Embed Size (px)
Citation preview

Cost Overruns in Large-Scale Transport Infrastructure Projects
A theoretical and empirical exploration for the Netherlands and worldwide
Chantal C. Cantarelli
Delft University of Technology

This research was funded by the Dutch Ministry of Infrastructure and the Environment.

Cost Overruns in Large-Scale Transport Infrastructure Projects
A theoretical and empirical exploration for the Netherlands and worldwide
Proefschrift
ter verkrijging van de graad van doctor
aan de Technische Universiteit Delft,
op gezag van de Rector Magnificus prof. ir. K.C.A.M. Luyben,
voorzitter van het College voor Promoties
in het openbaar te verdedigen op maandag, 28 november 2011 om 10.00 uur
door
Chantal Corinne CANTARELLI
Ingenieur Technische Bestuurskunde
geboren te Rotterdam

Dit proefschrift is goedgekeurd door de promotoren: Prof. dr. G.P. van Wee Prof. dr. B. Flyvbjerg Copromotor: Dr. ir. E.J.E. Molin Samenstelling promotiecommissie: Rector Magnificus voorzitter Prof. dr. G.P.van Wee Technische Universiteit Delft, Promotor Prof. dr. B. Flyvbjerg University of Oxford, Promotor Dr. ir. E.J.E. Molin Technische Universiteit Delft, Copromotor Prof. dr. ir. H. Priemus Technische Universiteit Delft Prof. dr. E.J.M.M. Arts Rijksuniversiteit Groningen Prof. drs. J.G. de Wit Universiteit van Amsterdam Prof. dr. ir. L. Bertolini Universiteit van Amsterdam TRAIL Thesis Series T2010/15, the Netherlands TRAIL Research School TRAIL Research School PO Box 5017 2600 GA Delft The Netherlands T: +31 (0) 15 278 6046 F: +31 (0) 15 278 4333 E: [email protected] ISBN: 978-90-5584-152-3 Keywords: cost overruns, infrastructure, lock-in, strategic behaviour, the Netherlands, ecological fallacy, Betuweroute, HSL-South Cover illustration: Marjolein Pijnappels (Studio Lakmoes) Copyright © 2011 by Chantal C. Cantarelli All rights reserved. No part of the material protect by this copyright notice may be reproduced or utilized in any form or by any means, electronic or mechanical, including photocopying, recording or by any information storage and retrieval system, without written permission from the author. Printed in the Netherlands

i
Preface
I am delighted to present this dissertation as the result of my PhD Research.
During my master thesis, I realised that I clearly enjoyed doing research. However, to be honest, when I was first asked if I was interested in doing a PhD I wasn’t really convinced this was something for me. Four years studying one and the same subject seemed a bit “boring” to say it bluntly. But I couldn’t have been more wrong! The last few years I worked on a large diversity of subjects from different perspectives. It is fair to say that this did entail some frustrations but at the end it was more than worthwhile. The four years passed by before noticed and while some questions were being answered there were so many more interesting questions to be studied.
This research was carried out at the section of Transport and Logistics of Delft University of Technology. This section has been a really nice environment for me whereby I especially appreciated the openness of and the informal relations between the members of the department. Thank you all!
I consider myself very lucky with the guidance and support during my PhD. I owe much gratitude to my promoter Prof. dr. Bert van Wee. I greatly prize your enthusiasm, positive attitude, scientific contributions as well as your willingness to help at any moment in time. Further, I would like to express my appreciation to my promoter Prof. dr. Bent Flyvbjerg. Your devotion to the research and your deep experience on the subject are a great source of inspiration. Special thanks to my daily supervisor Dr. ir. Eric Molin. Your support, especially with the discussions on statistics, is greatly valued.
Thanks to all my other co-authors of the papers this dissertation is composed of. Caspar Chorus and Scott Cunningham, thank you for your valuable contributions to structure the game which made it possible for me to study this new interesting area. Søren Buhl, thank you for your devoted input mainly on statistical matters.

ii Cost overruns in large-scale transport infrastructure projects
I am privileged with this highly knowledgeable committee and I greatly appreciate all committee members for their participation.
Besides, I would like to thank the committee members of the Ministry of Infrastructure and the Environment for their useful comments during the different stages of my research. Carl Koopmans, Arjen ‘t Hoen, Hugo Priemus, Eric Bussink, Fred Heuer, Hans Leeflang, Hedi van Dijk, Jeroen Smit, Piet de Wildt, Jaap Anne Korteweg, thank you!
I also wish to thank all those organisations and individuals that have helped me through the years with the data collection, an essential part of this thesis: RWS direction Zuid-Holland, RWS direction Bouwdienst, Hans Versteegen, Theo van Bekkum, Patrick Buck, Eddy Westerveld, Ingrid Koedood, Emiel Reiding, Guido Hagemann, Wim Groot, en Coen Raaphorst. I apologise to anyone I have forgotten to mention here.
Finally, to my parents, thank you for your love and support. My gratitude is infinite.
Chantal C. Cantarelli
Oxford, October 2011

iii
Table of Contents
Preface ........................................................................................................................................ i
Table of Contents .................................................................................................................... iii
List of Figures ......................................................................................................................... vii
List of Tables ............................................................................................................................ ix
1. Introduction .......................................................................................................................... 1
1.1 The problem of cost overruns ...................................................................................... 1 1.2 Background and problem statements ........................................................................... 2 1.3 Research aim and research focus ................................................................................. 7 1.4 Outline of this research ................................................................................................ 8 References ............................................................................................................................ 12
2. Explanations and their Theoretical Embeddedness ........................................................ 15
2.1 Introduction ............................................................................................................... 16 2.2 Methodology .............................................................................................................. 16 2.3 Causes and explanations for cost overruns ................................................................ 18 2.4 Categorising causes and explanations ....................................................................... 22 2.5 Plausibility of explanations ....................................................................................... 24 2.6 Conclusions and recommendations ........................................................................... 26 Acknowledgement ................................................................................................................ 27 References ............................................................................................................................ 27
3. Lock-in and its influence on project performance .......................................................... 31
3.1 Introduction ............................................................................................................... 32 3.2 Recognising lock-in ................................................................................................... 34 3.3 Case study: the Betuweroute ..................................................................................... 37 3.4 Case study: HSL-South ............................................................................................. 41

iv Cost overruns in large-scale transport infrastructure projects
3.5 Conclusions and recommendations ........................................................................... 44 Acknowledgements .............................................................................................................. 46 References ............................................................................................................................ 46
4. Explaining cost overruns by a signalling game ............................................................... 49
4.1 Introduction ............................................................................................................... 50 4.2 Specification and analysis of the game ...................................................................... 52 4.3 Relation to cost overruns ........................................................................................... 57 4.4 The influence of policy measures .............................................................................. 58 4.5 Conclusions and recommendations ........................................................................... 64 Acknowledgement ................................................................................................................ 66 References ............................................................................................................................ 66
5. Cost overruns in the Netherlands: ecological fallacy and project phases ..................... 69
5.1 Introduction ............................................................................................................... 70 5.2 Project selection, data collection and methodology .................................................. 72 5.3 Cost performance: magnitude and frequency of cost overruns ................................. 75 5.4 Cost performance over time ...................................................................................... 77 5.5 Cost overruns during different project phases ........................................................... 79 5.6 Conclusions and discussion ....................................................................................... 82 5.7 Areas for further research .......................................................................................... 83 Acknowledgement ................................................................................................................ 84 References ............................................................................................................................ 84
6. Determinants of cost overruns of infrastructure projects in the Netherlands ............. 87
6.1 Introduction ............................................................................................................... 88 6.2 Methodology .............................................................................................................. 89 6.3 Cost overruns per project type ................................................................................... 90 6.4 Project size ................................................................................................................. 93 6.5 Implementation phase ................................................................................................ 97 6.6 Conclusions and discussion ..................................................................................... 102 6.7 Areas for further research ........................................................................................ 104 Acknowledgement .............................................................................................................. 105 References .......................................................................................................................... 105
7. Geographical variation in cost performance of transport infrastructure projects .... 107
7.1 Introduction ............................................................................................................. 108 7.2 Data and methodology ............................................................................................. 109 7.3 Geographical variation in cost performance in the Netherlands ............................. 113 7.4 Cost overruns in 806 projects compared with previous data ................................... 114 7.5 Cost performance of Dutch projects versus that of the rest of the world ................ 116 7.6 Cost overruns of transport infrastructure projects in different geographical areas . 117 7.7 Explanations ............................................................................................................ 119 7.8 Conclusions and discussion ..................................................................................... 121 References .......................................................................................................................... 123
8. Conclusions, recommendations and reflection .............................................................. 125
8.1 Introduction ............................................................................................................. 125 8.2 Overview of this research ........................................................................................ 125 8.3 Conclusions ............................................................................................................. 126 8.4 Recommendations ................................................................................................... 130

Table of contents v
8.5 Reflection ................................................................................................................. 135 References .......................................................................................................................... 139
Appendices ............................................................................................................................ 141
Summary ............................................................................................................................... 161
Samenvatting ........................................................................................................................ 171
About the author .................................................................................................................. 181
TRAIL Thesis Series ............................................................................................................ 183

vi Cost overruns in large-scale transport infrastructure projects

vii
List of Figures Figure 1-1 Overview of the Research ...................................................................................... 12 Figure 3-1 Theoretical framework for lock-in ......................................................................... 36 Figure 3-2 Timeline for the Betuweroute project (decision-making level) ............................. 39 Figure 3-3 Timeline for the Betuweroute (project level) ......................................................... 41 Figure 3-4 Timeline of the High Speek Link-South project (decision-making level) ............. 43 Figure 3-5 Timeline of the High Speed Link South (project level) ......................................... 44 Figure 4-1 Signalling game ...................................................................................................... 52 Figure 4-2 Signalling game with payoff structure ................................................................... 54 Figure 4-3 Strategic form of the signalling game .................................................................... 54 Figure 4-4 Strategic form of the signalling game including best strategies ............................. 56 Figure 4-5 Mixture diagram identifying 3 regions with in each region different Nash
Equilibria ............................................................................................................... 56 Figure 4-6 Strategic form of the game with an accountability structure (general) .................. 59 Figure 4-7 Signalling game for the benchmark system including two signals ........................ 60 Figure 4-8 Strategic form of the game with a benchmark system ........................................... 61 Figure 4-9 Phase diagram for market party's strategy {LL} (left diagram) and {LH} (right
diagram) ................................................................................................................. 62 Figure 5-1 Distribution of cost overruns in Dutch transport infrastructure projects ................ 76 Figure 5-2 Cost overruns over time (year of completion) ........................................................ 78 Figure 5-3 Cost overruns over time (year of decision to build) ............................................... 78 Figure 5-4 Distribution of cost overruns in the pre-construction phase ................................... 80 Figure 5-5 Distribution of cost overruns in the construction phase ......................................... 81 Figure 6-1 Estimated costs and cost overruns (76 projects) ..................................................... 96 Figure 6-2 Length of the implementation phase and cost overruns (78 projects) .................... 98 Figure 6-3 Length of the pre-construction phase and cost overruns (51 projects) ................. 100 Figure 6-4 Length of the construction phase and cost overruns (51 projects) ....................... 101 Figure 7-1 Provinces of the Netherlands ................................................................................ 110 Figure 8-1 Theoretical framework lock-in ............................................................................. 128

viii Cost overruns in large-scale transport infrastructure projects

ix
List of Tables Table 1-1 Problem statements .................................................................................................... 7 Table 2-1 Overview of sources of literature ............................................................................. 18 Table 2-2 Causes and explanations .......................................................................................... 22 Table 2-3 Theories in explanations .......................................................................................... 24 Table 2-4 Appropriate theories for explaining cost overruns .................................................. 27 Table 5-1 Frequency and magnitude of cost overruns found in literature ............................... 70 Table 6-1 Average cost overrun per project type ..................................................................... 90 Table 6-2 Number of projects with cost underrun and overrun (in percentage and number)
and their averages), the Netherlands ...................................................................... 91 Table 6-3 Frequencies of cost underruns and overruns broken down in different categories
of underrun and overrun a, the Netherlands............................................................ 92 Table 6-4 Average cost underrun and overrun in the pre-construction and construction
phase per project type b, the Netherlands ............................................................... 92 Table 6-5 Cost overruns broken down by project size (estimated costs in € in 1995) and
project type c, the Netherlands................................................................................ 95 Table 7-1 Number of projects by geographical location and project type ............................. 110 Table 7-2 Characteristics of the international database ......................................................... 111 Table 7-3 Characteristics Dutch database .............................................................................. 114 Table 7-4 Number of projects per region and project type in the database with 806 and 258
projects ................................................................................................................. 115 Table 7-5 Cost overruns broken down by type for worldwide samples of transport
infrastructure projects ........................................................................................... 115 Table 7-6 Cost overruns broken down by type: Netherlands versus rest of the world .......... 116 Table 7-7 Cost overrun of transport infrastructure projects in NW European countries by
project type ........................................................................................................... 117 Table 7-8 Cost overruns of transport infrastructure projects in the Netherlands, other NW
European countries and other geographical areas ................................................ 118

x Cost overruns in large-scale transport infrastructure projects
Table 7-9 Cost overruns for different rail types in the Netherlands, other NW European countries and other geographical areas ................................................................ 121
Table 8-1 Overview causes, explanations and theories used in literature on cost overruns .. 127 Table A-1 List of variables ..................................................................................................... 142 Table A-2 Overview of road and rail projects in the database ............................................... 148 Table A-3 Overview of tunnels and bridges in the database .................................................. 148 Table B-1 Rules of thumb in determining the Time of formal Decision to build .................. 150 Table B-2 Adjusted Time of formal Decision to build for road projects ............................... 152 Table B-3 Assumed estimated opening year .......................................................................... 154 Table B-4 Rules of thumb in determining the year in which the construction started ........... 156 Table B-5 VAT changes ......................................................................................................... 160

1
1. Introduction
1.1 The problem of cost overruns
Many well-known large-scale transport infrastructure projects incur major cost overruns. One of the most famous “project disasters” in this respect is the Channel Tunnel. This undersea rail tunnel linking the United Kingdom and France is the longest of its kind with a length of about 50 kilometres. Construction costs increased from £2600 million to £4650 million (1985 prices), which is 80 per cent higher than the forecasted costs (Flyvbjerg et al., 2003a). Another well-known megaproject failure is the Central Artery/Tunnel project in Boston America, also known as the “Big Dig” or Big Dug” due to persistent tunnel leaks. This large and complex underground highway project suffered a cost overrun of US $ 11 million or 275 per cent (Flyvbjerg 2007). Many other examples of projects with cost overruns can be given, e.g. the Great Belt link in Denmark (54% overrun), the Humber bridge in the UK (175% overrun) and the Paris Nord TGV in France (25% overrun) (Flyvbjerg et al., 2003a).
Given these large and persistent overruns, the level of investment in transport infrastructure projects remains immense. For example, the total amount of investments undertaken in transport by the EU25 Member States was a massive €859 billion in the period 2000-2006 (Steer Davies Gleave, 2009). These investments are essential to create a well-functioning infrastructure network that strengthens the economy. However, at the same time, they may threaten the economy due to their large cost overruns.
Moreover, cost overruns are considered problematic for the following four reasons (Flyvbjerg et al., 2007, p.6). First of all, “they lead to a Pareto-inefficient allocation of resources, i.e., waste”. Cost forecasts are often inaccurate but the large standard deviations show that the margin by which costs are “wrong” differs across projects. As a consequence, the ranking of projects is affected and “decision makers are likely to implement inferior projects”. Additional budget is required as projects become more expensive than was initially estimated. The budget for other projects can therefore be affected, particularly as the total budget for
2 Cost overruns in large-scale transport infrastructure projects
infrastructure investments is often fixed in a given period. Cost overruns thus result in both financial wastage but also in fewer infrastructure projects being realised than planned. Secondly, cost overruns can “lead to delays and further cost overruns”. When confronted with cost overruns, attempts must be made to secure additional funding and projects must often be renegotiated or reapproved. This inevitably takes time and cost overruns increase with each additional year before implementation (Flyvbjerg et al., 2004). Thirdly, cost overruns “destabilize policy, planning, implementation, and operations of projects”. Cost overruns can lead to continuous reapproval and unrest in the project organisation and parliament. Fourthly, “the problem is getting bigger because projects get bigger”. When projects become more and more expensive and still involve cost overruns, the financial consequences can become so large that it even may destabilise the finances of a whole country or region.
The leading piece of research on cost overruns of large transport infrastructure projects is considered to be the international study by Flyvbjerg et al. (2003a) due to its scope – the large number of projects, the variety of project types, the long time period and the wide geographical coverage. It includes 258 projects worldwide and indicates that in 86% of the projects cost overruns appear with average overruns of 20% for road, 41% for rail and 34% for fixed link projects (tunnels and bridges). Other studies reach similar conclusions; cost overruns are a common phenomenon in large-scale projects (Merewitz, 1973; Pickrell, 1992; Odeck, 2004; Nijkamp and Ubbels, 1999, Morris and Hough, 1987; Hall, 1980; and Dantata, 2006). Cost overruns appear to be a worldwide phenomenon and occur in different project types but it is even more disturbing that “cost escalation has not decreased over the past 70 years” (Flyvbjerg et al., 2003b).
1.2 Background and problem statements
1.2.1 Extent of the problem in the Netherlands
In the Netherlands, attention for cost overruns intensified after a large budget increase came to light for two recently implemented projects, the Betuweroute and the HSL-South (see Box 1 at the end of this section for a more detailed background description of the awareness in the Netherlands towards the inaccuracy of cost estimates over the years). This large budget increase was the immediate cause for the Dutch Ministry of Infrastructure and the Environment1 to carry out research to determine whether these projects were exceptions or whether cost overruns are a regular feature of large-scale projects in the Netherlands.
Since the literature generally recognises cost overruns as a common feature of megaprojects, there is no reason to assume that this would be any different in the Netherlands. Though, considering the large variety in the size of the average cost overruns found in different studies, varying between 0% and 164% (Merewitz, 1973; Pickrell, 1992; Odeck, 2004; Nijkamp and Ubbels, 1999, Flyvbjerg et al., 2003a), the extent of the problem of cost overruns in the Netherlands is unclear. Little is known about the regularity and magnitude of cost overruns in the Netherlands and whether the accuracy of cost estimates has improved over time.
1 In October 2010 the Dutch Ministry of Transport, Public Works, and Water Management merged with the Ministry of
Housing, Spatial Planning and the Environment to become the Ministry of Infrastructure and the Environment. Some chapters in this thesis refer to the Ministry of Transport, Public Works and Water Management since that part of the research was carried out before the merger of both Ministries.
Chapter 1 - Introduction 3
There are probably many countries with similar questions as the Netherlands regarding their project performance. More generally formulated, it is unknown to what extent the results of the international study by Flyvbjerg et al. (2003a) could be used as a reference for the project performance in individual countries. Although this study is considered the leading piece of research with a worldwide coverage, using the results for individual countries specifically could include the danger of ecological fallacy. This is the tendency for inferences to be made about individual cases (individual countries or projects) from aggregate results. It is not always possible to postulate about individual countries from aggregate results on overruns, for example, the conclusions for Europe do not necessarily apply to each individual European country.
There are few large sample studies on cost overruns and they mostly focus on the frequency and distribution of the overrun (including the magnitude of the overrun). Surprisingly little research has been carried out into the phase in which a project is most prone to cost overruns. This information would contribute to the understanding of cost overruns. For example, if the largest cost increases occur in the earlier phases, cost overruns appear to be a planning problem, whereas if they mostly occur in the later project phases, it seems to be mainly a project management problem. If the phase is identified in which the largest cost increases occur, the research scope regarding the problem of cost overruns could be narrowed down to this specific phase. This would increase the chances for finding its causes and providing cures. However, little is known about whether costs increase marginally over the years or severely in certain periods of project development.
A first indication of the extent of the problem of cost overruns in the Netherlands could be based on the geographical location of the Netherlands. Flyvbjerg et al. (2003b) showed that cost overruns vary between geographical areas, with average cost overruns typically being smaller in Europe (26%) and North America (24%) compared to other areas (65%). Hence, it is expected that the average cost overrun in the Netherlands is relatively moderate. However, Flyvbjerg et al. (2003b) also argue that the significant differences in average overrun that were found between geographical areas was probably caused by the projects outside Europe and North America “with their poor track record of cost escalation for rail, averaging 64.6%”. There is thus no clear proof that European projects perform better than projects outside Europe, or whether Dutch transport infrastructure projects perform better or worse than other countries.
To summarise, transport infrastructure projects are likely to involve cost overruns but at what point during the project development the largest cost increases occur is unknown. For the Netherlands, there is no data on the overall project performance and it is unknown whether Dutch transport infrastructure projects perform better or worse than projects in other countries.

4 Cost overruns in large-scale transport infrastructure projects
BOX 1 The situation in the Netherlands – three areas of awareness of cost overruns Early years: hardly any attention for cost overruns Before the year 1989, cost estimates of infrastructure projects in the Netherlands were hardly considered a problem (Nijkamp and Ubbels, 1999). In 1989 a large budget increase for road network projects came to light leading to increased attention on cost escalation. As a result, in 1990 the Ministry of Transport, Public Works and Water Management established the Working Group for Estimates for Infrastructure (Werkgroep Ramingen Infrastructuur) to investigate the problems with estimate overruns. However, besides inflation, no general explanation of estimated overruns could be given (Boschloo, 1999). 1990s: extensive research results in an obligation to provide an ex-ante evaluation (OEI) In 1998, the Ministry of Transport, Public Works and Water Management and the Ministry of Economic Affairs (now part of the Ministry of Economic Affairs, Agriculture and Innovation) initialised further research into cost estimates with the Research Program Economic Effects of Infrastructure (“Onderzoeksprogramma Economische Effecten Infrastructuur, OEEI). The program resulted in a manual to set up an “OEEI”, which is a guideline for carrying out a cost-benefit analysis. In the year 2003, the guideline was evaluated and expanded, now called the OEI-manual (Overview Effects Infrastructure), including all effects related to the construction and exploitation of large-scale infrastructure. Using manual is obligatory for large-scale national public infrastructure projects in the Netherlands. Recent years: managing large-scale projects is still problematic Although the OEI led to an improvement of ex-ante evaluation, attention for cost estimation procedures really intensified just after a large budget increase became public for two large-scale transport infrastructure projects, the Betuweroute and the HSL-South. This was the trigger for the Lower Chamber to investigate its own role in large-scale infrastructure projects. In the year 2004, the Lower Chamber established the Temporary Committee on Infrastructure Projects, TCI2 (also Duivesteijn Committee). The Committee was set up to form a realistic assessment framework in order to improve the committee’s role in the decision-making process and its control over the implementation of large infrastructure projects. In its final report, ‘Grote projecten uitvergroot’ (“Large projects enlarged”), the Committee identified many shortcomings in the decision-making process for large infrastructure projects. The Committee’s main conclusion concerns the fact that the Lower Chamber had been regularly misinformed about the costs and benefits of projects (TCI, 2004a, 2004b). This misinformation makes it particularly difficult for decision-makers to manage large-scale transport infrastructure projects. The TCI wants the information about large projects to be subject to greater control (Priemus, 2007). In addition, the current practice of evaluating large-scale infrastructure projects, as described in the OEI-manual, needs further refinement. Increasing the accuracy of cost and benefit estimates reduces misinformation.
1.2.2 Various causes and explanations for cost overruns
Although the problem of cost overruns is generally acknowledged, the causes and explanations are subject to more debate. The literature has identified various causes of cost overruns, including poor project design and implementation, the inadequate funding of projects, bureaucratic indecision, the lack of coordination between enterprises, inflation, incompleteness of estimates, adjustments to projects, project size, project type, region, construction and implementation period (Morris, 1990; Odeck, 2004; Nijkamp and Ubbels, 1999; Flyvbjerg et al. 2004; van Wee, 2007). However, not all of these studies reach the same conclusions. Odeck (2004), for example, finds rather surprisingly as no other study has noted it previously, that smaller projects have relatively larger cost overruns compared to larger ones. The study by Flyvbjerg et al. (2004) concludes conversely that cost overruns are large for all project sizes. As a consequence, the causes of possible cost overruns in the Netherlands could also be diverse, and if ecological fallacy plays a role, it is impossible to draw any
2 Temporary Parliamentary Commission on Infrastructure Projects

Chapter 1 - Introduction 5
conclusions regarding the causes of cost overruns in individual countries from aggregate results.
Beside these causes, Flyvbjerg et al. (2007, 2002) provide four types of explanations for forecasting inaccuracy. Note the difference between causes and explanations. In line with the definition in Flyvbjerg et al. (2004), what is meant here by ‘cause’ is ‘to result in’; the cause is not the explanation of the result. Causes refer to the variables or factors that influence the cost overruns, such as the implementation period or the size of the project. Explanations are more general and might comprise several causes. Flyvbjerg et al. (2007, 2002) give the following types of explanations for forecasting inaccuracy: Technical explanations: these are ‘forecasting errors’ in technical terms e.g.
imperfect forecasting techniques, inadequate data and lack of experience; Economic explanations: these explain cost overruns either in terms of economic self-
interest or in terms of public interest, but both depict underestimation as deliberate and economically rational;
Psychological explanations: these include the concepts of planning fallacy and optimism bias (a systematic tendency for project appraisers to be overly optimistic)
Political explanations: strategic misrepresentation; deliberately and strategically overestimating benefits and underestimating costs when forecasting the outcomes of projects.
Optimism bias and misrepresentation are both deception but the latter is intentional i.e. lying whereas the first is not, optimism bias is self-deception (Flyvbjerg, 2006). A trichotomy of explanations is also common, in which economic and political explanations are combined into one category i.e. political-economic explanations (see for example Flyvbjerg, 2007). The definition of economics in this dissertation is narrow and is much more comprehensive in the economic field.
Despite these explanations, cost overruns continue to be a problem in large-scale transport infrastructure projects. This asks for a different approach in studying cost overruns, namely from a theoretical perspective. A sound theoretical basis is particularly important as it substantiates the explanation and provides opportunities to define appropriate cures. Insight into the theories underlying the explanations for cost overruns has been the subject of only a few studies. A systematic overview of the theories that are used or can be used to explain cost overruns is however lacking. Moreover, an application of a specific theory to show how cost overruns can occur has not been conducted.
In searching for an explanation for cost overruns, poor information control is often referred to. Otten (1996) provides the following reasons: information is often controversial, information is used as an instrument to influence the decision-making, information-asymmetry, and information could be confidential. In addition, he argues that the ability to control projects is also a function of previously taken decisions, also known as “verstrikking” or here translated into “lock-in”. This can be seen as institutional or behaviour lock-in compared to the more commonly known technical lock-in (see e.g. Paul David’s article (1985) on the QWERTY keyboard). Lock-in is a general phenomenon widely acknowledged in the literature (e.g., Brockner et al., 1986; Staw, 1981; Whyte, 1986;), where the process of escalating commitment is also known as “entrapment” (Brockner and Rubin, 1985), the “sunk-cost effect” (Northcraft and Wolf, 1984), the “knee-deep-in-the-big-muddy” effect (Staw, 1976), and the “too-much-invested-to-quit” effect (Teger, 1980 in Brockner et al., 1986). However, the institutional or behavioural form of lock-in has been addressed to a far lesser degree and in the context of cost overruns, no such concept has been thoroughly investigated. Little is
6 Cost overruns in large-scale transport infrastructure projects
known about how lock-in emerges, whether it has actually taken place and to what extent it can explain cost overruns.
In sum, there are various possible causes and explanations but they have barely been addressed from a theoretical perspective. Lock-in is a phenomenon that seems particularly suitable to cost overruns but has to the authors’ best knowledge never been considered in this respect. Lastly, there is no indication which causes and explanations apply specifically to the Netherlands.
1.2.3 Remedies for cost overruns
Several remedies for cost overruns have been proposed, many of them concern an increase in the accountability of the responsible parties (Bruzelius et al., 2002, Pickrell, 1992, TCI 2004b). Pickrell (1992), for example, argues that “the most effective way to induce planners and decision-makers to choose projects on the basis of more accurate ridership and cost projections would be to transfer the financial risk of forecasting errors from the federal treasury to local government” (though this is only effective if the local government is made responsible before local choices between projects are made). Furthermore, Bruzelius et al. (2002) argue that good decision-making is not only an issue of better information and better methods, but also of institutional arrangements to improve the accountability. They propose four basic instruments: Transparency: information should be made available to the public because the test of
publicity is the main means of enforcing accountability in the public sector. Specification of performance: changing the approach of decision making from a
technical to a goal driven one where general requirements have to be specified before the technical requirements are considered.
Explicit formulation of the regulation regime: encompassing various rules to ensure a rational use of the project.
Mobilisation of risk capital: selection and elimination of policy risks before decision-making.
Flyvbjerg et al. (2007) stress the need for less deception and more honesty in the estimation of costs if projects are to be implemented. They thereby distinguish two situations. In the first situation, planners consider it important to get forecasts right and better forecasting methods are proposed as a cure for forecasting inaccuracy. To be more specific, Flyvbjerg et al. (2007) recommend the use of reference class forecasting, taking an ‘outside view’ next to the usual ‘inside view’. In the second situation, planners do not consider it important to get forecasts right because optimistic forecasts are seen as a necessary means to get a project started. In this latter situation, improved incentive structures (see the above listed four instruments of accountability) are proposed as a cure. Moreover, Flyvbjerg (2006) argues that improved forecasting methods (reference class forecasting) and measures of accountability must go hand in hand in order to reach more accurate forecasts.
The following section will proceed from here by indicating the research focus and by deriving the research goals and questions from the problem statements described above.

Chapter 1 - Introduction 7
1.3 Research aim and research focus
1.3.1 Research aim
The main aim of this research is “to obtain a better understanding of the phenomenon of cost overruns”. Based on the problem description formulated in the previous sections, there are several empirical as well as theoretical drawbacks to the current state-of-the art literature that need more attention to better understand cost overruns. The above-mentioned research aim is therefore split into an empirical-oriented and theoretical-oriented objective.
The empirical-oriented research aim can be formulated as follows:
This research aims to provide more insight into the project performance of the Netherlands and to compare this performance with the performance in other countries.
The theoretical-oriented research aim can be stated as follows:
This research aims to explore the causes and explanations of cost overruns from a theoretical perspective.
1.3.2 Research focus
In addition to the division between an empirically and a theoretically oriented focus, this research also has a geographical focus of the Netherlands. However, the interests and contributions of this research are not limited to the Dutch situation but are of importance to a worldwide audience. Table 1-1 gives an overview of the problems and the relation with the research focus.
Table 1-1 Problem statements
Orientation Problem statements Empirical 1: There is little knowledge about the project performance in the Netherlands and worldwide
results cannot be used for individual countries due to the lack of knowledge about whether and to what extent ecological fallacy plays a role in using aggregate worldwide results. 2: The literature currently lacks any insight into whether cost increases vary with the project phase. 3: The causes for possible cost overruns in the Netherlands are unknown and if ecological fallacy plays a role, it is impossible to draw any conclusions regarding the causes of overruns in individual countries from the aggregate results. 4: There is little significant evidence that cost performances vary with geography.
Theoretical 5: The extent to which explanations are theoretically founded and how theories can be applied to explain cost overruns is unclear. 6: Little is known about how lock-in can emerge, whether it has actually taken place and to what extent it can explain cost overruns.

8 Cost overruns in large-scale transport infrastructure projects
It should be noted that this research mainly focuses on the problems, causes and explanations of cost overruns. Possible measurements to deal with cost overruns are not the central focus of this thesis. These will be addressed in this study as recommendations for improvements in current practice in the Netherlands, based on the new insights obtained by this research.
1.4 Outline of this research
The problem statements will be addressed in different chapters of this thesis. Problem statements 1 and 2 are both addressed in chapter 5 and problem statement 5 is covered in both chapter 2 and 4.
In total, the thesis contains 8 chapters divided over two parts. We start with the theoretical part, covering chapters 2 to 4, as insights of these chapters are used in the subsequent chapters. After that, part II, comprising chapters 5 to 7, addresses the empirically-oriented research aim. The thesis closes with a chapter of conclusions, recommendations and reflections.
Each chapter consists of a paper that has been published, is forthcoming or has been submitted for publication in a scientific peer-reviewed journal. As a consequence of the format of this thesis being based on papers, there is some overlap with this introduction as well as with other chapters. The remainder of this chapter presents the outline of this thesis. For each chapter the research question that is derived from the problem statement is formulated. Furthermore, the research method(s) by which the question will be addressed and the relevance of that specific research part are described. They will be more extensively addressed in the respective chapters.
1.4.1 Part I: Theoretical-oriented research
Chapters 2 to 4 focus on the theories related to the causes and explanations of cost overruns. Chapter 2 gives an overview of the causes and explanations and the theories that are used in the literature. Chapter 3 uses several theories to identify indicators of lock-in and chapter 4 applies agency theory to explain cost overruns.
Chapter 2 Insight into the theories underlying the explanations of cost overruns is limited (problem statement 5). The research question that is addressed in this chapter is therefore as follows: “Which causes and explanations for cost overruns of large-scale transport infrastructure projects are provided in literature and how are these theoretically embedded and characterised?”
To the authors’ knowledge, a systematic investigation into the different explanations for cost overruns has not yet been conducted. This will be the subject of this chapter. In addition, it will be determined whether each explanation is supported by one or more theories and if so which theory or theories. In this way, the underlying theories can be used to substantiate the explanations and hence provide a better understanding of the phenomenon of cost overruns. The aim of this study is not to give a profound description of the theories but rather to identify the extent to which theories are used in the context of cost overruns. Therefore, in this dissertation, theories are addressed at a rather general level.

Chapter 1 - Introduction 9
The research methodology that is applied in this chapter concerns a literature review of past studies on cost overruns. The review methodology does not set out any restriction in the search for literature on cost overruns of transport infrastructure projects. It attempts to give an overview of studies that is as complete as possible. This is also in line with Morris (1990) who argues that in understanding planning failures, one has to look for a general explanation. The literature review is therefore kept broad. Studies addressing project performance in general are considered (broad focus) as well as studies focusing specifically on cost overruns (narrow focus). The literature review shows that political-economic explanations are considered the most helpful in understanding cost overruns. A large variety of theories is and can be applied to support this category of explanations with agency theory having the largest potential in this respect. It should be noted that the theories that are addressed in the chapter are in the economic field much broader than illustrated in this dissertation. Here, the theories are solely addressed from the perspective of the research area cost overruns in transport infrastructure projects.
The findings of this chapter result in the focus on political-economic explanations in chapters 3 and 4. Chapter 3 addresses this type of explanation by elaborating upon lock-in and chapter 4 applies agency theory to show how strategic misrepresentation can result in cost overruns.
Both chapters address political explanations, that is, that cost overruns are seen as the consequence of strategic behaviour. It should be noted that there are many types of strategic behaviour and that this thesis focuses on two types, the strategic behaviour of decision-makers (chapter 3) and strategic behaviour between decision-makers and market parties (chapter 4).
Chapter 3 Lock-in is an important phenomenon that can explain the outcomes of decision-making processes. However, little is known about the influence of lock-in regarding decision-making about transport infrastructure projects (problem statement 6). Insight is currently lacking about whether and how lock-in plays a role in the decision-making and whether it can explain cost overruns. The research question is therefore as follows: “How can lock-in emerge, has it actually taken place in transport infrastructure projects, and if so, how did it occur and until what moment in the decision-making process could the decision be reversed?”
The study is of scientific relevance as it fills the current gap of knowledge in the literature about lock-in by providing a theoretical notion of institutional lock-in and the relation with cost overruns. The research is also of social relevance as it gives insight into decision-making and the reason for cost overruns. The results are inherently helpful in reducing these problems and may ease the burden on the State’s budget.
Chapter 3 provides an answer to the above-mentioned research question by means of a literature research and two case studies. Based on a literature search different indicators for lock-in are identified and a conceptual model is drawn that shows the way in which lock-in occurs and how it can influence cost overruns. Two case studies illustrate whether lock-in has actually occurred and how it affects costs.
Chapter 4 This chapter includes the application of a specific theory in explaining cost overruns from a political-economic perspective. To the authors’ knowledge the specific application of a theory to explain cost overruns has not previously been conducted. Agency theory is chosen as the theory to be applied for cost underestimation (problem statement 5). The research question is as follows: “How can agency theory be applied to illustrate the behaviour of parties leading to cost overruns of large-scale transport infrastructure projects?”
10 Cost overruns in large-scale transport infrastructure projects
This study is of scientific relevance as it puts a new perspective on the way in which cost overruns can be described. It does so by providing a formal account of the interaction between parties that is characterised by strategic behaviour resulting in cost overruns. The study is also of social relevance as the model can also be used to estimate the impact of policy measures on strategic behaviour.
Chapter 4 models a specific type of agency theory i.e. a signalling game. This game is particularly suitable for addressing strategic behaviour between two parties (in this case the governmental party and the market party). It is a game with incomplete information which considers the way in which parties anticipate the behaviour of other parties’ in choosing a course of action (Fudenberg and Tirole, 1992). This asymmetric information enables parties to behave strategically and, in this case, underestimate costs. The model is also applied to show the effect of policy measures.
1.4.2 Part II: Empirical-oriented research
Chapters 5 and 6 focus on the problems, causes and explanations of cost overruns in the Netherlands. Chapter 7 compares the cost performance of large-scale transport infrastructure projects in the Netherlands with other countries. For these chapters, an extensive amount of data for Dutch large-scale transport infrastructure projects was gathered. A detailed description of the data collection and methodology can be found in Appendix 1 of this thesis. The chapters in this empirical part of the thesis all involve the same research method, that is, statistical analysis, including either descriptive statistics, or the analysis of variance, or regression analysis.
Chapter 5 Due to the possible danger of ecological fallacy, it is impossible to use the results of an international study to estimate the problem of cost overruns in the Netherlands or in any other individual country. In addition, there is no indication whether projects are more prone to cost overruns in specific phases of the project or not (problem statements 1 and 2). This results in the following research questions. 1. “How can the cost performance of large-scale transport infrastructure projects in the Netherlands be characterised regarding the frequency and magnitude of cost overruns, and does this support the danger of ecological fallacy?” 2. “To what extent have cost estimates in the Netherlands improved over time?” 3. “Are transport infrastructure projects more vulnerable to cost overruns during different project phases and if so, what are the differences between the phases?”
This study is in particular of social relevance for the Netherlands as it provides insight into the extent to which the decision-making for Dutch transport infrastructure projects is based on an accurate appraisal of projects. Besides, the problem of ecological fallacy makes this research of social as well as scientific relevance worldwide. Whether or not ecological fallacy plays a role has large implications for the applicability of former studies into cost overruns. It could either make current results more widely applicable (in case ecological fallacy does not play a role or only to a small extent) or prevents these results being used with unfortunate consequences. In addition, by addressing cost overruns during different phases this study contributes to the current state-of-the-art on cost overruns and provides policy makers with knowledge to enable better management of project costs.
One of the main findings of this study is that ecological fallacy is indeed a real threat. It is therefore important to consider the problem but also the causes of cost overruns (chapter 6)

Chapter 1 - Introduction 11
for individual countries separately. Furthermore, the study shows that Dutch transport infrastructure projects perform rather differently compared to worldwide findings.
Chapter 6 Similar to the problem of cost overruns, the danger of ecological fallacy makes it impossible until now to draw any conclusions regarding the causes of cost overruns for Dutch projects or for projects in any other specific country (problem statement 3). This research focuses on three particular causes of cost overruns: project type, project size and the length of the implementation period. Hereto, the following research questions were formulated: 1. “To what extent is the cost performance different for different types of transport infrastructure projects?” 2. “What is the relation between project size and cost overruns?” and 3. “To what extent does the length of the implementation phase of the transport infrastructure project influence the cost performance?”
Again this study is of particular social relevance for the Netherlands but also for other countries as every country investing in infrastructure will be confronted with cost overruns. The concept of ecological fallacy will show how and to what extent individual countries may predict cost performance based on existing studies.
This study contributes scientifically to the current literature on cost overruns as it differentiates, as no study has done before, between the influence of the length of the pre-construction and the length of the construction phase on the extent of cost overruns.
Chapter 6 shows that in addition to the project performance overall, the determinants of cost overruns are different in transport infrastructure projects in the Netherlands compared to international projects.
Chapter 7 The first indications for the danger of ecological fallacy and the rather different project performance in the Netherlands require an additional study comparing the Netherlands in more detail with other countries. The geographical location is thereby taken as a reference point as the better performance could be explained by the lower average overrun that was found for the projects in Europe (problem statement 4). The research question is as follows: “To what extent do cost overruns of transport infrastructure projects within the Netherlands depend on geographical location and to what extent is the cost performance in the Netherlands statistically different from that worldwide?”
This study is of social as well as of scientific relevance. It contributes to the understanding of the variance in cost overruns by geography and because of the worldwide coverage the results are of social relevance for all countries dealing with cost overruns.
Chapter 8 Chapter 8 provides the main conclusions of this thesis, providing answers to the empirical as well as to the theoretical research questions formulated in this chapter. In addition, recommendations that follow from the research findings are provided. It should be noted that these recommendations are not solely of interest for the Netherlands but address a wider public, i.e. every country that is confronted with cost overruns. The thesis finishes with a reflection.

12 Cost overruns in large-scale transport infrastructure projects
1.4.3 Schematic overview of this thesis
Figure 1-1 presents overview of this research. The upper part in the middle of the figure is related to the theoretically-oriented research aim (part I) and the lower part in the middle is related to the empirically-oriented research aim (part II). Chapter 3, both with a theoretical and an empirical focus is therefore placed in between both of these parts (but mainly in part I as the emphasis is on the theoretical part).
Figure 1-1 Overview of the Research
References
Boschloo, M. (1999) Evaluatie van Ramingsstijgingen. Het verantwoord omgaan met onzekerheden in ramingen en budgetten, Afstudeerrapport. TU Delft, Delft
Brockner J., R. Houser, G. Birnbaum, K. Lloyd, J. Deitcher, S. Nathanson, and J. Z. Rubin (1986) Escalation of commitment to an ineffective course of action: the effect of feedback having negative implications for self-identity, in: Administrative Science Quarterly, 31 (1), pp. 109-126.
Brockner, J., J.Z. Rubin (1985) Entrapment in escalating commitment conflicts: a social psychological analysis, Springer, New York.
Bruzelius, N., B. Flyvbjerg, and W. Rothengatter (2002) Big decision, big risks. Improving accountability in mega projects, in: Transport Policy, 9 (2), pp. 143–154.
Dantata, N.A., A. Touran, and D.C. Schneck. (2006) Trends in US Rail Transit Project Cost Overrun. Paper presented at the 85th meeting of the Transportation Research Board, Washington, D.C.
David, P. (1985) Clio and the economics of QWERTY, in: American Economic Review, 75, pp. 332-337
Eurostat, http://epp.eurostat.ec.europa.eu, consulted 13-06-2010
Flyvbjerg, B. (2007) Policy and planning for large-infrastructure projects: problems, causes, cures. Environment and Planning B, in: Planning and Design, 34 (4), pp. 578-597.
Flyvbjerg, B., M.K. Skamris Holm and S.L. Buhl (2002) Underestimating cost in public works. Error or Lie?, in: Journal of the American Planning Association, 68 (3), pp. 279-295.
Flyvbjerg, B., N. Bruzelius and W. Rothengatter (2003a) Megaprojects and Risk: An Anatomy of Ambition, Cambridge, Cambridge University Press.
Chapter 1Introduction
Chapter 2Problem statement 5
Literature review
Chapter 3Problem statement 6
Lock-in
Chapter 4Problem statement 5
Theoretical model
Chapter 5Problem statements
1 and 2Cost overruns in NL
Chapter 6Problem statement 4
Determinants cost overruns in NL
Chapter 7Problem statement 3
Cost performance comparison between countries
Chapter 8Conclusions,
recommendations and reflection

Chapter 1 - Introduction 13
Flyvbjerg, B., M.K. Skamris Holm and S.L. Buhl (2003b) How Common and How Large Are Cost Overruns in Transport Infrastructure Projects?, in: Transport Reviews, 23(1), pp. 71-88.
Flyvbjerg, B., M.K. Skamris Holm and S.L. Buhl (2004) What Causes Cost Overrun in Transport Infrastructure Projects?, in: Transport Reviews, 24 (1), pp. 3-18.
Flyvbjerg, B. (2006) From Nobel Prize to Project Management: Getting Risks Right, in: Project Management Journal, 37 (3), pp. 5-15.
Fudenberg, D. and J. Tirole (1992) Game theory, MIT Press, Cambridge, USA.
Hall, P. (1980) Great Planning Disasters, Penguin Books, Harmondsworth.
Merewitz, L. (1973) How do urban rapid transit projects compare in cost estimating experience? Proceedings of the International Conference on Transportation Research. First Conference. Reprint no. 104, pp. 483-493, Bruges, Belgium.
Morris, S. (1990) Cost and Time Overruns in Public Sector Projects, in: Economic and Political Weekly, 15(47), pp. 154-168.
Morris, P. and G.H. Hough (1987) The Anatomy of Major Projects: A Study of the Reality of Project Management, John Wiley and Sons, New York.
Nijkamp, P. and B. Ubbels (1999) How Reliable are Estimates of Infrastructure Costs? A Comparative Analysis, in: International Journal of Transport Economics, 26(1), pp. 23-53.
Northcraft, G.B. and G. Wolf (1984) Dollars, sense, and sunk costs: a life-cycle model of resource allocation decisions, in: Academy of Management Review, 9, pp. 225-234
Odeck, J. (2004) Cost overruns in road construction – what are their sizes and determinants?, in: Transport Policy, 11(1), pp. 43–53.
Otten, M.P.H. (1996) Ontspoorde technisch-complexe projecten. In: de Bruijn, J.A., P.de Jong, A.F.A. Korsten and W.P.C. van Zanten (eds.) Grote projecten. Besluitvorming en Management, Samsom H.D. Tjeenk Willink, Alpen aan den Rijn.
Pickrell, D. (1992) A Desire Named Streetcar: Fantasy and Fact in Rail Transit Planning, in: Journal of the American Planning Association, 58(2), pp. 158-176.
Priemus, H. (2007) Decision-making on large infrastructure projects: the role of the Dutch Parliament, in: Transportation Planning and Technology, 30 pp. 71-93.
Staw, B.M. (1976) Knee-deep in the big muddy: a study of escalating commitment to a chosen course of action, in: Organisational Behaviour and Human Performance, 16, pp. 27-44.
Staw, B.M. (1981) The escalation of commitment to a course of action, in: Academy of Management Review, 6, pp. 577-587.
Steer Davies Gleave (2009) Ex post evaluation of cohesion policy programmes 2000-2006. Work Packages 5A: Transport, Steer Davies Gleave, London.
Teger, A.I. (1980) Too Much Invested to Quit, Pergamon Press, New York.
TCI (2004a) Grote Projecten Uitvergroot: Een Infrastructuur voor Besluitvorming (Temporary Committee for Infrastructure Projects, Tweede Kamer der Staten-Generaal TK 2004-2005, 29 283, nr.5-6), Sdu Uitgevers, The Hague.
TCI (2004b) Onderzoek naar infrastructuurprojecten (Temporary Committee for Infrastructure Projects, Tweede Kamer der Staten-Generaal TK 2004-2005, 29 283, nr.10), Sdu Uitgevers, The Hague.

14 Cost overruns in large-scale transport infrastructure projects
Van Wee, B. (2007) Large infrastructure projects: a review of the quality of demand forecasts and cost estimations, in: Environment and Planning B: Planning and Design, 34 (4), pp. 611-625.
Whyte G, (1986) Escalating commitment to a course of action: a reinterpretation, in: Academy of Management Review, 11, pp. 311-321.

15
2. Explanations and their Theoretical Embeddedness Cantarelli, C.C., Flyvbjerg, B., Molin, E.J.E & Wee, B. van (2010). Cost Overruns in Large-scale Transportation Infrastructure Projects: Explanations and Their Theoretical Embeddedness. European Journal of Transport and Infrastructure Research, 10(1), pp. 5-18.
Abstract Managing large-scale transportation infrastructure projects is difficult due to frequent misinformation about the costs which results in large cost overruns that often threaten the overall project viability. This paper investigates the explanations for cost overruns that are given in the literature. Overall, four categories of explanations can be distinguished: technical, economic, psychological, and political. Political explanations have been seen to be the most dominant explanations for cost overruns. Agency theory is considered the most interesting for political explanations and an eclectic theory is also considered possible. Non-political explanations are diverse in character, therefore a range of different theories (including rational choice theory and prospect theory), depending on the kind of explanation is considered more appropriate than one all-embracing theory.
16 Cost overruns in large-scale transport infrastructure projects
2.1 Introduction
Investments in infrastructure are a considerable burden on a country’s gross domestic product (GDP). For example, in 2005 the Dutch government invested about 8 billion euros (CBS, 2005 in KIM, 2007) in infrastructure, amounting to 1.55% of GDP. This is of even greater concern if the inefficient allocation of financial resources as the result of decisions based on misinformation are recognised (Flyvbjerg, 2005b, De Bruijn and Leijten, 2007). Cost estimates are often inaccurate and consequently the ranking of projects based on project viability is also inaccurate. Inevitably, this means there is a danger that eventually inferior projects are implemented, that resources are used which could have been assigned more appropriately, and that projects that are unable to recover their costs are implemented. Inaccurate estimates make it particularly difficult to manage large projects and often lead to cost overruns, which further increases the burden on the country’s GDP. The problem can be summarised as follows: managing large-scale transportation infrastructure projects is difficult due to frequent misinformation about the costs which results in large cost overruns that often threaten overall project viability. Various studies have addressed the issue of cost overruns in transportation projects (van Wee, 2007). Some studies, including a large database of projects, reach the following conclusions. The Government Accountability Office, for example, found that 77% of highway projects in the USA experienced cost escalation (in Kaliba et al., 2008). Merewitz (1973) suggests that the average overrun of infrastructure projects is a little over 50 percent (Merewitz, 1973). A review by Morris and Hough (1987), which covered about 3500 projects, revealed that overruns are the norm, and generally range between 40 and 200 per cent (Reichelt and Lyneis, 1999). Furthermore, a study by Flyvbjerg et al. (2003a) indicates that in 86 percent of the projects cost overruns appear to overrun by an average of 28 percent.
The problem is recognised in the literature but the causes and explanations are still ambiguous. To the authors’ knowledge, a systematic investigation into the different explanations for cost overruns has not yet been conducted. Moreover, insight into the theories underlying these explanations has been the subject of only a few studies. A sound theoretical basis is particularly important because it substantiates the explanation and provides opportunities to define the appropriate cures.
This paper provides an overview of explanations and their theoretical embeddedness in order to gain a better understanding of the phenomenon of cost overruns
The paper is structured as follows. The second section describes the research methodology, and this is followed in section 3 by a description of the causes and explanations for cost overruns for each source. The explanations are categorised and further examined in section 4. Section 5 elaborates on the theoretical embeddedness of the explanations. Finally, section 6 presents the main conclusions, addresses the research questions and presents a number of recommendations.
2.2 Methodology
In line with the conventional methodology, the inaccuracy of cost estimates is measured as the size of cost overruns. Cost overrun is measured as actual out-turn costs minus estimated costs as a percentage of estimated costs. Actual costs are defined as real, accounted construction costs determined at the time of project completion. Estimated costs are defined as budgeted or forecasted construction costs determined at the time of the decision to build. Cost estimates become more accurate during the project process. However, what is relevant

Chapter 2 – Explanations and their theoretical embeddedness 17
here is the estimate known by the decision maker, i.e. the estimate based upon which the decision maker decides whether or not to implement the project. A particular moment in time is often taken to represent the moment at which the decision to implement the project was made (‘formal decision to build’). Cost overruns are generally calculated according to the costs estimated at this ‘formal decision to build’ (these are the costs at the initial funding level). However, the decision-making process involves several moments at which decisions are made; therefore, references to the formal decision to build do not always provide an accurate picture of cost overruns. In some cases, parties have committed themselves at an earlier decision-making moment, known as the ‘real decision to build’. This situation is referred to as lock-in at the decision-making level. Lock-in influences the magnitude of cost overruns, because the estimated costs at the real decision to build are usually lower than those at later stages of the decision-making process (Cantarelli et al. 2009). This paper concentrates on explanations rather than on causes. In line with the definition in Flyvbjerg et al. (2004), what we mean by ‘cause’ is ‘to result in’; the cause is not the explanation of the result. Causes refer to the variables or factors that influence the cost overruns, such as the implementation period or the size of the project. Explanations are more general and might comprise several causes.
We define transportation infrastructure projects as follows: ‘Transport infrastructures include roads, rail lines, channels, (extensions to) airports and harbours, bridges and tunnels. Of these projects it is the ‘hardware’ that is considered, and the “software”,i.e. projects relating to deregulations, liberalization, privatization, and so forth is excluded’. The literature did not provide one minimum cost level that is generally applied to mark a large-scale project. A large-scale project is defined in this paper by a minimum cost level of 500 million euros.
A literature study of explanations and theories that are used to support the explanations was carried out. In line with Morris (1990), who concludes in his research that in understanding the planning failures, one has to look for a general explanation, the review methodology does not set out any restrictions in the search for literature on cost overruns of transportation infrastructure projects. It attempts to give an overview of studies that is as complete as possible. Studies addressing project performance in general are considered (broad focus) as well as studies focusing specifically on cost overruns (narrow focus). Most studies are empirical studies; studies that largely use data from observation or experience, i.e. empirical studies give insight into the extent of cost overruns based on data from real projects. Table 2-1 presents the different studies.

18 Cost overruns in large-scale transport infrastructure projects
Table 2-1 Overview of sources of literature
Various categories of projects including transport projects
Transport
Narrow focus Wachs (1987, 1989) Morris (1990) Arvan and Leite (1990) Kahneman (1993, 2003)
Knudsen (1976) Fouracre et al. (1990) Pickrell (1992) Auditor General of Sweden (1994) Mansfield et al. (1994) Skamris and Flyvbjerg (1997) Nijkamp and Ubbels (1999) Trujillo (2002) Odeck (2004) Lee (2008) Kaliba et al. (2008)
Broad focus Hall (1980) Altshuler and Luberoff (2003)
Szyliowics (1995) Bruzelius et al (2003) Flyvbjerg et al. (2003) Mackie and Preston (1998)
2.3 Causes and explanations for cost overruns
2.3.1 Studies with a narrow focus
Morris (1990) conducted one of the first empirical studies with a narrow focus on cost overruns in large projects. He argues that delays in project implementation and cost overruns have become a regular feature of public sector projects. The average cost overrun found in this study is 82%. As far as possible causes are concerned, Morris (1990) concludes that about 20 - 25% can be attributed to price increases, and the remaining 70-75% has to be explained in terms of real factors, such as delays in implementation. He gives the following main factors as the causes of delays and cost overruns: poor project design and implementation, inadequate funding of projects, bureaucratic indecision, and a lack of coordination between enterprises.
The study by Arvan and Leite (1990) focuses on large-scale government sponsored procurement. They provide an explanation of cost overruns by assuming that the sponsor cannot pre-commit to the compensation paid to the contractor when the contractor has some private cost information.
Wachs (1987, 1989) reviews several forecasting models in the field of transportation. He finds that forecasts are often inaccurate, underestimating costs and overestimating traffic demand. He proposes two possible explanations for these optimistic forecasts. Firstly, ‘forecasting is inherently exact and the observed errors result from imperfect techniques’. Secondly, ‘travel and cost forecasting is deliberately slanted to produce figures which constitute technical justification for public works programs favoured on the basis of political rather than economic or technical criteria’. Because the forecasting errors are always in the same direction - always an overestimation of traffic demand and an underestimation of costs - the first explanation seems, according to Wachs, to be less valid. In line with Ascher’s argumentation (1987) he concludes that ‘the competitive, politically charged environment of transportation forecasting has resulted in the continuous adjustment of assumptions until they produce forecasts which support politically attractive outcomes’. He identifies three main sources of error in forecasting costs: changes of scope, assumed rates of inflation that are lower than actual rates of inflation, and delay. He concludes that about 40-90% of the total

Chapter 2 – Explanations and their theoretical embeddedness 19
cost overrun can be explained by these factors, but a substantial part remains unexplained. Other causes can be found in the funding system commonly found in rail transit projects. There is an incentive with this kind of funding system to select the most optimistic assumptions in the development of cost estimates for projects.
A frequently cited piece of research concerned with forecasting in decision-making is by the Nobel prize winner Kahneman. Kahneman and Lovallo (1993) and Lovallo and Kahneman (2003) identify two main biases in forecasting and risk taking. The first bias concerns optimism bias, the systematic tendency to be overly optimistic about the outcome. The second bias concerns risk aversion, the overly cautious attitudes towards risk.
Lastly, a more recent study by Lee (2008) examined cost overruns in Korean social overhead capital projects. Based on 161 completed projects he concluded that the causes of cost overruns can be grouped into several major categories: changes in scope, delays during construction, unreasonable estimation and adjustment of project costs, and no practical use of the earned value management system.
Various studies addressed cost overruns for transportation projects specifically. For example, Pickrell (1992) investigated the cost overruns and benefit shortfalls of 8 rail transit projects in the US. In his study, Pickrell (1992) starts from the premise that forecasters overestimate rail transit ridership and underestimate rail construction costs and operating expenses. To understand these inaccurate forecasts, he points, on the one hand, to optimism among local officials and to inadequate planning processes on the other. He argues that the causes of underestimated costs lie in the structure of programmes and the existence of dedicated funding sources that provide few incentives for local officials to seek accurate information for evaluating alternatives. Fouracre et al. (1990) investigated cost overruns for 21 metro projects worldwide. Nearly all the metro systems incurred costs higher than expected. These overruns were attributed to ‘a range of factors, including the additional costs of unforeseen service and utility diversions and other civil works problems, which could not be offset by contingency allowances; changes in specifications; currency devaluation and rises in interest charges’. According to the authors, most of the cost estimates were optimistic because there was little appreciation of the difficulties of the work. In addition, authorities lacked the management skills to mitigate errors in project planning and to keep effective control of costs.
The Auditor General of Sweden (1994) is another study with a narrow focus on cost overruns involving transport projects. It covered 15 road and rail projects. The average capital cost overrun for the eight road projects was 86%, ranging between 2 and 182%, and for the seven rail projects this was 17%, ranging from minus 14% to plus 74%. The authors conclude that there is still a considerable element that cannot be explained by technical causes.
The study by Mansfield et al. (1994) considered the causes of cost overrun in Nigerian construction projects specifically (highway projects). They concluded that the major variables that can lead to excessive project overruns are the financing of and payment for completed works, poor contract management, shortages of materials, price fluctuations, and inaccurate estimates leading to delays. Other factors which can be identified as usually being responsible for project delays and excessive costs are excessive bureaucratic checking and approval procedures, unclear definitions of contract terms by the client and insufficient geotechnical investigations at the feasibility stage.
The research by Skamris and Flyvbjerg (1997) covers seven tunnel and bridge projects. They found an average construction cost overrun for the five completed projects of 14%, ranging from -10% to 33%.

20 Cost overruns in large-scale transport infrastructure projects
The Dutch study by Nijkamp and Ubbels (1999) also concentrates specifically on the cost overruns of transport projects. In contrast to the findings of most studies, they conclude that in cost estimates generally tend to be rather reliable. In most projects, cost overruns were common but the extent of cost underestimation varied between 0 and 20%. They identify three common causes of cost underestimation in projects: price rises, incompleteness of estimations and adjustments to the projects. They do not consider the strategic behaviour of the actors involved to have a major impact on cost overruns. They tend to argue that change in social opinion and intervention by interest groups, the availability of new technologies, the state of the economy, and the tendering method all lead to adjustments in the project which cause cost overruns.
A more recent study on cost overruns by Odeck (2004) uses statistical analysis to derive the average cost overruns and to identify the factors that influence cost overruns. The average cost overrun found in this study is rather small at around 7.9%. A striking feature is the large standard deviation – 29.2% – indicating a large spread around this average among the individual projects. Surprisingly, the cost overrun percentage seems to be higher for smaller projects compared with larger ones. (However, the number of large projects is small compared with the number of smaller projects.) Regarding the factors that influence cost overruns, it was concluded that completion time and the geographical region influence cost overruns, whereas project type and workforce do not have an impact. Odeck (2004) argues that larger projects are most probably under much better management compared with smaller ones and this is the reason why overruns are less predominant among larger projects. As a possible explanation for the tendency that cost overruns are higher the shorter the completion time, he argues that the shorter the length of time the construction is expected to take, the more difficult it is to predict costs. This would imply that uncertainties diminish with time.
Kaliba et al. (2008) carried out a study into cost escalation and schedule delays in road construction projects in Zambia. The main causes of cost escalation were: bad or inclement weather due to heavy rain and flooding, scope changes, environmental protection and mitigation costs, schedule delay, strikes, technical challenges, inflation and local government pressure. Factors that lead to cost escalation are said to include: the size of the project; project scope enlargement; inflation; length of time to complete the project; incompleteness of preliminary engineering and quantity surveys; engineering uncertainties; exogenous delays; complex administrative structures; and inexperienced administrative personnel (Merewitz, 1973). Cost escalation is further compounded by factors such as project location, project conditions, environmental mitigation costs, suspension of work, strikes, poor site coordination, expiry of bid, local government pressure, political discontinuity and transportation problems (Hall, 1980; NAP, 2003; Schexnayder, 2003).
2.3.2 Studies with a broad focus
Hall (1980) conducted one of the first empirical studies with a broad focus on inadequate planning of large infrastructure projects incorporating cost overruns. The research starts with the notion that many of the planning disasters seem to have been initiated on the basis of forecasts that were later found to be inadequate and misleading. Searching for a better understanding of the failures in planning, Hall (1980) considers planning uncertainty to be an important element and makes a distinction between three categories of uncertainty. They are: uncertainty in the planning environment, uncertainty in related decision areas and uncertainty about value judgments (see: Hall, 1980, for an elaboration on these types of uncertainty). He further considers whether the difference between public and private goods has any effect on

Chapter 2 – Explanations and their theoretical embeddedness 21
the planning failures. According to Hall (1980), the main problem is the way in which societies plan the output of the public good (goods and services which the public is willing to pay for but which the private sector is not motivated to provide (Hall, 1980)). Public goods are characterised by non-exclusiveness and non-control over exclusion (Snidal, 1979). Suppliers of the public good do not have the opportunity not to provide the good (non-exclusiveness). This difference between public and private goods is particularly important in the research on cost overruns.
Mackie and Preston (1998) present twenty-one sources of error and bias in the appraisal of transport projects. They mainly relate to measurement error and appraisal optimism. They conclude that appraisal optimism is the greatest danger in transport investment analysis. ‘Appraisal optimism happens because the information contained in the appraisal tends to be owned by scheme promoters who have obvious incentives to bias the appraisal - deliberately or unwittingly’.
Another study that incorporates a wider scope is the research of Bruzelius et al. (2002) who find that differences between forecasts and actual costs, revenues and viability could not be explained by the difficulty of forecasting itself. These differences can only be explained by the strategic behaviour of project proponents who succeed in biasing forecasts in such a way that it leads to the decision to continue with the project instead of to change plans. Three issues are mentioned in this respect: the lack of a long-term commitment to the project, rent-seeking behaviour for special interest groups, and the tendency to underestimate in tenders in order to get proposals accepted.
Research by Altshuler and Luberoff (2003) focuses on the new politics of infrastructure development and distinguishes four political eras. One of the main important conclusions of the research relevant here is the following notion: ‘consistent underestimation is an example of the tragedy of the commons. It corrodes the public confidence in government overall, and especially in proposals with long time frames, even as it helps advance specific projects’.
Finally, one of the leading pieces of research in the field of cost overruns in large transportation infrastructure projects is by Flyvbjerg et al. (2003a). They examined 258 projects worldwide, and their research identifies cost overruns for several projects. They find that cost overruns are the greatest for rail projects, with an average cost overrun of 45%, followed by fixed links (average cost overruns of 34%) and road projects (average cost overrun of 20%). Explanations for cost overruns are sought through statistical analysis and theoretical considerations. Four categories of explanations were distinguished (see for example Flyvbjerg et al. 2002, Flyvbjerg 2005, Flyvbjerg et al. 2003a). First, technical explanations are indicated, which are forecasting errors in technical terms, including inadequate data and lack of experience. Second, there are economic explanations that depict the cost underestimation as deliberate and economically rational. Third, psychological explanations for cost overruns, including the concepts of planning fallacy and optimism bias, are provided. Fourth, political explanations might also explain cost overruns. Strategic misrepresentation is an important concept within political explanation.
To obtain a better overview of the type of causes and explanations, section 4 will categorise these causes and explanations.

22 Cost overruns in large-scale transport infrastructure projects
2.4 Categorising causes and explanations
Table 2-2 presents the causes and explanations found in the studies considered based on the categorisation provided by Flyvbjerg et al. (2003a).
Table 2-2 Causes and explanations
Explanations Causes Study Technical Forecasting errors including price rises, poor
project design, and incompleteness of estimations Scope changes Uncertainty Inappropriate organisational structure Inadequate decision-making process Inadequate planning process
Morris, Nijkamp and Ubbels,Lee, Fouracre, Mansfield et al., Kaliba et al., Mackie and Preston Nijkamp, Wachs, Lee, Fouracre et al., Kaliba Hall, Kaliba et al. Hall, Mansfield et al., Kaliba et al. Bruzelius et al. Pickrell
Economical Deliberate underestimation due to: - lack of incentives, - lack of resources, - inefficient use of resources - dedicated funding process - poor financing / contract management - strategic behaviour
Pickrell, Wachs Odeck, Mansfield et al. Hall Pickrell, Morris, Wachs, Bruzelius et al. Mansfield et al. Hall, Bruzelius et al.Arvan and Leite
Psychological Optimism bias among local officials Cognitive bias of people Cautious attitudes towards risk
Pickrell, Kahneman and Lovallo, Fouracre et al., Mackie and Preston Kahneman and Lovallo Kahneman and Lovallo
Political Deliberate cost underestimation Manipulation of forecasts Private information
Nijkamp, Bruzelius et al. Wachs, Auditor General of Sweden Arvan and Leite
Technical explanations are commonly found in the literature on cost overruns. Price rises, poor project design and implementation, and incomplete estimations are all seen as the causes of cost overruns. Price rises are difficult to predict in the future, poor project design and implementation could be the result of a lack of experience, and incomplete estimates are an indication of inadequate data. These are considered variables that influence cost overruns, rather than explaining cost overruns themselves. Together with other causes, the cause is part of a technical explanation. Scope changes, uncertainty, inappropriate organisational structure, inadequate decision-making processes, and inadequate planning processes are all considered technical explanations for cost overruns on their own. They mainly relate to difficulties predicting the future and are considered ‘honest’ errors. Scope changes indicate changes in the design that were not predicted beforehand. These changes involve additional costs. The inappropriate organisational structure, the inadequate decision-making process, and the inadequate planning process all indicate inefficiency resulting in costs higher than expected. What we are looking at here are an inability to adapt sufficiently well to changing circumstances, accountability and control, and planning.
The lack of incentives and resources, the dedicated funding process, and the inefficient planning of public outputs are considered (economic) causes because although they influence the extent of cost overrun, they cannot provide an explanation in themselves. Forecasters often lack an incentive to provide accurate estimates and accordingly underestimate forecasts because it is in their own interest to do so. Due to a lack of resources, decision-makers have to choose between projects and this leads to competition. Consequently, project promoters deliberately underestimate costs in order to make projects look more attractive and thereby

Chapter 2 – Explanations and their theoretical embeddedness 23
increase the chance of being selected. The inefficient use of resources can also result in cost overrun. Inferior projects are implemented and resources are spent that cannot be recovered. Lastly, the dedicated funding process results in cost overruns. Costs of projects are deliberately underestimated to increase the chance of receiving part of the funding. Strategic behaviour is an economic explanation for cost overruns on its own. Underestimating costs increases the chance of getting the project started.
Psychological explanations are based on the concepts of planning fallacy and optimism bias. They involve peoples’ cognitive bias and their cautious attitudes towards risks When taking decisions. In taking decisions with risky prospects, people tend to be risk averse, have near-proportional risk attitudes (people are proportionally risk averse) and frame their decision problems narrowly (people consider decision problems one at a time, often isolating the current problem from other choices that may be pending, as well as from future opportunities to make similar decisions (Kahneman and Lovallo, 1993)). The cognitive bias leads to optimistic forecasts resulting in cost overruns. And due to the cautious attitude towards risks, people frame an outcome that maximises utility. A higher utility is obtained when the project is selected for implementation. The chance of being selected is increased when the estimated costs are low, consequently leading to underestimation.
Political explanations are generally agreed upon in the literature as the main explanation for cost overruns. Other explanations (sub-explanations) that fall within this overall category are deliberate cost underestimation and forecast manipulation. Costs are deliberately underestimated in order to increase the chances of project acceptance. Wachs (1989) argues that cost forecasts are manipulated because behaviour is determined on considerations of advocacy rather than objectivity. The literature furthermore describes different causes of cost overruns by strategic misrepresentation, including: learning, a lack of coordination, a lack of long-term commitment, a lack of discipline, organisational and political pressure, and asymmetric information. Learning involves the awareness among managers and decision-makers that in order for projects to be selected for implementation, forecasts of outcomes have to be highly favourable. Consequently, they behave strategically and misrepresent forecasts. The lack of coordination, the lack of long-term commitment and the lack of discipline make strategic behaviour possible because of the lack of consequences that is related to this kind of behaviour. Organisational and political pressures cause strategic misrepresentation because forecasts are adjusted to derive the most politically or organisationally attractive outcomes. Lastly, asymmetric information is an important cause of deliberate underestimation or strategic misrepresentation. Decision-makers have little information and are dependent on the information obtained from forecasts. This gives forecasters the opportunity to misrepresent information.
It is recognised within this categorisation of explanations that the difference between economic and political explanations is rather small. Both types of explanation use utility as a basis to understand behaviour. However, the starting point differs. Whereas economic explanations reason from the lack of incentives and resources and consider this the starting point to strive for utility maximisation, political explanations construe this in terms of interests and power (Flyvbjerg, 1998).

24 Cost overruns in large-scale transport infrastructure projects
2.5 Plausibility of explanations
The plausibility of an explanation is partly based on its theoretical embeddedness. When there are models, assumptions, premises or concepts behind the explanation, the likelihood of understanding the phenomenon of cost overruns increases.
Table 2-3 shows that a large variety of theories is used to support explanations. Theories are evenly distributed among studies.
Table 2-3 Theories in explanations
Explanation Theory Study Type of study Technical
Forecasting Kahneman and Lovallo, Wachs Flyvbjerg et al.
Narrow & various, Broad & transpor
Planning Pickrell, Altshuler and Luberoff, Hall
Narrow & transport, Broad & various
Decision-making Bruzelius et al. Broad & transport Economical
Neoclassical economics Pickrell, Odeck, Wachs Narrow & transport, Narrow & various
Rational choice Hall, Flybjerg et al. Broad & various, Broad & transport
Psychological Planning fallacy & optimism bias
Kahneman and Lovallo, Pickrell, Flyvbjerg et al., Fouracre et al., Mackie and Preston
Narrow & various, Narrow & transportation, Broad & transport, Narrow &Transport
Prospect Kahneman and Lovallo, Flyvbjerg et al.
Narrow & various, Broad & transport
Rational choice Kahneman and Lovallo Narrow & various Political Machiavellianism Flyvbjerg et al., Bruzelius et al.,
Hall, Wachs, Morris, Pickrell , Nijkamp and Ubbels, Odeck
Broad & transport, Broad & various, Narrow & various, Narrow & transport
Agency Wachs, Flyvbjerg et al., Arvan and Leite
Narrow & various, Broad & transport, Narrow & various
Ethical Wachs, Flyvbjerg et al., Auditor General of Sweden
Narrow & various, Broad & transport, Narrow and transport
2.5.1 Technical explanations
Three theories were used to support technical explanations: forecasting theory, planning theory and decision-making theory. Forecasting theory examines estimations in uncertain future situations. It studies the understanding of the forecasting process at large and aims to clarify how and why the various successes and failures come about (Armstrong, 2001). Failures in estimates may arise as a result of the cognitive mind in the forecasting process. Forecasting models were used to gain a better understanding of the problems with errors in forecasting techniques or inappropriate forecasting approaches that lead to poor cost estimates. Planning theory examines how projects and policy are established (Faludi, 1973). Planning concepts were used to refer to the inappropriate planning process of projects and the poor design and implementation as a main explanation for cost overruns. Lastly, decision-making theory considers government and politics as a series of decisions taken by people and institutions that make rational decisions in the light of their interests and the circumstances under which they operate (Dunleavy, 1991). This is mainly seen when it is referred to inappropriate institutional arrangements as a reason for cost overruns. The three theories are rather different and can be useful to address different parts of the explanation.

Chapter 2 – Explanations and their theoretical embeddedness 25
2.5.2 Economic explanations
Economic explanations were mainly founded on neoclassical economics and rational choice theory. Neoclassical economics is a framework for understanding the allocation of scarce resources among alternative ends. It sees that incentives and costs play an important role in shaping decision making. These notions of incentives in decision making are used in relation to cost overruns as follows: ‘The dedicated funding causes little incentive to produce accurate figures because accurate figures decrease the chance of receiving part of the funding‘ (Pickrell, 1992). The premises of neoclassical economics are also used to find an explanation for the tendency to deliberately misrepresent information. This is explained by the lack of incentives for the planners in their role as ‘advocates’. Rational choice theory aims to understand social and economic behaviour. It assumes that the actions of individuals are fundamentally rational and people calculate the costs and benefits of an action, recognising their preference functions and constraints facing them before taking a decision (Arrow, 1987; Coleman, 1992). The theory is used to underlie the explanation that it is economically rational to underestimate costs because it will increase the likelihood of revenue and profit.
Rational choice theory is considered to have considerable potential in explaining cost overruns, not only for economic explanations but also for psychological and political explanations. For political explanations, it has important implications for the relation between the agent and the principal. The theory assumes that individuals choose the best action according to stable preference functions and the constraints facing them. When making a decision, the agent searches for the best action according to his preferences, taking the interests of the principal into account. This might lead to conflicts surrounding the cost estimates.
2.5.3 Psychological explanations
Psychological explanations are addressed by a small number of studies and are based on the concepts of planning fallacy and optimism bias, prospect theory and rational choice theory. Planning fallacy is used as follows: ‘it is the tendency to underestimate time, costs and risks of future actions and at the same time overestimate the benefits of the same actions’. Cognitive biases of forecasters such as scenario thinking, anchoring estimations and extrapolation of current trends result in optimism bias, the systematic tendency to be overly optimistic. Prospect theory (which is part of psychological theory) is used to explain that the optimistic forecasts are a result of decision-making involving uncertainties and risk. The explanation of cost overruns based on risks can also be founded by rational choice theory which assumes that in their consideration people take risk into account in their goal of utility maximisation.
The concept of planning fallacy and optimism bias are closely related, but because the link with cost overruns is stronger for optimism bias, the preference is given to this notion to support psychological explanations. Prospect theory is preferred even more so because it provides a more comprehensive model for psychological explanations incorporating uncertainty and risks in addition to optimistic forecasts. Lastly, rational choice theory is considered a very useful basis for understanding cost overruns because it addresses economic, political and psychological elements of the phenomenon.

26 Cost overruns in large-scale transport infrastructure projects
2.5.4 Political explanations
Three theories underlie political explanations: the concept of Machiavellianism, agency theory, and ethical theory. Strategic misrepresentation is the core issue in political explanations and this is underlined by the concept of Machiavellianism. This is the person’s tendency to deceive and manipulate others for personal gain (Byrne & Whiten, 1989; Christie & Geis, 1970). The concept is often used to explain cost overruns as a result of competition among parties for government funding or to get projects going. Strategic behaviour is enabled because ‘uncertainties of estimates are never brought to the attention of decision-makers’ (Odeck, 2004). Similarly, cost overruns can be considered the result of the decision-making process involving many actors with different interests acting strategically (possibly involving ‘lying’) leading to sub-optimal results. One theory that also incorporates the notion of manipulation is ethical theory, which studies the behaviour of people and groups and includes their values, customs and responsibility (Wachs, 1982; LaFolette, 2000). Costs are underestimated because of a lack of loyalty or responsibility to the agent or to a the lack of values in a forecaster’s mind to produce accurate figures. Lastly, agency theory is also often used to address the strategic behaviour in political explanations. Agency theory (principal agent theory) assumes that people act unreservedly in their own narrowly defined self-interest with, if necessary, guile and deceit (Noreen, 1999). Agency theory can explain why strategic behaviour is made possible by the concept of asymmetric information. It is also used in the context of possible institutional set-ups between parties to guide the decision-making on projects. The asymmetric information makes it possible for an agent to take strategic advantage of the set-up of the funding process to deliberately under-budget their projects in order to see them realised.
Ethical theory is rather specific and its contribution to a full understanding of cost overruns is considered to be small due to its weak relationship with cost overruns. The contribution of the concept of Machiavellianism is mainly related to the manipulation element but this is also incorporated in agency theory by assuming agents act, if necessary, with deceit. Agency theory is therefore held to be the most comprehensive theory. It is considered promising in bringing about a more general understanding of the phenomenon of cost overruns because it can also underlie economic explanations. The relationship between the agent and the principal is characterised by the utility maximising behaviour of agents, hence, the link with the economic causes of cost overruns.
2.6 Conclusions and recommendations
This paper provides an overview of the different explanations for cost overruns; the most commonly used explanations are: economic rational behaviour, strategic behaviour, optimism bias, structure of the organisation, relationship between actors and actors’ values and their relationship to the environment. The explanations can be grouped into four different categories: technical explanations, economic explanations, psychological explanations, and political explanations. In addition, the theoretical embeddedness of the explanations was investigated. The extent of the use and the variety of theories used in the literature is actually quite large. Table 2-4 indicates which theories are considered most appropriate to support the explanations for cost overruns for each category of explanations.
Considering the wide variety of explanations and theories, we recommend focusing on the type of explanation before applying a specific theory to better understand the cost overruns in projects. Each type of explanation requires the use of a different theory to understand the way

Chapter 2 – Explanations and their theoretical embeddedness 27
in which cost overruns appeared. Political explanations are the most dominant and agency theory (principal-agent theory specifically) is therefore recommended as a basic theory to understand cost overruns. Agency theory is considered to be the most interesting for the following reasons. First, it is rather specific, and can address cost overruns specifically. Secondly, an initial attempt to use the theory to understand cost overruns has already been made indicating its relevance. And lastly, the theory makes use of several disciplines, including politics, economics and sociology, which makes the theory fairly complete. However, although agency theory is quite comprehensive, it is to be expected that there may be aspects that cannot be addressed appropriately by agency theory. It might not be the all-embracing theory that can be applied to understand and explain cost overruns by political theories. If that is true, an eclectic theory needs to be defined that is based on agency theory but also includes the ‘best’ insights of other theories. Therefore, the recommendation is to search for other promising theories that can help bring about a better understanding of cost overruns. Theories in the fields of political science, economics or institutions are considered useful. In addition, research into the explanations of cost underestimation with respect to contingencies and explanations regarding demand forecasts is considered valuable.
Table 2-4 Appropriate theories for explaining cost overruns
Sub-category of explanations Appropriate theories Political explanations Machiavellianism
Agency theory Technical explanations Forecasting theory
Planning theory Economic explanations Neoclassical economics
Rational choice theory Psychological explanations Prospect theory
Rational choice theory
Acknowledgement
The research was supported by the Dutch Ministry of Transport. The authors thank two anonymous referees for their useful comments.
References
Altshuler, A. and D. Luberoff (2003) Mega-Projects: The Changing Politics of Urban Public Investment, Brookings Institution, Washington D.C.
Armstrong, J.S. (ed.) (2001) Principles of forecasting: a handbook for researchers and practitioners. Kluwer Academic Publishers, Norwell, Massachusetts.
Arrow, K.J. (1987) Economic theory and the hypothesis of rationality, in: The New Palgrave: a dictionary of economics, 2, pp. 69-75.
Arvan, L. and A.P.N. Leite (1990) Cost overruns in long term projects, in: International Journal of Industrial Organisation, 8 (3), pp. 443-467.
Auditor General of Sweden (1994) Riksrevisionsverket. Infrastrukurinvestingar: En Kostnadsjamorelse Mellan Poan of Utyfall i 15 Storre Prosjekt InnomVagverket of Banverket RVV 23.
28 Cost overruns in large-scale transport infrastructure projects
Bruzelius, N., B. Flyvbjerg, and W. Rothengatter (2002) Big decision, big risks. Improving accountability in mega projects, in: Transport Policy, 9 (2), pp. 143–154.
Buehler, R., D. Griffin and H. MacDonald (1997) The role of motivated reasoning in optimistic time predictions, in: Personality and Social Psychology Bulletin, 23 (3), pp. 238-247.
Cantarelli, C.C., B. Flyvbjerg, B. van Wee and E.J.E. Molin (2009) Lock-in and its influence on the project performance of large-scale transportation infrastructure projects. Investigating the way in which lock-in can emerge and affect cost overruns. Paper presented at the 88th annual meeting of the Transportation Research Board, Washington, D.C.
Centraal Bureau voor de Statistiek (CBS) (2005) Nationale Rekeningen 2005, CBS, Voorburg/Heerlen.
Coleman, J.S. (1992) Rational choice theory: advocacy and critique, Sage Publications, Newbury Park.
De Bruijn, H. and M. Leijten (2007) Megaprojects and contested information, in: Transportation Planning and Technology, 30 (1), pp. 49-69.
Dunleavy, P. (1991) Democracy, Bureaucracy and Public Choice. Hemel Hemstead, Harvester Wheatsheaf.
Faludi, A. (1973) Planning theory, Pergamon Press, New York.
Flyvbjerg, B. (1998) Rationality and power: Democracy in practice, University of Chicago Press, Chicago.
Flyvbjerg, B., M.K. Skamris Holm and S.L. Buhl (2002) Underestimating cost in public works. Error or Lie?, in: Journal of the American Planning Association, 68 (3), pp. 279-295.
Flyvbjerg, B., N. Bruzelius and W. Rothengatter (2003a) Megaprojects and Risk: An Anatomy of Ambition, Cambridge, Cambridge University Press.
Flyvbjerg, B., M.K. Skamris Holm and S.L. Buhl (2003b) How Common and How Large Are
Cost Overruns in Transport Infrastructure Projects?, in: Transport Reviews, 23(1), pp. 71-88.
Flyvbjerg, B. and Cowi (2004) Procedures for Dealing with Optimism Bias. Transport Planning: Guidance Document, UK Department for Transport, London.
Flyvbjerg, B., M.K. Skamris Holm and S.L. Buhl (2004) What Causes Cost Overrun in
Transport Infrastructure Projects?, in: Transport Reviews, 24 (1), pp. 3-18.
Flyvbjerg, B. (2005a) Measuring Inaccuracy in Travel Demand Forecasting: Methodological Considerations Regarding Ramp Up and Sampling, in: Transportation Research A, 39 (6), pp. 522-530.
Flyvbjerg, B. 2005b Policy and planning for large infrastructure projects: problems, causes, cures, World Bank Policy Research Working Paper, WPS3781, World Bank, Washington D.C.
Fouracre, P.R., R.J. Allport and J.M. Thomson (1990) The performance and impact of rail mass transit in developing countries, Transport and Road Research Laboratory, Crowthorne, Berkshire.
Hall, P. (1980) Great Planning Disasters, Penguin Books, Harmondsworth.
Kahneman D. and D. Tversky (1979) Prospect theory: An analysis of decision under risk, in: Econometrica, 47 (2), pp. 263-292.

Chapter 2 – Explanations and their theoretical embeddedness 29
Kahneman, D. and D. Lovallo (1993) Timid choices and bold forecasts: A cognitive perspective on risk taking, in: Management Science, 39 (1), pp. 17-31.
Kaliba, C., M. Muya and K. Mumba (2008) Cost escalation and schedule delays in road construction projects in Zambia. In: International Journal of Project Management, 27, pp. 522-531.
Kennisinstituut voor Mobiliteitsbeleid (KIM) (2007) Mobiliteitsbalans 2007, KIM, Den Haag.
Lee, L. (2008) Cost Overrun and Cause in Korean Social Overhead Capital Projects: Roads, Rails, Airports, and Ports, in: Journal of Urban Planning and Development, 134 (2), pp. 59-62.
Lovallo, D. and D. Kahneman (2003) Delusions of success: How optimism undermines executives’ decision, in: Harvard Business Review, 81 (7), pp. 56-63.
Mackie, P. and J. Preston (1998) Twenty-one sources of error and bias in transport project appraisal, in: Transport Policy, 5 (1), pp. 1-7.
Mansfield, N.R., O.O. Ugwu and T. Doranl (1994) Causes of delay and cost overruns in Nigerian construction projects, in: International Journal of Project Management, 12 (4), pp. 254-260.
Morris, S. (1990) Cost and Time Overruns in Public Sector Projects, in: Economic and Political Weekly, 15(47), pp. 154-168.
Morris, P. and G.H. Hough (1987) The Anatomy of Major Projects: A Study of the Reality of Project Management, John Wiley and Sons, New York.
Nijkamp, P. and B. Ubbels (1999) How Reliable are Estimates of Infrastructure Costs? A Comparative Analysis, in: International Journal of Transport Economics, 26(1), pp. 23-53.
NAP (2003) Completing the Big dig; managing the final stages of Boston’s Central Artery/Tunnel Project, The National Academies Press, Washington D.C.
Noreen, E. (1988) The economics of ethics: a new perspective on agency theory, in: Accounting organisations and society, 13 (4), pp. 359-369.
Odeck, J. (2004) Cost overruns in road construction – what are their sizes and determinants?, in: Transport Policy, 11(1), pp. 43–53.
Pickrell, D. (1992) A Desire Named Streetcar: Fantasy and Fact in Rail Transit Planning, in: Journal of the American Planning Association, 58(2), pp. 158-176.
Reichelt, K. and J. Lyneis (1999) The dynamics of project performance: Benchmarking the driers of cost and schedule overrun, in: European Management Journal, 17 (2), pp. 135-150.
Schexnayder C., C. Fiori and S. Weber (2003) Project cost estimating; a synthesis of highway practice, Arizona. National Cooperative Research Program, Transportation Research Board, Washington, D.C.
Snidal, D. (1979) Public goods, Property Rights, and Political organizations. In: International Studies Quarterly, 23 (4), pp. 532-566.
Trujillo, L., E. Quinet and A. Estache (2002) Dealing with demand forecasting games in transport privatization, in: Transport Policy, 9 (4), pp. 325-334.
Van Wee, B. (2007) Large infrastructure projects: a review of the quality of demand forecasts and cost estimations, in: Environment and Planning B: Planning and Design, 34 (4), pp. 611-625.

30 Cost overruns in large-scale transport infrastructure projects
Wachs, M. (1982) Ethical Dilemmas in Forecasting for Public Policy, In: Public Administration Review, 42 (6), pp. 562-557.
Wachs, M. (1987) Forecasts in urban transportation planning: uses, methods and dilemmas, in: Climatic Change, 11, pp. 61-80.
Wachs, M. (1989) When Planners Lie with Numbers, in: Journal of the American Planning Association, 55 (4), pp. 476-479.

31
3. Lock-in and its influence on project performance Cantarelli, C.C., Flyvbjerg, B., Wee, B. van, and Molin, E.J.E. (2010). Lock-in and its influence on the project performance of large-scale transportation infrastructure projects: investigating the way in which lock-in can emerge and affect cost overruns. Environment and planning B: Planning & design, 37(5), pp. 792-807.
Abstract Lock-in, the escalating commitment of decision makers to an ineffective course of action, has the potential to explain the large cost overruns in large-scale transportation infrastructure projects. Lock-in can occur both at the decision-making level (before the decision to build) and at the project level (after the decision to build) and can influence the extent of overruns in two ways. The first involves the `methodology' of calculating cost overruns according to the `formal decision to build'. Due to lock-in, however, the `real decision to build' is made much earlier in the decision-making process and the costs estimated at that stage are often much lower than those that are estimated at a later stage in the decision-making process, thus increasing cost overruns. The second way that lock-in can affect cost overruns is through `practice'. Although decisions about the project (design and implementation) need to be made, lock-in can lead to inefficient decisions that involve higher costs. Sunk costs (in terms of both time and money), the need for justification, escalating commitment, and inflexibility and the closure of alternatives are indicators of lock-in. Two case studies, of the Betuweroute and the High Speed Link-South projects in the Netherlands, demonstrate the presence of lock-in and its influence on the extent of cost overruns at both the decision-making and project levels. This suggests that recognition of lock-in as an explanation for cost overruns contributes significantly to the understanding of the inadequate planning process of projects and allows development of more appropriate means.

32 Cost overruns in large-scale transport infrastructure projects
3.1 Introduction
Large-scale transportation infrastructure projects are often characterised by large cost overruns (Flyvbjerg et al, 2003; Hall, 1980; van Wee, 2007). Flyvbjerg et al (2003) indicate that cost overruns appear in 86% of the projects they considered with an average cost overrun of 28% [see Flyvbjerg (2005) for the definition of cost overrun]. Earlier research has provided a variety of explanations (Flyvbjerg et al, 2002; 2003; Hall, 1980; Pickrell, 1992; Wachs, 1989), which can be broadly grouped into four categories: technical, economic, psychological, and political (Flyvbjerg et al, 2003). The first - technical explanations - involves `forecasting errors' expressed in technical terms; examples include imperfect forecasting techniques, inadequate data, and lack of experience. The second - economic explanations - involves issues of either economic self-interest or public interest. The third - psychological explanations - includes the concepts of planning fallacy (the tendency to underestimate the time needed to complete certain tasks) and optimism bias (the systematic tendency to be overly optimistic about the outcomes of actions), and the fourth - political explanations - involves strategic misrepresentation through the deliberate and strategic underestimation of costs when forecasting the outcomes of projects.
Although researchers generally agree that the problem exists (van Wee, 2007), they differ widely about the causes and explanations. For example, both Flyvbjerg et al (2003) and Pickrell (1992) consider strategic misrepresentation to be the main explanation, whereas Wachs (1989) explains the phenomenon in terms of ethical considerations. Because of this diversity of explanations, a broader view, which addresses the phenomenon by including inadequate project planning in general, is useful.
Arthur (1989), for example, uses a dynamic approach of allocation of resources under increasing returns to explain the outcome of a decision-making process. On the basis of the four principles of increasing returns, he explains how decision-makers select an outcome. First, the nonergodic principle implies that different historical or chance events determine the drive towards a different outcome. Second, nonpredictability indicates that the outcome could not be predicted before the historical or chance event took place. Third, the inflexibility principle concerns the lack of possibilities to influence the drive towards another outcome. Finally, path inefficiency indicates the presence of an outcome that would have been more successful. Policy results depend on the start and the specific development of the decision-making process in time (path dependency).
Lock-in is created when suboptimal policies are used as a consequence of path dependency, even though a better alternative is present (Woerdman, 2004). The term refers to the overcommitment of decision makers to an ineffective course of action (for example, a decision or project). Overcommitment itself refers to the style of psycho- logical coping associated with the inability to withdraw from obligations (Vrijkotte et al, 2004). There are several possible moments in the decision-making process before the formal decision is taken at which decision makers become committed to the project. This early commitment is, in itself, not necessarily negative and could also be advantageous to the decision-making process as it could enforce a decision, and thus limit delay. Early commitment can result in negative outcomes once the commitment turns into escalating commitment and lock-in. As lock-in is based on escalation, it has, by definition, a negative influence on project performance. On this basis, we provide a more thorough examination of lock-in and its influence on project performance, specifically regarding cost overruns, while considering the relationship between lock-in and the four categories of explanations mentioned above.

Chapter 3 – Lock-in and its influence on project performance 33
Although lock-in often concerns technical lock-in, [eg see David's article (1985) on the QWERTY keyboard] we are concerned with its institutional or behavioural form. It is a general phenomenon that is widely acknowledged in literature (eg, Brockner et al, 1986; Staw, 1981; Whyte, 1986), where the process of escalating commitment is also known as `entrapment' (Brockner and Rubin, 1985), the `sunk-cost' effect (Northcraft and Wolf, 1984), the `knee-deep in the big muddy' effect (Staw, 1976), and the `too much invested to quit' effect (Teger, 1980 in Brockner et al, 1986). However, institutional lock-in has never, to the best of our knowledge, been examined in the specific context of large-scale transportation infrastructure projects.
In order to consider it in this context, it is first necessary to understand how lock-in can influence the project performance. It can do so in two different ways. First, it can influence the extent of cost overruns through the methodology of calculating these overruns. In such a case, a particular moment in time is often used to represent the moment at which the decision to implement the project was made (`formal decision to build') (Flyvbjerg et al, 2003). Cost overruns are commonly calculated according to the costs estimated at the time of the formal decision to build (the costs at the initial funding level) (Flyvbjerg et al, 2003). The decision-making process, however, involves several moments at which decisions are made so references to the formal `decision to build' do not always provide an accurate picture of cost overruns. In some cases, parties commit themselves at an earlier decision-making moment, known as the `real decision to build'. In this paper this situation is referred to as lock-in at the decision- making level. The reason why lock-in influences the extent of cost overruns is that the estimated costs at the time of the real decision to build are usually lower than those at later stages in the decision-making process.
In this paper a distinction is made between the `formal' and `real' decision to build. In line with previous research in this field, a specific definition is used to determine the formal decision to build: it is the moment at which the decision was taken in Parliament. Literature on this subject (eg see Flyvbjerg et al, 2003; Teisman, 1995) recognises that it is more difficult to determine the moment of the real decision to build because that decision is taken informally and within a fuzzy environment.
The second way in which lock-in can influence the extent of cost overruns is through `practice'. Although the decision to implement the project has been made, specific decisions about the project itself also need to be made. These may not be `optimal', may involve the danger of inefficient outcomes, and can lead to lock-in at the project level.
To conclude, lock-in can be distinguished at two different levels, the decision- making level and the project level, and can influence the extent of cost overruns in two different ways, methodology and practice. In the light of this, the general definition of lock-in is adjusted in this paper and formulated as: the overcommitment of parties to an inefficient project before the formal decision to build is taken, and to the inefficient specifications of the project after the formal decision to build has been taken.
Our primary aim is to present lock-in within a framework in order to provide insight into the way in which it can actually occur and influence project performance (cost overruns). A further aim is to determine empirically whether lock-in has actually taken place in a project and, if it has, whether it has influenced the performance of that project. Our main research question is: can lock-in provide an appropriate explanation for cost overruns? This is answered by addressing two subquestions: (1) how can lock-in emerge at the decision-making and project levels? and (2) has lock-in actually taken place in projects, and, if so, how did it

34 Cost overruns in large-scale transport infrastructure projects
occur and until what moment in the decision-making process could the decision have been reversed?
Two research methods are applied to address these questions. A literature survey was conducted to address the first research question, and case-study research was used to derive empirical evidence to answer the second. The case studies, of the HSL-South (High Speed Link-South) and the Betuweroute projects (these are described later), were developed specifically to determine whether lock-in was present in the decision-making process through the identification of several indicators, and, if it was present, how it appeared. The projects were chosen because they are large scale, well documented, and either nearly complete or recently implemented. In addition, since this study is part of a larger investigation of large-scale projects in the Netherlands, they are both Dutch projects.
Developments that took place in the projects are examined, and how these develop-ments relate to the indicators of lock-in is investigated. If many indicators of lock-in were present, it must be concluded that lock-in played a significant role in the decision-making process.
Since the reports of the Temporary Committee for Infrastructure Projects (TCI, 2004a; 2004b), which conducted extensive investigation of both projects, provide a good overview of the project characteristics they were used to derive most of the data. In addition, the semiannual progress reports of the projects and several other reports were also consulted.
The scientific relevance of this work is that it fills a gap in knowledge concerning the contribution of lock-in to inadequate transport planning in large-scale transportation infrastructure projects. It is also of social relevance, due to the major impact of lock-in on social welfare. Obtaining better insight into the role lock-in has in cost overruns is likely to lead to solutions that avoid it, thus reducing the large burden on the state's budget.
This paper is organised as follows. Section 2 elaborates on the concept of lock-in and investigates how it can emerge and influence cost overruns. Sections 3 and 4 describe the two case studies, the Betuweroute and the HSL-South projects, respectively. Finally, section 5 presents the main conclusions and recommendations.
3.2 Recognising lock-in
This section addresses the first subquestion: how can lock-in emerge at the decision-making and project levels?
In order to define the ways in which lock-in can emerge, different indicators and criteria that determine whether the indicator is present are specified. Since, as the previous section indicated, path dependency plays a role in lock-in, two indicators were derived: inflexibility and closure of alternatives. These are considered one indicator for lock-in in the remainder of this paper because they are both based on path dependency. Decision makers who make a certain decision within an inflexible or incomplete (in the sense of not including all the alternatives) decision-making process are likely to be influenced by lock-in. A decision route becomes path dependent when previous decisions or events subject to inflexibility or closure of alternatives determine the current decision, which cannot be revised to reach another outcome.

Chapter 3 – Lock-in and its influence on project performance 35
Several studies have investigated the indicators for lock-in using various theories, including transaction-costs economics (Amess, 2002), complexity theory (Walby, 2003), self-justification theory and prospect theory (Brockner et al, 1981; 1982; Wilson and Zhang, 1997), and decision-dilemma theory (Bowen, 1987; Brockner et al, 1982). Transaction cost economics identifies sunk costs (that is, the irretrievable costs in terms of money and time) as an important subject of study: ``Individuals show a greater tendency to continue an endeavour once an investment in funds, effort or time, has been made'' (Wilson and Zhang, 1997, page 289). As a consequence, sunk costs lead directly to lock-in at the project level and, through their impact on escalating commitment, point to lock-in at the decision-making level. Commitment to the project or decision increases concurrently with the amount of time invested in the decision-making process, making it more difficult to reconsider the decision.
The relationship between sunk costs and lock-in can also be explained by prospect theory, which describes how people make choices in situations in which they must decide between alternatives that involve risk. Kahneman and Lovallo (1993) argued that there is asymmetry in the way in which individuals value gains and losses; losses having a greater impact than equivalent sized gains. This asymmetry is known as loss aversion: the tendency to have a strong preference for avoiding losses over acquiring gains. Loss aversion can explain the sunk-cost effect as follows: when an investment in time or money is made (for example, time spent in the decision-making phase or money spent in the project phase), individuals prefer to continue with the project because doing so allows for a chance of successful implementation, as opposed to a sure loss of the investment should they decide to quit. A decision is subject to sunk costs when it is decided to proceed with the project despite a lack of results from investments made in time or money.
Decision makers show evidence of entrapment whenever they escalate their commitment to ineffective policies, products, services or strategies in order to justify previous allocations of resources to those objectives (Brockner et al, 1986). Escalating commitment and justification are therefore important indicators of lock-in. The need for justification is derived from the theories of self-justification and dissonance, which describe how individuals search for confirmation of their rational behaviour (Staw, 1981; Wilson and Zhang, 1997). This need arises from social pressures and `face-saving' mechanisms. The involvement of interest groups and organisational pushes and pulls can also introduce pressures into the decision-making process, threatening the position of the decision makers, who may feel pressure to continue with a (failing) project in order to avoid publicly admitting what they may see as a personal failure (McElhinney, 2005). Face saving was described by Whyte (1986, page 311) as when ``people try to rationalize their actions or psychologically defend themselves against an apparent error in judgment.'' When the support for a decision is sustained despite contradicting information and social pressures, the argumentation for a decision is based on the need for justification.
Although escalating commitment can be the result of sunk costs and the need for justification, complexity theory and decision-dilemma theory have identified several other variables that lead directly to escalating commitment. Examples include agreements between parties and flawed decision-making processes that focus on solutions rather than on problems. Political vulnerability leads to escalating commitment in a project due to the influence of interests: and commitments to decisions (Whyte, 1986). If strategic behaviour is evident in a project, it can also lead to escalating commitment, with individuals or groups acting in favour of a specific project, or underestimating the costs to make the project appear more acceptable.

36 Cost overruns in large-scale transport infrastructure projects
To determine if the argumentation of a decision was based on escalating commitment, the following indicators were identified: (1) an excessive focus on one particular outcome; (2) if agreements regarding the outcome were made earlier; (3) strategic behaviour; (4) if actions were taken for political reasons.
These different theories identify several indicators of lock-in and provide insight into how the indicators are created and how lock-in can result at the decision-making or project level. The relationship between the indicators and their outcomes is illustrated in the framework in Figure 3-1, which shows the four indicators: sunk costs, the need for justification, escalating commitment, and inflexibility and the closure of alternatives.
Figure 3-1 Theoretical framework for lock-in (Solid line represent the influence of conscious lock-in, dotted lines the influence of unconscious lock-in)
A distinction should be made here between conscious and unconscious lock-in. With the former, decision makers are aware of their tendency to justify a decision instead of evaluating it critically and having the possibility of reversing the decision. Unconscious lock-in, on the other hand, can occur in projects when the decision maker cannot see a possibility of changing the situation. In Figure 3-1 the dotted lines represent the influence of unconscious lock-in, and the solid lines represent the influence of conscious lock-in. Sunk costs in terms of time lead to unconscious lock-in. Escalating commitment, inflexibility, and closure of alternatives lead to conscious lock-in. Since it is difficult to control sunk costs in terms of time, their impact is assumed to lead to unconscious lock-in. On the other hand, as other indicators can, to some extent, be managed, they are considered to be indicators of conscious lock-in.
There is a further distinction between intentional and unintentional lock-in. Lock-in can be the result of intentional behaviour on the part of a decision maker to ensure the implementation of a project. The importance of such a lock-in is presented by Walby (2003), who argues that an important role is played by social and political institutions that lock-in certain paths of development, by shaping power, opportunity, and knowledge (Arthur, 1989; David, 1985; Mahoney, 2000; Nee and Cao, 1999; North, 1990; Pierson, 2000a; 2000b; 2001).
Solution starting point
Lock-in
Sunk costs (time, costs)
Need for Justification
Escalating commitment
Inflexibility, Closure
alternatives
Indicator OutcomeInput variables
Face-saving
Social pressures
Path dependency
Strategic behaviour
Political vulnerability
Investments
(decision-making and project level)
Agreements
Chapter 3 – Lock-in and its influence on project performance 37
Some of the different types of lock-in can be avoided. For example, avoidance is possible when decision makers are conscious of their behaviour and are willing to change that behaviour. However, other types of lock-in are more difficult to control, such as the intentional lock-in which is the result of specific behaviour by stakeholders.
Against the background of this insight, two case studies are described in section 3 and 4 with the aim of empirically considering the role of lock-in and providing an answer to the second subquestion: has lock-in actually taken place in projects and, if so, how did it occur and until what moment in the decision-making process could the decision have been reversed?
3.3 Case study: the Betuweroute
The Betuweroute is a freight-transport railway line of about 160 km, between the port of Rotterdam and the European hinterland. It was finally opened in 2007 after a long decision-making process. As long ago as the early 1980s, the construction of a new railway line was proposed to deal with the unsatisfactory rail connections of the `main port' Rotterdam (Priemus, 2007), thus improving the connections between the hinterland and the main port and strengthening the national economy. The Betuweroute project was approved by the Dutch House of Representatives in 1994, after much public debate questioning its desirability and necessity. The project was then reconsidered but this did not influence the outcome, and in 1996 the decision to build the project was taken. This case study involves a systematic search for the presence or absence of lock-in indicators (that is, sunk costs, a need for justification, escalating commitment, and inflexibility and the closure of alternatives).
3.3.1 Decision-making level
The project was incorporated into the policy plans in 1990 as the SVVII (Second Transport and Structure Plan) as a solution to the problem of insufficient railway capacity for freight transport to accommodate expected future growth. This created an excessive focus on the Betuweroute itself and shifted attention away from the problems (that is, the solution was taken as a starting point) (TCI, 2004a). Politician Hermans, chairman of the commission on the Betuweroute, concluded that in a manner of speaking, the decision was taken first after which arguments played a role (De Gelderlander, 1995 in Roscam Abbing et al, 1999, page 13). Priemus (2007, page 630) reached similar conclusions: “the solution was decided upon at a very early stage of the process.” This excessive focus indicates the presence of escalating commitment by politicians to the project in the decision-making process. The number of agreements, another criterion for escalating commitment, also contributed to overcommitment to the project. Examples of this include the Agreement of Warnemünde (with Germany about the connection to the German railway network) and agreements relating to the project's inclusion in the SVVII. These agreements formalised the decision to construct the railway line.
The problem analysis remained narrow, focusing on identifying opportunities to develop Rotterdam harbour as a main port (Priemus, 2007), with the result that the decision-making process was inflexible and incomplete (focusing solely on railway connections instead of other options to increase the strength of the main port) and alternatives to the Betuweroute were not really considered. Although the Betuweroute project was labelled as indicative rather than decisive in SVVII, the Dutch Railway Company had investigated the specific implementation of the Betuweroute (Ministry of Transport, 1996 - 2007; Pestman, 2001; TCI,

38 Cost overruns in large-scale transport infrastructure projects
2004a) in the project memorandum, thus limiting itself to studying this solution alone and failing to consider alternatives (for example, zero plus alternatives alternatives in modality, and rail alternatives). For example, a possible alternative increasing the capacity of inland waterway transport was never fully considered. Several other alternatives, such as joint hinterland connection by rail between Rotterdam and Antwerp, using the existing railway network more intensively, and underground construction were also not taken seriously or were proposed far too late to add anything to the discussion (Priemus, 2007).
Roscam Abbing et al (1999, page 10) showed that reports were “written under order in which some comparisons were made and others were not, and for a government that was not willing to enter into any discussion concerning content and to stake everything to force a `point' of no return.” They argued that the question of how inland shipping might provide a possible solution was not answered as it could have harmed political support for the Betuweroute. This shows escalating commitment as a result of the closure of alternatives and due to political vulnerability.
Social pressures as a consequence of continuous criticism of the project led to the cabinet decision to follow a two-track policy, calling for the publication of the PKB1 (Key Planning Decisions, part 1, design track decision) while conducting additional research into the justification of the intention to implement the Betuweroute. This allowed them to continue with the Betuweroute project (further locking themselves into the project) while simultaneously addressing the criticism of the PKB1. Although the PKB-procedure had started, the desirability and necessity of the Betuweroute were yet to be discussed.
The need for justification can also be seen in the decision of the cabinet to start a PKB procedure as part of the New Track Law. Although this planning procedure provided a new opportunity to fundamentally question the project, steps that could not be reversed (lock-in) had already been taken. The TCI described the Cabinet's lock-in to the project as follows:
“The Cabinet decided to take the lead and follow a PKB-procedure for the Betuweroute”. (This made it harder to reverse the decision for the project, which was exactly as the Cabinet had intended.) “The Cabinet used the time argument to pressure the parliament; postponing the decision-making was not desired” (TCI, 2004a, page 399).
Two new pieces of legislation (the New Track and NIMBY laws) were planned to prevent further delay to projects or, in other words, to speed up the decision-making process (Priemus and Visser, 1995). Overall, the reaction to the criticism of the Betuweroute led to face saving and was the immediate cause for continuing with the project. This can also be seen as escalating commitment due to sunk costs in time.
Arguments to support the decision to implement the project were poorly founded. The report by the Hermans Commission (established in 1994 to investigate the desirability and necessity of the Betuweroute) lacked an adequately justified conclusion and the Nijffer Research Institute report provided no new insights into the economic effects of the project. Furthermore, the fact that the environmental objectives had not been met proved no reason for abandoning or adjusting the decision to implement the Betuweroute project (Ministry of Transport, 1996 - 2007; TCI, 2004a). This decision shows a face-saving mechanism on the part of the decision makers. One of the main conclusions of Pestman's (2001, page 206) research into the Betuweroute was the importance of the need for justification:

Chapter 3 – Lock-in and its influence on project performance 39
“whenever the degree of mobilisation is quite high, new insights and more information, which might prove advantageous in making a fair assessment of societal costs and benefits, are found. However, due to the mobilisation process, it becomes increasingly difficult for politicians to change their opinions because of their fear of losing credibility.”
Even after environmental and economic arguments removed the foundations of the implementation decision, politicians insisted that it was a `strategic decision' (Roscam Abbing et al, 1999). This political vulnerability indicates that the escalating commitment to the project created lock-in of the decision makers to the project.
Finally, the unwillingness of political parties to change their opinions regarding the decision to implement the Betuweroute project, once new insights into the desirability and necessity of the project became available, indicates the presence of inflexibility in the project implementation. For example, the Netherlands Bureau for Economic Policy Analysis (TCI, 2004a, page 194) concluded that the capacity along the east - west corridor was higher than expected, allowing for phased implementation. However, the decision makers did not take this new information into account (inflexibility) (Priemus, 2007; TCI, 2004a). This unwillingness to reopen the discussion again created lock-in through the failure to consider other, potentially more efficient, implementation choices.
Figure 3-2 (based on Ministry of Transport (1996 - 2007); TCI (2004a)) shows the decision-making moments that led to lock-in along a timeline.
Figure 3-2 Timeline for the Betuweroute project (decision-making level) (Costs are from the official reported budget (including inflation) in billion euros. PKB=key planning decision; SVVII=Second Transport and Structure Plan (based on TCI, 2004a; Ministry of Transport, 1996-2007))
Although the formal decision to build was taken in 1996, all five decision-making moments had taken place before 1996, suggesting the presence of lock-in in the decision-making process. It is therefore reasonable to assume that the real decision to build was made before 1996. Identifying the `real decision to build' requires consideration of each decision-making moment with regard to the relative possibility of revising the decision. The moment at which this was no longer possible is known as the `point of no return'. In 1990, when the SVVII was published, the project was described as `indicative' but no formal agreements had yet been made. Consequently, it was still possible to reconsider the decision. This was also the case for the decision-making moment in the project memorandum. Although the memorandum considered only the Betuweroute and no further alternatives, it did not incorporate any agreements that precluded the possibility of reversing the decision. The point of no return in the Betuweroute project was actually the start of the PKB-procedure in 1992, at which the first steps into project implementation had already been taken even though a clear justification
SVV2: Betuweroute as a starting point
(escalating commitment) New track law
19943,744
19954,034
19964,138
19974,243
19933,239
19922,832
19912,335
19901,134
Decision to build
Project memorandum: Focus on Betuweroute (closure alternatives) Agreements of
Warnemunde (escalating commitment)
PKB-procedure was started
to “save face”
Re-opening discussion: political vulnerability led to escalating commitment
1990 - 1991
Years:Costs *:
* Official reported budget including inflation (in billion euro)

40 Cost overruns in large-scale transport infrastructure projects
was lacking. This made it impossible to reopen the discussion concerning the decision to build. Withdrawing was no longer an option, decision makers were obliged to the project.
Lock-in thus led to a real decision to build that was taken before the formal decision to build. Consequently, the extent of cost overrun taken from the real decision to build differs from that for the formal decision. Cost estimates early in the decision-making moment are usually much lower and the extent of cost overrun is therefore expected to be higher at the real decision to build. More specifically, cost overruns calculated in connection with the real decision to build are 64.6% (with final costs in 2007 of €4.663 billion and 1992 as the base-line funding year) while cost overruns calculated in connection with the formal decision to build were `merely' 12.7% (with the same final costs but 1996 as the base-line funding year). Lock-in thus resulted in the inaccurate representation of the extent of cost overruns. Note that the percentage cost overrun calculated from the `formal decision to build' differs in this paper from figures presented in former studies. This can be explained by the status of the project at the time of the study. In previous research, the project was not yet complete and the budget for the total project when 88% of this budget had been spent was therefore used as the `actual costs'.
3.3.2 Project level
An indication of lock-in at the project level is the need for justification by decision makers as a consequence of the new budget-control philosophy of `steering on a limited budget'. This philosophy is applied in situations in which the actual costs prove higher than expected, thus raising the threat of a deficit. In order to deal with this, the budget can either be increased or the scope of the project adjusted. This philosophy ensures that, in such a case, the budget will not be readjusted but instead control measures will be applied to ensure that the problems are resolved within the limited budget.
Furthermore, lock-in is seen in the escalating commitment to the project despite financial tensions during project implementation.
The “Malle Jan” arrangement (between the Minister of Transport and the project organisation that called for the realisation of the Betuweroute project within the specified requirements) had been established to resolve this tension but did not have the desired results and project implementation continued despite negative results, with the budget being changed at the expense of the project scope.
In addition to the escalating commitment, the project involved closure of alternatives (for example, with respect to ground-level or underground construction). The provinces of Gelderland and Zuid-Holland proposed underground construction as an alternative. According to the van Engelshoven Steering Group, established to investigate the possibility of underground construction, this alternative was both too expensive and too risky. The Minister's firm standpoint on the type of construction created lock-in, and other construction methods, such as, underground construction, failed to receive fair consideration.
The existence of lock-in at the project level was further indicated by the inflexibility regarding financing and the discussion concerning the desirability and necessity of the project. Also, an assessment scheme to determine the desirability and necessity of the project was poorly founded (Pestman, 2001).

Chapter 3 – Lock-in and its influence on project performance 41
With regard to financing, private financing was adopted as the starting point. This option ultimately proved impossible but by then the project had already reached a stage at which abandonment was no longer an option. Due to inflexibility with regard to changing the decision, political parties were locked-into the project. Some parties felt deceived, as they had considered private financing a precondition for the implementation decision. The starting assumption of private financing created lock-in, and may have precluded the examination of other types of potentially more appropriate financing.
On the other hand, there were some decisions that did include flexibility at the project level. For example, the decision regarding the crossing of the Pannerdensch Kanaal left room for discussion about whether it was to be a bridge or a tunnel (Pestman, 2001). In terms of the method of tunnel construction flexibility was also seen. In the end, the tunnels were bored, which was a situation not foreseen at the start of the decision-making process.
Figure 3-3 shows the decision-making moments that led to lock-in. Since the “Malle Jan” agreement was established solely to control costs, it had no direct impact on the cost overruns. The new philosophy did, however, influence project performance as given that construction had not yet begun, it was still possible to withdraw from the project at that time.
Figure 3-3 Timeline for the Betuweroute (project level) (Costs are from the official reported budget (including inflation) in billion euros (based on TCI, 2004a; Ministry of Transport, 1996 – 2007))
3.4 Case study: HSL-South
This case study involves a systematic search for the presence or absence of lock-in indicators at the decision-making and project levels. After the success of the high-speed railway connection between Paris and Lyon, the idea of a European network of high- speed railway trains emerged. In 1986, the ministers responsible in France, Belgium, Germany, and the Netherlands agreed to develop an HSL-network between Paris, Brussels, and Amsterdam, with the HSL-South as the Dutch section. Procedures of a PKB started in 1986 and, after several delays, part of the HSL-South (the part between Amsterdam and Rotterdam) opened in September 2009.
3.4.1 Decision-making level
In the decision-making process of the HSL-South, path dependency played an impor- tant role. During international consultations, decisions were taken about the mode of transport, time schedule, financing, and the specific characteristics of the different tracks (de Vries et al, 2007). For example, a decision was taken not to use existing infrastructure for the main part of the railway but to construct new infrastructure. With regard to the design speed, decisions
Construction start
“Malle-Jan”
Agreement
Private financing is starting point
19943,744
19954,034
19964,138
19974,243
19984,281
19994,386
19933,239
19922,832
19912,335
19901,134
Decision to build
New philosophy steering on limited budget
* Official reported budget including inflation (in billion euro)
Years:Costs*:

42 Cost overruns in large-scale transport infrastructure projects
had already been taken and the railway line had to be suitable for high-speed traffic of 300 km/h. These decisions at the international level set limitations on the decisions to be made at the national level, creating inflexibility for national policy. This was seen in the SVVII, which confirmed connection of the Netherlands to the European network of high-speed railway lines and the construction of a new railway line between Rotterdam and the Belgium border suitable for high speeds of 300 km/h. With the acceptance of this plan by the Dutch Lower Chamber, the Netherlands embedded international agreements into national policy (de Vries et al, 2007). These agreements, which made decisions binding, indicate the overcommitment to the project. Furthermore, there was escalating commitment in the assumptions regarding the HSL-South project: despite the lack of any conclusions about the desirability or necessity of the high-speed railway line the government considered the Dutch connection to the European HSL-network to be essential. This illustrates a common problem in the decision making surrounding large projects: the solution, rather than the problem, was taken as a starting point. The geographical location and the advantages regarding economy, transport value, and the environment were later advanced as justification for the project. Most of the discussion about the HSL-South was related to the track decision. Though the different possibilities had been determined by previous decisions, the Netherlands and Belgium preferred different options and the focus was on these two preferred options. Agreement was eventually reached as a consequence of political vulnerability: the Minister of Transport wanted to publish the new plan (SVVII) while she was still in office (escalating commitment to the plan).
Lock-in at the decision-making level was created by the inflexibility of the decision- making process regarding deviations from prior decisions. In the formation of a new cabinet, the Ministry of Transport supported the decisions already made by referring to the coalition agreement: the decision to implement the high-speed railway line is confirmed, including the track choice. It was argued that any deviations from these decisions would lead to practical objections and negative effects on the economic position of the Netherlands. Different alternatives were included in the consultation round but did not stand a fair chance of success (Priemus, 2007).
The presence of lock-in in the decision-making process of the HSL-South is described by Priemus (2007, page 639) as follows:
“By rigidly maintaining the design speed requirement of 300 km/h, and by including the preferred alternative in the 1994 Coalition Agreement, the cabinet was able to pass this choice through the political and social decision-making procedures without any serious problems.”
However, there were also several occasions in the decision-making process that contradict the presence of escalating commitment, inflexibility, or the closure of alter- natives. The SVVI was received poorly, leading to a new plan, the SVVII, being composed. This possibility and the willingness to change the plan both point to flexibility in the decision-making process. There was also flexibility in the decision-making process regarding the stops: although not originally designated as a stop, Antwerp was eventually included due to social pressures. The decision-making moments that led to lock-in are presented in Figure 3-4.

Chapter 3 – Lock-in and its influence on project performance 43
Figure 3-4 Timeline of the High Speek Link-South project (decision-making level) (Costs are from the official reported budget (including inflation) in billion euros. SVVI=First Transport and Structure Plan; HSL-South=High Speed Link-South; SVVII=Second Transport and Structure Plan; PKBI=Key Planning Decision I (based on TCI, 2004b; Ministry of Transport, 1997 – 2007)).
The decision-making moments identified preceded the formal decision to build (which occurred in 1996). The real decision to build was, therefore, probably made before the formal decision. Once again, identifying the real decision to build is likely to help determine the influence of lock-in on project performance in terms of money. In other words, the point of no return must be established by considering the possibility of reversing the decision at each of the decision-making moments. At decision-making moments for SVVI and SVVII, it was still considered possible to reconsider the decision to build, as no agreements had actually been made. As in the Betuweroute project, the actual point of no return in the HSL-South project was marked by the start of the PKB procedure.
The extent of cost overruns is even higher if the PKB1 decision-making moment in 1992 is taken as a reference instead of the formal decision to build in 1996 (403.67% compared with 110%, with final costs of €7.17 billion). Again, note that these percentages may differ from other studies as a consequence of the status of the project. Cost overruns based on the expected cost at the time of the formal decision to build are therefore misleading and due to lock-in actually even higher.
3.4.2 Project level
Sunk costs also created lock-in at the project level with the difference that project-level sunk costs involved money and those at the decision-making level involved time. Investments led to unwillingness to abandon the project after the formal decision to build had been made, thus creating lock-in with regard to the project.
The threat of cost overruns created a need for a new budget-control method, leading to the establishment of the philosophy of `steering on a limited budget'. There was an excessive focus on the price, however, at the expense of the risks, scope, design, and quality of the contracts to be made. Despite negative results with the philosophy (for example, social pressures and face-saving behaviour by parties who felt unable to admit their mistakes), it was decided to proceed with the HSL-South, indicating lock-in with regard to the budget-control measure. In addition, problems related to the budget led to strategic behaviour on the part of contractors. The low tender budgets and estimations were the immediate cause of the structural underestimation of investment costs in the five contracts. Furthermore, the need for justification is evident from the discussion on private financing. The project had originally been based on private financing, with an assumed a contribution of 50%. This approach was,
First plans AmRoBel
Publication AmRoBel report (Closure of alternatives)
19801,423
19881,423
19891,423
19901,423
19911,423
19921,423
19791,423
19781,423
19771,423
19731,423
SVV1: HSL-South as starting point
(Escalating commitment)
Agreements SVV2
AgreementsPKB1
Coalition agreement
(inflexibility)
19931,423
19942,659
19952,659
19963,413
Decision to Build
Years:Costs*:
* Official reported budget including inflation (in billion euro)
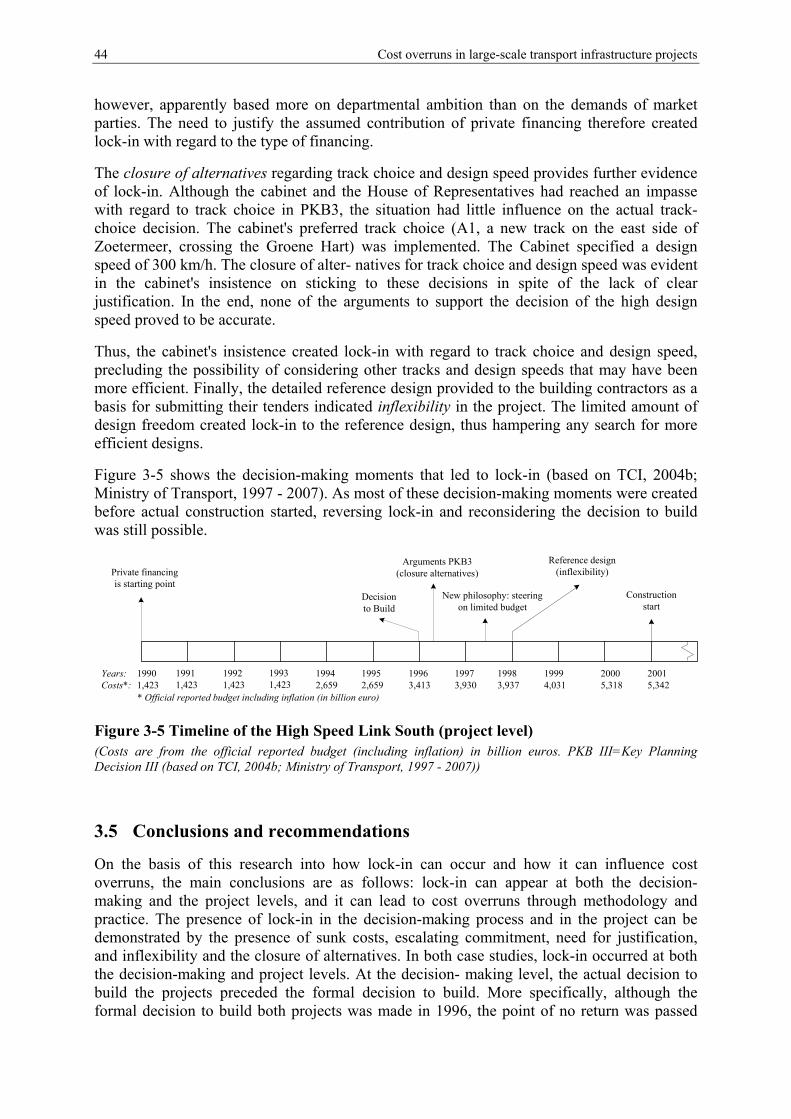
44 Cost overruns in large-scale transport infrastructure projects
however, apparently based more on departmental ambition than on the demands of market parties. The need to justify the assumed contribution of private financing therefore created lock-in with regard to the type of financing.
The closure of alternatives regarding track choice and design speed provides further evidence of lock-in. Although the cabinet and the House of Representatives had reached an impasse with regard to track choice in PKB3, the situation had little influence on the actual track-choice decision. The cabinet's preferred track choice (A1, a new track on the east side of Zoetermeer, crossing the Groene Hart) was implemented. The Cabinet specified a design speed of 300 km/h. The closure of alter- natives for track choice and design speed was evident in the cabinet's insistence on sticking to these decisions in spite of the lack of clear justification. In the end, none of the arguments to support the decision of the high design speed proved to be accurate.
Thus, the cabinet's insistence created lock-in with regard to track choice and design speed, precluding the possibility of considering other tracks and design speeds that may have been more efficient. Finally, the detailed reference design provided to the building contractors as a basis for submitting their tenders indicated inflexibility in the project. The limited amount of design freedom created lock-in to the reference design, thus hampering any search for more efficient designs.
Figure 3-5 shows the decision-making moments that led to lock-in (based on TCI, 2004b; Ministry of Transport, 1997 - 2007). As most of these decision-making moments were created before actual construction started, reversing lock-in and reconsidering the decision to build was still possible.
Figure 3-5 Timeline of the High Speed Link South (project level) (Costs are from the official reported budget (including inflation) in billion euros. PKB III=Key Planning Decision III (based on TCI, 2004b; Ministry of Transport, 1997 - 2007))
3.5 Conclusions and recommendations
On the basis of this research into how lock-in can occur and how it can influence cost overruns, the main conclusions are as follows: lock-in can appear at both the decision- making and the project levels, and it can lead to cost overruns through methodology and practice. The presence of lock-in in the decision-making process and in the project can be demonstrated by the presence of sunk costs, escalating commitment, need for justification, and inflexibility and the closure of alternatives. In both case studies, lock-in occurred at both the decision-making and project levels. At the decision- making level, the actual decision to build the projects preceded the formal decision to build. More specifically, although the formal decision to build both projects was made in 1996, the point of no return was passed
Years:Costs*:
Private financing is starting point
19942,659
19952,659
19963,413
19973,930
19983,937
19994,031
19931,423
19921,423
19911,423
19901,423
New philosophy: steering on limited budget
20005,318
20015,342
Decision to Build
Construction start
Reference design (inflexibility)
Arguments PKB3 (closure alternatives)
* Official reported budget including inflation (in billion euro)

Chapter 3 – Lock-in and its influence on project performance 45
earlier, in 1992. This moment was marked by the beginning of the PKB procedure, which can be seen as the moment of the real decision to build. The time difference between the formal and real decisions to build indicates lock-in, which influenced cost overruns through methodology. The costs estimated at the time of the real decision to build were much lower, thus increasing the actual cost overruns. At the project level, higher costs resulted from limited freedom to change possibly inefficient decisions regarding the design of the project.
The extent and appearance of lock-in is different in the two case studies. The Betuweroute project was widely debated publicly and faced a lot of criticism, resulting in decisions driven by the need for justification and escalating commitment. The HSL-South Project, on the other hand, had considerable support at the start and the need for justification was therefore less dominant. In both cases, lock-in emerged at a very early stage because one of the main criteria for escalating commitment, the solution, was taken as a starting point. If decision makers had been aware of this, lock-in could have been limited to a certain extent. However, the danger of lock-in would have remained during the whole decision-making and project phases. In this paper a distinction was made between early commitment, escalating commitment, and lock-in. When the scope is enlarged early commitment, for example, regarding early land development and shorter procedures, could be advantageous. However, lock-in is, by definition, a negative phenomenon.
Lock-in has two important policy implications. First, lock-in by methodology necessitates identification of the decision-making moments representing both the formal and the real decision to build in order to determine whether there is a difference and whether any methodological corrections are needed in the calculation of cost overruns. Second, with regard to policy implications for practice, cost overruns can be avoided if lock-in is prevented. Some decision makers deliberately create over- commitment or exclude other alternatives in order to create lock-in for their preferred projects or decisions. The subsequent cost overruns due to the deliberate creation of the lock-in may thus be partly unnecessary or avoidable and partly unavoidable due to the incapacity of decision makers to make optimal decisions (that is, bounded rationality).
The findings on lock-in reported in this paper have further important implications for theory. To summarise, lock-in can actually be placed within each of the four categories, as technical, economic, psychological, and political explanations. In contrast to Flyvbjerg et al (2003) who argue that technical explanations are least likely to explain cost overruns, here the concept of lock-in has proved that technical explanations also constitute an important category of explanations by the methodology of calculating cost overruns. Lock-in also stresses the importance of economic explanations, with sunk costs in terms of money creating conscious lock-in as various parties are aware of their investments, while the bounded rationality of decision makers results in unconscious lock-in. Finally, lock-in is a psychological explanation if it arises from behaviour intended to justify decisions, and is a political explanation if it emerges in response to intentional (strategic) behaviour. This study shows that despite the significant theoretical impact that the methodology used in a project can have on its performance, the effect is more difficult to demonstrate in practice. Although it is known that earlier decision-making moments lead to higher cost overruns, the extent of the difference in cost overruns between the actual and the formal decision-making moments remains to be proven. Subsequent research into lock-in is therefore recommended. Once interviews have been held with decision makers in different projects and the actual decision-making moments established, the real and formal decisions to build can be compared, allowing more precise conclusions to be made concerning the influence of lock-in on project performance through the methodology adopted.

46 Cost overruns in large-scale transport infrastructure projects
Acknowledgements
This research was supported by the Dutch Ministry of Transport. The authors thank two anonymous referees for their useful comments. The authors thank Eddy Westerveld of AT Osborne for his valuable help.
References
Amess, K.K. (2002) Financial institutions, the theory of the firm, and organisational form, in: The Service Industries Journal, 22, pp. 129-148.
Arthur, W.B. (1989) Competing technologies, increasing returns and lock-in by historical events, in: The Economic Journal, pp. 99-116.
Bowen, M.G. (1987) The escalation phenomenon reconsidered: decision dilemmas or decision errors?, in: Academy of Management Review, 12, pp. 52-66.
Brockner, J., J.Z. Rubin (1985) Entrapment in escalating commitment conflicts: a social psychological analysis, Springer, New York.
Brockner, J., J.Z. Rubin and E. Lang (1981) Face-saving and entrapment, in: Journal of Experimental Social Psychology, 17, pp. 68-79.
Brockner J., J.Z. Rubin, J. Fine, T.P. Hamilton, B. Thomas and B. Turetsky (1982) Factors affecting entrapment in escalating conflicts: the importance of timing, in: Journal of Research in Personality, 16, pp. 247-266.
Brockner J., R. Houser, G. Birnbaum, K. Lloyd, J. Deitcher, S. Nathanson, and J. Z. Rubin (1986) Escalation of commitment to an ineffective course of action: the effect of feedback having negative implications for self-identity, in: Administrative Science Quarterly, 31 (1), pp. 109-126.
David, P. (1985) Clio and the economics of QWERTY, in: American Economic Review, 75, pp. 332-337
De Vries J., A. Harbers and F. Verwest, (2007) Grensoverschrijdende Projecten in Nederland en Vlaanderen: leren van de HSL-Zuid, Schelde en Ijzeren Rijn, NAi Uitgevers, Rotterdam.
Flyvbjerg, B. (2005) Policy and planning for large infrastructure projects: problems, causes, cures, World Bank Policy Research Working Paper, WPS3781, World Bank, Washington D.C.
Flyvbjerg, B., M.K. Skamris Holm and S.L. Buhl (2002) Underestimating cost in public works. Error or Lie?, in: Journal of the American Planning Association, 68 (3), pp. 279-295.
Flyvbjerg, B., N. Bruzelius and W. Rothengatter (2003a) Megaprojects and Risk: An Anatomy of Ambition, Cambridge, Cambridge University Press.
Hall, P. (1980) Great Planning Disasters, Penguin Books, Harmondsworth.
Kahneman, D. and D. Lovallo (1993) Timid choices and bold forecasts: A cognitive perspective on risk taking, in: Management Science, 39 (1), pp. 17-31.
McElhinney D. (2005) Concept of entrapment and decision-making, in: Management Decision, 43, pp. 189-202.
Mahoney J. (2000) Path dependency in historical sociology, in: Theory and Society, 29, pp.507-548.
Chapter 3 – Lock-in and its influence on project performance 47
Ministry of Transport (1996 – 2007) Progress Reports 1 - 22. Betuweroute, Ministerie van Verkeer enWaterstaat, The Hague
Ministry of Transport (1997 – 2007) Voortgangsrapportages 1-21 HSL-Zuid, Projectorganisatie Hogesnelheidslijn-Zuid, Ministerie van Verkeer enWaterstaat, The Hague
Nee, V. and Y. Cao, (1999) Path dependent societal transformation: stratification in hybrid mixed economies, in: Theory and Society, 28, pp. 799-834.
North, D.C. (1990) Institutions, Institutional Change and Economic Performance, Cambridge University Press, Cambridge
Northcraft, G.B. and G. Wolf (1984) Dollars, sense, and sunk costs: a life-cycle model of resource allocation decisions, in: Academy of Management Review, 9, pp. 225-234
Pestman, P.(2001) In Het Spoor van de Betuweroute. Mobilisatie, Besluitvorming en Institutionalisering Rond een Groot Infrastructureel Project, Rozenberg, Amsterdam.
Pickrell, D. (1992) A Desire Named Streetcar: Fantasy and Fact in Rail Transit Planning, in: Journal of the American Planning Association, 58(2), pp. 158-176.
Pierson P. (2000a) Increasing returns, path dependence, and the study of politics, in: American Political Science Review, 94, pp. 251-268.
Pierson P. (2000b) Not just what, but when: timing and sequence in political processes, in: Studies in American Political Development, 14, pp. 72-92.
Pierson P, 2001 The New Politics of theWelfare State (Oxford University Press, Oxford)
Priemus H, 2007, “Development and design of large infrastructure projects: disregarded alternatives and issues of spatial planning” Environment and Planning B: Planning and Design 34 626 – 644
Priemus, H. and J. Visser (1995) Infrastructure policy in the Randstad Holland: struggle between accessibility and sustainability, in: Political Geography, 14, pp. 363-377.
Roscam Abbing, M.R., A.A. J. Pols and M. Bierman (1999) Hoe Spoort Het Water? Ontspoorde Besluitvorming Betuwelijn: een Analyse van Genegeerde Alternatieven, TU Delft, Delft.
Staw, B.M. (1976) Knee-deep in the big muddy: a study of escalating commitment to a chosen course of action, in: Organisational Behaviour and Human Performance, 16, pp. 27-44.
Staw, B.M. (1981) The escalation of commitment to a course of action, in: Academy of Management Review, 6, pp. 577-587.
TCI (2004a) Onderzoek naar Infrastructuurprojecten. Reconstructie Betuweroute de Besluitvorming uitvergroot (Temporary Committee for Infrastructure Projects, Tweede Kamer der Staten-Generaal TK 2004 - 2005, 29 283, nr. 7), Sdu Uitgevers, The Hague.
TCI (2004b) Onderzoek naar Infrastructuurprojecten. Reconstructie HSL-Zuid: de Besluitvorming uitvergroot (Temporary Committee for Infrastructure Projects, Tweede Kamer der Staten-Generaal TK 2004 - 2005, 29 283, nr. 8), Sdu Uitgevers, The Hague.
Teger, A.I. (1980) Too Much Invested to Quit, Pergamon Press, New York.
Teisman, G. (1995) Complexe Besluitvorming, een Pluricentrisch Perspectief op Besluitvorming over Ruimtelijke Investeringen, VUGA, The Hague.

48 Cost overruns in large-scale transport infrastructure projects
Van Wee, B. (2007) Large infrastructure projects: a review of the quality of demand forecasts and cost estimations, in: Environment and Planning B: Planning and Design, 34 (4), pp. 611-625.
Vrijkotte, J.G.M., L.J.P. van Doornen and E.J.C de Geus (2004) Overcommitment to work is associated with changes in cardiac sympathetic regulation, in: Psychosomatic Medicine, 66, pp.656-663.
Wachs, M. (1989) When Planners Lie with Numbers, in: Journal of the American Planning Association, 55 (4), pp. 476-479.
Walby, S. (2003) Complexity theory, globalisation and diversity, Conference of the British
Sociological Association, University of New York, http://www.lancs.ac.uk/fass/sociology/ papers/walby
Whyte G, (1986) Escalating commitment to a course of action: a reinterpretation, in: Academy of Management Review, 11, pp. 311-321.
Wilson, R.M.S. and A. Zhang (1997) Entrapment and escalating commitment in investment decision making: a review, in: British Accounting Review, 29, pp. 277-305.
Woerdman, E. (2004) Politiek en politicologie, Wolters-Noordhoff, Groningen.
49
4. Explaining cost overruns by a signalling game Cantarelli, C.C., Chorus, C.G. and Cunningham, S.W. (forthcoming). Explaining Cost Overruns of Large-scale Transportation Infrastructure Projects using a Signalling Game, Transportmetrica, Accepted for publication.
Abstract Strategic behaviour is one of the main explanations for cost overruns. It can theoretically be supported by agency theory, in which strategic behaviour is the result of asymmetric information between the principal and agent. This paper gives a formal account of this relation by a signalling game. This is a game with incomplete information which considers the way in which parties anticipate upon other parties’ behaviour in choosing a course of action. The game shows how cost overruns are the result of an inappropriate signal. This makes it impossible for the principal to distinguish between the types of agents, and hence, allows for strategic behaviour. It is illustrated how cost overruns can be avoided by means of two policy measures, e.g. an accountability structure and benchmarking.
50 Cost overruns in large-scale transport infrastructure projects
4.1 Introduction
Large-scale projects are often characterised by large cost overruns. Flyvbjerg et al. (2003) conducted an international research of 258 transport infrastructure projects and found that in 86% of the projects under consideration, cost overruns appeared with average cost overruns of 28%. Cost overruns are problematic because they increase the burden on the country’s gross domestic product (CBS, 2005 in KiM, 2007). Cost estimates are often inaccurate and consequently the ranking of projects based on project viability is often inaccurate as well. Inevitably, this incorporates the danger that eventually inferior projects are implemented, that resources are used which could have been assigned more appropriately, and that projects are implemented which cannot recover their costs.
Various studies (Hall, 1980; Wachs, 1989; Morris, 1990; Odeck, 2004; Bruzelius et al. 2002; van Wee, 2007; and Flyvbjerg, et al. 2003) addressed this problem of inaccurate cost estimates and provided different accounts for this. First of all, cost overruns are explained by forecasting errors in technical terms, including inadequate data and lack of experience (technical explanations). Secondly, cost overruns are often explained as the result of optimistic forecasts due to cognitive bias (psychological explanations) Next to this, strategic behaviour is an important explanation for cost overruns. It is described as the result of strategic misrepresentation; deliberate underestimation of costs in order to increase the chances for project acceptance (political-economic explanations).
Cost estimates have not improved and overruns have not decreased over the last 70 years (Flyvbjerg et al, 2003). If inaccurate estimates were caused by technical causes, errors in overestimating costs would have been of the same size and frequency as errors in underestimating costs. But this turns out not to be the case. Furthermore, the refinement of data collection and forecasting methods over the years would have resulted in more accurate forecasts over time (Flyvbjerg et al. 2002). However, this was not the case and technical explanations of forecasting errors are, therefore, not considered the main cause for cost overruns. Likewise, because learning effects would have improved the accuracy of the cost estimates if optimism bias is a main reason for underestimation, psychological explanations are not considered the foremost cause of cost overruns. Wachs (1989) found that misleading forecasts of costs were best explained by deception. Flyvbjerg et al. (2002) also concluded that political-economic explanations best fit the data for cost underestimation.
Strategic behaviour seems an important explanation for cost overruns and this will, therefore, be the focus in this paper. There are two main categories of strategic behaviour, adverse selection and moral hazard (Laffont and Tirole, 1998 in Mu et al. 2010). Adverse selection is the tendency that “bad” market parties are selected. It emerges before any contracts are signed in a situation in which the contractor has more information than the owner e.g. regarding the actual costs during a tender process. Moral hazard is strategic behaviour that takes place after the contract is signed. In this case, the contractor takes actions that are not easily observable by the owner such as artificially increasing the project costs during implementation. Both adverse selection and moral hazard are closely related; adverse selection can give rise to moral hazard. The difference between the two concerns who knows what, when. This paper emphasises on the decision-making phase and hence the strategic behaviour of adverse selection, and it considers moral hazard the result of this.
Little work has been done to explain misleading forecasts from a political-economic view. To the authors’ knowledge, an explicit application of a theory that illustrates the behaviour of parties leading to cost underestimation has not yet been conducted.

Chapter 4 – Explaining cost overruns by a signalling game 51
A theory that is particularly suitable to support political-economic explanations is agency theory. Agency theory involves the study where there is a contract in which a client or principal engages an agent or contractor to take actions on behalf of the principal that involve the delegation of some decision-making authority to the agent (Jensen, 2000 in Mu et al. 2010). The theory assumes a relation between the agent and the principal that is characterised by asymmetric information and goal conflict. The agent has more information than the principal and pursues different objectives which might lead to strategic behaviour, the agent not acting in the best interest of the principal. A specific theory that can be used to formally describe the behaviour of the principal and agent is game theory (Fudenberg and Tirole, 1992, Rasmussen, 2006). The game that is considered in this paper is a so-called signalling game. It is a game with incomplete information which considers the way in which parties anticipate upon other parties’ behaviour in choosing a course of action (Fudenberg and Tirole, 1992).
Game theory’s potential to highlight the role of strategic behaviour caused by the asymmetric information between agents makes it a particularly promising framework from the perspective of our research question. This will be subject of this paper.
Previous work has considered the use of multi-attribute analysis techniques for evaluating contractor capability (see for instance Holt et al. 1994). This is useful and complementary work, particularly given the acknowledgment that price is an insufficient signal of contractor quality. The role of price as a signal of quality is further discussed below. Note also that work order or design errors are often a major cause of cost-overruns (Assaf and Al-Hejji, 2006). However, these play a role mostly after the project has been assigned. In contrast, our study focuses on the process preceding project execution, and specifically on how cost-overruns can be reduced by a more clever design of the tendering process. As such, our study complements –rather than aiming to substitute- studies that deal with cost-overruns from a project-execution perspective. Another related strand of literature focuses on the effect of strategic behaviour during the exploitation of transport infrastructure. For example, Yang and colleagues (2009) use Game Theory to describe the behaviour of private parties, in the absence of a regulative authority, in terms of the exploitation of transport infrastructure by for example setting prices and capacity of toll roads (Yang et al., 2009). In addition, Karlaftis studies how various ownership structures are related to public transit system efficiency (Karlaftis, 2010). This paper, in contrast, focuses on the process that precedes realization of the infrastructure, rather than dealing with the exploitation of the infrastructure.
The paper contributes to the current state of the art on cost overruns of large-scale transportation infrastructure projects as it puts a new perspective on the explanations for cost overruns. The approach of applying game theory herein discerns this study from others. Moreover, game theory can provide a formal account of the interaction between parties, contributing to the scientific underpinning of the explanation. A better theoretical embedded explanation for cost overruns can increase the understanding of strategic misrepresentation of costs by parties and may eventually result in more appropriate measures to deal with this. Two such measurements that can be taken in this respect are considered in this paper. It is shown by means of the signalling game that each of these may influence and improve current practice. The use of game theory therefore not only improves our understanding how cost underestimation occurs but it also shows to what extent measures aimed at dealing with cost-underestimating result in a lower probability of cost overrun as well as in smaller overruns.
Section 2 describes the situation concerning the behaviour of the parties in the process of large-scale transportation infrastructure projects and presents the formal model of the situation. The analysis and implications of the game are discussed in section 4. Section 5

52 Cost overruns in large-scale transport infrastructure projects
shows how policy measures change the outcome of the game and avoid strategic behaviour by cost underestimation. Section 6 presents the main conclusions and recommendations.
4.2 Specification and analysis of the game
A signalling game consists of two players, an informed player (agent) and an uninformed player (principal). The agent has private information that is summarised by his type. The type could for example be his aptitude; his ability to perform the task of the principal. The agent sends to the principal a signal, typically a message that can reveal some of the hidden information of the agent identifying its type. In other words, the message can reveal the extent to which the agent is able to perform the principals’ tasks. The principal receives this message and takes an action, after which the game ends. After discussing the game as specified, we demonstrate why project cost is an inadequate measure of contractor capability.
In this paper the following hypothetical situation can be kept in mind when addressing the game. A new road between two cities will be constructed to increase accessibility. It was decided to contract out the realisation of this project. An open tender was organised and market parties submitted their proposal including amongst others the necessary budget. The bid selection criterion is usually based on the lowest costs and this is, therefore, also the selection criterion in this situation. The market party is the agent that will carry out the project according to the wishes of the principal, the governmental authority. The governmental party aims to get the project realised against the lowest costs and the market party aims to get his tender proposal accepted.
Figure 4-1 depicts the model of the signalling game between the market party and the governmental party.
Figure 4-1 Signalling game
The figure is composed of nodes, vector of letters, arrows and labels. Each node is a position in the game; a point at which some player must choose some action. The first position in the game is depicted by an N node; all the other nodes are filled in by either the letter M (Market party) or the letter G (Governmental agency) representing the actor expected to move at that stage of the game. N is the state of nature, which determines a type for the market party, either able or unable. An arrow represents a choice that is feasible for the player choosing.
The game starts with the market party choosing a strategy; either to include a low or high estimate in its tender proposal (Figure 4-1). The estimate in the tender proposal is the message

Chapter 4 – Explaining cost overruns by a signalling game 53
that the market party sends to the governmental party. The message is the particular choice of the market party between a low or high estimate. The low estimate is the lowest possible realistic estimate perceived as such by the governmental party. The market party’s private information is her aptitude: the market party knows whether he is able or unable to realise the project against the low cost estimate. The able market party can realise the project for the low cost estimate whereas the unable market party is not able to realise the project for the low cost estimate. The governmental party will observe the message and has to decide whether to accept (a) or reject (r) the tender proposal of the market party. The arrows a and r point to vectors of letters that are, in this game, composed of two letters (the first letter corresponds to the market party’s payoff and the second number refers to the governmental party’s payoff). For example, if the able market party provides a low cost estimate in its tender proposal and the governmental party decides to accept the tender, the payoff for the market party is X1 and the payoff for the governmental party is Y1.
The model furthermore indicates the probability that the market party is able by and indicates the probability that the market party is unable by 1-. When making the choice of accepting or rejecting the proposal, the governmental party does not know whether the market party is able or unable (indicated by dashed lines). This is represented in the model as follows. s is the governmental party’s belief (probability) that, given that the message with a low estimate is observed, it concerns an able market party. t is the governmental agency’s belief (probability) that, given that the message with a high estimate is observed, it concerns an able market party.
4.2.1 Payoff structure of the game
The payoff structure of the game includes the value of the infrastructure to the governmental party (I). This quantity includes the net benefit of the infrastructure minus minimum cost production of the infrastructure. A second payoff value is the budget requested by the market party for the provision of the infrastructure (either L or H for a low or high estimate respectively). Finally, there is the cost overrun incurred by the unable market party for a low estimate(C). The fall-back options of no infrastructure provision to the government and the market party is fixed to 0.
Payoff market party The payoff of the market party is a function of benefits and costs. The benefits include benefits from the budget that is received (either L or H) and additional benefits from receiving commission of the project (R). These additional benefits refer to the reputation of the market party; it is assumed that this reputation increases as the market party becomes more known with each project that is implemented. The magnitude of the additional benefits is independent from the market party’s type or message. The costs include costs related to the realisation of the project, which are equal to the cost estimate (thus L or H). In this payoff structure, the payoffs are independent upon the message or type of market party, but the market party prefers acceptation of the proposal above rejection.
Payoff governmental party The payoff of the governmental party is a function of benefits and costs. The benefits include the value of the infrastructure (I). These benefits are independent from the market party’s type or message. The costs include costs of the budget that is provided to the market party to realise the project (either L of H) and there is cost overrun for the unable market party providing a low estimate.
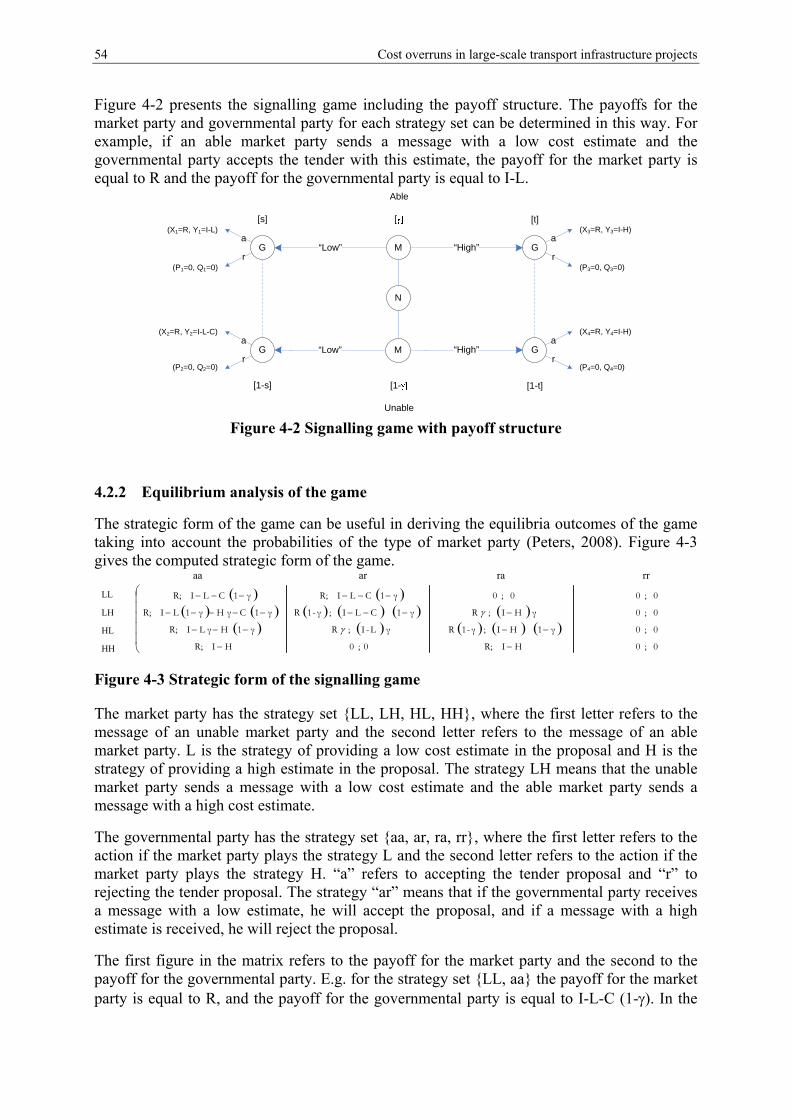
54 Cost overruns in large-scale transport infrastructure projects
Figure 4-2 presents the signalling game including the payoff structure. The payoffs for the market party and governmental party for each strategy set can be determined in this way. For example, if an able market party sends a message with a low cost estimate and the governmental party accepts the tender with this estimate, the payoff for the market party is equal to R and the payoff for the governmental party is equal to I-L.
a
r r
a
r
a
r
a“Low” “High”
“Low” “High”
G
G G
G
M
N
M
Able
[
[1-
Unable
[s] [t]
[1-s] [1-t]
(X1=R, Y1=I-L)
(P1=0, Q1=0)
(X2=R, Y2=I-L-C)
(P2=0, Q2=0)
(X3=R, Y3=I-H)
(X4=R, Y4=I-H)
(P3=0, Q3=0)
(P4=0, Q4=0)
Figure 4-2 Signalling game with payoff structure
4.2.2 Equilibrium analysis of the game
The strategic form of the game can be useful in deriving the equilibria outcomes of the game taking into account the probabilities of the type of market party (Peters, 2008). Figure 4-3 gives the computed strategic form of the game.
aa ar ra rr
LL
LH
HL
HH
Figure 4-3 Strategic form of the signalling game
The market party has the strategy set {LL, LH, HL, HH}, where the first letter refers to the message of an unable market party and the second letter refers to the message of an able market party. L is the strategy of providing a low cost estimate in the proposal and H is the strategy of providing a high estimate in the proposal. The strategy LH means that the unable market party sends a message with a low cost estimate and the able market party sends a message with a high cost estimate.
The governmental party has the strategy set {aa, ar, ra, rr}, where the first letter refers to the action if the market party plays the strategy L and the second letter refers to the action if the market party plays the strategy H. “a” refers to accepting the tender proposal and “r” to rejecting the tender proposal. The strategy “ar” means that if the governmental party receives a message with a low estimate, he will accept the proposal, and if a message with a high estimate is received, he will reject the proposal.
The first figure in the matrix refers to the payoff for the market party and the second to the payoff for the governmental party. E.g. for the strategy set {LL, aa} the payoff for the market party is equal to R, and the payoff for the governmental party is equal to I-L-C (1-). In the
0 ; 0 HI R; 0 ; 0 HI R;
0 ; 0 γ1HI ; γ-1R γL-I ;R γ1 HL γI R;
0 ; 0 γHI ;R γ1CLI ; γ-1R γ1 CH γγ1LI R;
0 ; 0 0 ; 0 γ1 CLI R; γ1 CLI R;

Chapter 4 – Explaining cost overruns by a signalling game 55
following material we use the Nash equilibrium concept to solve for potential outcomes or equilibria of the game. Further, we consider whether the government can use the price signal of industry as an indicator of potential contracting quality.
The best strategy of the sender (market party) The best response of the sender to the anticipated behaviour of the receiver is the strategy that maximises its utility regardless of the senders’ type. In the situation of a tender process, the market party’s expected utility is the sum of the probabilities when the action accept/reject is taken when the signal with a low/high estimate is sent multiplied by the utility of the different strategy sets (low/ high, accept/reject, able/unable).
Based on the strategic form of the game presented in Figure 3, the best strategy of the market party can be determined. The best strategy of the market party is determined by considering for each governmental party’s strategy the strategy at which the market party receives the highest payoff. For example, considering the anticipated behaviour of the governmental party playing the strategy “aa”, the payoffs of the four possible strategies of the market party are compared (LL, LH, HL, HH). In this case, the payoffs for all four strategies of the market party are the same and equal to R.
Considering the anticipated behaviour of the governmental party playing the strategy “ar”, the payoffs for LL, LH, HL differ and is highest for the strategy LL (payoff is equal to R whereas the payoff for LH and HL is only a fraction of R, and the payoff for HH is equal to 0). The best strategy of the market party to the anticipated behaviour of the governmental party playing the strategy “ra” is HH (payoff for HH>LH/HL>LL (R>R or R(1-)>0)) and for the strategy “rr” each of the four strategies of the market party will provide the same payoff (payoff is 0).
The best strategy of the receiver (governmental party) The receiver chooses an action after he observes the sender’s message. He wants to make a decision that is optimal given the best beliefs he has concerning the sender’s type. The best response of the receiver to the behaviour of the sender is the strategy that maximises its utility. Using the strategic form of the game presented in Figure 3, the best strategy of the governmental party is determined by considering for each market party’s strategy the strategy at which the governmental party receives the highest payoff. For example, for the market party’s strategy LL the payoffs of the four possible strategies of the governmental party are compared (“aa”, “ar”, “ra”, “rr”). The payoff for the strategies “aa” and “ar” are equal and represented by I-L-C (1-) and the payoff for the strategies “ra” and “rr” are equal and represented by 0. Consequently, the best strategy of the governmental party for the market party’s strategy LL depends on the probability and parameter values I, L and C. With a high probability, =1, the best strategy is either “aa” or “ar” if I>L and for a low probability, =0, the best strategy is either “aa” or “ar” if I>L+C. Otherwise, the best strategy will be “ra” or “rr”. The same applies for the other strategies of the market party, they are all dependent on the probability and parameters values.
Figure 4-4 shows the strategic form of the game within which the best strategy of the market party and governmental party are indicated.

56 Cost overruns in large-scale transport infrastructure projects
aa ar ra rr
LL
LH
HL
HH
Figure 4-4 Strategic form of the signalling game including best strategies Note: * indicates the best strategy of the market party, † indicates the best strategy of the governmental party. In this case, all strategies are marked with an † because the best strategy is conditional upon the value of and the value of the parameters. The numbers refer to the outcomes of the game, in which both market party and governmental party play their best strategy
The computed strategic form of the game presented in Figure 4 identified eight possible equilibria outcomes of the game (these are the situations in which both the market party as the governmental party play their best strategy, indicated by * or † in Figure 4. ). The game will play out differently according to the relative values of I, H and C. L can be recognised as some fraction of H, and therefore only three parameters are addressed rather than 4.
Figure 5 shows a mixture diagram (Png, 1983) indicating which Nash equilibria potentially exist depending on the values of I, H, and C. There are three equilibrium regions with, in each region, four possible equilibria. Regions one and two are associated to variable degrees with cost overruns, whereas region three is associated to variable degrees with a failure to contract infrastructure. This latter is also an interesting problem, but it is not considered here.
Figure 4-5 Mixture diagram identifying 3 regions with in each region different Nash Equilibria
Market outcomes depend strongly upon the capability of the market. Lower capability markets increase the overall potential for cost overruns. A market with a lower competence may also require additionally money to successfully complete the project. Alternatively, they may attempt to reduce their bid, but be unable to offset the possible additional expected costs of an over-run. A failure to contract or higher overall costs is the resultant outcome. This can be demonstrated analytically by use of extrema – examining how equilibria regions change as competence varies from γ=0 to γ=1.
†8†7††7
†6†††5
†4†††3
†2††1†1
0 ;*0 HI ;*R 0 0; HI ;*R
0 ;*0 γ1HI ; -γ1R γL-I ;R γ1 HLγI ;*R
0 ;*0 γHI ;R γ1CLI ; -γ1R γ1 CHγγ1LI ;*R
0 ;*0 0 0; γ1 CLI ;*R γ1 CLI ;*R

Chapter 4 – Explaining cost overruns by a signalling game 57
4.3 Relation to cost overruns
Cost overruns only occur if the governmental party accepts a tender proposal with a low estimate from an unable market party. Two of the equilibrium outcomes identified in the previous section represent this situation, namely, the equilibria 1 and 3. For these equilibria, maximum cost overruns being as high as the government’s assessment of the value of the infrastructure (I=C).
4.3.1 Occurrence of cost overruns
Equilibrium 1 {LL, aa} is a so-called pooling equilibrium. This is problematic because in this type of equilibrium, both types of market party send the same message and, hence, the message does not reveal anything about the market party’s type. The message can be considered an insufficient signal of the game. As a consequence, the governmental party is unable to update his beliefs about the market party’s type after receiving a message. The inability of the governmental party to distinguish between the types of market party gives the unable market party the possibility to behave strategically and send a false signal, a signal that does not fit his type, to get the proposal accepted. Thus, despite both parties acting rationally and according to their best response to the other parties’ behaviour; whether or not the outcome is desired for society at large depends on the type of market party.
Equilibrium 3 {LH, aa} is a so-called separating equilibrium; both types of market party send a different message, which makes it possible to distinguish between the market parties. Despite this, the equilibrium is equally problematic as equilibrium 1. It involves a “bluffing” market party who is in fact unable to complete the contract, coupled with a government willing to accept any bid.
A separating equilibrium can potentially provide useful information to the government in selecting a contractor. Capable contractors may find it advantageous to adopt a specific bidding strategy. The government, upon seeing this strategy used in a given contracting setting, can use the bid as an additional piece of information in comprehensively evaluating contractor capability. A Bayesian approach for handling new information is appropriate in this case. The strategic equivalent for use in a game is known as a perfect Bayesian equilibrium (Ratliff, 1996; Lafont and Tirole, 1998). The use of price as a signifier of competency is credible if and only if there are the correct incentives in the game for a player to reveal their type. In the material which follows we consider whether or not these incentives for open communication actually exist in the game as specified. The necessity of further policy measures is suggested.
4.3.2 Prevention of cost overruns within the current play of the game
In the following section we discuss two attempts to remediate cost overruns without making a substantial change to the play of the game. We investigate, and eliminate, the possibility of meaningful pricing signals whereby the competent market party signals their capability thereby enhancing the range of contractible outcomes. We also consider a market covenant where the government promises to pay extra if the parties involved offer a full and complete accounting of cost. This last strategy, known as a “strategic move” in the sense of Schelling (1960), seems promising. However as will be discussed, it is a credible arrangement only for high competence markets undertaking high valued infrastructure.

58 Cost overruns in large-scale transport infrastructure projects
A price signal can be informative only if the less capable market parties were to play a different strategy than the capable market parties. Further the move must be in equilibrium – compatible with the incentives of both market party and government. However, the least capable market parties will not play a distinct strategy from the capable market players. There is never an incentive for them to do so regardless of government strategy or any degree of prior belief in overall market competence outside �=1 (complete competence). Consider the following reasoning.
It is not possible to induce a meaningful price signal with government strategy “accept all” {aa} since given this response all types of market players play all strategies. Market strategy “reject all” {rr} is doubly problematic; the market signal is informative, and the potential for contracting infrastructure is anyhow lost. The “accept low bid” {ar} strategies induce the market to uniformly bid low and the “accept high bid” strategies {ra} induce the market to uniformly bid high. Here again the bidding response is uninformative. A government strategy to selectively reject low bids is compatible with their interests only when the market is already understood to be completely capable. The signal is both uninformative and uninteresting. A similar argument eliminates the possibility of selectively accepting high bids.
Another option would be for the market parties to communicate outside the game. We discuss below a covenant which might be reached between high competency markets and the government. Suppose the government promised to unconditionally accept high bids {aa}, as long as the least capable parties makes a full and complete accounting of their costs {HL}. Such a prior commitment would be credible to both parties only if (a) the government could credibly claim that it could cost less money for it to accept some high bids than to rejecting all high bids, and (b) the contracted infrastructure was worth the extra cost to the government.
Requirement a is trivially satisfied for all cases where the government might want to contract, I > L. Requirement a however puts some binding constraints on the minimum necessary level of market competency. Such a claim from the government is credible if the strategy of {aa} is more valuable to the government than the strategy {ar}, subject to industry promising to play {HL}. The claim results in an inequality, which working through can be expressed as a constraint on the required competence of the market.
γ>((H-I))/((H-L)).
The greater the high cost bid relative to infrastructure, the greater the need for market competency for this covenant to be credibly upheld. Likewise, the more efficient the low bid, relative to infrastructure, also the greater the requirement on market competency. The covenant, while attractive, is possible only to more developed and capable marketplaces.
4.4 The influence of policy measures
The previous sections described by means of a signalling game how cost overruns could occur. It showed that market parties were able to behave strategically by underestimating costs due to the lack of an appropriate signal to distinguish between the market party’s types. In order to prevent market parties underestimating costs, the incentive structure has to change in such a way that the signal becomes effective. This will be further elaborated upon in this section. Two policy measures will be addressed in this respect, the introduction of an accountability structure and the introduction of a benchmark system.
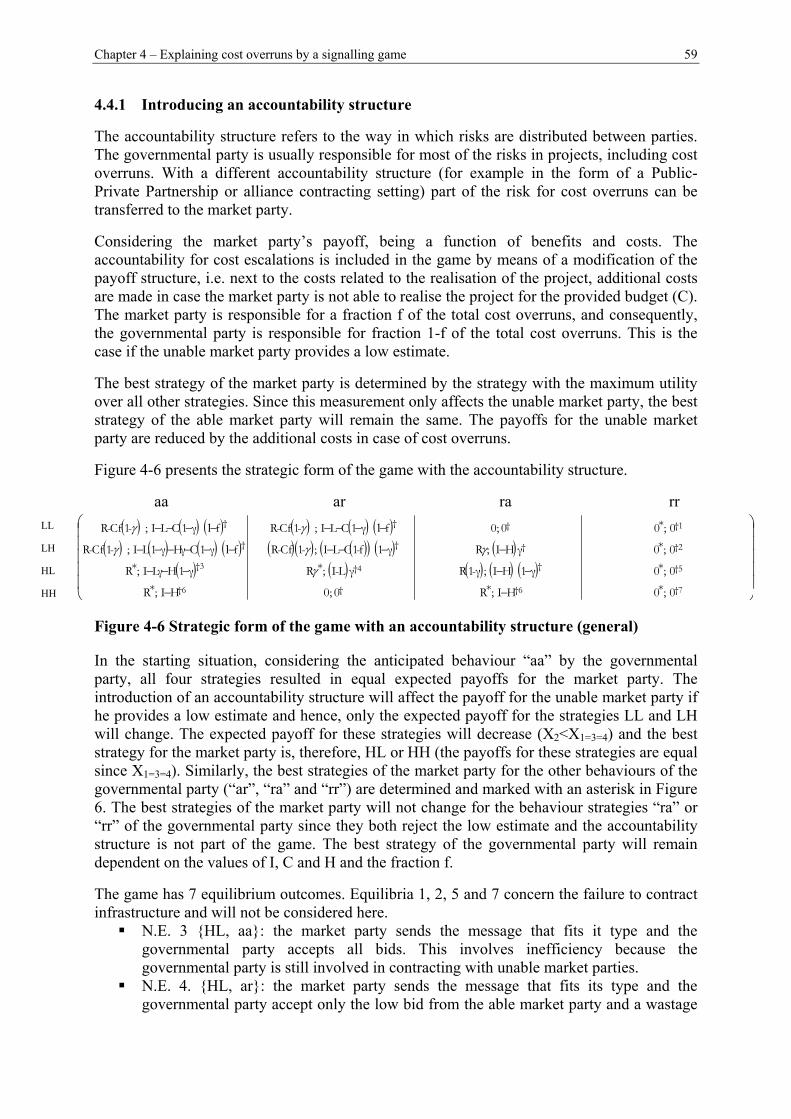
Chapter 4 – Explaining cost overruns by a signalling game 59
4.4.1 Introducing an accountability structure
The accountability structure refers to the way in which risks are distributed between parties. The governmental party is usually responsible for most of the risks in projects, including cost overruns. With a different accountability structure (for example in the form of a Public-Private Partnership or alliance contracting setting) part of the risk for cost overruns can be transferred to the market party.
Considering the market party’s payoff, being a function of benefits and costs. The accountability for cost escalations is included in the game by means of a modification of the payoff structure, i.e. next to the costs related to the realisation of the project, additional costs are made in case the market party is not able to realise the project for the provided budget (C). The market party is responsible for a fraction f of the total cost overruns, and consequently, the governmental party is responsible for fraction 1-f of the total cost overruns. This is the case if the unable market party provides a low estimate.
The best strategy of the market party is determined by the strategy with the maximum utility over all other strategies. Since this measurement only affects the unable market party, the best strategy of the able market party will remain the same. The payoffs for the unable market party are reduced by the additional costs in case of cost overruns.
Figure 4-6 presents the strategic form of the game with the accountability structure.
aa ar ra rr
LL
LH
HL
HH
Figure 4-6 Strategic form of the game with an accountability structure (general)
In the starting situation, considering the anticipated behaviour “aa” by the governmental party, all four strategies resulted in equal expected payoffs for the market party. The introduction of an accountability structure will affect the payoff for the unable market party if he provides a low estimate and hence, only the expected payoff for the strategies LL and LH will change. The expected payoff for these strategies will decrease (X2<X1=3=4) and the best strategy for the market party is, therefore, HL or HH (the payoffs for these strategies are equal since X1=3=4). Similarly, the best strategies of the market party for the other behaviours of the governmental party (“ar”, “ra” and “rr”) are determined and marked with an asterisk in Figure 6. The best strategies of the market party will not change for the behaviour strategies “ra” or “rr” of the governmental party since they both reject the low estimate and the accountability structure is not part of the game. The best strategy of the governmental party will remain dependent on the values of I, C and H and the fraction f.
The game has 7 equilibrium outcomes. Equilibria 1, 2, 5 and 7 concern the failure to contract infrastructure and will not be considered here. N.E. 3 {HL, aa}: the market party sends the message that fits it type and the
governmental party accepts all bids. This involves inefficiency because the governmental party is still involved in contracting with unable market parties.
N.E. 4. {HL, ar}: the market party sends the message that fits its type and the governmental party accept only the low bid from the able market party and a wastage
†7†6††6
†5††4†3
†2†††
†1†††
0 ;*0 HI ;*R 0 0; HI ;*R
0 ;*0 γ1HI ; γ-1R γL-I ;*R γ1 HLγI ;*R
0 ;*0 γHI ;R γ1f-1CLI ; -1 Cf-R fγ1 CHγγ1LI ;-1 Cf-R
0 ;*0 0 0; fγ1 CLI ;-1 Cf-R fγ1 CLI ;-1 Cf-R
1
11

60 Cost overruns in large-scale transport infrastructure projects
of financial resources (by accepting a high bid from an unable market party) is avoided.
N.E. 6 {HH, aa} and {HH, ra}: both market parties provide high estimates and the governmental party accepts the proposal. This could lead to financial wastage as market parties could provide unrealistic high bids anticipating upon the governmental party’s strategy of accepting the high bid
The accountability structure eliminates both problematic equilibria associated with cost overruns. A new separating equilibrium {HL, ar} emerges, in which the market party sends the message that fits its type and the governmental party only accepts the low estimate by the able market party. The accountability structure prevents the unable market party from providing a low estimate and the governmental party can accept a proposal with a low estimate without the danger of cost overruns.
4.4.2 Introducing a benchmark system
Benchmark systems compare the performance of companies and integrate this information into the selection of firms for future contracts. The introduction of a benchmark system provides the governmental party with information on the past performance of market parties in the tender process. The additional information that is made available to the governmental party reduces the information asymmetry between the governmental party and the market party and limits in this way the possibilities of strategic behaviour by market parties.
With a benchmark system, the governmental party faces, in addition to the variability uncertainty regarding the market party’s type, uncertainty regarding the quality of the benchmark. This can be represented in the game by a second signal to the governmental party concerning the quality of the market. This signal tells whether the estimate reveals the truth about the market party’s type. Figure 4-7 presents this game. The probabilities of the benchmark system are indicated by q and r for the able and unable market party respectively. The benchmark system changes the expected utility of the different strategies due to the conditional probabilities of the decision nodes representing the benchmark signal.
Figure 4-7 Signalling game for the benchmark system including two signals
Figure 4-8 presents the strategic form of the game. The additional signal increases the number of possible strategies for the governmental party. The strategy set can be summarised by 4 letters, the first letter refers to the governmental party’s action (accept or reject) if he receives a low estimate and the benchmark identifies the market party as unable, the second refers to

Chapter 4 – Explaining cost overruns by a signalling game 61
his action if he receives a low estimate and the benchmark identifies the market party as able, the third and fourth letter refer to the actions when he receives a high estimate and the benchmark system identifies the market party as unable and able respectively. Note that there are a number of strategic equivalent equilibria in the payoff matrix, e.g. the strategies {aara}, {aaar}, and {aarr} are strategically equivalent equilibria to the strategy {aaaa} and are not further mentioned.
LL LH HL HH
aaaa R I-L-C(1-)
* †
R I-L(1-)-C(1-)-H
* †
R I-H(1-)-L
* †
R I-H
*†
raaa R(q+(1-)r) (I-L)q+(I-L-C)(1-)r
R(+(1-)r) (I-L-C)(1-)r+(I-H)
R(q+(1-)) (I-L)q+(I-H)(1-)
R I-H
*†
araa R((1-r)+ (1-q)) (I-L)(1-q)+(I-L-C)(1-)(1-r)
R(1-r+) (I-L-C)(1-)(1-r)+(I-H)
R(1-q) (I-L)(1-q)+(I-H)(1-)
R I-H
*†
aara R I-L-C(1-)
* †
R(q+(1-)) (I-L-C)(1-)+(I-H)q
R(+(1-)r) (I-L)+(I-H)(1-)r
R(q+(1-)r) (I-H)( q+(1-)r)
aaar R I-L-C(1-)
* †
R(1-q) (I-L-C)(1-)+(I-H)(1-q)
R(1-r+r) (I-L)+(I-H)(1-)(1-r)
R((1-)(1-r)+ (1-q)) (I-H)((1-q)+(1-)(1-r))
rraa 0 0
R (I-H)
R(1-) (I-H)(1-)
R I-H
*†
rara R(q+(1-)r) (I-L)q+(I-L-C)(1-)r
* †
R(q+(1-)r) (I-L)(1-)r+(I-H)q
* †
R(q+(1-)r) (I-L)q+(I-H)(1-)r
* †
R(q+(1-)r) (I-H)(q+(1-)r)
*†
raar R(q+(1-)r) (I-L)q+(I-L-C)(1-)r
R((1-)r+(1-q)) (I-L-C)(1-)r+(I-H)(1-q)
R((q+(1-)(1-r)) (I-L)q+(I-H)(1-)(1-r)
* †
R((1-)(1-r)+ (1-q)) (I-H)((1-q)+(1-)(1-r))
arra R((1-)(1-r)+(1-q)) (I-L)(1-q)+(I-L-C)(1-)(1-r)
R(q+(1-)(1-r)) (I-L-C)(1-)(1-r)+(I-H)yq
* †
R((1-q)+(1-)r) (I-L)(1-q)+(I-H)(1-)r
R(q+(1-)r) (I-H)( q+(1-)r)
arar R((1-)(1-r)+ (1-q)) (I-L)(1-q)+(I-L-C)(1-)(1-r)
* †
R((1-)(1-r)+ (1-q)) (I-L-C)(1-)(1-r)+(I-H)(1-q)
* †
R((1-)(1-r)+ (1-q)) (I-L)(1-q)+(I-H)(1-)(1-r)
* †
R((1-)(1-r)+ (1-q)) (I-H)((1-q)+(1-)(1-r))
*†
aarr R I-L-C(1-)
* †
R(1-) (I-L-C)(1-)
R (I-L)
0 0
arrr R((1-)(1-r)+ (1-q)) (I-L)(1-q)+(I-L-C)(1-)(1-r)
* †
R(1-)(1-r) (I-L-C)(1-)(1-r)
R(1-q) (I-L)(1-q)
0 0
rarr R(q+(1-)r) (I-L)q+(I-L-C)(1-)r
* †
R(1-)r (I-L-C)(1-)r
Rq (I-L)q
0 0
rrar 0 0
R(1-q) (I-H)(1-q)
R(1-)(1-r) (I-H)(1-)(1-r)
R((1-)(1-r)+ (1-q)) (I-H)((1-q)+(1-)(1-r))
*†
rrra 0 0
Rq (I-H)q
R(1-)r (I-H)(1-)r
R(q+(1-)r) (I-H)(q+(1-)r)
*†
rrrr 0 0
* †
0 0
* †
0 0
* †
0 0
*†
Figure 4-8 Strategic form of the game with a benchmark system Note: for reasons of readability, the columns represent the strategies of the market party and the rows represent the governmental party’s strategies. Furthermore, the first row in the cell represents the expected payoffs for the market party and the second row in the cell represents the expected payoff for the governmental party; e.g. the strategy set {LL, aa}, R is the expected payoff for the market party, and I-L-C(1-) is the expected payoff for the governmental party.
The benchmark system includes two type or errors. The first type of error concerns the benchmark system telling that the market party is able but it is in fact unable. The probability of this type of error is represented by the probability r. The second type of error concerns the benchmark system telling the market party is unable but it is in fact able. The probability of this type of error is represented by 1-q. Type 1 errors are much worse as compared to type 2 errors and the probability of occurrence should, therefore, be reduced. At any stake, the benchmark system should be such that 1-q<0.5 and r<0.5. Otherwise, the benchmark would be misleading and not helpful. Based on these constraints, the best strategy of the market party can be determined (marked with an asterisk in Figure 4-8).

62 Cost overruns in large-scale transport infrastructure projects
To determine the best strategy of the governmental party, phased diagrams are used. Figure 4-9 provides an example of such phase diagrams. The two most interesting strategies of the market party, the strategies in which cost overruns could occur, are illustrated. The dashed line represents the best strategy of the governmental party for the strategy LL or LH by the market party for different market competence. The shaded regions indicate the benefits as a result of the benchmark system.
Figure 4-9 Phase diagram for market party's strategy {LL} (left diagram) and {LH} (right diagram)
The analyses by phase diagrams demonstrate the following. Case 1: no deficits associated with overrun or high bids: {aaaa} dominates for all strategies of the market party
Case 2: deficits associated with overruns but not with high bids: {LL}{rrrr} or {LL}{rarr} or {LL}{aaaa} dominates depending upon market
competence {LH}{rrrr} or {LH}{arra} or {LH}{aaaa} dominates depending upon market
competence {HL}{aaaa} dominates {HH}{aaaa} dominates
The benchmarking provides additional strategic flexibility to manage a more complete range of market competencies. Benchmarking is of very considerable help when the market is bidding low {LL} since it enables selection of competent market parties. The benchmark introduces two additional best strategies for the governmental party {rara} and {rarr} next to the best strategies in the starting situation {aaaa} and {aarr}. The new enabled strategy {rara} rejects the low as well as high estimate if the benchmark tells it concerns an unable market party. It is, therefore, a market disciplinary strategy for high bidders as well but it does not apply in the game of cost overruns. In this strategy, the governmental party accepts high bids from the able market party, and this would result in financial wastage because the market party is able to realise the project for less. Therefore, although both new enabled strategies are

Chapter 4 – Explaining cost overruns by a signalling game 63
equivalent, the strategy {rarr} is preferred; only bids from an able market party should be accepted.
In the new enabled strategy {rarr}, the market party bids low and the government uses benchmarking to accept only bids from market parties with a certain level of market competence. Thus, the benchmarking enables more effective contracting in lower capability markets (shaded area in Figure 4-9).
A benchmark system is of only limited use when the market parties are bluffing {LH}. The benchmarking introduces one additional best strategy for the governmental party i.e. {arra}. This strategy affords a credible threat for the government to penalise and possibly eliminate a subset of moderately competent market parties. These parties are subjected to an error-laden benchmarking system, while the most competent are fast-tracked with an immediate and unconditioned acceptance.
4.4.3 Comparison between the accountability and benchmark system
Both the accountability as well as the benchmark system reduce the probability of strategic behaviour by the market party. This section further elaborates upon the advantages and disadvantages of both systems. The accountability system removes the incentive to provide underestimated costs (the unable market party providing a low estimate) because the market party is held responsible for any additional costs and his behaviour is reprimanded if he cannot realise the budget against the agreed budget. The change in the payoff structure of the game changes the behaviour of the market party. The government has a large advantage of this system because he is not being confronted with any large unforeseen cost overruns.
There are, however, two possible dangers with the introduction of an accountability structure. First of all, although it reduces the strategic behaviour in the decision-making phase, it can give rise to another type of strategic behaviour during the implementation phase, so-called moral hazard. With moral hazard, the danger exists that the market party is trying to stay within the budget in order to avoid any additional costs that he is now responsible of, at the expense of other project values. The information asymmetry between the market party and the governmental party makes it possible for the market party to reduce the performance on these other project values e.g. scope or quality because the governmental party is not able to fully monitor the market party. Secondly, care should be taken into determining the extent to which responsibilities are transferred to the market party. Too large risks and responsibilities for the market party will result in yet another type of strategic behaviour that is contradictory to the current situation, i.e. market parties will provide unrealistic high bids to ensure that they can realise the project for the received budget.
The benchmark system does not, contrary to the accountability structure, alter the payoff structure to reduce strategic behaviour. It does so by reducing the information asymmetry between parties by providing additional information to the governmental party. This makes the governmental party’s belief about the market party’s type more certain which decreases the probability of an inappropriate action with unforeseen cost overruns. The effectiveness of the benchmark system is, however, dependent upon the market party’s strategy. It is not fully effective for a “bluffing” market party, thus still incorporating the danger of potential foreseen cost overruns. The government, similar as with the accountability system, has an advantage of the system because he is not confronted with any unexpected cost overruns. Next to this, the increased transparency of the system enables him to make a decision based on complete information. However, the benchmark system also has its demerits. Although it is introduced

64 Cost overruns in large-scale transport infrastructure projects
to reduce strategic behaviour of the market party underestimating costs, it can at the same time evoke strategic behaviour of a different kind. It concerns the danger of so-called signal jamming. Signal jamming concerns the tendency of the market party to hide information for the governmental party as to not to reveal their true type (Rasmussen, 2006).
4.5 Conclusions and recommendations
4.5.1 Main conclusions
This paper focuses on political-economic explanations for cost overruns. These explain cost overruns as the strategic misrepresentation of costs by agents to get their proposal accepted. The main objective of this research is to illustrate this strategic behaviour from a theoretical perspective. The theory of principal and agent is often used in this respect. This paper uses game theory, and more specifically a signalling game to address the principal-agent problem by providing a formal account of the interaction between parties that result in the underestimation of costs. It shows how the market party and the governmental party choose a course of action that maximises their expected payoff through anticipation of behaviour.
The paper shows that there are multiple equilibria outcomes in a simple model of cost overruns. The problematic equilibria concern the situation in which the governmental party accepts the low estimate from the unable market party. This situation can emerge due to a lack of an appropriate incentive for the market party to provide the message that fits its type. Furthermore, this strategic behaviour is possible because the signal in the game is insufficient for the governmental party to distinguish, based on the message he receives, between the type of market party and to accept only a low estimate from the able market party.
The signalling game gives useful insights in the way in which strategic behaviour results in cost underestimation. It is, furthermore, a valuable tool to predict the impact of policy measures on the behaviour of the market party. Measurements are aimed to reprimand or prevent the strategic behaviour of the market party and they should be focused on changing the incentive structure in such a way that the signal of the game becomes effective. Two such measurements are considered in this paper, i.e. the introduction of an accountability structure and a benchmark system. Overall, it was shown that the measurements have the desired impact of reducing the probability of cost overruns, but they can also give rise to other kinds of strategic behaviour such as moral hazard or cost overestimation. These problems can also be modelled by means of a signalling game in the same way as cost underestimation was modelled in this paper.
4.5.2 Limitations of our model
As with many studies of signalling games, this study suffers from certain limitations. This is the result of assumptions and simplifications necessary to capture the situation in the game. This section addresses these limitations by considering for each assumption and simplification the way in which it affects the game and outcome.
This paper uses the tender price as the bid selection criterion (represented by a message that is based on costs). Strategic behaviour occurs due to asymmetric information about the selection criteria. However, the market party only has strategic advantage over the governmental party concerning the actual costs. The information asymmetry with respect to the other selection

Chapter 4 – Explaining cost overruns by a signalling game 65
criteria is small and consequently, opportunities for strategic behaviour regarding these criteria are fewer. The outcome of the game is, therefore, mainly determined by the extent to which the market party behaves strategically regarding the cost estimate rather than to other criteria. A signalling model with one message regarding the estimated costs, therefore, suffices. The assumption to focus on one bid selection criterion does not set any restrictions to the conclusions of this research.
The message in the game is binary but the estimated cost is actually a continuous variable. Modelling the variable accordingly will result in the same outcome and shows, in addition, the extent of underestimation. However, this paper addresses the tendency towards cost underestimation and not the extent to which costs are underestimated.
The market party is either one of the following two types, an able or unable market party. Market parties differ to the extent to which they are able to realise the project for the low cost estimate. Differences in the extent of ability will influence the extent of cost overruns but this is not considered in this research. Concerning the payoff function it is assumed that the payoff is a linear function of the costs and benefits. The assumption of linearity influences this ratio between the payoffs and equilibrium outcome. It mainly affects the tipping points at which one strategy is still better than another..
4.5.3 Avenues for further research
The formal model presented in this paper presents three benefits for continued research. First, it suggests areas for empirical investigation and testing. Second, it provides a theoretical explanation which assists the choice and justification of specific remedies for alleviating overruns. Third, it contributes to a growing body of evidence that overruns occur, at least in part, as a result of strategic behaviour. We review each of these points in greater detail below.
The model provides firm hypotheses which can be empirically verified. It calls specific attention to the role of market capabilities, the spread between high and low bids, and the value of the infrastructure as potential determinants of cost overruns. The model also demonstrates that there is an important source of censoring in empirical data – the failure to contract desired infrastructure. A complete database should include those projects which are completed, as well as those which fail in contracting.
The model presents a clear and falsifiable hypothesis concerning the maximum degree of cost over-run. In the model, overruns cannot exceed 100% of the valued infrastructure. This is falsified in at least one notable case (Murphy 2008). Cases such as these suggest interesting extensions to the model; the ultimate answer seems to require more strategic behaviour rather than less. The model also presents a clear and falsifiable hypothesis concerning market competency. Cost overruns should occur within regimes corresponding to local markets for capability and competency. Two counter claims could be tested; that cost overruns are not regionally specific, or that cost overruns are regionally specific but occur solely from a lack of engineering competency rather than strategic misrepresentation.
Flyvbjerg et al. (2003) have provided a number of instruments to strengthen accountability. These measures have been applied in practice in policy and planning to address misinformation or strategic behaviour of underestimating costs, and signs of improvement have recently appeared. Although these measures are focused on reducing misinformation by project promoters instead of by market parties, the rationale is the same, strategic behaviour by underestimating costs to get the project approved or tender accepted respectively. We

66 Cost overruns in large-scale transport infrastructure projects
therefore believe that the effects will also be considerable for the situation drawn in this paper. Whether this is actually the case can be tested by comparing the cost performance of projects with different levels of accountability.
The measurement of benchmarking has also been applied in practice to address strategic misrepresentation or underestimating of costs, by the method of reference class forecasting (the theory was developed by Kahneman and Tversky and the method and data were developed by Flyvbjerg). “Reference class forecasting consists of taking a so-called "outside view" on the particular project being forecast. The outside view is established on the basis of information from a class of similar projects” (Flyvbjerg, 2009 – survival of the unfittest). The method has proven more accurate than conventional forecasting, and has been applied by governments and private companies over the world. Similar to the measurement of accountability, the method is focussed on strategic behaviour of project promoters but it can just as well be applied for the strategic behaviour of market parties. For this purpose, data should be gathered about the past performance of market parties in tenders. This information can be used as a reference to establish the accurateness of the estimate or the ability of the market party.
The covenant approach discussed in the paper is also currently being applied in practice. One recent example involves the Dutch Ministry of Infrastructure and Environment which has adopted a new memorandum of understanding regarding high bids in infrastructure projects. The model presented in this paper makes it clear that given the game structure considered such covenants can only work under certain specific situations involving high competency and manageable infrastructure costs.
Acknowledgement
The research was supported by the Dutch Ministry of Infrastructure and Environment. We are grateful to three referees, whose thoughtful comments have been instrumental in improving an earlier version of this paper.
References
Assaf, S.A. and S. Al-Hejji, (2006) Causes of delay in large construction projects, in: International Journal of Project Management, 24(4), pp. 349-357
Bruzelius, N., B. Flyvbjerg, and W. Rothengatter (2002) Big decision, big risks. Improving accountability in mega projects, in: Transport Policy, 9 (2), pp. 143–154.
Centraal Bureau voor de Statistiek (CBS), (2005) Nationale Rekeningen 2005, CBS, Voorburg/Heerlen.
Flyvbjerg, B., M.K. Skamris Holm and S.L. Buhl (2002) Underestimating cost in public works. Error or Lie?, in: Journal of the American Planning Association, 68 (3), pp. 279-295.
Flyvbjerg, B., N. Bruzelius and W. Rothengatter (2003a) Megaprojects and Risk: An Anatomy of Ambition, Cambridge, Cambridge University Press.
Fudenberg, D. and J. Tirole (1992) Game theory, MIT Press, Cambridge, USA.
Hall, P. (1980) Great Planning Disasters, Penguin Books, Harmondsworth.

Chapter 4 – Explaining cost overruns by a signalling game 67
Holt, G.D., P.O. Olomolaiye and F.C. Harris (1994). Evaluating prequalification criteria in contractor selection, in: Building and Environment, 29 (4), pp. 437-448.
Jensen, M.C. (2000) A theory of the firm: Governance, residual claims, and organizational forms, Harvard University Press, Massachusetts, USA.
Karlaftis, M.G. (2010) Ownership and competition in European transit: assessing efficiency, in: Transportmetrica, 6(2), pp. 143-160.
Kennisinstituut voor Mobiliteitsbeleid (KIM) (2007) Mobiliteitsbalans 2007, KIM, Den Haag.
Laffont, J. J. and Tirole (1998) A theory of incentives in procurement and regulation, MIT Press, Cambridge, USA.
Morris, S. (1990) Cost and Time Overruns in Public Sector Projects, in: Economic and Political Weekly, 15(47), pp. 154-168.
Mu, R., M. de Jong and E. ten Heuvelhof (2010) A typology of strategic behaviour in PPPs for expressways: Lessons from China and implications for Europe, in: European Journal of Transport and Infrastructure Research, 10 (1), pp. 42–62.
Murphy, S.P. (2008) Big dig’s red ink engulfs state, in: Boston Globe.
Odeck, J. (2004) Cost overruns in road construction – what are their sizes and determinants?, in: Transport Policy, 11(1), pp. 43–53.
Peters, H. (2008) Game theory. A multi-leveled approach, Springer Verlag, Berlin.
Png, I.P.L. (1983). Strategic Behavior in Suit, Settlement, and Trial. In: Bell Journal of Economics, 14 (2), pp. 539–550.
Rasmusen, E. (2006) Games & Information. An introduction to game theory, Blackwell Publishers, Oxford, UK:.
Ratliff, J. (1996). Perfect Bayesian Equilibrium in Sender-Receiver Games. Lecture notes from course on game theory at the University of Arizona [online], Arizona, University of Arizona. Available from:
http://www.virtualperfection.com/gametheory/6.2.PerfectBayesSenderReceiver.1.0.pdf [Accessed 4 March 2010].
Schelling, T. (1960) The Strategy of Conflict, Harvard University Press, Harvard.
Van Wee, B. (2007) Large infrastructure projects: a review of the quality of demand forecasts and cost estimations, in: Environment and Planning B: Planning and Design, 34 (4), pp. 611-625.
Wachs, M. (1989) When Planners Lie with Numbers, in: Journal of the American Planning Association, 55 (4), pp. 476-479.
Yang, H., F. Xiao and H.J. Huang (2009) Private Road Competition and Equilibrium with Traffic Equilibrium Constraints, in: Journal of Advanced Transportation, 43(1), pp. 21-45.

68 Cost overruns in large-scale transport infrastructure projects

69
5. Cost overruns in the Netherlands: ecological fallacy and project phases Cantarelli, C.C., Molin, E.J.E, Wee, B. van, and Flyvbjerg, B. Exploring the danger of ecological fallacy and cost overruns during project development: The Dutch case for transport infrastructure projects. Conditionally accepted for publication in Transport Policy.
Abstract This paper covers two subjects on cost overruns that have either not or barely been addressed in the literature: ecological fallacy and cost overruns during project development. Using a methodology similar to that used in the worldwide research, the cost performance of Dutch large-scale transport infrastructure projects is compared with worldwide findings and is found to be considerably better. In the Netherlands, cost overruns are less frequent and the average overrun is much lower. Ecological fallacy is therefore a real threat and worldwide findings are not always applicable for individual countries. Further research is recommended as, besides the differences in cost performance, the determinants of cost overruns may also differ. In addition, the focus on one country enabled the cost overruns during project development phases to be considered. It turned out that in the Netherlands the majority of the cost overrun occurs in the pre-construction phase (the period between the formal decision to build and the start of construction). The frequency as well as the magnitude of pre-construction cost overruns is significantly higher than in the construction phase.

70 Cost overruns in large-scale transport infrastructure projects
5.1 Introduction
Transport infrastructures are expensive and often involve large cost overruns. Projects become more expensive than was initially estimated and additional budget is required. Consequently, as the total budget for infrastructure investments is generally fixed, the budget to cover the costs of other projects may be insufficient. Cost overruns therefore not only result in financial consequences for the project under consideration but may also ultimately result in fewer infrastructure projects being realised than planned. The problem of cost overruns is even more disturbing considering the fact that “cost escalation has not decreased over the past 70 years” (Flyvbjerg et al. (2003b).
The problem of cost overruns is thus severe and persistent and probably affects every country investing in transport infrastructure. The question, however, is to what extent. The study by Flyvbjerg et al. (2002, 2003a, 2004) can be considered the leading piece of research into cost overruns because of the large number of projects included, the variety of project types, the long time period and the wide geographical coverage. However, using the results of this study specifically for individual countries could include the danger of ecological fallacy. This is the tendency for inferences to be made about individual cases (individual countries or projects) from aggregate results, which is not always possible. For example, the conclusions for Europe do not necessarily apply to each individual European country.
Some studies on cost overruns have focused on individual countries. Table 5-1 gives an overview of these studies on cost overruns, their geographical area, the frequency and the magnitude of cost overruns. The study of Flyvbjerg et al. (2003a) is included in the table for comparison. Note that these studies measure cost overruns slightly differently, which is explained a few lines below the table.
Table 5-1 Frequency and magnitude of cost overruns found in literature
Study Geographical area Frequency cost overrun (%)
Magnitude of cost overrun Road Rail Fixed
Links Other
% N % N % N % N Merewitz (1973) US 79 26 49 54 17
Morris (1990) India na 164 23 4 10
Pickrell (1990, 1992)b US 88 61 8
Auditor General (1994)c Sweden na 86 8 17 7
Nijkamp and Ubbels (1999) Netherlands,Finland 75 0-20 8
Flyvbjerg et al. (2003a) World 86 20 167 41 58 34 33
Bordat et al. (2004) US 55 5 2668d
Odeck (2004) Norway 52 8 620
Dantata et al. (2006) US 81 30 16
Ellis et al. (2007) US na 9 3130
Lee (2008)e South Korea 95 11 138 48 16 a In which: %: the percentage cost overrun and N: the number of projects with cost overruns, na: not available b In van Wee (2007) c In Odeck (2004) d Projects include: Road and bridge construction and rehabilitation projects; maintenance projects, with road maintenance and resurfacing contracts; Traffic and traffic maintenance contracts e In Siemiatycki (2009)
All studies show that cost overruns are more common than cost underruns, with frequencies ranging between 52% and 95%. Conversely, the magnitude of the cost overruns differs between the studies. The studies by Nijkamp and Ubbels (1999), Odeck (2004), Bordat et al. (2004) and Ellis et al. (2007) found rather small cost overruns – up to 20% – whereas Morris

Chapter 5 – Cost overruns in the Netherlands: ecological fallacy and project phases 71
(1990) and the Auditor General of Sweden (in Odeck) found enormous cost overruns of 164% and 86% respectively.
The following main explanations can be given for these differences in average cost overruns between studies. First of all, the main reason for the differences in the average cost overrun between studies is the difference in the use of nominal and real prices (Flyvbjerg, 2007). Secondly, the way data are handled can explain the differences in the extent of cost overruns between studies (see for a more extensive elaboration Flyvbjerg et al., 2003b). Studies use a different moments for the year of decision to build and the year of completion as the basis for the estimated and actual costs, and hence the extent of the cost overruns differs. Thirdly, differences can also be related to the variation in sample size. If the sample size is small, outliers may have a large influence on the results. Fourthly, the differences can be explained by the differences in the geographical area that is covered (different economies), and the project types that are included (different project dynamics and complexity).
These differences make it impossible to draw conclusions regarding ecological fallacy. It is therefore necessary to acquire data on individual countries by applying the same methodology used for the worldwide research. This implies that the same project types should be included, data should be handled in the same way and real prices should be used.
Considering cost overruns at this disaggregated level allows cost overruns to be considered from a different perspective. In the literature on cost overruns hardly any attention is given to the project phases (with the exception of Odeck (2004)). Possibly some project phases include larger cost increases than others and this insight might be useful in explaining cost overruns.
The objective of this research is therefore two-fold. Firstly, we aim to examine the danger of ecological fallacy by determining the cost overruns for one country (using the same methodology as the worldwide research) and comparing them to the international findings. This concerns the frequency and the magnitude of cost overruns and whether cost estimated have improved over time. Secondly, we aim to determine whether and to what extent cost overruns differ between project phases.
The Netherlands was chosen as the country under scrutiny. Even though there is little knowledge about the regularity and magnitude of cost overruns in the Netherlands, there has recently been more interest in this subject after large budget increases came to light for two recently implemented projects, the Betuweroute and the HSL-South. This led the Dutch Ministry of Infrastructure and the Environment to carry out research to determine whether these projects were exceptions or whether cost overruns are a regular feature of large-scale projects in the Netherlands. Part of the research involved extensive data collection of Dutch transport infrastructure projects, which enabled both of the objectives described above to be addressed.
In order to address the first research objective a database of 78 Dutch large-scale transport infrastructure projects was created. The statistical analyses were used to determine the frequency and magnitude of cost overruns in the Netherlands and also to examine whether cost estimates have become more accurate over time.
For the second objective, we investigated whether projects are more vulnerable to cost overruns during different project phases and if so which phase this concerns. A distinction was made between two phases (more phases was not possible with the available data): 1. the pre-construction phase (the period between the formal decision to build and the start of

72 Cost overruns in large-scale transport infrastructure projects
construction) and 2. the construction phase (the period between the start of construction and the start of operation (opening)).
To summarise, this paper addresses the following questions: 1. How can the cost performance of large-scale transport infrastructure projects in the Netherlands be characterised regarding the frequency and magnitude of cost overruns, and does this support the risk of ecological fallacy? 2. To what extent have cost estimates of large-scale transport infrastructure projects in the Netherlands improved over time? 3. Are transport infrastructure projects more vulnerable to cost overruns during different project phases and if so, what is the difference between the phases?
The structure of the paper is as follows. Section 2 describes the project selection, data collection and methodology. It provides information on the size of the database and the variables that are included. Section 3 presents the cost performance in the Netherlands, focussing on the frequency and magnitude of cost overruns. Section 4 examines whether cost estimations have improved over time. In section 5 a comparison is made between the cost overruns in the pre-construction phase and those in the construction phase. Finally, section 6 discusses the main conclusions and section 7 presents several areas for further research.
5.2 Project selection, data collection and methodology
5.2.1 Definition large-scale project
Large-scale projects are often defined as major infrastructure projects that cost more than US$1 billion (Flyvbjerg et al., 2003a). However, past studies have often included a wider range of projects, both smaller sized projects costing several million dollars and large-scale projects (see e.g. Flyvbjerg et al., 2003b, where the smallest project cost US$ 1.5 million, and Odeck, 2004, which included projects costing less than 15 million NOK ~ US$ 12.3 million). In addition to the size of the project in terms of costs, large-scale projects attract a high level of public attention or political interest because of substantial direct and indirect impacts on the community, environment, and budgets (FHWA in Capka, 2004). Therefore, the definition of a large-scale project can also depend on the context, that is, the size of the project in relation to the size of the city (or country). Based on project size, their impact and context, projects that cost more than about € 20 million are considered large-scale projects in the Netherlands3. Regarding transport infrastructures, we adopt the definition of van Wee (2007): “Transport infrastructures include roads, rail lines, channels, (extensions of) airports and harbours, bridges and tunnels. Of these projects the ‘hardware’ is considered, excluding ‘software’; projects that are not related to the construction of infrastructure but are related to policies of deregulations, liberalization, privatization, and so forth”. In line with previous studies, the project types that are included in this research are road, rail, and fixed link (tunnel and bridge) projects.
5.2.2 Project selection and data collection
The first step in data collection involved the identification of all transport infrastructure projects in the Netherlands that were completed after the year 1980. Projects completed before this year are excluded because the data were expected to be difficult to come by.
3 These are the costs at the time of project completion in 2010 prices.

Chapter 5 – Cost overruns in the Netherlands: ecological fallacy and project phases 73
Projects were then selected that fulfilled the aforementioned definition of a large-scale project, and after that data were collected from these projects.
Data were collected from a variety of sources, i.e. interviews with former project leaders and project teams; archives research at the Ministry of Infrastructure and the Environment; RWS4 Direction Large Projects and RWS Direction Zuid-Holland; internet search; and the MIRT reports. The MIRT (Meerjarenprogramma Infrastructuur, Ruimte en Transport, translated as the Multi-year programme for infrastructure, spatial planning and transport5) was a valuable source of information for both identifying large-scale road and rail projects and collecting data. The MIRT is the implementation programme related to the policy of ‘mobility and water’. It is funded by the Infrastructure Fund of the Ministry of Infrastructure and the Environment. The MIRT6 includes all infrastructure projects in the Netherlands and it was therefore particularly useful for the selection of large-scale projects. For this research the programmes for the years 1984-20107 were accessed.
Based on the MIRT, 70 road and 39 rail projects were identified (one rail project falls out of the period 1984-2010 but is included because data for this project was readily available from the research of Flyvbjerg et al. (2003a)). Of these projects, 34 projects (23 road and 11 rail) were rejected for reasons of limited data availability, and 12 projects (10 road and 2 rail) were rejected because the data was invalid.
To identify tunnels we used an international database and gallery for structures – Structurae – (http://en.structurae.de) and to identify bridges we used the database of the National Bridge Foundation (NBF) (http://bruggenstichting.nl). However, neither of these databases includes data on costs and in order to select the large-scale fixed link projects, the length of the project was used as a surrogate criterion for project size. Larger projects have a greater impact on the community, environment, and budgets and they require more effort to fit into the landscape, not only due to the development density but also for aesthetic reasons. However, because the level of effort differs between bridges and tunnels, the definition of a large-scale project based on the project length differs as well. Bridge projects, for example, have a larger influence on the visual hindrance compared to tunnel projects and hence the minimum length of a large-scale project is less for bridge projects. The minimum length for projects is based on construction cost indices and was set at 500 meters for tunnels and 200 meters for bridges (http://www.bouwkostenkompas.nl)8. Data on fixed link projects was collected by means of interviews and researching the archives. In total, 27 tunnel and 25 bridge projects were identified. For 38 of these projects data for crucial variables were missing, so these projects could not be included in the database. To summarise, the database consists of 78 projects completed between 1991 and 2009.
4 RWS, Rijkswaterstaat, is the executive agency of the Ministry of Infrastructure and the Environment, responsible for the
construction and maintenance of roads and waterways. 5 The translation of the MIRT in English is based on:
http://www.verkeerenwaterstaat.nl/english/topics/water/delta_programme/rules_and_framework_of_the_mirt (consulted 20-03-2010)
6 Note that the MIRT was called MIT until 2008; from 1984-1989 it was called MPP, translated here as Multi-year Passenger Transport Programme and spatial planning projects were not part of the programme, only passenger transport was included and not freight transport.
7 With the exception of MIRT 1985 8 The use of length as a surrogate criterion was verified and with the specified minimum lengths the probability of rejecting
projects that should have been included is minimised.

74 Cost overruns in large-scale transport infrastructure projects
5.2.3 Methodology
Given the objective of determining whether the worldwide findings also apply for one specific country, it was important for this study into cost overruns in the Netherlands to apply, as much as possible, the same methodology used in the worldwide research by Flyvbjerg et al (2003a; 2003b). Consequently, this affected methodological choices. This section presents the most important implications, related to the definition and measurement of variables, inflation and VAT correction9.
The two most important data variables in this research are the estimated and actual costs. Cost overrun is measured as actual out-turn costs minus estimated costs expressed as a percentage of the estimated costs. Actual costs are defined as real, accounted construction costs determined at the time of project completion. Estimated costs are defined as budgeted or forecasted construction costs determined at the Time of formal Decision to build (ToD). This is also called the "decision date”, "the time of the decision to proceed," the "go-decision" (Flyvbjerg et al., 2003a). At that moment, cost estimates were often available as data for decision-makers to make an informed decision.
Estimated costs are the costs at the ToD. In line with Flyvbjerg et al. (2003a), when the costs are not available at the ToD, the nearest available reliable figure for estimated costs is used as a proxy. This is typically a later estimate, which is often more accurate, and therefore leads to lower cost overruns. By investigating the cases with complete information, it was estimated that the cost overruns presented in this study are about 1% lower because of this assumption. We did not correct cost estimates using this figure because it is based on many assumptions and only concerns a small deviation.
The actual construction costs are the costs at the year of completion (year operations begun). If the actual costs are unknown at the time of project completion, the most reliable later figure for actual costs is used (i.e. from a year later than the opening year), if available. If unavailable, an earlier figure for actual costs was used (i.e., from a year before the opening year), but only if at least 90% of the budget was spent at this time, i.e., the project was at least 90% complete in financial terms. The cost overruns presented in this study are about 0.8% higher because of this assumption. For the same reason as given for estimated costs, we did not use this percentage as a correction factor.
All costs were converted to 1995 prices using the appropriate historical and sectoral indices for discounting in the Netherlands to correct for inflation (similar to Flyvbjerg et al. 2003a). Based on expert opinions10 the most appropriate indices were determined, which included the GWW index, an index by ProRail for rail projects and the CROW index11. Research on cost overruns typically presents costs without VAT. VAT is, therefore, also excluded in the costs for the projects in this research. In adjusting the costs for VAT, the difference between a low and high tariff as well as changes of the tariff over the years is taken into account. The methodology of data collection and the calculation of cost overruns was approved by two independent authorities from the Ministry of Infrastructure and the Environment, i.e. RWS and KiM.
9 The full methodological elucidation is included in the Appendix of this PhD Thesis. 10 By RWS direction Large Projects and KiM, Kennisinstituut voor Mobiliteitsbeleid (Netherlands institute for Transport
Policy Analyses, an independent institute within the Ministry of Infrastructure and the Environment) 11 The GWW index concerns an index for “ground, water and road construction”. The CROW is a platform of knowledge on
infrastructure, traffic and transport, and public space and provides a special index for large bridges and tunnels.

Chapter 5 – Cost overruns in the Netherlands: ecological fallacy and project phases 75
The intention was to include all projects in the specified period in the database, but due to non-availability of key information of projects, the database does not cover all projects. This raises the question of whether the projects in the database are representative for the population of all projects. We believe that the data for road and rail projects is fairly representative because the same source for each of the projects is used (the MIRT). Hence, data collection for these projects was not dependent on retrieving information directly from project managers and, therefore, bias in the sense that managers may have an interest in whether or not data is provided or presenting the data in a favourable light may not play a role. For the fixed link projects, data was partly collected by means of interviews with project managers and therefore the risk of bias mentioned above is present. However, the average cost overruns for fixed link projects for which data was collected by means of interviews is not statistically different from the average cost overruns for fixed link projects for which data was collected by means of documentation research. (t=-1.414, p=0.188, N=15, independent sample t-test). Assuming the cost overruns across these projects to be similar, this implies that there is no reason to assume the presence of bias in the cost overruns for fixed link projects.
As may have become clear, the resulting database does not include all projects due to incompleteness of information which may be regarded as non-response (thus not due to sampling mechanisms, because these were not applied). However, in line with previous international research in this field that also included only projects for which information was available, the database is treated as a sample. However, also non-significant differences will be reported because we are also interested in a complete description of the project performance of the specific projects in the database.
5.3 Cost performance: magnitude and frequency of cost overruns
The results of the analyses regarding the magnitude and frequency of cost overruns are presented in this section.
5.3.1 Magnitude of cost overruns
Figure 5-1 shows a histogram with the distribution of cost overruns for all Dutch transport infrastructure projects in the database.

76 Cost overruns in large-scale transport infrastructure projects
Figure 5-1 Distribution of cost overruns in Dutch transport infrastructure projects
The histogram shows a large spread around zero indicating that the errors in forecasting costs are various and large. Furthermore, considering the asymmetrical distribution around zero it can be concluded that the errors in overestimating costs are different in size to the errors in underestimating costs.
The specific statistics are as follows (figures rounded off to one decimal): The range of cost overrun is -40.3% to 164.0% The average cost overrun is 16.5%. The standard deviation is 40.0, indicating a rather large variation of the individual cost
overruns around the mean.
Figure 5-1 shows two striking features in the distribution of cost overruns. First of all, there is one project, The Tweede Heinenoordtunnel, with an extremely large cost overrun of 164.0%. It was the first tunnel in the Netherlands to be bored, and the additional complexity involved with this construction method can partly explain the cost overruns. If this project is excluded, the total average cost overrun decreases to 14.6% (SD=36.5).
Secondly, a large number of projects (32%) have cost underruns in the category -20% to 0%. Considering this group of projects in more detail, there are slightly more rail projects and less road projects but overall these projects do not differ considerably from the other projects in the database regarding project type. Of the total number of projects (25), 40% are road projects, 40% are rail projects and 20% are fixed link projects. Regarding project size (in terms of estimated costs in line with standard convention), the projects with cost overruns between -2% and 0% are considerably smaller with €89.9 million compared to the other projects with an average size of €218.5 million (p=0.346, independent sample t-test).
5.3.2 Frequency of cost overruns
The main findings regarding the frequency of cost overruns are as follows: In 55% of the projects, actual costs are larger compared to estimated costs (resulting in
cost overruns) whereas in 44% of the projects, actual costs are lower compared to estimated costs (resulting in cost underruns).

Chapter 5 – Cost overruns in the Netherlands: ecological fallacy and project phases 77
Projects with cost overruns are as common as projects with cost underruns (one project had correct costs and is therefore combined with the projects with a positive cost performance record) (p=0.428, binominal test).
Projects with cost overruns have an average overrun of 41.3% (SD=38.1). Projects with cost underruns have on average an underrun of 13.9% (SD=10.5). This is a significant difference (Mann-Whitney U =0.000, p=0.000, Mann-Whitney U-test).
5.3.3 Sub-conclusion average and frequency of cost overruns
Comparing these results with the worldwide research by Flyvbjerg et al. (2003a; 2003b) we find that the cost overruns in the Netherlands are considerably smaller. The average cost overrun in the Netherlands is significantly different from the average of Europe (25.7%) (t=-2.023, p=0.047) and the average of other geographical areas (64.6%) (t=-10.611, p=0.000) but not significantly different from the average in North America (23.6%) (t=-1.559, p=0.123) (one-sample t-test). Regarding the frequency, in the Netherlands, cost overruns occur significantly less often than internationally (86%) (p=0.000, binominal test).
It is expected that the percentage cost overruns that are presented in this paper and also in the international study are underestimated due to the methodology (section 2) as well as due to the use of the formal decision to build as the basis for the estimated costs. The point at which decision-makers informally decide to carry out the project is often made before the formal decision to build (Cantarelli et al., 2010). This is referred to as the real (informal) decision to build as opposed to the formal decision to build. It is highly likely that the estimated costs at the formal decision to build are larger since estimated costs usually become more accurate over time. For example, costs increased on average by 63.4% between the first estimate and the estimate at the time of the formal decision to build. Consequently, when the smaller estimated costs at the formal decision to build are used to calculate the cost overruns, the overrun will be larger. Two case studies have shown that the cost overruns were 4 to 5 times larger when the estimated costs at the informal decision to build were taken as a reference (Cantarelli et al., 2010)12. Because it is almost impossible to determine the real decision to build, we used the formal decision to build as a reference but recognise that the calculated cost overruns are probably higher as a result.
5.4 Cost performance over time
Technical explanations explain cost overruns by technical errors such as inadequate forecasting techniques. If technical explanations are the main cause of cost overruns, cost estimates should have improved over time since better methods have become available. This section examines whether technical explanations fit the data. In order to consider the project performance in terms of costs over time we consider time by the year of completion and the year of formal decision to build. According to Flyvbjerg et al. (2003b) “it is better to use year of decision to build rather than year of completion; the latter includes length of implementation phase, which has an influence on cost escalation, causing confounding”. Data on the year of completion is however more evident and hence more reliable. We therefore consider both time variables.
12 Note that the indicated cost overruns in the referred paper differ from the cost overruns presented in this paper due to the
difference in the use of current and constant prices.

78 Cost overruns in large-scale transport infrastructure projects
One project is excluded from the analysis as it was completed in 1970 whereas the other projects were all completed in the period 1991-2009.
Figure 5-2 does not give reason to assume a relation between the year of completion and cost overruns. Based on a regression analysis (F=0.002, p=0.964), we conclude that there is indeed no effect between both variables. For the relation between the year of decision to build and cost overruns (Figure 5-3) we also conclude that there is no statistical significant effect (F=2.486, p=0.119).
Figure 5-2 Cost overruns over time (year of completion)
Figure 5-3 Cost overruns over time (year of decision to build)
To conclude, data showed that cost estimates have not improved over time and we therefore conclude that technical explanation for cost overruns does not fit the data well. These findings are in line with the international research (Flyvbjerg et al. (2003a; 2003b).
Although cost overruns have not improved over time, the problem of cost overruns could have become more or less severe. If, for example, the actual size of projects has changed over the years, the financial consequences in budgetary terms will also differ13. We tested our data for this. We exclude two additional projects because their actual costs are more than €3,000 million whereas the average cost is about €95 million for the other projects. Based on a regression analysis it is concluded that the size of projects have remained the same over the years (linear actual costs: t=0.388, p=0.699; logarithmic actual costs: t=0.561, p=0.576). Thus, the financial consequences at the project level have on average remained the same over the years for each individual project.
In search for a possible explanation for the lack of improvement of cost estimates over time, the large construction fraud that was committed during the tendering for numerous governmental projects in the Netherlands could be considered. This construction fraud came to light in the year 2000, after which projects were set under stricter management. Therefore, if projects that were decided upon before 2000 have higher average cost overruns, building cartels may be an explanation for the large and consistent cost overruns over time. It turns out that the average cost overrun for this group of projects (18.8%) is indeed significantly larger than the average cost overrun for projects that were decided upon from 2000 onwards (-
13 The size of the project concerns here the actual costs, since these are the costs at actual opening.

Chapter 5 – Cost overruns in the Netherlands: ecological fallacy and project phases 79
18.0%) (t=2.013, p=0.048). However, the number of projects completed is considerably lower (7%) than the number of projects completed before the year 2000 (93%).
5.5 Cost overruns during different project phases
This section discusses cost overruns during the project development. Hereby two project phases are distinguished: the pre-construction and the construction phase.
The pre-construction phase is the period between the formal decision to build (ToD) and the start of construction. The construction phase is the period between the start of construction and the year of completion. Only those projects for which data on the essential variables are available are included.
We excluded three projects for which data on the year of construction start were unavailable and fourteen projects for which data on the estimated costs at the time of construction start were unavailable. In some cases, construction started in the same year or even before the formal decision to build was made. These projects do not have an explicit pre-construction phase. The construction phase is then equal to the implementation phase and consequently the costs are in the construction phase the same as in the pre-construction phase: no cost overrun. This would give a distorted picture regarding the phase in which the largest cost overruns take place and these projects were therefore not included in this analysis (24 projects).
To investigate the cost overruns during different phases, data from 37 projects were used. There is no systematic bias regarding these projects with respect to cost overruns (t=0.483, p=0.630, independent sample t-test).
The cost overrun in the pre-construction phase is measured as the estimated costs at the start of construction minus the estimated costs at the ToD expressed as a percentage of the estimated costs at the ToD. The cost overrun in the construction phase is measured as the actual out-turn costs minus the estimated costs at the start of construction expressed as a percentage of the estimated costs at the start of the construction. For both phases the distribution, average and frequency of the overrun are examined.
5.5.1 Cost overruns in the pre-construction phase
Figure 5-4 shows the distribution of cost overruns in the pre-construction phase.

80 Cost overruns in large-scale transport infrastructure projects
Figure 5-4 Distribution of cost overruns in the pre-construction phase
The histogram shows an asymmetric distribution around zero with a larger number of projects with cost overruns. The statistics for the cost overruns in the pre-construction phase are as follows: The range of cost overruns is -39.5% to 112.1% The average cost overrun is 19.7% The standard deviation is 32.6
Three projects have extremely large cost overruns between 90% and 120%. It turns out that for these three projects the problem of cost overrun mainly takes place in the pre-construction phase. One of the projects, for example, was confronted with large delays in the development plan procedures increasing the length of the pre-construction phase and possibly the costs. Large cost overruns in the pre-construction phase suggest that the projects are relatively easy to construct and that the cost overruns are rather the result of a difficult decision-making process or large scope changes.
The main findings regarding the frequency of cost overruns in the pre-construction phase are as follows: In 70% of the projects, estimated costs increased, whereas in 30% of the projects,
estimated costs stayed the same or decreased (p=0.020, binominal test). For the projects with cost overruns, the average overrun is 30.8% (SD=32.5) and for
the projects with cost underruns, the average underrun is 6.5% (SD=11.3) (p=0.002, Mann-Whitney U-test).
Cost overruns are not only more frequent than cost underruns in the pre-construction phase, costs that have been underestimated are inaccurate to a larger extent than costs that have been overestimated.

Chapter 5 – Cost overruns in the Netherlands: ecological fallacy and project phases 81
5.5.2 Cost overruns in the construction phase
Figure 5-5 shows the distribution of cost overruns in the construction phase.
Figure 5-5 Distribution of cost overruns in the construction phase
The histogram of the construction phase shows a rather different distribution of cost overruns than in the pre-construction phase. It is more symmetric but not around zero indicating a difference between the projects with cost overruns and with underruns. The statistics for the cost overruns in the construction phase are as follows: The range of cost overruns is -35.4% to 22.8% The average cost overrun is -4.5% The standard deviation is 14.4
The main findings regarding the frequency of cost overruns in the construction phase are listed below: In 38% of the projects cost overruns occur whereas in 62% of the projects cost
underruns occur (p=0.188, binominal test). For the projects with cost overruns, the average overrun is 9.5% (SD=7.4) and for the
projects with cost underruns, the average cost underrun is 13.1% (SD=10.4) (p=0.347, Mann-Whitney U-test).
5.5.3 Concluding remarks
It can be concluded that the main problem with cost overruns takes place before construction has started. The frequency of cost overruns as well as the average overrun is larger in the pre-construction phase. The average cost overrun in the pre-construction phase is significantly higher than the average overrun in the construction phase (t=-4.118, p=0.000, paired-sample t-test).

82 Cost overruns in large-scale transport infrastructure projects
5.6 Conclusions and discussion
5.6.1 Conclusions
In the Netherlands cost overruns are about as common as cost underruns but the average cost overrun is larger than the average cost underrun. Overall, the average cost overrun is 16.5%. The cost performance in the Netherlands is considerably better than the international cost performance. Using the worldwide findings for individual countries therefore does not give a correct picture of the cost performance and the danger of ecological fallacy is genuine. It should be noted that the average (in this study as well as in the international study) is probably higher as a consequence of lock-in. Due to lock-in the actual decision to build is made earlier in the decision-making process, when estimates are usually lower and this thus results in higher cost overruns.
Although the Dutch study has a considerably smaller time period of about 20 years, compared to the time span of approximately 70 years in the worldwide research, similar to the findings in the worldwide research there was no improvement in cost estimates over time. We can therefore conclude that technical explanations do not seem to be the main reason for cost overruns.
With respect to cost overruns during project development, the problem of cost overruns mainly occurs in the pre-construction phase, the period between the formal decision to build and the start of construction. The probability of cost overruns as well as the average overrun is higher than in the construction phase. Moreover, in the construction phase, most projects involve cost underruns and the average overrun is negative. This may be explained by the different character of the budget at the start of the construction, which is far more fixed than in the earlier stages (allowing less cost increases).
5.6.2 Discussion
This section provides six points of discussion. First of all, this study showed that the cost performance in the Netherlands is different from worldwide findings and that ecological fallacy is really a threat.
The difference could be the result of the applied methodology. Although this research specifically used the same reference point for the estimated costs, that is, the formal decision to build, as the international research, this moment could still be positioned differently in the total decision-making phase as in other countries. It may be possible that in the Netherlands the formal decision to build is usually taken at a later stage in the decision-making process than in other countries. Since cost estimates usually become more accurate over time, due to decreasing uncertainty factors, a decision taken in a later stage results in lower cost overruns.
Secondly, the different cost performance raises the question of whether and to what extent the determinants of cost overrun, e.g. type, size and length of the implementation phase, differ for the Dutch projects compared to the international projects. Thirdly, apart from the different cost performance, the research showed that cost overruns mainly occur in the pre-construction phase. The large difference in cost increase between the pre-construction and construction phase is remarkable. In an attempt to explain this, we have come up with four possible explanations. First of all, it could be the result of misconceived estimates. Over time, project plans become more detailed and costs can be better estimated. Secondly, the essence of the cost estimate changes over time. In the first phases of project development, the estimates are

Chapter 5 – Cost overruns in the Netherlands: ecological fallacy and project phases 83
rough and have an “indicative” character whereas at the start of construction, the estimates are much more detailed and have a more “restrictive” nature that allows fewer adjustments. Thirdly, cost estimates are often optimistic and become more realistic as project plans develop. Since project plans in general change the most during the pre-construction phase, cost increases can be the result of this so-called optimism bias. Fourthly, costs could be kept low deliberately to get the project proposal accepted. After acceptance, the “real” estimates become known or scope changes are introduced (other than functional changes) that involve higher costs. Here, it is often referred to as salami-tactics, deliberately adding scope to the project step by step.
Fourthly, from the study into cost overruns during different project phases, two striking features came to light. The first is the large number of projects where construction started in the same year as the decision to build. This could be the result of the methodology but it is more likely to be the result of lock-in. The informal decision to build must have been taken earlier and preparations had already taken place and procedures had been started that allowed construction to start as soon as the formal decision to build was taken. The second striking feature is the extremely large cost overruns for some projects of 90% to 120% even before construction has started. Even though cancelling the project would probably lead to losses being incurred (missed benefits), the loss is much smaller than if the project is implemented. It is therefore remarkable that these projects are not called off. This can also be explained by lock-in. Decision-makers may have been too committed to the project to reverse their decision and withdraw the project from implementation. It is questioned whether it is desirable to introduce the possibility of pulling back the project from implementation in the period between the decision to build and the start of construction.
To conclude, this study has shown that in order to deal with cost overruns, the main focus should lie in the pre-construction phase (and also in the period before the formal decision to build), at least in the Netherlands. Furthermore, measures could be taken to control strategic misrepresentation and optimism bias (for such measures the reader is referred to Flyvbjerg et al. 2003a).
5.7 Areas for further research
This study was based on data from 78 projects and this was the best obtainable data within our research set, but further efforts to enlarge the database should be made. In addition, there are several important issues that need to be addressed in subsequent research. First of all, more insight should be obtained into the determinants of cost overruns for Dutch transport infrastructure projects. International research has shown that project type matters and cost overruns occur for all project sizes. However, since the project performance in the Dutch study differs from the worldwide research we cannot use these findings and apply them in our understanding of cost overruns in the Netherlands. Secondly, because of the danger of ecological fallacy it is necessary to make a systematic comparison and conduct specific tests to conclude whether the differences between Dutch transport infrastructure projects and those worldwide are statistically significant. Thirdly, this research has shown that projects are more prone to cost overruns in the pre-construction phase than in the construction phase. A related topic for further research is to investigate how the lengths of these phases correlate with cost overruns in the respective phases. We will explore these subjects, the determinants, the statistical significance of the difference between the Dutch and international findings, and the lengths of the project phases, in subsequent papers.

84 Cost overruns in large-scale transport infrastructure projects
We conclude with two areas for further research, which both require additional data collection. First of all, it would be useful to consider the cost overruns for different project phases for other countries as well. This would give insight into whether it is common for projects to have the largest cost increase in the pre-construction phase or whether this is a specific feature of Dutch transport infrastructure projects. Differences in the decision-making procedures between countries should be taken into account when drawing conclusions. Secondly, although we recognise that it is very difficult to establish the time of the informal decision to build, more research is needed into this area as it considerably influences the extent of cost overruns.
Acknowledgement
The authors thank the Dutch Ministry of Infrastructure and the Environment, including RWS and KiM for their support in data collection. Further, the authors thank various other institutes who provided us with valuable data of projects. The research was supported by the Dutch Ministry of Infrastructure and the Environment.
References
Bordat, C., B.G. McCullouch, S. Labi and K.C. Sinha (2004) An analysis of cost overruns and time delays of INDOT projects. Publication no. FHWA/IN/JTRP-2004/7, SPR-2811, Transportation Research Board, Washington D.C.
Bouwkostencompas, http://www.bouwkostenkompas.nl, consulted May 2010
Cantarelli, C.C., B. Flyvbjerg, B. van Wee and E.J.E. Molin (2009) Lock-in and its influence on the project performance of large-scale transportation infrastructure projects. Investigating the way in which lock-in can emerge and affect cost overruns. Paper presented at the 88th annual meeting of the Transportation Research Board, Washington, D.C.
Capka, J.R. (2004) Megaprojects – They are a different breed, in: Public Roads, 68(1).
Dantata, N.A., A. Touran, and D.C. Schneck. (2006) Trends in US Rail Transit Project Cost Overrun. Paper presented at the 85th meeting of the Transportation Research Board, Washington, D.C.
Ellis, R., J.H. Pyeon, Z. Herbsman, E. Minchin and K. Molenaer (2007) Evaluation of alternative contracting techniques on FDOT construction projects, Florida Department of Transportation, Tallahassee.
Flyvbjerg, B. (2007) Cost overruns and demand shortfalls in urban rail and other infrastructure, in: Transportation Planning and Technology, 3(1), pp. 9-30.
Flyvbjerg, B., M.K. Skamris Holm and S.L. Buhl (2002) Underestimating cost in public works. Error or Lie?, in: Journal of the American Planning Association, 68 (3), pp. 279-295.
Flyvbjerg, B., N. Bruzelius and W. Rothengatter (2003a) Megaprojects and Risk: An Anatomy of Ambition, Cambridge, Cambridge University Press.
Flyvbjerg, B., M.K. Skamris Holm and S.L. Buhl (2003b) How Common and How Large Are Cost Overruns in Transport Infrastructure Projects?, in: Transport Reviews, 23(1), pp. 71-88.
Flyvbjerg, B., M.K. Skamris Holm and S.L. Buhl (2004) What Causes Cost Overrun in Transport Infrastructure Projects?, in: Transport Reviews, 24 (1), pp. 3-18.

Chapter 5 – Cost overruns in the Netherlands: ecological fallacy and project phases 85
Lee, L. (2008) Cost Overrun and Cause in Korean Social Overhead Capital Projects: Roads, Rails, Airports, and Ports, in: Journal of Urban Planning and Development, 134 (2), pp. 59-62.
Merewitz, L. (1973) How do urban rapid transit projects compare in cost estimating experience? Proceedings of the International Conference on Transportation Research. First Conference. Reprint no. 104, pp. 483-493, Bruges, Belgium.
Ministry of Transport, Public Works and Water Management (1985-2009), MIT/MIRT Projectenboek (1985-2009), SDU Uitgevers, Den Haag.
Morris, S. (1990) Cost and Time Overruns in Public Sector Projects, in: Economic and Political Weekly, 15(47), pp. 154-168.
Nederlandse Bruggen Stichting, Bruggen Database NBS. http://bruggenstichting.nl, consulted January 2010
Nijkamp, P. and B. Ubbels (1999) How Reliable are Estimates of Infrastructure Costs? A Comparative Analysis, in: International Journal of Transport Economics, 26(1), pp. 23-53.
Odeck, J. (2004) Cost overruns in road construction – what are their sizes and determinants?, in: Transport Policy, 11(1), pp. 43–53.
Pickrell, D.H. (1990) Urban rail transit projects: forecasts versus actual ridership and cost, US Department of Transportation, Washington D.C.
Pickrell, D. (1992) A Desire Named Streetcar: Fantasy and Fact in Rail Transit Planning, in: Journal of the American Planning Association, 58(2), pp. 158-176.
Siemiatycki, M. (2009) Academics and Auditors: Comparing Perspectives on Transportation Project Cost Overruns, in: Journal of Planning Education and Research, 29 (2), pp. 142-156.
Structurae. http://en.structurae.de, consulted December 2008
Van Wee, B. (2007) Large infrastructure projects: a review of the quality of demand forecasts and cost estimations, in: Environment and Planning B: Planning and Design, 34 (4), pp. 611-625.

86 Cost overruns in large-scale transport infrastructure projects

87
6. Determinants of cost overruns of infrastructure projects in the Netherlands Cantarelli, C.C., Wee, B. van, Molin, E.J.E, and Flyvbjerg, B. Different cost performance: different determinants? The case of cost overruns in Dutch transport infrastructure projects. Conditionally accepted for publication in Transport Policy.
Abstract Cost overruns of Dutch transport infrastructure are substantially lower than that in other countries. This paper examines three independent variables and their relation with cost overrun to decide whether this is different for Dutch infrastructure projects compared to worldwide findings as well. The three variables are project type (road, rail, and fixed link projects), project size (measured in terms of estimated costs) and the length of the project implementation phase. For Dutch projects, average cost overrun is 10.6% for rail, 18.8% for roads and 21.7% for fixed links. This is the opposite of worldwide findings where rail has the largest overrun. For project size, small Dutch projects have the largest average percentage cost overruns but in terms of total overrun, large projects have a larger share. Worldwide research showed that cost overruns are large for all project sizes. The length of the implementation phase and especially the length of the pre-construction phase are important determinants of cost overruns in the Netherlands. With each additional year of pre-construction, percentage cost overrun increases by five percentage points. In contrast, the length of the construction phase has hardly any influence on cost overruns. This narrows down the period in which projects are most prone to cost overruns considerably, at least in the Netherlands. Regarding the three determinants, it was again concluded that Dutch projects perform differently compared to the worldwide pattern, showing again the occurrence of ecological fallacy. It is therefore important to consider individual countries and to compare countries.

88 Cost overruns in large-scale transport infrastructure projects
6.1 Introduction
Time and again, even during implementation, prevailing cost increases come to light in large-scale transport infrastructure projects. By the time of opening, the calculated cost overruns are enormous. That these cost overruns are a severe problem has been shown in previous studies. Cost overruns are not only more common than cost underruns (negative overrun) (Flyvbjerg et al., 2003a, 2003b; Merewitz, 1973; Pickrell, 1992; Odeck, 2004; Nijkamp and Ubbels, 1999), but the magnitude of these overruns is also considerably higher than that of underruns (Flyvbjerg et al., 2003b). In addition, estimates of costs have not improved over the past 70 years, implying that lessons have not been learned (Flyvbjerg et al. (2003b).
However, from a first study on the cost performance of Dutch transport infrastructure projects (Cantarelli et al., forthcoming) a rather different picture emerged. The main findings were as follows: Cost overruns are not predominant but are as common as cost underruns. The average cost overrun is considerably smaller than worldwide findings with an
average of 16.5% (SD=40.0) Cost estimates have not improved over time either.
These findings immediately raise various questions; whether the Netherlands should be taken as an example and what can be learned, what could explain the low average cost overrun, and why the cost estimates have not improved, to name a few. With the current knowledge, it is too early to draw firmer conclusions regarding the cost performance in the Netherlands than that it is considerably different from other countries. We need to dig deeper and investigate the Dutch transport infrastructure projects further to understand them better and to explain the differences. There are various determinants of cost overruns that could be considered in this respect. We will consider three of these determinants, i.e. project type, project size and the implementation phase. These determinants have been addressed in previous studies into cost overruns and seem to be the most important in understanding cost overruns. Some first expectations about these variables are described below.
Cost performance usually differs between project types, with typically the largest cost overruns incurred for rail projects and more reserved overruns for road projects (Flyvbjerg, 2003b; Merewitz; 1973, Morris, 1990) (with the exception of the findings in the study by the Auditor General of Sweden, found in Odeck, 2004). However, the Dutch database includes more road projects than rail (and fixed link) projects, which could be an indicator for the smaller average cost overrun.
Much less consensus exists with respect to the impact of project size. We define project size, in line with standard convention, in terms of estimated costs. Odeck (2004) reported that “cost overruns appear to be more predominant among smaller projects as compared to larger ones”, whereas Flyvbjerg et al. (2004) found that “…the risk of cost escalation is high for all project sizes…”.
Compared to project type and project size, the length of the implementation phase is to a lesser extent addressed in previous studies but it turns out to be an essential predictor of cost overruns. According to Flyvbjerg et al. (2004) it is even more vital than project type: “if information on implementation duration is given, project type is not important”. This paper examines whether the length of the implementation phase is also an important predictor for cost overruns and how the relation with cost overruns can be described. In addition, in line with the previous paper on cost overruns in the Netherlands, a distinction is made between the pre-construction phase and the construction phase.

Chapter 6 – Determinants of cost overruns of infrastructure projects in the Netherlands 89
To summarise, this paper aims to investigate whether project type, project size and the implementation phase are also relevant for the variance in cost overruns in the Netherlands and whether these variables can explain the differences in cost performance between the Netherlands and worldwide. More specifically, this paper aims to answer the following three research questions: 1. To what extent is the cost performance different for different types of transport infrastructure projects? 2. What is the relation between project size and cost overruns? 3. To what extent does the length of the implementation phase influence the cost performance? For each of these questions the results are compared with the worldwide findings.
The remainder of this paper will answer these questions, each question in a separate section, sections 3 to 5 respectively, after the methodology is described in section 2. Section 6 draws the main conclusions and discussions and finally section 7 describes areas for further research.
6.2 Methodology
For a full description of the project selection, data collection and methodology we refer to Cantarelli et al. (forthcoming) which is a companion paper to the present paper14. In this section we will exemplify those parts of the methodology that are specifically related to the topics in this paper. It concerns the definition of the implementation phase, pre-construction phase and the construction phase and the related data collection.
In line with Flyvbjerg et al. (2004) we define the implementation phase as the period from the year of the formal decision to build (ToD) until the construction is completed and operations have begun. Data about the year in which operations have begun (here referred to as the actual opening year) is therefore required. However, for projects that were based on the MIRT documentation, data on this actual opening year were unavailable and an assumption had to be adopted. For projects for which the year of opening is indicated in the MIRT, the assumption was established by comparing the year of opening with the last year in which costs were provided in the MIRT. It turned out that, on average, the actual opening year was one year (road projects) or one and a half years (rail projects) before the last year for which costs were indicated in the MIRT. Resulting from these findings we assume that the actual opening year for road projects is one year and for rail projects one and a half years before the last year for which costs were indicated in the MIRT. These assumptions are considered fairly reasonable since the MIRT is prepared one year before it is published (MIRT 2004 is set up in September 2003).
The implementation phase is split into two phases: the pre-construction phase and the construction phase. The pre-construction phase is the period between the ToD and the start of construction. The construction phase is the period between the start of construction and the year in which the project is completed and operation has begun. The cost overrun in the pre-construction phase is measured as the estimated costs at the start of construction minus the estimated costs at the ToD expressed as a percentage of the estimated costs at the ToD. The cost overrun in the construction phase is measured as the actual out-turn costs minus the estimated costs at the start of construction expressed as a percentage of the estimated costs at the start of the construction.
14 The full methodological elucidation is included in the Appendix of this PhD Thesis
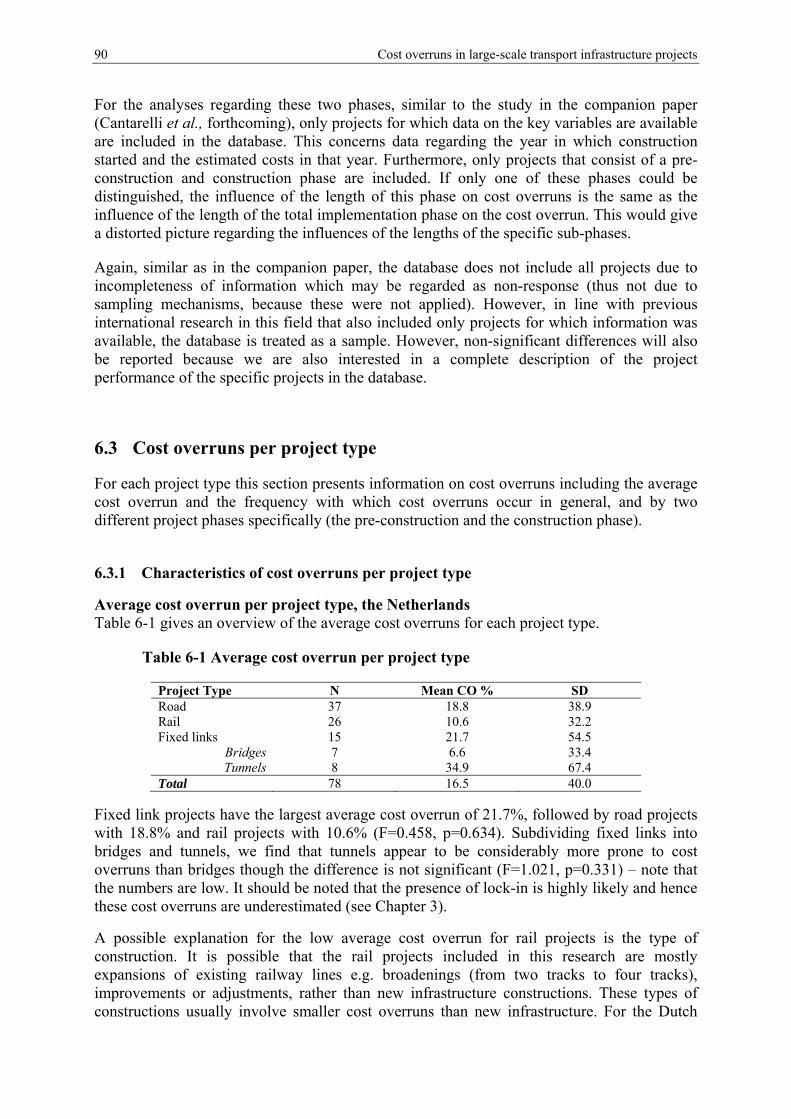
90 Cost overruns in large-scale transport infrastructure projects
For the analyses regarding these two phases, similar to the study in the companion paper (Cantarelli et al., forthcoming), only projects for which data on the key variables are available are included in the database. This concerns data regarding the year in which construction started and the estimated costs in that year. Furthermore, only projects that consist of a pre-construction and construction phase are included. If only one of these phases could be distinguished, the influence of the length of this phase on cost overruns is the same as the influence of the length of the total implementation phase on the cost overrun. This would give a distorted picture regarding the influences of the lengths of the specific sub-phases.
Again, similar as in the companion paper, the database does not include all projects due to incompleteness of information which may be regarded as non-response (thus not due to sampling mechanisms, because these were not applied). However, in line with previous international research in this field that also included only projects for which information was available, the database is treated as a sample. However, non-significant differences will also be reported because we are also interested in a complete description of the project performance of the specific projects in the database.
6.3 Cost overruns per project type
For each project type this section presents information on cost overruns including the average cost overrun and the frequency with which cost overruns occur in general, and by two different project phases specifically (the pre-construction and the construction phase).
6.3.1 Characteristics of cost overruns per project type
Average cost overrun per project type, the Netherlands Table 6-1 gives an overview of the average cost overruns for each project type.
Table 6-1 Average cost overrun per project type
Project Type N Mean CO % SD Road 37 18.8 38.9 Rail 26 10.6 32.2 Fixed links 15 21.7 54.5
Bridges 7 6.6 33.4 Tunnels 8 34.9 67.4
Total 78 16.5 40.0
Fixed link projects have the largest average cost overrun of 21.7%, followed by road projects with 18.8% and rail projects with 10.6% (F=0.458, p=0.634). Subdividing fixed links into bridges and tunnels, we find that tunnels appear to be considerably more prone to cost overruns than bridges though the difference is not significant (F=1.021, p=0.331) – note that the numbers are low. It should be noted that the presence of lock-in is highly likely and hence these cost overruns are underestimated (see Chapter 3).
A possible explanation for the low average cost overrun for rail projects is the type of construction. It is possible that the rail projects included in this research are mostly expansions of existing railway lines e.g. broadenings (from two tracks to four tracks), improvements or adjustments, rather than new infrastructure constructions. These types of constructions usually involve smaller cost overruns than new infrastructure. For the Dutch

Chapter 6 – Determinants of cost overruns of infrastructure projects in the Netherlands 91
data the average cost overrun for the projects (road, rail, fixed links) that concerned expansions of existing infrastructure was indeed 9.2% lower (SD=34.0) than the average of 20.9% (SD=42.9) for the projects concerned with the construction of new infrastructure (t=1.256, p=0.213, independent sample t-test). This does not only apply for all projects together but also for road and rail projects separately. However, the share of projects which expand existing infrastructure in rail projects is not higher than for road projects. The type of construction cannot therefore explain the difference in average cost overrun between these project types. Organisational set-up and institutional settings may account for the difference between the project types – ProRail is project owner for rail projects and RWS for road projects.
The relatively low cost overruns of Dutch rail projects compared to worldwide rail projects may be explained by the type of rail projects. Dutch rail projects mainly concern heavy rail whereas the worldwide research also concerns light rail, a type of rail that typically involves much higher cost overruns.
As the number of tunnel and bridge projects is considerably smaller compared to the number of road or rail projects and since analyses based on a small number of projects are much more vulnerable to extreme scores, tunnels and bridges are taken as one category called fixed links in the remainder of this paper. The subdivision will thus be based on 3 project types: road, rail and fixed link projects.
Frequency of cost overruns per project type Table 6-2 presents the frequency by which cost underruns (left side) and cost overruns (right side) occur.
Table 6-2 Number of projects with cost underrun and overrun (in percentage and number) and their averages), the Netherlands
Project Type Number of projects with cost underrun
Number of projects with cost overrun
Mean Cost underrun %
(SD)
Mean Cost overrun % (SD) (%) (#) (%) (#)
Road 37.8 14 62.2 23 14.3 (12.7) 38.7 (35.6) Rail 50.0 13 50.0 13 13.1 (8.8) 34.2 (29.4) Fixed links 53.3 8 46.7 7 14.4 (10.1) 62.9 (55.5) Total 44.9 35 55.1 43 13.9 (10.5) 41.3 (38.1)
Overall and for road projects individually, cost overruns are more common than cost underruns (p=0.428 and p=0.188 respectively, binomial test).
The magnitude of cost overruns (41%) is higher than that of cost underruns (14%) (p=0.000, Mann-Whitney U-test). This also applies for the project types individually (p=0.009, p=0.06, and p=0.011 for road, rail and fixed link projects respectively, Mann-Whitney U-test). The average cost underrun is similar between project types with an underrun of about 14% (p=0.948, Anova). The average cost overrun is similar between road and rail projects but almost twice as large for fixed link projects (though the averages between the project types is not statistically significant, p=0.249). Remarkably, fixed links have the lowest frequency of cost overruns, but the average cost overrun is largest.
Table 3 shows the frequencies and the magnitudes of cost underruns and cost overruns in more detail. It shows for projects with cost underruns as well as for projects with cost overruns the number of projects, the percentage of projects and the cumulative percentage in categories of under- or overruns.

92 Cost overruns in large-scale transport infrastructure projects
Table 6-3 Frequencies of cost underruns and overruns broken down in different categories of underrun and overrun a, the Netherlands
Road Rail Fixed links Total Underruns # % ∑ % # % ∑ % # % ∑ % # % ∑ % -60 to -40 1 2.7 2.7 0 0.0 0.0 0 0.0 0.0 1 1.3 1.3 -40 to -20 3 8.1 10.8 3 11.5 11.5 2 13.3 13.3 8 10.3 11.5 -20 to 0 10 27.0 37.8 10 38.5 50.0 6 40.0 53.3 26 33.3 44.9 Overruns # % ∑ % # % ∑ % # % ∑ % # % ∑ % 0 to 20 8 21.6 59.4 6 23.1 73.1 1 6.7 60.0 15 19.2 64.1 20 to 40 7 18.9 78.3 2 7.7 80.8 3 20.0 80.0 12 15.4 79.5 40 to 60 4 10.8 89.1 3 11.5 92.3 0 0.0 80.0 7 9.0 88.5 60 to 80 1 2.7 91.8 0 0.0 92.3 1 6.7 86.7 2 2.6 91.1 80 to 100 1 2.7 94.5 2 7.7 100.0 0 0.0 86.7 3 3.9 95.0 100 to 120 1 2.7 97.2 0 0.0 100.0 1 6.7 93.4 2 2.6 97.6 120 to 140 1 2.7 100.0 0 0.0 100.0 0 0.0 93.4 1 1.3 98.9 140 to 160 0 0.0 93.4 0 0.0 98.9 a In which #=number of projects, %=percentage of projects, ∑%=cumulative percentage of projects
Striking for projects with cost underruns is that most projects fall within the category of a cost underrun of between -20% and 0%, which applies for all project types. Likewise for cost overruns, there is a large share of projects that fall in the category of the smallest cost overruns of 0% to 20%. However, there is also a considerable number of projects that fall in the higher categories of cost overruns.
6.3.2 Cost overruns in the pre-construction and construction phase
Overall, the main problem with cost overruns lies in the pre-construction phase but this does not necessarily mean that this also applies for each project type. Table 4 indicates the cost overruns in the pre-construction and in the construction phase for each project type specifically. It presents the frequency by which cost underruns and cost overruns occur and the respective average underrun and overrun. The figures for fixed link projects should be interpreted with reservation since the number of projects is small.
Table 6-4 Average cost underrun and overrun in the pre-construction and construction phase per project type b, the Netherlands
Cost overrun in the pre-construction phase Cost overrun in the construction phase Project type
N Mean SD Freq. CU
CU (%)
Freq. CO
CO (%)
Mean SD Freq. CU
CU (%)
Freq. CO
CO (%)
Road 23 17.6 33.5 21.7 12.4 78.3 26.0 -2.9 15.2 52.2 13.7 47.8 8.9
Rail 11 21.5 33.1 45.5 2.0 54.5 41.0 -6.9 14.2 81.8 12.0 18.2 16.0
Fixed links 3 29.0 33.7 33.3 0.0 66.7 43.5 -8.5 10.1 66.7 14.1 33.3 2.7
Total 37 19.7 32.6 29.7 6.5 70.3 30.8 -4.5 14.4 62.2 13.1 37.8 9.5 b In which CU= cost underrun and CO=cost overrun
Considering the pre-construction phase, the main findings are as follows: The average cost overrun is largest for fixed link projects and smallest for road
projects (p=0.840, F=0.176, One way Anova). Cost overruns are more common than cost underruns for all project types. The
difference in the frequency of cost overruns compared with cost underruns is only significant for road projects (p=0.011, binominal test).
For projects with cost overruns, fixed link projects have the largest average cost overrun (43.5%), followed by rail projects (41.0%) (F=0.631, p=0.541, One way

Chapter 6 – Determinants of cost overruns of infrastructure projects in the Netherlands 93
Anova). For projects with cost underruns, rail projects have the largest underrun (12.4%; F=1.319, p=0.320, One way Anova).
For all project types, the average cost overrun is considerably higher than the average cost underrun. For rail projects, the difference is significant (p=0.011, Mann-Whitney U-test).
The frequency of cost overruns is highest for road projects, although the average overrun is the smallest. In contrast, the frequency of cost underruns for road projects is the smallest, but the average underrun is the largest.
Considering the construction phase, the main findings are as follows: All project types involve on average cost underruns in the construction phase. The
average cost underrun is largest for fixed link projects and smallest for rail projects (F=0.400, p=0.673, One-way Anova).
For all project types, cost underruns are more common than cost overruns (though not statistically significant, p>0.05 for all project types, binominal tests).
For projects with cost overruns, rail projects have the largest average cost overrun (F=1.253, p=0.323, One way Anova). For projects with cost underruns, fixed link projects have the largest underrun (F=0.071, p=0.932, One way Anova).
With the exception of rail projects, cost underruns are larger than cost overruns (p=0.424 and p=0.221 for road and fixed links respectively, Mann-Whitney U-test).
The frequency of cost underruns is the highest for rail projects, but the average underrun is the smallest. The frequency of cost overruns for rail projects is the smallest, but the average overrun is the largest.
To summarise, in the pre-construction phase all project types involved cost overruns and in the construction phase projects involved cost underruns. With the exception of fixed link projects, the average cost overrun in the pre-construction phase is significantly higher than the average cost underrun in the construction phase (p=0.011 and p=0.034 for road and rail projects respectively, Paired-sample T-test). It appears that the cost performances in both phases are of a different nature and project types also perform differently in both phases.
6.4 Project size
Project size will be examined in this study in two ways; as an ordinal and scale variable. First of all, projects are often categorised as small, medium, large or very large projects and then the differences in the average percentage cost overrun between these groups of projects is determined. Secondly, as a scale variable, the influence of project size on the extent of the cost overruns is examined and how this effect can be described. These two subjects will be addressed in sections 3.1 and 3.2 respectively.
Two projects were considered statistical outliers and are excluded from the analyses. Both projects had estimated costs of more than € 3000 million whereas the average project size for the other projects was € 86 million (SD=98). These projects are the Betuweroute and HSL-South, two recently implemented rail projects that are also different from the other projects in the database in terms of their length (160 km and 125 km respectively, compared to the average length of the other projects of 5 km).

94 Cost overruns in large-scale transport infrastructure projects
6.4.1 Cost overruns for small, medium, large and very large transport infrastructure projects
Small, medium, large and very large transport infrastructure projects were defined by the cost limits that were used in the MIRT of €112.5 and €225 million. The MIRT (Meerjarenprogramma Infrastructuur, Ruimte en Transport, translated as the Multi-year programme for infrastructure, spatial planning and transport15) is the implementation programme related to the policy of ‘mobility and water’, and is part of the budget of the infrastructure fund of the Ministry of Infrastructure and the Environment. These two cost limits result in three categories with the category including the smallest projects representing almost 75% of all projects. Because of its high share we split this category into two groups by introducing a third cost limit of €50 million (again half the cost of the first limit of €112.5 million). The distribution of the projects regarding project size is than as follows:
Small < € 50 million: 35 Medium € 50 - <112.5 million: 23 Large € 112.5 - <225 million: 12 Very large > € 225 million: 6
Possible differences between the four groups in average cost overruns could be caused by the way in which the formation of the groups was based on the cost limits of the MIRT. The relation between project size and cost overruns was therefore considered in a second way i.e. by dividing the projects into groups with an equal number of projects in each group. This resulted in the following distribution of projects:
Small < € 20.4 million: 19 Medium € 20.4 - < € 56 million: 19 Large € 56 - < € 100 million: 19 Very large > € 100 million: 19
Table 6-5 presents, for both categorisations, the statistics on cost overruns broken down by project size and project type. The statistics include the number of projects, the percentage of projects, the average percentage overrun and standard deviation and the net total overrun in percentages (absolute cost overrun). This absolute cost overrun is the overrun in million euros expressed as a percentage of the total overrun in million euros.
15 The translation of the MIRT in English is based on:
http://www.verkeerenwaterstaat.nl/english/topics/water/delta_programme/rules_and_framework_of_the_mirt (consulted 20-03-2010)

Chapter 6 – Determinants of cost overruns of infrastructure projects in the Netherlands 95
Table 6-5 Cost overruns broken down by project size (estimated costs in € in 1995) and project type c, the Netherlands
Project size
Project type
MIRT Categorisation Equal groups categorisation # % Mean
CO % SD % of
CO # % Mean
CO % SD % of
CO Small Road 19 25.0 21.5 39.7 8.5 13 17.1 29.0 43.4 5.7 Rail 10 13.2 8.4 35.2 2.7 4 5.3 16.1 46.9 1.9 Fixed links 6 7.9 46.7 79.5 13.1 2 2.6 26.1 50.5 0.4 Total 35 46.1 22.1 47.5 24.3 19 25.0 26.0 42.4 8.0 Medium Road 13 17.1 16.1 42.0 19.0 8 10.5 -1.2 27.1 -0.4 Rail 8 10.5 15.0 31.7 13.8 6 7.9 3.2 28.7 0.8 Fixed links 2 2.6 -14.1 4.0 -2.5 5 6.6 43.3 88.7 11.9 Total 23 30.3 13.1 36.8 30.3 19 25.0 11.9 51.4 12.3 Large Road 5 6.6 14.5 33.3 15.2 11 14.5 22.7 41.6 22.2 Rail 3 3.9 -17.2 10.6 -10.9 7 9.2 16.0 34.1 12.5 Fixed links 4 5.3 18.0 18.1 18.5 1 1.3 -17.0 . -1.6 Total 12 15.8 7.7 27.2 22.9 19 25.0 18.1 37.8 33.0 Very large Road 0 0.0 . . 0.0 5 6.6 14.5 33.3 15.2 Rail 3 3.9 21.5 36.2 24.5 7 9.2 3.1 29.2 14.9 Fixed links 3 3.9 0.5 24.6 -1.9 7 9.2 10.5 21.3 9.3 Total 6 7.9 11.0 30.0 22.5 19 25.0 8.8 26.6 46.7
c In which: #= the number of projects in the category, %=the percentage of projects in the category, Mean CO (%)= the average percentage cost overrun of this category, SD=standard deviation, % of CO= the absolute overrun as a percentage for the specific category .
Cost overruns and project size overall In the MIRT categorisation, the majority of the projects are classified as “small projects” with total estimated costs equal to or less than € 50 million. These projects represent about 46.1% of all projects and have the largest average percentage cost overrun of 22.1% (F=1.065, p=0.370, univariate analysis of variance). In terms of total net overrun as a percentage, “small projects” are responsible for a large share (24.3%) of the total overrun, although the other categories are not very different.
For the categorisation that was based on an equal number of projects in each group, “small projects” were also identified as the category of projects with the largest average percentage cost overrun with 26% (F=0.351, p=0.789, univariate analysis of variance). However, in terms of net total overrun in percentage (absolute cost overrun), they have the smallest share of overrun and “very large projects” represent the largest part of the overrun with 46.7%.
Independent of the categorisation, the average percentage cost overrun is largest for the category representing “small projects”. Moreover, the average percentage cost overrun for “small projects” in the second categorisation (which includes smaller projects than the “small projects” in the first categorisation) is even higher than that of the first categorisation, suggesting that relative cost overruns decrease with an increase in project size.
Cost overruns and project size for different project types In contrast to the overall findings described above, for the project type rail, “very large projects” have the largest average cost overrun (21.5%) in the MIRT categorisation (though, the average cost overrun is not significantly different for project size (F=1.065, p=0.370) or project type (F=0.362, p=0.698), univariate analysis of variance). When the categorisation, based on an equal number of projects in each group, is considered, again only one project type, fixed link projects, perform differently from the overall results. For these projects, the

96 Cost overruns in large-scale transport infrastructure projects
conclusion that small projects have the largest average cost overrun does not hold. Regarding the net total overrun as a percentage (absolute cost overrun), the group of projects with the largest share differs between the project types for both types of categorisation.
Overall, small projects have relative larger cost overruns but in terms of absolute overrun, larger projects are more problematic. For project types individually overruns are problematic for all project sizes. The next section will further address the relation between project size and cost overruns by statistical analysis.
6.4.2 Project size as a predictor for cost overruns
This section will determine, based on a regression analysis, whether project size influences the extent of cost overruns and if so, how this effect can be described. A linear or logarithmic relation between project size and cost overruns is often assumed in literature. The logarithmic relationship provided a slightly better fit for the Dutch data, although the logarithmic coefficient for the model was not statistically significant either (p=0.126). The simpler model is therefore preferred – cost overruns are considered to be linearly dependent on project size.
Figure 6-1 shows the plot of percentage cost overruns against project size including the regression line for all projects (solid line) as well as the regression lines for the three project types separately (dotted lines).
Figure 6-1 Estimated costs and cost overruns (76 projects)
The regression line for cost overrun (%) for all project types is: 0CC *05.069.20 , where C0 is
the estimated costs of the project (€ in 1995) Cost overruns decrease with project size; for each additional million Euros that a project costs, the cost overruns decrease by 0.05% (t=-1.095, p=0.277, R2=0.016). Considering the small scope and the low explained variance, we conclude that cost overruns weakly depend on project size
One fixed link project with considerably higher estimated costs (€ 577 million) compared to the average (€ 159 million for fixed links project (SD=150)) could be considered a statistical

Chapter 6 – Determinants of cost overruns of infrastructure projects in the Netherlands 97
outlier. However, excluding the project from the analysis alters the results only slightly (slope=-0.062, t=-1.050, p=0.0297, R2=0.015).
Considering all the projects together there is no significant relation between project size and the level of cost overruns. However, from figure 1 it can be seen that, especially for fixed link projects, there is a tendency towards smaller cost overruns for larger projects. The relation between the project size and cost overruns was therefore also tested for each project type individually.
The regression equations are as follows:
0CRoad C *09.090.23 , t=-0.777, p=0.443, R2=0.017
0CRail C *002.090.8 , t=0.019, p=0.985, R2=0.000
0Clinks Fixed C *08.032.33 t=-0.868, p=0.401, R2=0.055
It turns out that for road and fixed link projects, the same conclusion holds as for all projects; relative cost overruns decrease with project size. In contrast, for rail projects, relative cost overruns increase with project size but the effect is negligible (0.002%). In addition, for the specific projects that are included in the database, the small slope and the low explained variance of project size shows that cost overruns are only slightly dependent on project size.
6.5 Implementation phase
One of the main predictors of cost overruns worldwide is the length of the implementation phase. Based on a regression analysis this section examines whether this is also the case for Dutch transport infrastructure projects.
The previous study showed that the main cost overruns occur in the pre-construction phase. The cost overruns in the construction phase are considerably smaller. This section will therefore also consider the lengths of the pre-construction and construction phase and their relation with cost overruns separately.
6.5.1 Cost overruns for different lengths of the implementation phase
Section 3 showed that fixed link projects have the largest average cost overrun and rail projects have the smallest average overrun. It turns out that the average length of the implementation phase is also largest for fixed link projects (9.2 years, SD=3.2) followed by road projects (7.3 years, SD=3.1) and rail projects (6.5 years, SD=2.3). The length of the implementation phase is statistically different between the three project types (p=0.017). Considering these findings, we expect a positive relationship between the implementation phase and cost overruns. This was tested in more detail by a regression analysis. Since the literature had also assumed a quadratic relationship (Odeck, 2004), the data was tested for this non-linear relationship as well. However, the quadratic relationship resulted in only a slightly better fit and the coefficient of the quadratic component was not statistically significant (p=0.139). The linear relation is therefore preferred and the remainder of this section will address this linear relationship.
Figure 6-2 gives a plot of the cost overrun against the length of the implementation phase for all projects (solid line) and for road, rail and fixed link projects specifically (dotted lines).

98 Cost overruns in large-scale transport infrastructure projects
Figure 6-2 Length of the implementation phase and cost overruns (78 projects)
The regression line for all projects is: TC * 74.315.11 , where C is the cost overrun (as a % of constant prices) and T is the length of the implementation phase of the project. For each additional year of the implementation phase, cost overruns increase by 3.74% (t=2.533, p=0.013). The explained variance of cost overruns by implementation phase is, however, low (R2 =0.078).
Also regression analyses were carried out for the project types individually, whereby linear and quadratic relations were tested, and the preference was given to the linear models. Based on the plot in Figure 6-2, it can be seen that all project types have a positive relation between the length of the implementation phase and relative cost overruns. The regression equations for road, rail and fixed link projects are as follows:
TRoad C * 72.116.6 , p=0.422, R2 = 0.019 TRail C * 99.296.8 , p=0.293, R2 = 0.046
TLinks Fixed C * 39.990.64 , p=0.036, R2 =0.297
The length of the implementation phase is an important predictor for cost overruns especially for fixed links as this type of project has the largest slope (indicating the largest increase in cost overruns for each additional year of implementation) and the largest explained variance. Although there are no outliers that influence the outcomes, Figure 6-2 shows that the individual values have a large spread around the regression line.
Delay The implementation phase possibly includes delays. Delay is, at least in the Netherlands, often assumed to be a main predictor of cost overruns. As a delay results in a longer implementation phase and cost overruns increase with each additional year of the implementation phase, it is expected that delays would also influence cost overruns. The average length of the implementation phase for projects with delays is indeed larger (7.7 years) than the average length for projects that were completed on time (6.5 years, t=-1.449, p=0.151, independent sample t-test). The average cost overrun for projects with delays is also larger (18.5% compared to 10.0%) but the difference is not statistically significant (t=-0.787,

Chapter 6 – Determinants of cost overruns of infrastructure projects in the Netherlands 99
p=0.434, independent sample t-test). With a coefficient that is similar to that of the variable length of the implementation phase (3.55, t=1.119, p=0.168) and a lower explained variance of 0.021, it is not the delay but the length of the implementation phase that is the better predictor of cost overruns.
6.5.2 Cost overruns for different lengths of the pre-construction and construction phase
Similar to the analyses of the length of the implementation phase, the analyses regarding the length of the pre-construction and construction phase start by comparing the lengths of these phases between different project types. Combining these findings with the average cost overrun of the project types, a first indication is obtained about the relation between the lengths of the pre-construction or construction phases and cost overruns.
The predictors pre-construction and construction phase are compared for all projects before each project type is considered in detail.
Comparison between the length of the pre-construction phase and construction phase The average length of the pre-construction phase is 3.0 years (SD=2.2) which is significantly shorter than the average length of the construction phase (4.8 years, SD=2.6, t=-3.364, p=0.001, paired sample t-test). Also for each of the project types, the pre-construction phase is shorter than the construction phase with average differences of 0.8 years for road (t=1.162, p=0.257), 4.2 years for rail (t=6.729, p=0.000) and 1.2 years for fixed links (t=0.943, p=0.364) (all paired sample t-tests).
Considering the larger cost overruns in the pre-construction phase compared to the cost overruns in the construction phase, it is expected that the length of the pre-construction phase is more strongly related to cost overruns than the length of the construction phase.
Pre-construction phase Rail projects have the shortest pre-construction phase length (an average of 1.4 years, SD=0.8), followed by road projects (3.4 years, SD=2.2) and fixed link projects (3.7 years, SD=2.6, p=0.009). Fixed links also have the largest average cost overruns and we therefore assume a positive relationship between the length of the pre-construction phase and the cost overrun. By means of a regression analysis, this relation can be further examined. Again it was tested for linear and quadratic relationships. The quadratic model has a similar fit to the linear model but since the coefficient of the model is not statistically significant either (t=-0.319, p=0.751) the linear model is preferred.
Figure 6-3 gives a plot of the cost overruns against the length of the pre-construction phase for all projects (solid line) and for road, rail and fixed link projects specifically (dotted lines).

100 Cost overruns in large-scale transport infrastructure projects
Figure 6-3 Length of the pre-construction phase and cost overruns (51 projects)
The regression line based on all projects is: TC * 02.525.1 , where C is the cost overrun (as a % of constant prices) and T is the length of the pre-construction phase of the project. The pre-construction phase is responsible for 10.2% of the variance in cost overruns. For each additional year the pre-construction phase takes, the cost overrun increases by 5.0% (t=2.365, p=0.022).
The linear model is also compared with the quadratic model for the project types individually, but the quadratic model does not result in a considerably better fit for either road or rail or fixed link projects. The relation between the pre-construction phase and cost overruns is considered to be a linear one. Outliers do not influence any of the relations, and hence all the projects can be part of the analyses. The regression lines for the three project types are as follows:
TRoad C * 19.742.6 , t=2.050, p=0.052, R2 = 0.155 TRail C * 49.1763.9 , t=1.555, p=0.148, R2 = 0.180
TLinks Fixed C * 37.431.12 , t=1.546, p=0.150, R2 =0.178
There is a positive relation between the length of the pre-construction phase and cost overruns for all three project types; the longer the pre-construction phase, the higher the cost overrun. However, the magnitude by which cost overruns increase with each additional year of the pre-construction phase is much larger for rail projects than for road and fixed link projects.
Construction phase Rail projects have the largest length of the construction phase, with an average of 5.6 years (SD=2.3) followed by fixed link projects (4.9 years, SD=2.6) and road projects (4.3 years, SD=2.6) (p=0.305, Anova). Similar to the lengths of the implementation and pre-construction phase, the relation between the length of the construction phase and cost overruns is considered by means of a regression analysis. The data was also tested for a quadratic relationship but this did not result in a better model fit .
Figure 6-4 gives a plot of the cost overrun against the length of the construction phase for all projects (solid line) and for road, rail and fixed link projects specifically (dotted lines).

Chapter 6 – Determinants of cost overruns of infrastructure projects in the Netherlands 101
Figure 6-4 Length of the construction phase and cost overruns (51 projects)
The regression line for all projects is: TC * 15.042.14 , where C is the cost overrun (as a % of constant prices) and T is the length of the construction phase of the project. For each additional year of construction, the extent of the cost overrun decreases by 0.15% (t=-0.075, p=0.940). The small explained variance in cost overruns (R2=0.000) also shows that cost overruns are only to a very small extent dependent on the length of the construction phase.
Two projects were identified as statistical outliers, having a construction phase of more than 10 years. One of the projects was 48 km long, compared with the average length of the other road projects in this analysis of 8.8 km. This can explain the longer construction phase. If the analyses are carried out without these statistical outliers, remarkably, with each year the construction phase takes longer, cost overruns increase by 0.83%, instead of decreasing, although the influence is still not statistically significant (p=0.733).
The influence of the construction phase on cost overruns is also small for road, rail and fixed link projects individually considering the small slopes and explained variances in the following regression equations and statistics:
TRoad C * 69.112.11 , t=0.536, p=0.597, R2 = 0.012 TRail C * 73.158.24 , t=-0.416, p=0.686, R2 = 0.015
TLinks Fixed C * 90.104.13 , t=-0.620, p=0.548, R2 =0.034
Striking in these equations is the positive relation for road projects, whereas for rail and fixed link projects there is a negative relation between the length of the construction phase and cost overruns. The extent to which the costs increase and decrease in both these relations is similar between the project types.
If the two mentioned outliers are excluded from analyses, this results for road projects in a model that better fits the data. For each year the construction phase increases, the cost overruns increase by 3.5% (p=0.395, R2 = 0.033).

102 Cost overruns in large-scale transport infrastructure projects
6.5.3 Sub-conclusion
The length of the pre-construction phase has a strong (positive) relation and the length of the construction phase has a weak (negative) relation with cost overruns. This makes the length of the pre-construction phase a much better determinant of cost overruns than the length of the construction phase. It is even a better predictor than the length of the implementation phase. The same applies for the individual project types, except for fixed link projects. We therefore conclude that the focus should lie on the pre-construction phase when searching for causes and cures for cost overruns.
6.6 Conclusions and discussion
6.6.1 Conclusions
This study addressed the influence of the project type, project size and the length of the implementation phase on cost overruns for Dutch transport infrastructure projects in order to determine whether the determinants of cost overruns are the same as the worldwide findings.
First, the main findings regarding the project type are as follows: Rail projects perform better compared with road and fixed link projects. Road projects are particularly vulnerable to cost overruns. For all project types, cost overruns mainly appear in the pre-construction phase.
Considering these findings it can be concluded that also regarding the project type, the cost performance in the Netherlands differs from those worldwide. Rail projects have the largest average cost overrun worldwide, whereas in the Netherlands this is the category with the smallest average overrun. In addition to the lower average cost overrun, the frequency of cost overruns for all project types is considerably lower compared to worldwide findings.
Secondly, for the project size the following conclusions can be drawn: The problem of cost overruns is most severe for small projects. Project size does not significantly influence the cost overrun.
In average percentages, cost overruns are highest for small projects, but the impact of project size on cost overruns is small. However, in terms of absolute cost overrun, larger projects contribute to a greater extent to cost overruns.
Thirdly, regarding the implementation phase, the main findings are as follows: The longer the implementation phase the higher the cost overruns, especially for fixed
link projects. The pre-construction phase is significantly shorter than the construction phase but it
has the highest influence on cost overruns.
The most important variable related to cost overruns is the length of the pre-construction phase. More specifically, for road and rail projects the length of the pre-construction phase is the best predictor of cost overruns but for fixed link projects it is the length of the implementation phase. The different nature of the cost estimate at the time of construction start can play a role herein.
This research showed once more that the cost performance in Dutch transport infrastructure projects is different from worldwide findings. There are also some similarities; for example,

Chapter 6 – Determinants of cost overruns of infrastructure projects in the Netherlands 103
similar to worldwide findings, the length of the implementation phase turns out to be a valuable predictor of cost overruns. In addition this research provided new insight as it demonstrated that the length of the pre-construction phase is an even better predictor for cost overruns than the length of the implementation phase. This is very useful because this narrows down the period in which projects are most vulnerable to cost overruns and hence, more specific measures can be taken in this area.
6.6.2 Discussion
The findings raise several points for discussion. This section will address these subjects focussing on the possible reasons that can explain the findings.
The study showed that in the Netherlands cost overruns for rail projects are relatively low, both when compared nationally with roads and fixed links and internationally when compared with worldwide findings. The difference in average cost overrun between project types is not the result of a bias in cost overruns (see Chapter 5). The difference between project types may be related to the organisational set-up and institutional settings which is different for rail projects (with ProRail as project owner) and for road projects (with RWS as project owner).
The type of construction, i.e. either new construction or the broadening of an existing structure, does not explain the difference between road and rail projects in the Netherlands, but it could explain the difference with the worldwide findings. In the Dutch data, a large share of projects concerns broadenings, adjustments, improvements and not new infrastructure. New infrastructure typically involves larger cost overruns and the international database may include a greater number of new infrastructures, which could explain the difference. Furthermore, the type of rail, heavy or light rail, could partly explain the difference with the worldwide findings.
This research furthermore concluded that small projects have the largest average cost overrun. Odeck (2004) suggests that this could be due to the greater amount of attention that is given to larger projects. “Larger projects are most probably under much better management as compared to smaller ones”. This suggests that smaller projects deserve more attention than is currently the case as they result in similar cost overruns as the large projects. Of course the benefits should exceed the additional management costs. In addition, the length of the pre-construction phase turns out to be a better predictor of cost overruns than the length of the construction phase or implementation phase. The causality is still uncertain, so it is as yet impossible to conclude that shortening this period will reduce the magnitude of cost overruns. In addition, a shorter phase might not be sufficient to obtain agreement on the project implementation. This would have to be discussed in the construction phase and hence, cost increases might not be reduced but shifted to the next phase.
More insight into the reasons behind the cost increase in this phase is needed to determine the effect of shortening the length of the pre-construction phase.
Considering the three main explanations for cost overruns (Flyvbjerg et al., 2002) – technical, psychological and political-economic explanations – the latter seems the most likely. Technical explanations concern forecasting errors in technical terms such as inaccurate models. Psychological explanations are based on the cognitive mind of forecasters resulting in optimistic forecasts, and political-economic explanations are based on strategic misrepresentation.
104 Cost overruns in large-scale transport infrastructure projects
The forecasting models or optimism bias do not change with the length of the pre-construction phase and hence cannot explain the increasing cost overruns. Conversely, strategic misrepresentation can increase cost overruns. In the pre-construction phase, strategic misrepresentation can be seen by the many scope changes. Before the decision to build, the estimated costs were purposefully kept low (usually with a small project scope) to increase the chances for the proposal being accepted. Once accepted, attempts are made to add scope to the project, resulting in large cost increases. The longer the pre-construction phase will take, the more opportunities there are to adjust the project plans (either due to unforeseen events or purposefully) and hence raise the project costs and eventually cost overruns. Shortening this phase will result in lower cost overruns as it should reduce or remove the possibility of purposeful scope changes and similar behaviour.
Finally, there is also a question as to whether a shorter pre-construction phase fits with the decision-making culture in the Netherlands. This culture is characterised by many opportunities for the general public, as well as the local citizens, interest groups and industry to participate in the process. The belief is that this will, eventually, result in greater support for the project’s plans, therefore avoiding resistance in later phases of the decision-making process. Depending upon the level of participation in this pre-construction phase, reducing the phase might complicate the possibilities for participation and not necessarily result in smaller cost overruns.
6.7 Areas for further research
The findings of this research pose several areas for further research. First of all, it would be interesting to compare the cost performance between countries. This would enable a more detailed assessment of ecological fallacy and the differences and similarities found could shed new light on the problems of cost overruns. Secondly, cost overruns could be considered from the perspective of the decision-making culture or more specifically, the system of governance. It is expected that the way in which decisions are made will influence the cost performance of projects. A first possible distinction could be democratic versus non-democratic systems of governance but other distinctions may also be suitable. We will explore these subjects, the comparison between countries and systems of governance in subsequent papers.
This paper concludes by proposing three additional areas of further research. First of all, the relation between the different phases in the decision-making phase and the extent of the cost overruns could be considered and compared between countries. This would provide an answer to the question of whether the length of the pre-construction phase is also a better indicator of the total cost overruns in other countries. For this, the specific decision-making phases for each country should be taken into account, because it probably varies. Secondly, it might be useful to consider several projects in more detail, to determine specifically the reasons for each cost increase. Lastly, it turned out that the type of construction, thus either new infrastructure or not, could make a difference to cost performance. Additional research into this variable is also recommended.

Chapter 6 – Determinants of cost overruns of infrastructure projects in the Netherlands 105
Acknowledgement
The authors thank the Dutch Ministry of Infrastructure and the Environment, including RWS and KiM for their support in data collection. Furthermore, the authors thank various other institutes who provided valuable data for projects. The research was supported by the Dutch Ministry of Infrastructure and the Environment.
References
Cantarelli, C.C., B. Flyvbjerg, B. van Wee and E.J.E. Molin (2009) Lock-in and its influence on the project performance of large-scale transportation infrastructure projects. Investigating the way in which lock-in can emerge and affect cost overruns. Paper presented at the 88th annual meeting of the Transportation Research Board, Washington, D.C.
Flyvbjerg, B., M.K. Skamris Holm and S.L. Buhl (2002) Underestimating cost in public works. Error or Lie?, in: Journal of the American Planning Association, 68 (3), pp. 279-295.
Flyvbjerg, B., N. Bruzelius and W. Rothengatter (2003a) Megaprojects and Risk: An Anatomy of Ambition, Cambridge, Cambridge University Press.
Flyvbjerg, B., M.K. Skamris Holm and S.L. Buhl (2003b) How Common and How Large Are
Cost Overruns in Transport Infrastructure Projects?, in: Transport Reviews, 23(1), pp. 71-88.
Flyvbjerg, B., M.K. Skamris Holm and S.L. Buhl (2004) What Causes Cost Overrun in Transport Infrastructure Projects?, in: Transport Reviews, 24 (1), pp. 3-18.
Merewitz, L. (1973) How do urban rapid transit projects compare in cost estimating experience? Proceedings of the International Conference on Transportation Research. First Conference. Reprint no. 104, pp. 483-493, Bruges, Belgium.
Ministry of Transport, Public Works and Water Management (1985-2009), MIT Projectenboek (1985-2009), SDU Uitgevers, Den Haag.
Morris, S. (1990) Cost and Time Overruns in Public Sector Projects, in: Economic and Political Weekly, 15(47), pp. 154-168.
Nederlandse Bruggen Stichting, Bruggen Database NBS. http://bruggenstichting.nl, consulted January 2010
Nijkamp, P. and B. Ubbels (1999) How Reliable are Estimates of Infrastructure Costs? A Comparative Analysis, in: International Journal of Transport Economics, 26(1), pp. 23-53.
Odeck, J. (2004) Cost overruns in road construction – what are their sizes and determinants?, in: Transport Policy, 11(1), pp. 43–53.
Pickrell, D.H. (1990) Urban rail transit projects: forecasts versus actual ridership and cost, US Department of Transportation, Washington D.C.
Pickrell, D. (1992) A Desire Named Streetcar: Fantasy and Fact in Rail Transit Planning, in: Journal of the American Planning Association, 58(2), pp. 158-176.
Structurae. http://en.structurae.de, consulted December 2008

106 Cost overruns in large-scale transport infrastructure projects

107
7. Geographical variation in cost performance of transport infrastructure projects Cantarelli, C.C., Flyvbjerg, B and Buhl, S.L. (submitted). Geographical variation in project cost performance. The Netherlands versus worldwide.
Abstract Cost overruns in transport infrastructure projects know no geographical limits; overruns are a global phenomenon. Nevertheless, the size of cost overruns varies with location. In the Netherlands, cost overruns appear to be smaller compared to the rest of the world. This paper tests whether Dutch projects perform significantly better in terms of cost overruns than other geographical areas. It is concluded that for road and tunnel projects, the Netherlands performs similarly to the rest of the world. For rail projects, Dutch projects perform considerably better, with projects having significantly lower percentage cost overruns in real terms (11%) compared to projects in other North West European countries (27%) and in other geographical areas (44%). Bridge projects also have considerably smaller cost overruns - 7% in the Netherlands compared with 45% in other NW European countries and 27% in other geographical areas. In explaining cost overruns, geography should therefore clearly be taken into consideration.

108 Cost overruns in large-scale transport infrastructure projects
7.1 Introduction
Whether it is in Europe, America, Australasia or elsewhere, all over the world, examples of large cost overruns in transport infrastructure projects can be found. One of the most famous “project disasters” in this respect is the Channel tunnel. This undersea rail tunnel linking the United Kingdom and France is the longest in its kind in Europe with a length of about 50 kilometres. Construction costs increased from £2600 million to £4650 million (1985 prices) - 80 per cent higher than forecasted (Flyvbjerg et al., 2003a). In Boston, in the United States, a much disputed project is the Central Artery/Tunnel project, a large and complex underground highway project. The project, also known as the “Big Dig” or “Big Dug” due to persistent tunnel leaks, had overrun its costs by US $ 11 million or 275 per cent when it opened (Flyvbjerg 2007, EPB). The Mass Rapid Transit, the underground metro system in Bangkok which is about 20 kilometres long and was 67% over budget when completed can be seen as yet another transport infrastructure failure. Cost overruns appear to be a global phenomenon, existing across 20 nations on five continents (Flyvbjerg et al., 2002; Flyvbjerg et al., 2003b).
Few studies comparing actual and estimated costs have taken the geographical location into account. To the authors’ knowledge, the study by Flyvbjerg et al. (2003a, 2003b) is the only study that tests whether cost overruns vary with geographical location. This study covers 258 projects (roads, rail, tunnels and bridges) and distinguishes three geographical areas: Europe, North America and “other geographical areas (a group of 10 developing nations plus Japan).” Flyvbjerg et al. (2003a, 2003b) found statistically significant differences in average cost overruns between these areas with average overruns typically being smaller for Europe (26%) and North America (24%) compared to other areas (65%). Thus, geography matters for cost performance. However, Flyvbjerg et al. (2003b) argue that the highly significant differences in cost escalation depending on geographical location are due to the large average cost overrun of the projects in the “other geographical areas”, “with their poor track record of cost escalation for rail, averaging 64.6% (Flyvbjerg et al. 2003b).”
Although cost overruns seem to be a global phenomenon, they also appear to vary with geographical location. This is supported by a recent study by Cantarelli et al. (forthcoming-a and –b, see also chapters 5 and 6) which shows that the cost performance of transport infrastructure projects in the Netherlands is actually quite different from the worldwide findings. The main differences are: Cost overruns are not predominant but are as common as cost underruns. The average cost overrun is considerably smaller than the worldwide average. Rail projects have the smallest overruns whereas worldwide rail projects have the
largest average cost overrun.
The purpose of this paper is to establish the extent to which cost performance in Dutch projects differs with geographical location. This geographical variation will be examined within the context of the Netherlands and within a worldwide context. In addition, possible explanations for the findings are provided.
In order to address these objectives, the sample from the Dutch study is used to analyse in a statistically valid and reliable manner the extent to which the cost performance in the Netherlands differs from the rest of the world and from specific geographical locations. For the international data, an enlarged version of the original database (Flyvbjerg et al., 2003), now including 806 projects instead of 258 projects, is used. This immediately raises the question of whether the increase in the number of projects has any influence on the overall cost performance of the worldwide study. New countries have been included compared with

Chapter 7 – Geographical variation in project performance 109
the original database, and if geographical location plays a role, this could affect the overall performance. This will also be covered in this paper.
In sum, the following research questions are addressed: 1. To what extent do cost overruns of transport infrastructure projects within the Netherlands depend on geographical location? 2. What is the influence of the increase in the number of projects in the worldwide database on the cost performance? And 3. To what extent is the cost performance in the Netherlands different from that worldwide? The large worldwide database allows a distinction to be made between different regions of the world. For this paper, other North West (NW) European countries are considered in more detail.
The remaining part of this paper is as follows. In section 2, the data and methodology of the Dutch and international sample are described and the similarities and differences between both samples are highlighted. Section 3 examines whether cost performance varies depending on geographical location within the Netherlands. Section 4 presents the cost performance of the 806 projects against the original cost performance based on 258 projects. Section 5 compares the Dutch project performance against that of the rest of the world. In section 6 the Netherlands is compared with other NW European countries and other geographical areas. Section 7 focuses on the most important results and provides explanations for the findings. Finally, section 8 presents the conclusions and a discussion.
7.2 Data and methodology
This section presents the main characteristics of the Dutch and international samples. Both samples focus on land-based transport infrastructure projects, including the following four project types: roads, rail, tunnels and bridges. So here tunnels and bridges are not combined into one category.
7.2.1 Dutch and international data
Characteristics of the Dutch data After three years of data collection and refinement, a database was established consisting of 78 Dutch transport infrastructure projects, which are distributed as follows over the four project types:
Road: 37 Rail: 26 Tunnel: 8 Bridge: 7
The Netherlands is divided into twelve provinces, but for the purpose of this research, 6 regions are distinguished16: North Netherlands (N NL): including provinces Friesland, Groningen, Drenthe East Netherlands (E NL): including provinces Gelderland, Overijssel Central Netherlands (C NL): including provinces Utrecht, Flevoland South Netherlands (S NL): including provinces Limburg, Noord-Brabant Noord-Holland (NH): province Noord-Holland Zuid-Holland (ZH): province Zuid-Holland
16 The database does not include any projects from the province Zeeland

110 Cost overruns in large-scale transport infrastructure projects
Figure 7-1 gives a map of the Netherlands and the twelve provinces.
Figure 7-1 Provinces of the Netherlands
Table 7-1 provides an overview of the number of projects by geographical location and project type. Two rail projects i.e. the Betuweroute and HSL-South are implemented in more than one region and are marked as “crossing” in Table 7-1
Table 7-1 Number of projects by geographical location and project type
Region Project type Total Road Rail Tunnel Bridge # %
North Netherlands (N NL) 7 2 - - 9 12 East Netherlands (E NL) 3 - - 1 4 5 Central Netherlands (C NL) 4 4 1 1 10 13 South Netherlands (S NL) 6 2 1 - 9 12 Noord-Holland (NH) 7 8 1 2 18 23 Zuid-Holland (ZH) 10 8 5 3 26 33 Crossing - 2 - - 2 3 Total 37 26 8 7 78 100
The largest share of projects (about 56%) has been implemented in the provinces Noord-Holland and Zuid-Holland. These are also the two most densely populated provinces with 1246 and 999 inhabitants per square kilometre respectively. These provinces contain three of the four largest cities in the Netherlands being Amsterdam in the Noord-Holland province and Rotterdam and The Hague in the Zuid-Holland province. Together with the city Utrecht (C NL) and their surrounding areas they form the Randstad, which is the 6th largest metropolitan area (in terms of population size) in Europe.

Chapter 7 – Geographical variation in project performance 111
Characteristics of the international data At the time of this research, the number of projects in the international database has about tripled compared to the 2003 study to reach a total number of 806 projects. The Dutch projects are included in this number for the purpose of comparing this enlarged database with the original database of 258 projects (section 4). However, when the cost performance of the Dutch projects is compared with the rest of the world (section 5 and 6), the Dutch projects are removed from the international database. Hence the 78 Dutch projects are compared with the 728 international projects. The 806, which includes the Dutch projects, are distributed as follows over the four project types:
Road: 537 Rail: 195 Tunnel: 36 Bridge: 38
The projects are located in 8 different regions, covering 17 countries plus two categories (S Eu and other developing countries) which comprises several unspecified countries17: North and West (NW) Europe (NW Eu): including the countries Netherlands,
Switzerland, Germany, Denmark, France, Norway, Sweden, United Kingdom and Hungary
South Europe (S Eu): specific countries in this region are unknown East Europe (E Eu): including the country Slovenia North America (N Am): including the countries Canada and the US Latin America (L Am): including the country Mexico Asia: including the countries Japan, South Korea and Thailand Africa: including the country Zambia Other developing countries18
Table 7-2 gives an overview of the number of projects by geographical distribution and project type.
Table 7-2 Characteristics of the international database
Region Project type Total Road Rail Tunnel Bridge # %
NW Europe (NW Eu) 315 90 32 22 459 57 South Europe (S Eu) 16 7 - - 23 3 East Europe (E Eu) 37 - - - 37 5 North America (N Am) 24 65 3 16 108 13 Latin America (L Am) - 1 - - 1 - Asia 138 20 1 - 159 20 Africa 7 - - - 7 1 Other developing countries - 12 - - 12 1 Total 537 195 36 38 806 100
The largest share of projects (about 57%) has been implemented in NW Europe. Since the Netherlands is geographically located in this area, the project performance of the Netherlands will be compared more specifically with this region. The other regions (being South Europe, East Europe, North America, Latin America, Asia, Africa and other developing countries) are pooled together into the group “other geographical areas.” 17 The original data of 2002 covered 20 countries (Canada, Denmark, Germany, France, Japan, Mexico, Netherlands,
Norway, Sweden, UK, USA and nine developing countries) 18 These include projects for which the geographical area was unknown

112 Cost overruns in large-scale transport infrastructure projects
7.2.2 Methodology in the Dutch and international study
With the objective of determining whether the worldwide findings also apply for one specific country (in this case the Netherlands), the Dutch study followed from the outset as much as possible the same methodology as the worldwide research by Flyvbjerg et al. (2003a; 2003b). Projects in the international database were selected on the basis of data availability, that is, all the projects that were known and for which data were available for the development of construction costs were considered for inclusion in the sample. Since the methodology is the same, as with the original sample of 258 projects the current sample of 806 projects is probably not representative of the population of transport infrastructure projects in the world (see Flyvbjerg et al., 2003b). The sample is biased and the bias is conservative; the difference between the actual and estimated costs from the sample is likely to be lower than the difference in the project population. Despite this conservative bias, given the current state-of-the-art in this field of research, it is the best obtainable sample (see Flyvbjerg et al. (2003b) for an extensive description of the methodological considerations and implications of the international sample).
The intention of the Dutch study was to include all projects from a specified period in the database. However, due to the non-availability of key information and the incompleteness of information for some projects, the database does not cover all projects. However, in line with previous international research in this field that also included only projects for which information was available, the database is treated as a sample (see Cantarelli et al. forthcoming-a, chapter 5) for a full description of the methodology in the Dutch study). Similar to the international study, the sample is probably biased and the bias is conservative. This is mainly caused by fixed link projects for which data was collected by means of interviews.
7.2.3 Similarities and differences between the Dutch and international sample
Both the Dutch and the worldwide sample include the same variables and the way in which the data for these variables are collected is also the same. The most important variables are the following:
Time of formal decision to build (ToD): this is one specific point in the process when a decision was made to go ahead with the project, that is, the “go-decision”
Estimated opening year: this is the expected year of opening at the ToD. If the estimated opening year is unavailable at the ToD, then the nearest available estimate of the opening year is used as a baseline.
Actual opening year: year in which operations begin19 Estimated costs: the costs at the ToD. When the costs are not available at the ToD, the
nearest available reliable figure for estimated costs is used as a proxy. Actual costs: the costs at the actual opening year. If the actual costs are unknown at
the time of project completion, the most reliable later figure for actual costs is used (i.e. from a year later than the opening year), if available. If unavailable, an earlier figure for actual costs could be used (i.e., from a year before the opening year), but only if 90% of the budget was spent at this time, i.e., the project was 90% complete in financial terms.
19 For projects that were based on the MIRT documentation, data on this actual opening year were unavailable and an
assumption had to be applied (see Cantarelli et al., forthcoming)

Chapter 7 – Geographical variation in project performance 113
The way in which scope changes are handled can potentially have an impact on the difference in average cost overrun. Therefore in both the Dutch and the worldwide sample, scope changes are treated in the same way. Scope changes are included to the extent that the planned and implemented projects remain functionally identical. The project has to fulfil the same objective and serve the same market to be considered to have the same project function. If the project function remained the same over the years, the project was included in the research. If the project function at the ToD was different from the project function at the time of opening, an attempt was made to make the projects comparable. If this attempt failed, it was considered meaningless to compare the projects, and it was not included.
Besides the variables and scope changes, the overall way in which data is handled is the same in both the Dutch and the worldwide study. This makes it possible to compare the Dutch and worldwide data, which was almost impossible with previous studies on cost overruns (e.g. Merewitz, 1973; Morris, 1990; Pickrell, 1990,1992; Auditor General of Sweden, 1994 (in Odeck 2004); Nijkamp and Ubbels, 1999; Flyvbjerg et al., 2003a; and Odeck, 2004). The four main reasons for this are: i) the difference in use of nominal and real prices (Flyvbjerg, 2007), ii) different use of the time of the formal decision to build and actual opening year as a basis for the estimated and actual costs (Flyvbjerg et al., 2003b), iii) different sample size and iv) different geographical area. Both the Dutch and international sample present costs excluding VAT and correct for inflation using the appropriate geographical, sectoral and historical indices. Estimated and actual costs are based on the same base year (see above). Although the sample size of the Dutch projects is smaller compared to the international database it is still considered large enough to allow statistical analyses. This leaves only one main reason for differences found between both samples, namely geographical area, and this is exactly the subject under scrutiny in this paper. If cost overruns differ between both samples, this can be explained by geographical area.
The main differences between both samples concern the sources of data collection and the selection of large-scale projects. In the worldwide sample, one of the core sources of information on the costs of projects is the National Audit Office. Instead, one of the main sources for data collection for the Dutch projects is the MIRT (Meerjarenprogramma Infrastructuur, Ruimte en Transport, translated as the Multi-years programme for infrastructure, spatial planning and transport)20. The different use of sources also resulted in a different approach to selecting large-scale projects.
7.3 Geographical variation in cost performance in the Netherlands
The previous section identified six geographical regions in the Netherlands and four project types. In this section we examine whether cost performance varies between these regions and project types.
Table 7-3 provides an overview of the characteristics of the Dutch infrastructure projects regarding the number of projects and average cost overruns by geographical region and project type.
20 The translation of the MIRT in English is based on:
http://www.verkeerenwaterstaat.nl/english/topics/water/delta_programme/rules_and_framework_of_the_mirt (consulted 20-03-2010)

114 Cost overruns in large-scale transport infrastructure projects
Table 7-3 Characteristics Dutch database
Regions
Project type Total Cost overrun Road Rail Tunnel Bridge # % Mean SD
North Netherlands (N NL) 7 2 - - 9 12 11.5 35.6 East Netherlands (E NL) 3 - - 1 4 5 9.3 24.9 Central Netherlands (C NL) 4 4 1 1 10 13 7.1 39.3 South Netherlands (S NL) 6 2 1 - 9 12 23.8 48.9 Noord-Holland (NH) 7 8 1 2 18 23 13.2 27.3 Zuid-Holland (ZH) 10 8 5 3 26 33 21.9 49.4 Crossing - 2 - - 2 3 28.9 36.5 Total 37 26 8 7 78 100 16.5 40.0 Cost overrun Mean 18.8 10.6 34.9 6.6
SD 38.9 32.2 67.4 33.3
The average cost overrun is largest for the two projects that are cross-regional (28.9%,SD=36.5) followed by projects in the area South Netherlands (23.8%, SD=48.9). The geographical area with the smallest cost overrun is Central Netherlands with on average a cost overrun of 7.1% (SD=39.3). Overall, the average cost overrun is not significantly different between the regions (F=0.301, p=0.934), possibly due to the small number of projects.
The average cost overrun is the largest for tunnel projects followed by road, rail and bridges. However, the difference in the averages between the four project types is not statistically significant (F=0.937, p=0.427). Possibly the type of projects in each region could influence the extent of cost overrun. Based on a two-way Anova test, we concluded that there is no difference in average overrun caused by the interaction effect of region and project type (F=1.461, p=0.190). We therefore conclude that geographical location does not matter for the cost performance of Dutch transport infrastructure projects.
7.4 Cost overruns in 806 projects compared with previous data
This section determines whether and to what extent the cost performance of the projects in the new dataset comprising 806 projects all over the world differs from that of the projects in the original dataset of 258 projects. First we examine whether the representation of projects over geographical location and project type has changed with the increase of the database. This may give an indication of whether the cost performance has changed.
Table 7-4 presents the number of projects per region and project type for both databases. Note that the original 258 projects are also included in the enlarged international dataset of 806 projects. Further, in the original study based on 258 projects, fixed links were not broken down into tunnels and bridges, and hence we cannot present the number of projects per region for these project types separately either.

Chapter 7 – Geographical variation in project performance 115
Table 7-4 Number of projects per region and project type in the database with 806 and 258 projects
Region
Worldwide database (N=806) Worldwide database (N=258) Road Rail Tunnel Bridge Total Road Rail Fixed
links Total
NW EU 315 90 32 22 459 143 23 15 181 S EU 16 7 - - 23 - - - 0 E EU 37 - - - 37 - - - 0 N Am 24 65 3 16 108 24 19 18 61 L Am - 1 - - 1 - 1 - 1 Asia 138 20 1 - 159 0 3 0 3 Africa 7 - - - 7 - - - 0 Other - 12 - - 12 - 12 - 12 Total 537 195 36 38 806 167 58 33 258
The enlarged database of 806 projects differs in three aspects from the original database. First of all, projects from three new regions are included. These are projects in Southern Europe, Eastern Europe and Africa. Secondly, Asian projects are better represented in the larger database. Thirdly, the number of projects for all three project types has been greatly increased. Despite a doubling in the number of fixed link projects, this increase remains the smallest compared to road and rail projects. Furthermore, the increase in fixed link projects did not incorporate any new geographical areas.
To conclude, the representation of projects regarding geographical location and project types has changed with the increase of the number of projects and a different cost performance could happen. Since no new fixed link projects from different regions were added, we do not expect a change for this project type.
Table 7-5 presents the number of projects, the mean cost overrun and the standard deviation for the worldwide samples with 806 projects and 258 projects.
Table 7-5 Cost overruns broken down by type for worldwide samples of transport infrastructure projects
Project Type Worldwide N=806 Worldwide N=258 N Mean CO
% SD N Mean CO
% SD
Road 537 19.8 31.4 167 20.4 29.9 Rail 195 34.1 43.5 58 44.7 38.4 Fixed links 74 32.8 58.2 33 33.8 62.4
Bridges 38 30.3 60.6 n/a n/a n/a Tunnels 36 35.5 56.3 n/a n/a n/a
Total 806 258
First we shall consider the cost performance of the new enlarged database. Table 5 shows that of the four project types, road projects have the smallest overrun of 20% followed by bridge projects with an overrun of 30%, rail projects with an overrun of 34% and tunnel projects with an overrun of 35%. Based on an F-test we conclude with overwhelming statistical significance that roads, rail, tunnels and bridges are different (F=8.293, p<0.001). Hence, project types should be treated separately when discussing cost overruns. However, considering the relatively small number of observations and similar cost performances, it could be argued that bridges and tunnels should be treated as one project type, fixed links.

116 Cost overruns in large-scale transport infrastructure projects
Based on a t-test, it is concluded that cost overruns do not significantly differ between bridges and tunnels (p=0.706). Hence, tunnels and bridges could be merged.
Furthermore, the average overruns come with large standard deviations, indicating that the data for individual projects are spread over a large range of values. Road projects have the smallest standard deviation indicating that on average road projects are nearer to the mean value of the overrun compared to rail, bridges and tunnels. A Bartlett test shows that the standard deviations of the different project types are different with very high statistical significance (p<0.001).
Considering the substantial and significant difference in mean cost overruns and standard deviations we have found, we conclude that project type matters and pooling the project types together is therefore not appropriate. In the analyses that follow, each type of project will therefore be considered separately.
Following these findings on cost overruns worldwide, let us compare these new results with the original results based on 258 projects. Looking at table 5 two figures immediately stand out; the considerably lower average cost overrun for rail projects and the hardly changed average overrun for road projects. From this we must conclude that geographical location has a larger influence on the average cost overrun for rail projects than for road projects. The decrease in average cost overrun for rail projects can be explained by the increase in the number of projects in Europe and North America, the areas with a better cost performance record. As expected, the cost performance of fixed link projects changed only slightly.
7.5 Cost performance of Dutch projects versus that of the rest of the world
This section describes the results of the comparison in cost performance of transport infrastructure projects in the Netherlands and the rest of the world. Table 6 presents the number of projects, the mean cost overrun and the standard deviation for the 78 Dutch transport infrastructure projects and for the 728 projects in the rest of the world.
Table 7-6 Cost overruns broken down by type: Netherlands versus rest of the world
Project Type Netherlands N=78 Worldwide N=728 N Mean CO
% SD N Mean CO
% SD
Road 37 18.8 38.9 500 19.9 30.9 Rail 26 10.6 32.2 169 37.7 44.0 Fixed links 15 21.7 54.4 59 35.7 59.2
Bridges 7 6.6 33.4 31 35.7 64.4 Tunnels 8 34.9 67.4 28 35.6 54.1
Total 78 726
Comparing the Netherlands with the rest of the world, the largest differences can be seen between the average cost overrun for rail and for bridges. Rail projects in the Netherlands have considerable smaller average cost overruns (11%) compared to the rail projects in the rest of the world (38%). Similarly, the average cost overrun for Dutch bridge projects at 7%, is considerably smaller than the worldwide average of 36%. The difference in average is statistically significant for rail projects (p<0.001), but not for bridge projects (p=0.106). The non-significance for bridge projects is probably caused by the small number of projects. Still, considering the difference in average we must conclude that there is a very large and relevant

Chapter 7 – Geographical variation in project performance 117
difference from the other project types. For road and tunnel projects, the average cost overrun in the Netherlands is not significantly different from the other projects (p=0.875 and p=0.977 for roads and tunnels respectively).
7.6 Cost overruns of transport infrastructure projects in different geographical areas
This section presents the results on the comparison between the Netherlands and other geographical areas. Section 2 already specified that the focus will be on NW European countries; the other regions are pooled together as “other geographical areas.” This thus results in three geographical areas: the Netherlands, “other NW European countries”, and “other geographical areas.” First the cost performance of transport infrastructure projects in North West Europe is considered more closely.
7.6.1 Cost performance of transport infrastructure projects in North West Europe
Table 7-7 presents the number of projects, the mean cost overrun and the standard deviation for North West European countries broken down by project type.
Table 7-7 Cost overrun of transport infrastructure projects in NW European countries by project type
Project Type NW-Europe N Mean CO
% SD
Road 315 20.9 30.2 Rail 90 22.3 34.9 Fixed links 54 31.5 48.6
Bridges 22 32.9 50.6 Tunnels 32 30.6 48.0
Total 459
Table 7-7 shows that road projects have the best cost performance, closely followed by rail projects. Bridges and tunnels also perform rather similarly. An F-test showed that the difference in average cost overrun between the project types for NW European countries is not statistically significant (F=1.533, p=0.205). This implies that for this geographical area, project type does not matter for cost overruns and hence, projects could be pooled together. However, a Bartlett test shows that there is a highly significant (p<0.001) difference in the standard deviations of the project types. Since homogeneity of standard variances is a precondition for an F-test, and this has thus been violated, the different types of projects are considered separately in the following analyses. The most remarkable difference between the worldwide projects and NW European projects is that in NW Europe, the average overrun for rail is smaller.

118 Cost overruns in large-scale transport infrastructure projects
7.6.2 Cost overruns of transport infrastructure projects in the Netherlands versus NW Europe and other geographical areas
These abovementioned figures for NW Europe include the Dutch projects, but if these projects are compared with other NW European countries and other geographical areas, a different picture emerges. Table 7-8 presents the number of projects, the mean cost overrun and the standard deviation for these three geographical areas broken down by project type.
Table 7-8 Cost overruns of transport infrastructure projects in the Netherlands, other NW European countries and other geographical areas
Project Type
The Netherlands Other NW-European countries
Other geographical areas
N Mean SD N Mean SD N Mean SD Road 37 18.8 38.9 278 21.2 28.9 222 18.2 33.1 Rail 26 10.6 32.2 64 27.1 35.0 105 44.2 47.6 Fixed links 15 21.7 54.4 39 35.3 46.4 20 36.4 80.0
Bridges 7 6.6 33.4 15 45.1 53.5 16 26.8 73.8 Tunnels 8 34.9 67.4 24 29.2 41.4 4 74.5 104.2
Total 78 381 347
The difference in average cost overrun between the three geographical areas is described for each project type individually below.
Considering road projects, there does not seem to be a large difference in project performance between the different geographical regions with cost overruns ranging between 18% for other geographical areas, 19% for Dutch projects and 21% for other NW European countries. Based on a t-test (the Welch version was used because of problems with variance homogeneity), it was confirmed that the differences in average cost overrun between the Netherlands and other NW European countries is not significant (p=0.714). The difference in average cost overrun between the Netherlands and other geographical areas is not statistically significant either (p=0.934). However, for rail, bridges and tunnels, the average cost overruns do largely differ between the regions with differences in average cost overrun of about 30% for rail, approximately 20% for tunnels and even up to about 40% for bridges.
For rail projects, Dutch projects have significantly smaller cost overruns of 11% compared to the average overrun of 27% in other NW European countries (p=0.037) and an average of 44% in other geographical areas (p=0.001). Cost overruns for rail projects vary with geographical location.
Dutch projects again have the smallest average cost overrun for bridges. The difference with the other regions is quite large with a 7% overrun for Dutch projects, 45% for other NW European countries and 27% for other geographical areas. It seems as if the Netherlands clearly performs better than the rest of the world. However, the differences are not statistically significant (p=0.054 for the difference in average overrun with other NW European countries and p=0.376 for the difference with other geographical areas). The reason could be the small number of projects and/or the large standard deviations. As it is, the differences could be due to chance.
Lastly, considering the project performance of tunnel projects, NW European projects have the smallest average cost overrun of 29%, followed by Dutch projects with an average of 35% and projects in other geographical areas with an average cost overrun of 75%. Although the cost overrun in the other geographical areas seem much higher compared to the Dutch

Chapter 7 – Geographical variation in project performance 119
projects, the difference in average cost overrun is non-significant (p=0.525). The cost performance in the Netherlands does not significantly differ with that from other NW European countries either (p=0.827).
7.7 Explanations
The analyses presented in the previous sections show some remarkable results. This section elaborates upon these results and provides possible explanations for these findings.
7.7.1 Worldwide cost performance of transport infrastructure projects
There are two findings that are particularly remarkable in the study regarding the worldwide cost performance. First of all, the worldwide cost performance varies with project type; the cost overruns between road, rail, tunnels and bridges are significantly different with tunnel and bridge projects having on average the largest cost overrun. This has important policy implications. Cost estimates should be considered with care for all project types and in particular for fixed link projects. As to the reason why fixed link projects have the largest overruns, there are several plausible explanations. As a matter of fact, any or all of the different types of explanations - technical, political-economic or psychological explanations (Flyvbjerg et al. 2002, 2007), can apply. Technical explanations consider cost overruns to be the result of “forecasting errors” in technical terms e.g. imperfect forecasting techniques, inadequate data and lack of experience. The indivisibility argument, that is, projects that consist of one part that cannot function unless all the elements are completed, can in this respect clarify why cost overruns are higher for fixed link projects. Political-economic explanations consider cost overruns to be the result of the strategic misrepresentation of costs. From this point of view, fixed link projects might be more prestigious, hence decision-makers will do anything in their capacity to get the project realised, e.g. underestimating costs. Lastly, the complexity is usually higher for fixed link projects than for conventional road or rail projects. As a consequence, forecasters, optimistic by nature, will find it more difficult to estimate accurately. In other words, the bias in fixed link projects might be higher. This explanation is based on the psychological notion of optimism bias, the tendency to be overly optimistic. These elucidations only stress that different explanations clarify the differences in average cost overrun between project types; the general belief that cost overruns are mainly the result of political-economic behaviour is not disputed.
A second remarkable finding concerns the improved project performance of rail projects in the new database including 806 projects (from an overrun of 45% to 34%). This can be explained as follows. In the original database the rail projects in the “other geographical areas” had relatively large cost overruns compared to projects in Europe and North America which increased the overall mean. In the new database, the number of projects has increased but only a few of those are projects in the “other geographical areas.” The projects in the “other geographical areas” with large overruns hence have less influence with the larger database resulting in a lower average overrun.
7.7.2 Netherlands versus the rest of the world
One of the most remarkable outcomes in the analysis of the Netherlands with the rest of the world is the much smaller average cost overrun for the Dutch projects compared to that of

120 Cost overruns in large-scale transport infrastructure projects
projects in the rest of the world. Another difference between both databases is the age of the projects; the projects in the Netherlands have been implemented more recently (range of 1991-2009 compared to a range of 1927-2009 for the international projects). If projects that are more recently implemented have lower cost overruns, this could explain the better cost performance in the Netherlands. We therefore tested whether the age influenced the extent of cost overrun. Age could be tested by using either the year of decision to build, the year in which construction started or the year of opening as the reference year. The year of opening is used here because the number of projects with information on this variable is the largest (607 projects compared to 338 and 147 projects with information on the year of decision to build and year when construction started respectively). Based on linear regression analyses with cost overrun and year of opening, there is no significant relation between both variables (p-values are 0.173, 0.116, 0.567 and 0.821 for roads, rail, bridges and tunnels). We therefore conclude that age does not influence the cost overrun; age can therefore not explain the difference in average cost overruns between the Netherlands and the rest of the world.
In addition to the average cost overrun, regarding the project types, it turns out that for road and tunnel projects, the Netherlands is not different from the rest of the world. However, for rail and bridge projects Dutch projects perform better, with statistical significance for rail projects although chance cannot be excluded. The statistical insignificance for bridge projects can be explained by the small number of observations for this type of project in the Netherlands.
7.7.3 Netherlands versus other NW European countries and other geographical areas
Comparing the cost performance between the Netherlands, other NW European countries and other geographical areas, it is remarkable that for road projects cost overruns do not vary with geographical location. The average cost overrun varies by only 3% and even the standard deviations are similar between the geographical areas. Also the increase in the number of projects with an additional 370 road projects hardly affected the average cost overrun. The project performance of road projects is relatively stable. This provides opportunities to improve cost estimation procedures for these types of projects.
In addition, the Netherlands has an extraordinary cost performance record for bridge projects, certainly in comparison with projects in the rest of the world which have on average cost overruns up to 4 to 7 times greater. However, the differences are non-significant, probably caused by the small number of Dutch bridges.
Lastly, and probably most remarkable, for rail projects Dutch projects perform significantly better than other NW European countries, which in turn perform better than the rest of the world. Considering the rail projects in more detail, the type of rail could possibly explain the lower average cost overrun. The Dutch rail projects are mostly conventional rail, whereas in the other geographical locations a considerable number of urban and high-speed rail projects are also included. Although the differences were non-significant, Flyvbjerg et al. (2003b) showed that high-speed rail projects top the list of cost escalation followed by urban rail and conventional rail. Based on the enlarged database, we tested again whether the cost performance of rail projects differed between different types of rail and whether this is different for the Netherlands. The same three types of rail were distinguished: conventional rail, urban rail and high-speed rail. Table 7-9 gives an overview of the number of projects, the average cost overrun and the standard deviation for the three different rail types and three different geographical locations.

Chapter 7 – Geographical variation in project performance 121
Table 7-9 Cost overruns for different rail types in the Netherlands, other NW European countries and other geographical areas
Rail Type The Netherlands Other NW-European countries
Other geographical areas
N Mean SD N Mean SD N Mean SD Conventional 23 8.7 32.6 27 20.4 37.3 - - - Urban 2 10.5 23.2 23 35.5 37.0 78 40.2 43.6 High-speed 1 55.0 - 14 26.1 25.2 4 98.8 24.0 Total 26 64 82
The representation of Dutch projects for urban rail projects and high-speed rail projects is too sparse to make a meaningful comparison with other regions. The focus is therefore here on conventional rail. Based on a Welch t-test the average cost overrun for conventional rail in the Netherlands is compared with that of other North West European projects. Although the cost overrun on average is smaller for the Netherlands with an average of 9.7% compared to an average of 20.4% for other North West European countries, the difference is not statistically significant (p=0.242). Because of the large variation, the better average performance could be due to chance.
To conclude, almost all projects in the Dutch sample concern conventional rail projects. Comparing these projects with conventional rail projects in the worldwide sample, the difference in average overrun between Dutch projects and other North-West European countries is not statistically significant. Neither is the larger average cost overruns of urban and high-speed rail projects than for conventional rail projects in North-West European (except Dutch) projects statistically significant. The significant difference in cost overrun between Dutch and other North-West European projects is not highly significant, and we cannot conclude whether it is due to a genuine better performance for the Netherlands or a difference between rail types.
7.8 Conclusions and discussion
Cost overruns are a worldwide phenomenon but a recent study showed that cost overruns in the Netherlands were considerably smaller than in the rest of the world. This paper aimed to establish the extent to which Dutch projects perform significantly better than other geographical areas and whether this differs for project types. Three geographical locations were distinguished: the Netherlands, other NW European countries and other geographical regions. Four project types were considered: road, rail, tunnels and bridges.
The study concludes that worldwide cost overruns differ with project type. Therefore in order to determine whether cost overruns vary with geographical location each project type should be considered separately. For roads and tunnels, the Netherlands performs similarly to the rest of the world. For bridge and rail projects, Dutch projects perform considerably better, with statistical significance for the difference in cost overrun for rail projects. Cost overruns of rail projects in the Netherlands are, depending upon the geographical area, 2 to 4 times smaller than in the rest of the world. Possible explanations may lie in the professionalism of the organisation or principal.
These findings have important scientific and policy implications. The study showed with statistical significance, as no other study has previously done, that geographical location matters for project performance, to a varying degree according to project type. It showed that

122 Cost overruns in large-scale transport infrastructure projects
the Netherlands performs better in delivering rail projects than other countries. Since geography matters, there could be other countries with significantly better or worse project performance. Insight into these countries could provide valuable information about the occurrence of cost overruns. Moreover, as geography matters, there might be other characteristics of countries that can explain the differences in project performance between countries. Countries are different in various aspects, e.g., the decision-making procedures or more generally their system of governance, and this could play a role in project performance as well.
Furthermore, the findings have important policy implications, in particular for the promising new forecasting method called “reference class forecasting (RCF) (Flybjerg and Cowi, 2004).” This method achieves accuracy in estimates by basing cost forecasts on actual performance in a reference class of comparable projects thereby bypassing both optimism bias and strategic misrepresentation. Based on the results of this paper, the reference group should be geographically dependent for rail projects. Since the project performance for rail projects differs with geographical location, for future cost forecasts for rail projects the reference group should only contain projects in that specific geographical area. For other types of projects, the reference group can contain projects all over the world. As the geographical location is now taken into account, the overall risk assessment is more detailed and more accurate, thus improving the project management of future projects.
This study was based on data on 806 projects, these were the best obtainable data within our research set. Further efforts to enlarge the database should be made, especially for collecting data for projects outside NW Europe. More data are particularly desirable for projects in developing countries. In addition, there are several important issues that need to be addressed in subsequent research. First of all, the cost performance of transport infrastructure projects in NW European countries should be examined in more detail and a cross-country comparison would be useful to derive the similarities and differences. Secondly, it should be determined whether other issues can explain the difference in average cost overrun between countries besides to geography, e.g. the decision-making culture or system of governance.

Chapter 7 – Geographical variation in project performance 123
References
Cantarelli, C.C., E.J.E. Molin, B. van Wee and B. Flyvbjerg (forthcoming-a). Exploring the danger of ecological fallacy and cost overruns during project development: The Dutch case for transport infrastructure projects.
Cantarelli, C.C., B. van Wee, E.J.E. Molin, and B. Flyvbjerg, B. (forthcoming-b). Different cost performance: different determinants? The case of cost overruns in Dutch transport infrastructure projects.
Flyvbjerg, B., M.K. Skamris Holm and S.L. Buhl (2002) Underestimating cost in public works. Error or Lie?, in: Journal of the American Planning Association, 68 (3), pp. 279-295.
Flyvbjerg, B., N. Bruzelius and W. Rothengatter (2003a) Megaprojects and Risk: An Anatomy of Ambition, Cambridge, Cambridge University Press.
Flyvbjerg, B., M.K. Skamris Holm and S.L. Buhl (2003b) How Common and How Large Are Cost Overruns in Transport Infrastructure Projects?, in: Transport Reviews, 23(1), pp. 71-88.
Flyvbjerg, B. and Cowi (2004) Procedures for Dealing with Optimism Bias. Transport Planning: Guidance Document, UK Department for Transport, London.
Flyvbjerg, B. (2007) Policy and planning for large-infrastructure projects: problems, causes, cures. Environment and Planning B, in: Planning and Design, 34 (4), pp. 578-597.
Merewitz, L. (1973) How do urban rapid transit projects compare in cost estimating experience? Proceedings of the International Conference on Transportation Research. First Conference. Reprint no. 104, pp. 483-493, Bruges, Belgium.
Ministry of Transport, Public Works and Water Management (1985-2009), MIT/MIRT Projectenboek (1985-2009), SDU Uitgevers, Den Haag.
Morris, S. (1990) Cost and Time Overruns in Public Sector Projects, in: Economic and Political Weekly, 15(47), pp. 154-168.
Nijkamp, P. and B. Ubbels (1999) How Reliable are Estimates of Infrastructure Costs? A Comparative Analysis, in: International Journal of Transport Economics, 26(1), pp. 23-53.
Odeck, J. (2004) Cost overruns in road construction – what are their sizes and determinants?, in: Transport Policy, 11(1), pp. 43–53.
Pickrell, D.H. (1990) Urban rail transit projects: forecasts versus actual ridership and cost, US Department of Transportation, Washington D.C.
Pickrell, D. (1992) A Desire Named Streetcar: Fantasy and Fact in Rail Transit Planning, in: Journal of the American Planning Association, 58(2), pp. 158-176.

124 Cost overruns in large-scale transport infrastructure projects

125
8. Conclusions, recommendations and reflection
8.1 Introduction
This chapter draws the main conclusions of this thesis. Section 8.2 provides an overview of the work presented in this research. Section 8.3 describes the most interesting research findings and answers the research questions raised in the introduction of this dissertation. After that, in section 8.4 recommendations and areas for further research are described. Lastly, a reflection is presented in section 8.5.
8.2 Overview of this research
This thesis has studied the phenomenon of cost overruns in large-scale transport infrastructure projects. The research objective included a theoretically-oriented and an empirically-oriented aim.
The theoretical part of this research aimed to explore the causes and explanations of cost overruns from a theoretical perspective. Based on a literature review, a systematic overview of the causes and explanations was created and it was indicated whether and how explanations were supported by theories. The phenomenon of lock-in was examined in greater detail as a possible explanation of cost overruns, indicators for lock-in were identified and whether lock-in has taken place in practice was considered. The last part of the theoretically-oriented research applied agency theory, which was identified as a promising means of explaining cost overruns. This application showed how the understanding of cost overruns was increased by using theories and how theories could be used to formulate measures to deal with cost overruns.
The empirical part of this thesis aimed to provide more insight into the project performance of individual countries and in particular that of the Netherlands. For this purpose, a database

126 Cost overruns in large-scale transport infrastructure projects
consisting of 78 large-scale Dutch projects was created. Based on statistical analysis, the frequency and magnitude of cost overruns were determined and the possible causes were examined. The Dutch data was furthermore compared with international projects to determine whether ecological fallacy played a role and whether cost overruns varied with geographical location.
The aim of this chapter is to present the key findings of this thesis and to provide recommendations based on these findings. The chapter concludes with a reflection.
8.3 Conclusions
8.3.1 Causes and explanations for cost overruns and their theoretical embeddedness
The literature on large-scale transport infrastructure projects generally recognises that cost overruns occur although there is less agreement on the causes and explanations for these overruns. Moreover, theories to support these explanations have hardly been addressed, whereas these could contribute considerably to the understanding of cost overruns. The research question that was addressed in this study in this respect was “Which causes and explanations for cost overruns of large-scale transport infrastructure projects are provided in the literature and how are these theoretically embedded and characterised?”
A variety of causes were identified from the literature, including: economic rational behaviour, strategic behaviour, optimism bias, and the structure of the organisation. The identified causes were grouped into four categories of explanations as found in the literature:
Technical explanations: forecasting errors in technical terms. Economic explanations: deliberate underestimation of costs (strategic behaviour) for
self-interest Psychological explanations: the cognitive bias leads to optimistic forecasts, and due to
the cautious attitude towards risks, people frame an outcome that maximises utility (in other words, they underestimate the costs).
Political explanations: deliberate cost underestimation, strategic misinformation and manipulation.
Table 8-1 provides an overview of the causes, explanations and theories used in the literature to support the explanations. There is a large variety of causes divided in four categories of explanations which are supported by various theories.
This study concluded that there is not one best theory that can be used to explain cost overruns. Depending upon the causes, a theory could be selected that could be used to better understand the reason for the cost increase. Furthermore, political explanations are the most useful and agency theory the most helpful to address these type of explanations. However, although agency theory is quite comprehensive, there may be aspects that cannot be addressed appropriately and other theories should therefore be examined as well.

Chapter 8 – Conclusions, recommendations and reflection 127
Table 8-1 Overview causes, explanations and theories used in literature on cost overruns
Causes Explanation Theories Forecasting errors including price rises, poor project design, and incompleteness of estimations Scope changes Uncertainty Inappropriate organisational structure Inadequate decision-making process Inadequate planning process
Technical Forecasting Planning Decision-making
Deliberate underestimation due to: - lack of incentives, - lack of resources, - inefficient use of resources - dedicated funding process - poor financing / contract management - strategic behaviour
Economic Neoclassical economics Rational choice
Optimism bias among local officials Cognitive bias of people Cautious attitudes towards risk
Psychological Planning fallacy & Optimism bias Prospect Rational choice
Deliberate cost underestimation Manipulation of forecasts Private information
Political Machiavellianism Agency Ethical
8.3.2 The emergence and influence of lock-in
Lock-in was expected to contribute to the understanding of cost overruns. It concerns the over-commitment of decision-makers to an ineffective course of action (e.g. a decision or project) and is considered in this dissertation to have a negative impact. Little was known about the influence of lock-in regarding decision-making of transport infrastructure projects. The research question was: “How can lock-in emerge, has it actually taken place in transport infrastructure projects, and if so, how did it occur and until what moment in the decision-making process could the decision be reversed?”
This study concluded that lock-in can occur both at the decision-making level (before the decision to build) and at the project level (after the decision to build) and can influence the extent of overruns in two ways: i) through “methodology”: cost overruns are often calculated according to the “formal decision to build” but due to lock-in the “real decision to build” is made much earlier in the decision-making process when costs are usually estimated as much lower. ii) through “practice”: inefficient decisions are taken that involve higher costs.
Within this study a framework was constructed that shows how lock-in can occur and how it can influence project performance. Figure 8-1 presents this framework showing four indicators for lock-in: sunk costs, need for justification, escalating commitment, and inflexibility and closure of alternatives. Two distinctions of lock-in were made: i) conscious versus unconscious and ii) intentional versus unintentional lock-in. These distinctions should be taken into account when taking measures to deal with lock-in.

128 Cost overruns in large-scale transport infrastructure projects
Figure 8-1 Theoretical framework lock-in
Two case studies (Betuweroute and HSL-South) showed that lock-in had actually taken place both at the decision-making and at the project levels. At the decision-making level, the real decision to build the projects preceded the formal decision to build. If the costs at the real decision to build had been taken as the basis for the costs the cost overruns for both projects would have been four times as large. At the project level, the limited freedom to change possibly inefficient decisions regarding the design of the project resulted in higher costs.
The study into lock-in showed that it is highly likely that the cost performance of transport infrastructure projects is worse than what is currently measured (with cost overruns based on the estimated costs at the time of the “formal decision to build”).
8.3.3 A game theoretical explanation for cost overruns
The third way in which cost overruns were addressed from a theoretical perspective in this thesis is a methodological one. Theories were considered useful, but a specific application that gave a formal account of how cost overruns occur had not yet been conducted. Agency theory was selected as the theory under scrutiny and the related research question was as follows: “How can agency theory be applied to illustrate the behaviour of parties leading to cost overruns of large-scale transport infrastructure projects?”
This thesis applied a signalling game to illustrate the behaviour of parties leading to cost underestimation. The game includes two players, a market party and a governmental party. The market party sends a signal (e.g. the tender price) and the governmental party has to decide whether to accept the tender or not. The problem of cost underestimation is caused by a failure in the signal from the market party to the governmental party, that is, the tender price is not accurate (too low) and the governmental party ends up with cost overruns. In order to avoid this situation the incentive structure of the market party needs to be changed such that an accurate signal (tender price) is sent to the governmental party.
The study showed the effects of introducing an accountability structure and a benchmark system as measures to reduce cost overruns. Both measurements provide more accurate
Solution starting point
Lock-in
Sunk costs (time, costs)
Need for Justification
Escalating commitment
Inflexibility, Closure
alternatives
Indicator OutcomeInput variables
Face-saving
Social pressures
Path dependency
Strategic behaviour
Political vulnerability
Investments
(decision-making and project level)
Agreements

Chapter 8 – Conclusions, recommendations and reflection 129
signals and hence avoid cost underestimation. However, they can also give rise to other types of strategic behaviour; i.e. signal jamming.
This study has shown that agency theory is highly useful not only to understand cost overruns but also to model possible policy measures to deal with cost overruns.
8.3.4 Cost performance of transport infrastructure projects in the Netherlands
In the empirical part of the research we investigated the cost performance of large-scale transport infrastructure projects in the Netherlands. International research into cost overruns concluded that cost overruns were more predominant than cost underruns. Due to the possible danger of ecological fallacy, it was impossible to use the results of the international study to estimate the problem of cost overruns in the Netherlands or in any other individual country. In addition, there was no indication whether transport infrastructure projects are more prone to cost overruns in specific phases of the project or not. Chapter 5 of this thesis addressed these subjects based on three research questions: 1. “How can the cost performance of large-scale transport infrastructure projects in the Netherlands be characterised regarding the frequency and magnitude of cost overruns, and does this support the danger of ecological fallacy?” 2. “To what extent have cost estimates of large-scale transport infrastructure projects in the Netherlands improved over time?” 3. “Are transport infrastructure projects more vulnerable to cost overruns during different project phases and if so, what are the differences between the phases?”
This study showed that in the Netherlands the average overrun is 16.5% (SD=40.0) with a range of -40.3% to 164.0%. Cost overruns were present in 55% of the projects and the extent of the overrun was larger than the extent of the underrun in projects with cost underruns. The frequency and average overrun in the Netherlands were considerably different to the worldwide findings, supporting the danger of ecological fallacy.
Secondly, both the year of completion and the year of formal decision to build did not show a relation with cost overruns, hence, cost estimates had not improved over time.
Lastly, this study showed that cost overruns are more common in the pre-construction phase than cost underruns and the extent of cost overruns is higher than that of the cost underruns. In the construction phase, it is the other way around. The main problem for cost overruns lies therefore in the period before construction starts.
8.3.5 Different cost performance of transport infrastructure projects: different determinants?
Although we concluded that the frequency and magnitude of cost overruns in the Netherlands differ from those in other countries, it is still too early to draw any firmer conclusions. The Dutch projects were therefore investigated in more detail in this thesis by considering three different determinants of cost overruns – project type, project size and the implementation phase. The aim was to investigate whether these determinants were also relevant for the variance in cost overruns of transport infrastructure projects in the Netherlands and whether these variables could explain the differences in cost performance between projects in the Netherlands and those in the rest of the world. To this end, Chapter 6 addressed three research questions: 1. To what extent is the cost performance different for different types of transport infrastructure projects? 2. What is the relation between project size and cost overruns? 3. To

130 Cost overruns in large-scale transport infrastructure projects
what extent does the length of the implementation phase influence the cost performance of transport infrastructure projects?
In the Netherlands, fixed link projects had the largest average cost overrun and rail projects the smallest. Conversely, in the rest of the world, rail projects have the largest average cost overruns.
Regarding project size, the study showed that overall, small projects have larger cost overruns, but in terms of absolute cost overrun, larger projects are more problematic. When project size was considered as a continuous variable it turned out that for rail projects cost overruns increased with project size. However, cost overruns were only slightly dependent on project size considering the small slope and low explained variance.
For Dutch transport infrastructure projects, and especially for fixed link projects, cost overruns increased with the length of the implementation phase. Moreover, for road and rail projects, the influence of the length of the pre-construction phase on cost overruns was larger than for that of the implementation phase.
To conclude, not only the frequency and magnitude of overruns is different in Dutch projects, the determinants differ as well. Furthermore, new insights were obtained into the period in which projects are most vulnerable to cost overruns.
8.3.6 Geographical variation in project cost performance
The cost performance of large-scale transport infrastructure projects in the Netherlands is thus different from those in other countries, which raises the question of whether geographical location plays a role. This study covered that subject, i.e. whether and to what extent cost overruns differ between different geographical regions. The research question addressed in chapter 7 of this thesis was: “To what extent do cost overruns of transport infrastructure projects within the Netherlands depend on geographical location and to what extent is the cost performance in the Netherlands statistically different from that worldwide?”
The study showed that geography matters to a varying degree for different project types. For road and tunnel projects there is no significant difference in cost performance between countries worldwide. The cost performance of road projects is similar in the Netherlands, other Northern European countries and other countries worldwide. The cost performance of rail and bridge projects is however different – Dutch projects perform better. Moreover, for rail projects Dutch projects perform significantly better than those in other North European countries, which in turn perform better than those in the rest of the world.
8.4 Recommendations
This section provides recommendations that follow from the findings of this research. The first section provides recommendations regarding the pre-construction phase of transport infrastructure projects and the second section gives recommendations regarding cost estimation. Finally, the third section describes areas for further research. The recommendations made in this thesis do not only apply for the Netherlands but are of interest to a much wider public, that is, all countries confronted with inaccurate cost estimates.

Chapter 8 – Conclusions, recommendations and reflection 131
8.4.1 Recommendations regarding the pre-construction phase of transport infrastructure projects
The two determinants with the largest influence on the extent of cost overruns are the length of the implementation phase and the length of the pre-construction phase. Cost overruns increase as the length of these phases increase. This does not however ensure smaller cost overruns when the length is reduced. There are underlying factors that interact and influence the extent of cost overruns as well. For example, cost overruns are also caused by the deliberate underestimation of costs, and as long as this strategic behaviour is endorsed, cost overruns will remain. Thus, cost overruns will only diminish if this strategic behaviour is managed, with a reduction in the length of the implementation or pre-construction phase. We therefore recommend controlling the length of the implementation or pre-construction phase as well as managing the occurrence of strategic behaviour.
Another determinant for cost overruns is the project size. For Dutch transport infrastructure projects as well as for Norwegian road projects (Odeck, 2004), relative cost overruns are larger for smaller projects. Combined with the worldwide findings that show that cost overruns are high for all project sizes, we agree with the policy implication of Odeck (2004) that “cost estimates for smaller projects should be set under the same scrutiny as those of larger projects”. For example, all projects can be made subject to a cost-benefit analysis. However, it should be taken into account that the benefits that are obtained by this measurement (smaller cost overruns) must offset the additional costs of carrying out these cost-benefit analyses. Thus, decision-making procedures could be expanded by putting small projects under the same scrutiny as those of larger projects, as long as the benefits of such an analysis outweigh the costs.
Project costs often turn out higher than estimated because over time changes are made that involve higher costs. These so-called scope changes mostly take place in the decision-making process and in the pre-construction phase; the phases in which the largest cost escalation take place. Sometimes, these scope changes are the result of salami-tactics (Flyvbjerg et al., 2002). This behaviour characterises itself by adding scope “slice by slice” after the decision to build the project has been made. It is usually intentional behaviour by project proponents to keep their costs low in this way and hence increase the chances of having their proposal accepted. However, not all scope changes are deliberate and some changes are necessary to increase the acceptance of the project. We therefore recommend managing scope changes to the extent to which they result in more support for the project.
It is important that project plans maintain some flexibility for changes to improve efficiency and development. The extent of this flexibility could however depend upon the project phase. In the initiation phase, the project is yet to be decided upon and flexibility leaves room for innovative and efficient designs. However, once the decision to build the project has been made, it is recommended that the project plans are made more resistant to changes. In that way, behaviour such as salami-tactics is discouraged. Decision-makers have to make their interest known before the decision-to-build and the decision will therefore be based on a more accurate design of the project. It should be noted that a stricter regulation of project changes after the formal decision to build is taken might reduce cost underestimation as a consequence of strategic behaviour, but might, at the same time, endorse other types of strategic behaviour. Costs could become such a key value that the project is realised within budget but at the expense of other project values e.g. quality. The possibility of making project plans subject to greater control could be considered in this respect, for example, include the range within which the project scope can change, include possible measurements that can be taken to

132 Cost overruns in large-scale transport infrastructure projects
reduce the cost of the project if scope changes occur, or establish a committee to review project plans.
Furthermore, cost overruns could be the result of influences such as lock-in. Due to lock-in, the real decision to build is often made before the formal decision to build, resulting in cost overruns. Hence, in order to reduce cost overruns, lock-in has to be avoided. An independent process supervisor could be helpful in this respect, by using the four indicators as a guideline for identifying possibilities for lock-in and when lock-in occurs, dealing with it.
The way in which lock-in affects the decision-making process of projects can be seen using cost-benefit analysis. Cost-benefit analysis is used for the ex-ante evaluation of projects to support decision-making; it is not necessarily binding. Hence, a negative cost-benefit outcome does not immediately imply that the project is rejected. Some projects are politically desirable despite their negative CBA outcome and are implemented regardless. In the Netherlands, there is a tendency to postpone the decision of the project rather than to decide to reject it (Annema et al., 2007). This can be explained by lock-in; due to the over-commitment to the project, instead of rejecting the project, they postpone the decision of the project to create opportunities to show its benefits and hence increase the chance of a positive decision. To a certain extent, decision-makers themselves can take lock-in into account and try to avoid this kind of over-commitment. We agree with the recommendations by TCI to be aware of early commitment, for example to avoid commitment when cost-benefit analysis is not yet solid or when cost estimates are not yet sound. In addition, we stress the existence of intentional lock-in, in which case these measures will not be effective. In that case, independent authorities or reviewers could be brought in to control this behaviour. Reviewers and the parliament in the Netherlands should pay more attention to the outcome of cost-benefit analyses, especially those for projects that are still to be deliberated upon but have, at first sight, a negative cost-benefit outcome. In addition, a review committee could be established and outcomes of the cost-benefit analyses could be published to increase transparency.
Lastly, it is generally acknowledged that projects that are well-managed have a better project performance. The data collection of Dutch projects showed that information is often not stored well or it is unknown where information can be found (see also reflection section). We therefore recommend that in the Netherlands the management of project documentation is better controlled for example, by introducing regulations, the standardisation of methods to store documentation, the creation of a central archive, and/or generating a digital database.
8.4.2 Recommendations regarding cost estimation
Most ex-ante evaluations of projects (e.g. cost-benefit analyses) focus on the benefits, whereby costs get less attention. Considering the large cost overruns that are involved in large-scale transport infrastructure projects, it is worthwhile increasing the focus on costs. Forecasting costs is difficult due to uncertainties in the planning environment (including amongst others the natural environment, social and political factors of decision-making). These lead to inaccurate cost estimates or scope changes. Such uncertainties are hardly taken into account in cost-benefit analyses. We recommend in this respect the introduction of uncertainty levels alongside the cost estimate, indicating for example the extent to which the project is subject to scope or cost changes.
Another problem to deal with as a result of the inaccurate cost estimates is that projects may be realised at the expense of other projects. In the Netherlands, the MIRT (Meerjarenprogramma Infrastructuur, Ruimte en Transport, translated as the Multi-year

Chapter 8 – Conclusions, recommendations and reflection 133
programme for infrastructure, spatial planning and transport21) is the implementation programme for all infrastructure projects in the Netherlands. There is usually a total amount of money available for infrastructure investments and this budget is allocated to different projects. If projects involve cost overruns and hence require more budget than initially foreseen, this additional budget is often made available at the expense of other projects. One could consider including a separate “special purpose” budget that is not related to any specific project but is available for the whole investment programme. If a project encounters cost overruns, additional budget can be allocated to the respective project from this separate special purpose budget. In this way, the realisation of other projects, for which implementation was decided and budget allocated, are no longer at risk. However, at the same time, this measurement has some caveats. The special purpose budget reduces the total budget that can be allocated to different projects and hence, either “cheaper” or fewer projects will be selected. In this first case, project proponents have a higher incentive to underestimate costs to increase their chances of being selected, and the result is again a cost overrun. In the second case, fewer projects will be implemented which reduce mobility and economic growth. In addition, project proponents might not feel addressed by the measurement as they consider themselves eligible for this special purpose budget. Therefore, in order for this measurement to succeed, strict rules could be enforced that prescribe when projects are given additional budget from this reserved post. We believe this measurement has potential but it has to be further developed and might only accomplish its aims in combination with other measurements (e.g. accountability structures).
Another possibility for improving the ex-ante evaluation of projects is applying “reference class forecasting”. This method is specifically aimed to improve the accuracy of cost estimates. It takes a so-called “outside view” of forecasting costs, instead of an “inside view” which is commonly used in conventional forecasting methods. This outside view is “based on the knowledge about actual performance in a reference class of comparable projects” (Flyvbjerg, 2006). This reference class is adjusted for the unique characteristics of the project in hand. The average cost of these projects in the reference class is usually higher than the initial cost estimates of the project under consideration, and hence the estimated costs could be adjusted accordingly (so-called optimism bias uplifts). Positive experiences with the method have been achieved in Denmark and the United Kingdom and we believe that the Netherlands, but also other countries that are confronted with inaccurate cost estimates, can benefit from the use of this method and hence recommend doing so.
8.4.3 Areas for further research
This thesis has provided new insights into the phenomenon of cost overruns from a theoretical and empirical perspective. It also revealed some new areas for further research aimed at improving the understanding of cost overruns. This section describes these possibilities for further research.
The explanations for cost overruns are diverse and there is a large number of theories that can be used to underline these theories. This makes it difficult to find an overall theory that captures the total understanding of cost overruns. Additional research could focus on the desirability of an overarching theory and how this theory might appear.
21 The translation of the MIRT in English is based on:
http://www.verkeerenwaterstaat.nl/english/topics/water/delta_programme/rules_and_framework_of_the_mirt (consulted 20-03-2010)

134 Cost overruns in large-scale transport infrastructure projects
One theory that is especially useful to understand cost overruns is agency theory. It can be applied to explain the behaviour of parties that underestimate costs and it can also be used to predict the effects of policy measures on the extent of cost overruns. It is recommended that further research is carried out to further develop the signalling model and to determine the extent to which it can actually be used in practice.
Based on a combination of theories, the phenomenon of lock-in was identified and explained in relation to cost overruns. There is however only a small amount of empirical evidence of its existence. This kind of evidence would have to show that the real decision to build was actually made before the formal decision to build. However, this decision-making point is often informal and usually not reported. Further research could focus on demonstrating whether and how lock-in has taken place in practice.
In addition to these recommendations regarding further theoretical research and making findings more widely applicable in practice, there are three recommendations for further research with respect to further data analyses.
First of all, it is worthwhile investigating in more detail the determinants that were shown to have a great influence on the extent of cost overruns. Especially the length of both the implementation phase and the pre-construction phase deserves more attention. At the moment there is a lack of understanding of these determinants in terms of whether a reduction in the length actually also reduces the cost overruns. A possible study in this respect would be to compare the average cost overrun of projects after measures were taken to reduce the length of the implementation or pre-construction phase with the average cost overrun of projects before these measures were taken. Subsequent research could analyse the relation between important determinants in greater detail.
Secondly, there are several project characteristics that have insufficiently or not yet been addressed in relation to cost overruns. One of these characteristics is the project ownership of projects. It is expected that projects with private involvement have a better cost performance than projects with only public involvement. Flyvbjerg et al. (2004) made a first attempt to investigate the relation of project ownership with cost overruns but could not make firm conclusions due to statistical insignificance. Considering the millions of Euros that the state invests in transport infrastructure, it would be particularly interesting to find out whether governments should continue with attracting private involvement or not. Besides, financial arrangements could be further investigated, e.g. the different contract types. In the last decade, there has been a tendency for integrated contracts but evidence that these projects perform better than projects with a standard design and construct contract is lacking. Further research into project ownership and financing of projects (including public private partnerships) in relation to cost overruns is recommended.
Thirdly, the research clearly showed that geography matters in cost performance. This raises questions concerning the reasons behind the differences in cost performance between countries. It is possible that the institutional settings of decision-making play a role. Further research in this respect could focus on institutional dimensions, level of democracy, the system of governance and the like.
Lastly, two areas for further research to deal with cost overruns are as follows. First of all, as the cost performance in the Netherlands was found to be different from the worldwide findings, the question is raised as to whether the optimism bias uplifts, which aim to increase the accuracy of cost estimates, are appropriate or whether specific uplifts for the Netherlands could be established. This also applies to other individual countries. Subsequent research

Chapter 8 – Conclusions, recommendations and reflection 135
could focus on the applicability of optimism bias uplifts for individual countries. Moreover, now that the international database has increased substantially from the database used in the studies in 2003 (Flyvbjerg et al. (2003b)) it might be possible to formulate more specific reference classes. Further research could focus on the way in which these reference classes can be formulated and how it influences the optimism bias uplifts.
Secondly, the question is raised as to whether reference class forecasting could also be applied to other areas of decision-making or evaluation. It could possibly be employed in cost-benefit analyses. When the effects of a project have to be estimated, the average effect on a class of reference projects could be used as well. In this way, the outcome of the cost-benefit analyses will be more robust and less subject to strategic behaviour of misinformation in order to reach a positive cost-benefit outcome. The downside is that it could be time consuming and might require additional financial means. Further research into the possibilities of applying reference class forecasting to a wider area is recommended.
8.5 Reflection
8.5.1 Policy reflection: position of this research
In the Netherlands, attention to cost overruns intensified after a large budget increase came to light for two recently implemented projects, the Betuweroute and the HSL-South. This led to the Lower Chamber investigating the decisions made for large-scale projects. As a result, two important studies were carried out, one in 2004 by the Temporary Committee on Infrastructure Projects, TCI22 (also Duivesteijn Committee) (TCI,2004a, 2004b, 2004c, 2004d), and the other in 2008 by the Committee Elverding in 2008 (Commissie Elverding, 2008).
The TCI was established to investigate the possibility of improving decision-making and control of the implementation of large-scale infrastructure projects. It resulted in several extensive reports describing the characteristics of large-scale projects and their relation with decision-making. The Betuweroute and HSL-South were addressed in detail in the reports. This thesis agrees with the findings of the TCI and in addition provides an overall picture of the cost performance in the Netherlands. Based on this dissertation we were able to conclude that the project performance is not as bad as we had expected after the Betuweroute and HSL-South. Moreover, compared to the worldwide findings, the Netherlands performs quite well. The thesis provides more insight into the frequency with which projects incur cost overruns, the magnitude of the overrun and the determinants of the cost overruns. Whereas the TCI report mentioned possible problems and causes, this thesis actually identified them.
The Committee Elverding was concerned with the sluggish decision-making on transport infrastructure projects in the Netherlands. Suggestions were made as to how the speed of decision-making could be increased. This thesis also considered this phase, before the formal decision to build has been taken, as one of the most problematic phases regarding cost escalation but adds hereto two further supplements: the notion of lock-in and the correlation between the length of the phase and cost overruns. Lock-in has been shown to be a particularly useful phenomenon in explaining the sluggish decision-making. Cost overruns increase with the length of the phase and this will probably also be the case for the length of
22 Temporary Parliamentary Commission on Infrastructure Projects

136 Cost overruns in large-scale transport infrastructure projects
the decision-making phase. However, the recommendations by the Committee Elverding to increase the speed of the decision-making phase may not result in better cost performance.
8.5.2 Methodological reflection
The reflection regarding the data that is used in this research focuses on two main aspects: the use of construction costs and the estimated costs that are used as a basis for calculating cost overruns.
First of all, this research uses construction costs instead of financing costs or life cycle costs. Financing costs consist mainly of accrued interest and are therefore sensitive to time. This type of cost is particularly sensitive to long delays, because delays defer income, while the interest, and the interest on the interest, keep accumulating. Long delays may result in projects ending up in the so-called “interest trap”, where a combination of escalating construction costs, delays and increasing interest payments result in a situation where the income from a project cannot cover the costs (Flyvbjerg et al. 2004). If financing costs are considered as the measure for cost performance, the average cost overrun would be much larger and it would have been much more difficult to compare projects. Life cycle costs are increasingly used in infrastructure investments. Measuring cost overruns would require a different approach since costs do not only include construction costs but also the costs for maintenance, repair, modifications and even the costs for the removal of infrastructure (van Wee and Tavasszy, 2008) and these costs are not all paid by the same authorities. In order to determine whether decision-makers were well-informed at the time of formal decision making, the costs have to be broken down into the costs for each individual party. Another difficulty concerns the data collection which has to cover a longer period of time as it also has to include the period after project completion.
Secondly, the estimated cost at the time of the formal decision to build is used in this research as the basis for measuring cost overruns. It should be noted in this respect that during the preparation and implementation of a project different estimates are made and that these estimates are referred to in different terms, e.g. estimate, contract sum, budget etc. The budget does not therefore necessarily refer to the budget at the time of the formal decision to build. Care must be taken when measuring cost overruns to ensure that the “correct” estimated costs are used.
A reflection on the data analyses concerns the method of statistical analyses. From the start of this research the aim was to conduct a large sample study that allowed for statistical analyses. For the purpose of this study this is the most appropriate method and the method is therefore not subject to debate. The main discussion regarding data analyses concerned the question of whether the Dutch projects should be considered as a sample or as a population.
The first viewpoint considered the data to be a population. The intention of the research was to include all large-scale infrastructure projects in the Netherlands completed after 1980, hence, no deliberate probability mechanism was applied to draw a random sample. Many of the identified projects did not have complete data on the most crucial variables, and these projects were therefore not included in the database. Hence, non-inclusion of a project should be regarded as non-response. The resulting database thus includes the entire population of large-scale infrastructure projects in the Netherlands completed between 1991 and 2009 for which we have complete data. As the data thus represent an entire population, there is no need for statistical significance testing.

Chapter 8 – Conclusions, recommendations and reflection 137
The second viewpoint assumes that the collected data represent large-scale infrastructure projects over a longer time period, also including the period before 1991 and the (near) future. This seems a reasonable assumption as Flyvbjerg et al. (2003b) showed that cost estimates of large-scale transport infrastructure projects have not improved over the last 70 years. Furthermore, if incentives to make accurate estimates or policy measurements have not been changed, it is very likely that future projects will be prone to a similar extent of cost overruns as the projects in this dataset. This point of view therefore considers that not all infrastructure projects are included in the database and therefore the collected data are regarded as a sample that requires statistical significance testing in order to be able to make any probability statements about the wider population.
The first viewpoint would imply that the results only apply for that specific population. However, for the purpose of this research we wanted to draw conclusions for a larger group of projects and hence decided to treat the Dutch projects as a sample.
8.5.3 General reflection
Data collection Much to our surprise, it turned out that the data collection for this research was more difficult than that of the international study. That is, in most other countries (and also for some developing countries), data could be collected more easily than in the Netherlands. The main problems with the data collection in the Netherlands were as follows:
1. Lack of knowledge about where information is stored: information on projects is stored at different departments of the Ministry of Infrastructure and the Environment and its agency RWS. Knowledge about which department keeps the documentation for which projects is lacking. Sometimes, the department that is responsible for controlling the project keeps the documentation, and at other times, the documentation is stored at the department that was responsible for the construction.
2. There is no central database: in addition to the lack of a central archive with project documentation, a central (digital) database with all large-scale projects in the Netherlands does not exist either. It seems as if there is no clue at all to how many projects have been implemented over the years.
3. Contact persons: at first, an attempt was made to contact the principal, executing department or project manager for each project. However, it was difficult to find out which people were involved and it was even more difficult to get in contact with these persons. This was probably caused by the fact that projects often involve a project team and once the project is implemented each member of the project team moves on to another function. This makes it difficult to trace back people (and with it project information).
4. Information gets lost: on some occasions, information was no longer available because documentation was lost, e.g. information is thrown away after a reorganisation or when the legal period to store documentation has passed.
5. Mismatch between the requested data and the information available: which documents and reports could be consulted to derive the data was often not known. In addition, projects are not reported in the same way, which makes it impossible to identify a standard way to look through documentation. Furthermore, the databases that RWS used to store and locate information were not suitable as a search engine for the specific data that we were looking for. As a consequence, data collection became very time consuming.

138 Cost overruns in large-scale transport infrastructure projects
6. Ill will: sometimes people were just not willing to cooperate because they were afraid of the outcomes of the research or the political unrest that it might cause. On other occasions they did not consider it important and were not willing to invest time tracing the information.
Furthermore, data collection was difficult because the variables for which data was collected were not as straightforward as expected. For example, costs could only refer to the construction costs (excluding VAT, financing costs, costs for measurement and the like), estimated costs had to refer to the estimate that was available to the decision makers at the time they made the decision to build the project and it was difficult to establish this moment and also difficult to find the estimate from that time. In addition, project documentation from initiation to opening and beyond was required to establish the physical features of the project and the way in which it changed over time. In this way, whether the project remained functionally identical to the planned project could be determined, but this turned out to be far more difficult than anticipated. Scope changes were included in the research as long as the function of the project remained the same.
Despite these problems with data collection, it was a great learning experience as well. The two most remarkable experiences were the influence of the Ministry and the diversity of responses. People usually became much more helpful when I mentioned that the research was carried out in cooperation with the Ministry of Infrastructure and the Environment. Although the kind of information requested should be made publicly available, with the subject at stake it is completely understandable that people are more cooperative when they know the Ministry supports this research. In that case, they are less worried about the results or political unrest that the research might cause. The responses that I got when collecting the data were extremely diverse. Some were just not interested, some almost angry that I asked, but others were very kind and helpful in providing data (they were willing to provide the information but this was usually not the specific data we were looking for).
The Netherlands as a starting point Since the Ministry of Infrastructure and the Environment initiated this research, the Netherlands was the starting point of this study. If another country had been chosen to study the results of the empirical part of this thesis may have been different (the theoretical part is not affected).
It is expected that the data collection process would have been different. Some of the experiences in data collection described above would probably also play a role in the data collection in other countries e.g. ill will or loss of information, but other experiences are considered typically Dutch, for example the fact that nobody seemed to know where the project documentations were being kept. If data was collected in another country, we may have had a larger sample or more data of the projects. Whether the results regarding the extent of cost overruns would have been the same as the findings in this research or not, remains to be seen. However, with hindsight we know that countries perform differently and hence it is worthwhile investigating more individual countries.
Results versus expectations At the start of my research I had high pretentions, aiming to develop a theory to explain cost overruns and formulate new solutions to reduce or solve cost overruns. These objectives turned out to be a little too ambitious.
Over time one gets more knowledge about one’s research subject and the areas that are most interesting. In this particular thesis, this was for example the case with the phenomenon of

Chapter 8 – Conclusions, recommendations and reflection 139
lock-in. This turned out to be a topic particularly relevant in the literature on cost overruns and we therefore decided to focus on this issue in more depth. In addition, when reviewing the literature on cost overruns and the extent to which causes and explanations were based on theories, we found that there was a large variety of causes and explanations, and the use of theories was also diverse. This made it much harder than expected to develop an overall theory. Instead we decided to start with focussing on one theory, agency theory, and to examine cost overruns by applying one specific theory.
Another reason for the difference in the result of this thesis and the expectations (as, for example, expressed in my research proposal) were the difficulties with the data collection. These were beyond the control of the researchers but turned out to have a tremendous effect on the scope of this research. Data collection was estimated to take about one year but eventually took three years. Not only did it require much more time, far less data was collected than the initial target. The lengthy time spent on collecting data meant that there was less time to investigate other aspects of cost overruns (for example cures for cost overruns).
Although the results are different from my first expectations, I am happy with the final product. I conclude that it is a balanced piece of research between theory and empiricism and that it has both scientific and social relevance.
References
Annema, J.A., C. Koopmans and B. van Wee (2007) Evaluating Transport Infrastructure Investments: The Dutch Experience with a Standardized Approach, in: Transport Reviews, 27 (2), pp. 125-150
Commissie Elverding (Commissie Versnelling Besluitvorming Infrastructurele Projecten) (2008) Sneller en Beter (Advisory Committee on Faster Decision-making about Infrastructure Projects), The Hague: Ministry of Transport, Public Works and Water Management.
Flyvbjerg, B., M.K. Skamris Holm and S.L. Buhl (2002) Underestimating cost in public works. Error or Lie?, in: Journal of the American Planning Association, 68 (3), pp. 279-295.
Flyvbjerg, B. (2006) From Nobel Prize to Project Management: Getting Risks Right, in: Project Management Journal, 37 (3), pp. 5-15.
Flyvbjerg, B., M.K. Skamris Holm and S.L. Buhl (2003b) How Common and How Large Are
Flyvbjerg, B., M.K. Skamris Holm and S.L. Buhl (2004) What Causes Cost Overrun in
Transport Infrastructure Projects?, in: Transport Reviews, 24 (1), pp. 3-18.
Cost Overruns in Transport Infrastructure Projects?, in: Transport Reviews, 23(1), pp. 71-88.
Odeck, J. (2004) Cost overruns in road construction – what are their sizes and determinants?, in: Transport Policy, 11(1), pp. 43–53.
TCI (2004a) Onderzoek naar Infrastructuurprojecten. Reconstructie Betuweroute: de Besluitvorming uitvergroot (Temporary Committee for Infrastructure Projects, Tweede Kamer der Staten-Generaal TK 2004 - 2005, 29 283, nr. 7), Sdu Uitgevers, The Hague.
TCI (2004b) Onderzoek naar Infrastructuurprojecten. Reconstructie HSL-Zuid: de Besluitvorming uitvergroot (Temporary Committee for Infrastructure Projects, Tweede Kamer der Staten-Generaal TK 2004 - 2005, 29 283, nr. 8), Sdu Uitgevers, The Hague.

140 Cost overruns in large-scale transport infrastructure projects
TCI (2004c) Grote Projecten Uitvergroot: Een Infrastructuur voor Besluitvorming (Temporary Committee for Infrastructure Projects, Tweede Kamer der Staten-Generaal TK 2004-2005, 29 283, nr.5-6), Sdu Uitgevers, The Hague.
TCI (2004d) Onderzoek naar infrastructuurprojecten (Temporary Committee for Infrastructure Projects, Tweede Kamer der Staten-Generaal TK 2004-2005, 29 283, nr.10), Sdu Uitgevers, The Hague.
Van Wee B., L.A. Tavasszy (2008) Ex-ante evaluation of megaprojects: methodological issues and cost-benefit analysis, in: Priemus, H., Flyvbjerg, B. and van Wee, B. (eds.) Decision-Making on Mega-Project. Cost-Benefit Analysis, Planning and Innovation, Edward Elgar Publishing, Cheltenham, UK and Northampton MA, USA

141
Appendices
A. Data collection and project selection
A.1 Data variables
The two most important data variables to determine the cost overruns are the estimated and actual costs. Cost overrun is measured as actual out-turn costs minus estimated costs in percent of estimated costs. Actual costs are defined as real, accounted construction costs determined at the time of project completion. Estimated costs are defined as budgeted or forecasted construction costs determined at the Time Of formal Decision to build (ToD). This is sometimes also called the "decision date”, "the time of the decision to proceed", the "go-decision" (Flyvbjerg, 2003a). At that moment, cost estimates were often available as data for decision-makers to make an informed decision.
In order for a project to be included in the research, data about the actual costs, the estimated costs and the ToD have to be known. Furthermore, to derive the actual costs, the project has to be completed at the time that this research is carried out (2010).
The main factors that are considered in this research are the following:
Project type: a category of projects having common characteristics Length: the measurement or extent of a project from one end to the other end; the
greater or greatest of two or more dimensions of a project Delay: the difference between the actual and planned opening year. Implementation phase: the difference between the actual opening year and the ToD Pre-construction phase: the difference between the year in which construction
started and the year of formal decision to build Construction phase: the difference between the actual opening year and the year in
which construction started

142 Cost overruns in large-scale transport infrastructure projects
Age: the difference between the year in which this research is carried out (2010) and the actual opening year
In order to measure the delay and construction phase, additional information is necessary. Data of the following additional variables is needed: actual opening year, estimated opening year, and the year in which construction started.
Table A-1 presents the total list of variables that are included in the database. This list distinguishes three categories of variables: variables either related to the characteristics of the project, to time or to costs.
Table A-1 List of variables
Variables related to project characteristics
Description of variable
Type Type of project (road, rail, fixed links) Length Length of the project Variables related to time Description of variable ToD Time Of Decision to build Estimated opening Planned opening year at ToD Actual opening Actual opening year Start construction Year in which construction started/cut the first sod Delay Difference between actual and planned opening year Implementation phase Difference between actual opening year and ToD Pre-construction phase Difference between year of construction start and ToD Construction phase Difference between actual opening year and year in which construction started Age Difference between 2010 and actual opening year Variables related to costs Description of variable Estimated costs Estimated costs at ToD Actual costs Actual costs at opening year Cost overrun Ratio of actual to estimated costs
A.2 Data sources
Several authorities were approached to select projects and collect data, amongst others, the Ministry of Transport, Public Works and Water Management; Rijkswaterstaat23; regional authorities; consultancy and construction companies. However, an overview of all large-scale transport infrastructure projects that were implemented in the Netherlands does not exist, and, consequently, data of projects was not systematically stored. This implies that the list of implemented projects had to be constructed based on different sources.
The MIRT (Meerjarenprogramma Infrastructuur, Ruimte en Transport, and in English the Multi-year programme for infrastructure, spatial planning and transport24) turned out to be a valuable source of information for the identification of large-scale projects and the collection of data. Next to the MIRT, several other sources of information were used to identify large-scale transport infrastructure projects and to collect data. The MIRT mainly includes road and rail projects and for fixed link projects other sources had to be applied
23 RWS, Rijkswaterstaat, is the executive agency of the Ministry of Transport, Public Works and Water Management,
responsible for the construction and maintenance of roads and waterways 24 The translation of the MIRT in English is based on:
http://www.verkeerenwaterstaat.nl/english/topics/water/delta_programme/rules_and_framework_of_the_mirt (consulted 20-03-2010)

Appendices 143
MIRT data source
The MIRT is the implementation programme related to the policy of ‘mobility and water’. It is part of the budget of the infrastructure fund of the Ministry of Transport, Public Works, and Water Management. The MIRT is supposed to include all large-scale public infrastructure projects in the Netherlands and it is, therefore, particularly useful for the selection of large-scale projects.
For this research the programmes of the years 1984-201025 were available. During this period, two large changes in the programme had taken place. First of all, before the year 2008 the programme was called MIT instead of MIRT. Spatial planning projects were not part of the programme. Secondly, the programmes of the year 1984-1989 were called MPP (Meerjarenprogramma Personenvervoer), translated here as “Multi-year Passenger transport Programme”, including only passenger transport and not freight transport. Both changes concern differences in the name of the programme and the types of projects that are included in the project. However, the aim of the programmes remained the same over the years. For reasons of communication it is referred to the MIRT of the years 1984-2010 in the remainder of this research.
The use of the MIRT documentation of the years 1984-2010 set demarcations to the research. The projects have to be realised in the period 1984-2010. Furthermore, to calculate cost overruns, the estimated as well as the actual costs of the project has to be known. The first year for which the estimated costs are provided is the year 1987. The estimated costs are the costs at the ToD and, therefore, only projects that have a ToD after 1986 can be included in the research. Several assumptions were made to determine whether the ToD was taken before or after 1986.
If the project was in the realization phase in the MIRT 1986 it is assumed that the ToD was before this year.
If the project was already in the realization phase in the first year in which the project is included in the MIRT it is assumed that the ToD was before this year.
Projects not only have to be completed after 1984 and before 2010, the ToD also has to be after 1986.
Project types The MIRT consists of three parts: the framework of rules, the governmental consultations and the project book. The framework of rules gives a description of the procedures. The governmental consultations concerns discussing the progress of previously made agreements and placing subjects on the agenda for subsequent consultations. The project book is an overview of investment projects and programmes. This third part, the project book, is relevant for the purpose of identifying large-scale projects and for collecting data of these projects.
In the MIRT a classification of projects is made into different project phases and project types. Regarding the project phases, projects are either in the exploration, planstudy or realisation phase. In this research, for the identification of large-scale projects, the projects in the realisation phase are considered. For these projects, the ToD had taken place and it is, therefore, likely that the projects have been completed. The other two phases are less suitable for the identification of projects because projects in those phases have not been formally decided upon and implementation is not yet certain.
25 With the exception of MIRT 1985

144 Cost overruns in large-scale transport infrastructure projects
Projects in the MIRT concern, road, rail or water projects. Water projects are not considered in this research. With respect to fixed link projects, there are only few projects included in the road and rail programmes of the MIRT. These projects are included as a fixed link project when the tunnel or bridge represents the main part of the costs. With respect to road projects, projects are either included in the national roads programme or in the regional/local roads programme. The projects in both programmes are similar regarding the project size in terms of costs. However, it is assumed that the projects in the national roads programme have a larger impact on the community, environment, and budgets. Therefore, only projects in the national roads programme are included in this research. With respect to rail projects, projects can either concern passenger or freight transport. The projects in both programmes are similar regarding the project size in terms of costs and it is expected that the impact on the community, environment, and budgets is also the same. Therefore, projects related to passenger as well as freight transport are included in this research.
The projects in the MIRT are of diverse characters:
Transport infrastructure projects concerning line infrastructure such as the construction of a new stretch of road or rail
Transport infrastructure projects concerning non-line infrastructure such as fixed link projects, crossings, connections, curves, bottlenecks, rail service centres and capacity measurements
Projects concerning supporting constructions such as projects related to stations, platforms, yards, bicycle shelter, energy and electrification
Projects concerning measurements to existing infrastructure such as projects related to utility (accessibility, intensification rail, and reliability), maintenance, safety, noise nuisance, adjustments to heavy trains and measures for noise nuisance and safety, and automation and general utilisation projects. The MIRT does not indicate to which project the measurement applies, e.g. a project is called “measurements for noise nuisance” but it is not indicated for which road or rail project and for which stretch of the project these measurements are taken.
Projects concerning financing such as projects related to completion costs, redemption costs for tunnels, realisation costs for projects in the implementation phase, preparation costs, and repayment of projects. The MIRT does not indicate to which project the financing applies, e.g. the project is called “redemption costs for tunnels” but it is not indicated which specific tunnels it concerns.
The categorisation of different projects mentioned above leads to a further specification of the large-scale transport infrastructure projects that are considered in this research.
Projects related to non-line infrastructure are typically of a smaller size in terms of project dimensions and it is, therefore, assumed that they attract less public attention or political interest because of few direct and indirect impacts on the community, environment, and budgets. Projects concerning supporting constructions, measurements to existing infrastructure and financing are not related to the transport infrastructure function itself and do not entail the construction cost. These projects are, therefore, not considered large-scale transport infrastructure projects in this research.
Large-scale transport infrastructure projects in this research concern projects that are not only road, rail or fixed link projects, but also concern line infrastructure and relate to the project function itself.

Appendices 145
Data variables The MIRT provides different information on projects. The financial tables in the project book of the MIRT include the total budget of each project and are particularly suitable to derive data of the estimated and actual costs of the projects.
In the MIRTs of the years 2001-2010, the project book includes next to the financial tables, descriptions of each project individually. A description of the problem and solution is provided, and the planning of the project regarding the year in which the ToD had taken place, the year in which construction will be started and the estimated opening year is indicated. For projects that are included in the MIRTs before 2001, the information that is provided about the project differs. Not all of the data that is required for this research is provided in the MIRTs and assumptions were necessary to derive the data. These assumptions are based on available information in the MIRT. Data on all of the variables and for all projects was eventually derived. Chapter 2 further elaborates upon these assumptions and describes the way in which cost overruns are calculated based on the MIRT.
Other data sources
The MIRT could not be used for the selection and data collection of fixed link projects. For tunnel projects, the internet was the only possible means to create a list of all tunnels that were implemented. Structurae, an international database and gallery for structures (http://en.structurae.de) was a useful source for this. This database was used to identify fixed links but it did not provide any information regarding the costs of the projects, hence, for data collection other sources had to be applied. For bridges, the database of the National Bridge Foundation (NBF) was a useful source for the identification of all bridges that were implemented in the Netherlands (http://bruggenstichting.nl). At this moment, 21 January 2010, the last update of the database was on 14 January 2010 and the database contained 1390 projects. This specific version of the database is used in this research. The database of the NBF provides information about the following (for this research relevant) variables: the type of bridge, the construction year (this is the year of construction start, Hans Rhee, NBF) and the dimensions of the bridge (length, width, span range and passage width). Information about the estimated and actual costs and the ToD, which is necessary to determine the extent of cost overruns are unfortunately not included in the database, and other sources have to be applied to derive this information.
For the collection of data of fixed link projects, the following methods were used:
Interviews with the project team or project leader: data was collected project by project.
Archives research at RWS direction Projects and the regional direction of RWS ZH Collaboration with King project team: King (Kennis in het Groot, translated here as
Knowledge in large) is a collaboration programme between Rijkswaterstaat and ProRail. The focus is on the development and exchange of knowledge about project management that is obtained during the implementation of large infrastructure projects. The King project team provided information for two projects specifically, the Betuweroute and HSL South project.

146 Cost overruns in large-scale transport infrastructure projects
A.3 Criteria for project selection
Based on the project types, data variables and available sources, the following criteria are used to select large-scale transport infrastructure projects:
1. Costs: actual costs at the time of project completion is larger than 20 million Euros (2010 prices) and the project has ‘significant’ costs that attract a high level of public attention or political interest because of substantial direct and indirect impacts on the community, environment, and budgets
2. Time: the project is completed after 1984 and before 2010 and the ToD was after 1986 3. Project type: projects concern road, rail or fixed links (bridges and tunnels) and for road
and rail projects, only projects related to line infrastructure and projects related to the project function itself are included. Projects related to non-line infrastructure, financing, supporting constructions, and measurements to existing infrastructures are not part of the research.
4. Data availability: data on the estimated and actual costs and the ToD should be available
A difficulty arises with the use of the selection criterion costs. The actual costs are based on the time of project completion. However, at the moment of project selection, the year of project completion is often not yet known and the actual costs can, therefore, not be established. It is very time consuming to derive the actual opening year for all of the projects in the research26. It is, therefore, considered justified to use the most recent budgeted costs as a reference to determine whether the project fulfilled the minimum cost requirement of 20 million Euros.
Another difficulty is with the selection of large-scale fixed link projects. The available information about the fixed link projects is insufficient to apply the criteria. For bridges, the database of the NBF does not provide data on costs or time which is necessary to apply the selection criteria. The criteria project type and data availability are not applicable. All projects in the database of the NBF concern the same project type and data on the costs are unknown for all projects. Regarding the time criterion, all projects in the database are completed and fulfil the requirement that the project is completed before 2010. Selection of projects based on the ToD is not possible because the ToD is unknown. The number of bridges can be narrowed down by considering only the projects that were completed from 1984 onwards.
However, the number of bridges is still large and it is practically impossible to derive the costs of hundreds of bridges to make a selection of the large-scale projects based on project size in terms of costs27. An additional criterion is, therefore, necessary to select the large-scale bridges. The length of the bridge is considered the surrogate variable for the costs. The size of the project in terms of its length can indicate whether a project is large-scale. Larger projects have a greater impact on the community, environment, and budgets and the length is, therefore, considered a suitable surrogate criterion for the project size in terms of costs. The minimum length for bridge projects is based on an intuitive judgment from impressions in the landscape, and concerns a length of 200 meters28. It is assumed that a bridge with a length of 26 It takes on average several hours to determine the actual opening year. It is practically impossible to establish the actual
opening year for the hundreds of projects in the MIRTs. It is, therefore, considered legitimate to use the most recent budgeted costs as a reference.
27 It takes on average one day to derive the costs of one project and in total more than two years to derive the costs for all of the bridges in the database of the NBF. The time that is necessary to derive the data is not in proportion to the extent of information that is acquired. It is, therefore, considered legitimate to use a surrogate criterion.
28 The Bouwkostencompas, an online resource for construction cost indices by the IGG Bouwkostenadvies en Archidat, is used to derive an estimate of the length of projects with costs of 20 million Euros. In this way, it is validated whether the minimum length of 200 meters that is used in this research was acceptable for the identification of large-scale projects.

Appendices 147
200 meters has minimum span range of 100 meters and a minimum passage width of 100 meters29. If the length of the bridge was unknown, the span range and the passage width were used to determine whether the length is larger than 200 meters, and hence if the bridge should be included in the research.
The surrogate criterion is formulated as follows:
5. Length: if the cost of the bridge is not known the project has to have a minimum length of 200 meters to be considered a large-scale bridge project.
The available information about the tunnel projects was also insufficient to apply the criteria to select the large-scale tunnel projects. It is time consuming to gather data on the costs (or on the other data variables) for all projects to be able to use the criteria for the selection of large-scale tunnel projects30. It was, therefore, necessary to define an additional criterion to select large-scale tunnels. In line with the chosen surrogate criterion for bridge projects, the length of the project is the additional criterion for the selection of large-scale tunnel projects. The minimum length of the tunnel is based on an intuitive judgment from impressions in the landscape and concerns a length of 500 meters31.
The surrogate criterion is formulated as follows:
6. Length: if the cost of the tunnel is not known the project has to have a minimum length of 500 meters to be considered a large-scale tunnel project.
The compass gives information about the cost per meter of a bridge. The cost of the bridge depends on the type of the bridge and the number of tracks. Regarding the type of bridge, the following types are distinguished: flyover, concrete bridge, cable-stayed bridge, draw bridge, bascule bridge, car bridge, and a bridge for slow traffic. Flyovers are not considered in this research. The bridges for car traffic in the Bouwkostencompas refer to bridges with lengths of 50 meters and do not fulfill the requirements of a large-scale project in this research. The costs per meter of a bridge were not available for bridges for slow traffic and for draw bridges and these types are, therefore, not considered in this examination. Regarding the number of tracks, bridges either have 2x1, 2x2 or 2x3 tracks. The compass provides for each type of bridge and for the different number of tracks the base costs including a low and high estimate. The cost per meter of a bridge is largely dependent on the type of bridge. For concrete bridges, considering the smallest possible bridge in terms of the number of tracks (2x1 tracks) and using the base costs per meter, the length of the bridge would have to be at least 1000 meters to costs more than 20 million Euros. For cable-stayed bridges, the minimum length is 700 meters. Bascule bridges are the most expensive and a bridge with a length of 100 meters already involves construction costs of more than 400 million Euros. Based on this examination it is concluded that the requirement of a minimum length of 200 meter is at the lower limit and a higher limit could have been chosen. However, the minimum length is considered acceptable because, in this way, the chance of rejecting projects that should have been included is minimised.
29 The span range and the passage width are both measures that refer to the length of the bridge. They are typically smaller than the total length and the minimum length of these measures is, therefore, set at 100 meters. This is a rather conservative measure; it is expected that projects with lengths of 200 meters will have a span range and passage width of more than 100 meters. However, these measurements are considered acceptable because, in this way, the chance of rejecting projects that should have been included is minimised.
30 It takes on average one day to derive the costs of one project and in total more than two months to derive the costs for all of the identified tunnels. The time that is necessary to derive the data is not in proportion to the extent of information that is acquired. It is, therefore, considered legitimate to use a surrogate criterion.
31 The Bouwkostencompas is used to derive an estimate of the length of projects with costs of 20 million Euros. In this way, it is validated whether the minimum length of 500 meters that is used in this research was acceptable for the identification of large-scale projects. The cost of the tunnel depends on the type of the tunnel and the number of tracks. Regarding the type of the tunnel, two types are distinguished: tunnels over land and tunnels with an open building excavation. Regarding the number of tracks, tunnels either have 2x1, 2x2 or 2x3 tracks. For each type of tunnel and for the different number of tracks the base costs are provided including a low and high estimate. For tunnels over land, considering the smallest possible tunnel in terms of the number of tracks (2x1 tracks) and using the base costs per meter, the length of the tunnel would have to be at least 800 meters to costs more than 20 million Euros. For tunnels with an open building excavation, the minimum length is 600 meters. Based on this examination, it is concluded that the requirement of a minimum length of 500 meter is at the lower limit and a higher limit could have been chosen. However, the minimum length is considered acceptable because, in this way, the chance of rejecting projects that should have been included is minimised.

148 Cost overruns in large-scale transport infrastructure projects
A.4 Projects in the database
Different criteria were applied to select large-scale projects for this research (costs, project type, time, data availability and length). Table A-2 gives an overview of the road and rail projects that were identified, the number of projects that were excluded (for each criterion specifically) and the number of projects that are eventually included in this research. Table A-3 provides this information for fixed link projects. Chapter 1 of the background reported related to this thesis describes the selection of the projects in more detail.
In total, 55 road, 32 rail, 8 tunnel and 7 bridge projects are included in this research.
Table A-2 Overview of road and rail projects in the database
# Projects excluded Project type
# in MIRT
Costs Time: before 2010
Time: ToD after 1986
Project type
Data availability
# in Database
Road 228 22 (10%) 18 (8%) 77 (34%) 33 (14%) 23 (10%) 55 (24%) Rail 203 + 132 63 (31%) 26 (13%) 0 (0%) 74 (36%) 11 (5%) 30 (15%)
Table A-3 Overview of tunnels and bridges in the database
# Projects excluded Project type
# Identified
Time: 1984 onwards
Time: before 2010
Length Data availability
Costs # in Database
Tunnels 61 15 (25%) 5 (8%) 14 (23%) 19 (31%) - 8 (13%) Bridges 1390 +133 916 (66%) 0 441 (32%) 16 (1%) 11 (1%) 7 (0.5%)
32 203 projects were identified by the MIRT and next to this one other projects was included, the Rotterdam Metro, because
data of this projects was readily available from the research of Flyvbjerg et al.(2003a) 33 1390 projects were identified by the database of the Bruggenstichting, and the MIRT identified 1 additional bridge

Appendices 149
B. MIRT-Methodology
For each of the data variables included in this research it is indicated in this chapter, how the data is derived from the MIRT. It concerns the following data variables:
1. Time of formal decision to build 2. Estimated opening 3. Actual opening 4. Start construction 5. Estimated costs 6. Actual costs 7. Cost overrun
B.1 Time of formal decision to build
Information in the MIRT The Time of formal decision to build (ToD) is specifically indicated only in the more recent MIRTs (2001-2010). In case the ToD is not available, several rules of thumb will be applied to determine the ToD. These rules of thumb are based on information from the MIRTs. However, the information that is provided in the MIRTs differs over the years and, consequently, the rules of thumb applied for each MIRT differ as well. First, information that is provided is listed after which the rules of thumb are provided.
For the different MIRT years, the information that is provided is as follows: 1984-1992: projects are indicated to be in realisation (group 1.1) or to be taken into
realisation in the respective MIRT period (group 1.2) or in a later period (group 2 or group 3)
1993: for road projects the priority category is indicated and for rail projects the project phase is indicated comparable with the phases used in 1994 and 1995. Regarding the priority categories, six possible priorities are distinguished: 1. projects in realisation, 2. projects with political commitment and governmental arrangements, 3. other projects of the accessibility plan Randstad, 4. other projects at hinterland connections, 5. other projects at the main axes, and 6. other projects at the main network. Priorities 1 and 2 are based on legal and political-governmental arrangements.
1994-1995: the project phases are indicated: 0. initiation, 1. study phase, 2. development phase, 3. design phase and 4. implementation phase. The development phase is the first phase in which the cost estimates are included.
1996-1997: projects are part of the plan study programme or of the realisation programme. For projects that are included in plan study programme, some of the following information is provided: procedures finished, ToD, start, estimated opening
1998-2000: projects are part of the plan study programme or of the realisation programme. For projects in the plan study programme, some of the following information is provided: study/initial plan, track/project note, design track/project decision, track/project decision, procedures finished, implementation assignment, and implementation period finished.
2001-2009: procedures finished, ToD, start construction, estimated opening

150 Cost overruns in large-scale transport infrastructure projects
Based on the information that is available for the project, assumptions can be made about the ToD. Table B-1 shows the rules of thumb in determining the ToD when the ToD is not available (starting with the first year in which the project is included in the MIRT with the exception of the years 2001-2010 in which the ToD is explicitly mentioned).
Table B-1 Rules of thumb in determining the Time of formal Decision to build
First time in MIRT (year)
Rule of Thumb
2001-2010 1 Derive ToD from the most recent MIRT (MIRT in which the project was last included), if not indicated, consider MIRT of year before ToD not indicated for the years 2001-2009: consider first MIRT in which project is included
1984-1992 2a Project in group 1.1 (in realisation) or group 1.2 (to be taken into realisation in that respective year): ToD was one year before, if not, consider the next MIRT year Project not in those groups within period 1984-1992: consider the next MIRT, 1993
2b If the ToD is established but the project was not yet included in the MIRT in that respective year, the upcoming year is used as the ToD
1993-1995 3a For road projects in 1993: projects with priority 1 or 2: ToD was one year before the project was first indicated with priority 1 or 2. If this is not indicated, consider next MIRT, MIRT 1994
3b For road (1994-1995) and rail (1993-1995): projects in phase 3 or later: ToD was one year before, if not, consider next MIRT
3c For rail (1993-1995): if phase is unknown but in u (u=uitvoering= realisation): phase is > 1: ToD was one year before
1996-1998 4a Projects in realisation phase: ToD was one year before 4b Projects in plan study phase: ToD is indicated, if not, year in which procedures
were finished is indicated, if this year is the same as the MIRT year or an earlier year: ToD was one year before, if not, consider next MIRT
1998-2000 5a Projects in realisation phase: ToD was one year before 5b Projects in plan study phase: ToD is indicated, if not, year in which procedures
were finished is indicated, if this year is the same as the MIRT year or an earlier year: ToD was one year before, if not, consider next MIRT
Chapter 2 of the background report presents the results of the systematic application of these rules to derive the ToD for each project individually.
Verification assumptions regarding the ToD For 46 of the 55 road projects and for 19 of the 27 rail projects34 the ToD was not specifically indicated in the MIRT and the assumptions were used to derive the ToD. The assumptions are verified by comparing the actual ToD (ToD that was specifically indicated in the MIRT) with the assumed ToD (ToD that was derived when the assumptions would have been applied) (Chapter 2 of the background report). The comparison can only be made for the 17 projects for which the actual ToD was known. Unfortunately, most of these projects were implemented during the years 2001-2009 and for this period, information is missing to apply the assumptions to derive the ToD. A comparison between the actual and assumed ToD is, therefore, only possible for projects for which the actual ToD was known and the assumed ToD could be established based on the assumptions.
The assumptions could be checked for 4 road projects. For one project, applying the assumptions resulted in a ToD that was one year earlier as compared to the actual ToD. For the other 3 projects, the ToD based on the assumptions was in a later year than the actual ToD
34 Note that 30 rail projects were selected but the data of 3 projects is derived from other sources than the MIRT)
Appendices 151
(2, 3 or even 7 years later). The estimated costs are more accurate because they are based on a ToD at a later time in the decision-making process. Consequently, this implies that, in this research, cost overruns are lower than in reality. The assumptions, therefore, create a bias towards the underestimation of cost overruns for road projects. However, care should be taken with this conclusion because it is based on only 4 of the total 55 road projects.
The assumptions with respect to the ToD could be verified for 8 rail projects. For 3 projects, applying the rules resulted in an assumed ToD that was the same as the actual ToD. For the other 5 projects, the assumed ToD was at an earlier time in the decision-making process as compared to the actual ToD (ranging from 1 year to 6 years earlier). This implies a bias in the database towards the overestimation of cost overruns for rail projects. The estimated costs will be less accurate because they are based on an earlier time in the decision-making process. The cost overruns for rail projects in this research are, therefore, likely to be larger than in reality. However, again, care should be taken with this conclusion because it is based on only 8 out of 27 projects.
The assumptions could not be verified for tunnels and bridges because the actual ToD was not known.
Scope change The project scope at the ToD is the scope that was known to the decision-maker when a decision about the project had to be taken. However, the scope of the project at the time of opening can differ from the scope at the ToD. For example, the stretch of the road is several kilometres larger or the road does not entail 2 but 3 tracks. It could be argued that scope changes should be excluded in the calculation of cost overruns because the project that is implemented is different from the project that was planned. However, for the purpose of this research, as a general rule and in line with the research of Flyvbjerg et al. (2003), scope changes are included for the following reasons. Scope changes can be a cause of cost overrun in itself. The scope of a project can
either increase or decrease during project development. However, these scope increases and decreases are typically not of the same order of magnitude and will result in cost overruns.
It is practically impossible to identify all scope changes in major projects. A decision must, therefore, be made about which scope changes to exclude (typically larger ones) and which to include (smaller ones). There is, however, no commonly accepted criterion to make a distinction between the larger and smaller scope changes. People have different opinions about what is considered a large or small scope change which makes it difficult to set an objective criterion.
Cost overruns often do not entail the error of comparing different projects but are the result of purposefully adding scope to the project at a later moment in the decision-making process. Project planners and promoters routinely ignore, hide or leave out important scope in order to make total costs appear low. Project scope is introduced ‘step-by-step’ or ‘one slice at a time’ also known as the practice of ‘salami tactics’.
For large-scale projects the actual scope is never exactly identical as the planned scope and this would make it impossible to calculate cost overruns for even a single project.
Scope changes are included in this research to the extent that the planned and implemented projects remain functionally identical. The project has to fulfil the same objective and serve the same market to be considered to have the same project function. If the project function remained the same over the years, the project will be included in the research. If the project

152 Cost overruns in large-scale transport infrastructure projects
function at the ToD is different from the project function at the time of opening, an attempt can be made to make the projects comparable. This can be done in two ways:
1. Adding or removing scope to the project at the ToD or at the time of opening 2. Adjusting the ToD to a year in which the project function is the same as the project
function at the time of opening. Adjusting the ToD is not possible if the ToD of the project was specifically indicated in the MIRT (actual ToD) because this ToD is fixed.
If it is not possible to make the projects functionally identical, it becomes meaningless to compare the projects, and it is decided, as an exception to the general rule mentioned above, not to include the project in further research.
For each project in this research (for which the data is derived from the MIRT), it is examined whether the planned and implemented projects are functionally identical and thus can be included in this research (Chapter 3 of the background report).
8 road projects could not be part of further research because they did not satisfy the scope of this research (realised, included in the national road programme) and 1 project because the ToD was not taken. In addition, 5 projects are excluded because the projects at ToD and opening are not functionally identical. It concerns the following projects:
1. A2 Oudenrijn-Everdingen 2. A5 Verlengde Westrandweg 3. N11 Alphen a/d Rijn – Bodegraven 4. N35 Wierden-Almelo 5. A73 Venlo-Maasbracht
Next to this, information of 4 projects was insufficient to establish reliable and valid data on the ToD and costs and these projects are excluded as well.
1. A12 Zoetermeer West-Zoetermeer Oost 2. A15 Vaanplein-Ridderster 3. A32 Heerenveen-Grouw 4. A76 Zuiderbrugtracé
For 5 road projects the ToD was adjusted to make the project at the ToD comparable with the project at the time of opening. It concerns the following projects:
Table B-2 Adjusted Time of formal Decision to build for road projects
Project ToD based on assumptions
Adjusted ToD after changes
A12 Lunetten-Bunnik 1988 1990 A4 Prins Clausplein-Knpt Ypenburg-Harnash-Delft 1988 1989 A9 Alkmaar-Den Helder 1994 1995 N50 Kampen-Ramspol-Emmeloord 1994 1996 A15 Reconstruction hardinxveld-Giessendam and Sliedrecht 1996 1998
Lastly, one project is excluded to avoid double counting. This concerns the project A15 Europaweg incorporating amongst others the construction of the Calandtunnel. The Calandtunnel itself is included in the tunnel category. Comparing these costs of the Calandtunnel with the costs of the project A15 Europaweg, it turns out that the costs of the Calandtunnel are more than 90% of the total costs of the A15 Europaweg. Since the tunnel project was already included within the tunnel category, including the road project as well would result in measuring the tunnel project twice. Therefore, only the data of the

Appendices 153
Calandtunnel is included in the database. In total 36 road projects are included in the database that are functionally identical.
Regarding rail projects, the railway line Leiden-Woerden could not be part of further research. The project was removed from the MIRT after several years because additional research showed that there was no need for the project. Next to this, 2 projects are excluded because the projects at ToD and opening are not functionally identical. It concerns the following projects:
1. Woerden-Harmelen fase 1 2. Rotterdam Zuid-Dordrecht
For 2 rail projects the ToD was adjusted to make the project at ToD comparable with the project at the time of opening. It concerns the following projects:
1. Diemen – Weesp 2. Boxtel – Liempde
Lastly, one of the projects in this category (Uitgeest de Kleis) turns out to be a tunnel for road traffic and since the length of the tunnel is less than 100 meters it cannot be considered as a large scale tunnel project in this research but rather it will be considered as a road project.
Regarding the 3 tunnel and 2 bridge projects that were based on the MIRT, only for one tunnel project the function changed to such an extent that the ToD was adjusted to one year later.
Chapter 4 of the background report gives an overview of the ToD of the projects after taken into account the project function.
Consequences assumptions and changes in ToD For several projects the ToD has been adjusted to a later moment in the decision-making process. The costs at a later moment in the decision-making process are more accurate and this could raise the question whether cost overruns are underestimated in this study. However, the data do not show that this is the case; on the contrary, cost overruns for road projects in the Netherlands are higher as compared to the cost overrun for road projects in other countries. Note that only for 5 of the 36 road projects, the ToD is adjusted.
For rail projects there was little information available to track down the project development over time. It was assumed that if the MIRT did not report any project changes, the project function remained the same. This assumption can have consequences for the extent of cost overruns because it cannot be certain whether the scope changes lead to changes in the functionality of the project. This implies that part of the cost overruns found for rail projects can be caused by comparing projects that are functionally different. However, considering the small average cost overrun of 10% for the projects for which no project changes were indicated, it can be concluded that the assumption “project function remained the same if no changes are indicated” is justified. If the project did entail large scope changes, this would have been resulted in larger cost overruns.

154 Cost overruns in large-scale transport infrastructure projects
B.2 Estimated opening year
The estimated opening year is the expected year of opening at the ToD. If the estimated opening year is unavailable at the ToD, then the nearest available estimate of the opening year is used as a baseline, i.e. the nearest in the sense that the number of years between the ToD and the year of estimate is the smallest possible for the estimates available. For example, the ToD is in 2004 but the expected opening year is not provided in the MIRT of 2004. The estimated opening year is indicated in the MIRT 2005 and 2006. In that case, the nearest available year of estimate is the year 2005 and the estimated opening year is based on the MIRT year 2005.
The MIRTs of the years 1984-1989 do not include information about the estimated opening year for road projects. For projects for which the ToD was taken in this period, the estimated opening year is, therefore, not available. For these projects, the estimated opening is based on the nearest available year of estimate, the year 1990. For 13 of the 37 road projects, the ToD was before 1990 and the estimated opening year was, therefore, not based on the ToD but on the year 1990. Similarly for 3 fixed link projects, the ToD was before 1990 and the estimated opening was not available and, therefore, not based on the ToD but on the year 1990.
For 7 projects, the ToD was after 1990, but the estimated opening year was not indicated in the MIRT of the respective ToD. For these projects, the estimated opening year is, therefore, based on the nearest available estimate of the opening year (usually one year later, with the exception of two projects (N31 and Willemsspoortunnel), for which the year of estimate is three and two years later than the ToD respectively).
Table B-3 Assumed estimated opening year
Project ToD Estimated Opening
Source
N14 1994 2007 1995 N31 1998 2005 2001 A15 2000 2004 2001 Uitgeest de Kleis 2000 2003 2001 Aanpassing Houten 1998 2000 1999 Delfthavense Schiebruggen 1985 1992 1986 Willemsspoortunnel 1984 1994 1986
Using these assumptions regarding the estimated opening year creates bias in the database regarding the delay of projects. For several projects in this research, the estimated opening year is based on a later moment in the decision-making process because the estimated opening year at the ToD was unavailable and had to be based on the nearest available year of estimate. An estimate of the opening year usually becomes more accurate over time and, consequently, the difference between the actual and estimated opening year (the delay in project implementation) is smaller. It is, therefore, expected that, mainly for road projects, the average delay in this research is lower than in reality. The delay is underestimated in this research. In order to make an estimate of the bias, the delay based on the estimated opening year at ToD should be compared with the delay based on the nearest available estimate of opening year. Most of the road projects (13 of the 17) for which the estimated opening year at ToD is unavailable have a ToD in the period 1984-1989. Since for none of the projects with a ToD in this period the estimated opening year at ToD is available, it is not possible to establish the bias in delay for road projects. The bias in delay for rail and fixed link projects is considered negligible since the delay is only for 3 of the 41 projects based on the nearest available estimate of opening year instead of on the estimated opening year at ToD.

Appendices 155
B.3 Actual opening year
The actual opening year is the year in which the project is taken into operation. The actual opening year should be distinguished from the year of realisation (year in which the project implementation is finished). The MIRT, however, does not indicate the year of opening but instead reports the year of realisation. The MIRT only indicates the year of opening when a project was taken into operation before it was completed.
It is, therefore, reasonable to assume that the year of realisation for road and rail projects is the same as the year of opening. When the year of opening is unknown, the last year for which costs were indicated in the MIRT is considered the actual opening year.
This assumption is verified by comparing, for projects for which the year of opening is indicated in the MIRT, the year of opening with the last year in which costs were provided in the MIRT (Chapter 5 of the background report). The assumption regarding the year of opening is used for 3 of the 37 road projects. The assumed year of opening based on the last year for which costs were known is on average 0,9 years later than the actual opening year that was indicated in the MIRT. The assumption is, therefore, not accurate and should be adjusted. The new assumption for projects for which the year of realization is not indicated in the MIRT is therefore as follows: the opening year is one year before the project was last included in the MIRT.
The assumption regarding the year of opening is used for 6 of the 23 rail projects. The assumed year of opening based on the last year for which costs were available is on average 1,4 years later than the actual opening. The assumption is not accurate and had to be adjusted. The new assumption for rail projects for which the year of opening is not indicated in the MIRT is, therefore as follows: the opening year is 1,5 years before the project was last included in the MIRT.
For each of the projects it is examined if the project is realised since only projects that are completed are included in this research. If it is not specifically indicated that the project is realised, but the project has been in implementation for at least two years, it is assumed that the project is realised. Next to this, the website autosnelwegen.nl was consulted to determine whether the project was taken into operation. This website includes the history of the highways in the Netherlands and is particularly useful to determine whether the project is realised. It is concluded that all of the projects are implemented.
This comparison is made for road and rail projects but not for fixed link projects. For fixed link projects, the general assumption that the actual opening is one year before the project is last included in the MIRT. His cannot be verified because there are too few projects to make this verification.
B.4 Start construction year
The start of construction is the year of break ground (cut the first sod). For road and rail projects that are implemented within the 2001-2009 period, the year in which construction is started is often indicated in the MIRT. This information is not readily available in the other MIRT years. If the year of construction start is not available, assumptions have to be made to determine the year of construction start. These assumptions are based on information that is provided in the MIRT.

156 Cost overruns in large-scale transport infrastructure projects
Table B-4 provides an overview of the rules of thumb that are applied to determine the year in which construction started.
Table B-4 Rules of thumb in determining the year in which the construction started
First time in MIRT (year)
Rule of Thumb
2001-2009 1 Derive year of construction start from most recent MIRT (MIRT in which the project was last included), if not indicated, consider MIRT of year before Construction start not indicated for the years 2001-2009: consider first MIRT in which project is included
1984-2000 2a MIRT x indicates the start in year x+1 ---> construction not yet started thus consider next MIRT (MIRT x+1) MIRT x+1: project in realization or in realisation table ---> construction of the project could not have been started 1 year before thus start construction in year x+1 If this does not apply: consider assumption 2 b, c, d or e
2b MIRT x indicates the start in year x or in year x-1 ---> construction not yet started thus next MIRT (MIRT x+1) MIRT x+1: if project is in realisation --> start is 1 year before=x (assumption 2c) If this does not apply: consider assumptions 2 d or e
2c Project is indicated as in realisation: use oldest MIRT start is 1 year before 2d Project is indicated as in R table: use oldest MIRT start is 1 year before 2e If the project is not included in the MIRT year in the derived start year, the first
year in which the project is included in the MIRT is used as the year in which construction started
2f If the project function is different at the start year as compared to the project function at ToD, the start year is the first year in which the project function is the same.
The assumptions were applied for 22 of the 37 road projects, 16 of the 23 rail projects, 1 of the 3 tunnel projects and 1 of the 2 bridge projects. Chapter 6 of the background report describes for each project individually how the year in which construction started is determined based on these rules.
It is assumed that if the month is unknown (which is the case for the different events ToD, estimated opening, actual opening and year of construction start), the event took place halfway through the year, which is common practice in this type of research.
Verification assumptions regarding the start of construction The assumptions are verified by comparing the actual year of construction start (year of construction start that was specifically indicated in the MIRT) with the assumed year of construction start (year of construction start that was derived when the assumptions would have been applied) (Chapter 6 of the background report). The comparison can only be made for the projects for which the actual year of construction start was known.
The assumptions could be checked for 12 road projects. For 3 road projects, applying the assumptions to derive the year of construction start resulted in the same year as the actual year of construction start. For the other projects, applying the assumptions resulted in a year of construction start that was earlier than the actual construction start (on average 2 years earlier). The assumptions could be checked for 7 rail projects. The year of construction start based on the assumptions is on average 2.5 years earlier than the actual year of construction start. The assumptions could not be verified for tunnels and bridges because there are too few projects to compare.

Appendices 157
It could be argued to adjust the assumptions accordingly, thus adjust the year of construction start that was derived from the assumptions by 2 years for road projects and by 2.5 years for rail projects. If the assumption would have been adjusted, this would have resulted for 28 of the 40 projects in a year of construction start that is before the year of formal decision to build. Although this is not impossible, the number of projects for which this is the case is unrealistically high such that adjusting the year of construction start that is based on the assumptions is not considered a better estimate. In addition, since there are only few projects for which the validation could be carried out, it is preferred to stay with the original assumptions but take these validation results into account in interpreting the results.
For example, because of these assumptions, it is likely that the length of the pre-construction phase is overestimated and the length of the construction phase is underestimated in this study since the year of construction start is earlier in reality as compared to in this study.
Furthermore, the estimated costs at the year of construction start are larger in this study that in reality (since the estimated costs become more accurate over time and the year of construction start is at a later moment in time in this study than in reality) and hence, the cost overruns before construction start are overestimated. Likewise, the cost overruns after construction start are underestimated. The bias in the cost overrun before and after construction start is not calculated because it was not considered realistic to adjust the assumption by changing the year of construction start into a year that is 2 years earlier (see above).
B.5 Estimated costs
Estimated costs are the costs at the ToD. When the estimated costs are not available at the ToD, the nearest available reliable estimate of the costs is used as a proxi. This is the case for 1 road, 1 rail, 2 tunnel and 2 bridge projects. “This is typically a later estimate resulting in a conservative bias in the measurement of the cost development”. Estimated costs at a later time are often more accurate and cost overruns based on a later moment in time will, therefore, be underestimated. By investigating the cases with complete information, it can be estimated that cost overruns presented in this study are about 1% lower because of this assumption35.
35 For 6 of the 65 projects, estimated costs are not based on the year of ToD but on a later year. Note that ToD+1= one year
after the ToD The average cost overrun based on estimated costs at the ToD is 16.8% (N=59). The average cost overrun based on estimated costs at the ToD+1 is 7.6%. For each project for which the estimated costs are not based on the ToD but on the ToD+ 1, the average cost overrun is 0.16% lower than in reality. The average cost overrun based on estimated costs at the ToD+2 is 8.2% (N=59). For each project for which the estimated costs are not based on the ToD but on the ToD+2, the average cost overrun is 0.14% lower than in reality. The average cost overrun based on estimated costs at the ToD+3 is 0.6% (N=53, only projects for which the period between ToD and opening is at least 5 years are included, otherwise the cost overruns based on the estimated costs at the ToD+3 will not make any sense). For each project that is not based on the ToD but on the ToD+3, the average cost overrun is 0.31% lower than in reality. For 3 of the 6 projects, the estimated costs is not based on the ToD but on the ToD+1, for 2 projects the estimated costs is not based on the ToD but on the ToD+2, and for one project the estimated costs are not based on the ToD but on the ToD+3. In total, the bias as a consequence of the estimated costs not based on the ToD but on a later year is 1.1%.

158 Cost overruns in large-scale transport infrastructure projects
B.6 Actual costs
The actual construction costs are the costs at the actual opening year. If the actual costs are not available at the time of project completion (year of opening), the most reliable later figure for actual costs is used (i.e. from a year later than the opening year), if available. If unavailable, an earlier figure for actual costs may be used (i.e., from a year before the opening year), but only if 90% of the budget was spent at this time (the project was 90% complete in financial terms).
For six road projects the actual costs were unavailable at the time of project completion. A later figure for actual costs was not available, and therefore, an earlier figure for actual costs was used. These are the costs from a year before the opening year, the year 200036. Five of the six projects suffice the criterion that 90% of the budget had been spent in this year but one project did not fulfil this requirement. The project is included in the database after all, since it hardly influences the overall cost performance. If the project was left out, the average cost overrun would have been 0.06% lower.
For three rail projects the actual costs were unknown at the time of project completion. For one project, the costs of the project one year later than the opening year were provided and these are used as the actual costs. For two projects, the costs of the project from a later year than the opening year were not available and an earlier figure is used37.
For one tunnel project the actual costs were unknown at the time of project completion and a later figure for actual costs was not available. An earlier figure, from one year before the actual opening, was used for the actual costs. This was possible because more than 90% of the budget was spent at that time38.
The actual costs for both bridge projects were available at the time of opening.
By investigating the cases with complete information, it can be estimated that the cost overruns presented in this study are about 0.8% higher because of this assumption39.
36 This is possible because more than 90% of the budget was spent. A12 Lunetten-Bunnik (65/65=100%), A4 Leiden-Pr.
Clausplein (257/264=98%), A27 Eemnes-Almere (192/198=97%), A9 Alkmaar-Den Helder (57/63=90%). One project did not satisfy the condition that 90% of the project was spent, this concerned the project A2 Aansluiting Meibergdreef (19/70=27%) for which only 27% was spent.
37 These concern the projects Amersfoort-Amersfoort connection, and Groningen-Leeuwarden. For the project Amersfoort-Amersfoort connection, the opening year is 2001 and the costs for 2000 are the last available costs. The total costs are 275 million guilders, of which 268 million guilders was spent before 2000 and 7 million guilders are expected costs in 2000 and 2001. Thus 97% of the budget was spent in the year before opening and it is, therefore, valid to use the earlier figure as the actual costs. For the project Groningen-Leeuwarden, it is possible to use an earlier figure because more than 90% of the budget was spent in that year. The opening year is 2001 and the costs for 2000 are the last available costs. The total costs are 150 million guilders, of which 142 million guilders was spent before 2000 and 8 million guilders are the expected costs in the year 2000. Thus, about 95% of the budget was spent one year before the opening year and it is, therefore, valid to use the earlier figure as the actual costs.
38 A29 Rotterdam-Heinenoord (251/257=98%), 39 For 10 of the 65 projects, actual costs are not based on the year of opening but on an earlier or later year.
The average cost overrun based on the year of opening is 19.08% (N=55). The average cost overrun based on the year before opening is 24.58%. For each project for which the actual costs are not based on the year of opening but on the year before, the average cost overrun is 0.11% higher than in reality. The average cost overrun based on the year after opening is 12.10%. For each project for which the actual costs are not based on the year of opening but on the year after opening, the average cost overrun is 0.15% lower than in reality. For 9 of the 10 projects, the actual costs are not based on the year of opening but on one year before opening, and for 1 project, the actual costs are not based on the year of opening but on one year after opening. In total, the bias as a consequence of actual costs not based on the year of opening is 0.80%.

Appendices 159
B.7 Cost overrun
The way in which the information from the MIRTs are used to determine the estimated and actual costs and eventually the cost overruns for road and rail projects is described by the following 6 steps:
1. Determine total budget for each MIRT year: derive the total costs of the project for each year from the realization tables of the MIRT reports.
2. Changes values into Euros: convert the costs indicated in guilders into Euro (1 Euro: 2,20371 Guilders)
3. Correct values for inflation: “the costs in each estimation year is expressed in prices of the year of publication of the current MIRT (for example: MIRT 2005 is published in September 2004, estimation years from 2005 are all expressed in prices 2004)” (Wim Groot, KiM). In order to compare the actual costs with the estimated costs, the costs should be expressed in the same price level. In line with the research of Flyvbjerg et al. (2003), the year 1995 was used as a base level. Based on expert opinions the most appropriate indices were determined. - For road projects the GWW index from the Netherlands National Accounts, an
index for “ground, water and road construction” is foremost applied for road projects and is, therefore, considered the most appropriate index for this research. Three index series are used, namely 1979=100, 1995=100 and 2000=100. The indexes were coupled as described in the report by Elfering “Basisverlegging prijsindexcijfers GWW” (CBS, 2005). A distinction is, furthermore, made between an ‘open’ and ‘closed’ surface. ‘Open surface’ concerns the pavement and ‘closed’ surface concerns the asphalt. In this case, new road projects are characterized as ‘open surface’. For the years 1979-1997 two index figures and for the years 1998-2009 four index figures are published every year. In this research, in line with the propositions by KiM the average over the year is taken.
- For rail projects, for the years 1971-2001 the index provided by ProRail will be used and for the period 2002-2009 the index for GWW for railways specifically will be used.
4. Exclude VAT in values: the values reported in the MIRT include VAT. Research on cost overruns typically present costs without VAT. VAT is, therefore, also excluded in the costs for the projects in this research. “The VAT-system distinguishes two different tariffs, a low one of 6% and a high one of 19%. Costs of projects are built up of three main categories: construction costs, real estate costs and engineering costs. For construction costs and engineering costs the high tariff has been applied, but for the real estate costs the low tariff has been applied. For a correct comparison between projects, the costs figures have to be split up in two categories – building and engineering costs and real estate costs - and subsequently the costs should be adjusted with the appropriate VAT-tariff” (Wim Groot, KiM). Due to the lack of the public accessibility of these data (the way in which the costs constitute the three cost categories), costs are corrected for VAT by the following rule: 1/6 according to the low tariff and 5/6 according to the high tariff. This rule was established by experts of RWS. The VAT of both tariffs had changed during the years. Table B-5 presents the changes of the VAT tariffs over the years. Next to the difference in the high and low tariffs, the different tariffs over the years will be taken into account in adjusting the costs for VAT.

160 Cost overruns in large-scale transport infrastructure projects
Table B-5 VAT changes
Years Low tariff High tariff 1979-1983 4% 18% 1984-1985 5% 19% 1986-2010 6%
1986-1988 20% 1989-1991 18.5% 1992-2000 17.5% 2001-2010 19%
5. Determine formal decision to build: see the rules of thumb in determining the ToD in
section 2.5.1. 6. Determine the cost overruns: the cost overruns are calculated by comparing the actual
costs with the estimated costs at the ToD. Formula: ((actual costs-estimated costs)/estimated costs) x 100%.
The method is described in more detail in Chapter 7 of the background report by applying the method for an example project.
B.8 Verification MIRT Methodology
The method is verified by two second opinions: 1. KiM: The Netherlands Institute for Transport Policy Analysis (KiM) conducted a
second opinion about the way in which cost overruns were calculated based on the MIRT.
2. RWS: Rijkswaterstaat, agency of the Ministry of Transport, Public Works and Water Managements, verified the method of calculating cost overruns including the assumptions that were made regarding the ToD and the start of the construction.
The second opinions are presented in Chapter 8 of the background report.

161
Summary
Background
The Channel Tunnel between France and the UK, the Great Belt link in Denmark, or the Central Artery Tunnel in Boston America, they all have one unfortunate thing in common: immense cost overruns. Construction costs of the Channel tunnel increased from £2600 million to £4650 million (1985 prices) which is an 80 per cent increase. The Great Belt link suffered a cost overrun of 54%. The actual cost of the Central Artery Tunnel, also known as “Big Dig” or “Big Dug”, turned out to be US $ 11 million or 275 per cent higher than the forecasted costs. These are only a few of many projects with cost overruns. One of the leading pieces of research in this area, covering 258 projects across 20 nations and 5 continents, concluded that in 9 out of 10 projects, actual costs are higher than estimated. Cost overruns occur for different project types, with average overruns of 20% for road, 41% for rail, and 34% for fixed link projects (tunnel and bridge). Further and perhaps even more disturbing is their finding that cost overruns have not decreased over the past 70 years.
There are four main concerns with cost overruns. First of all, they lead to a Pareto-inefficient allocation of resources. Cost forecasts are often inaccurate but the extent to which they are incorrectly estimated differs between projects. This may affect the ranking of projects and the decision-maker is hence likely to implement an inferior project. Secondly, a project that involves cost overruns requires additional work regarding funding and decision-making which takes time and consequently increases the projects’ costs even further. Thirdly, cost overruns “destabilize policy, planning, implementation, and operations of projects”. Cost overruns can lead to continuous reapproval and unrest in the project organisation and parliament. Fourthly, “the problem is getting bigger because projects get bigger”. Needless to say, the financial consequences of cost overruns in terms of net total overrun increase with project size. Moreover, when projects become more and more expensive and still involve cost overruns, the financial consequences can become so large that it may destabilise the finances of a whole country or region.

162 Cost overruns in large-scale transport infrastructure projects
Also in the Netherlands, cost overruns appear in projects, evidencing the large budget increase for two recently implemented projects; the Betuweroute and the HSL-South. Beside these two projects, however, little is known about the general cost performance in the Netherlands. Since the literature generally agrees that cost overruns are a common feature of megaprojects and as cost overruns seem a worldwide phenomenon, there is no reason to assume that this would be any different in the Netherlands. However, the extent of the problem of cost overruns in the Netherlands is unclear and little is known about its regularity and magnitude or whether estimates have improved over time. Unfortunately, due to the possible existence of ecological fallacy, results of existing studies cannot be used to postulate about cost performance in the Netherlands and neither for other individual countries. A first indication of the extent of the problem of cost overruns in the Netherlands could be based on the geographical location of the Netherlands. European and North American countries tend to have more moderate cost overruns but there is a lack of evidence whether cost overruns actually vary with geographical location.
Most studies on cost overruns focus on the frequency and magnitude but surprisingly little research has been carried out into the project phases in which projects are most prone to cost overruns. Costs might increase marginally over the years or severely in specific phases. Knowledge about this may be helpful to understand whether cost overruns are foremost a planning or a project management problem.
The literature on large-scale transport infrastructure projects generally recognises that cost overruns occur although there is less agreement on the causes and explanations. A categorisation of explanations that is regularly used in this research area is between the following four types of explanations: technical, economic, psychological and political explanations. Technical explanations consider cost overruns the result of “forecasting errors” in technical terms, for example, imperfect forecasting techniques, inadequate data and lack of experience. Economic explanations depict underestimation as deliberate and economically rational. Psychological explanations are based on the concepts of planning fallacy and optimism bias, a systematic tendency for project appraisals to be overly optimistic. Political explanations consider cost overruns the result of strategic misrepresentation, that is, the deliberate and strategic underestimation of costs when forecasting the outcomes of projects.
Despite these valuable insights in ways to explain cost overruns, overruns remain a problem in large-scale transport infrastructure projects. In this respect, opportunities lie in addressing cost overruns from a theoretical perspective. A sound theoretical basis is particularly important as it substantiates the explanation and provides opportunities to define appropriate cures. Insight into the theories underlying the explanations for cost overruns has been the subject of only a few studies.
Beside these four categories of explanations, “lock-in”, the escalating commitment to a course of action or project, is considered to have an important contribution in explaining cost overruns. However, little is known about how lock-in can emerge, whether it actually had taken place and to what extent it can explain cost overruns.
Several remedies for cost overruns have been proposed, many of which are focused on institutional arrangements to improve accountability. Four basic instruments that were suggested in this respect are: transparency, specification of performance, explicit formulation of the regulation regime and mobilisation of risk capital. These measurements are foremost effective when planners do not consider it important to get forecasts right because optimistic forecasts are seen as a necessary means to get projects started. If planners do consider it
Summary 163
important to get forecasts right, better forecasting methods, e.g. reference class forecasting, are proposed as a cure for forecasting inaccuracy.
Notwithstanding the fact that past studies have provided valuable insights of the existence, causes and explanations of cost overruns and even provided possible cures to deal with them, as became clear from the above, the current state of knowledge suffers from several drawbacks particular related to the problem and causes of cost overruns. The main aim of this research is therefore “to obtain a better understanding of the phenomenon of cost overruns”. This research aim is split into a theoretical and an empirical-oriented research aim. The theoretical-oriented research aim is as follows: This research aims to explore the causes and explanations of cost overruns from a theoretical perspective. The empirical-oriented research aim is as follows: This research aims to provide more insight into the project performance of the Netherlands and to compare this performance with the performance in other countries.
This thesis’ contents
This thesis consists of two main parts, a theoretical followed by an empirical one. The theoretical part starts with a literature review. This review includes studies addressing project performance in general and studies focussing specifically on cost overruns. The review gives an overview of the various causes, explanations and the theories that were used herein. It shows that political-economic explanations are considered the most helpful in understanding cost overruns. The focus in the rest of the thesis is therefore on this type of explanation. Overall, a large variety of theories is and can be applied to support political-economic explanations with agency theory having the largest potential in this respect.
A second literature review is conducted to derive the forces behind the phenomenon of lock-in. A conceptual model of these forces is built that shows how lock-in can occur and how it may influence the extent of cost overruns. Furthermore, two case studies are carried out to illustrate how the conceptual model can be used to determine whether and how lock-in had taken place in the project.
In addition to these literature reviews and case studies, a model is built that gives a formal account of cost overruns. This formal account is based on agency theory and applies this theory by means of a signalling game. This game describes the relation between the principal and agent (in this specific case between the governmental party and the market party) and how the behaviour of both parties eventually can result in cost overruns.
The empirical part of the research is based on a dataset of large-scale transport infrastructure projects in the Netherlands. This dataset was built during the research and includes data about the main project features (e.g. length), time variables (e.g. decision to build, opening year) and cost variables (e.g. estimated and actual costs) of in total 78 Dutch transport infrastructure projects. The collected data is used for statistical analyses regarding the extent and determinants of cost overruns in the Netherlands. In addition, the dataset is used to compare the cost performance in the Netherlands with other countries worldwide.

164 Cost overruns in large-scale transport infrastructure projects
Conclusions
This section presents the main conclusions for each of the chapters 2 to 7. The first three chapters, chapters 2 to 4 address the theoretical-oriented research aim, chapters 5 to 7 address the empirical-oriented aim.
Chapter 2 provides an overview of the causes and explanations for cost overruns and their theoretical embeddedness based on a broad literature review. With this overview it is aimed to answer the following research question: “Which causes and explanations of cost overruns in large-scale transport infrastructure projects are provided in literature and how are these theoretically embedded and characterised?”
A variety of causes were identified, amongst others: economic rational behaviour, strategic behaviour, optimism bias, and the structure of the organisation. The identified causes were grouped in the four categories of explanations that were found in literature: Technical explanations: cost forecasts are inaccurate due to imperfect techniques, lack
of experience and the like. These concerns forecasting errors in technical terms. Economic explanations: costs are deliberately underestimated for reasons of self-
interest Psychological explanations: underestimated costs are explained as the result of the
cognitive bias that leads to optimistic forecasts. In combination with the cautious attitude towards risks, people frame an outcome that maximises utility (in other words, they underestimate the costs).
Political explanations: cost overruns are the result of deliberate cost underestimation, strategic misinformation and manipulation.
Both economic and political explanations use utility as a basis to understand cost underestimation but the former reason from the lack of incentives and resources whereas the latter explains this in terms of interest and power.
The extent of use and variety of theories used in the literature is quite large. Table 1 provides an overview of the causes, explanations and theories used to support the explanations.
This study concluded that there is no one best theory that can be used to explain cost overruns. Depending upon the causes, a theory could be selected that can be used to better understand the reason for the cost increase. Furthermore, political explanations are the most useful and agency theory the most helpful to address these type of explanations. However, although agency theory is quite comprehensive, there may be aspects that cannot be addressed appropriately and other theories should therefore be examined as well.

Summary 165
Table 1 Overview causes, explanations and theories
Causes Explanation Theories Forecasting errors including price rises, poor project design, and incompleteness of estimations Scope changes Uncertainty Inappropriate organisational structure Inadequate decision-making process Inadequate planning process
Technical Forecasting Planning Decision-making
Deliberate underestimation due to: - lack of incentives, - lack of resources, - inefficient use of resources - dedicated funding process - poor financing / contract management - strategic behaviour
Economic Neoclassical economics Rational choice
Optimism bias among local officials Cognitive bias of people Cautious attitudes towards risk
Psychological Planning fallacy & Optimism bias Prospect Rational choice
Deliberate cost underestimation Manipulation of forecasts Private information
Political Machiavellianism Agency Ethical
Chapter 3 proceeds by examining lock-in in greater detail. The research question that is addressed in this chapter is as follows: “How can lock-in emerge, has it actually taken place in transport infrastructure projects, and if so, how did it occur and until what moment in the decision-making process could the decision be reversed?”
Lock-in refers to the over-commitment of decision-makers to an ineffective course of action (e.g. a decision or project). There are several possible moments in the decision-making process before the formal decision is taken at which decision-makers are committed to the project. This early commitment is in itself not necessarily negative but it is once the commitment turns into escalating commitment and lock-in. Lock-in is in this thesis based on escalating commitment and has, by definition, a negative influence on project performance. The phenomenon of lock-in supports in this way political explanations for cost overruns.
This research concludes that lock-in can occur both at the decision-making level (before the decision to build) and at the project level (after the decision to build) and can influence the extent of overruns in two ways. First of all, lock-in can influence the extent of cost overruns through the “methodology” of calculating cost overruns. Cost overruns are often calculated according to the “formal decision to build” but due to lock-in the “real decision to build” is often made much earlier in the decision-making process. The costs estimated at that stage are usually much lower than those that are estimated at a later stage in the decision-making process, thus increasing cost overruns. Secondly, lock-in can affect cost overruns through “practice” which refers to the inefficient decisions that are taken that involve higher costs.
Based on a literature research, this thesis constructed a framework that shows how lock-in can occur and can influence project performance. Figure 1 presents this framework showing the four main indicators for lock-in at the decision-making and the project levels.

166 Cost overruns in large-scale transport infrastructure projects
Figure 1 Theoretical framework lock-in
Sunk costs lead via their irretrievable costs directly to lock-in at the project level. In addition, when the amount of time or costs invested in the project increases, the commitment to the project or decision increases concurrently. This makes it more difficult to reconsider the decision: an indication of lock-in at the decision-making level. The need for justification arises due to social pressures and “face-saving” mechanisms. If the position of the decision-maker is threatened he might feel the pressure to continue with the project despite low support and contradicting information about the feasibility of the project, to avoid admitting a personal failure. Escalating commitment can be the cause of an excessive focus on one outcome, previously made agreements, strategic behaviour and actions motivated by political reasons. Lastly, the indicator inflexibility and the closure of alternatives stems from path dependency. A decision route becomes path dependent when previous decisions or events subject to inflexibility or closure of alternatives determine the current decision and the decision cannot be revised. Decision-makers who make a certain decision within an inflexible or incomplete decision-making process are likely to be influenced by lock-in. This research further notes the distinctions between conscious and unconscious lock-in and between intentional and unintentional lock-in. These distinctions are important when taking measurements to deal with lock-in.
Two case studies (Betuweroute and HSL-South) show that lock-in had actually taken place both at the decision-making and at the project levels. At the decision-making level, the real decision to build the projects preceded the formal decision to build. If the costs at the real decision to build had been taken as the basis for the costs, the cost overruns for both projects would have been four times as large. At the project level, the limited freedom to change possibly inefficient decisions regarding the design of the project resulted in higher costs.
The study into lock-in showed that it is highly likely that the cost performance of projects is worse than estimated.
Chapter 4 presents a third way in which cost overruns are addressed from a theoretical perspective. It includes the application of a specific theory, agency theory, in explaining cost overruns from a political-economic perspective. The related research question is as follows:
Solution starting point
Lock-in
Sunk costs (time, costs)
Need for Justification
Escalating commitment
Inflexibility, Closure
alternatives
Indicator OutcomeInput variables
Face-saving
Social pressures
Path dependency
Strategic behaviour
Political vulnerability
Investments
(decision-making and project level)
Agreements

Summary 167
“How can agency theory be applied to illustrate the behaviour of parties leading to cost overruns?”
A specific type of agency theory i.e. a signalling game is modelled. This game is particularly suitable to address strategic behaviour between two parties (in this case the governmental party and the market party) caused by asymmetric information. In short, the market party sends a signal (e.g. the tender price) and the governmental party has to decide whether to accept or reject the proposal. The problem of cost underestimation is caused by a failure in the signal from the market party to the governmental party, that is, the tender price is not accurate (too low) and the governmental party ends up with cost overruns. This situation can occur when the market party lacks the incentive to provide an accurate signal (tender price, an “honest” price for which he can actually realise the project) or when the governmental party lacks the ability to estimate whether the signal is accurate or not.
In addition, two policy measures were modelled by a signalling game to illustrate how they can intervene and influence the extent of cost overruns. These concern the introduction of an accountability system and a benchmark system. The accountability system removes the incentive of the market party to provide underestimated costs because he is now held responsible for any additional costs and his behaviour is reprimanded if he cannot realise the project against the agreed budget. The benchmark system reduces the information asymmetry between parties by providing additional information to the governmental party who can now decide whether or not to accept the proposal based on full information. Both measurements provide more accurate signals and hence avoid cost underestimation. However, they can also give rise to other types of strategic behaviour; i.e. signal jamming.
This study has shown that agency theory is highly useful not only to understand cost overruns but also to model possible policy measures to deal with cost overruns.
Chapter 5 investigates the cost performance in the Netherlands. Due to the possible danger of ecological fallacy, it was impossible to use the results of the international study to estimate the problem of cost overruns in the Netherlands or in any other individual country. A study into cost overruns in one specific country, carried out with the same methodology as the worldwide research was necessary to determine whether ecological fallacy is a real threat. The Netherlands was chosen as the country under scrutiny as this research was supported by the Dutch Ministry of Infrastructure and the Environment. The focus on one country made it possible to study along the extent and causes of cost overrun, the period in which projects were most vulnerable to cost overruns. The resulting research questions are as follows: 1. “How can the cost performance of large-scale transport infrastructure projects in the Netherlands be characterised regarding frequency and magnitude of cost overruns, and does this support the danger of ecological fallacy?” 2. “To what extent have cost estimates in the Netherlands improved over time?” 3. “Are transport infrastructure projects more vulnerable to cost overruns during different project phases and if so, what are the differences between the phases?”
This study showed that in the Netherlands the average overrun is 16.5% (SD=40.0) with a range of -40.3% to 164.0%. Cost overruns were present in 55% of the projects and the extent of the overrun was larger than the extent of the underrun in projects with cost underruns. This implies that not only are costs more often underestimated than overestimated, but the extent to which cost are underestimated is larger than the extent to which costs are overestimated. In the worldwide study, the average cost overrun varied between 20% for road projects, 34% for fixed link projects and 45% for rail projects, and overruns appeared in 86% of the projects.

168 Cost overruns in large-scale transport infrastructure projects
Considering these large differences in average and frequency we must conclude that the Netherlands performs considerably different to the world and hence, ecological fallacy is a real threat.
Similar to the worldwide study, the situation in the Netherlands regarding cost estimation has remained the same over time. Based on statistical analyses no relation was found between the year of completion and the year of formal decision to build; cost estimates had not improved the last 20 years.
Lastly, this study showed that cost overruns are more common in the pre-construction phase than cost underruns and the extent of overruns is higher than that of the underruns. In the construction phase, it is the other way around. The main problem for cost overruns lies therefore in the period before construction starts.
Chapter 6 proceeds with an examination of the cost performance in the Netherlands by focussing on the determinants of cost overruns and comparing these with the worldwide findings. Three independent variables and their relation with cost overrun are examined in order to decide whether this is different for Dutch infrastructure projects compared to worldwide findings. The three independent variables are project type (road, rail and fixed link projects), project size (measured in terms of estimated costs), and the length of the project implementation phase. The related research questions are as follows: 1. To what extent is the cost performance different for different types of transport infrastructure projects? 2. What is the relation between project size and cost overruns? 3. To what extent does the length of the implementation phase of transport infrastructure projects influence the cost performance?
For Dutch projects, average cost overrun is 10.6% for rail, 18.8% for roads and 21.7% for fixed links. This is the quite the opposite to the worldwide findings where rail projects have the largest overrun.
Regarding project size, the study showed that small Dutch projects have the largest average percentage cost overruns, but in terms of total overrun (e.g. in mln Euro), large projects have a larger share. Worldwide research showed that cost overruns are large for all project sizes.
The length of the implementation phase and especially the length of the pre-construction phase are important determinants of cost overruns in the Netherlands. With each additional year of pre-construction, percentage cost overrun increases by five percentage points. In contrast, the length of the construction phase has hardly any influence on cost overruns. This is an important contribution to current knowledge about cost overruns, because the period in which projects are most prone to cost overruns is narrowed down considerably, at least in the Netherlands. This implies that in studying causes and cures for cost overruns, the pre-construction phase should be the focus.
Chapter 7 statistically tests whether cost overruns vary with geographical location. It does so for the Netherland and worldwide. The research question is: ““To what extent do cost overruns of transport infrastructure projects within the Netherlands depend on geographical location and to what extent is the cost performance in the Netherlands statistically different from that worldwide?”
For the Netherlands, 6 different geographical areas are distinguished: North Netherlands, East Netherlands, South Netherlands, Central Netherlands, Noord-Holland and Zuid-Holland. These later two regions included the projects with the highest average cost overrun, but

Summary 169
overall, the difference in average cost overrun between regions was not statistically significant.
Furthermore, the study showed that for a worldwide coverage of projects, geography does matter. Taking project type into account, geography matters with a varying degree. For road and tunnel projects, there is no significant difference in cost performance between countries worldwide. The cost performance of road projects is similar in the Netherlands, other Northern European countries and other countries. The cost performance of rail and bridge projects is however different; Dutch projects perform better (with statistical significance for rail projects). Moreover, for rail projects Dutch projects perform significantly better than other North European countries, which in turn perform better than the rest of the world.
To conclude, this thesis has both theoretical as empirical contributions to the current state of the art. It showed that theories are promising means to increase the understanding of and dealing with cost overruns. Cost overruns are a complex problem with many determinants and this research contributed by demonstrating that cost overruns vary with geographical location and that the main problem lies in the pre-construction (and decision-making) phase. This implies that cost overruns is particularly a planning problem rather than a project management problem and particular attention should therefore be paid to the early phases of decision-making, a phase in which project proponents are sensitive to lock-in.

170 Cost overruns in large-scale transport infrastructure projects
171
Samenvatting
Achtergrond
De kanaaltunnel tussen Frankrijk en het Verenigd Koninkrijk, de grote Beltbrug in Denemarken en the Central Artery Tunnel in Boston USA hebben allen een onfortuinlijke overeenkomst: enorme kostenoverschrijdingen. De bouwkosten van de Kanaaltunnel stegen van £2600 miljoen naar £4650 miljoen (prijspeil 1985), een toename van 80 procent. De grote Beltbrug ondervond een kostenoverschrijding van 54%. De werkelijke kosten van de Central Artery tunnel, ook wel bekend als de “Big Dig” of “Big Dug”, bleek US $11 miljoen ofwel 275 procent hoger dan de voorspelde kosten. Dit zijn slechts enkele voorbeelden van een groot aantal projecten met kostenoverschrijdingen. Eén van de meest vooraanstaande studies in dit onderzoeksgebied concludeerde dat in 9 van de 10 projecten, de werkelijke kosten groter zijn dan voorspeld. Kostenoverschrijdingen komen voor bij verschillende projecttypes, met een gemiddelde kostenoverschrijding van 20% voor wegen, 41% voor spoorwegen en 34% voor kunstwerken (tunnels en bruggen). Daarnaast, en wellicht zelfs zorgwekkender, is de bevinding dat kostenoverschrijdingen de afgelopen 70 jaar niet zijn afgenomen.
Er zijn vier belangrijke problemen met kostenoverschrijdingen. Ten eerste, het leidt tot een Pareto-inefficiënte allocatie van middelen. Kostenvoorspellingen zijn vaak onnauwkeurig maar de mate waarin ze verkeerd zijn ingeschat verschilt tussen projecten. Hierdoor kunnen projecten verkeerd op de ranglijst van projecten terechtkomen en is het mogelijk dat de besluitmaker een “ondergeschikt” project voor laat gaan. Ten tweede, een project dat te maken heeft met een kostenoverschrijding vraagt extra werk met betrekking tot het rond krijgen van financiering, waardoor de besluitvorming langer duurt en de kosten van het project uiteindelijk verder oplopen. Ten derde, kostenoverschrijdingen kunnen beleid, planning, implementatie en dienstverlening van projecten destabiliseren. Kostenoverschrijdingen kunnen ertoe leiden dat projecten herhaaldelijk opnieuw moeten worden goedgekeurd en dat geeft onrust in de organisatie en in het parlement. Ten vierde, het probleem wordt steeds groter omdat projecten steeds groter worden. De financiële

172 Cost overruns in large-scale transport infrastructure projects
consequenties van kostenoverschrijdingen in netto totale (absolute) overschrijding nemen toe met de projectgrootte. Wanneer projecten steeds duurder worden en alsnog te maken krijgen met kostenoverschrijdingen, kunnen de financiële consequenties bovendien zo groot worden dat het de financiële situatie in een gehele regio of land kan destabiliseren.
Ook in Nederland kennen grote bouwprojecten kostenoverschrijdingen, zoals de aanzienlijke budgettoenames bij de Betuweroute en de HSL-Zuid laten zien. Naast deze twee projecten is er echter weinig bekend over de algemene kostenprestaties van projecten in Nederland. De literatuur is het over het algemeen eens dat kostenoverschrijdingen een algemeen kenmerk zijn van megaprojecten en omdat dit een wereldwijd fenomeen blijkt te zijn, is er geen reden om aan te nemen dat de situatie in Nederland anders zou zijn. Echter, de mate van het probleem van kostenoverschrijdingen in Nederland is onduidelijk en er is weinig bekend over hoe regelmatig kostenoverschrijdingen voorkomen, wat de omvang van kostenoverschrijdingen zijn, en of schattingen de afgelopen jaren verbeterd zijn. Door het mogelijke gevaar van “ecological fallacy” kunnen de resultaten van bestaande studies niet worgen gebruikt om de kostenprestatie in Nederland, of in elk ander individueel land, te voorspellen. Een eerste indicatie van het probleem kan gebaseerd worden op de geografische ligging van Nederland. Europese en Noord-Amerikaanse landen neigen naar meer gematigde kostenoverschrijdingen, maar het bewijs dat kostenprestatie daadwerkelijk verschilt met geografische ligging ontbreekt.
De meeste studies naar kostenoverschrijdingen zijn gericht op de frequentie en omvang van overschrijdingen en er is verrassend weinig onderzoek gedaan naar de projectfase waarin projecten het meest vatbaar zijn voor kostenoverschrijdingen. Kosten kunnen marginaal over de jaren toenemen of hevig in een specifieke fase. Kennis hierover maakt het mogelijk om kostenoverschrijdingen beter te begrijpen en om aan te duiden of het voornamelijk een planning- of projectmanagementprobleem is.
De literatuur erkent over het algemeen dat kostenoverschrijdingen voorkomen, maar er is minder overeenstemming over de oorzaken en de verklaringen. Er wordt vaak een onderscheid gemaakt tussen de volgende vier typen verklaringen: technische, economische, psychologische en politieke. Technische verklaringen beschouwen kostenoverschrijdingen als het resultaat van voorspellingsfouten in technische zin, bijvoorbeeld imperfecte voorspellingstechnieken, inadequate data en een gebrek aan ervaring. Economische verklaringen zien onderschattingen als bewust en economisch rationeel. Psychologische verklaringen zijn gebaseerd op de concepten van “planning fallacy” en optimistische bias, de systematische neiging om buitenmatig optimistisch te zijn in evaluaties. Politieke verklaringen beschouwen kostenoverschrijdingen als het resultaat van strategische misrepresentatie; het bewust en strategisch onderschatten van kosten bij het voorspellen van de projectresultaten.
Ondanks deze waardevolle inzichten om kostenoverschrijdingen te verklaren, blijft het een probleem in grootschalige transport infrastructuurprojecten. Daarom is een andere benadering om kostenoverschrijdingen te onderzoeken gewenst en een theoretische aanpak is een goede mogelijkheid. Een gedegen theoretische basis is voornamelijk van belang omdat het een onderbouwing biedt voor de betreffende verklaring en omdat het mogelijkheden biedt om passende oplossingen te definiëren. Inzicht in de theorieën die ten grondslag liggen aan de verklaringen voor kostenoverschrijdingen is slechts in een klein aantal studies onderzocht.
Naast de vier categorieën verklaringen wordt van “lock-in”, de buitenmatige betrokkenheid bij een bepaalde actie of project, verwacht dat het een belangrijke bijdrage zou kunnen

Samenvatting 173
leveren aan het verklaren van de kostenoverschrijdingen. Er is echter maar weinig bekend over hoe lock-in kan ontstaan, of het daadwerkelijk heeft opgetreden en in welke mate het kostenoverschrijdingen kan verklaren.
Er zijn verschillende maatregelen tegen kostenoverschrijdingen voorgesteld, velen daarvan zijn gebaseerd op institutionele regelingen: gericht op het beter afstemmen van verantwoordelijkheden. Er zijn vier basisinstrumenten voorgesteld: transparantie, specificatie van prestatie, expliciete formulering van de reguleringsmechanismen en de mobilisatie van risicokapitaal. Deze maatregelen zijn met name effectief wanneer planners het niet belangrijk vinden om voorspellingen juist te krijgen omdat optimistische voorspellingen een noodzakelijk middel zijn om projecten op te starten. Indien planners het wel belangrijk vinden om voorspellingen juist te krijgen, worden betere voorspellingsmethoden, bijvoorbeeld “reference class forecasting”, aanbevolen als oplossing voor inaccurate voorspellingen.
Studies hebben in het verleden waardevolle inzichten gegeven in het bestaan van kostenoverschrijdingen, de oorzaken en verklaringen ervan, en hebben ook verschillende oplossingen geboden om hier mee om te gaan. Toch vertoont de huidige kennis, zoals uit het voorgaande al bleek, een aantal hiaten die voornamelijk gerelateerd zijn aan de problemen en oorzaken van kostenoverschrijdingen. De voornaamste doelstelling van dit onderzoek is dan ook “het beter begrijpen van het fenomeen kostenoverschrijdingen”. Dit onderzoeksdoel is opgesplitst in een theoretisch en een empirisch gericht onderzoeksdoel. Het theoretisch gerichte doel is als volgt: Dit onderzoek beoogt de oorzaken en verklaringen van kostenoverschrijdingen vanuit een theoretisch perspectief te verkennen. Het empirisch gericht onderzoeksdoel is als volgt: Dit onderzoek heeft als doel om meer inzicht te verschaffen in de projectprestatie van Nederland en om deze prestatie te vergelijken met andere landen.
Inhoud van deze dissertatie
Deze dissertatie bestaat uit twee hoofddelen, een theoretisch deel gevolgd door een empirisch deel. Het theoretische deel start met een literatuurbespreking. Deze bespreking bevat onderzoeken die projectprestaties in het algemeen beschrijven en onderzoeken die specifiek op kostenoverschrijdingen zijn gericht. De beschouwing geeft een overzicht van de verschillende oorzaken, verklaringen en de theorieën die hierbij zijn gebruikt. Het laat zien dat politiek-economische verklaringen als het meest nuttig worden beschouwd bij het begrijpen van kostenoverschrijdingen. De aandacht is in de rest van de dissertatie daarom op dit type verklaring gericht. In het algemeen is er een grote variëteit in theorieën die kan worden gebruikt om politiek-economische verklaringen te ondersteunen, waarbij de principaalagent-problematiek (agency theory) het meest veelbelovend is.
Een tweede literatuurstudie is uitgevoerd om de drijvende krachten achter het fenomeen lock-in te achterhalen. Een conceptueel model van deze drijvende krachten is opgesteld om te laten zien hoe lock-in kan ontstaan en hoe het de mate van kostenoverschrijdingen kan beïnvloeden. Er zijn twee casusonderzoeken uitgevoerd om te illustreren hoe het conceptuele model kan worden gebruikt om te bepalen of, en op welke wijze lock-in heeft plaatsgevonden in het project.
Naast deze literatuurbesprekingen en casusonderzoeken is een model opgesteld dat een formele uiteenzetting geeft over kostenoverschrijdingen. Deze formele uiteenzetting is gebaseerd op de principaalagent-problematiek en past de theorie toe door middel van een “signaal spel” (signalling game). Deze game beschrijft de relatie tussen de principaal en de
174 Cost overruns in large-scale transport infrastructure projects
agent (in dit specifieke geval tussen de overheid en de markt) en hoe het gedrag van beide partijen uiteindelijk kan leiden tot kostenoverschrijdingen.
Het empirische deel van het onderzoek is gebaseerd op een dataset van grootschalige transport infrastructuurprojecten in Nederland. Deze dataset is gebouwd gedurende het onderzoek en bevat data over de voornaamste projectkenmerken (bijvoorbeeld lengte), tijdvariabelen (bijvoorbeeld het formele besluit, jaar van opening) en kostenvariabelen (bijvoorbeeld geschatte en werkelijke kosten) van in totaal 78 Nederlandse projecten. De verzamelde data is gebruikt voor statistische analyses met betrekking tot onder andere de mate en de determinanten van kostenoverschrijdingen in Nederland. Daarnaast is de dataset gebruikt om de kostenprestatie in Nederland te vergelijken met de prestatie in andere landen wereldwijd.
Conclusies
In dit deel worden de belangrijkste conclusies van de hoofdstukken 2 tot 7 beschreven. De eerste drie hoofdstukken, hoofdstukken 2 tot 4 behandelen het theoretische gerichte onderzoeksdoel, hoofdstukken 5 tot 7 behandelen het empirisch gerichte doel.
Hoofdstuk 2 geeft een overzicht van de oorzaken en verklaringen voor kostenoverschrijdingen en de theoretische onderbouwing gebaseerd op een brede literatuurbeschouwing. Met dit overzicht wordt beoogd een antwoord te geven op de volgende onderzoeksvraag: “Welke oorzaken en verklaringen voor kostenoverschrijdingen in grootschalige transport infrastructuur projecten worden gegeven in de literatuur en hoe zijn deze theoretische onderbouwd en gekenmerkt?”
Een verscheidenheid aan oorzaken is geïdentificeerd, waaronder: economisch rationeel gedrag, strategisch gedrag, optimistische bias, en de structuur van de organisatie. De geïdentificeerde oorzaken zijn gegroepeerd in vier categorieën verklaringen die in de literatuur zijn gevonden:
Technische verklaringen: kostenschattingen zijn onnauwkeurig door imperfecte technieken, een gebrek aan ervaringen en dergelijke. Dit betreft voorspellingsfouten in technische zin.
Economische verklaringen: kosten worden bewust onderschat vanwege zelfbelang. Psychologische verklaringen: onderschatte kosten worden uitgelegd als het resultaat
van een cognitieve bias dat resulteert in optimistische voorspellingen. In combinatie met de voorzichtige houding jegens risico’s, framen mensen een uitkomst dat nut maximaliseert (dat wil zeggen, ze onderschatten de kosten).
Politieke verklaringen: kostenoverschrijdingen zijn het resultaat van bewuste kostenonderschatting, strategische misinformatie en manipulatie.
Zowel economische als politieke verklaringen gebruiken nut als basis om kostenonderschattingen te verklaren maar de eerste beargumenteerd dit vanuit het gebrek aan prikkels en bronnen en de laatste vanuit belangen en power.
De mate en de variëteit van theorieën die in de literatuur worden gebruikt is vrij groot. Tabel 1 geeft een overzicht van de oorzaken, verklaringen en theorieën die worden gebruikt om de verklaringen te ondersteunen.

Samenvatting 175
Dit onderzoek concludeert dat er niet één beste theorie is die gebruikt kan worden om kostenoverschrijdingen te verklaren. Afhankelijk van de oorzaken kan een theorie geselecteerd worden die kan worden gebruikt om de reden voor de kostentoename beter te begrijpen. Daarnaast zijn politieke verklaringen het meest waardevol en is agency theory het meest behulpzaam om dit type verklaring te adresseren. Echter, hoewel agency theory vrij veelomvattend is, kunnen er aspecten zijn die niet juist worden behandeld en andere theorieën zouden daarom onderzocht moeten worden.
Tabel 1 Overzicht oorzaken, verklaringen en theorieën
Oorzaken Verklaringen Theorieën Voorspellingsfouten inclusief prijsstijgingen, slecht projectontwerp, en incomplete schattingen Scope veranderingen Onzekerheid Ongeschikte organisatorische structuur Ontoereikend besluitvormingsproces Inadequaat planningsproces
Technisch Voorspelling Planning besluitvorming
Bewuste onderschatting door: - gebrek aan prikkels, - gebrek aan middelen, - inefficiënt gebruik van middelen - toegewijd funding proces - slecht financing/contract management - strategisch gedrag
Economisch Neoklassieke economie Rationele keuze
Optimistische bias tussen lokale ambtenaren Cognitieve bias Voorzichtige houden jegens risico
Psychologisch Planning fallacy & Optimistische bias Prospect Rationele keuze
Bewuste onderschatting Manipulatie van voorspellingen Private informatie
Politiek Machiavellianisme Princiaalagent Ethische
Hoofdstuk 3 gaat verder met het nader beschouwen van lock-in. De onderzoeksvraag die in dit hoofdstuk is behandeld is als volgt: “Hoe kan lock-in ontstaan, heeft het daadwerkelijk plaatsgevonden in transport infrastructuur projecten, en indien ja, op welke manier heeft het plaatsgevonden en tot welk moment in het besluitvormingsproces kon de beslissing worden teruggedraaid?
Lock-in heeft betrekking op de buitenmatige verbondenheid van besluitmakers aan een ineffectief verloop van acties (een besluit of project). Er zijn verschillende momenten in het besluitvormingsproces voordat het formele besluit is genomen en besluitvormers kunnen op al deze momenten al gecommitteerd raken aan een project. Deze vroege verbondenheid is op zichzelf niet negatief, maar het wordt negatief wanneer deze verbondenheid omslaat in buitenmatige verbondenheid en lock-in. Lock-in is in deze dissertatie gebaseerd op buitenmatige commitment en heeft per definitie een negatieve invloed op projectprestatie. Het fenomeen lock-in ondersteunt op deze manier de politieke verklaringen voor kostenoverschrijdingen.

176 Cost overruns in large-scale transport infrastructure projects
Dit onderzoek concludeert dat lock-in zowel op het besluitvormingsniveau (voordat het formele besluit is genomen) als op het projectniveau (na het formele besluit) kan optreden en dat het de mate van overschrijding op twee manieren kan beïnvloeden. Ten eerste, lock-in kan de mate van kostenoverschrijding beïnvloeden via de methodologie waarmee kostenoverschrijdingen worden berekend. Kostenoverschrijdingen worden vaak berekend op basis van het formele besluit, maar vanwege lock-in is het werkelijke besluit vaak al veel eerder in het besluitvormingsproces genomen. De geschatte kosten op dat moment zijn vaak veel lager dan die in een latere fase van het besluitvormingsproces en daardoor nemen de werkelijke kostenoverschrijdingen toe. Ten tweede, lock-in kan de kostenoverschrijdingen beïnvloeden door de “praktijk”, wat betrekking heeft op de inefficiënte beslissingen die genomen worden en die hogere kosten met zich mee brengen.
Op basis van een literatuurstudie is in deze dissertatie een raamwerk opgesteld dat laat zien hoe lock-in kan ontstaan en hoe het de projectprestatie kan beïnvloeden. Figuur 1 geeft dit raamwerk weer en laat de vier belangrijkste indicatoren voor lock-in op het besluitvormingsniveau en het projectniveau zien.
Figuur 1 Theoretisch raamwerk lock-in
Doordat de kosten in geld of tijd niet meer kunnen worden terugverdiend leiden verzonken kosten (sunk costs) direct tot lock-in op het projectniveau. Daarnaast zal de verbondenheid aan het project of besluit toenemen met de tijd en de kosten die geïnvesteerd zijn. Dit maakt het moeilijker om een besluit te heroverwegen: een aanduiding voor lock-in op het besluitvormingsniveau. De behoefte voor rechtvaardiging (need for justification) treedt op door sociale druk en mechanismen als het voorkomen van gezichtsverlies. Indien de positie van besluitmakers bedreigd wordt kunnen zij de druk voelen om door te gaan met het project, ondanks het gebrek aan steun en tegenstrijdige informatie over de haalbaarheid van het project omdat zij willen vermijden een persoonlijk falen toe te moeten geven.
Buitenmatige verbondenheid kan veroorzaakt worden door een excessieve aandacht op een uitkomst, eerder gemaakte afspraken, strategisch gedrag en actie gedreven door politieke motivaties. Ten slotte, de indicator inflexibiliteit en het uitsluiten van alternatieven volgt uit padafhankelijkheid. Een beslissingspad wordt padafhankelijk wanneer eerder gemaakte

Samenvatting 177
beslissingen of gebeurtenissen, betreffende inflexibiliteit of het uitsluiten van alternatieven, de huidige beslissing bepalen en deze beslissing niet meer kan worden herzien. Besluitmakers die een bepaalde beslissing maken in een inflexibele of incompleet besluitvormingsproces zijn waarschijnlijk beïnvloed door lock-in. Dit onderzoek merkt verder op dat er een onderscheid moet worden gemaakt tussen bewuste en onbewuste lock-in en tussen opzettelijke en niet opzettelijke lock-in. Dit onderscheid is belangrijk wanneer men maatregelen wil nemen tegen lock-in.
Twee casusonderzoeken (Betuweroute en HSL-Zuid) laten zien dat lock-in daadwerkelijk heeft plaatsgevonden op het besluitvormings- en op het projectniveau. Op het besluitvormingsniveau is het werkelijke besluit voorafgegaan aan het formele besluit. Indien de kosten op het moment van het werkelijke besluit waren gebruikt als basis voor de geschatte kosten, zouden de kostenoverschrijdingen voor beide projecten ongeveer vier keer zo groot zijn uitgevallen (ten opzichte van de kostenoverschrijdingen berekend op basis van de geschatte kosten ten tijde van het formele besluit). Op het projectniveau heeft de beperkte vrijheid om mogelijk inefficiënte besluiten met betrekking tot het ontwerp van het project aan te passen geleid tot hogere kosten.
Dit onderzoek naar lock-in heeft laten zien dat het hoogst waarschijnlijk is dat de kostenprestatie van projecten slechter is dan is geschat.
Hoofdstuk 4 presenteert een derde manier waarop kostenoverschrijdingen behandeld kunnen worden vanuit een theoretisch perspectief. Het betreft de toepassing van een specifieke theorie, agency theory, voor het verklaren van kostenoverschrijdingen vanuit een politiek-economisch perspectief. De gerelateerde onderzoeksvraag is als volgt: “Hoe kan agency theory toegepast worden om het gedrag van partijen dat leidt tot kostenoverschrijdingen in transport infrastructuur projecten te illustreren?”
Een specifiek type agency theory, namelijk een signalling game, is gemodelleerd. Dit is een game dat bijzonder geschikt is om strategisch gedrag tussen twee partijen (in dit geval de overheid en de markt) te beschrijven. Samenvattend, de marktpartij verstuurd een signaal (aanbestedingsprijs) en de overheidspartij moet beslissen om dit “voorstel” te accepteren of af te wijzen. Het probleem van kostenonderschatting is veroorzaakt door het falen van het signaal van de marktpartij naar de overheidspartij, dat wil zeggen, de aanbestedingsprijs is niet nauwkeurig (te laag) en de kostenoverschrijdingen komen terecht bij de overheidspartij. Deze situatie kan voorkomen wanneer de marktpartij de prikkel mist om een nauwkeurig signaal te sturen (een eerlijke prijs waarvoor hij het project kan realiseren) of wanneer de overheid niet bekwaam genoeg is om in te schatten of het signaal accuraat is of niet.
Daarnaast zijn twee beleidsmaatregelen gemodelleerd door middel van een signalling game om te illustreren hoe deze de mate van kostenoverschrijdingen kunnen beïnvloeden. Het betreft het introduceren van een accountability systeem en een benchmarking systeem. Het accountability systeem verwijderd de prikkel van de marktpartij om onderschatte kosten te sturen, omdat hij nu verantwoordelijk wordt gehouden voor extra kosten en daarnaast wordt zijn gedrag terechtgewezen wanneer hij het project niet tegen het afgesproken budget kan realiseren. Het benchmark systeem reduceert de informatie asymmetrie tussen partijen door de overheid van extra informatie te voorzien zodat deze nu kan beslissen om het voorstel te accepteren op basis van volledige informatie. Beide maatregelen voorzien in meer accurate signalen en vermijden kostenonderschattingen. Ze kunnen echter ook aanleiding geven tot andere vormen van strategisch gedrag zoals signaal verstoring (signal jamming).

178 Cost overruns in large-scale transport infrastructure projects
Dit onderzoek heeft laten zien dat agency theory buitenmatig nuttig is om kostenoverschrijdingen te begrijpen en om aan te tonen wat de effecten zijn van beleidsmaatregelen op kostenoverschrijdingen.
Hoofdstuk 5 onderzoekt de kostenprestatie in Nederland. Vanwege het mogelijke gevaar van ecological fallacy was het onmogelijk om de resultaten van de internationale studie te gebruiken om het probleem van kostenoverschrijdingen in Nederland, of elk ander individueel land, in te schatten. Een onderzoek naar kostenoverschrijdingen in een specifiek land waarbij eenzelfde methodologie wordt gebruikt als in het wereldwijde onderzoek, was nodig om te bepalen of ecological fallacy inderdaad een reëel gevaar is. Nederland was gekozen voor dit onderzoek omdat het onderzoek ondersteund wordt door het Nederlandse Ministerie van Infrastructuur en Milieu. De aandacht op één land maakte het daarnaast mogelijk om de mate en oorzaken van kostenoverschrijdingen en de periode waarin projecten het meest kwetsbaar zijn voor kostenoverschrijdingen te onderzoeken. De onderzoeksvragen zijn als volgt: 1. “Hoe kan de kostenprestatie van grootschalige transport infrastructuurprojecten in Nederland worden gekenmerkt met betrekking tot de frequentie en de mate van kostenoverschrijdingen en ondersteund dit het gevaar op ecological fallacy?”, 2. “In welke mate zijn kostenschattingen in Nederland de afgelopen jaren verbeterd?”, 3. “Zijn transport infrastructuur projecten kwetsbaarder voor kostenoverschrijdingen gedurende verschillende projectfases en zo ja, wat zijn de verschillen tussen de fases?”
Dit onderzoek laat zien dat de gemiddelde overschrijding in Nederland 16.5% (SD=40.0) is, variërend tussen -40.3% en 164.0%. In 55% van de projecten kwamen kostenoverschrijdingen voor en de mate van overschrijdingen was groter dan de mate van onderschrijding in projecten met een onderschrijding. Dit impliceert dat kosten niet alleen vaker worden onderschat dan overschat, maar ook dat de mate waarin de kosten worden onderschat ook groter is dan de mate waarin kosten worden overschat. In de wereldwijde studie varieerde de kostenoverschrijding met 20% voor wegprojecten, 34% voor kunstwerken en 45% voor spoorwegprojecten. Kostenoverschrijdingen kwamen voor in 86% van de projecten. Gezien de grote verschillen in gemiddelde en frequentie moeten we concluderen dat Nederland aanzienlijk anders presteert dan de wereld en ecological fallcay is daarom een reëel gevaar.
Vergelijkbaar met het wereldwijde onderzoek zijn de kostenschattingen in Nederland gelijk gebleven over de jaren. Op basis van statistische analyses is er geen relatie gevonden tussen het jaar van voltooiing en het jaar van formele besluit; kostenoverschrijdingen zijn de afgelopen 20 jaar niet verbeterd.
Ten slotte, dit onderzoek heeft aangetoond dat in de fase voorafgaand aan de bouw (pre-bouwfase) kostenoverschrijdingen vaker voorkomen dan kostenonderschrijdingen en dat de mate van overschrijding hoger is dan dat van onderschrijdingen. In de bouwfase is de situatie omgedraaid. Het belangrijkste probleem van kostenoverschrijding ligt daarom in de fase voordat de bouw start.
Hoofdstuk 6 gaat voort met een beschouwing van de kostenprestatie in Nederland door de determinanten van kostenoverschrijdingen te onderzoeken en deze te vergelijken met de wereldwijde bevindingen. Drie onafhankelijk variabelen en de relatie met kostenoverschrijdingen is onderzocht om te bepalen of deze voor Nederlandse infrastructuurprojecten verschillen van de wereldwijde resultaten. De drie onafhankelijke variabelen zijn project type (weg, rail, en kunstwerken), projectgrootte (gemeten in geschatte kosten) en de lengte van de implementatieperiode.

Samenvatting 179
De onderzoeksvragen zijn als volgt: 1. “In welke mate is de kostenprestatie verschillend voor de verschillende typen transport infrastructuur projecten?”, 2. “Wat is de relatie tussen projectgrootte en kostenoverschrijdingen?”, en 3. “In welke mate heeft de lengte van de implementatieperiode invloed op de kostenprestatie van transport infrastructuur projecten?”
De gemiddelde kostenoverschrijding voor Nederlandse projecten is 10.6% voor rail, 18.8% voor wegprojecten en 21.7% voor kunstwerken. Dit is tegenovergesteld met de wereldwijde bevindingen waar railprojecten de grootste overschrijdingen kennen.
Met betrekking tot projectgrootte laat de studie zien dat kleine Nederlandse projecten de grootste gemiddelde percentage kostenoverschrijdingen kennen, maar in totale overschrijding (miljoenen Euro) hebben grote projecten een groter aandeel. Wereldwijd onderzoek liet zien dat kostenoverschrijdingen groot zijn voor alle projectgroottes.
De lengte van de implementatieperiode, en voornamelijk de lengte van de fase voor de start van de bouw, zijn belangrijke determinanten van kostenoverschrijdingen in Nederland. Elk jaar dat de pre-bouwfase toeneemt, neemt het percentage kostenoverschrijding met vijf procent toe. De lengte van de bouwfase heeft in tegenstelling hiermee nauwelijks enige invloed op kostenoverschrijding. Dit is een belangrijke bijdrage aan huidige kennis over kostenoverschrijdingen omdat de periode waarin projecten het meest kwetsbaar zijn voor kostenoverschrijdingen, in ieder geval voor Nederland, verkleind is. Dit impliceert dat men zich voor het onderzoeken van de oorzaken en de oplossingen van kostenoverschrijdingen het beste kan richten op de pre-bouwfase.
Hoofdstuk 7 toetst of kostenoverschrijdingen variëren met de geografische ligging. Het toetst dit voor Nederland en voor de wereld. De onderzoeksvraag is als volgt: “In welke mate variëren kostenoverschrijdingen van transport infrastructuur projecten met de geografische ligging en is de kostenprestatie in Nederland statistisch significant verschillend van dat in andere landen?”
Voor Nederland zijn zes geografische gebieden onderscheiden: Noord-Nederland, Oost-Nederland, Zuid-Nederland, Centraal-Nederland, Noord-Holland en Zuid-Holland. In deze twee laatste regio’s bevinden zich de projecten met de hoogste gemiddelde kostenoverschrijding, maar in het algemeen is het verschil in gemiddelde overschrijding tussen regio’s niet statistisch significant verschillend.
De studie laat verder zien dat voor de wereldwijde beschouwing van de projecten, geografische ligging van belang is. Geografische ligging is van variërend belang voor project type. Voor weg en tunnel projecten is er geen significant verschil in kostenprestatie tussen landen wereldwijd. De kostenprestatie voor wegprojecten in Nederland is vergelijkbaar met andere Noord-Europese landen en landen in andere geografische gebieden. De kostenprestatie van rail en bruggen is echter wel verschillend; Nederlandse projecten presteren significant beter dan andere Noord-Europese projecten, welke weer beter presteren dan landen in de rest van de wereld.
Samenvattend, deze dissertatie biedt zowel theoretische als empirische bijdragen aan de huidige kennis. Het laat zien dat theorieën veelbelovend zijn om kostenoverschrijdingen beter te begrijpen en hoe ermee om te gaan. Kostenoverschrijdingen zijn een complex probleem met vele determinanten en dit onderzoek toont aan dat kostenoverschrijdingen variëren per geografische locatie en dat het voornaamste probleem ligt in de pre-bouwfase (en besluitvormingsfase). Dit impliceert dat kostenoverschrijdingen eerder een planningsprobleem zijn dan een projectmanagementprobleem. Speciale aandacht moet

180 Cost overruns in large-scale transport infrastructure projects
daarom worden besteed aan de vroege fases van besluitvorming, fases waarin projectvoorstanders gevoelig zijn voor lock-in.

181
About the author Chantal Cantarelli was born in Rotterdam, the Netherlands, on 26 August 1983. She studied Systems Engineering, Policy Analysis & Management at Delft University of Technology. In 2006, she took her Master’s degree, her thesis was focused on the feasibility of the Superbus, an innovative electric vehicle travelling with speeds of 250 km/hour operating according to a demand-responsive transport concept Fast Transport on Request (FTR). After her graduation she continued as PhD researcher at Delft University of Technology, section Transport and Logistics. Currently she is working as a Research Fellow at the Saïd Business School, University of Oxford, BT Centre for Major Programme Management.

182 Cost overruns in large-scale transport infrastructure projects
183
TRAIL Thesis Series The following list contains the most recent dissertations in the TRAIL Thesis Series. For a complete overview of more than 100 titles see the TRAIL website: www.rsTRAIL.nl. The TRAIL Thesis Series is a series of the Netherlands TRAIL Research School on transport, infrastructure and logistics. Cantarelli, C.C., Cost Overruns in Large-Scale Transportation Infrastructure Projects: a theoretical and empirical exploration for the Netherlands and Worldwide, T2011/15, November 2011, TRAIL Thesis Series, the Netherlands Vlies, A.V. van der, Rail Transport Risks and Urban Planning: solving deadlock situations between urban planning and rail transport of hazardous materials in the Netherlands, T2011/14, October 2011, TRAIL Thesis Series, the Netherlands Pas, J.W.G.M. van der, Clearing the Road for ISA Implementation? Applying adaptive policymaking for the implementation of intelligent speed adaptation, T2011/13, October 2011, TRAIL Thesis Series, the Netherlands Zegeye, S.K., Model-Based Traffic Control for Sustainable Mobility, T2011/12, October 2011, TRAIL Thesis Series, the Netherlands Máhr, T., Vehicle Routing under Uncertainty, T2011/11, September 2011, TRAIL Thesis Series, the Netherlands Pel, A.J., Transportation Modelling for Large-scale Evacuations, T2011/10, July 2011, TRAIL Thesis Series, the Netherlands
184 Cost overruns in large-scale transport infrastructure projects
Zheng, F., Modelling Urban Travel Times, T2011/9, July 2011, TRAIL Thesis Series, the Netherlands Vlassenroot, S.H.M., The Acceptability of In-vehicle Intelligent Speed Assistance (ISA) Systems: from trial support to public support, T2011/8, June 2011, TRAIL Thesis Series, the Netherlands Kroesen, M., Human Response to Aircraft Noise, T2011/7, June 2011, TRAIL Thesis Series, the Netherlands Nielsen, L.K., Rolling Stock Rescheduling in Passenger Railways: applications in short-term planning and in disruption management, T2011/6, May 2011, TRAIL Thesis Series, the Netherlands Qing, O., New Approach to Fusion of Heterogeneous Traffic Data, T2011/5, May 2011, TRAIL Thesis Series, the Netherlands Walta, L., Getting ADAS on the Road: actors’ interactions in Advanced Driver Assistance Systems deployment, T2011/4, April 2011, TRAIL Thesis Series, the Netherlands Lin, S., Efficient Model Predictive Control for Large-Scale Urban Traffic Networks, T2011/3, April 2011, TRAIL Thesis Series, the Netherlands Oort, N. van, Service Reliability and Urban Public Transport Design, T2011/2, April 2011, TRAIL Thesis Series, the Netherlands Mahmod, M.K.M., Using Co-Operative Vehicle-Infrastructure Systems to Reduce Traffic Emissions and Improve Air Quality at Signalized Urban Intersections, T2011/1, March 2011, TRAIL Thesis Series, the Netherlands Corman, F., Real-Time Railway Traffic Management: dispatching in complex, large and busy railway networks, T2010/14, December 2010, TRAIL Thesis Series, the Netherlands Kwakkel, J., The Treatment of Uncertainty in Airport Strategic Planning, T2010/13, December 2010, TRAIL Thesis Series, the Netherlands Pang, Y., Intelligent Belt Conveyor Monitoring and Control, T2010/12, December 2010, TRAIL Thesis Series, the Netherlands Kim, N.S., Intermodal Freight Transport on the Right Track? Environmental and economic performances and their trade-off, T2010/11, December 2010, TRAIL Thesis Series, the Netherlands Snelder, M., Designing Robust Road Networks: a general design method applied to the Netherlands, T2010/10, December 2010, TRAIL Thesis Series, the Netherlands Hinsbergen, C.P.IJ. van, Bayesian Data Assimilation for Improved Modeling of Road Traffic, T2010/9, November 2010, TRAIL Thesis Series, the Netherlands