Embed Size (px)
Citation preview
July 2002
Cost of Reformulating Foods and Cosmetics
Final Report
Prepared for
Edward Puro DHHS/Food and Drug Administration
Center for Food Safety and Applied Nutrition HFS-726
5100 Paint Branch Parkway College Park, MD 20740-3835
Prepared by
William J. White Erica Gledhill Shawn Karns Mary K. Muth
RTI Center for Regulatory Economics and Policy Research
Research Triangle Park, NC 27709
RTI Project Number 08184.003
RTI Project Number 08184.003
Cost of Reformulating Foods and Cosmetics
Final Report
July 2002
Prepared for
Edward Puro DHHS/Food and Drug Administration
Center for Food Safety and Applied Nutrition HFS-726
5100 Paint Branch Parkway College Park, MD 20740-3835
Prepared by
William J. White Erica Gledhill Shawn Karns Mary K. Muth
RTI
Center for Regulatory Economics and Policy Research Research Triangle Park, NC 27709-2194
iii
Contents
1. Introduction 1-1
1.1 Project Objectives............................................................. 1-2
1.2 Overview of the Report ..................................................... 1-2
1.3 References ........................................................................ 1-3
2. Reformulation Concepts and Process 2-1
2.1 Basic Concepts in Reformulation....................................... 2-1
2.1.1 Importance of Ingredient or Component................. 2-2
2.1.2 Likely Response of Manufacturers to Regulation............................................................. 2-3
2.1.3 Effects of the Compliance Period............................ 2-5
2.2 The Process of Reformulation ............................................ 2-6
2.3 References ...................................................................... 2-16
3. Reformulation Cost Model Assumptions, Data, and Calculations 3-1
3.1 Reformulation Cost Model Assumptions ............................ 3-1
3.2 Reformulation Cost Model Data ........................................ 3-3
3.2.1 Product Categories ................................................ 3-3
3.2.2 Cost Estimates Used in the Reformulation Model ................................................................. 3-14
3.3 Reformulation Cost Model Calculations........................... 3-21
3.4 Considerations Beyond the Model ................................... 3-24
3.5 References ...................................................................... 3-24
iv
4. Instructions for Using the Reformulation Cost Model 4-1
4.1 Preparing to Run the Model............................................... 4-1
4.2 Selecting Model Inputs...................................................... 4-2
4.3 Outputs of the Model ...................................................... 4-11
Appendixes
A Products in the Reformulation Cost Model for Each NAICS Code......................................................................A-1
B Stata Data Sets and Programming Code ............................. B-1
v
Figures
Figure 2-1 Overview of the Reformulation Process...................................... 2-8
Figure 4-1 The Main Menu Screen for the Reformulation Cost Model.......... 4-3
Figure 4-2 The Product Selection Screen for Choosing Product Categories by IRI-Based Product Types....................................... 4-4
Figure 4-3 The Product Selection Screen for Choosing Product Categories by NAICS Codes ....................................................... 4-6
Figure 4-4 The Test Screen ......................................................................... 4-8
Figure 4-5 The Compliance Period Screen ................................................ 4-11
Figure 4-6 The Display Selection Message Box ......................................... 4-12
Figure 4-7 The Inputs Sheet of the Reformulation Cost Model Output ....... 4-13
Figure 4-8 The Aggregate Cost Sheet of the Reformulation Cost Model Output..................................................................................... 4-14
Figure 4-9 The All Costs Sheet of the Reformulation Cost Model Output ... 4-15
Figure 4-10 Totals by Cost Type Sheet of the Reformulation Cost Model Output..................................................................................... 4-16
vi
Tables
Table 2-1 Categories of Component Importance with Examples for Food and Cosmetic Products...................................................... 2-3
Table 2-2 Types of Sensory Evaluation Tests Used for Food and Cosmetic Products ................................................................... 2-12
Table 3-1 Food Product Categories Included in the Reformulation Cost Model........................................................................................ 3-4
Table 3-2 Cosmetic Products Included in Reformulation Cost Model ....... 3-13
Table 3-3 Correspondence Between Type of Reformulation, Ingredient Importance, and Steps in the Reformulation Process................. 3-15
Table 3-4a Cost Estimates for Steps in the Reformulation Process: Substitution for Minor Ingredients ............................................ 3-17
Table 3-4b Cost Estimates for Steps in the Reformulation Process: Major Ingredients, Process Changes, and Unknown ................. 3-18
Table 3-5 Analytical Testing Cost Estimates (Selected by the Model User) ....................................................................................... 3-20
Table 3-6 Sensory Evaluation Test Cost Estimates (Selected by the Model User) ............................................................................ 3-20
Table 3-7 Consumer Sampling Test Cost Estimates (Selected by the Model User) ............................................................................ 3-21
Table 3-8 Discarded Inventory Calculation Assumptions.......................... 3-21
Table 3-9 Descriptions of Variables Used in the Reformulation Cost Model Calculations.................................................................. 3-22
1-1
1 Introduction
The food and cosmetic products purchased by households in the United States convey a variety of benefits that are valued by their consumers. In addition to caloric and nutrient content for sustenance, food products offer pleasing taste, aroma, texture, and appearance. Some may provide ease of preparation (microwave pizza), vitamin fortification (bread and cereal), increased feelings of status (some premium ice creams), or a wide variety of other tangible or perceived benefits. Cosmetic products, likewise, can impart to consumers a sense of well-being or status, in addition to their core functions of making the user more attractive or perhaps just more pleasant-smelling. In both of these product areas, buyers are willing to pay for all of these attributes in making their purchase decisions.
The firms that produce these food and cosmetic products choose a bundle of characteristics that will maximize their expected profits. Except in the case of most fresh produce and a few other very simple products, all firms in the industry modify their ingredients in some way to influence consumers’ willingness to buy at the established price. We can think of (and model) purchasers as paying separately for each of the quality or performance attributes they choose (Lancaster, 1974). Over time, manufacturers will reformulate their products in response to changing consumer tastes or preferences, changes in cost or availability of raw materials, or governmental regulatory action.
The Food and Drug Administration (FDA) has the responsibility to ensure that foods and cosmetic products offered for sale in the
Food and cosmetic manufacturers choose bundles of product attributes to maximize their expected profits and may alter these attributes through product reformulation.
Cost of Reformulating Foods and Cosmetics
1-2
United States are safe and unadulterated. Some components of these products may be so harmful that they need to be eliminated from consumer products through a restriction or ban. In less drastic cases, there are potential economic and health benefits from requiring truthful revelation of health characteristics and risks; the reduction in consumers’ uncertainty can reduce or eliminate the adverse selection problem.
Many of the food safety and nutrition regulations proposed by the FDA require reformulation of affected products or induce manufacturers to reformulate to avoid labeling changes. FDA is required by law to analyze the costs and benefits of proposed food and cosmetic regulations prior to implementation to make sure that the regulation will be socially beneficial. The Economics Team at FDA’s Center for Food Safety and Applied Nutrition (CFSAN) must estimate the costs incurred in reformulation as part of its regulatory impact analyses (RIAs) for new food and cosmetic regulations.
1.1 PROJECT OBJECTIVES The primary objective of this project is to develop an operational model to estimate the costs of product reformulation for food and cosmetic products regulated by FDA. Such a model will allow the Economics Team to obtain a range of cost estimates associated with the types of reformulation that manufacturers may undertake in response to regulations. The model is designed to be consistent in approach and concept to RTI’s labeling cost model (Muth, Gledhill, and Karns, 2001).
1.2 OVERVIEW OF THE REPORT This report is organized as follows. Section 2 provides an overview of the reformulation process including a description of the factors that affect the level of reformulation complexity. Section 3 describes the assumptions of the model, the cost estimates used in the model, and the equations for calculating the total costs of a reformulation. Finally, Section 4 provides instructions for using and updating the model.
Section 1 — Introduction
1-3
The appendices contain additional supplementary information. Appendix A provides a table listing product categories by North American Industry Classification System (NAICS) codes. Appendix B includes the Stata program used to calculate the cost estimates and instructions for revising the Stata data files.
1.3 REFERENCES Lancaster, K. 1974. Introduction to Modern Microeconomics.
Second Edition. Chicago, IL: Rand McNally College Publishing Company.
Muth, M.K., E.C. Gledhill, and S.A. Karns. November 2001. “FDA Labeling Cost Model.” Report prepared for U.S. Food and Drug Administration, Center for Food Safety and Applied Nutrition. Research Triangle Park, NC: RTI.

2-1
Reformulation Concepts and 2 Process
The reformulation of food and cosmetic products is a form of technical change. It involves the search for a new recipe for combining the product ingredients that will preserve or even enhance consumers’ perceptions of the product without negatively affecting producer profits. Such reformulation may be rather minor, and of low cost, as would be the case with qualification of a new supplier or the substitution of one colorant for another. On the other extreme, it may present significant technical and economic challenges to producers, as would the reduction of saturated fat or cholesterol in dairy products.
In this section, we present some general concepts related to determining the complexity and thus the level of costs associated with reformulation. Both the importance of the ingredient to the product formula and the likely response of manufacturers can affect the level of cost incurred. Following that discussion, we then provide an overview of the steps and testing involved in the reformulation process.
2.1 BASIC CONCEPTS IN REFORMULATION Manufacturers continuously reformulate food and cosmetic products in response to changing consumer needs and to reposition themselves in the product space in response to the actual or anticipated actions of competitors (Kuntz, 1993). These reformulations require developing new knowledge and thus are
Manufacturers may reformulate products as a direct or indirect result of a regulation.
Cost of Reformulating Foods and Cosmetics
2-2
essentially a research and development (R&D) effort. The goal of these reformulations is generally to reduce production costs or change the product attributes in a manner that better meets consumer preferences. Because the development of new recipes is the uncertain outcome of R&D, firms must evaluate the probability of technical success; the probability, given technical success, that the reformulated product can be effectively commercialized; and the probability, given commercialization, that the expected return on investment in R&D (and potentially, in the production process itself) will meet or exceed the firm’s hurdle rate or threshold for project acceptance (see Mansfield, 1961).
In contrast, in the context of a response to government regulation, the goal of product reformulation is to meet the regulatory requirements without substantially affecting production costs or consumer acceptance of the product. Whether this goal can be met depends on the complexity of the required change, the availability and quality of substitutes or suitable processing steps, and the time period allowed for making the change. If the expected costs of reformulation are greater than projected increases in revenue, and if complying with the regulatory requirement without reformulation is likely to create losses as well, then the firm’s response will be to cease production.
When assessing reformulation costs, several key drivers cut across all product categories in food and cosmetics sectors:
Z the importance of the ingredient or component to the affected product or product category
Z the likely response of manufacturers to the proposed regulation
Z the compliance period allowed
In the next three subsections, we discuss each of these cost drivers in detail.
2.1.1 Importance of Ingredient or Component
The importance of the component or ingredient in the product formula affects the complexity and, therefore, the costs of product reformulation. Table 2-1 lists categories of component importance with examples for food and cosmetic products. At one extreme, some minor components could be eliminated at nominal expense
In the context of a response to government regulation, the goal of product reformulation is to meet the regulatory requirements without substantially affecting production costs or consumer acceptance of the product.

Section 2 — Reformulation Concepts and Process
2-3
Table 2-1. Categories of Component Importance with Examples for Food and Cosmetic Products
Importance Category Examples
Noncritical minor ingredient—used at low levels with no functional performance effects
Dye/colorant Preservative Shampoo or lotion fragrance
Critical minor ingredient—used at low levels with either functional performance or safety effects
Perfume fragrance Aloe in a sun care product Preservative in product snack foods
Major ingredient—used at high levels and thus always has functional performance and safety effects
Peanut oil in potato chips Durum wheat flour in pasta Sodium lauryl sulfate in shampoo
Primary component or inherent characteristic of an ingredient—a naturally occurring component of an ingredient that would require a production process change to remove it
Saturated or trans fats in foods Cholesterol in animal products Trace metals or toxins in fruits
by, for example, small-scale testing of a new formula, changing the formula card, and analyzing a few product batches. In contrast, major components and those most important in forming the value proposition for the consumer may take months of R&D effort to replace. Manufacturers may not be able to develop a new formula that meets product performance, cost, and consumer acceptance criteria.
2.1.2 Likely Response of Manufacturers to Regulation
Having decided to reformulate a product, a producer still must determine what specific actions to take. For ingredients, the most productive options are dictated by the role the ingredient plays in the food or cosmetic formula; the availability of good substitutes; and sensory concerns such as taste, texture, and fragrance. For inherent constituents of a product, including trace impurities, fatty-acid composition, and cholesterol, the optimal decision will depend on the processing steps necessary to remove the offending component. Potential responses include substituting for the ingredient and changing the production process. We describe each of these potential responses below.
Potential reformulation responses include Z substituting for an
ingredient and
Z changing the production process.
Cost of Reformulating Foods and Cosmetics
2-4
Substituting for an Ingredient
Substituting one ingredient for another is probably the most commonly adopted type of reformulation. In some cases, manufacturers might substitute a similar ingredient purchased from a different supplier but in other cases, manufacturers might substitute a different type ingredient. By substituting a similar ingredient from a different supplier, manufacturers might obtain a higher-quality ingredient or one made from a different source or a different process. Thus, manufacturers may eliminate a potential health concern.
By substituting an entirely different ingredient, manufacturers might also eliminate a potential health concern. However, if one assumes that the manufacturer optimized the initial formula, then every ingredient has an intended function.1 If one ingredient is eliminated to avoid a regulatory impact, a similar material must be found to perform its function(s).
A few examples of ingredient substitution are
Z replacing a synthetic chemical with a naturally derived one (or possibly the reverse) to eliminate a trace impurity that would otherwise require a warning label,
Z replacing a bleach or filtered vegetable oil with one that has been distilled or deodorized to remove cholesterol and other unhealthy components,
Z replacing reconstituted orange juice with freshly squeezed orange juice to allow a “fresh” claim on a product label,
Z replacing Red Dye #2 after FDA determined it was hazardous to consume and banned it,
Z par-frying frozen potato products in vegetable oil rather than tallow to eliminate cholesterol, and
Z replacing sucrose with a less caloric sweetener in response to a change in nutrition facts requirements.
Substitution of a new ingredient will typically require the manufacturer to conduct a full-scale reformulation effort. Because a new component is being added, safety, stability, and consumer acceptance tests will be required in some form, legal and marketing approvals will be needed, and the manufacturing and materials
1Some reformulations could potentially involve elimination of a noncritical minor
ingredient without substitution. However, these types of reformulation appear to be infrequent. Furthermore, the types of activities required for removal of an ingredient are likely similar to those for substitution of an ingredient.
Section 2 — Reformulation Concepts and Process
2-5
handling processes will be affected. The amount and cost of effort required in each of these areas will depend on other factors discussed in this section.
Changing the Production Process
The most complex and costly reformulation efforts occur if a change in processing conditions or a new production step is required. Such an undertaking is likely if the manufacturer must eliminate a bulk component or trace impurity, and cannot use a new source of supply to avoid the issue. The National Food Processors Association (NFPA) indicated this type of change might be needed to avoid labeling for trans-fatty acids (NFPA, 2001). Process change may even be required to support a substitution effort, as would be the case if a powdered ingredient were replaced with a liquid, for example. In this case, costs will include those listed for substitution, plus the cost of engineering, constructing, and starting up the new process.
If large-scale process changes are required to avoid a labeling mandate, the high costs may make it likely that many affected firms will choose to relabel rather than reformulate. In the extreme, as when a component ban or restriction was imposed and relabeling was not an option, the producers might choose to cease making the product rather than comply.
2.1.3 Effects of the Compliance Period
In addition to the component importance and likely response, the compliance period will affect the cost of reformulation. If the time allowed is short, premium labor costs and/or contract manufacturing services might be required to keep store shelves stocked with a firm’s product. More importantly, long-term purchase contracts may require payment for unneeded raw materials and packaging, and a finished product that sells slowly may need to be recovered and scrapped.
On the other hand, long compliance periods do not eliminate regulatory compliance costs. This would be the case if firms could coordinate regulatory reformulations with those already scheduled for cost reduction, product improvement, advertising claims support, or other corporate initiatives. In researching the labeling cost model, for instance, RTI found that labeling costs would be
Short compliance periods will likely increase the costs of reformulation, but long compliance periods will not eliminate all reformulation costs.
Cost of Reformulating Foods and Cosmetics
2-6
negligible if a 3-year compliance period were allowed. In the present case, however, we found that routine reformulation occurs less frequently than relabeling. Low-volume products, especially those made by small companies, are less likely to be reformulated without a regulatory mandate.
Specific types of compliance period-dependent costs are the following:
Z Overtime charges for accelerated product development, testing, and support activities. These charges would be unlikely with compliance periods of 2 years or more but would be certain if 6 months or less were allowed.
Z Scrapping or resale of obsolete raw materials. Most firms keep only a few weeks of raw materials inventory on hand but may have purchase commitments of a year or more. For compliance periods longer than 1 year, the costs are likely to be borne as contract cancellation fees rather than scrapping or loss on resale.
Z Scrapping of packaging materials. Unlike raw materials, packaging materials cannot typically be resold; they must be thrown away or recycled.
Z Throwaway of processed material or finished product. This extremely costly situation would only occur if compliance periods were very short or if firms were not allowed to “sell through” existing inventories of finished products.
Z Contract manufacturing. If additional processing steps were required or decontamination of existing production equipment indicated, firms might have to contract out production if short compliance periods were imposed.
2.2 THE PROCESS OF REFORMULATION In this section, we describe the process by which food and cosmetic products are developed. It is necessary to understand all of the steps in the reformulation process so that we can later estimate the cost of each step in the process. Even if the ingredient affected is a noncritical minor ingredient, almost all of the steps in the process will still have to be followed to some extent. Each step needs to be followed because the ingredients in a product exist in a delicate balance and every ingredient contributes some characteristic to the product. It is often difficult to determine if the formulation policy should involve replacing an ingredient or removing it. Although occasionally one method makes more sense than another, neither approach is as simple as it sounds (Kuntz,
The steps followed in the reformulation process depend on the importance and function of the ingredient affected by the regulation.
Section 2 — Reformulation Concepts and Process
2-7
1993). However, a reformulation can be more or less complex depending on the function the reformulated ingredient performs in the food or cosmetic product. In general, the more complex the reformulation, the more time and money are spent at each step in the process.
Once the manufacturer has decided to reformulate, it follows a number of steps to initiate the reformulation process. In general, the steps are as follows:
Z idea generation
Z development
Z sensory evaluation
Z consumer sampling (prior to marketing)
Z shelf-life studies
Z packaging
Z production/manufacturing
Z market testing (in a few cases)
Z commercialization (in some cases) (Baker, Hahn, and Robbins, 1988)
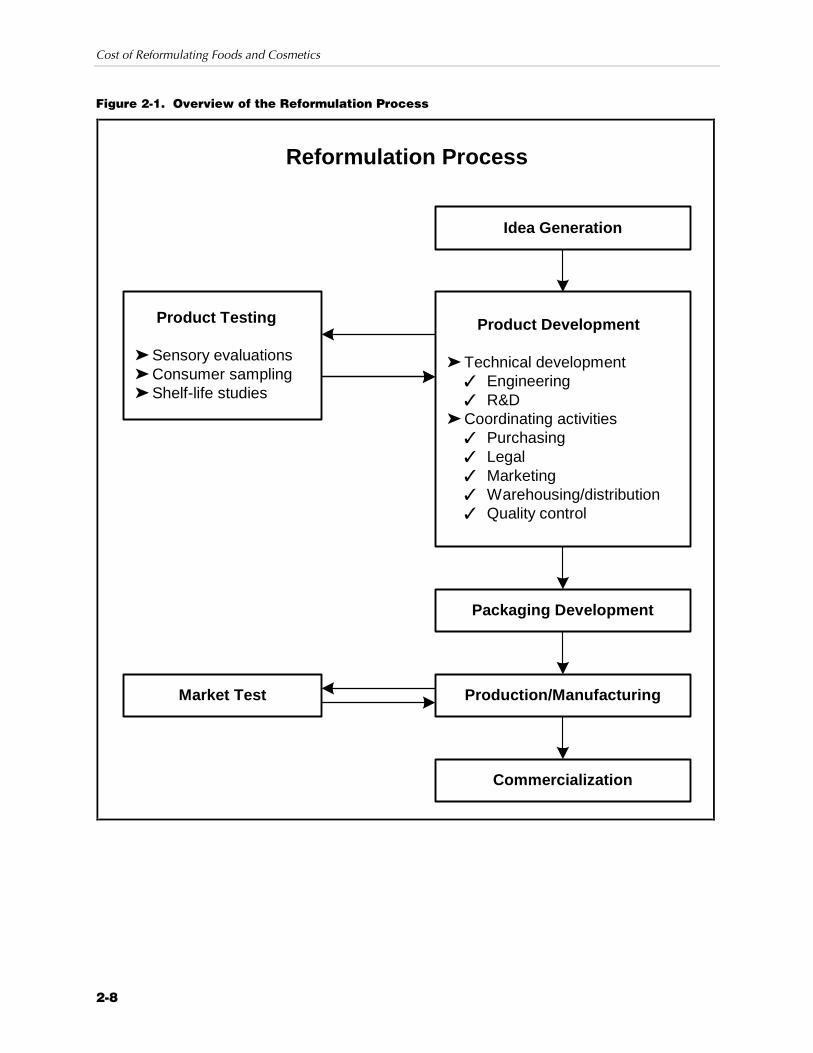
These steps are outlined in Figure 2-1. Even though these steps are outlined linearly, many different departments are involved in the process of reformulating and work together in a product development team. Many of these steps run concurrently with each other, and the process is also iterative, so the results of one step may feed back into a previous step to allow for further refinements of the product. This occurs, for example, when product tests such as sensory evaluations, consumer sampling, and shelf-life studies are conducted at the same time the product is being developed. The results from these product tests cause the product to be further developed, and these refinements, in turn, necessitate more testing. The following departments are likely included in the product development team for a reformulation:
Z R&D
Z engineering
Z production
Z legal
Z marketing
Z purchasing
Cost of Reformulating Foods and Cosmetics
2-8
Figure 2-1. Overview of the Reformulation Process
Idea Generation
Product Development
ZTechnical developmentX EngineeringX R&D
ZCoordinating activitiesX PurchasingX LegalX MarketingX Warehousing/distributionX Quality control
Packaging Development
Production/Manufacturing
Commercialization
Product Testing
ZSensory evaluationsZConsumer samplingZShelf-life studies
Market Test
Reformulation Process
Section 2 — Reformulation Concepts and Process
2-9
Z quality control
Z management (Fuller, 1994)
R&D is involved in the more technical aspects of product development, while the other departments serve more supportive and coordinating roles. We describe each of the steps in more detail below.
Idea Generation
During the idea generation phase of a project, the product development team, which comprises members from each department involved in the reformulation, decides how it is going to respond to the challenge (Baker, Hahn, and Robbins, 1988). They decide what type of actions they will take—whether it is eliminating an ingredient, substituting an ingredient, or changing the production process. Limits to what the production plant can and cannot physically do with respect to the reformulated product are also outlined (Fuller, 1994). Although the process of idea generation within manufacturing firms is quite complex and highly proprietary in general, we expect that the restricted degrees of freedom found in reformulation cause this step to be rather straightforward.
Product Development
The development of a product continuously evolves based on advice given by each department involved in reformulation. The technical development of the product itself involves food or cosmetic technologists from the R&D department working in the laboratory and on computers to devise new formulas. Information from tests and supporting activities is constantly fed back to them, and they make refinements to the product based on this information. R&D works with the purchasing department to find sources of new raw materials, ingredients, and packaging. The legal department reviews the formulations for compliance with all legal requirements in terms of limiting liability issues and complying with regulatory requirements. The market research department provides information from consumer tests about product preference. The quality control department determines whether all processing, product, environmental, and worker safety standards have been adhered to and that the product has been
Idea generation is the process of determining the type of reformulation actions to be taken.
Product development is responsible for developing the new formula and coordinating testing and support activities.
Cost of Reformulating Foods and Cosmetics
2-10
protected from public health hazards (Fuller, 1994). In the development process, a development team comprising different departments with many different skills turns the idea for a product reformulation into a reality.
Sensory Evaluation
Because of the importance of organoleptic properties in consumer acceptance of food and cosmetic products, sensory evaluation is perhaps the most critical activity in reformulation. Sensory evaluations run concurrently with development so that the food technologists can obtain the results and refine recipes and formulations accordingly. Ideally, food and cosmetic manufacturers use two panels to find information on a product: a trained panel and a consumer panel. The trained panel can more objectively distinguish between flavor, texture, tenderness, and juiciness, and, in the case of reformulation, can determine the difference between the reformulated product and the original product (Baker, Hahn, and Robbins, 1988). A consumer panel is used to determine preferences to help the manufacturer produce products that are popular with the public. In large firms, the consumer panel may be made up of company employees (Carpenter, Lyon, and Hasdell, 2000). Technologists in R&D are typically responsible for running and analyzing the experienced panels, and the market research department usually coordinates the consumer panels.
Manufacturers use these methods in reformulation because when some element of the manufacturing process is changed, they need to check the impact on the final product quality.
Z Discrimination studies test the consumer’s ability to detect and recognize differences in a product. These tests involve side-by-side comparative judgments and can be very sensitive and capable of detecting very small differences between products.
Z Descriptive tests are designed to identify and quantify sensory characteristics. Descriptive tests are appropriate to use with a reformulation because they provide an objective measure of any quality changes caused by ingredient or process changes.
Z Preference and acceptability tests establish whether the product differences are recognized by the consumer and are seen to improve liking or acceptability. These methods lie on the fringe between sensory analysis and consumer
In sensory evaluation, the organoleptic properties of the new formula are tested by experienced panels and nonexpert consumers.
Section 2 — Reformulation Concepts and Process
2-11
research and require assessors that are representative of the target consumer population and have little or no sensory training (Carpenter, Lyon, and Hasdell, 2000).
Discrimination and descriptive tests are described as analytical sensory tests because highly trained assessors make the evaluations. Preference and acceptability tests are affective sensory tests because the assessors comprise large numbers of untrained panelists who represent a type of consumer (Baker, Hahn, and Robbins, 1988). Table 2-2 lists and describes specific types of tests within these general categories.
Consumer Sampling
Consumer sampling is not always practiced, but valuable information about the product may be obtained at a relatively low cost by testing the product with a small consumer population (Baker, Hahn, and Robbins, 1988). The three main methods of consumer sampling are the following:
Z Focus group: A small number of panelists (usually 8 to 10) representative of the target population are questioned about their attitudes toward the product category and then asked to test the product, fill out a questionnaire on the product, and discuss the product.
Z Central location test: The manufacturer takes the product to a central location where it conducts tests with a broad cross-section of individuals at locations such as malls or churches. The testers fill out a questionnaire about the product.
Z In-home test: Preselected consumers are sent samples of a product to prepare at home. There is no control of the environment in which the test is carried out, but the manufacturer is able to find out valuable information such as how well the instructions were followed at home. Testers fill out and return a questionnaire or are interviewed over the telephone.
These consumer sampling tests are usually coordinated by the marketing department and may be conducted multiple times in different areas of the country (Fuller, 1994).
Consumer sampling can be accomplished through Z focus groups,
Z central location tests, and
Z in-home tests.

Cost of Reformulating Foods and Cosmetics
2-12
Table 2-2. Types of Sensory Evaluation Tests Used for Food and Cosmetic Products
Type of Test Description of Tests
Discrimination Type Tests Z Paired comparison test: Panelists are asked to state if there is a difference between two samples.
Z Duo trio test: One sample is presented as a reference; then a pair of samples is presented, and the panelist is asked to identify which of the two matches the reference sample.
Z Triangle test: This is similar to the duo trio, except that none of the three materials is a reference material.
Z Rating difference/scalar difference: A control is identified with multiple coded samples, and the panelists use a scale to rate how different the sample is from the control.
Z Two-out-of-five test: This test is similar to the triangle test, but it involves five samples.
Z Ranking test: Panelists are asked to rank coded samples in order for a certain sensory characteristic (e.g., bitterness, spiciness).
Z Magnitude estimation: Panelists are presented a reference sample and it is assigned an arbitrary value for the attribute in question. Subsequent samples are then given higher or lower values according to the magnitude of the perceived difference.
Descriptive Tests Z Consensus profiling: Four to six highly trained assessors work together to achieve agreed-upon standards to define and then rank the odor, flavor, taste, and feeling of the product.
Z Descriptive profiling: Highly trained assessors define attributes collectively but assign ratings and scores individually.
Z Free choice profiling: Highly trained assessors define and assign ratings individually.
Preference and Acceptance Tests
Z Paired comparison preference test: Panelists are presented with two samples and asked which one they prefer based on an attribute.
Z Repeat paired comparison preference test: Panelists are asked to make a preference judgment between two products on one occasion and then to repeat the test a second time—ideally, 24 hours later.
Z Ranking preference test: Three or more samples are ranked by panelists according to preference.
Sources: Carpenter, Roland P., David H. Lyon, and Terry A. Hasdell. 2000. Guidelines for Sensory Analysis in Food Product Development and Quality Control. Gaithersburg, MD: Aspen Publishers, Inc.
Baker, Robert C., Patricia Wong Hahn, and Kelly R. Robbins. 1988. Fundamentals of New Food Product Development. Amsterdam: Elsevier Science Publishers.
Section 2 — Reformulation Concepts and Process
2-13
Shelf-Life Studies
Shelf stability needs to be tested so that the manufacturer has an understanding of how long a product will keep under a variety of different temperatures and conditions. Many different chemical reactions can take place during the storage life of a product. Shelf-life studies are usually administered by product or packaging development personnel within the R&D organization. In addition, most companies have chemists and microbiologists to study any chemical or biological reactions that occur; smaller firms may contract out for these analyses (Baker, Hahn, and Robbins, 1988).
In reformulation, the manufacturer already has an understanding of the shelf life of the base product, but a new ingredient or change to the process may alter the stability and thus the acceptable shelf life of the reformulated product. Therefore, shelf-life stability needs to be studied in the case of a reformulation, although the tests may not have to be as extensive, depending on the complexity of the reformulation.
There are three kinds of shelf-life tests:
Z Static tests: The product is stored under a given set of environmental conditions selected as most representative of distribution system and household storage conditions.
Z Accelerated tests: The product is stored under a range of environmental variables (e.g., temperature, humidity, barometric pressure) more extreme than will be experienced in normal storage. These tests are only projectable if they have been calibrated against a normal stress condition.
Z Use/abuse tests: The product is cycled through different levels of certain environmental conditions to identify how much abuse can be tolerated before product failure.
Static tests are the simplest to set up and operate. However, the long time period that it takes for noticeable changes to occur makes them time-consuming and resource-intensive for the producer. In addition, they do not provide information on the behavior of the product under unusual conditions or other stresses. Accelerated tests provide more timely information about the product and the kinetics of its deterioration and, for this reason, are usually preferred (Fuller, 1994).
Use/abuse tests are the only way to test for certain abnormal changes. For example, transportation at high altitudes (such as shipment to the West Coast from the East) may cause vacuum-
The response of products to conditions experienced in handling and storage can be determined by Z static storage tests,
Z accelerated aging tests, and
Z use/abuse tests.
Cost of Reformulating Foods and Cosmetics
2-14
packed products to lose their seal, permitting deterioration and loss of flavor. A barometric pressure cycling test in the laboratory can simulate this type of stress and ensure that the proper vacuum conditions are maintained.
Packaging Development
Packaging is not only important to add attractiveness and convenience to a product, but it also protects the product. It is also important that packaging is easy to apply, lightweight, economical, and does not react with the product (Baker, Hahn, and Robbins, 1988). The package structure will usually not have to change because of a reformulation, unless the changed ingredient is a major ingredient or a primary component to the product. In that case, the engineering department may have to alter the packaging for the reformulated product.
However, even if the type of packaging does not need to change, a reformulation usually requires the manufacturer to change the label. Generally the marketing department handles the new label design and label copy, but the legal department must also sign off on the final label to make sure that it complies with all regulations.
Market Testing
Manufacturers market test a product when they want to reduce the risk of having an expensive failure with a national introduction. The manufacturer selects a city to release the product where the population comprises many different ethnic groups with a broad spectrum of incomes (Baker, Hahn, and Robbins, 1988). Numerous models for market testing have been developed to present the new product to consumers in a relatively realistic setting. A market test is done to obtain more accurate information about the product’s sales potential because the manufacturer is able to take direct consumer measures and forecast them to predict total trial and repeat purchases (Brody and Lord, 2000). If the product succeeds in sales and repeat purchases, the manufacturer can try a larger or national introduction. If the product fails, it can be dropped or examined to determine the reasons for failure. If the development team can correct the problem, the product can be placed in another test market to confirm its ability to succeed (Baker, Hahn, and Robbins, 1988).
Packaging development assesses compatibility of product and package and conformance of package and label to regulations.
Advertising or marketing personnel may conduct a market test if there is a significant risk of commercial failure with the reformulated product.
Section 2 — Reformulation Concepts and Process
2-15
In the case of a reformulated product, the manufacturer would only conduct a market test if the reformulation is a major one, and even then, it would probably only be carried out by large food or cosmetics companies. Most small companies that sell locally would not go to the expense of a market test.
Production/Manufacturing
During the early stages of reformulation efforts, the R&D department must communicate with the production (or manufacturing) organization to ensure that the necessary skills, labor, and physical plant are or will be available to produce the new product within the cost constraints and quality parameters required. The production department works with engineers to modify the existing production process or evaluate alternative production processes. They also will determine any potential need to engage a co-packer for the product or the need to purchase equipment (Baker, Hahn, and Robbins, 1988). Usually, only small adjustments to the production process would need to be made for reformulations of minor ingredients, but reformulations of major ingredients or primary components of the product may require new production processes and equipment.
Once any necessary changes to the production line have been made and the production line has been set up, a plant trial is conducted to ensure that all of the production activities are feasible. Following the plant trial, production start-up can begin. As part of production start-up, verification activities are conducted to ensure that all the specifications of the production process and the product are being met. If a product is going to be market tested, full-scale production should not occur until after a successful market test. If a market test is not going to be performed, full-scale production should take place when all of the previous steps in the development process have been successfully completed.
The production department ensures the proper people, equipment, and logistics are in place to manufacture the reformulated product.
Cost of Reformulating Foods and Cosmetics
2-16
Commercialization
The commercialization stage of product development involves advertising the new product (Baker, Hahn, and Robbins, 1988). In the case of reformulation, advertising would only be necessary if the marketing staff have decided to change the campaign based on the reformulation. They might do this if they wanted to emphasize the fact that the product no longer contains the ingredient that they eliminated from the formula or to simply state that the product is “new and improved.” If new advertising were not part of the marketing plan, then the commercialization stage would not occur. The old advertisements would continue to run and the new reformulated products would simply fill the shelves without alerting the consumer that the formula had been changed. If the compliance period were sufficiently long, the cost of creating new advertising schemes would be irrelevant, because the marketing department would be able to incorporate the information about the reformulation into periodic planned advertising changes.
2.3 REFERENCES Baker, Robert C., Patricia Wong Hahn, and Kelly R. Robbins.
1988. Fundamentals of New Food Product Development. Amsterdam: Elsevier Science Publishers.
Brody, Aaron L., and John B. Lord, editors. 2000. Developing New Food Products for a Changing Marketplace. Lancaster, PA: Technomic Publishing Company.
Carpenter, Roland P., David H. Lyon, and Terry A. Hasdell. 2000. Guidelines for Sensory Analysis in Food Product Development and Quality Control. Gaithersburg, MD: Aspen Publishers, Inc.
Fuller, Gordon W. 1994. New Food Product Development. Boca Raton, FL: CRC Press, Inc.
Kuntz, Lynn A. 1993. “Backing into a Label.” Food Product Design (December). <http://www.foodproductdesign.com>.
Mansfield, Edwin. 1961. “Technical Change and the Rate of Imitation.” Econometrica 29(October):741-766.
Commercialization costs will be incurred if new advertising or promotion is associated with the reformulation.

Section 2 — Reformulation Concepts and Process
2-17
National Food Processors Association (NFPA). “Comments on Food Labeling” ref. [Docket No. 94P-0036] Food Labeling: Trans Fatty Acids in Nutrition Labeling, Nutrient Content Claims, and Health Claims; Proposed Rule 64 Federal Register 62746, November 17, 1999. <http://www.nfpa-food.org/ comments/nutrition label00_4_17.html>. As obtained on September 6, 2001.

3-1
Reformulation Cost Model Assumptions, Data, and 3 Calculations
In this section, we describe the assumptions underlying the reformulation cost model, present the product category and cost data used in the model, and explain the formulas used to calculate reformulation costs. This information provides the background that a user of the model may need to select the model inputs (as described in Section 4) and interpret the outputs.
3.1 REFORMULATION COST MODEL ASSUMPTIONS The reformulation cost model provides estimates of the costs of reformulation for the range of food, dietary supplement, and cosmetic products under FDA’s jurisdiction. The product categories that form the basis of the model were derived from disaggregated scanner data obtained from Information Resources, Inc. (IRI) for food and dietary supplement and from aggregated scanner data obtained from ACNielsen for cosmetic products. To be included in these sources, products must have scannable universal product codes (UPCs); therefore, products that do not have scannable UPCs are excluded from the model (e.g., food products produced only for foodservice and cosmetic products produced for sale in department stores).
The reformulation cost model includes food, dietary supplement, and cosmetic products under FDA’s jurisdiction.
Cost of Reformulating Foods and Cosmetics
3-2
Based on our review of the literature described in Section 2 and information collected during interviews with manufacturers, we developed the following key assumptions for the reformulation cost model:
Z The costs of reformulating food and cosmetic products are on a per-formula basis. Manufacturers may produce and distribute several products (with different stock keeping units [SKUs]) that are essentially the same formula. When reformulating these products, they incur the costs of the reformulation process for each individual formula. They also incur the costs of analytical testing, sensory evaluation, and consumer sampling on a per-formula basis.
Z The costs related to the process of reformulating private label and branded food and cosmetic products are the same because the same types of activities would have to occur for both types of products. We assume that the complexity of the formulas for both private label and branded foods are similar and that manufacturers would conduct the same level of effort in reformulating both types of products.
Z The costs of reformulating a product in 12 months versus longer time periods are higher because manufacturers may have to discard unused raw material and finished goods inventories. We assume that for branded products, 2.5 percent of the annual volume of finished goods and 2.5 percent of the annual volume of raw materials would have to be discarded for a 12-month compliance period. For private label products, with slower sell-through and fewer opportunities to re-use unneeded raw materials, we assume that 5 percent of the annual volume of finished goods and 5 percent of the annual volume of raw materials would have to be discarded for a 1-year compliance period.
Z Depending on the compliance period, some manufacturers will be able to coordinate a reformulation required as a result of an FDA regulation with a scheduled reformulation. If manufacturers can coordinate a required reformulation with a scheduled reformulation, we assume the costs associated with compliance are negligible. The default coordination assumptions, which the user can modify in the model, are the following:
X 12 months—5 percent can coordinate
X 24 months—20 percent can coordinate
X 36 months—30 percent can coordinate
X 48 months—40 percent can coordinate
Additional specific assumptions were required for particular data elements in the model. These assumptions are described in Sections 3.2 and 3.3.
Section 3 — Reformulation Cost Model Assumptions, Data, and Calculations
3-3
3.2 REFORMULATION COST MODEL DATA In this section, we present the data that underlie the cost calculations for the model. These include the product category definitions and the costs associated with each reformulation activity. These activity-based costs were collected in interviews with food and cosmetics manufacturers, industry trade association representatives, and food industry consultants and laboratories.
3.2.1 Product Categories
As noted above, the product categories for the reformulation cost model were derived from two sources. For food and dietary supplement products, we derived the categories from disaggregated IRI scanner data, and for cosmetics, we derived the categories from aggregated ACNielsen scanner data. We describe the data associated with these product categories below.
Food and Dietary Supplement Product Categories
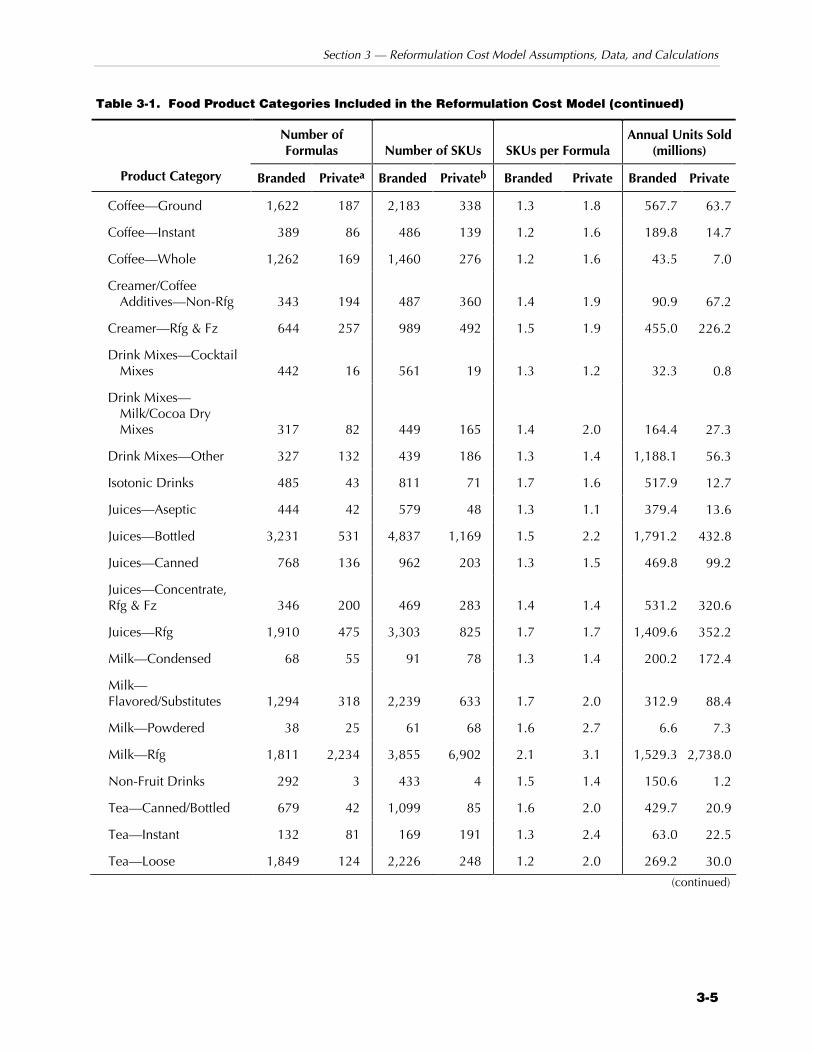
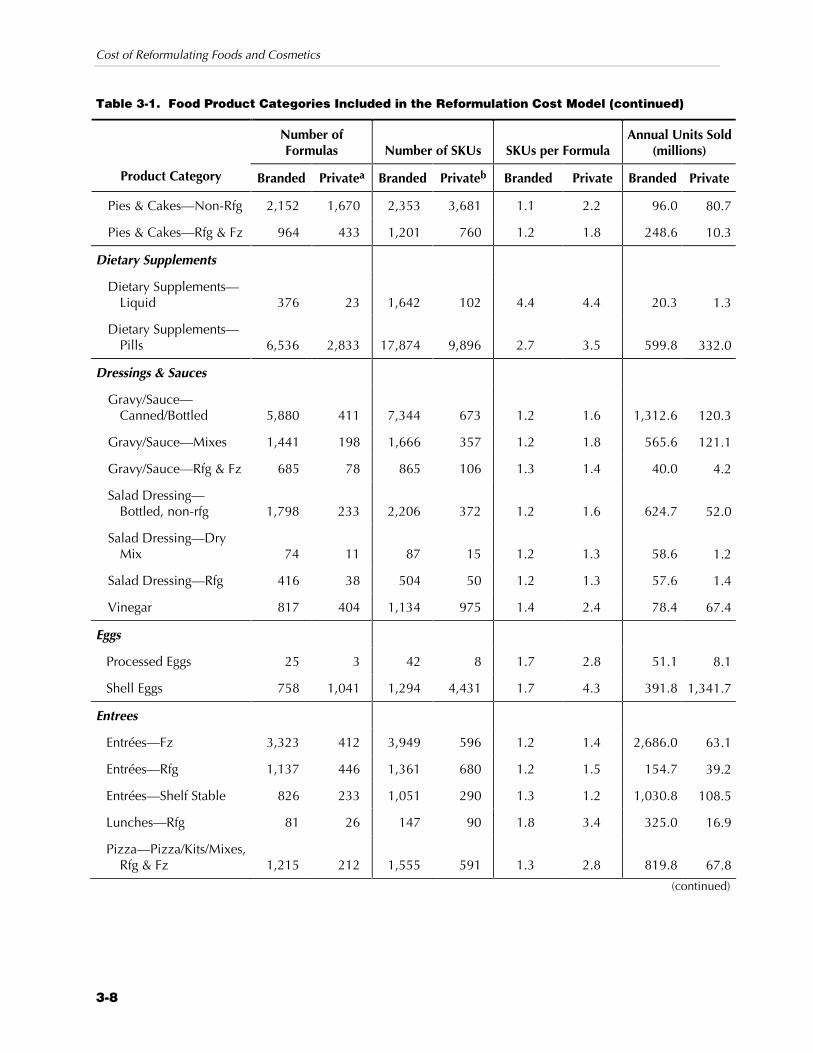
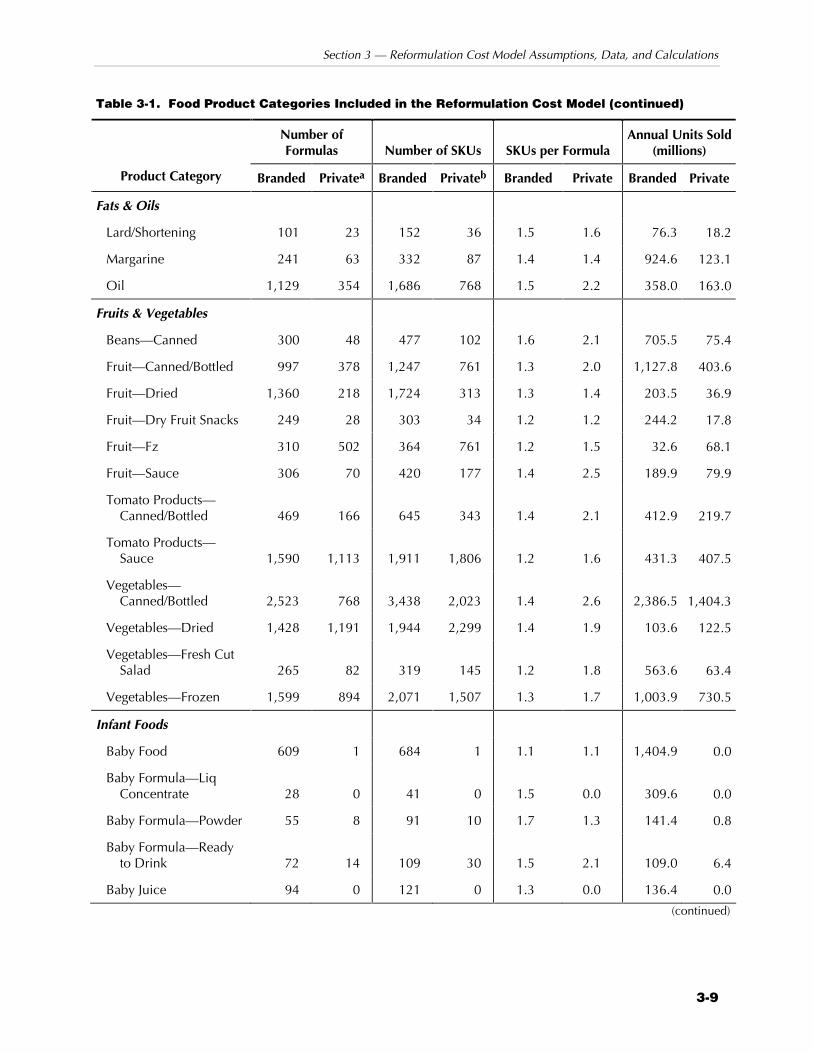
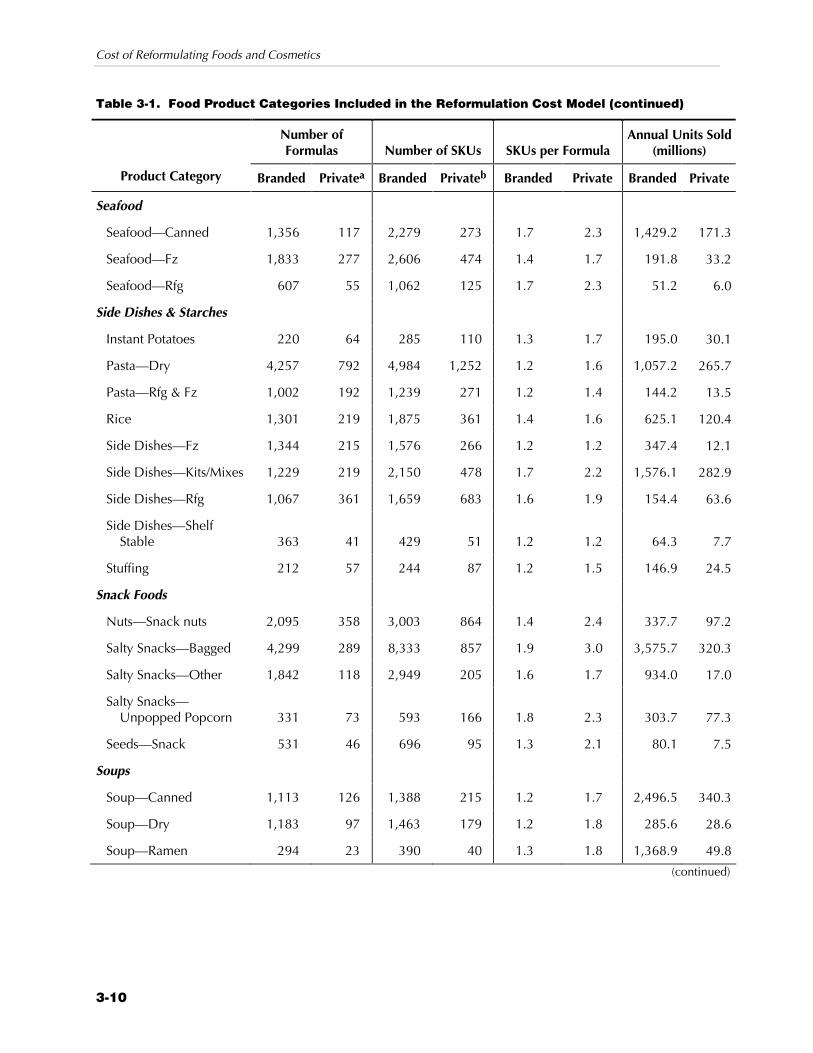
The process we followed for defining the food products categories was described in the labeling cost model report (Muth, Gledhill, and Karns, 2001). Table 3-1 lists the product categories, estimated number of formulas, number of SKUs, and annual units sold for food products included in the model. These product categories include approximately 220,000 formulas, 350,000 SKUs, and $192.5 billion in sales in grocery stores, drug stores, and mass merchandise stores.
To derive the counts of the number of unique formulas for food products, we used information in the product name field from the IRI data set. First, we eliminated the size of the package from the product name, and then we grouped products with the same product name. For each product category, we counted each set of grouped products as a unique formula. Because we believe the counting process may have overstated the number of unique formulas, we adjusted the final number of formulas downward by multiplying by 0.94. We derived the adjustment factor by reviewing in detail a sample of product categories. This factor combines an adjustment for mid-year manufacturer name changes for the same branded product (approximately 1.3 percent of

Cost of Reformulating Foods and Cosmetics
3-4
Table 3-1. Food Product Categories Included in the Reformulation Cost Model
Product Category Number of Formulas Number of SKUs SKUs per Formula
Annual Units Sold (millions)
Branded Privatea Branded Privateb Branded Private Branded Private
Baked Goods
Bakery Snacks—Non-Rfg 4,162 1,698 4,988 2,817 1.2 1.7 1,098.4 172.9
Bakery Snacks—Rfg 39 49 43 65 1.1 1.3 1.3 1.2
Bread/Rolls—Non-Rfg 7,373 4,998 13,822 9,245 1.9 1.8 3,076.0 2,057.3
Bread/Rolls—Rfg & Fz 807 96 1,236 198 1.5 2.1 354.9 47.9
Breadcrumbs/Batters/ Croutons 816 87 1,013 147 1.2 1.7 204.5 29.7
Cookies 5,055 664 7,383 1,415 1.5 2.1 2,148.2 348.0
Crackers 2,395 381 2,898 622 1.2 1.6 1,676.9 210.4
Snack & Granola Bars 898 80 1,184 109 1.3 1.4 600.8 34.9
Baking Ingredients
Baking Ingredients 973 194 1,495 303 1.5 1.6 613.3 121.4
Baking Ingredients—Powders 124 13 149 24 1.2 1.8 151.8 17.9
Baking Mixes 1,324 181 1,612 313 1.2 1.7 1,115.1 55.5
Dough—Rfg & Fz 359 111 507 220 1.4 2.0 777.3 230.4
Flour/Meal 961 147 1,468 278 1.5 1.9 330.9 62.6
Nuts—Baking nuts 779 87 1,113 228 1.4 2.6 109.5 22.4
Pizza—Crust/Dough 112 22 132 40 1.2 1.9 38.5 6.4
Beverages
Bottled Water 1,956 545 2,850 1,465 1.5 2.7 1,095.5 563.1
Carbonated Beverages—Regular 2,320 381 3,821 769 1.6 2.0 5,602.0 831.5
Carbonated Beverages—Sugar substitute 493 136 880 207 1.8 1.5 2,155.5 191.6
Carbonated Beverages— Water/Club Soda 875 542 1,083 720 1.2 1.3 360.5 239.8
(continued)
Section 3 — Reformulation Cost Model Assumptions, Data, and Calculations
3-5
Table 3-1. Food Product Categories Included in the Reformulation Cost Model (continued)
Number of Formulas Number of SKUs SKUs per Formula
Annual Units Sold (millions)
Product Category Branded Privatea Branded Privateb Branded Private Branded Private
Coffee—Ground 1,622 187 2,183 338 1.3 1.8 567.7 63.7
Coffee—Instant 389 86 486 139 1.2 1.6 189.8 14.7
Coffee—Whole 1,262 169 1,460 276 1.2 1.6 43.5 7.0
Creamer/Coffee Additives—Non-Rfg 343 194 487 360 1.4 1.9 90.9 67.2
Creamer—Rfg & Fz 644 257 989 492 1.5 1.9 455.0 226.2
Drink Mixes—Cocktail Mixes 442 16 561 19 1.3 1.2 32.3 0.8
Drink Mixes—Milk/Cocoa Dry Mixes 317 82 449 165 1.4 2.0 164.4 27.3
Drink Mixes—Other 327 132 439 186 1.3 1.4 1,188.1 56.3
Isotonic Drinks 485 43 811 71 1.7 1.6 517.9 12.7
Juices—Aseptic 444 42 579 48 1.3 1.1 379.4 13.6
Juices—Bottled 3,231 531 4,837 1,169 1.5 2.2 1,791.2 432.8
Juices—Canned 768 136 962 203 1.3 1.5 469.8 99.2
Juices—Concentrate, Rfg & Fz 346 200 469 283 1.4 1.4 531.2 320.6
Juices—Rfg 1,910 475 3,303 825 1.7 1.7 1,409.6 352.2
Milk—Condensed 68 55 91 78 1.3 1.4 200.2 172.4
Milk—Flavored/Substitutes 1,294 318 2,239 633 1.7 2.0 312.9 88.4
Milk—Powdered 38 25 61 68 1.6 2.7 6.6 7.3
Milk—Rfg 1,811 2,234 3,855 6,902 2.1 3.1 1,529.3 2,738.0
Non-Fruit Drinks 292 3 433 4 1.5 1.4 150.6 1.2
Tea—Canned/Bottled 679 42 1,099 85 1.6 2.0 429.7 20.9
Tea—Instant 132 81 169 191 1.3 2.4 63.0 22.5
Tea—Loose 1,849 124 2,226 248 1.2 2.0 269.2 30.0
(continued)

Cost of Reformulating Foods and Cosmetics
3-6
Table 3-1. Food Product Categories Included in the Reformulation Cost Model (continued)
Number of Formulas Number of SKUs SKUs per Formula
Annual Units Sold (millions)
Product Category Branded Privatea Branded Privateb Branded Private Branded Private
Breakfast Foods
Breakfast Food—Frozen 227 30 437 78 1.9 2.6 413.2 34.9
Breakfast Food—Instant 41 11 57 32 1.4 2.8 30.4 1.9
Breakfast Food—Ready to Eat 126 46 197 94 1.6 2.0 259.0 64.3
Cereal 1,345 528 1,773 961 1.3 1.8 2,657.1 343.7
Candy & Gum
Chocolate Candy—Single Serve 838 26 1,100 29 1.3 1.1 1,712.7 0.3
Chocolate Candy—Snack 1,818 161 2,338 217 1.3 1.4 1,193.4 6.0
Gum—Regular Gum 669 17 910 68 1.4 4.0 743.6 3.2
Gum—Sugarless Gum 103 1 156 1 1.5 1.1 528.0 0.0
Nonchocolate Candy—Diet 439 54 559 97 1.3 1.8 46.4 5.0
Nonchocolate Candy—Kits 161 22 219 24 1.4 1.1 31.4 1.4
Nonchocolate Candy—Pkg & Roll 1,653 132 2,618 535 1.6 4.1 895.2 28.0
Nonchocolate Candy—Single Serve 2,340 157 3,306 420 1.4 2.7 750.0 12.2
Nonchocolate Candy—Snack 2,098 252 3,122 837 1.5 3.3 562.5 90.5
Seasonal Candy 2,451 118 5,491 383 2.2 3.2 1,257.6 19.3
Condiments/Dips/ Spreads
Condiments—Non-Rfg 1,018 155 1,345 383 1.3 2.5 439.7 125.2
Condiments—Rfg 444 22 584 33 1.3 1.5 25.8 0.9
Dips—Dry Mixes 128 19 147 37 1.1 2.0 36.2 2.6
Dips—Rfg & Fz 825 168 1,188 317 1.4 1.9 155.9 41.6
Dips—Shelf Stable 360 25 397 40 1.1 1.6 81.3 3.4
(continued)

Section 3 — Reformulation Cost Model Assumptions, Data, and Calculations
3-7
Table 3-1. Food Product Categories Included in the Reformulation Cost Model (continued)
Number of Formulas Number of SKUs SKUs per Formula
Annual Units Sold (millions)
Product Category Branded Privatea Branded Privateb Branded Private Branded Private
Jams/Jellies/Preserves 2,812 797 4,106 1,581 1.5 2.0 291.0 112.0
Mayonnaise 215 58 314 95 1.5 1.6 461.5 63.4
Peanut Butter 267 44 455 118 1.7 2.7 289.3 75.0
Pickles/Relish/Olives 4,289 1,441 6,742 2,789 1.6 1.9 702.2 290.4
Salad Toppings 140 15 165 42 1.2 2.8 90.4 3.0
Salt/Salt Substitutes 565 105 668 209 1.2 2.0 197.1 61.7
Spices/Seasonings 8,552 1,145 10,122 2,021 1.2 1.8 570.8 113.9
Dairy Foods
Butter 284 217 355 315 1.3 1.5 235.8 208.9
Cheese—Grated 237 74 331 176 1.4 2.4 72.5 38.5
Cheese—Imitation 120 17 154 25 1.3 1.5 19.9 3.2
Cheese—Natural Cheese 1,807 841 3,029 1,863 1.7 2.2 558.3 343.3
Cheese—Processed Cheese 823 244 1,577 547 1.9 2.2 647.0 224.3
Cheese—Ricotta/Cream/ Cottage 1,049 468 1,600 907 1.5 1.9 597.9 339.0
Cheese—Shredded 448 283 749 519 1.7 1.8 367.3 254.3
Frozen Novelties 3,574 782 5,704 1,434 1.6 1.8 686.0 172.4
Ice Cream & Ice Milk 5,642 2,347 7,927 3,009 1.4 1.3 864.0 327.9
Sour Cream 384 161 577 320 1.5 2.0 273.6 151.7
Yogurt 1,867 442 2,160 554 1.2 1.3 1,884.7 483.8
Desserts
Desserts—Toppings 331 68 407 115 1.2 1.7 280.4 79.2
Gelatin/Pudding—Mixes 474 191 554 336 1.2 1.8 623.4 68.1
Gelatin/Pudding—Regular 755 154 1,007 245 1.3 1.6 450.1 18.7
(continued)
Cost of Reformulating Foods and Cosmetics
3-8
Table 3-1. Food Product Categories Included in the Reformulation Cost Model (continued)
Number of Formulas Number of SKUs SKUs per Formula
Annual Units Sold (millions)
Product Category Branded Privatea Branded Privateb Branded Private Branded Private
Pies & Cakes—Non-Rfg 2,152 1,670 2,353 3,681 1.1 2.2 96.0 80.7
Pies & Cakes—Rfg & Fz 964 433 1,201 760 1.2 1.8 248.6 10.3
Dietary Supplements
Dietary Supplements—Liquid 376 23 1,642 102 4.4 4.4 20.3 1.3
Dietary Supplements—Pills 6,536 2,833 17,874 9,896 2.7 3.5 599.8 332.0
Dressings & Sauces
Gravy/Sauce—Canned/Bottled 5,880 411 7,344 673 1.2 1.6 1,312.6 120.3
Gravy/Sauce—Mixes 1,441 198 1,666 357 1.2 1.8 565.6 121.1
Gravy/Sauce—Rfg & Fz 685 78 865 106 1.3 1.4 40.0 4.2
Salad Dressing—Bottled, non-rfg 1,798 233 2,206 372 1.2 1.6 624.7 52.0
Salad Dressing—Dry Mix 74 11 87 15 1.2 1.3 58.6 1.2
Salad Dressing—Rfg 416 38 504 50 1.2 1.3 57.6 1.4
Vinegar 817 404 1,134 975 1.4 2.4 78.4 67.4
Eggs
Processed Eggs 25 3 42 8 1.7 2.8 51.1 8.1
Shell Eggs 758 1,041 1,294 4,431 1.7 4.3 391.8 1,341.7
Entrees
Entrées—Fz 3,323 412 3,949 596 1.2 1.4 2,686.0 63.1
Entrées—Rfg 1,137 446 1,361 680 1.2 1.5 154.7 39.2
Entrées—Shelf Stable 826 233 1,051 290 1.3 1.2 1,030.8 108.5
Lunches—Rfg 81 26 147 90 1.8 3.4 325.0 16.9
Pizza—Pizza/Kits/Mixes, Rfg & Fz 1,215 212 1,555 591 1.3 2.8 819.8 67.8
(continued)
Section 3 — Reformulation Cost Model Assumptions, Data, and Calculations
3-9
Table 3-1. Food Product Categories Included in the Reformulation Cost Model (continued)
Number of Formulas Number of SKUs SKUs per Formula
Annual Units Sold (millions)
Product Category Branded Privatea Branded Privateb Branded Private Branded Private
Fats & Oils
Lard/Shortening 101 23 152 36 1.5 1.6 76.3 18.2
Margarine 241 63 332 87 1.4 1.4 924.6 123.1
Oil 1,129 354 1,686 768 1.5 2.2 358.0 163.0
Fruits & Vegetables
Beans—Canned 300 48 477 102 1.6 2.1 705.5 75.4
Fruit—Canned/Bottled 997 378 1,247 761 1.3 2.0 1,127.8 403.6
Fruit—Dried 1,360 218 1,724 313 1.3 1.4 203.5 36.9
Fruit—Dry Fruit Snacks 249 28 303 34 1.2 1.2 244.2 17.8
Fruit—Fz 310 502 364 761 1.2 1.5 32.6 68.1
Fruit—Sauce 306 70 420 177 1.4 2.5 189.9 79.9
Tomato Products—Canned/Bottled 469 166 645 343 1.4 2.1 412.9 219.7
Tomato Products—Sauce 1,590 1,113 1,911 1,806 1.2 1.6 431.3 407.5
Vegetables—Canned/Bottled 2,523 768 3,438 2,023 1.4 2.6 2,386.5 1,404.3
Vegetables—Dried 1,428 1,191 1,944 2,299 1.4 1.9 103.6 122.5
Vegetables—Fresh Cut Salad 265 82 319 145 1.2 1.8 563.6 63.4
Vegetables—Frozen 1,599 894 2,071 1,507 1.3 1.7 1,003.9 730.5
Infant Foods
Baby Food 609 1 684 1 1.1 1.1 1,404.9 0.0
Baby Formula—Liq Concentrate 28 0 41 0 1.5 0.0 309.6 0.0
Baby Formula—Powder 55 8 91 10 1.7 1.3 141.4 0.8
Baby Formula—Ready to Drink 72 14 109 30 1.5 2.1 109.0 6.4
Baby Juice 94 0 121 0 1.3 0.0 136.4 0.0
(continued)
Cost of Reformulating Foods and Cosmetics
3-10
Table 3-1. Food Product Categories Included in the Reformulation Cost Model (continued)
Number of Formulas Number of SKUs SKUs per Formula
Annual Units Sold (millions)
Product Category Branded Privatea Branded Privateb Branded Private Branded Private
Seafood
Seafood—Canned 1,356 117 2,279 273 1.7 2.3 1,429.2 171.3
Seafood—Fz 1,833 277 2,606 474 1.4 1.7 191.8 33.2
Seafood—Rfg 607 55 1,062 125 1.7 2.3 51.2 6.0
Side Dishes & Starches
Instant Potatoes 220 64 285 110 1.3 1.7 195.0 30.1
Pasta—Dry 4,257 792 4,984 1,252 1.2 1.6 1,057.2 265.7
Pasta—Rfg & Fz 1,002 192 1,239 271 1.2 1.4 144.2 13.5
Rice 1,301 219 1,875 361 1.4 1.6 625.1 120.4
Side Dishes—Fz 1,344 215 1,576 266 1.2 1.2 347.4 12.1
Side Dishes—Kits/Mixes 1,229 219 2,150 478 1.7 2.2 1,576.1 282.9
Side Dishes—Rfg 1,067 361 1,659 683 1.6 1.9 154.4 63.6
Side Dishes—Shelf Stable 363 41 429 51 1.2 1.2 64.3 7.7
Stuffing 212 57 244 87 1.2 1.5 146.9 24.5
Snack Foods
Nuts—Snack nuts 2,095 358 3,003 864 1.4 2.4 337.7 97.2
Salty Snacks—Bagged 4,299 289 8,333 857 1.9 3.0 3,575.7 320.3
Salty Snacks—Other 1,842 118 2,949 205 1.6 1.7 934.0 17.0
Salty Snacks—Unpopped Popcorn 331 73 593 166 1.8 2.3 303.7 77.3
Seeds—Snack 531 46 696 95 1.3 2.1 80.1 7.5
Soups
Soup—Canned 1,113 126 1,388 215 1.2 1.7 2,496.5 340.3
Soup—Dry 1,183 97 1,463 179 1.2 1.8 285.6 28.6
Soup—Ramen 294 23 390 40 1.3 1.8 1,368.9 49.8
(continued)

Section 3 — Reformulation Cost Model Assumptions, Data, and Calculations
3-11
Table 3-1. Food Product Categories Included in the Reformulation Cost Model (continued)
Number of Formulas Number of SKUs SKUs per Formula
Annual Units Sold (millions)
Product Category Branded Privatea Branded Privateb Branded Private Branded Private
Sweeteners
Sugar 203 161 321 371 1.6 2.3 356.9 412.2
Sugar Substitutes 86 17 152 47 1.8 2.8 86.6 12.5
Syrup/Molasses 979 232 1,226 373 1.3 1.6 189.7 57.7
Weight Control Foods
Weight Control Liq/Powder 648 42 1,203 65 1.9 1.5 230.2 12.4
aPrivate label formulas are estimated based on the number of formulas for branded products.
bPrivate label SKUs are estimated based on the number of SKUs for branded products.
Source: Based on scanner data obtained from IRI for calendar year 1999.
formulas) and for multiproduct packaging bundles (approximately 4.7 percent of formulas).2
IRI scanner data aggregate into a single record all private-label SKUs for similar sizes and flavors. Therefore, we adjusted our initial private label SKU and formula counts to account for this. For the SKU adjustment, the process we followed is based on the relationship between unit sales and number of SKUs for branded products and is the same as in the labeling cost model (Muth, Gledhill, and Karns, 2001). Within each of the product categories, we subdivided the SKUs and calculated the annual units sold for private label and branded products. We then calculated the ratio of SKUs to annual units sold for branded products (B) and multiplied the ratio by the annual units sold for private label products (PL) as follows:
Estimated SKUsPL = (SKUsB / UnitsB) * (UnitsPL)
For categories in which a large proportion of the products sold are branded (e.g., aseptic juices, baby formula, and candy), this
2Another factor that may cause our counting process to overstate the true number
of formulas is that manufacturers may package essentially the same formula under different brand names. However, we are unable to estimate an adjustment factor for these occurrences using scanner data.

Cost of Reformulating Foods and Cosmetics
3-12
calculation results in a lower estimate of the number of SKUs than simply using the number of private label SKU-level records in the IRI dataset. In these cases, we used the number of private label SKU-level records as the estimate instead of using the calculation described above.
Once we derived a final estimate of the number of private label SKUs, we then adjusted the initial count of private label formulas as follows:
EstimatedFormulasPL
=
Estimated SKUsPL
Counted SKUPL * Counted FormulasPL
As in the labeling cost model, we made an adjustment to the dietary supplement SKU counts because IRI tracks only vitamins and minerals and not other types of dietary supplements. Based on data published in Nutrition Business Journal (2000), we calculated that approximately half of all dietary supplements sold in 1999 were vitamin and mineral products. Thus, we scaled up the number of formulas, SKUs, and units sold for vitamins and minerals in the IRI dataset by doubling both numbers.
Cosmetic Product Categories
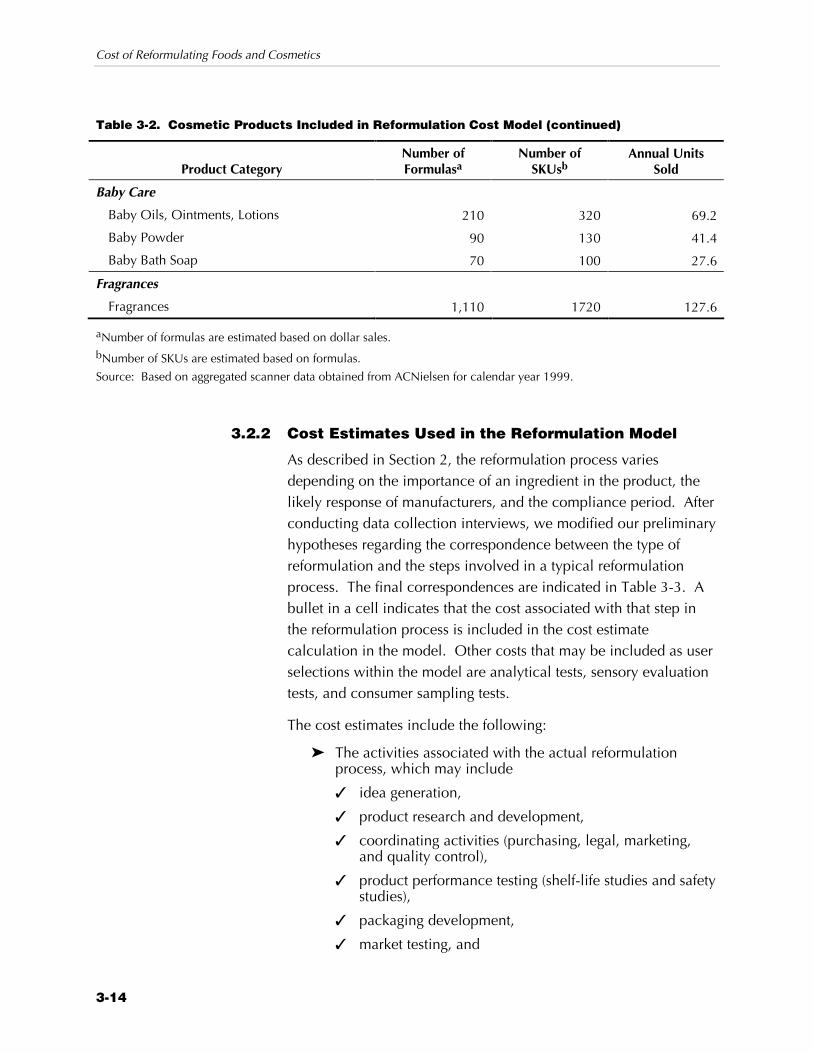
Table 3-2 lists the product categories, number of formulas, number of SKUs, and annual units sold for cosmetic products included in the model. Because ACNielsen does not differentiate branded and private label cosmetic products, the data presented in Table 3-2 combine both.3 These product categories account for an estimated 48,000 formulas and $43.1 billion in sales in grocery stores, drug stores, and mass merchandise stores.
To derive the counts of the number of unique formulas for cosmetic products, we relied on information derived from the disaggregated data for food products. For food products, each formula had a median retail dollar sales volume of $900,000, and each formula had a median 1.55 SKUs. Thus, for cosmetic products we calculated the number of formulas as total dollar sales volume divided by $900,000, and the number of SKUs as the number of formulas times 1.55.
3In general, substantially fewer cosmetic products are sold as private label, and the
costs of reformulation are likely similar.

Section 3 — Reformulation Cost Model Assumptions, Data, and Calculations
3-13
Table 3-2. Cosmetic Products Included in Reformulation Cost Model
Product Category Number of Formulasa
Number of SKUsb
Annual Units Sold
Hair Care
Shampoo 2,010 3110 671.1
Conditioner 960 1480 339.9
Hair Coloring 1,570 2430 235.3
Wave-Setting 740 1140 270.0
Women’s Hair Spray 480 740 229.3
Hair Growth 140 210 4.5
Ethnic Hair Preparations 210 320 52.8
Other Hair Care 1,620 2510 586.7
Oral Hygiene
Toothpaste 1,920 2970 748.9
Antiseptics/Rinses 840 1300 246.6
Other Oral Hygiene 790 1220 228.6
Facial Products
Facial Make-up 1,250 1930 194.3
Eye Make-up 1,070 1650 244.8
Lipstick & Lip Remedies 1,230 1900 391.1
Other Facial Products 170 260 39.0
Nail Products 820 1270 308.0
Skin Care Preparations
Lotions 2,400 3720 477.7
Talc & Dusting Powder 70 100 21.6
Suntan Preparations 570 880 78.6
Other Skin Care 970 1500 196.6
Hair Removal
Shaving Cream 440 680 219.0
Depilatories 110 170 20.4
Deodorant
Stick/Solid Deodorant 1,220 1890 507.3
Roll-on Deodorant 170 260 50.7
Aerosol Deodorant 250 380 76.0
Cologne & Other Deodorants 290 440 118.6 (continued)
Cost of Reformulating Foods and Cosmetics
3-14
Table 3-2. Cosmetic Products Included in Reformulation Cost Model (continued)
Product Category Number of Formulasa
Number of SKUsb
Annual Units Sold
Baby Care
Baby Oils, Ointments, Lotions 210 320 69.2
Baby Powder 90 130 41.4
Baby Bath Soap 70 100 27.6
Fragrances
Fragrances 1,110 1720 127.6
aNumber of formulas are estimated based on dollar sales. bNumber of SKUs are estimated based on formulas.
Source: Based on aggregated scanner data obtained from ACNielsen for calendar year 1999.
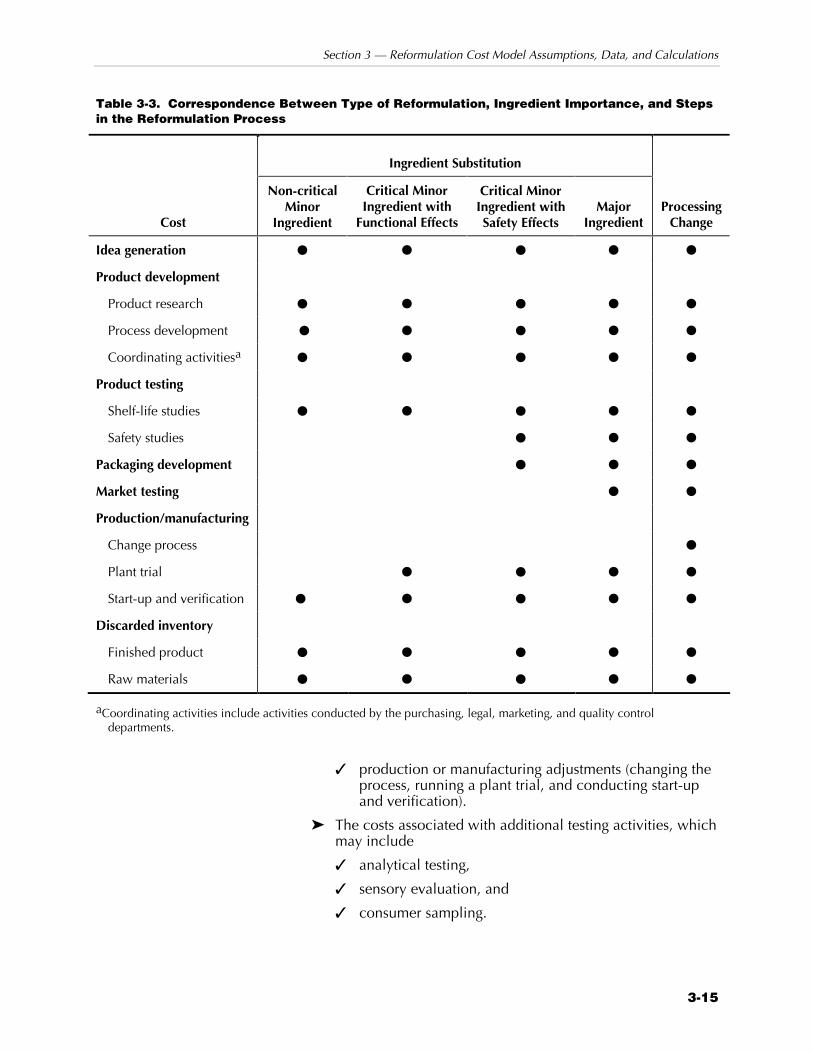
3.2.2 Cost Estimates Used in the Reformulation Model
As described in Section 2, the reformulation process varies depending on the importance of an ingredient in the product, the likely response of manufacturers, and the compliance period. After conducting data collection interviews, we modified our preliminary hypotheses regarding the correspondence between the type of reformulation and the steps involved in a typical reformulation process. The final correspondences are indicated in Table 3-3. A bullet in a cell indicates that the cost associated with that step in the reformulation process is included in the cost estimate calculation in the model. Other costs that may be included as user selections within the model are analytical tests, sensory evaluation tests, and consumer sampling tests.
The cost estimates include the following:
Z The activities associated with the actual reformulation process, which may include
X idea generation,
X product research and development,
X coordinating activities (purchasing, legal, marketing, and quality control),
X product performance testing (shelf-life studies and safety studies),
X packaging development,
X market testing, and
Section 3 — Reformulation Cost Model Assumptions, Data, and Calculations
3-15
Table 3-3. Correspondence Between Type of Reformulation, Ingredient Importance, and Steps in the Reformulation Process
Ingredient Substitution
Cost
Non-critical Minor
Ingredient
Critical Minor Ingredient with
Functional Effects
Critical Minor Ingredient with Safety Effects
Major Ingredient
Processing Change
Idea generation �� �� �� �� ��
Product development � � � � �
Product research �� �� �� �� ��
Process development �� �� �� �� ��
Coordinating activitiesa �� �� �� �� ��
Product testing � � � � �
Shelf-life studies �� �� �� �� ��
Safety studies � � �� �� ��
Packaging development � � �� �� ��
Market testing � � � �� ��
Production/manufacturing � � � � �
Change process � � � � ��
Plant trial � �� �� �� ��
Start-up and verification � � �� �� �� ��
Discarded inventory � � � � �
Finished product �� �� �� �� ��
Raw materials �� �� �� �� ��
aCoordinating activities include activities conducted by the purchasing, legal, marketing, and quality control departments.
X production or manufacturing adjustments (changing the process, running a plant trial, and conducting start-up and verification).
Z The costs associated with additional testing activities, which may include
X analytical testing,
X sensory evaluation, and
X consumer sampling.

Cost of Reformulating Foods and Cosmetics
3-16
Z The costs associated with discarding unused inventory, which may include
X raw materials and
X finished products.
Reformulation Process Costs
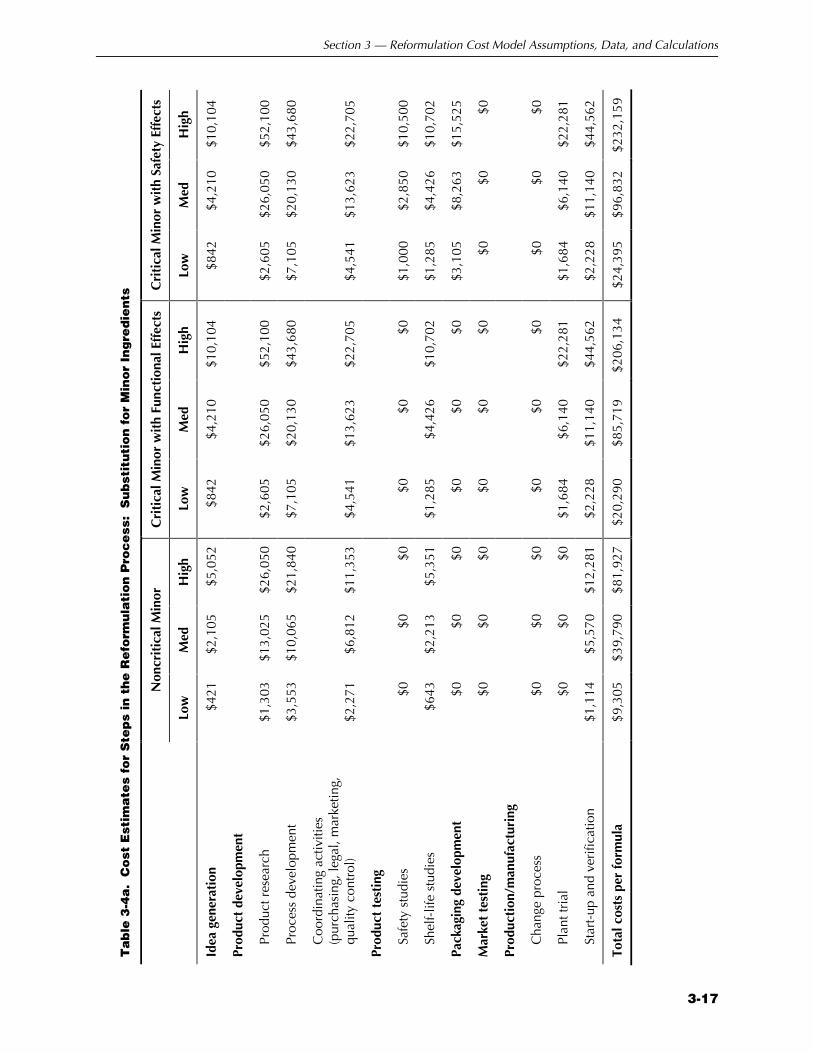
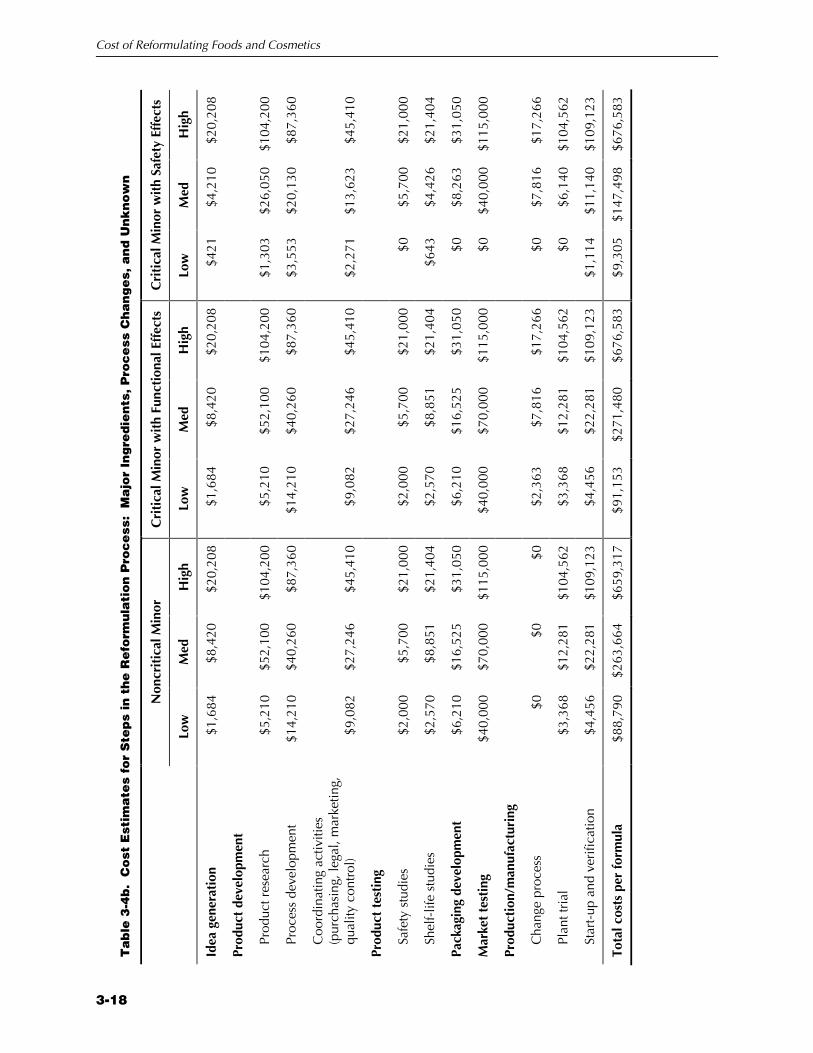
Tables 3-4a and 3-4b present the low, medium, and high per-formula cost estimates for the types of activities involved in the reformulation process based on the level of importance of the ingredient and the likely response of manufacturers. We developed the cost estimates for each of the steps from respondents’ estimates of the number of workers’ effort hours required multiplied by appropriate wage rates (including fringe benefits) plus the cost of purchased materials. If the activity was typically contracted out, we requested an estimate of the total price paid.
Across the manufacturers we interviewed, there was a wide range of cost estimates for each reformulation activity. Several respondents informed us that some reformulations prove to be quite difficult, requiring a large number of candidate formulas before a suitable one is found. These difficult reformulations, which cannot be fully anticipated, may cost several times as much as the easiest ones of the same type.
Additional Testing Activities
The reformulation cost model includes three additional types of testing—analytical testing, sensory evaluation, and consumer sampling. Depending on the level of importance of the ingredient and likely response of manufacturers, the model displays default test assumptions. The user may accept these default assumptions or alter them based on other information sources.
The analytical testing cost estimates are an augmented version of the labeling cost model cost information, while the sensory evaluation and consumer sampling cost estimates were derived separately. We developed these estimates using published price and service lists available on the Internet from several testing laboratories.
Section 3 — Reformulation Cost Model Assumptions, Data, and Calculations
3-17
Ta
ble
3-4
a. C
ost
Est
ima
tes
for
Ste
ps
in t
he
Re
form
ula
tio
n P
roc
ess
: S
ub
stit
uti
on
fo
r M
ino
r In
gre
die
nts
N
oncr
itic
al M
inor
C
riti
cal M
inor
wit
h Fu
ncti
onal
Eff
ects
C
riti
cal M
inor
wit
h Sa
fety
Eff
ects
Lo
w
Med
H
igh
Low
M
ed
Hig
h Lo
w
Med
H
igh
Idea
gen
erat
ion
$421
$2
,105
$5
,052
$8
42
$4,2
10
$10,
104
$842
$4
,210
$1
0,10
4
Prod
uct
deve
lopm
ent
Prod
uct r
esea
rch
$1,3
03
$13,
025
$26,
050
$2,6
05
$26,
050
$52,
100
$2,6
05
$26,
050
$52,
100
Proc
ess
deve
lopm
ent
$3,5
53
$10,
065
$21,
840
$7,1
05
$20,
130
$43,
680
$7,1
05
$20,
130
$43,
680
Coo
rdin
atin
g ac
tiviti
es
(pur
chas
ing,
lega
l, m
arke
ting,
qu
ality
con
trol
) $2
,271
$6
,812
$1
1,35
3 $4
,541
$1
3,62
3 $2
2,70
5 $4
,541
$1
3,62
3 $2
2,70
5
Prod
uct
test
ing
Safe
ty s
tudi
es
$0
$0
$0
$0
$0
$0
$1,0
00
$2,8
50
$10,
500
Shel
f-lif
e st
udie
s $6
43
$2,2
13
$5,3
51
$1,2
85
$4,4
26
$10,
702
$1,2
85
$4,4
26
$10,
702
Pack
agin
g de
velo
pmen
t $0
$0
$0
$0
$0
$0
$3
,105
$8
,263
$1
5,52
5
Mar
ket
test
ing
$0
$0
$0
$0
$0
$0
$0
$0
$0
Prod
ucti
on/m
anuf
actu
ring
Cha
nge
proc
ess
$0
$0
$0
$0
$0
$0
$0
$0
$0
Plan
t tri
al
$0
$0
$0
$1,6
84
$6,1
40
$22,
281
$1,6
84
$6,1
40
$22,
281
Star
t-up
and
ver
ifica
tion
$1,1
14
$5,5
70
$12,
281
$2,2
28
$11,
140
$44,
562
$2,2
28
$11,
140
$44,
562
Tota
l cos
ts p
er fo
rmul
a $9
,305
$3
9,79
0 $8
1,92
7 $2
0,29
0 $8
5,71
9 $2
06,1
34
$24,
395
$96,
832
$232
,159
Cost of Reformulating Foods and Cosmetics
3-18
Ta
ble
3-4
b. C
ost
Est
ima
tes
for
Ste
ps
in t
he
Re
form
ula
tio
n P
roc
ess
: M
ajo
r In
gre
die
nts
, P
roc
ess
Ch
an
ge
s, a
nd
Un
kn
ow
n
N
oncr
itic
al M
inor
C
riti
cal M
inor
wit
h Fu
ncti
onal
Eff
ects
C
riti
cal M
inor
wit
h Sa
fety
Eff
ects
Lo
w
Med
H
igh
Low
M
ed
Hig
h Lo
w
Med
H
igh
Idea
gen
erat
ion
$1,6
84
$8,4
20
$20,
208
$1,6
84
$8,4
20
$20,
208
$421
$4
,210
$2
0,20
8
Prod
uct
deve
lopm
ent
Prod
uct r
esea
rch
$5,2
10
$52,
100
$104
,200
$5
,210
$5
2,10
0 $1
04,2
00
$1,3
03
$26,
050
$104
,200
Proc
ess
deve
lopm
ent
$14,
210
$40,
260
$87,
360
$14,
210
$40,
260
$87,
360
$3,5
53
$20,
130
$87,
360
Coo
rdin
atin
g ac
tiviti
es
(pur
chas
ing,
lega
l, m
arke
ting,
qu
ality
con
trol
) $9
,082
$2
7,24
6 $4
5,41
0 $9
,082
$2
7,24
6 $4
5,41
0 $2
,271
$1
3,62
3 $4
5,41
0
Prod
uct
test
ing
Safe
ty s
tudi
es
$2,0
00
$5,7
00
$21,
000
$2,0
00
$5,7
00
$21,
000
$0
$5,7
00
$21,
000
Shel
f-lif
e st
udie
s $2
,570
$8
,851
$2
1,40
4 $2
,570
$8
,851
$2
1,40
4 $6
43
$4,4
26
$21,
404
Pack
agin
g de
velo
pmen
t $6
,210
$1
6,52
5 $3
1,05
0 $6
,210
$1
6,52
5 $3
1,05
0 $0
$8
,263
$3
1,05
0
Mar
ket
test
ing
$40,
000
$70,
000
$115
,000
$4
0,00
0 $7
0,00
0 $1
15,0
00
$0
$40,
000
$115
,000
Prod
ucti
on/m
anuf
actu
ring
Cha
nge
proc
ess
$0
$0
$0
$2,3
63
$7,8
16
$17,
266
$0
$7,8
16
$17,
266
Plan
t tri
al
$3,3
68
$12,
281
$104
,562
$3
,368
$1
2,28
1 $1
04,5
62
$0
$6,1
40
$104
,562
Star
t-up
and
ver
ifica
tion
$4,4
56
$22,
281
$109
,123
$4
,456
$2
2,28
1 $1
09,1
23
$1,1
14
$11,
140
$109
,123
Tota
l cos
ts p
er fo
rmul
a $8
8,79
0 $2
63,6
64
$659
,317
$9
1,15
3 $2
71,4
80
$676
,583
$9
,305
$1
47,4
98
$676
,583
Section 3 — Reformulation Cost Model Assumptions, Data, and Calculations
3-19
Analytical Testing Costs. In the reformulation cost model, the user chooses which analytical tests to include in the cost estimates. For each formula, the total analytical test cost calculation includes
Z the cost of testing two samples,
Z 1 hour of labor to prepare and package the samples ($14.73), and
Z delivery charges for one 2-pound package delivered overnight ($26.30).
Table 3-5 provides low, medium, and high cost estimates for the set of analytical tests included as options in the model. The labor cost estimate was based on average total compensation (wages and benefits) for “handlers, equipment cleaners, helpers, and laborers” in manufacturing industries (U.S. Department of Labor, 2001). The delivery charge estimate was based on the average charge for delivery of a 2-pound package overnight by FedEx (FedEx, 2001).
Sensory Evaluation Test Costs. In the reformulation cost model, the user chooses which sensory evaluation tests to include in the cost estimates. For each test the user selects, we assume that manufacturers perform at least two sensory evaluation tests—one with an experienced panel and one with a consumer panel. Table 3-6 provides the low, medium, and high cost estimates for the set of sensory evaluation tests included as options in the model.
Consumer Sampling Test Costs. In the reformulation cost model, the user chooses which consumer sampling tests to include in the cost estimates. For each test the user selects, we assume that manufacturers perform a number of specified tests. Table 3-7 provides the low, medium, and high cost estimates for the set of consumer sampling tests included as options in the model.
Discarded Inventory Costs
For short compliance periods, manufacturers may need to discard finished goods that cannot be sold prior to the effective date of the regulation. In addition, long-term contracts for raw materials often require purchase of specified quantities; if the ingredient in question is eliminated from the new formula, the manufacturer may still be obligated to pay for the material. In most cases, producers will have sufficient time to sell through existing inventories and

Cost of Reformulating Foods and Cosmetics
3-20
Type of Test Low Medium High
NLEA panel $485 $560 $650
Fatty acid profile $75 $125 $275
Trans fatty acids $110 $125 $165
Sugar profile $50 $73 $300
Peroxide $20 $33 $46
Soluble fiber $80 $133 $190
Insoluble fiber $80 $100 $185
Vitamins $32 $72 $260
Minerals $12 $33 $85
Iodine $45 $60 $90
Acidity (pH) $15 $19 $23
Microbiological screen $55 $64 $73
Iodine value (IV) $30 $48 $65
Pathogens $8 $26 $85
Bioengineered—PCR test $245 $300 $355
Bioengineered—ELISA lab test $50 $60 $70
Bioengineered—ELISA strip test $5 $7.50 $10
Caffeine $65 $103 $110
Allergens $70 $85 $100
Dietary supplement—vitamins $32 $72 $260
Dietary supplement—minerals $12 $33 $85
Dietary supplement—amino acids $100 $160 $260
Dietary supplement—botanicals $110 $205 $400
Dietary supplement—other ingredients $125 $225 $450
Type of Test Low Medium High
Descriptive test $480 $960 $1,440
Discrimination test $690 $1,380 $2,070
Preference and acceptability test $1,640 $3,280 $4,920
Table 3-5. Analytical Testing Cost Estimates (Selected by the Model User) In the model, these costs are multiplied by two tests, and labor and shipping costs are added.
Table 3-6. Sensory Evaluation Test Cost Estimates (Selected by the Model User)
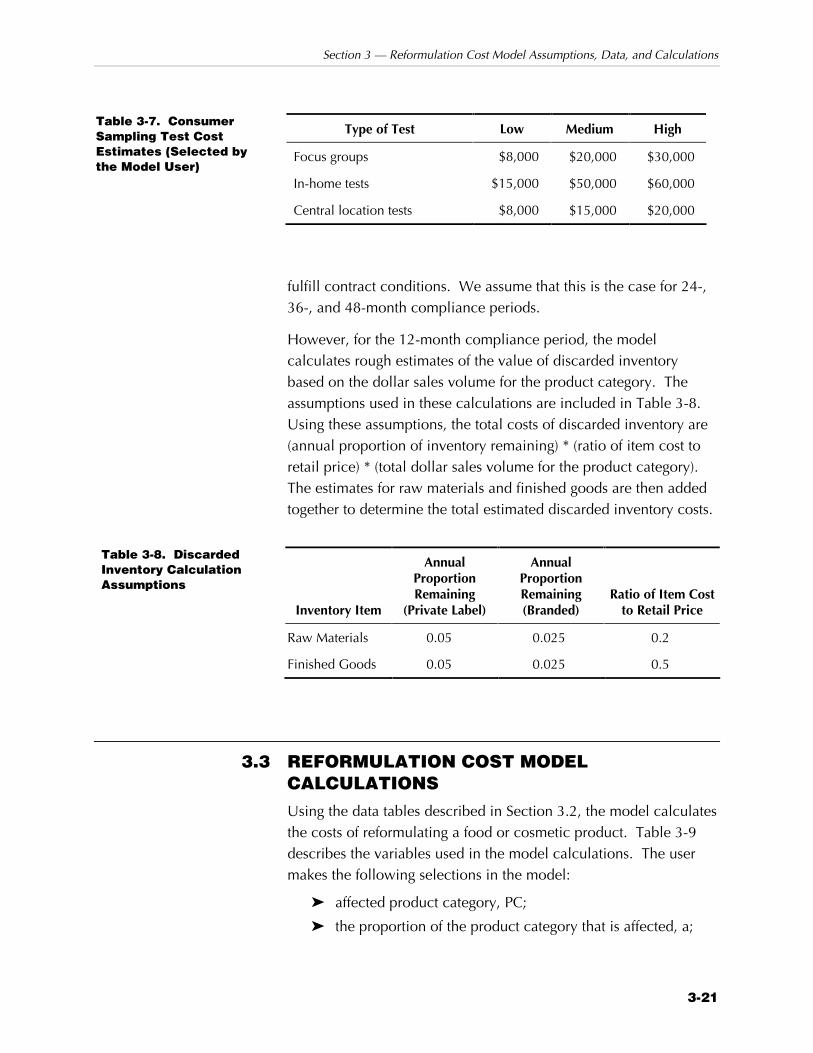
Section 3 — Reformulation Cost Model Assumptions, Data, and Calculations
3-21
Type of Test Low Medium High
Focus groups $8,000 $20,000 $30,000
In-home tests $15,000 $50,000 $60,000
Central location tests $8,000 $15,000 $20,000
fulfill contract conditions. We assume that this is the case for 24-, 36-, and 48-month compliance periods.
However, for the 12-month compliance period, the model calculates rough estimates of the value of discarded inventory based on the dollar sales volume for the product category. The assumptions used in these calculations are included in Table 3-8. Using these assumptions, the total costs of discarded inventory are (annual proportion of inventory remaining) * (ratio of item cost to retail price) * (total dollar sales volume for the product category). The estimates for raw materials and finished goods are then added together to determine the total estimated discarded inventory costs.
Inventory Item
Annual Proportion Remaining
(Private Label)
Annual Proportion Remaining (Branded)
Ratio of Item Cost to Retail Price
Raw Materials 0.05 0.025 0.2
Finished Goods 0.05 0.025 0.5
3.3 REFORMULATION COST MODEL CALCULATIONS Using the data tables described in Section 3.2, the model calculates the costs of reformulating a food or cosmetic product. Table 3-9 describes the variables used in the model calculations. The user makes the following selections in the model:
Z affected product category, PC;
Z the proportion of the product category that is affected, a;
Table 3-7. Consumer Sampling Test Cost Estimates (Selected by the Model User)
Table 3-8. Discarded Inventory Calculation Assumptions
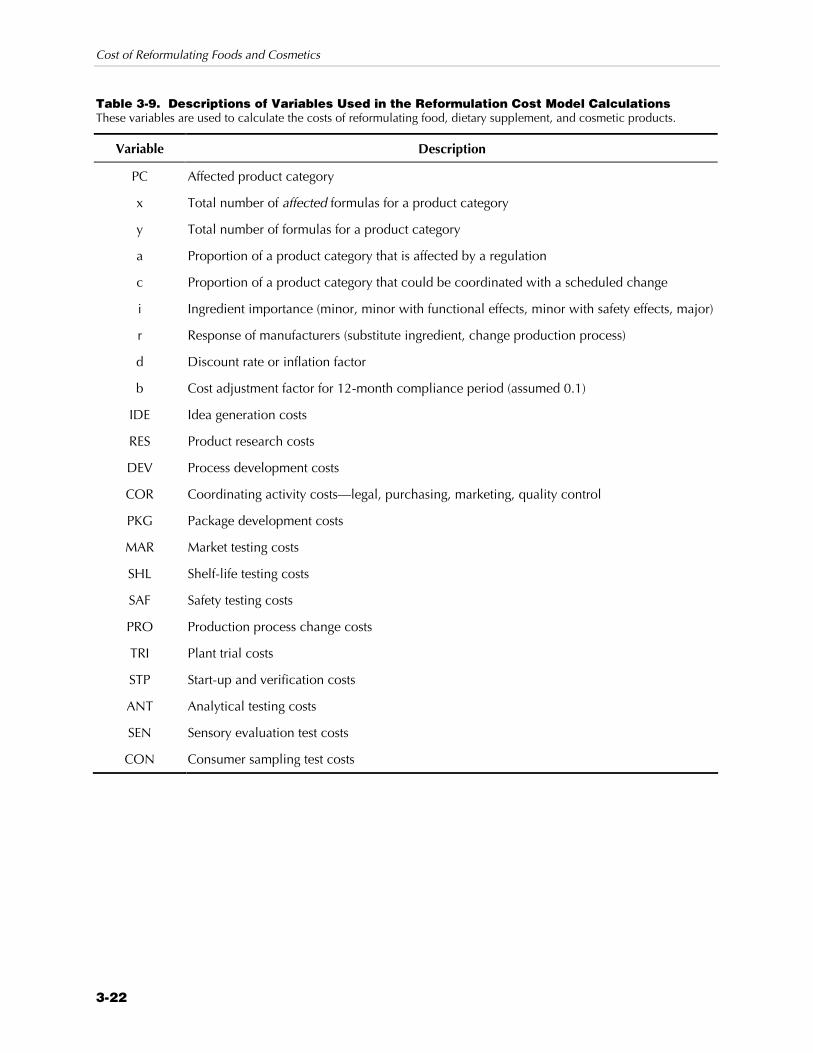
Cost of Reformulating Foods and Cosmetics
3-22
Table 3-9. Descriptions of Variables Used in the Reformulation Cost Model Calculations These variables are used to calculate the costs of reformulating food, dietary supplement, and cosmetic products.
Variable Description
PC Affected product category
x Total number of affected formulas for a product category
y Total number of formulas for a product category
a Proportion of a product category that is affected by a regulation
c Proportion of a product category that could be coordinated with a scheduled change
i Ingredient importance (minor, minor with functional effects, minor with safety effects, major)
r Response of manufacturers (substitute ingredient, change production process)
d Discount rate or inflation factor
b Cost adjustment factor for 12-month compliance period (assumed 0.1)
IDE Idea generation costs
RES Product research costs
DEV Process development costs
COR Coordinating activity costs—legal, purchasing, marketing, quality control
PKG Package development costs
MAR Market testing costs
SHL Shelf-life testing costs
SAF Safety testing costs
PRO Production process change costs
TRI Plant trial costs
STP Start-up and verification costs
ANT Analytical testing costs
SEN Sensory evaluation test costs
CON Consumer sampling test costs
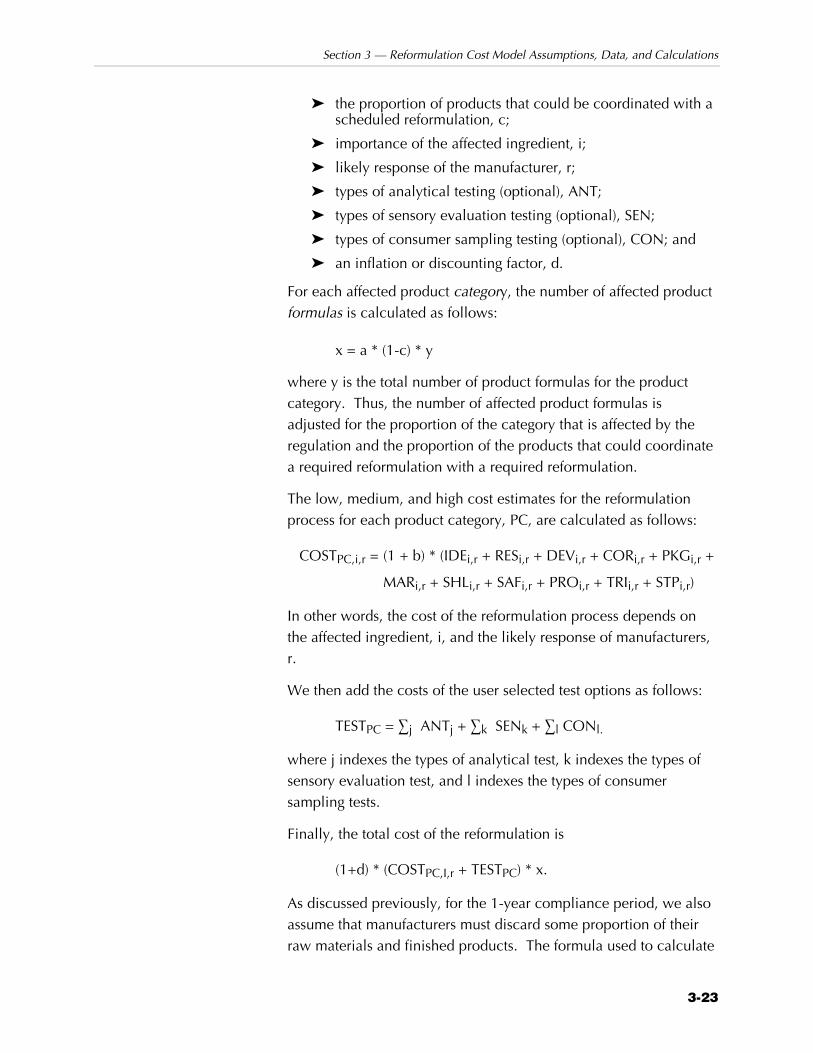
Section 3 — Reformulation Cost Model Assumptions, Data, and Calculations
3-23
Z the proportion of products that could be coordinated with a scheduled reformulation, c;
Z importance of the affected ingredient, i;
Z likely response of the manufacturer, r;
Z types of analytical testing (optional), ANT;
Z types of sensory evaluation testing (optional), SEN;
Z types of consumer sampling testing (optional), CON; and
Z an inflation or discounting factor, d.
For each affected product category, the number of affected product formulas is calculated as follows:
x = a * (1-c) * y
where y is the total number of product formulas for the product category. Thus, the number of affected product formulas is adjusted for the proportion of the category that is affected by the regulation and the proportion of the products that could coordinate a required reformulation with a required reformulation.
The low, medium, and high cost estimates for the reformulation process for each product category, PC, are calculated as follows:
COSTPC,i,r = (1 + b) * (IDEi,r + RESi,r + DEVi,r + CORi,r + PKGi,r +
MARi,r + SHLi,r + SAFi,r + PROi,r + TRIi,r + STPi,r)
In other words, the cost of the reformulation process depends on the affected ingredient, i, and the likely response of manufacturers, r.
We then add the costs of the user selected test options as follows:
TESTPC = �j ANTj + �k SENk + �l CONl.
where j indexes the types of analytical test, k indexes the types of sensory evaluation test, and l indexes the types of consumer sampling tests.
Finally, the total cost of the reformulation is
(1+d) * (COSTPC,I,r + TESTPC) * x.
As discussed previously, for the 1-year compliance period, we also assume that manufacturers must discard some proportion of their raw materials and finished products. The formula used to calculate
Cost of Reformulating Foods and Cosmetics
3-24
discarded inventory costs is described in Section 3.2. For longer compliance periods, we assume that manufacturers would have sufficient time to deplete their inventories.
3.4 CONSIDERATIONS BEYOND THE MODEL As we constructed the model and conducted interviews with manufacturers, we identified several considerations that could not be addressed in the current modeling framework. FDA may wish to consider addressing these issues in future data collection efforts. These include the following:
Z The current modeling framework includes the one-time costs for reformulating products, but manufacturers may incur ongoing costs associated with the regulation. Ongoing costs may include higher cost ingredients, additional processing steps, and changes in yield of the product. These costs are difficult to estimate and generalize because they vary substantially from product to product and by type and complexity of the reformulation.
Z The current modeling framework includes the costs of reformulation on a per-formula basis, but manufacturers may potentially achieve cost savings by reformulating multiple product formulas simultaneously. In our interviews with manufacturers, they reported that they frequently reformulate several product versions at one time. It is certainly reasonable to expect that there may be “economies of scope” associated with reformulation activities. Making an adjustment to account for this potential would require detailed information about the typical number of similar products produced by a manufacturer.
Z Under some situations, a manufacturer may choose to stop producing a product rather than reformulate to comply with a regulation. We received information in our interviews that small firms would be more likely than large firms to stop production if their reformulation costs were large. Large firms reported they would likely bear even very high costs, as long as their competitors were similarly affected.
3.5 REFERENCES FedEx. February 1, 2001. “U.S. Rates: FedEx Priority Overnight®.”
Excel spreadsheets. <http://rate.dmz.fedex.com/us/ rates/downloads/#eservice>.

Section 3 — Reformulation Cost Model Assumptions, Data, and Calculations
3-25
Muth, M.K., E.C. Gledhill, and S.A. Karns. November 2001. “FDA Labeling Cost Model.” Report prepared for U.S. Food and Drug Administration, Center for Food Safety and Applied Nutrition. Research Triangle Park, NC: RTI.
Nutrition Business Journal. 2000. “U.S. Nutrition Industry, 1994-2000, Products & Channels.”
U.S. Department of Labor, Bureau of Labor Statistics. June 29, 2001. “Employer Costs for Employee Compensation—March 2001.” USDL: 01-194.

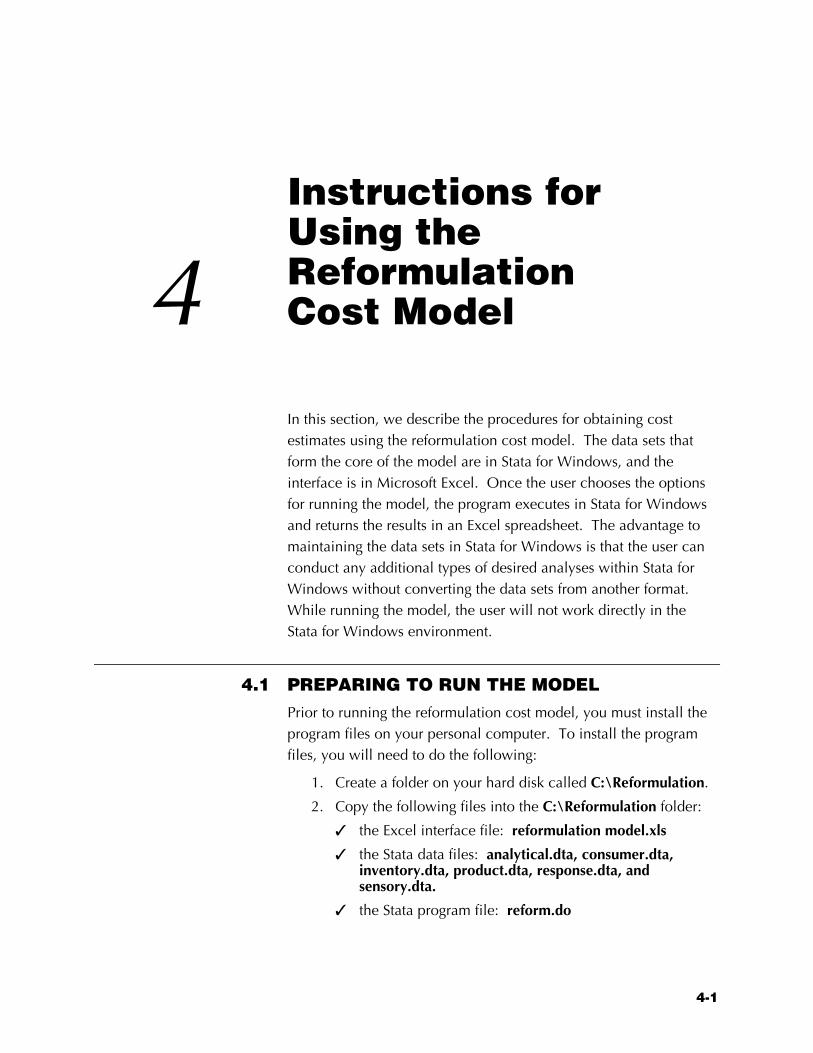
4-1
Instructions for Using the Reformulation 4 Cost Model
In this section, we describe the procedures for obtaining cost estimates using the reformulation cost model. The data sets that form the core of the model are in Stata for Windows, and the interface is in Microsoft Excel. Once the user chooses the options for running the model, the program executes in Stata for Windows and returns the results in an Excel spreadsheet. The advantage to maintaining the data sets in Stata for Windows is that the user can conduct any additional types of desired analyses within Stata for Windows without converting the data sets from another format. While running the model, the user will not work directly in the Stata for Windows environment.
4.1 PREPARING TO RUN THE MODEL Prior to running the reformulation cost model, you must install the program files on your personal computer. To install the program files, you will need to do the following:
1. Create a folder on your hard disk called C:\Reformulation.
2. Copy the following files into the C:\Reformulation folder:
X the Excel interface file: reformulation model.xls
X the Stata data files: analytical.dta, consumer.dta, inventory.dta, product.dta, response.dta, and sensory.dta.
X the Stata program file: reform.do
Cost of Reformulating Foods and Cosmetics
4-2
In Section 4.2, we provide instructions for running the model. However, prior to running the model, it may be useful to review the process by which the model runs. The process is as follows:
Z Open the Excel interface (reformulation model.xls) and choose the model inputs.
Z The Excel interface outputs the model inputs into a text file in the C:\Reformulation folder, calls up the Stata for Windows program, and waits for an output file.
Z The Stata for Windows program (reform.do) reads the text file of user inputs, calculates the reformulation cost estimates, and outputs a tab-delimited text file called reformcost.out into the C:\Reformulation folder.
Z The Excel interface program opens the reformcost.out file and dumps the cost estimates into the Data and Aggregate Data sheets and dumps the user inputs into the Inputs sheet.
Z The Excel program creates the following two pivot tables (each on a separate sheet):
X Aggregate Costs, which displays the total low, medium, and high cost estimates by product category;
X All Costs, which displays the detailed low, medium, and high cost estimates for each product category; and
X Totals by Cost Type, which displays the total low, medium, and high cost estimates by type of cost for all product categories combined.
4.2 SELECTING MODEL INPUTS To select the inputs for running the labeling cost model, open the Excel file reformulation model.xls. Once the model has opened, click [Start Reformulation Model] and the Main Menu screen will appear (see Figure 4-1). This menu will guide you through the process of choosing the inputs for the model.
You may click [Cancel] on the Main Menu to exit the model at any time, and you may click [Reset All Selections] on the Main Menu to clear all of your selections on every menu. Click [Reset Selections] at the bottom of the other menus to clear your selections on that particular menu. To learn more about any of the model inputs, you may click the [More Info] buttons on the right side of the Main Menu or at the bottom of each input menu.
Step 1: Open the file reformulation model.xls by double-clicking on the file name.

Section 4 — Instructions for Using the Reformulation Cost Model
4-3
You may select product categories sorted by Product Type OR by NAICS code. You may also select an entire Product Type OR and entire NAICS code. Although you may select more than one category, type, or NAICS code to include in a cost estimation, they must be chosen individually because of several assumptions that are linked with each selection. Having these assumptions linked to individual product categories, types, or NAICS codes allows you to vary the assumptions by selection rather than assume that they are the same across all selected categories, types, and/or NAICS codes. These assumptions include the percentage of the formulas in the category that would be affected by the regulation, the response of manufacturers within that product category to the regulation, and the level of importance the regulated ingredient has in that product category.
To choose the affected product categories sorted by Product Type or an entire product type:
Z Click [Select by Type].
When you click [Select by Type], a new menu will open (see Figure 4-2). On this menu, you may choose an individual product
Figure 4-1. The Main Menu Screen for the Reformulation Cost Model Follow the steps on the Main Menu screen to select the model inputs.
Step 2: Choose affected product categories sorted by either: Z product types or
Z NAICS codes.
To select product categories by IRI-based product types, begin here.

Cost of Reformulating Foods and Cosmetics
4-4
category to include in the model. To select an individual product category:
Z Click on a product type from the “Product Type” list on the far left of the menu. Once a product type is highlighted, all of the product categories within the type will display in the “Product Categories” list immediately to the right.
Z Double-click on the desired product category in the “Product Categories” list and it will display in the “User Selection” box.
OR:
Z Click on the desired product category in the “Product Categories” list. Click [Add Category]. The selected category will then display in the “User Selection” box.
To select an entire product type:
Z Click on a product type from the “Product Type” list at the far left of the menu.
Z Click [Add Entire Type].
To remove the selected product category or type from the “User Selection” box:
Z Double-click on the product category or product type in the “User Selection” box.
OR:
Figure 4-2. The Product Selection Screen for Choosing Product Categories by IRI-Based Product Types You may choose product categories by product type or by NAICS codes (see Figure 4-3).

Section 4 — Instructions for Using the Reformulation Cost Model
4-5
Z Click on the category or product type in the “User Selection” box and then click [Remove Category].
To select the percentage of the product category or type that is affected by the regulation:
Z Click on the percentage affected text box and enter a value between 0 and 100.
To select the likely response of manufacturers to the regulation:
Z Click on the arrow in the manufacturer’s response drop-down box and select Substitute ingredient(s), Change production process, or Unknown.
Once the manufacturer response has been chosen, the ingredient importance must be chosen. If you select Change production process as the manufacturer response, then the model assumes the ingredient importance to be major, and the ingredient importance drop-down box is deactivated. Similarly, if you selected Unknown as the manufacturer response, then the model assumes the ingredient importance to be unknown and the ingredient importance drop-down box is also deactivated. To select the level of importance of the ingredient in the product category:
Z Click on the arrow in the ingredient importance drop-down box and select Noncritical minor, Critical minor w/ functional effects, Critical minor w/ safety effects, or Major.
Z If you would like to clear your selections on this screen only, click [Reset Selections].
The selected manufacturer response and the ingredient importance level determine default tests to be assumed by the model. If you would like to select additional tests, or alter the defaults,
Z Click [Select Tests]
OR:
If you would like to retain the default tests,
Z Click [Back to Main Menu]
A message box will appear to confirm that you accept the assumed default tests. If you would like to retain the defaults, click [Yes] and you will be returned to the Main Menu. If you would like to alter the selected tests, click [No] and the Test Menu will open.
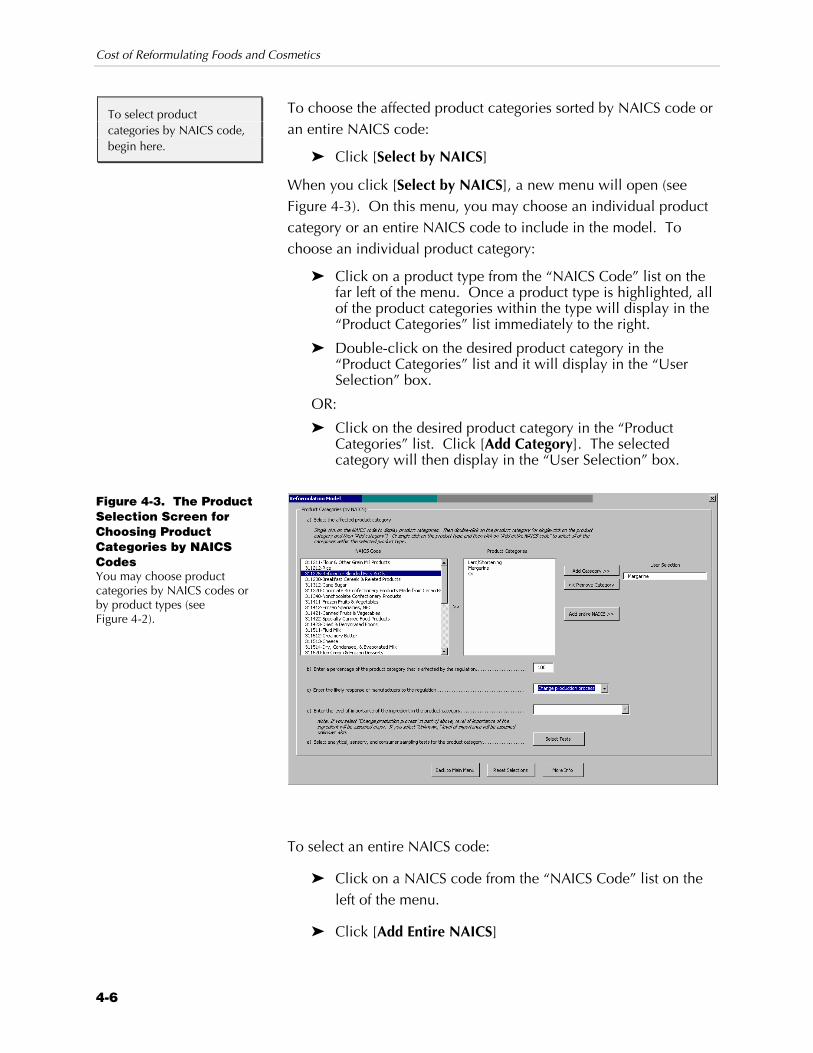
Cost of Reformulating Foods and Cosmetics
4-6
To choose the affected product categories sorted by NAICS code or an entire NAICS code:
Z Click [Select by NAICS]
When you click [Select by NAICS], a new menu will open (see Figure 4-3). On this menu, you may choose an individual product category or an entire NAICS code to include in the model. To choose an individual product category:
Z Click on a product type from the “NAICS Code” list on the far left of the menu. Once a product type is highlighted, all of the product categories within the type will display in the “Product Categories” list immediately to the right.
Z Double-click on the desired product category in the “Product Categories” list and it will display in the “User Selection” box.
OR:
Z Click on the desired product category in the “Product Categories” list. Click [Add Category]. The selected category will then display in the “User Selection” box.
To select an entire NAICS code:
Z Click on a NAICS code from the “NAICS Code” list on the left of the menu.
Z Click [Add Entire NAICS]
To select product categories by NAICS code, begin here.
Figure 4-3. The Product Selection Screen for Choosing Product Categories by NAICS Codes You may choose product categories by NAICS codes or by product types (see Figure 4-2).
Section 4 — Instructions for Using the Reformulation Cost Model
4-7
To remove the selected product category or entire NAICS code from the “User Selection” box:
Z Double-click on the product category or NAICS code in the “User Selection” box.
OR:
Z Click on the product category or NAICS code in the “User Selection” box and then click [Remove Category].
To select the percentage of the product category or NAICS code that is affected by the regulation:
Z Click on the percentage affected text box and enter a value between 0 and 100.
To select the likely response of manufacturers to the regulation:
Z Click on the arrow in the manufacturer’s response drop-down box and select Substitute ingredient(s), Change production process, or Unknown.
Once the manufacturer response has been chosen, the ingredient importance must be chosen. If you selected Change production process above, then the model assumes the ingredient importance to be major, and the ingredient importance drop-down box is deactivated. Similarly, if you selected Unknown as the manufacturer response, then the model assumes the ingredient importance to be unknown and the ingredient importance drop-down box is also deactivated. To select the level of importance of the ingredient in the product category:
Z Click on the arrow in the ingredient importance drop-down box and select Noncritical minor, Critical minor w/ functional effects, Critical minor w/ safety effects, or Major.
Z If you would like to clear your selections on this screen only, click [Reset Selections].
The selected manufacturer response and the ingredient importance level determine default tests to be assumed by the model. If you would like to select additional tests, or alter the defaults,
Z Click [Select Tests]
OR:
If you would like to retain the default tests,
Z Click [Back to Main Menu]
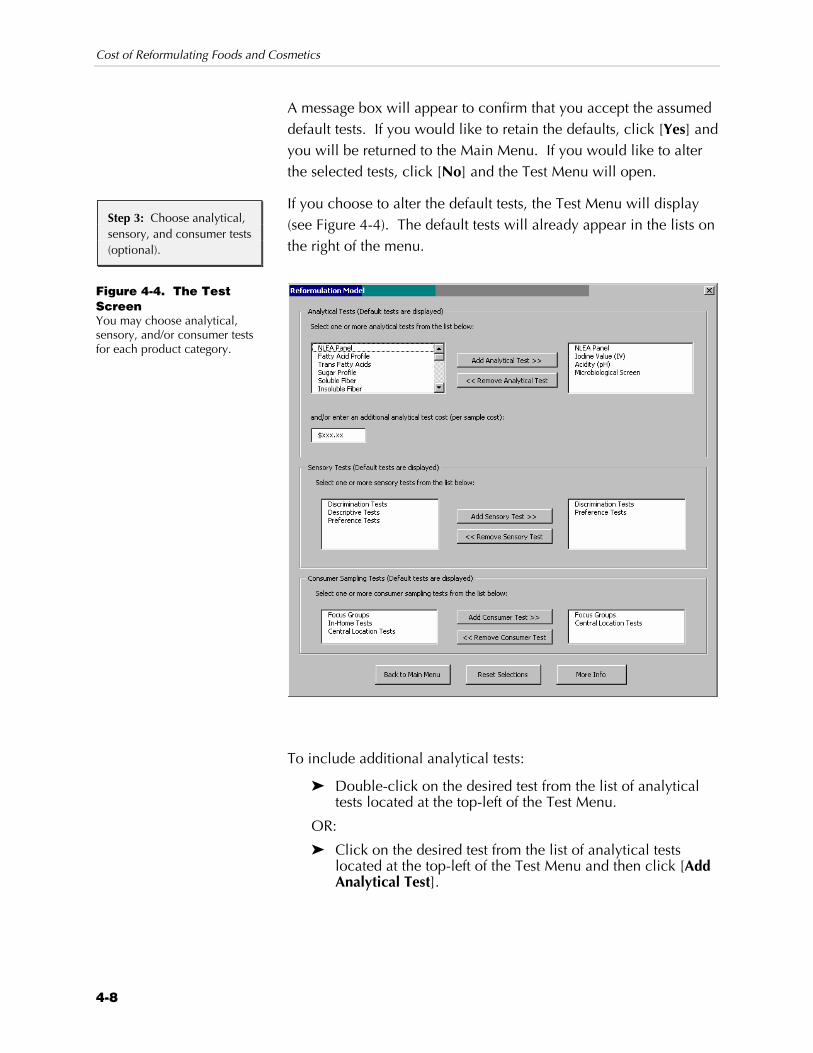
Cost of Reformulating Foods and Cosmetics
4-8
A message box will appear to confirm that you accept the assumed default tests. If you would like to retain the defaults, click [Yes] and you will be returned to the Main Menu. If you would like to alter the selected tests, click [No] and the Test Menu will open.
If you choose to alter the default tests, the Test Menu will display (see Figure 4-4). The default tests will already appear in the lists on the right of the menu.
To include additional analytical tests:
Z Double-click on the desired test from the list of analytical tests located at the top-left of the Test Menu.
OR:
Z Click on the desired test from the list of analytical tests located at the top-left of the Test Menu and then click [Add Analytical Test].
Step 3: Choose analytical, sensory, and consumer tests (optional).
Figure 4-4. The Test Screen You may choose analytical, sensory, and/or consumer tests for each product category.
Section 4 — Instructions for Using the Reformulation Cost Model
4-9
To remove analytical tests:
Z Double-click on the test to be removed from the list of selected analytical tests located at the top right of the Test Menu.
OR:
Z Click on the test to be removed from the list of selected analytical tests located at the top right of the Test Menu and then click [Remove Analytical Test].
To add analytical tests for a type of test not listed:
Z Click on the additional test cost box and enter in a total cost per sample.
To include additional sensory tests:
Z Double-click on the desired test from the list of sensory tests located at the center-left of the Test Menu.
OR:
Z Click on the desired test from the list of sensory tests located at the center-left of the Test Menu and then click [Add Sensory Test].
To remove sensory tests:
Z Double-click on the test to be removed from the list of selected sensory tests located at the center-right of the Test Menu.
OR:
Z Click on the test to be removed from the list of selected sensory tests located at the center-right of the Test Menu and then click [Remove Sensory Test].
To include additional consumer tests:
Z Double-click on the desired test from the list of consumer tests located at the bottom-left of the Test Menu.
OR:
Z Click on the desired test from the list of consumer tests located at the bottom-left of the Test Menu and then click [Add Consumer Test].
To remove consumer tests:
Z Double-click on the test to be removed from the list of selected consumer tests located at the bottom-right of the Test Menu.
OR:
Z Click on the test to be removed from the list of selected consumer tests located at the bottom-right of the Test Menu and then click [Remove Consumer Test].
Cost of Reformulating Foods and Cosmetics
4-10
Z If you would like to clear your selections on this screen only, click [Reset Selections].
Z Once you have selected analytical, sensory, and consumer tests, click [Back to Main Menu].
Once you have clicked [Back to Main Menu] from either the product screen or the test screen you will return to the Main Menu and must choose a compliance period.
To choose a compliance period:
Z Click [Select Compliance Period].
When you click [Select Compliance Period] a new menu will open (see Figure 4-5). On this menu, you must select the time period that manufacturers have to comply with the regulation. You may also change the model’s assumption about the percentage of products that can coordinate a regulated reformulation with a scheduled reformulation.
Z To select a compliance period, choose 12 months, 24 months, 36 months, or 48 months from the drop-down box.
Z The coordination assumptions for the selected compliance period will then display in the box below. To change those assumptions click on the box and enter a new percentage.
Z If you would like to clear your selections on this screen only, click [Reset Selections].
Z Once you have selected the compliance period, click [Back to Main Menu].
You will again be returned to the Main Menu and may now select a price adjustment factor. If you are running the model to estimate costs in a year beyond 2002, you may wish to enter an inflation factor. To enter an inflation factor:
Z Click on the price adjustment factor box and enter 1.xx where xx represents the total inflation factor beyond 2002. (By default, the inflation factor is set to 1.00.)
You may also wish to use the price adjustment factor to discount future changes back to the present. To enter a discount factor:
Z Click on the price adjustment factor box and enter a value between 0.5 and 1.0.
Step 4: Choose a compliance period and coordination assumptions.
Step 5: Enter a price adjustment factor (optional).
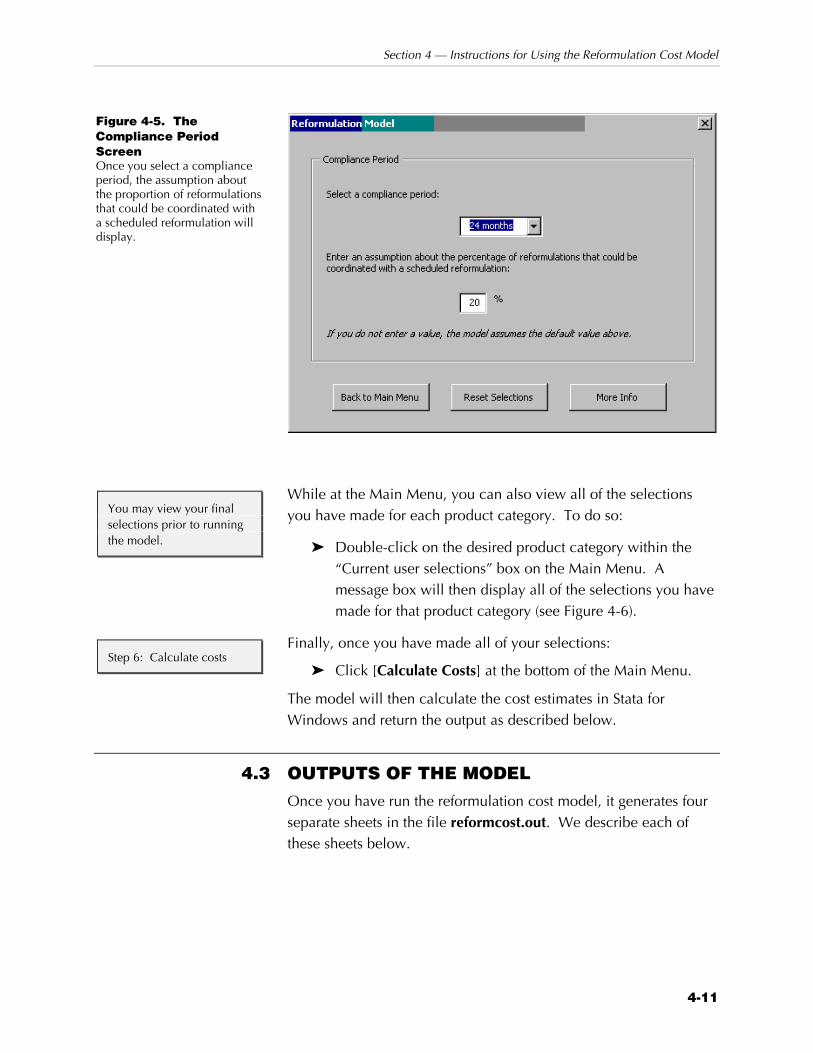
Section 4 — Instructions for Using the Reformulation Cost Model
4-11
While at the Main Menu, you can also view all of the selections you have made for each product category. To do so:
Z Double-click on the desired product category within the “Current user selections” box on the Main Menu. A message box will then display all of the selections you have made for that product category (see Figure 4-6).
Finally, once you have made all of your selections:
Z Click [Calculate Costs] at the bottom of the Main Menu.
The model will then calculate the cost estimates in Stata for Windows and return the output as described below.
4.3 OUTPUTS OF THE MODEL Once you have run the reformulation cost model, it generates four separate sheets in the file reformcost.out. We describe each of these sheets below.
Figure 4-5. The Compliance Period Screen Once you select a compliance period, the assumption about the proportion of reformulations that could be coordinated with a scheduled reformulation will display.
You may view your final selections prior to running the model.
Step 6: Calculate costs
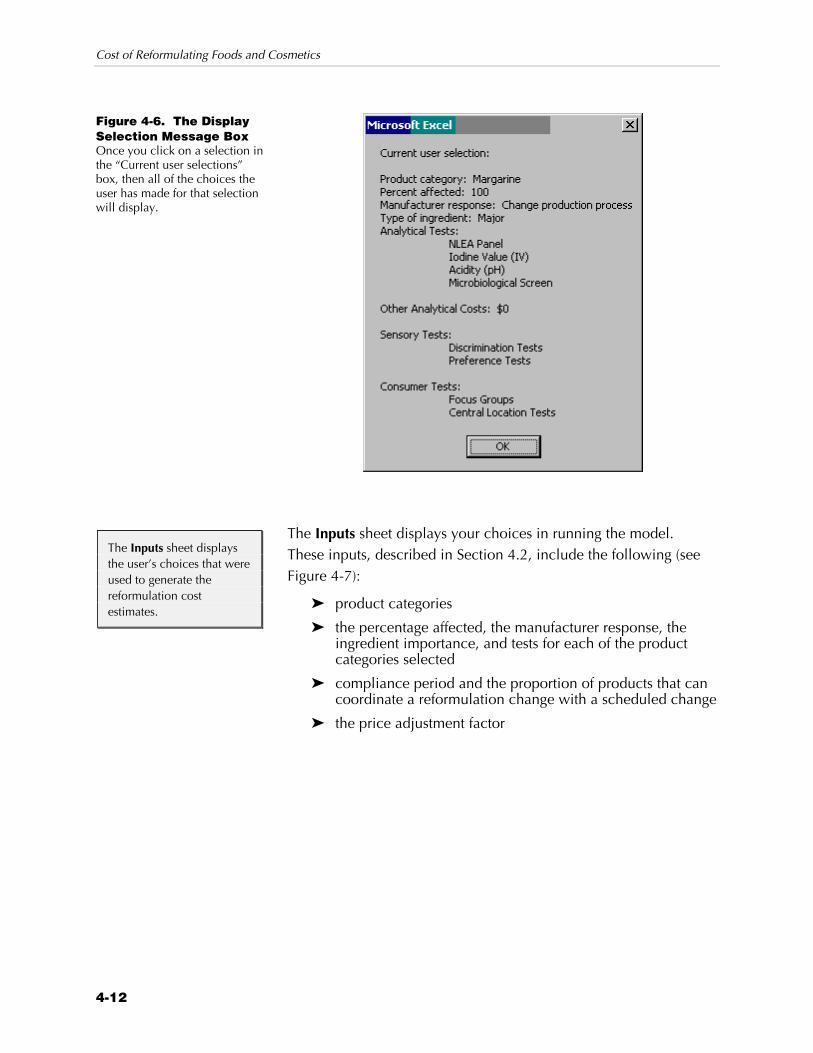
Cost of Reformulating Foods and Cosmetics
4-12
The Inputs sheet displays your choices in running the model. These inputs, described in Section 4.2, include the following (see Figure 4-7):
Z product categories
Z the percentage affected, the manufacturer response, the ingredient importance, and tests for each of the product categories selected
Z compliance period and the proportion of products that can coordinate a reformulation change with a scheduled change
Z the price adjustment factor
Figure 4-6. The Display Selection Message Box Once you click on a selection in the “Current user selections” box, then all of the choices the user has made for that selection will display.
The Inputs sheet displays the user’s choices that were used to generate the reformulation cost estimates.
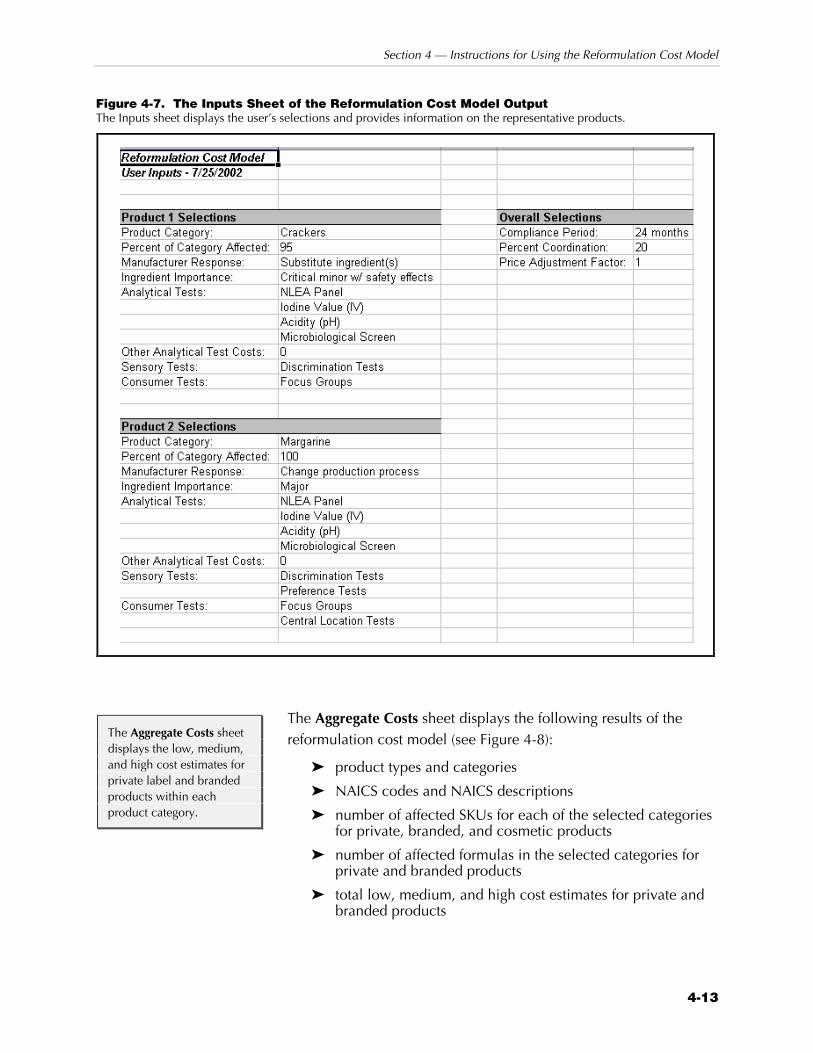
Section 4 — Instructions for Using the Reformulation Cost Model
4-13
Figure 4-7. The Inputs Sheet of the Reformulation Cost Model Output The Inputs sheet displays the user’s selections and provides information on the representative products.
The Aggregate Costs sheet displays the following results of the reformulation cost model (see Figure 4-8):
Z product types and categories
Z NAICS codes and NAICS descriptions
Z number of affected SKUs for each of the selected categories for private, branded, and cosmetic products
Z number of affected formulas in the selected categories for private and branded products
Z total low, medium, and high cost estimates for private and branded products
The Aggregate Costs sheet displays the low, medium, and high cost estimates for private label and branded products within each product category.
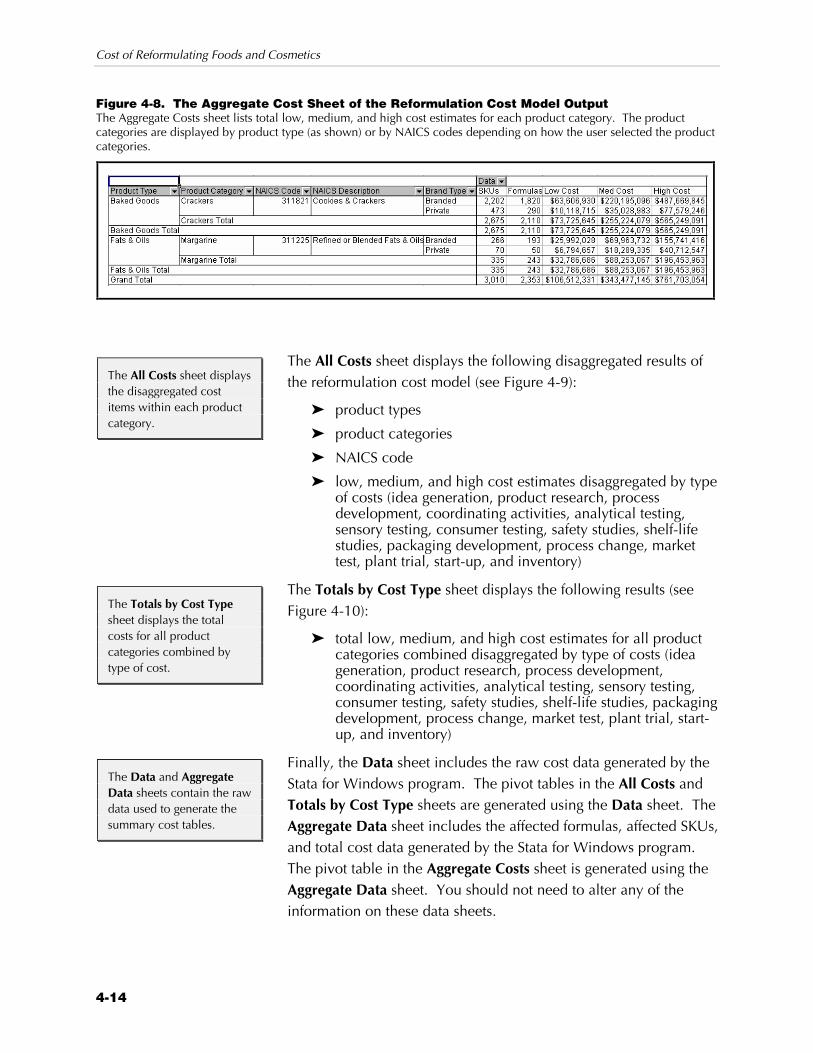
Cost of Reformulating Foods and Cosmetics
4-14
Figure 4-8. The Aggregate Cost Sheet of the Reformulation Cost Model Output The Aggregate Costs sheet lists total low, medium, and high cost estimates for each product category. The product categories are displayed by product type (as shown) or by NAICS codes depending on how the user selected the product categories.
The All Costs sheet displays the following disaggregated results of the reformulation cost model (see Figure 4-9):
Z product types
Z product categories
Z NAICS code
Z low, medium, and high cost estimates disaggregated by type of costs (idea generation, product research, process development, coordinating activities, analytical testing, sensory testing, consumer testing, safety studies, shelf-life studies, packaging development, process change, market test, plant trial, start-up, and inventory)
The Totals by Cost Type sheet displays the following results (see Figure 4-10):
Z total low, medium, and high cost estimates for all product categories combined disaggregated by type of costs (idea generation, product research, process development, coordinating activities, analytical testing, sensory testing, consumer testing, safety studies, shelf-life studies, packaging development, process change, market test, plant trial, start-up, and inventory)
Finally, the Data sheet includes the raw cost data generated by the Stata for Windows program. The pivot tables in the All Costs and Totals by Cost Type sheets are generated using the Data sheet. The Aggregate Data sheet includes the affected formulas, affected SKUs, and total cost data generated by the Stata for Windows program. The pivot table in the Aggregate Costs sheet is generated using the Aggregate Data sheet. You should not need to alter any of the information on these data sheets.
The All Costs sheet displays the disaggregated cost items within each product category.
The Totals by Cost Type sheet displays the total costs for all product categories combined by type of cost.
The Data and Aggregate Data sheets contain the raw data used to generate the summary cost tables.
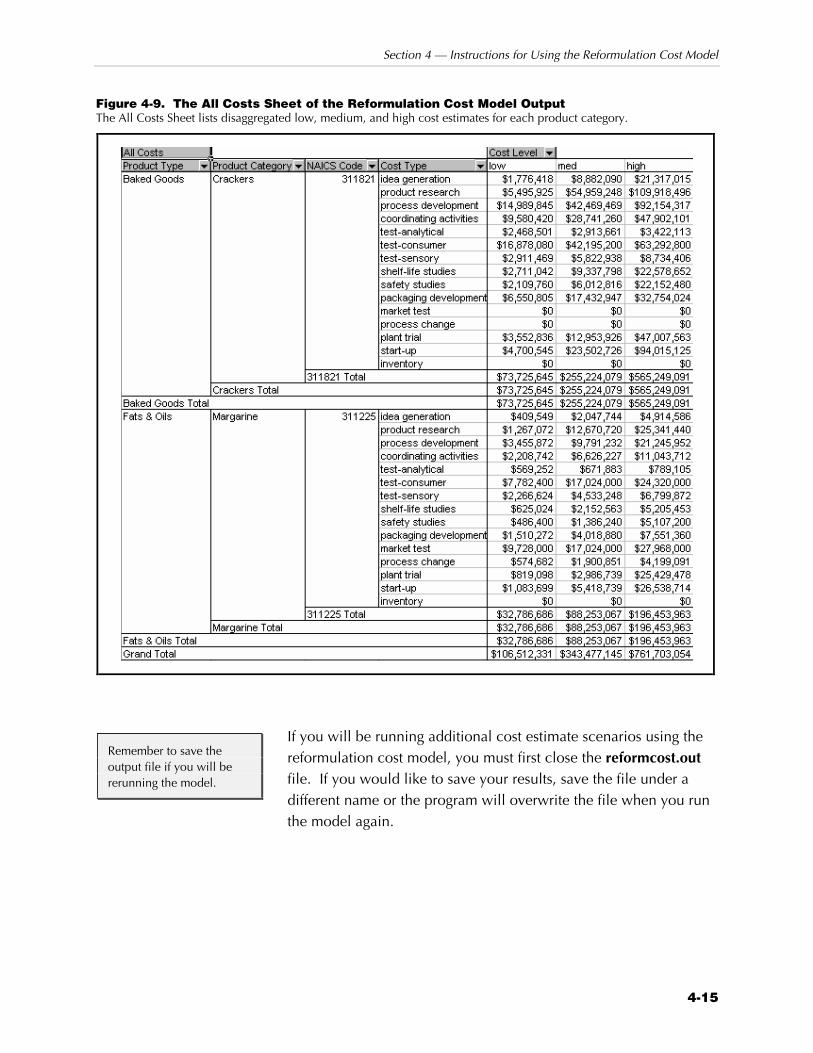
Section 4 — Instructions for Using the Reformulation Cost Model
4-15
Figure 4-9. The All Costs Sheet of the Reformulation Cost Model Output The All Costs Sheet lists disaggregated low, medium, and high cost estimates for each product category.
If you will be running additional cost estimate scenarios using the reformulation cost model, you must first close the reformcost.out file. If you would like to save your results, save the file under a different name or the program will overwrite the file when you run the model again.
Remember to save the output file if you will be rerunning the model.
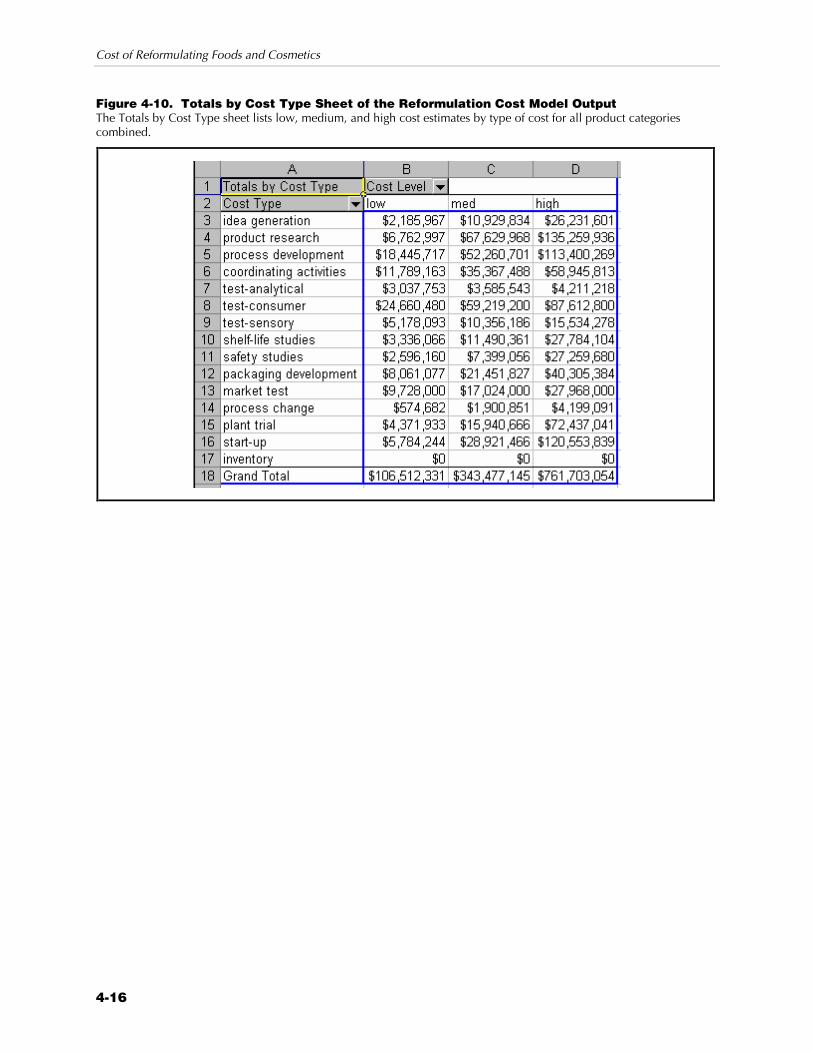
Cost of Reformulating Foods and Cosmetics
4-16
Figure 4-10. Totals by Cost Type Sheet of the Reformulation Cost Model Output The Totals by Cost Type sheet lists low, medium, and high cost estimates by type of cost for all product categories combined.
Appendix A: Products in the Reformulation Cost Model for Each NAICS Code

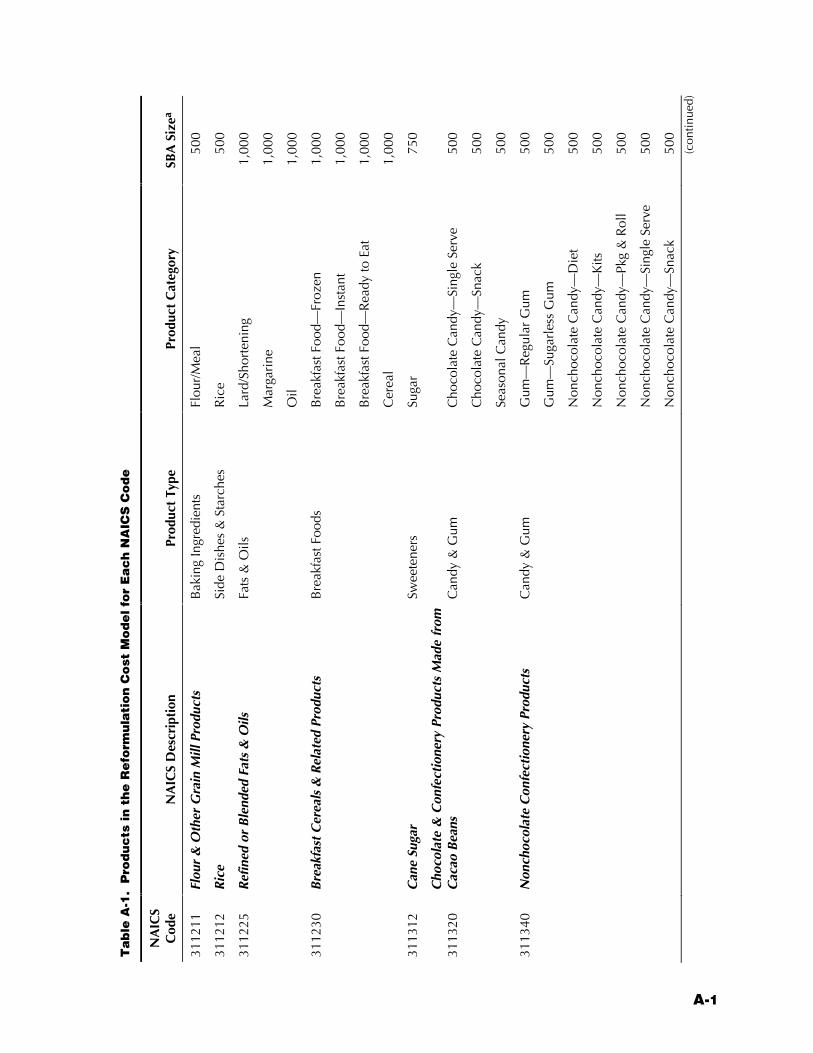
A-1
Ta
ble
A-1
. P
rod
uc
ts in
th
e R
efo
rmu
lati
on C
ost
Model fo
r E
ach N
AIC
S C
ode
NA
ICS
Cod
e N
AIC
S D
escr
ipti
on
Prod
uct
Type
Pr
oduc
t C
ateg
ory
SBA
Siz
ea
3112
11
Flou
r &
Oth
er G
rain
Mill
Pro
duct
s B
akin
g In
gred
ient
s Fl
our/
Mea
l 50
0
3112
12
Ric
e Si
de D
ishe
s &
Sta
rche
s R
ice
500
3112
25
Ref
ined
or
Ble
nded
Fat
s &
Oils
Fa
ts &
Oils
La
rd/S
hort
enin
g 1,
000
M
arga
rine
1,
000
O
il 1,
000
3112
30
Bre
akfa
st C
erea
ls &
Rel
ated
Pro
duct
s B
reak
fast
Foo
ds
Bre
akfa
st F
ood—
Froz
en
1,00
0
B
reak
fast
Foo
d—In
stan
t 1,
000
B
reak
fast
Foo
d—R
eady
to E
at
1,00
0
C
erea
l 1,
000
3113
12
Can
e Su
gar
Swee
tene
rs
Suga
r 75
0
3113
20
Cho
cola
te &
Con
fect
ione
ry P
rodu
cts
Mad
e fr
om
Cac
ao B
eans
C
andy
& G
um
Cho
cola
te C
andy
—Si
ngle
Ser
ve
500
C
hoco
late
Can
dy—
Snac
k 50
0
Se
ason
al C
andy
50
0
3113
40
Non
choc
olat
e C
onfe
ctio
nery
Pro
duct
s C
andy
& G
um
Gum
—R
egul
ar G
um
500
G
um—
Suga
rles
s G
um
500
N
onch
ocol
ate
Can
dy—
Die
t 50
0
N
onch
ocol
ate
Can
dy—
Kits
50
0
N
onch
ocol
ate
Can
dy—
Pkg
& R
oll
500
N
onch
ocol
ate
Can
dy—
Sing
le S
erve
50
0
N
onch
ocol
ate
Can
dy—
Snac
k 50
0 (c
ontin
ued)
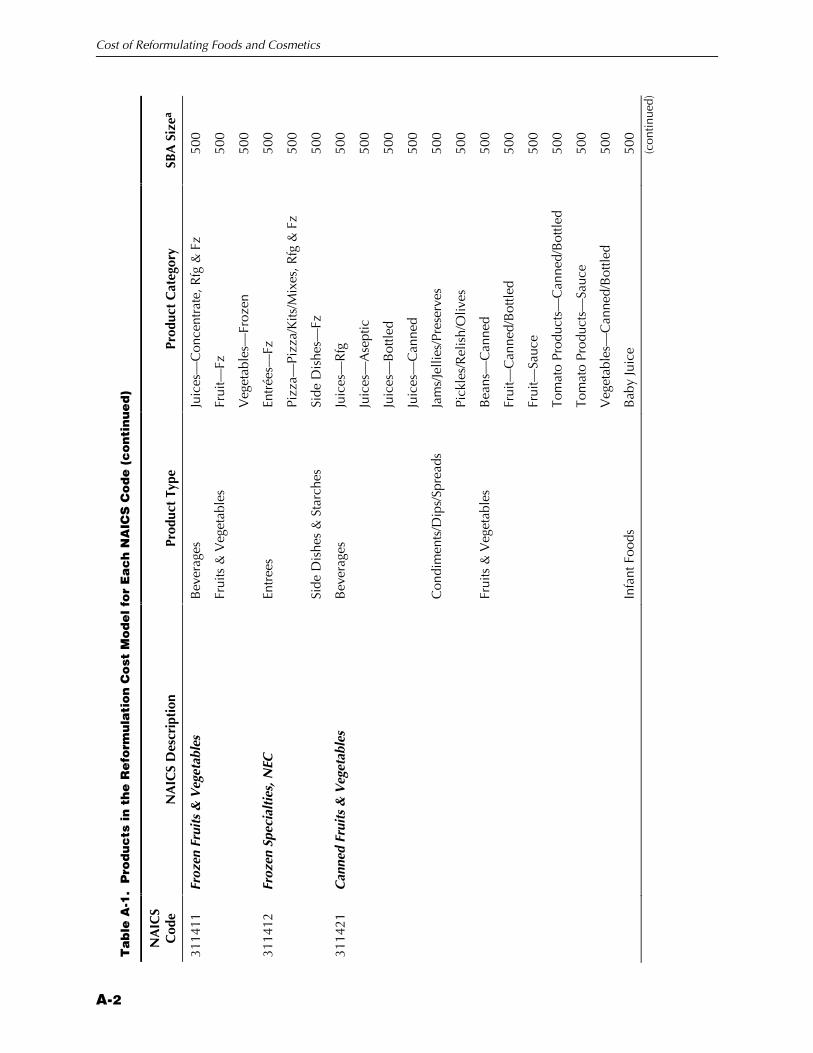
Cost of Reformulating Foods and Cosmetics
A-2
Ta
ble
A-1
. P
rod
uc
ts in
th
e R
efo
rmu
lati
on
Cost
Model fo
r E
ach N
AIC
S C
ode (
conti
nued)
NA
ICS
Cod
e N
AIC
S D
escr
ipti
on
Prod
uct
Type
Pr
oduc
t C
ateg
ory
SBA
Siz
ea
3114
11
Froz
en F
ruit
s &
Veg
etab
les
Bev
erag
es
Juic
es—
Con
cent
rate
, Rfg
& F
z 50
0
Frui
ts &
Veg
etab
les
Frui
t—Fz
50
0
V
eget
able
s—Fr
ozen
50
0
3114
12
Froz
en S
peci
alti
es, N
EC
Entr
ees
Entr
ées—
Fz
500
Pi
zza—
Pizz
a/K
its/M
ixes
, Rfg
& F
z 50
0
Side
Dis
hes
& S
tarc
hes
Side
Dis
hes—
Fz
500
3114
21
Can
ned
Frui
ts &
Veg
etab
les
Bev
erag
es
Juic
es—
Rfg
50
0
Ju
ices
—A
sept
ic
500
Ju
ices
—B
ottle
d 50
0
Ju
ices
—C
anne
d 50
0
Con
dim
ents
/Dip
s/Sp
read
s Ja
ms/
Jelli
es/P
rese
rves
50
0
Pi
ckle
s/R
elis
h/O
lives
50
0
Frui
ts &
Veg
etab
les
Bea
ns—
Can
ned
500
Fr
uit—
Can
ned/
Bot
tled
500
Fr
uit—
Sauc
e 50
0
To
mat
o Pr
oduc
ts—
Can
ned/
Bot
tled
500
To
mat
o Pr
oduc
ts—
Sauc
e 50
0
V
eget
able
s—C
anne
d/B
ottle
d 50
0
Infa
nt F
oods
B
aby
Juic
e 50
0 (c
ontin
ued)
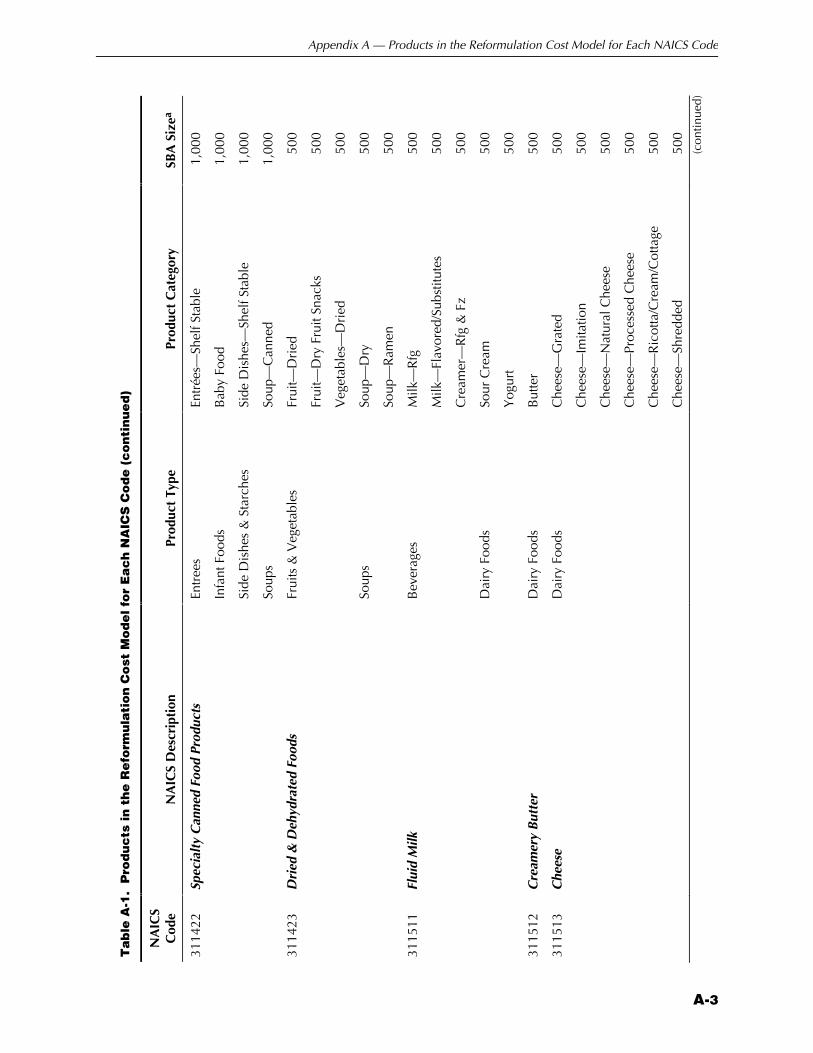
Appendix A — Products in the Reformulation Cost Model for Each NAICS Code
A-3
Ta
ble
A-1
. P
rod
uc
ts in
th
e R
efo
rmu
lati
on
Cost
Model fo
r E
ach N
AIC
S C
ode (
conti
nued)
NA
ICS
Cod
e N
AIC
S D
escr
ipti
on
Prod
uct
Type
Pr
oduc
t C
ateg
ory
SBA
Siz
ea
3114
22
Spec
ialt
y C
anne
d Fo
od P
rodu
cts
Entr
ees
Entr
ées—
Shel
f Sta
ble
1,00
0
Infa
nt F
oods
B
aby
Food
1,
000
Side
Dis
hes
& S
tarc
hes
Side
Dis
hes—
Shel
f Sta
ble
1,00
0
Soup
s So
up—
Can
ned
1,00
0
3114
23
Dri
ed &
Deh
ydra
ted
Food
s Fr
uits
& V
eget
able
s Fr
uit—
Dri
ed
500
Fr
uit—
Dry
Fru
it Sn
acks
50
0
V
eget
able
s—D
ried
50
0
Soup
s So
up—
Dry
50
0
So
up—
Ram
en
500
3115
11
Flui
d M
ilk
Bev
erag
es
Milk
—R
fg
500
M
ilk—
Flav
ored
/Sub
stitu
tes
500
C
ream
er—
Rfg
& F
z 50
0
Dai
ry F
oods
So
ur C
ream
50
0
Y
ogur
t 50
0
3115
12
Cre
amer
y B
utte
r D
airy
Foo
ds
But
ter
500
3115
13
Che
ese
Dai
ry F
oods
C
hees
e—G
rate
d
500
C
hees
e—Im
itatio
n 50
0
C
hees
e—N
atur
al C
hees
e 50
0
C
hees
e—Pr
oces
sed
Che
ese
500
C
hees
e—R
icot
ta/C
ream
/Cot
tage
50
0
C
hees
e—Sh
redd
ed
500
(con
tinue
d)
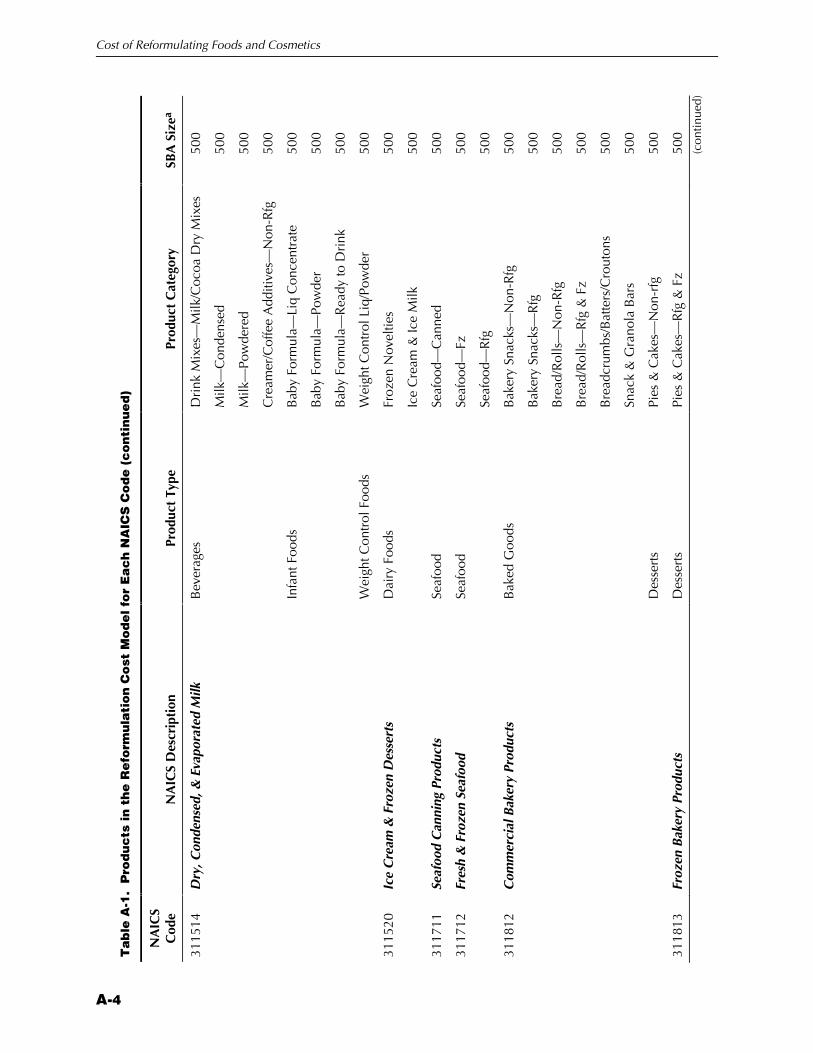
Cost of Reformulating Foods and Cosmetics
A-4
Ta
ble
A-1
. P
rod
uc
ts in
th
e R
efo
rmu
lati
on
Cost
Model fo
r E
ach N
AIC
S C
ode (
conti
nued)
NA
ICS
Cod
e N
AIC
S D
escr
ipti
on
Prod
uct
Type
Pr
oduc
t C
ateg
ory
SBA
Siz
ea
3115
14
Dry
, Con
dens
ed, &
Eva
pora
ted
Milk
B
ever
ages
D
rink
Mix
es—
Milk
/Coc
oa D
ry M
ixes
50
0
M
ilk—
Con
dens
ed
500
M
ilk—
Pow
dere
d 50
0
C
ream
er/C
offe
e A
dditi
ves—
Non
-Rfg
50
0
Infa
nt F
oods
B
aby
Form
ula—
Liq
Con
cent
rate
50
0
B
aby
Form
ula—
Pow
der
500
B
aby
Form
ula—
Rea
dy to
Dri
nk
500
Wei
ght C
ontr
ol F
oods
W
eigh
t Con
trol
Liq
/Pow
der
500
3115
20
Ice
Cre
am &
Fro
zen
Des
sert
s D
airy
Foo
ds
Froz
en N
ovel
ties
500
Ic
e C
ream
& Ic
e M
ilk
500
3117
11
Seaf
ood
Can
ning
Pro
duct
s Se
afoo
d Se
afoo
d—C
anne
d 50
0
3117
12
Fres
h &
Fro
zen
Seaf
ood
Seaf
ood
Seaf
ood—
Fz
500
Se
afoo
d—R
fg
500
3118
12
Com
mer
cial
Bak
ery
Prod
ucts
B
aked
Goo
ds
Bak
ery
Snac
ks—
Non
-Rfg
50
0
B
aker
y Sn
acks
—R
fg
500
B
read
/Rol
ls—
Non
-Rfg
50
0
B
read
/Rol
ls—
Rfg
& F
z 50
0
B
read
crum
bs/B
atte
rs/C
rout
ons
500
Sn
ack
& G
rano
la B
ars
500
Des
sert
s Pi
es &
Cak
es—
Non
-rfg
50
0
3118
13
Froz
en B
aker
y Pr
oduc
ts
Des
sert
s Pi
es &
Cak
es—
Rfg
& F
z 50
0 (c
ontin
ued)

Appendix A — Products in the Reformulation Cost Model for Each NAICS Code
A-5
Ta
ble
A-1
. P
rod
uc
ts in
th
e R
efo
rmu
lati
on
Cost
Model fo
r E
ach N
AIC
S C
ode (
conti
nued)
NA
ICS
Cod
e N
AIC
S D
escr
ipti
on
Prod
uct
Type
Pr
oduc
t C
ateg
ory
SBA
Siz
ea
3118
21
Coo
kies
& C
rack
ers
Bak
ed G
oods
C
ooki
es
750
C
rack
ers
750
3118
22
Flou
r M
ixes
& D
ough
Mad
e Fr
om P
urch
ased
Po
wde
r B
akin
g In
gred
ient
s B
akin
g M
ixes
50
0
D
ough
—R
fg &
Fz
500
Pi
zza—
Cru
st/D
ough
50
0
3118
23
Dry
Pas
ta M
anuf
actu
ring
Si
de D
ishe
s &
Sta
rche
s Pa
sta—
Dry
50
0
3119
11
Roa
sted
Nut
s or
See
ds &
Pea
nut
But
ter
Bak
ing
Ingr
edie
nts
Nut
s—B
akin
g N
uts
500
Con
dim
ents
/Dip
s/Sp
read
s Pe
anut
But
ter
500
Snac
k Fo
ods
Nut
s—Sn
ack
Nut
s 50
0
Se
eds—
Snac
k 50
0
3119
19
Oth
er S
nack
Foo
ds
Snac
k Fo
ods
Salty
Sna
cks—
Bag
ged
500
Sa
lty S
nack
s—O
ther
50
0
Sa
lty S
nack
s—U
npop
ped
Popc
orn
500
3119
20
Cof
fee
& T
ea P
rodu
cts
Bev
erag
es
Cof
fee—
Gro
und
500
C
offe
e—In
stan
t 50
0
C
offe
e—W
hole
50
0
Te
a—In
stan
t 50
0
Te
a—Lo
ose
500
(con
tinue
d)

Cost of Reformulating Foods and Cosmetics
A-6
Ta
ble
A-1
. P
rod
uc
ts in
th
e R
efo
rmu
lati
on
Cost
Model fo
r E
ach N
AIC
S C
ode (
conti
nued)
NA
ICS
Cod
e N
AIC
S D
escr
ipti
on
Prod
uct
Type
Pr
oduc
t C
ateg
ory
SBA
Siz
ea
3119
41
May
onna
ise,
Dre
ssin
gs, &
Oth
er P
repa
red
Sauc
es
Con
dim
ents
/Dip
s/Sp
read
s C
ondi
men
ts—
Non
-Rfg
50
0
C
ondi
men
ts—
Rfg
50
0
D
ips—
Shel
f Sta
ble
500
D
ips—
Rfg
& F
z 50
0
M
ayon
nais
e 50
0
Dre
ssin
gs &
Sau
ces
Gra
vy/S
auce
—C
anne
d/B
ottle
d 50
0
G
ravy
/Sau
ce—
Rfg
& F
z 50
0
Sa
lad
Dre
ssin
g—B
ottle
d, n
on-r
fg
500
Sa
lad
Dre
ssin
g—R
fg
500
V
ineg
ar
500
3119
42
Spic
es &
Ext
ract
s C
ondi
men
ts/D
ips/
Spre
ads
Dip
s—D
ry M
ixes
50
0
Sa
lt/Sa
lt Su
bstit
utes
50
0
Sp
ices
/Sea
soni
ngs
500
Dre
ssin
gs &
Sau
ces
Gra
vy/S
auce
—M
ixes
50
0
Sa
lad
Dre
ssin
g—D
ry M
ix
500
3119
91
Peri
shab
le P
repa
red
Food
Man
ufac
turi
ng
Entr
ees
Entr
ées—
Rfg
50
0
Lu
nche
s—R
fg
500
Frui
ts &
Veg
etab
les
Veg
etab
les—
Fres
h C
ut S
alad
50
0
Side
Dis
hes
& S
tarc
hes
Past
a—R
fg &
Fz
500
Si
de D
ishe
s—R
fg
500
(con
tinue
d)
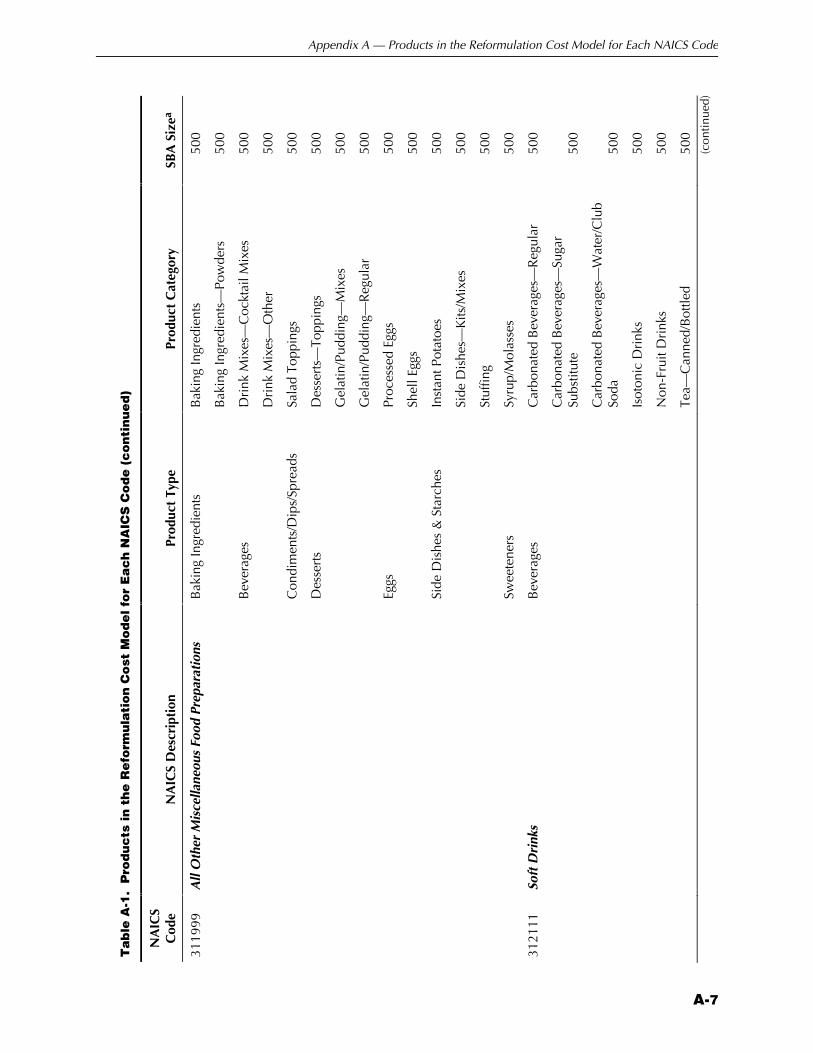
Appendix A — Products in the Reformulation Cost Model for Each NAICS Code
A-7
Ta
ble
A-1
. P
rod
uc
ts in
th
e R
efo
rmu
lati
on
Cost
Model fo
r E
ach N
AIC
S C
ode (
conti
nued)
NA
ICS
Cod
e N
AIC
S D
escr
ipti
on
Prod
uct
Type
Pr
oduc
t C
ateg
ory
SBA
Siz
ea
3119
99
All
Oth
er M
isce
llane
ous
Food
Pre
para
tion
s B
akin
g In
gred
ient
s B
akin
g In
gred
ient
s 50
0
B
akin
g In
gred
ient
s—Po
wde
rs
500
Bev
erag
es
Dri
nk M
ixes
—C
ockt
ail M
ixes
50
0
D
rink
Mix
es—
Oth
er
500
Con
dim
ents
/Dip
s/Sp
read
s Sa
lad
Topp
ings
50
0
Des
sert
s D
esse
rts—
Topp
ings
50
0
G
elat
in/P
uddi
ng—
Mix
es
500
G
elat
in/P
uddi
ng—
Reg
ular
50
0
Eggs
Pr
oces
sed
Eggs
50
0
Sh
ell E
ggs
500
Side
Dis
hes
& S
tarc
hes
Inst
ant P
otat
oes
500
Si
de D
ishe
s—K
its/M
ixes
50
0
St
uffin
g 50
0
Swee
tene
rs
Syru
p/M
olas
ses
500
3121
11
Soft
Dri
nks
Bev
erag
es
Car
bona
ted
Bev
erag
es—
Reg
ular
50
0
C
arbo
nate
d B
ever
ages
—Su
gar
Subs
titut
e 50
0
C
arbo
nate
d B
ever
ages
—W
ater
/Clu
b So
da
500
Is
oton
ic D
rink
s 50
0
N
on-F
ruit
Dri
nks
500
Te
a—C
anne
d/B
ottle
d 50
0 (c
ontin
ued)
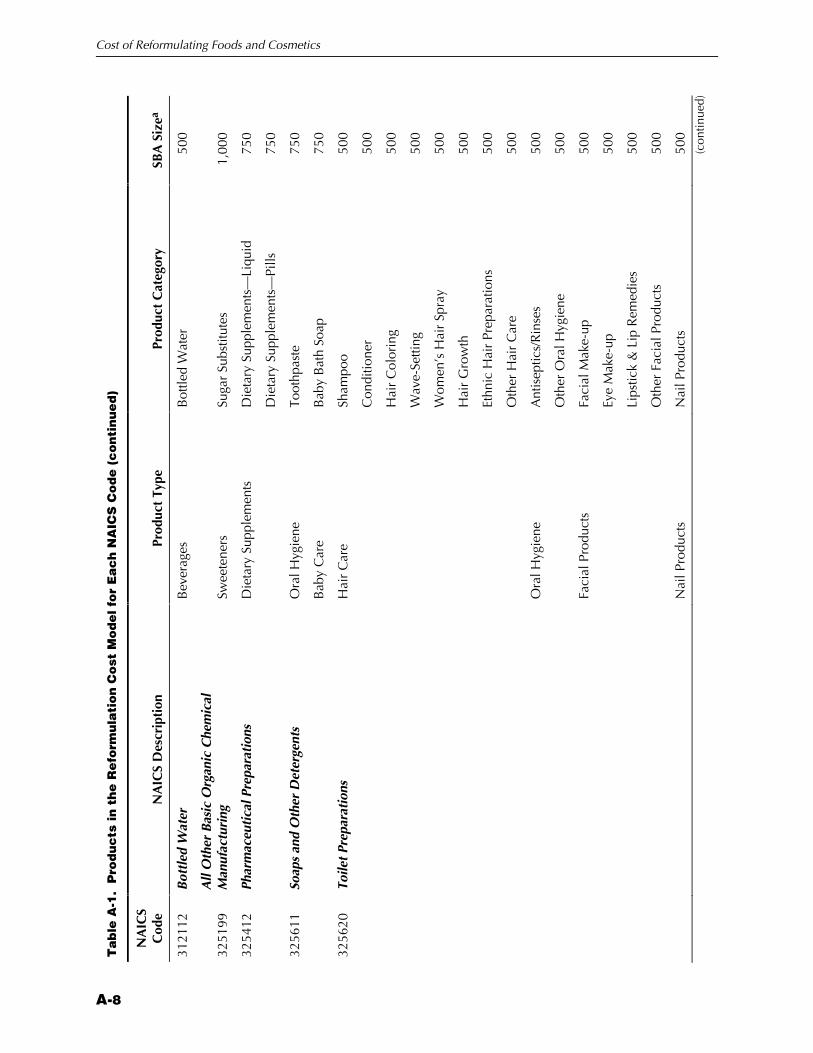
Cost of Reformulating Foods and Cosmetics
A-8
Ta
ble
A-1
. P
rod
uc
ts in
th
e R
efo
rmu
lati
on
Cost
Model fo
r E
ach N
AIC
S C
ode (
conti
nued)
NA
ICS
Cod
e N
AIC
S D
escr
ipti
on
Prod
uct
Type
Pr
oduc
t C
ateg
ory
SBA
Siz
ea
3121
12
Bot
tled
Wat
er
Bev
erag
es
Bot
tled
Wat
er
500
3251
99
All
Oth
er B
asic
Org
anic
Che
mic
al
Man
ufac
turi
ng
Swee
tene
rs
Suga
r Su
bstit
utes
1,
000
3254
12
Phar
mac
euti
cal P
repa
rati
ons
Die
tary
Sup
plem
ents
D
ieta
ry S
uppl
emen
ts—
Liqu
id
750
D
ieta
ry S
uppl
emen
ts—
Pills
75
0
3256
11
Soap
s an
d O
ther
Det
erge
nts
Ora
l Hyg
iene
To
othp
aste
75
0
Bab
y C
are
Bab
y B
ath
Soap
75
0
3256
20
Toile
t Pr
epar
atio
ns
Hai
r C
are
Sham
poo
500
C
ondi
tione
r 50
0
H
air
Col
orin
g 50
0
W
ave-
Setti
ng
500
W
omen
’s H
air
Spra
y 50
0
H
air
Gro
wth
50
0
Et
hnic
Hai
r Pr
epar
atio
ns
500
O
ther
Hai
r C
are
500
Ora
l Hyg
iene
A
ntis
eptic
s/R
inse
s 50
0
O
ther
Ora
l Hyg
iene
50
0
Faci
al P
rodu
cts
Faci
al M
ake-
up
500
Ey
e M
ake-
up
500
Li
pstic
k &
Lip
Rem
edie
s 50
0
O
ther
Fac
ial P
rodu
cts
500
Nai
l Pro
duct
s N
ail P
rodu
cts
500
(con
tinue
d)
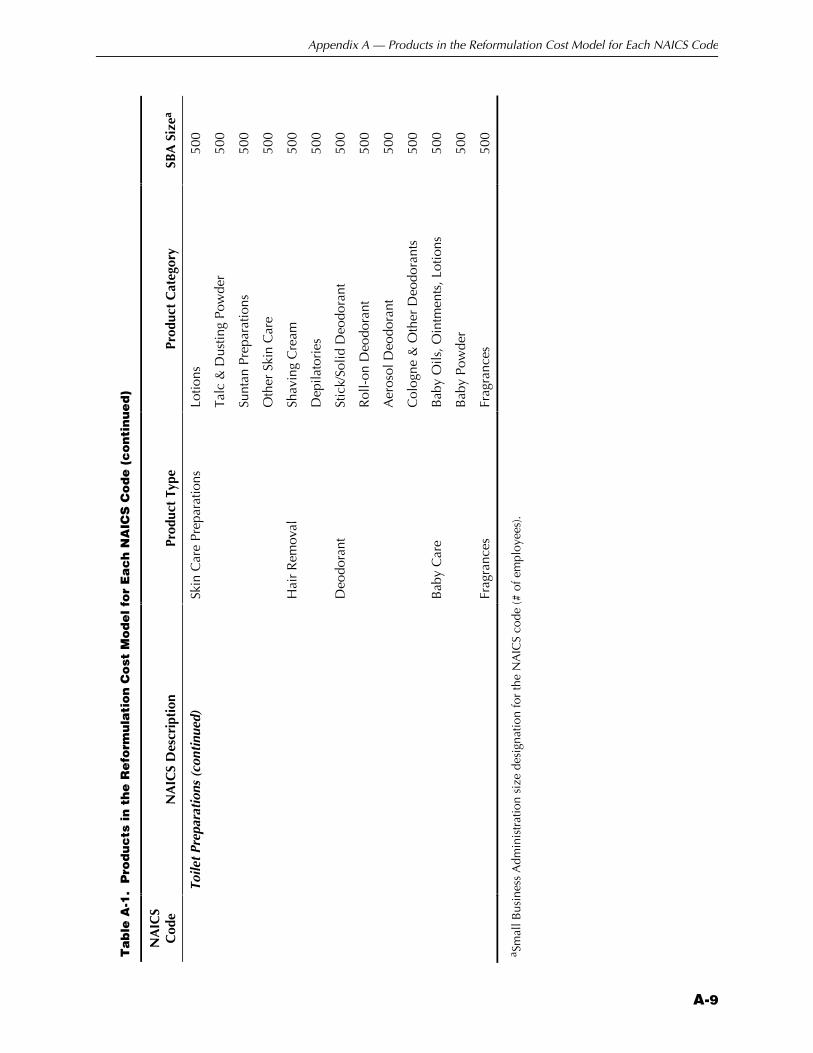
Appendix A — Products in the Reformulation Cost Model for Each NAICS Code
A-9
Ta
ble
A-1
. P
rod
uc
ts in
th
e R
efo
rmu
lati
on
Cost
Model fo
r E
ach N
AIC
S C
ode (
conti
nued)
NA
ICS
Cod
e N
AIC
S D
escr
ipti
on
Prod
uct
Type
Pr
oduc
t C
ateg
ory
SBA
Siz
ea
To
ilet
Prep
arat
ions
(co
ntin
ued)
Sk
in C
are
Prep
arat
ions
Lo
tions
50
0
Ta
lc &
Dus
ting
Pow
der
500
Su
ntan
Pre
para
tions
50
0
O
ther
Ski
n C
are
500
Hai
r R
emov
al
Shav
ing
Cre
am
500
D
epila
tori
es
500
Deo
dora
nt
Stic
k/So
lid D
eodo
rant
50
0
R
oll-
on D
eodo
rant
50
0
A
eros
ol D
eodo
rant
50
0
C
olog
ne &
Oth
er D
eodo
rant
s 50
0
Bab
y C
are
Bab
y O
ils, O
intm
ents
, Lot
ions
50
0
B
aby
Pow
der
500
Frag
ranc
es
Frag
ranc
es
500
a Sm
all B
usin
ess
Adm
inis
trat
ion
size
des
igna
tion
for
the
NA
ICS
code
(# o
f em
ploy
ees)
.
Appendix B: Stata Data Sets and Programming Code

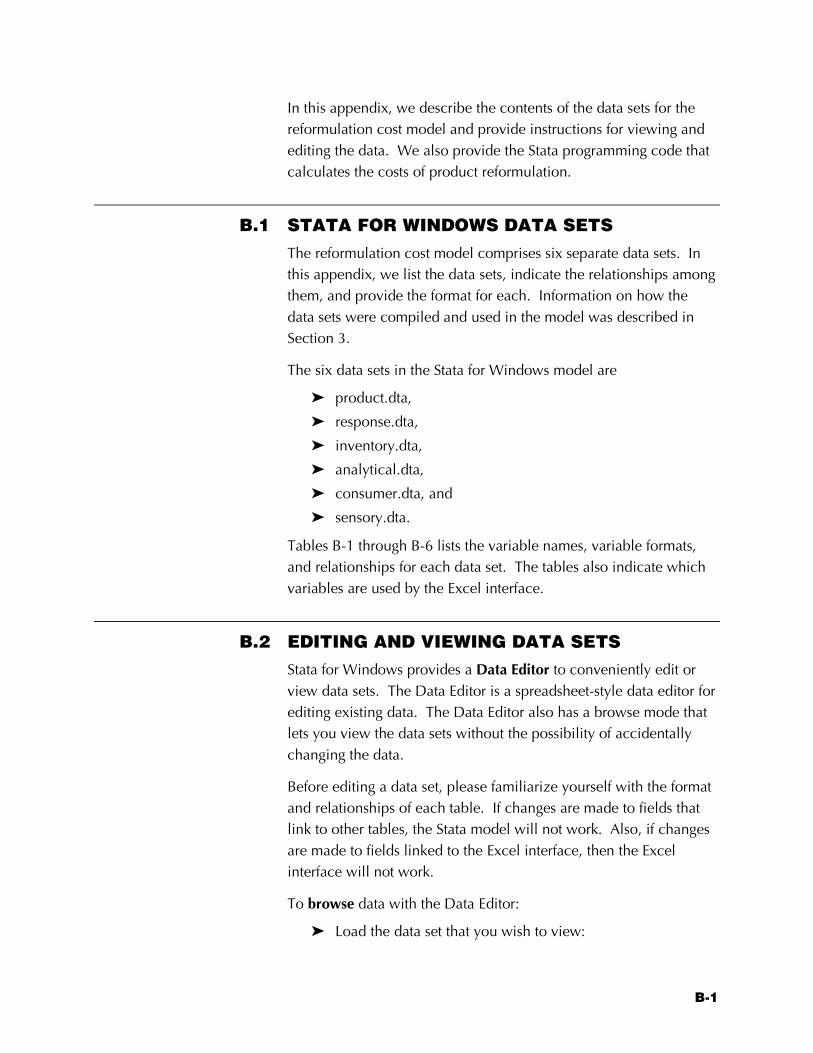
B-1
In this appendix, we describe the contents of the data sets for the reformulation cost model and provide instructions for viewing and editing the data. We also provide the Stata programming code that calculates the costs of product reformulation.
B.1 STATA FOR WINDOWS DATA SETS The reformulation cost model comprises six separate data sets. In this appendix, we list the data sets, indicate the relationships among them, and provide the format for each. Information on how the data sets were compiled and used in the model was described in Section 3.
The six data sets in the Stata for Windows model are
Z product.dta,
Z response.dta,
Z inventory.dta,
Z analytical.dta,
Z consumer.dta, and
Z sensory.dta.
Tables B-1 through B-6 lists the variable names, variable formats, and relationships for each data set. The tables also indicate which variables are used by the Excel interface.
B.2 EDITING AND VIEWING DATA SETS Stata for Windows provides a Data Editor to conveniently edit or view data sets. The Data Editor is a spreadsheet-style data editor for editing existing data. The Data Editor also has a browse mode that lets you view the data sets without the possibility of accidentally changing the data.
Before editing a data set, please familiarize yourself with the format and relationships of each table. If changes are made to fields that link to other tables, the Stata model will not work. Also, if changes are made to fields linked to the Excel interface, then the Excel interface will not work.
To browse data with the Data Editor:
Z Load the data set that you wish to view:

Cost of Reformulating Foods and Cosmetics
B-2
X Pull down File and choose Open. Then select the data set by double-clicking on the filename.
Z Click on the Data Browser icon or type browse in the Command Window.
To edit data with the Data Editor:
Z Load the data set that you wish to edit:
X Pull down File and choose Open. Then select the data set by double-clicking on the filename.
Z Click on the Data Editor icon or type edit in the Command Window.
Z Click on the cell that you would like to change.
Z Type the new value into the cell, then press Tab or Enter.
Z When you exit the editor, a dialog box will ask you to confirm your changes.
X To permanently save changes to the data set, click the Save button or pull down File and choose Save.
Please note that the changes are not permanent unless you save the file.
B.3 STATA PROGRAMMING CODE The programming code for calculating the costs of reformulation changes is provided in Exhibit B-1.
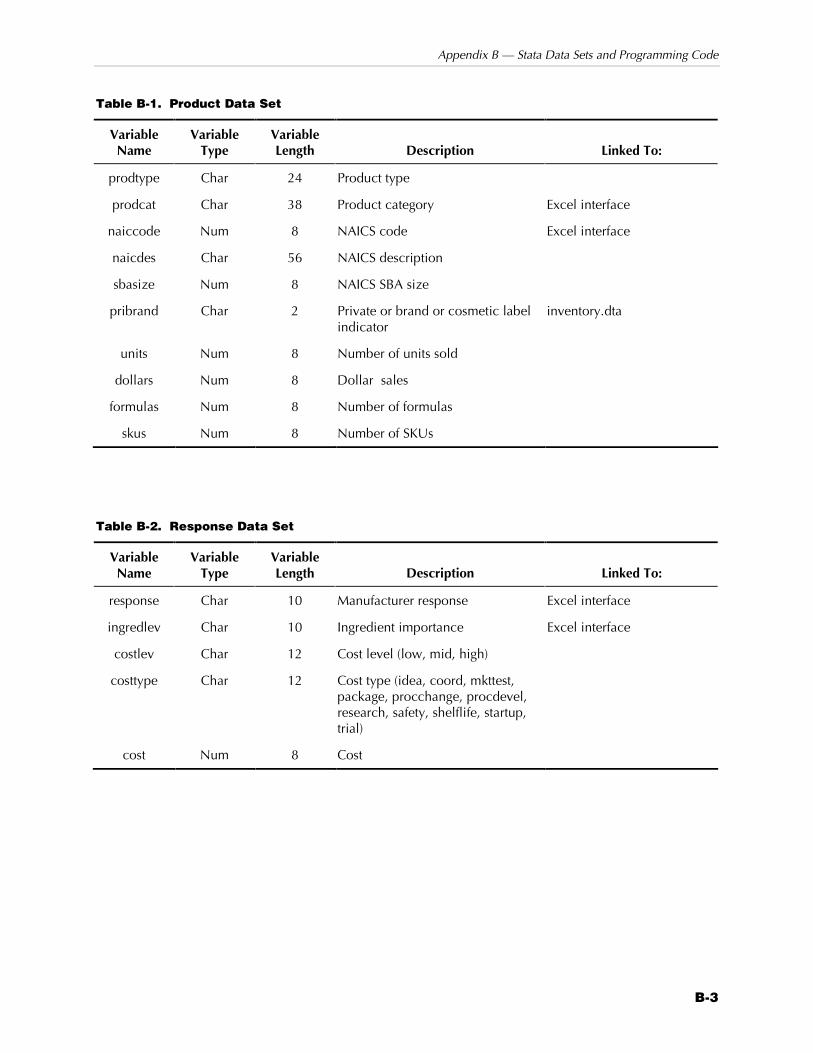
Appendix B — Stata Data Sets and Programming Code
B-3
Table B-1. Product Data Set
Variable Name
Variable Type
Variable Length Description Linked To:
prodtype Char 24 Product type
prodcat Char 38 Product category Excel interface
naiccode Num 8 NAICS code Excel interface
naicdes Char 56 NAICS description
sbasize Num 8 NAICS SBA size
pribrand Char 2 Private or brand or cosmetic label indicator
inventory.dta
units Num 8 Number of units sold
dollars Num 8 Dollar sales
formulas Num 8 Number of formulas
skus Num 8 Number of SKUs
Table B-2. Response Data Set
Variable Name
Variable Type
Variable Length Description Linked To:
response Char 10 Manufacturer response Excel interface
ingredlev Char 10 Ingredient importance Excel interface
costlev Char 12 Cost level (low, mid, high)
costtype Char 12 Cost type (idea, coord, mkttest, package, procchange, procdevel, research, safety, shelflife, startup, trial)
cost Num 8 Cost

Cost of Reformulating Foods and Cosmetics
B-4
Table B-3. Inventory Data Set
Variable Name
Variable Type
Variable Length Description Linked To:
costtype Char 12 Cost type (inventory)
pribrand Char 12 Private or brand or cosmetic label indicator
product.dta
compperd Char 10 Compliance period Excel interface
amtinv Num 8 Percent remaining inventory
Table B-4. Analytical Data Set
Variable Name
Variable Type
Variable Length Description Linked To:
analtest Char 36 Analytical test Excel interface
costtype Char 10 Cost type (analytical) product.dta
costlev Char 10 Cost level (low, mid, high)
cost Num 8 Cost
Table B-5. Consumer Data Set
Variable Name
Variable Type
Variable Length Description Linked To:
consumtest Char 22 Consumer test Excel interface
costtype Char 12 Cost type (consumer) product.dta
costlev Char 12 Cost level (low, mid, high)
cost Num 8 Cost
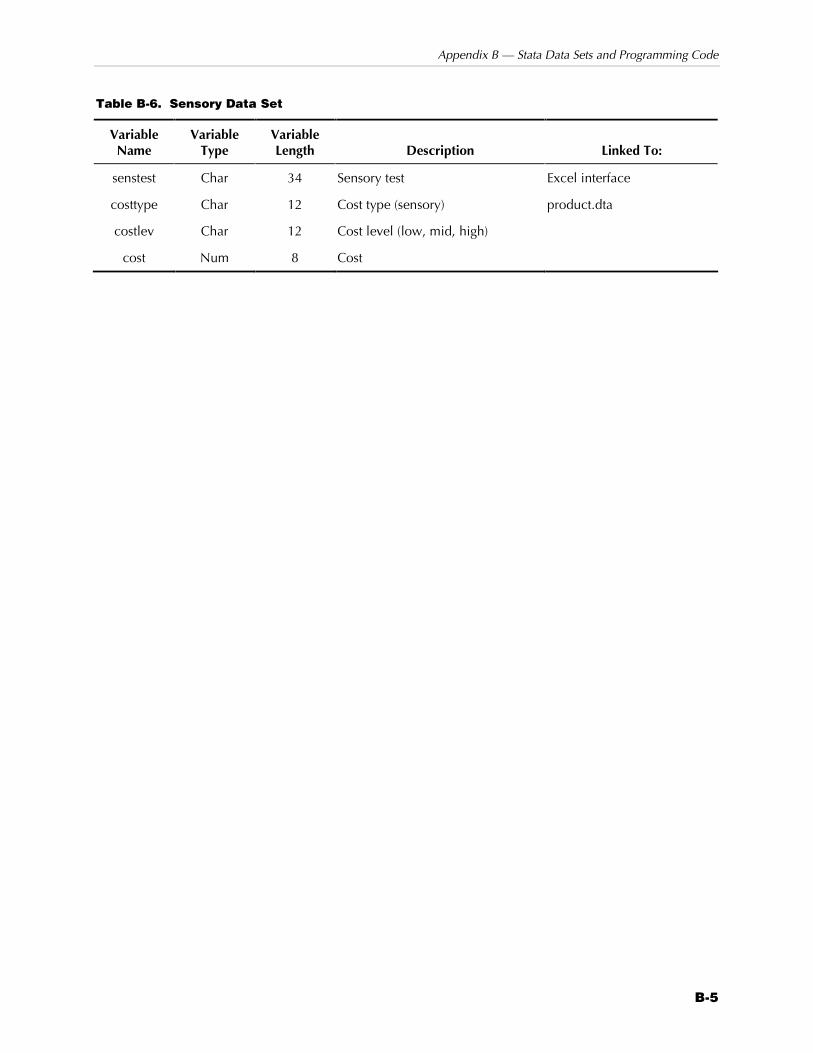
Appendix B — Stata Data Sets and Programming Code
B-5
Table B-6. Sensory Data Set
Variable Name
Variable Type
Variable Length Description Linked To:
senstest Char 34 Sensory test Excel interface
costtype Char 12 Cost type (sensory) product.dta
costlev Char 12 Cost level (low, mid, high)
cost Num 8 Cost
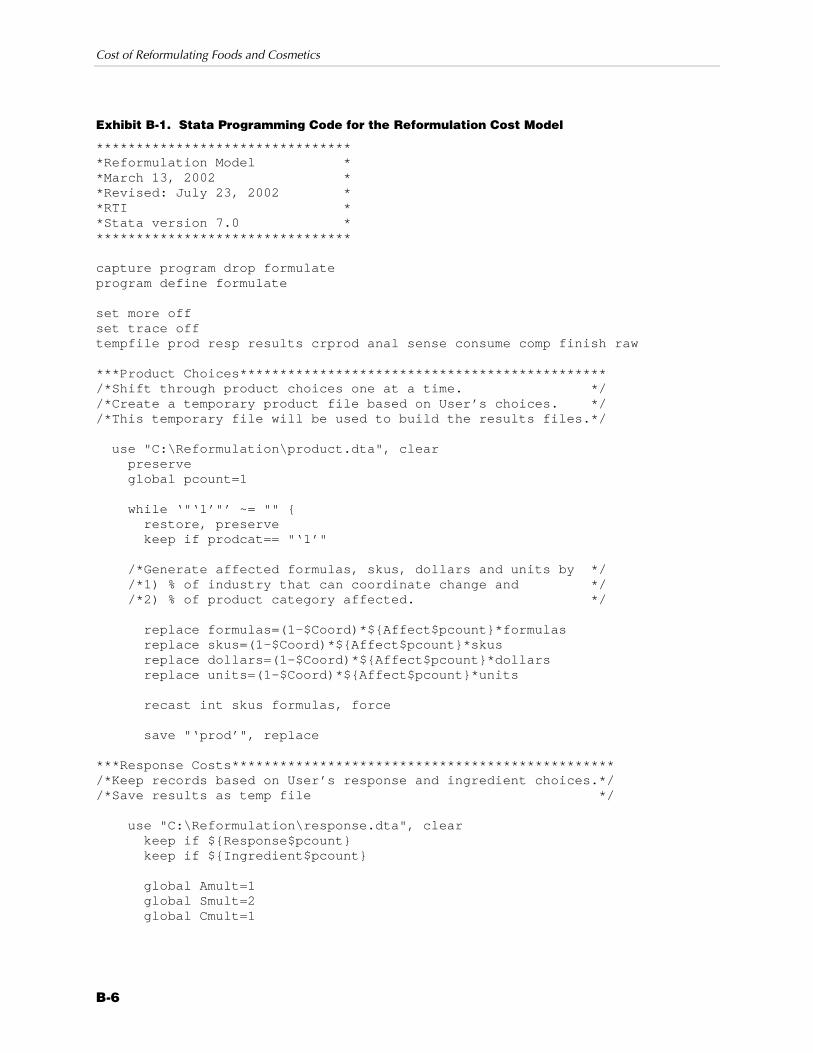
Cost of Reformulating Foods and Cosmetics
B-6
Exhibit B-1. Stata Programming Code for the Reformulation Cost Model
******************************** *Reformulation Model * *March 13, 2002 * *Revised: July 23, 2002 * *RTI * *Stata version 7.0 * ******************************** capture program drop formulate program define formulate set more off set trace off tempfile prod resp results crprod anal sense consume comp finish raw ***Product Choices********************************************** /*Shift through product choices one at a time. */ /*Create a temporary product file based on User’s choices. */ /*This temporary file will be used to build the results files.*/ use "C:\Reformulation\product.dta", clear preserve global pcount=1 while ‘"‘1’"’ ~= "" { restore, preserve keep if prodcat== "‘1’" /*Generate affected formulas, skus, dollars and units by */ /*1) % of industry that can coordinate change and */ /*2) % of product category affected. */ replace formulas=(1-$Coord)*${Affect$pcount}*formulas replace skus=(1-$Coord)*${Affect$pcount}*skus replace dollars=(1-$Coord)*${Affect$pcount}*dollars replace units=(1-$Coord)*${Affect$pcount}*units recast int skus formulas, force save "‘prod’", replace ***Response Costs************************************************ /*Keep records based on User’s response and ingredient choices.*/ /*Save results as temp file */ use "C:\Reformulation\response.dta", clear keep if ${Response$pcount} keep if ${Ingredient$pcount} global Amult=1 global Smult=2 global Cmult=1
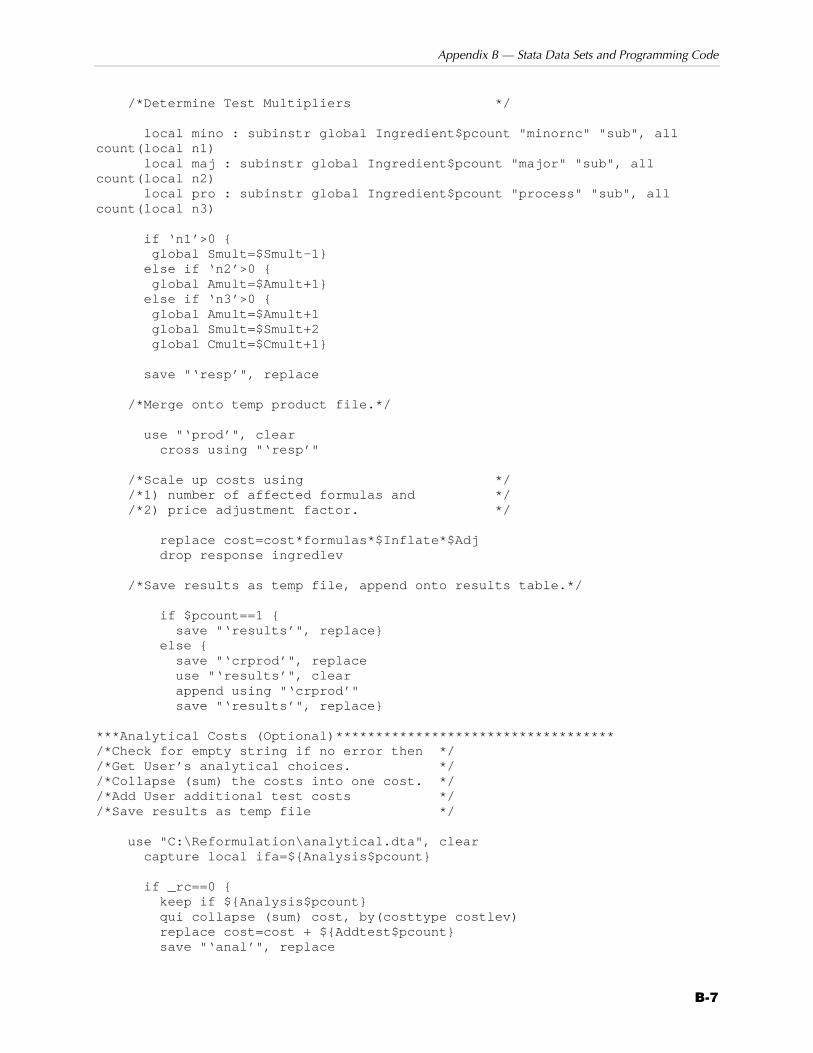
Appendix B — Stata Data Sets and Programming Code
B-7
/*Determine Test Multipliers */ local mino : subinstr global Ingredient$pcount "minornc" "sub", all count(local n1) local maj : subinstr global Ingredient$pcount "major" "sub", all count(local n2) local pro : subinstr global Ingredient$pcount "process" "sub", all count(local n3) if ‘n1’>0 { global Smult=$Smult-1} else if ‘n2’>0 { global Amult=$Amult+1} else if ‘n3’>0 { global Amult=$Amult+1 global Smult=$Smult+2 global Cmult=$Cmult+1} save "‘resp’", replace /*Merge onto temp product file.*/ use "‘prod’", clear cross using "‘resp’" /*Scale up costs using */ /*1) number of affected formulas and */ /*2) price adjustment factor. */ replace cost=cost*formulas*$Inflate*$Adj drop response ingredlev /*Save results as temp file, append onto results table.*/ if $pcount==1 { save "‘results’", replace} else { save "‘crprod’", replace use "‘results’", clear append using "‘crprod’" save "‘results’", replace} ***Analytical Costs (Optional)*********************************** /*Check for empty string if no error then */ /*Get User’s analytical choices. */ /*Collapse (sum) the costs into one cost. */ /*Add User additional test costs */ /*Save results as temp file */ use "C:\Reformulation\analytical.dta", clear capture local ifa=${Analysis$pcount} if _rc==0 { keep if ${Analysis$pcount} qui collapse (sum) cost, by(costtype costlev) replace cost=cost + ${Addtest$pcount} save "‘anal’", replace

Cost of Reformulating Foods and Cosmetics
B-8
/*Merge onto temp product file.*/ use "‘prod’", clear cross using "‘anal’" /*Scale up costs same as Response Costs plus */ /*5) 2 tests per product, */ /*6) multiplier based on ingredient level, and */ /*7) additional shipping and handling costs (41.03).*/ replace cost=formulas*$Inflate*$Amult*((cost*2)+41.03) /*Save results as temp file, append onto results table.*/ save "‘anal’", replace use "‘results’", clear append using "‘anal’" save "‘results’", replace} ***Sensory Costs (Optional)************************************** /*Check for empty string if no error then */ /*Get User’s sensory test choices. */ /*Collapse (sum) the costs into one cost. */ /*Save results as temp file */ use "C:\Reformulation\sensory.dta", clear capture local ifs=${Sensory$pcount} if _rc==0 { keep if ${Sensory$pcount} qui collapse (sum) cost, by(costtype costlev) save "‘sense’", replace /*Merge onto temp product file.*/ use "‘prod’", clear cross using "‘sense’" /*Scale up costs same as Response Costs plus */ /*5) multiplier based on ingredient level. */ replace cost=cost*formulas*$Inflate*$Smult /*Save results as temp file, append onto results table.*/ save "‘sense’", replace use "‘results’", clear append using "‘sense’" save "‘results’", replace} ***Consumer Costs (Optional)************************************* /*Check for empty string if no error then */ /*Get User’s consumer test choices. */ /*Collapse (sum) the costs into one cost. */ /*Save results as temp file */
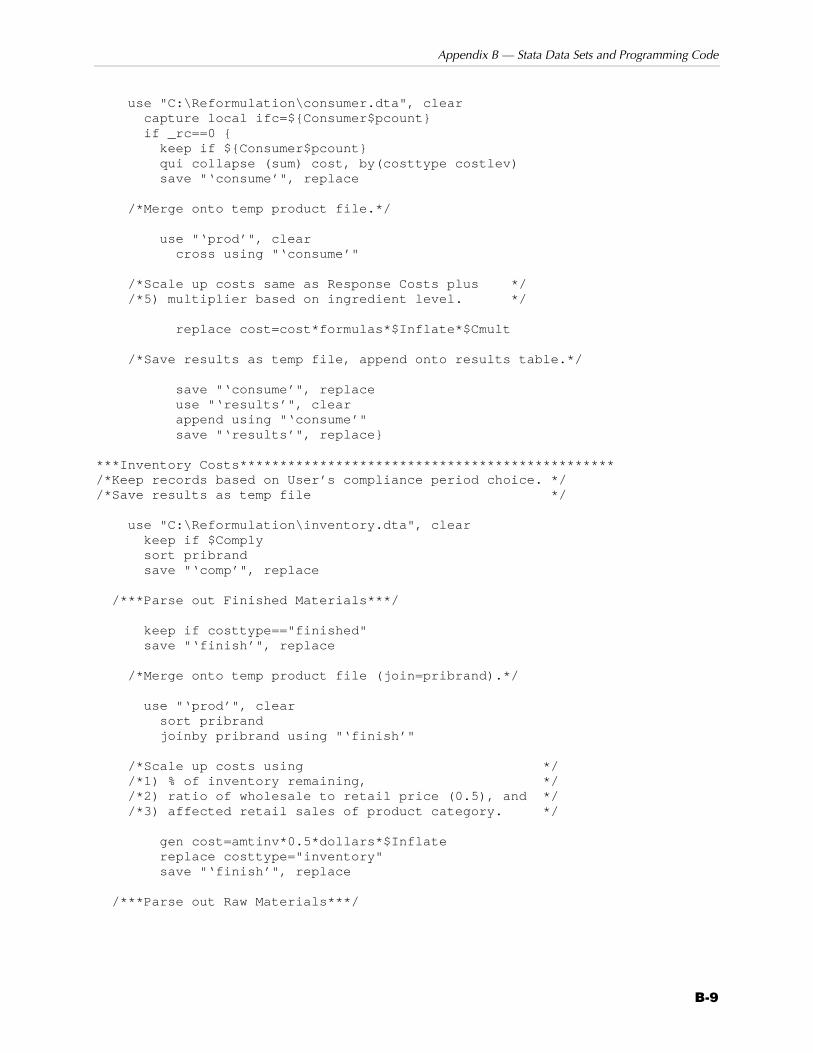
Appendix B — Stata Data Sets and Programming Code
B-9
use "C:\Reformulation\consumer.dta", clear capture local ifc=${Consumer$pcount} if _rc==0 { keep if ${Consumer$pcount} qui collapse (sum) cost, by(costtype costlev) save "‘consume’", replace /*Merge onto temp product file.*/ use "‘prod’", clear cross using "‘consume’" /*Scale up costs same as Response Costs plus */ /*5) multiplier based on ingredient level. */ replace cost=cost*formulas*$Inflate*$Cmult /*Save results as temp file, append onto results table.*/ save "‘consume’", replace use "‘results’", clear append using "‘consume’" save "‘results’", replace} ***Inventory Costs*********************************************** /*Keep records based on User’s compliance period choice. */ /*Save results as temp file */ use "C:\Reformulation\inventory.dta", clear keep if $Comply sort pribrand save "‘comp’", replace /***Parse out Finished Materials***/ keep if costtype=="finished" save "‘finish’", replace /*Merge onto temp product file (join=pribrand).*/ use "‘prod’", clear sort pribrand joinby pribrand using "‘finish’" /*Scale up costs using */ /*1) % of inventory remaining, */ /*2) ratio of wholesale to retail price (0.5), and */ /*3) affected retail sales of product category. */ gen cost=amtinv*0.5*dollars*$Inflate replace costtype="inventory" save "‘finish’", replace /***Parse out Raw Materials***/
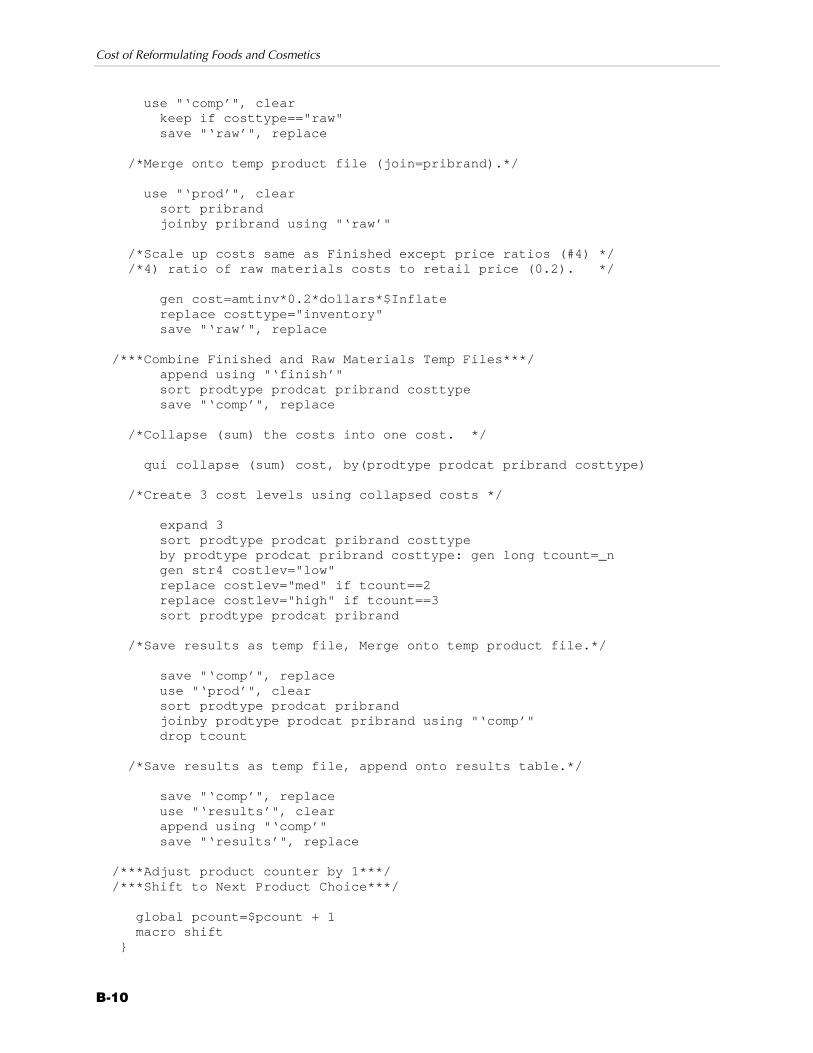
Cost of Reformulating Foods and Cosmetics
B-10
use "‘comp’", clear keep if costtype=="raw" save "‘raw’", replace /*Merge onto temp product file (join=pribrand).*/ use "‘prod’", clear sort pribrand joinby pribrand using "‘raw’" /*Scale up costs same as Finished except price ratios (#4) */ /*4) ratio of raw materials costs to retail price (0.2). */ gen cost=amtinv*0.2*dollars*$Inflate replace costtype="inventory" save "‘raw’", replace /***Combine Finished and Raw Materials Temp Files***/ append using "‘finish’" sort prodtype prodcat pribrand costtype save "‘comp’", replace /*Collapse (sum) the costs into one cost. */ qui collapse (sum) cost, by(prodtype prodcat pribrand costtype) /*Create 3 cost levels using collapsed costs */ expand 3 sort prodtype prodcat pribrand costtype by prodtype prodcat pribrand costtype: gen long tcount=_n gen str4 costlev="low" replace costlev="med" if tcount==2 replace costlev="high" if tcount==3 sort prodtype prodcat pribrand /*Save results as temp file, Merge onto temp product file.*/ save "‘comp’", replace use "‘prod’", clear sort prodtype prodcat pribrand joinby prodtype prodcat pribrand using "‘comp’" drop tcount /*Save results as temp file, append onto results table.*/ save "‘comp’", replace use "‘results’", clear append using "‘comp’" save "‘results’", replace /***Adjust product counter by 1***/ /***Shift to Next Product Choice***/ global pcount=$pcount + 1 macro shift }
Appendix B — Stata Data Sets and Programming Code
B-11
format cost %20.0g sort prodtype prodcat pribrand costtype costlev save "C:\Reformulation\reformcost.dta", replace outsheet using "C:\Reformulation\reformcost.out", replace /***Create Aggregate Cost File***/ use "C:\Reformulation\reformcost.dta", clear sort prodtype prodcat naiccode naicdes pribrand units dollars formulas skus costlev collapse (sum) cost, by(prodtype prodcat naiccode naicdes pribrand units dollars formulas skus costlev) reshape wide cost, i(prodtype prodcat pribrand) j(costlev) string save "C:\Reformulation\reformcostag.dta", replace outsheet using "C:\Reformulation\reformcostag.out", replace end


![Reformulating SU N Yang-Mills theory - arXiv · 2018-11-05 · arXiv:0803.0176v2 [hep-th] 14 Jul 2008 Chiba Univ. Preprint CHIBA-EP-167 July 2008 Reformulating SU(N) Yang-Mills theory](https://img.dokumen.tips/doc/110x75/5ecedb790e2bd5210370c9d6/reformulating-su-n-yang-mills-theory-arxiv-2018-11-05-arxiv08030176v2-hep-th.jpg)