Embed Size (px)
Citation preview

EUR 23703 EN - 2008
COST OF CAPITAL INDICATOR FOR EU MEMBER STATES - METHODOLOGY
David Guilleme Moreno (Joint Research Centre)

2
The Institute for the Protection and Security of the Citizen provides research-based, systems-oriented support to EU policies so as to protect the citizen against economic and technological risk. The Institute maintains and develops its expertise and networks in information, communication, space and engineering technologies in support of its mission. The strong cross-fertilisation between its nuclear and non-nuclear activities strengthens the expertise it can bring to the benefit of customers in both domains. European Commission Joint Research Centre Institute for the Protection and Security of the Citizen Contact information Address: Via E. Fermi, 2749, TP361, I-21027, Ispra (VA),Italy E-mail: [email protected] Tel.: (+39) 0332 783099 Fax: (+39) 0332 785733 http://ipsc.jrc.ec.europa.eu/ http://www.jrc.ec.europa.eu/ Legal Notice Neither the European Commission nor any person acting on behalf of the Commission is responsible for the use which might be made of this publication.
Europe Direct is a service to help you find answers to your questions about the European Union
Freephone number (*):
00 800 6 7 8 9 10 11
(*) Certain mobile telephone operators do not allow access to 00 800 numbers or these calls may be billed.
A great deal of additional information on the European Union is available on the Internet. It can be accessed through the Europa server http://europa.eu/ JRC 49398 EUR 23703 EN ISSN 1018-5593 Luxembourg: Office for Official Publications of the European Communities © European Communities, 2008 Reproduction is authorised provided the source is acknowledged Printed in Italy

3
Table of Contents
INTRODUCTION .........................................................................................................................5
SECTION 1 – BACKGROUND AND SCOPE OF THE PROJECT .......................................6
SECTION 2 – CONCEPT OF COST OF CAPITAL .................................................................7
SECTION 3 – METHODOLOGY OVERVIEW........................................................................8
SECTION 4 – INDICATOR ON COST OF LOANS (KLO).....................................................10
4.1 – Recommended Data Sources .....................................................................................10
4.2 – Recommended Indicator ............................................................................................11
SECTION 5 – INDICATOR ON COST OF DEBT SECURITIES (KDS)...............................15
5.1 – Recommended Indicator ............................................................................................15
5.2 – Sources of data ............................................................................................................17
5.3 – Observations................................................................................................................17
SECTION 6 – INDICATOR ON COST OF EQUITIES LISTED (KEL)................................18
6.1 – Methodological choices...............................................................................................18
6.2 – Recommendations.......................................................................................................19
SECTION 7 – WEIGHTING OF FINANCING SOURCES (WSOURCE - I) ..............................21
7.1 – Recommended data sources.......................................................................................21
7.2 – Calculation method.....................................................................................................21
7.3 – Data limitations / Comments .....................................................................................21
SECTION 8 – FURTHER DEVELOPMENTS ........................................................................22
8.1 – Indicator on Cost of Loans.........................................................................................22
8.2 – Indicator on Cost of Debt Securities .........................................................................22
8.3 – Indicator on Cost of Equities Listed .........................................................................22
8.4 – Indicator on Cost of Equities Unlisted......................................................................22
8.5 – Weighting of financing sources..................................................................................23
REFERENCES ............................................................................................................................24
APPENDIX 1 - AVAILABILITY OF MFI INTEREST RATE INFORMATION ON LOANS TO NON-FINANCIAL CORPORATIONS .........................................................................25
APPENDIX 2 - COST OF LOANS – TEMPORARY SOLUTION ............................................28

4
APPENDIX 3 - LIABILITY COMPOSITION OF NON-FINANCIAL CORPORATIONS' BALANCE SHEETS ............................................................................................................32
APPENDIX 4 - “HISTORICAL APPROACH” MODELS ......................................................33
APPENDIX 5 - “IMPLIED APPROACH” MODELS ..............................................................34
APPENDIX 6 - PROPORTION OF EACH SOURCE OF FINANCING AS A % OF THE TOTAL LIABILITIES – CALCULATION METHOD .......................................................36

5
INTRODUCTION The purpose of this document is to outline the methodology recommended to develop a cost of capital indicator for EU non-financial corporations, across all the EU Member States (MS). Section 1 provides some background to the project, and brief description of its scope. Section 2 defines the concepts of a corporation’s capital, its components and cost of capital. Section 3 briefly describes the methodology used for the construction of the cost of capital indicator, as a weighted average of its cost components. Sections 4 to 6 describe how to build an indicator for the individual capital components. Section 4: for loans Section 5: for corporate bonds Section 6: for listed equity Section 7 describes how to estimate the weight that should be given to the individual cost components. Section 8 lists some of the refinements and further developments that could be included following completion of the first phase of the project.

6
SECTION 1 – Background and Scope of the project The actions taken in the framework of the Lisbon Strategy are intended to improve the competitiveness of the EU's economy. To properly monitor the progress resulting from those actions, some indicators have been identified. One of those indicators is on “cost of capital”. The “cost of capital” is a key concept as it reflects the corporation’s cost of investment funding. Thus, the need to develop an indicator to monitor how that cost changes over time. The purpose of this project is to come up with an overall cost of capital composite indicator that would be updated on a quarterly basis and covering:
o Each one of the 27 EU Member States (MS) o EU-27 o Euro-Area
In the first phase of the project (Target: 1st Quarter 2009), the cost of capital indicator1 will cover three out of the 4 major sources of capital:
o Loans o Corporate bonds o Listed equity
Following the first phase, further refinements and developments can be considered such as:
- Include in the analysis the remaining major source of capital financing: Unlisted equity. - The development of indicators that take into account factors such as the impact of taxation. - The development of indicators at the economic sector level within each MS.
1 See Note on Terminology in Section 2.

7
SECTION 2 – Concept of Cost of Capital The total capital of a firm equals the value of its equity plus the value of its debt. If a firm was to increase its total assets (e.g. for a new investment), this would have to be financed by an increase of its equity, its debt or a combination of the two. Financing through debt can be performed using two main sources: loans and debt securities (e.g. corporate bonds). When financing through equity, a difference should be established between listed and unlisted equity. Lenders, debt and equity holders expect to get a return on the funds they provide to a firm. The cost of capital represents the rate of return required by the fund provider. For a firm using multiple sources of financing, the cost of capital can be calculated as the weighted average cost of the different sources, as follows:
WACC = Σ WSource-i KSource-i Where:
WACC: Weighted average cost of capital WSource – i : Proportion of source i (e.g. loans, debt securities, equity) in the total capital of the
firm. Σ WSource – i = 1 KSource-i: Cost of capital for the i source of financing
Note on terminology: In financial terms, the concept of cost of capital includes the impact of taxation on the cost of financing. As stated in Section 1, the first Phase of this project does not take this into account. As a result, the indicator resulting from the developments made in Phase I should be viewed as an indicator on “external cost of financing” rather than on “cost of capital”.

8
SECTION 3 – Methodology Overview To come up with a cost of capital composite indicator at the MS level, the same concept of Weighted Average Cost of Capital – WACC (i.e. weighted average cost of the different sources) will be used, as explained in Section 2. This requires the estimation at the MS level of:
- a cost of capital indicator for each source of financing (KSource-i), and - their individual weight (WSource - i)
As we saw above, the cost of capital represents the required rate of return of the fund provider. Depending on the source of capital used, information on the required rate of return from fund providers can be either directly observed, inferred from observable data, or in some cases it is very difficult to measure. In the case of loans, corporate debt and listed equity, we recommend to build the cost of capital indicator from the rates/yields applied by financial institutions/inferred from financial markets data. Examples of how the required rate of return can be measured:
- Loans: Interest rate charged by a bank on a loan. - Corporate debt: Yield on a corporate bond with similar characteristics / risk. - Listed equity: The earnings yield (equal to the ratio: Expected Earnings / Stock Price) can be
viewed as the expected rate of return required by investors. In the case of unlisted equities, the lack of market price information at the corporation level makes it very difficult to build an aggregated indicator at the MS level that reflects a required rate of return. As a result the WACC will only be calculated using loans, corporate debt and listed equity as sources of financing. The methodology to build the indicators for these 3 sources is described in Sections 4, 5, and 6. For unlisted equity, given the lack of information, the recommendation is to rely on qualitative information to at least get a sense of the MS where raising funds through the issuance of unlisted equity is more or less difficult (for example by looking at the fiscal and legislative framework). Some additional details on this approach are given in Section 8.4. As stated above in Section 1, the analysis of this source of financing will not be covered in the first phase of the project. The following table summarizes for each source of capital, the type of data recommended to be used to build the indicators.

9
Table 2 – Data Recommendations SOURCE TYPE OF DATA USED Loans Interest rates applied by Monetary Financial Institutions on loans to
non-financial corporations. Source of data: European Central Bank and National Central Banks.
Debt securities Yield on a corporate bond indices. Source of data: financial markets data providers.
Equities listed Prices of stock market indices as well as earnings forecast provided by financial analysts are used to infer the implied cost of equity capital. Source of data: financial markets data providers.
Equities unlisted Rating of factors impacting the development of the private equity environment and facilitating the use of private equity as a source of funds. Source of data: European Private Equity and Venture Capital Association (EVCA). Statistics from the same source, related for instance to amounts raised will also be considered.
To asses the importance or weight of each financing source, we will rely on the Financial Accounts statistics published by Eurostat. This will be described in Section 7.

10
SECTION 4 – Indicator on Cost of Loans (KLO) Raising capital through loans is one of the main sources of financing. In 2006, at the EU27 aggregated level loans represented around 28% of the total liabilities.2 An obvious measure to asses the cost of loans is to build an indicator that measures the rate lenders (such as banks or other monetary institutions) charge on loans to corporations. 4.1 – Recommended Data Sources For Euro Area Member States The ECB provides statistics3 on interest rates applied by Monetary Financial Institutions on loans to non-financial corporations (“MFI Interest Rate Data” statistics). These statistics cover information both on “New Business” (i.e. new contracts or existing contracts that have been re-negotiated) or “Outstanding contracts” (i.e. all outstanding contracts that have been agreed in all periods prior to the reporting date). Description of the data available on “New Business”:
o Data on Interest rate. Data is available at the Member State level (only those in the euro area) with the following layers of breakdown:
Bank overdraft Loans other than Bank overdrafts
• Initial period of fixation of the interest rate: 4 o floating rate and up to one year initial rate fixation, o over one and up to five years initial rate fixation, o over five years initial rate fixation.
• Size of the loan: Up to EUR 1 Million and Over EUR 1 Million o Data on Business Volumes. Same level of details as for Interest rates, but only at the
Euro area aggregate level. 2 Own calculations from Annual Financial Accounts (Source of raw data: Eurostat)
3 Regulation (EC) No 63/2002 of the European Central Bank of 20 December 2001 concerning statistics on interest rates applied by monetary financial institutions to deposits and loans vis-à-vis households and non-financial corporations.
4 The initial period of fixation is defined as the period of time at the start of a contract during which the value of the interest rate can not change (Example 1: Rate = 7% for the entire contract; Example 2: Rate = 3% above LIBOR as of 30 June 2008).

11
Description of the data available on “Outstanding Amounts”: o Data on Interest rate. Data is available at the Member State level (only those in the euro
area) with the following layers of breakdown: Bank overdraft Loans other than Bank overdrafts with an original maturity of:
o Up to 1 year o Over 1 and up to 5 years o Over 5 years.
o Data on Business Volumes. Same level of details as for Interest rates, but only at the euro area aggregate level.
For Non-Euro Area Member States In the short term, the only way to get equivalent data for non-euro area member states is to rely on the data published by the National Central Banks. Appendix 1 lists the source of information recommended to be used for each non-euro area MS, as well as any potential limitations with the available data. 4.2 – Recommended Indicator For Euro Area Member States In order to have an indicator that covers the full spectrum of maturities available, and to be able to compare rates contracted over the same period of time, the recommended indicator would be the result of a weighted average of the MFI Interest rates on New Business across the various rates fixation periods and for the different amount sizes. This would include the following rate series on New Business for each MS:
• Bank Overdrafts • Other loans with floating rate and up to 1 year initial rate fixation period
- Size of the loan: Up to EUR 1 Million - Size of the loan: Over EUR 1 Million
• Other loans over 1 and up to 5 years’ initial rate fixation period - Size of the loan: Up to EUR 1 Million - Size of the loan: Over EUR 1 Million
• Other loans over 5 years’ initial rate fixation period - Size of the loan: Up to EUR 1 Million - Size of the loan: Over EUR 1 Million
Using the rate series on “Outstanding contracts” would not be adequate as they would mix rates from old and new contracts. The data available on volume of loans on New Business would be used to calculate the weightings to be given to each one of the 7 loan categories listed above. These series are however not very stable due to

12
sudden increases / decreases in the volume of new business. To provide a more stable weighting scheme over time, a 12-month moving average of the volume data would be used. 5 It should be noted that the data on volumes is only available at the euro-area consolidated level. Therefore the same weights would be used for all MS. Having weights that are MS-specific should be one of the main areas of focus for future developments. Please refer to section 8 for additional details. For Non-Euro Area Member States To the extent there is available and reliable data from National Central Banks, we will use the same methodology as for euro-member states (including the use of euro-area weights). The methodology to calculate an indicator for MS where the rates information is not available/partially available and/or is not reliable will be decided on a case by case basis. From nominal to real indicator To take into account the decrease in real value of the borrowed funds over the duration of loan, the rates resulting from the weighted average calculation (i.e. the “nominal” rate) have to be deflated by the expected rate of inflation over the loan period. The resulting rate is the “real” rate. The relationship between the nominal and the real rates is the following: (1 + r)(1 + i) = (1 + R) where “r” is the real interest rate, “i” is the expected inflation rate, and “R” is the nominal interest rate
5 As an alternative to this weighting scheme that only uses volume data on “New Business”, the following method (combining volume data on “New Business” and “Outstanding contracts”) could be considered:
• For the weighting across different rates fixation periods, the volume data on “Outstanding contracts” would be used, but giving an extra weight to “loans with floating rates and up to 1 year rate fixation period” to take into account the fact that a significant proportion of the long term loans (over 1 year maturity) are granted at variable rates. For example, at the Euro-area level, it has been suggested to allocate 50% of the volume of long terms loans (i.e. over 1 year maturity) to the rates on “loans with floating rates and up to 1 year rate fixation period”.
• For the weighting across different sizes (Up to / Over 1 Million), the only statistics available are on “New Business”. These series are not very stable due to sudden increases / decreases in the volume of new business. To provide a more stable weighting scheme over time, a 12-month moving average of the volume data on “New Business” would be used.
13
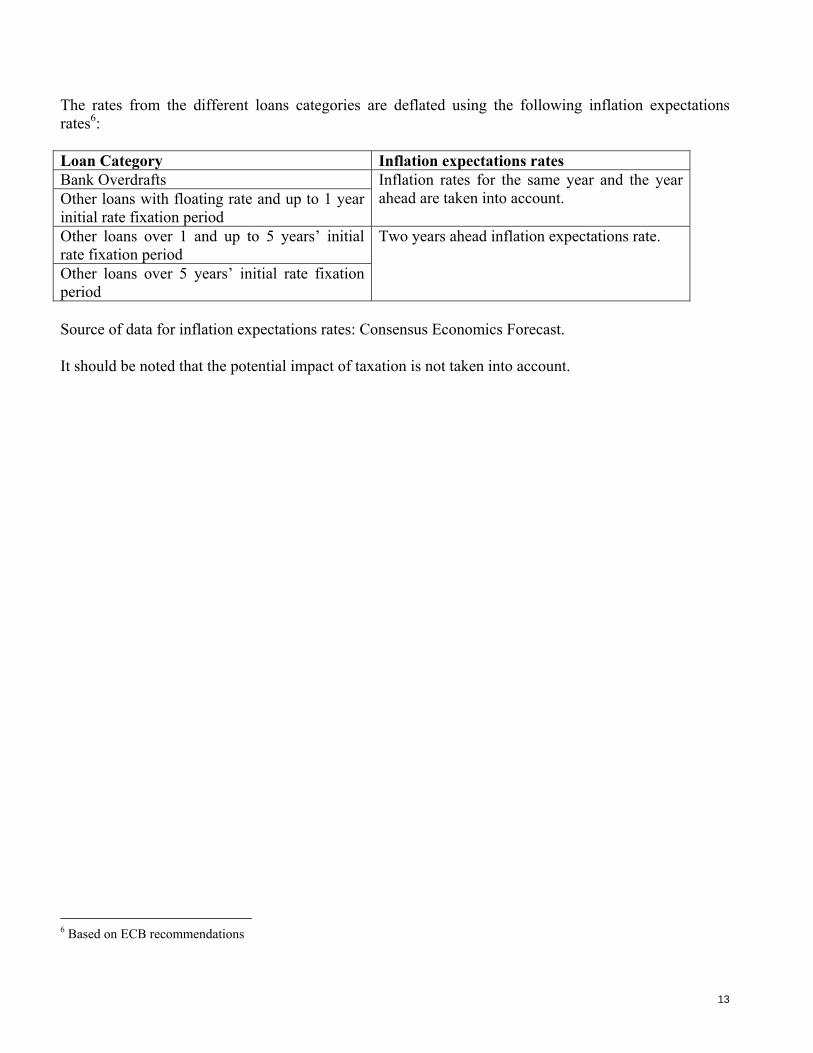
The rates from the different loans categories are deflated using the following inflation expectations rates6: Loan Category Inflation expectations rates Bank Overdrafts Other loans with floating rate and up to 1 year initial rate fixation period
Inflation rates for the same year and the year ahead are taken into account.
Other loans over 1 and up to 5 years’ initial rate fixation period Other loans over 5 years’ initial rate fixation period
Two years ahead inflation expectations rate.
Source of data for inflation expectations rates: Consensus Economics Forecast. It should be noted that the potential impact of taxation is not taken into account.
6 Based on ECB recommendations

14
IMPORTANT REMARK – TEMPORARY SOLUTION FOLLOWING A DETAILED ANALYSIS OF DATA ON LOANS CURRENTLY AVAILABLE Although the method described in Section 4.2 seems the most appropriate to calculate a cost of loans indicator that covers the full spectrum of maturities and sizes of loans possible, its practical implementation at the MS level is not feasible given the data currently available. The two key issues faced with the data currently available are:
• For 15 MS, rates are not available for one or more of the 7 rate categories. • Comparability of rates across MS: For 6 MS the data available has not been collected/reported
according to ECB standards. Given the uncertainties around the timing required to close these data gaps, a temporary solution should be envisaged. The key feature of the temporary solution is that the indicator on loans would be built using only the rates on loans with short term rate fixation periods and on overdrafts:
• Other loans with floating rate and up to 1 year initial rate fixation period o Size of the loan: Up to EUR 1 Million o Size of the loan: Over EUR 1 Million
• Bank Overdrafts A more detailed description of the issues faced with the data and a justification for the temporary solution are provided in Appendix 2 to this document.

15
SECTION 5 – Indicator on Cost of Debt Securities (KDS) Although issuance of corporate bonds has significantly increased since the introduction of the Euro, its importance is still marginal compared to other sources of financing. The UK is the only MS where this source of financing accounts for more than 10 % of the total liabilities (around 10.6% in 2006)7. In Greece, Austria, Portugal and Slovakia it accounted for between 5 and 7.5%. Please refer to Appendix 3 for details by MS. The cost of raising capital for a firm that issues bonds is based on the rate of return that investors will require on those bonds. The rate of return measuring the performance of a bond (including the payment of coupons as well as any capital gain or loss) is also known as the “yield”. The riskier the bond, the higher the yield will be. From a risk/credit rating perspective, corporate bonds can be classified into two main categories:
• “Investment Grade”. These are bonds with a low risk of default (Under S&P credit rating classification: Rating of BBB or higher. Under Moody’s: Rating of Bbb or higher).
• “High Yield” or “Junk” bonds. These are bonds rated below investment grade by the rating agencies. They pay a higher interest than investment grade, but they have a substantial risk of default.
5.1 – Recommended Indicator One possible approach to come up with a corporate bond yield indicator at the MS level would be to use average yields on national corporate bond indices (e.g. a weighted average of the yields on an “investment grade” bond index and on a “high yield” bond index). However implementing this approach at the MS level would raise the following issues:
- Given the small size of the corporate bond market for most of the EU MS, a corporate bond index at the MS level does not always exist. Or when it exists, the average yield would be driven by a small number of companies, which might not be representative of the entire market.
- Comparison over time and across MS of average yields of bond indices only makes sense if the average maturity (a.k.a. average duration) of the indices does not change over time / across MS.
As a result of the above, the indicator at the MS level might need to be artificially built using some assumptions. The basic model recommended to build the indicator is based on the assumption that the yield on a corporate bond is the result of the addition of two components:
- A Risk Free Rate, representing the yield on an asset with no/small risk (e.g. yield on government bonds) - A corporate spread, representing the additional spread required by investor to invest in corporate bonds and take on additional risk (in comparison with the risk free rate).
Model: Yield on Corporate Bonds = Risk Free Rate + Corporate Spread
7 Own calculations from Annual Financial Accounts (Source of raw data: Eurostat)

16
The model above would be applied as follows for each MS: Risk Free Rate = Yield on 10 year government bonds for the specific MS The Corporate spread should measure the extra return required by an investor to invest in corporate bonds. This could be calculated as the difference between the required yield on corporate bonds and the yield on a bond with no risk. Proposed method to calculate the Corporate Spread: Corporate Spread = (Weighted Average Yield of the iBoxx EUR Benchmark-Non Financial Corp. index and iBoxx EUR High Yield-Non Financial Corp. Index) – (Yield on the Euro area yield curve for AAA rated bonds corresponding to the weighted average duration of the same indices) Both indices would be market value weighted. The iBoxx indices are published by International Index Company Limited (IIC), a leading provider of indices in the area of fixed income, credit derivatives and currencies8. The iBoxx EUR Benchmark Index covers investment grade bonds denominated in EUR, and the iBoxx EUR High Yield Index covers EUR denominated bonds with a rating below investment grade. Example - Let’s assume that:
1 - The average yield is 8% for the iBoxx EUR Benchmark index and 11% for the iBoxx EUR high yield index. 2 - The average duration is 7.1 years for the iBoxx EUR Benchmark index, and 6 years for the iBoxx EUR high yield index. 3 - Market value weights: 90% for the Benchmark index and 10% for the High Yield index. 4 - The euro area yield curve takes the following values
Maturity 3 months 6 months 9 months 1 year 3 years 5 years 7 years 10 years Yield in % 4% 4.25% 4.50% 4.60% 4.75% 4.80% 4.85% 4.89%
Weighted average yield: 0.9X 8% + 0.1 X 11% =8.3% Weighed average duration: 0.9X 7.1 + 0.1 X 6 =6.99 years The corporate Spread would be = 8.3% - 4.85% = 3.45%. To come up with an indicator at the MS level, the above corporate spread would be added to the yield on 10 year government bonds for the specific MS. 8 Additional information on IIC and the iBoxx indices can be found on http://www.indexco.com/

17
From nominal to real indicator The indicator calculated above has then to be deflated by the expected rate of inflation over the average duration period. The resulting rate is the “real” indicator. 5.2 – Sources of data - Euro Area Yield Curve:
Source = ECB Data Set = Euro area yield curve
- Yield on 10 years government bonds for each member state Source = ECB Data Set = Harmonised long-term interest rates for convergence assessment purposes
- Average Yield and Average Duration for iBoxx indices. Source = Commercial data providers Data Set = Last 5 years
- Inflation Expectations: Consensus Economics Forecast. - How to estimate the weighting between Investment grade and High Yield? We would need to obtain market value figures on outstanding amounts in the investment grade and high yield sections of the market. Based on information available from the Securities Industry and Financial Markets Association, the Investment grade section represents more than 90% of the entire corporate bond market.9
5.3 – Observations
- Available evidence suggests that the corporate bond market in the euro area has achieved a high degree of integration, with “country effects only explaining a very small proportion of the cross-sectional variance of corporate bond yield spreads”10. The above model assumes that the corporate bond yield spreads are the same across all EU MS which might be a strong assumption for MS outside of the euro zone. The only country specific component in the corporate bond yield indicator is included in the risk free rate.
- Corporate bonds are mainly used by large companies. As a result the indicator for corporate bonds would not be representative for small/medium size firms. - iBoxx indices used to calculate the indicator on cost of debt securities cover EUR denominated bonds, which means that bonds from corporations outside of the EU might be included in the indices.
9 Source: Securities Industry and Financial Markets Association. See Pag 2 of the Primary Distribtion Survey report:
http://www.sifma.org/research/pdf/Primary-Distribution-Survey-Report-Spring-2007.pdf
10 Source: Indicators of Financial Integration in the Euro area – European Central Bank – September 2006

18
SECTION 6 – Indicator on Cost of Equities Listed (KEL) The listed equity cost of capital represents the return equity holders expect to get on their listed shares. It needs to compensate for the additional risk the investor is taking (compared to a risk free asset). This includes for example the corporation’s specific risk profile, country risk, liquidity risk, foreign exchange risk…etc. 6.1 – Methodological choices To come up with an estimator at the MS level for cost of capital on equities listed, two methodological choices have to be made:
1. Estimation approach: Should we use historical or forward looking information? (Section 6.1.1) 2. Type of data to be used: Should we use data at the corporation level? Or would it be possible to
use consolidated data at the market/MS level (e.g. use of stock indices) (Section 6.1.2) 6.1.1 – Estimation approach: “Historical” VS. “Forward looking” (or “Implied”) In the financial literature, two main approaches are used when estimating the equity cost of capital:
• “Historical” Approach – The cost of capital is derived using historical data. These models (best example of this model is the CAPM) implicitly assume that future stock performances can be estimated using historical data. Appendix 4 provides some details on a couple of popular models used to estimate the cost of equity capital under the Historical Approach.
• “Implied” Cost of Capital Approach – The cost of equity capital is derived from current stock prices and forward-looking information. This approach starts from the assumption that the price of a stock should equal the present value of the future cash flows to the investors (i.e. the dividends). The implied cost of equity is then calculated as the discount rate (k) that sets the current stock price (P0) equal to the present value of expected future dividends (D1 , D2 , ….Dt…)
P0=D1/(1+k) + D2/(1+k) 2 +… + Dt/(1+k) t +… +
The different models that can be used to estimate the cost of equity capital under the Implied Approach just differ by the assumptions used to estimate the dividends/earnings behavior. Please refer to Appendix 5 for some details on some of the models that could used to estimate the cost of equity capital under the “Implied Approach”.
6.1.2 – Type of data to be used: “Company level” VS. “MS’s overall stock market level” When applying any of the approaches above we may want to use either data at individual corporation level or at the Member State (MS) overall stock market level.
• Use of data at the individual corporation level – Estimate the implied KEL at the individual corporation level using data at that level (e.g. accounting data, price of the stock, dividend/earnings estimates, ….) and then aggregate to come up with a MS estimate.

19
• Use of data at the MS’s overall stock market level – Estimate the implied cost of equity capital using information available at the MS level, such as stock indices. The main advantage of using an index is that it consolidates a lot of the market information/expectations at the MS level with a very broad coverage. The recommendation here would be to use indices such as the “MSCI Global Investable Market Indices”11 and “MSCI Frontier Market Indices”12.
Benefits of using Stock Market indices, such as the MSCI Index:
Each corporation defined as eligible can only be classified in one country (i.e. no risk
of double counting for corporations listed in more than one market) Weight of each company in the index = Free-float adjusted market capitalization
weighting. This could also be seen as a disadvantage, as the weight of large capitalization firms might be too high.
Broad coverage – Up to 99% of the free-float adjusted market cap of the total market could be represented in the index.
For a corporation to be included in the index, MSCI imposes minimum requirements on free-float and liquidity.
The market index is broken down in Large/Medium/Small cap indices. This might be helpful to understand differences in the cost of capital depending on the size of the company.
MSCI Stock index is available for 22 out of the 27 Member states. For Malta, Cyprus, Latvia, Slovakia and Luxembourg, a possible alternative is look at the indices published by the Stock Exchanges.13
Amount of data to be processed is much lighter than when using data at the individual company level.
Regularly updated. 6.2 – Recommendations
1. ESTIMATION APPROACH: Use of “Implied” Cost of Capital Approach as the current price of a
financial instrument tells you more about the market’s expectations than past/historical information. This means that we will rely primarily on current stock prices and forward looking information, such as earnings estimates, to derive the implied cost of capital.
2. TYPE OF DATA TO BE USED: Use of Stock Market Indices. In addition the amount of data
required is significantly reduced. In the first phase of the project the indices from MSCI will be used. It should be noted that the MSCI indices cover both financial and non-financial corporations. As a future development, we can explore the possibility of using indices covering non-financial corporations only.
11 MSCI Global Investable Market Indices would be used for the following MS: Austria, Belgium, Denmark, Finland,
France, Germany, Greece, Ireland, Italy, Netherlands, Portugal, Spain, Sweden, UK, Czech Republic, Hungary and Poland.
12 MSCI Frontier Market Indices would be used for the following MS: Bulgaria, Estonia, Lithuania, Romania and Slovenia.
13 National Stock indices: SAX Index (Slovak), LUX General Index (Luxembourg), CSE All Share Index (Cyprus), MSE Index (Malta), OMX Riga All Share Index (Latvia)

20
3. ESTIMATION MODEL: In the financial literature there is no consensus on what is the best model to estimate cost of equity capital. As the underlying assumptions are different, the results are different. In the first phase of the project, two basic models will be considered:
• “Earnings Yield” model: Assumes earnings will remain constant (i.e. growth rate =0%). • “Dividend Discount” model, with the assumption that dividends remain constant. (a.k.a.
“Dividend Yield” model)14. As part of future developments, other models with different assumptions on the evolution of dividend/earnings could be considered, such as:
• “Gordon Dividend Growth model”: Assumes dividends will grow at a constant rate. • “Three Stage Dividend Discount Model”. This model makes the difference between three
periods: 1 - A period of high growth of earnings with a low payout ratio. 2 - A period of declining growth of earnings with an increasing payout ratio. 3 – A period of long term stable growth of earning with a high payout ratio.
• “Ohlson-Juettner” (OJ) model: Assumes earnings will grow, but makes a difference between short and long term growth rates.
o Data requirements
- Daily Prices and Actual Earnings on MSCI Indices, going back 5/10 years if possible. Source
of data: Data vendors (e.g. Bloomberg, Reuters). - Earnings estimates provided by financial analysts. Source of data: Thomson Financial
(I/B/E/S data – Institutional Brokers’ Estimate System) going back 5/10 years if possible. - Dividend estimates for next period. We can assume that the payout ratio in period 1 will be
the same as in the current period. As a result we can assume that D1= E1 (D0/E0) - Long term economic growth rate (required for OJ Model). Source of data: Eurostat – Data on
Real GDP Growth rate. This data set contains at the MS and at the aggregated level (EU27/Euro area) the GDP growth rate forecast for the current and next year. The long term rate would be estimated as the average of these two rates.
- Dividend growth rate (required for Gordon Model). We can assume that this rate equals the long term economic growth rate.
IMPORTANT REMARK Although conceptually the “implied Approach” is the preferred option to infer the cost of capital, its use would require the use of external data that might not be easily accessible for budgetary reasons (mainly the I/B/E/S data from the earnings estimates provided by financial analysts). To overcome this potential obstacle two options can be considered:
• Use the “Historical Approach, such as the CAPM Model. (Please refer to Appendix 4 for a short description).
• Use a variation of the “forward looking” Earnings Yield Model described in Appendix 5. Instead of using “future earnings estimates”, we could use a “trailing version” of the Earnings yield model by using “actual earnings” figures instead of future estimates.
The choice of the appropriate method will be dependent on the data available. 14 Earnings tend to be more volatile than dividends. As a result, the Dividend Yield model might give a more stable picture.

21
SECTION 7 – Weighting of financing sources (WSource - i) Corporate financing structures differ significantly from one MS to another. For example, in Austria loans are the privileged source of financing for non-financial corporations (representing around 44 % of the total liabilities in 2006). In France, on the other hand, equity represents the largest source of financing (representing almost 65% of the total liabilities).15 Evaluating the importance of each source of financing in each MS is key to determine the weights that should be allocated to each source-indicator. 7.1 – Recommended data sources The Financial Accounts statistics published by Eurostat provide at the EU Member state level data on the value of stocks of assets and liabilities. The data can be broken down by institutional sector (e.g. financial corporations, non-financial corporations, etc…) and by balance sheet item. This allows the estimation at the MS level of the proportion of each source of financing as a % of the total liabilities. 7.2 – Calculation method Details on the specific balance sheet items used and the calculation methods are provided in Appendix 6 to this document. 7.3 – Data limitations / Comments
• Timeliness. The data on Financial Accounts used to calculate the weighting of financing sources should be transmitted by MS by T+9 months. So for instance data for 2007 would not be available before October 2008.
• No data on Financial Accounts available for some MS: o Malta and Luxembourg (as a result of a derogation until 2010) o Cyprus (as a result of a derogation until Sep-2009) o In some case the data is incomplete data. For example in the case of Denmark, Germany,
Italy, Austria, Slovakia and the UK there is no data available to breakdown the equity data between quoted and unquoted shares.
Alternative: For the weights that can not be calculated due to missing data we will apply the EU average.
• In some MS, the category “Other Accounts payable” represents a significant proportion of non financial corporation’s balance sheets. In the first phase of the project we will assume that its importance as a financing source is negligible when this category is netted against the equivalent category on the assets side (“Other accounts receivable”). This assumption should be verified at a later stage of the project.
15 See Appendix 2 - Own calculations from Annual Financial Accounts (Source of raw data: Eurostat)

22
SECTION 8 – Further developments This section lists the areas that could be further refined and developed following the completion of the first phase of the project. 8.1 – Indicator on Cost of Loans • Improving the quality of the rates data for non-euro area member states: The only data currently
available is the one published by National Central Banks. This data might not comply with the ECB requirements on MFI Interest rate statistics. Harmonization of this data is currently on the ECB’s agenda (expected completion date to be set).
• Explore the possibility of getting and using data on volumes of loans at the MS level. This data could be used to better asses the distribution of loans across different maturities and sizes for each MS.
• Take into account the potential impact of taxation.
8.2 – Indicator on Cost of Debt Securities • The recommendation in section 5.1 is to build the indicator using yields on iBoxx indices. As an
alternative, the Merrill Lynch corporate bond indices could also be considered. • To have country specific corporate bond spreads. 8.3 – Indicator on Cost of Equities Listed • Consider indices that only cover non-financial corporations. • Consider other valuation models such as (non-exhaustive list): the “Gordon Dividend Growth
model”, the “Three Stage Dividend Discount Model” , or the “Ohlson-Juettner” model: 8.4 – Indicator on Cost of Equities Unlisted Information on firms that are not listed does not exist or is very difficult to obtain. So estimating the cost of capital using or inferring from “observed values” in the financial markets does not seem to be possible. An approach that could be explored is to leverage on the statistics collected and the research on factors impacting the development of the private equity environment performed by the EVCA (European Private Equity & Venture Capital Association). • Statistics: The EVCA runs on a yearly basis a survey of private equity and venture capital activity16.
This includes figures, such as the amount of money raised for most of the EU MS. • The EVCA also rates as a series of factors (27 in total)17 that have an impact on the development of
the private equity18 environment. 16 “EVCA Yearbook 2008 – Annual Survey of Pan-European Private Equity & Venture Capital Activity” (June 2008). A
description of the data provided is available on: http://www.evca.eu/uploadedFiles/Home/Knowledge_Center/Books_And_Publications/AggrYB08.pdf
17 The EVCA ‘Benchmarking European Tax and Legal Environments’ Paper – December 2006, published by the European Private Equity and Venture Capital Association (EVCA). An updated version is expected to be released in September 2008.
23
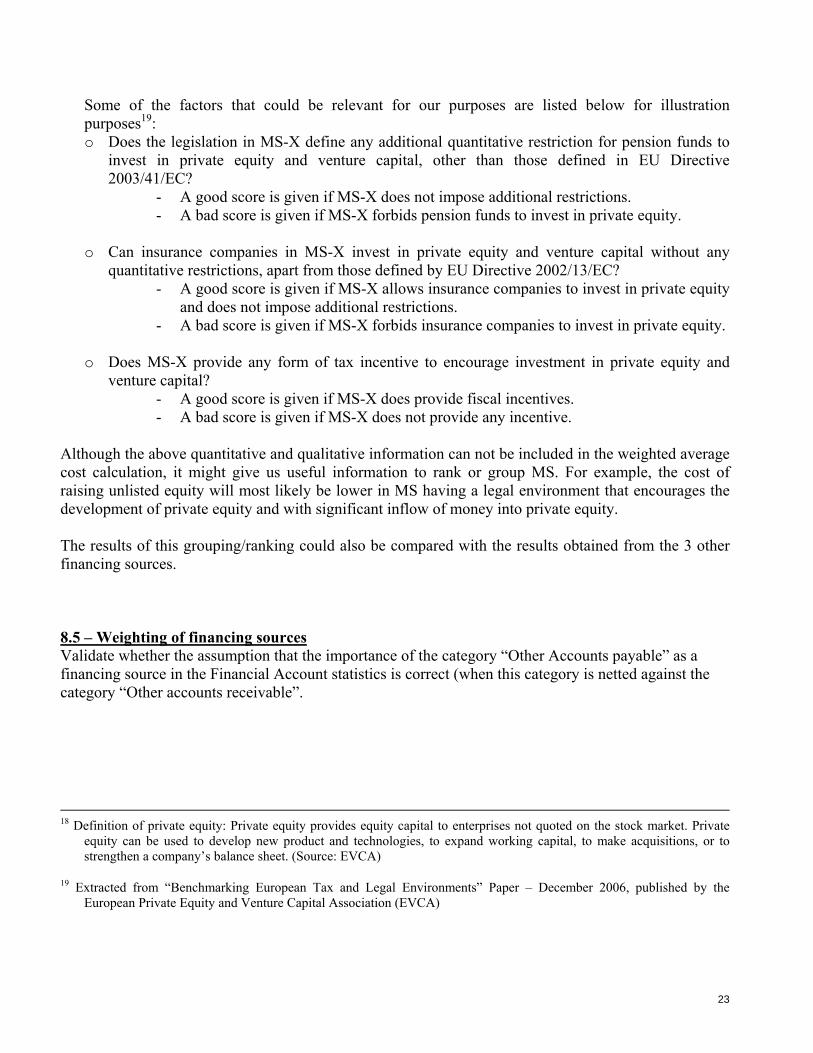
Some of the factors that could be relevant for our purposes are listed below for illustration purposes19: o Does the legislation in MS-X define any additional quantitative restriction for pension funds to
invest in private equity and venture capital, other than those defined in EU Directive 2003/41/EC?
- A good score is given if MS-X does not impose additional restrictions. - A bad score is given if MS-X forbids pension funds to invest in private equity.
o Can insurance companies in MS-X invest in private equity and venture capital without any
quantitative restrictions, apart from those defined by EU Directive 2002/13/EC? - A good score is given if MS-X allows insurance companies to invest in private equity
and does not impose additional restrictions. - A bad score is given if MS-X forbids insurance companies to invest in private equity.
o Does MS-X provide any form of tax incentive to encourage investment in private equity and venture capital?
- A good score is given if MS-X does provide fiscal incentives. - A bad score is given if MS-X does not provide any incentive.
Although the above quantitative and qualitative information can not be included in the weighted average cost calculation, it might give us useful information to rank or group MS. For example, the cost of raising unlisted equity will most likely be lower in MS having a legal environment that encourages the development of private equity and with significant inflow of money into private equity. The results of this grouping/ranking could also be compared with the results obtained from the 3 other financing sources. 8.5 – Weighting of financing sources Validate whether the assumption that the importance of the category “Other Accounts payable” as a financing source in the Financial Account statistics is correct (when this category is netted against the category “Other accounts receivable”.
18 Definition of private equity: Private equity provides equity capital to enterprises not quoted on the stock market. Private
equity can be used to develop new product and technologies, to expand working capital, to make acquisitions, or to strengthen a company’s balance sheet. (Source: EVCA)
19 Extracted from “Benchmarking European Tax and Legal Environments” Paper – December 2006, published by the European Private Equity and Venture Capital Association (EVCA)

24
REFERENCES ACCA (2006) – The cost of capital in Europe – Research report No. 94: an empirical analysis and the
preliminary impact of international accounting harmonisation.
ECB (2001) - Regulation (EC) No 63/2002 of the European Central Bank of 20 December 2001 concerning statistics on interest rates applied by monetary financial institutions to deposits and loans vis-à-vis households and non-financial corporations.
ECB (2005) - ECB Monthly Bulletin (March 2005) – Box 4: A measure of the real cost of the external financing of euro area non-financial corporations.
ECB (2005) - ECB Occasional Paper Series. No.37 / October 2005: Financing conditions in the Euro area.
ECB (2006) - Indicators of Financial Integration in the Euro area – September 2006
ECB (2006) – Differences in MFI Interest rates across euro area countries – September 2006
ECB (2007) – Corporate Finance in the euro area – May 2007
ECB – MFI Interest Rate statistics
Eurostat – Annual Financial Accounts statistics
EVCA (2008) - Yearbook 2008 – Annual Survey of Pan-European Private Equity & Venture Capital Activity”.
EVCA (2006) - Benchmarking European Tax and Legal Environments – December 2006.
Gode, D., Mohanram, P. Inferring the cost of capital using the Ohlson-Juettner Model. Stern School of Business working paper (December 2, 2002).
Gode, D., Mohanram, P. What affects the implied cost of equity capital. Stern School of Business working paper (February 3, 2001).
Indexco (2008) – Markit iBoxx EUR Benchmark Index Guide – November 2008
Indexco (2008) – Markit iBoxx EUR High Yield Index Guide – November 2008
MSCI Barra (2008) - MSCI Global Investable Market Indices Methodology
SIFMA (2007) - Securities Industry and Financial Markets Association. Primary Distribution Survey report – Spring 2007.

25
APPENDIX 1 - AVAILABILITY OF MFI INTEREST RATE INFORMATION ON LOANS TO NON-FINANCIAL CORPORATIONS
MS DATA IN “ECB-MFI” FORMAT?
SOURCE DATA CONSTRAINTS / COMMENTS ON AVAILABLE DATA
EURO AREA MEMBER STATES AT FI FR DE IE IT NL ES
YES ECB – MFI Interest rates statistics
None
BE GR SI
YES ECB – MFI Interest rates statistics
Data on rates not available for loans with: Between 1 and 5 years initial rate fixation period (IRFP) / Over EUR 1m. Over 5 years IRFP/ Over EUR 1m. Additional comment for SI: Data available only from Jan-2007
CY PT
YES ECB – MFI Interest rates statistics
Data on rates not available for loans over 1 year IRFP Additional comment for Cyprus: Data available only from Jan-2008
LU YES ECB – MFI Interest rates statistics
Data on rates not available for loans over 1 year IRFP and overdrafts.
MT Not yet ECB – MFI Interest rates statistics
Currently no data available Dataset for Malta will not be available before 2009.
NON-EURO AREA MEMBER STATES BG Yes (According to
Bulgarian National Bank)
Bulgarian National Bank – BNB (http://www.bnb.bg)
Data available from Jan-2007 BNB provides rates and volume information for loans denominated in local currency (BGN), EUR and USD. The rates on new business for the categories “IRFP between 1 and 5 years” and “over 5 years” are based on business volumes that are very small (in many cases with a business volume below EUR 5 million equiv.). This raises the question of the representativeness of this data.
CZ Yes (According to Czech National Bank)
Czech National Bank (http://www.cnb.cz)
Data available only for loans denominated in local currency (CZK). The threshold for the size of loans used by the CNB is CZK 30 million (aprox. EUR 1.2 million) instead of EUR 1 million.

26
MS DATA IN “ECB-MFI” FORMAT?
SOURCE DATA CONSTRAINTS / COMMENTS ON AVAILABLE DATA
DK Yes (According to Danmarks Nationalbank)
Danmarks Nationalbank (http://www.nationalbanken.dk)
Data available only for loans denominated in local currency (DKK). Some of the rates on new business for the categories “between 1 and 5 years / Up to EUR 1 million” are based on business volumes that are small and could be influenced by a small number of loans.
EE No Eesti Pank (http://www.eestipank.info)
The data does not seem to be collected / reported according to ECB regulation ECB/2001/18. The breakdown provided does not match with the ECB requirements. Breakdown provided: By recipient of the loan (e.g. government, financial institution, commercial undertakings,…) By maturity: Short term (less than a year) or long term (over 1 year). No breakdown by size is provided. No data on overdrafts. Eesti Pank provides rates information for loans denominated in local currency (EEK), EUR and USD. EUR related loans represent around 80% of the total volume of loans issued.
HU Yes * Magyar Nemzeti Bank (http://www.mnb.hu)
MNB provides rates and volume information for loans denominated in local currency (HUF), and EUR (from Jan-2005). The data series in EUR for rates on loans with IRFP of over 1 year is not available. * Although the format of the data reported is in line with the “ECB-MFI” format, we have not found a formal confirmation that the data was collected according to ECB regulation ECB/2001/18.
LT Yes (According to Bank of Lithuania)
Bank of Lithuania (http://www.lb.lt)
Data available from Mar-2005 Bank of Lithuania provides rates and volume information for loans denominated in local currency (LTL), and EUR. In the breakdown by initial rate fixation period, they do not make the difference between 1 and 5 years, and over 5 years. Those two categories are merged under “over 1 year”.
LV Partially comparable * Bank of Latvia (http://www.bank.lv)
Bank of Latvia provides rates and volume information for loans denominated in local currency (LVL) and EUR. The data on amounts is however not broken down by denominated currency. Rate data series, both in LVL and EUR have missing/not available data (mainly for IRFP of over 1 year). The rates data is broken down using the following amounts range: Below EUR 0.2 Million, between EUR 0.2 and EUR 1 million, and over EUR 1 million. In the breakdown by initial rate fixation period, they do not make the difference between 1 and 5 years, and over 5 years. Those two categories are merged under “over 1 year”. * To be confirmed: whether the data has been collected according to ECB regulation ECB/2001/18.

27
MS DATA IN “ECB-MFI” FORMAT?
SOURCE DATA CONSTRAINTS / COMMENTS ON AVAILABLE DATA
PL Yes (According to National Bank of Poland)
National Bank of Poland (http://www.nbp.pl)
Data available from Jan 2007 NBP provides rates and volume information for loans denominated in local currency (PLN), and EUR. Rate data series, both in PLN and EUR have missing/not available data (mainly for IRFP of over 1 year). Data on amounts not available. For loans in PLN it uses PLN 4 million as a threshold (= EUR 1.18 million) instead of EUR 1 million. Initial rate fixation periods are broken down as follows: (less than 3 months, between 3 months and 1 year, between 1 and 5 years, over 5 years)
RO Yes (According to National Bank of Romania)
National Bank of Romania (http://www.bnro.ro)
Data available from Jan 2007 NBR provides rates and volume information for loans denominated in local currency (RON), and EUR. Data on amounts not available.
SE No Statistics Office of Sweden (http://www.scb.se)
Data available from Sep 2005. Rates data provided for loans denominated in local currency. No info on amounts available. There is no breakdown by size of the loans (below or above 1 million) Initial rate fixation periods are broken down as follows: (less than 3 months, between 3 months and 1 year, between 1 and 5 years, over 5 years) No data available on overdrafts
SK Yes (According to National Bank of Slovakia)
National Bank of Slovakia (http://www.nbs.sk)
NBS provides rates information for loans denominated in local currency (SKK), and EUR. Data available at least since Jan-2007 for loans in SKK and since Jan-2008 for loans in EUR. Rate data series in EUR has a significant proportion of missing/not available rates (mainly for IRFP of over 1 year).
UK No Bank of England (http://www.bankofengland.co.uk)
Bank of England provides statistics on rates on loans to non-financial institutions. Two types of break downs are provided: By rate: Floating rate, Fixed up to 1 year, Fixed from 1 to 5 years, Fixed over 5 years. By size: Up to GBP 1 million (aprox. EUR 1.25 million), Between GBP 1 and 20 million, Over GBP 20 million. No info on amounts. No data available on overdrafts.

28
APPENDIX 2 - COST OF LOANS – TEMPORARY SOLUTION The purpose of this Appendix is twofold:
1. Highlight the limitations of the cost of loans indicator, as described in Section 4.2. Although the method described seems the most appropriate to calculate a cost of loans indicator that covers the full spectrum of maturities and sizes of loans possible, its practical implementation at the MS level is not feasible given the data currently available. (Section A)
2. Propose an alternative, to be implemented on a temporarily basis, while the data gaps are closed. (Section B)
A – LIMITATIONS WITH THE DATA CURRENTLY AVAILABLE The cost of loans indicator, as described in Section 4.2., is the result of a weighed average calculation of MFI interest rates on the following 7 types of loans:
• Other loans with floating rate and up to 1 year initial rate fixation period - Size of the loan: Up to EUR 1 Million (X1) - Size of the loan: Over EUR 1 Million (X2)
• Other loans over 1 and up to 5 years’ initial rate fixation period - Size of the loan: Up to EUR 1 Million (X3) - Size of the loan: Over EUR 1 Million (X4)
• Other loans over 5 years’ initial rate fixation period - Size of the loan: Up to EUR 1 Million (X5) - Size of the loan: Over EUR 1 Million (X6)
• Bank Overdrafts (X7) However, given the data constraints that we face for a significant proportion of MS, calculating a cost of loans indicator at the MS level, using the above 7 rates, does not appear to be feasible. The main issues faced with the data, preventing us from having a full data set comparable across all MS, are the following:
• For Euro-area MS: - Rates are not available for one or more of the 7 rate categories (BE/CY/GR/LU/PT/SI) - Entire set of data not yet been made available for one MS (MT)
• For Non-euro-area MS: - Rates are not available for one or more of the 7 rate categories
(EE/HU/LT/LV/PL/SE/SK/UK) - Rates are only available for loans denominated in local currency (CZ/DK/SE/UK), not for
loans denominated in EUR. - Comparability of rates across MS: Data has not been collected/has not been reported
according to ECB regulation ECB/2001/18 (e.g. breakdown provided is different) (EE/LV/SE/UK/SE/UK)

29
- Loans with floating rates and up to 1 year initial rate fixation period account for a significant proportion of all new loans to non-financial corporations 20. As a result, in some MS, the rates on loans with rate fixation periods over 1 year are based on business volumes that are very small21, raising the question of the representativity of the data. (e.g. BG, DK)
Appendix 1 of this document details the data constraints faced for each individual MS. Only for 10 out of the 27 MS the entire set of 7 rates is available and can be considered as fully comparable from one MS to another. (AT, DE, ES, FI, FR, IE, IT, NL, BG, RO) B – ALTERNATIVE PROPOSAL As an alternative, we suggest to:
• Use only the rates on loans with short terms fixation periods and on overdrafts instead of the 7 rates listed above:
o Other loans with floating rate and up to 1 year initial rate fixation period - Size of the loan: Up to EUR 1 Million (X1) - Size of the loan: Over EUR 1 Million (X2)
o Bank Overdrafts (X7) The number of MS where the above 3 rates are available and can be considered as fully comparable across MS is 20
MS where X1, X2 and X7 are available and comparable across MS
AT / BE / CY / DE ES / FI / FR / GR IE / IT / NL / PT / SI / BG / HU / LT / LV / PL / RO / SK
For the remaining seven MS, were X1, X2 or X7 are not available and/or have not been collected under ECB standards, we will proceed as follows:
MS Rates missing /
Not directly comparable
Proposed alternative
LU X7 Use the rate on Overdrafts of a MS with similar characteristics as a proxy, or alternatively a euro-area average.
MT X1 / X2 / X7 Use the rate on Overdrafts of a MS with similar characteristics as a proxy, or alternatively a euro-area average.
CZ X1 / X2 / X7 Use the equivalent rates for loans denominated in CZK provided by the Czech National Bank: For X1: Other loans to NFC up to CZK 30 million – floating rate and up to 1 year rate
fixation (New Business) For X2: Other loans to NFC over CZK 30 million – floating rate and up to 1 year rate
fixation (New Business) For X7: Rate on bank overdraft to NFC.
CZK 30 million = aprox. EUR 1.2 million And apply the Interest Rate Parity (IRP)22 theory to transform rates into EUR equivalent.
20 This is based on data available from those MS providing volume statistics (e.g. BG, CZ, DK, LT, HU,…)
21 In other words, those rates could be influenced by a very small number of loans
22 Under the IRP theory interest rates and exchanges in two countries (A and B) are related as follows:

30
MS Rates missing / Not directly comparable
Proposed alternative
DK X1 / X2 / X7 Use the equivalent rates for loans denominated in DKK provided by the Danmarks Nationalbank: For X1: Other loans to NFC up to DKK 7.5 million – floating rate and up to 1 year rate
fixation (New Business) For X2: Other loans to NFC over DKK 7.5 million – floating rate and up to 1 year rate
fixation (New Business) For X7: Rate on bank overdraft to NFC.
DKK 7.5 million = aprox. EUR 1 million Apply Interest Rate Parity (IRP) 23 theory to transform rates into EUR equivalent.
EE X1 / X2 / X7 For X1 and X2: Use the rate to commercial undertakings on short term loans (up to 1 year) provided by Eesti Pank , as a proxy of the weighted average of X1 and X2. (Eesti Pank does not provide breakdown by size of the loans - below or above 1 million). For X7: Use the rate on Overdrafts of a MS with similar characteristics as a proxy.
SE X1 / X2 / X7 For X1 and X2: Use the average between the following two rates as a proxy of the weighted average of X1 and X2:
- Rate to NFC on loans with rate fixation period under 3 months - Rate to NFC on loans with rate fixation period between 3 months and 1 year.
For X7: Use the rate on Overdrafts of a MS with similar characteristics as a proxy, or alternatively a euro-area average. Apply Interest Rate Parity (IRP) 24 theory to transform rates into EUR equivalent.
UK X1 / X2 / X7 For X1 and X2: Use the average between the following two rates as a proxy of the weighted average of X1 and X2:
- Rate on loans to NFC with floating rate. - Rate on loans to NFC with rate fixation period under 1 year.
For X7: Use the rate on Overdrafts of a MS with similar characteristics as a proxy, or alternatively a euro-area average. Apply Interest Rate Parity (IRP) 25 theory to transform rates into EUR equivalent.
This theory states that differentials in interest rates in countries A and B are captured by the difference between the forward and spot exchange rates.
(1 + IA) = (1 + IB) Forward FX / Spot FX
Where:
IA and IB are the interest rates in countries A and B on a loan on a given maturity. Forward FX = exchange rate for a forward contract with the same maturity as the loan (expressed as units of currency-A per unit of currency B) Spot FX = exchange rate for a spot contract
23 See footnote 22
24 See footnote 22
25 See footnote 22
31
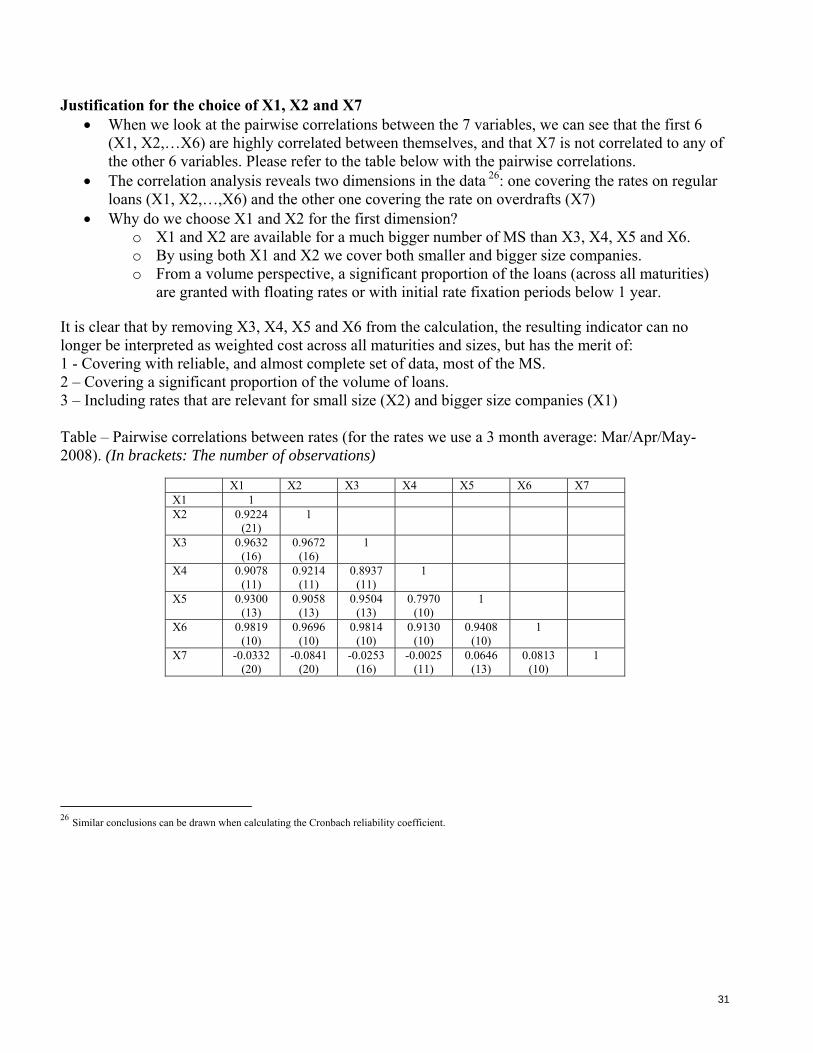
Justification for the choice of X1, X2 and X7 • When we look at the pairwise correlations between the 7 variables, we can see that the first 6
(X1, X2,…X6) are highly correlated between themselves, and that X7 is not correlated to any of the other 6 variables. Please refer to the table below with the pairwise correlations.
• The correlation analysis reveals two dimensions in the data 26: one covering the rates on regular loans (X1, X2,…,X6) and the other one covering the rate on overdrafts (X7)
• Why do we choose X1 and X2 for the first dimension? o X1 and X2 are available for a much bigger number of MS than X3, X4, X5 and X6. o By using both X1 and X2 we cover both smaller and bigger size companies. o From a volume perspective, a significant proportion of the loans (across all maturities)
are granted with floating rates or with initial rate fixation periods below 1 year. It is clear that by removing X3, X4, X5 and X6 from the calculation, the resulting indicator can no longer be interpreted as weighted cost across all maturities and sizes, but has the merit of: 1 - Covering with reliable, and almost complete set of data, most of the MS. 2 – Covering a significant proportion of the volume of loans. 3 – Including rates that are relevant for small size (X2) and bigger size companies (X1) Table – Pairwise correlations between rates (for the rates we use a 3 month average: Mar/Apr/May-2008). (In brackets: The number of observations)
X1 X2 X3 X4 X5 X6 X7 X1 1 X2 0.9224
(21) 1
X3 0.9632 (16)
0.9672 (16)
1
X4 0.9078 (11)
0.9214 (11)
0.8937 (11)
1
X5 0.9300 (13)
0.9058 (13)
0.9504 (13)
0.7970 (10)
1
X6 0.9819 (10)
0.9696 (10)
0.9814 (10)
0.9130 (10)
0.9408 (10)
1
X7 -0.0332 (20)
-0.0841 (20)
-0.0253 (16)
-0.0025 (11)
0.0646 (13)
0.0813 (10)
1
26 Similar conclusions can be drawn when calculating the Cronbach reliability coefficient.

32
APPENDIX 3 - LIABILITY COMPOSITION OF NON-FINANCIAL CORPORATIONS' BALANCE SHEETS (As a % of Total Liabilities) - YEAR 2006
2006 LOANS CORP. DEBT SHARES AND OTHER EQUITY OTHER CATEGORIES TOTAL
Quoted shares
Unquoted Shares
Financial Derivatives
Insurance Technical Reserves
Other Accounts Payable
be Belgium 32.91% 2.43% 63.81% 11.38% 37.46% 0.86% 0.00% 0.02% 0.83% 100.00% bg Bulgaria 25.30% 0.93% 49.17% 7.34% 29.62% 24.61% 0.03% 24.58% 100.00% cz Czech Republic 19.80% 0.99% 47.81% 13.37% 22.11% 31.40% 0.10% 31.30% 100.00% dk Denmark 29.18% 2.76% 63.71% 4.35% 4.35% 100.00% de Germany 32.99% 2.80% 49.20% 15.00% 5.27% 9.73% 100.00% ee Estonia 27.43% 1.40% 54.98% 9.78% 45.20% 16.20% 0.02% 16.18% 100.00% ie Ireland 39.98% 1.56% 37.10% 21.36% 0.00% 0.00% 21.36% 100.00% gr Greece 32.91% 5.37% 59.12% 30.54% 28.58% 2.60% 0.17% 0.00% 2.43% 100.00% es Spain 31.14% 0.36% 51.08% 15.13% 24.00% 17.42% 0.08% 0.06% 17.28% 100.00% fr France 19.23% 4.69% 64.85% 19.77% 42.50% 11.23% 0.46% 10.77% 100.00% it Italy 31.55% 2.29% 50.06% 16.11% 0.11% 3.77% 12.24% 100.00% cy Cyprus lv Latvia lt Lithuania 25.97% 0.08% 53.94% 16.54% 30.74% 20.01% 0.00% 20.01% 100.00% lu Luxembourg 0.00% hu Hungary 23.80% 0.47% 60.79% 7.42% 14.87% 14.94% 0.05% 0.00% 14.89% 100.00% mt Malta 0.00% nl Netherlands 34.70% 2.56% 51.38% 32.91% 18.13% 11.36% 11.36% 100.00% at Austria 44.64% 7.33% 44.20% 3.83% 0.00% 0.00% 3.83% 100.00% pl Poland 17.97% 1.56% 51.68% 14.57% 12.93% 28.80% 0.01% 0.00% 28.78% 100.00% pt Portugal 29.27% 5.58% 52.36% 12.52% 25.57% 12.80% -0.02% 0.35% 12.46% 100.00% ro Romania 18.17% 0.36% 45.04% 8.80% 24.38% 36.43% 0.00% 0.00% 36.43% 100.00% si Slovenia 29.35% 0.68% 49.87% 15.65% 13.43% 20.10% 0.04% 0.00% 20.06% 100.00% sk Slovakia 16.88% 5.99% 31.24% 45.88% 0.10% 0.00% 45.78% 100.00% fi Finland 27.58% 4.39% 58.95% 36.11% 19.74% 9.08% 0.27% 0.00% 8.81% 100.00% se Sweden 26.13% 3.05% 60.00% 26.32% 27.10% 10.82% 0.50% 0.78% 9.54% 100.00% uk United Kingdom 31.32% 10.67% 53.72% 4.28% 4.28% 100.00%
(Source: Own calculations from Annual Financial Accounts – Source of the Raw Data: Eurostat)

33
APPENDIX 4 - “Historical Approach” Models Model Comments 1 – Capital Asset Pricing Model (CAPM)
Under this model, the required rate of return is calculated as follows: KEL = RFR + Risk Premium RFR: Risk Free Rate Risk Premium = (RM – RFR)βf RM – RFR = is the “Market Premium” = Difference between the Return of the entire market (RM) and the RFR. βf =Beta for the firm. It measures how sensitive the return of a firm’s stock is compared to the market’s return (using historical data)
βf = 1 if the shares are as riskier as the market βf > 1 if the shares are riskier than the market βf < 1 if the shares are less riskier than the market
- Advantage: Conceptually simple. - Inconvenient: The main issue is that the calculation of the Beta relies only on historical data. It does not use any forward looking information, such as earnings estimates.
2 – Fama and French Three Factor Model
This models starts with the idea that small caps and value stocks (i.e. stocks with a high book value-to-price ratio) tend to outperform the market. So this model expands on the CAPM model (single factor model) by adding two additional factors to estimate the require rate of return: size and book value-to-price ratio.

34
APPENDIX 5 - “Implied Approach” Models
Model Type of information required
Comments
1 – “Earnings Yield” Formula = E1 / P0
- Current Price of Stock (P0) - Estimated Earnings for Next Period (E1)
The Earnings Yield is the inverse of the widely used Price Earnings Ratio (PER). PER is used as a measure of how cheap/expensive a stock is. It is calculated as the ratio between Price and Earnings. It gives how much the market is ready to pay for each unit of earnings. The inverse of the PER (i.e. ratio Earnings / Price) would represents the implied return. If we consider that the Price today (P0 ) reflects future estimated earnings, and E1 the estimated earnings for the next period, the ratio E1 / P0 would estimate the return required by investors.
- Advantage: Very simple approach. - Inconvenient: Earnings are not “hard numbers” (i.e. depending on how accounting standards are applied the earnings could be different). Using “consensus estimates” (average of individual estimates) from financial analysts could solve this issue. This model also assumes that the earnings will not change, and that they are not negative.
2 – “Ohlson-Juettner” Model
- Current Price of Stock (P0) - Estimated Earnings for forthcoming two periods (E1, E2) - Dividend per share estimates for the forthcoming period (D1) - Estimated long terms economic growth rate (γ)
Under this model the cost of equity capital can be estimated using: Price of the shares (P0), earnings per shares estimates for the forthcoming two periods (E1, E2), dividend per share estimates for the forthcoming period (D1), and an estimation of the long terms economic growth rate (γ) - Advantage: Although the underlying assumptions need to be further analyzed, it looks more realistic than the “Inverse of the PER” model as it does not rely on the assumption that the earnings will not change. It relies mostly on information that can either be easily found (e.g. Price) or available in the market (earning estimates produced by financial analysts – IBES data). - Inconvenient: Earnings are not “hard numbers”. Depending on how accounting standards are applied the earnings could be different. Using “consensus’ estimates from financial analysts could solve this issue. Underlying assumptions of this model need to be further analyzed.
35
Model Type of information required
Comments
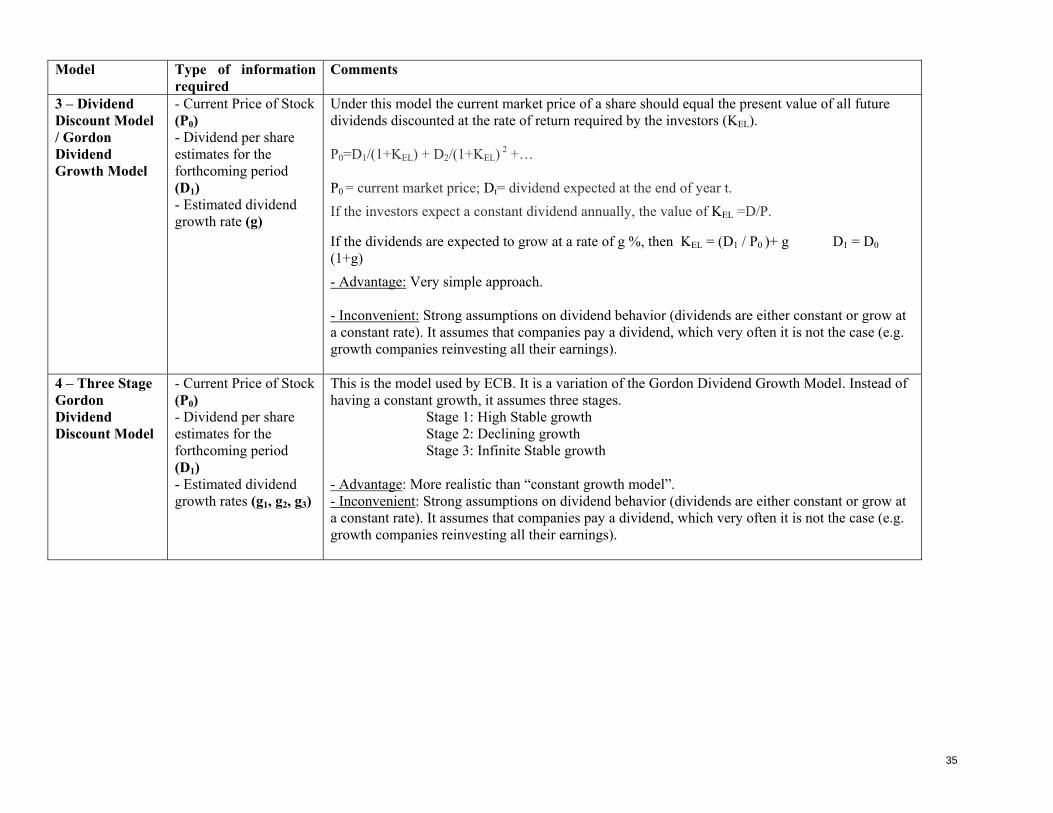
3 – Dividend Discount Model / Gordon Dividend Growth Model
- Current Price of Stock (P0) - Dividend per share estimates for the forthcoming period (D1) - Estimated dividend growth rate (g)
Under this model the current market price of a share should equal the present value of all future dividends discounted at the rate of return required by the investors (KEL). P0=D1/(1+KEL) + D2/(1+KEL) 2 +… P0 = current market price; Dt= dividend expected at the end of year t. If the investors expect a constant dividend annually, the value of KEL =D/P.
If the dividends are expected to grow at a rate of g %, then KEL = (D1 / P0 )+ g D1 = D0 (1+g) - Advantage: Very simple approach. - Inconvenient: Strong assumptions on dividend behavior (dividends are either constant or grow at a constant rate). It assumes that companies pay a dividend, which very often it is not the case (e.g. growth companies reinvesting all their earnings).
4 – Three Stage Gordon Dividend Discount Model
- Current Price of Stock (P0) - Dividend per share estimates for the forthcoming period (D1) - Estimated dividend growth rates (g1, g2, g3)
This is the model used by ECB. It is a variation of the Gordon Dividend Growth Model. Instead of having a constant growth, it assumes three stages.
Stage 1: High Stable growth Stage 2: Declining growth Stage 3: Infinite Stable growth
- Advantage: More realistic than “constant growth model”. - Inconvenient: Strong assumptions on dividend behavior (dividends are either constant or grow at a constant rate). It assumes that companies pay a dividend, which very often it is not the case (e.g. growth companies reinvesting all their earnings).

36
APPENDIX 6 - PROPORTION OF EACH SOURCE OF FINANCING AS A % OF THE TOTAL LIABILITIES – CALCULATION METHOD
• DATA o Source of Information: Eurostat o Data Category: Annual Financial Accounts – Balance Sheet o Selection Criteria:
Geographical breakdown: 27 Individual MS Sector: Non Financial Corporations (S11) Balance Sheet side: Liabilities (LIAB) Frequency of data: Yearly. Indicators used (in brackets: ESA95 Codes):
• Total Liabilities (f_lib) • Securities other than shares (f3) • Securities other than shares excluding financial derivatives (f33) • Financial derivatives (f34) • Loans (f4) • Shares other than equity (f5) • Shares and other equity, excluding mutual fund shares (f51) • Quoted shares (f511) • Unquoted shares (f512) • Other equity (f513) • Mutual Fund shares (f52) • Insurance Technical Reserves (f6) • Other accounts receivable (f7)
• CALCULATION METHODTO ESTIMATED THE PROPORTION OF EACH
SOURCE OF FINANCING FOR EACH MEMBER STATE (using the ESA 95 Codes) o Proportion of LOANS = f4 / f_lib o Proportion of CORPORATE DEBT: f33 / f_lib o Proportion of SHARES AND OTHER EQUITY: f5 / f_lib
Proportion of Quoted shares: f511 / f_lib Proportion of Unquoted shares: f512 / f_lib
o Proportion of OTHER CATEGORIES: (f34 + f6 + f7) / f_lib

37
European Commission EUR 23703 EN – Joint Research Centre – Institute for the Protection and Security of the Citizen Title: Cost of Capital Indicator for EU Member States - Methodology Author(s): David Guilleme Moreno Luxembourg: Office for Official Publications of the European Communities EUR – Scientific and Technical Research series – ISSN 1018-5593

38
How to obtain EU publications Our priced publications are available from EU Bookshop (http://bookshop.europa.eu), where you can place an order with the sales agent of your choice. The Publications Office has a worldwide network of sales agents. You can obtain their contact details by sending a fax to (352) 29 29-42758.

39
The mission of the JRC is to provide customer-driven scientific and technical support for the conception, development, implementation and monitoring of EU policies. As a service of the European Commission, the JRC functions as a reference centre of science and technology for the Union. Close to the policy-making process, it serves the common interest of the Member States, while being independent of special interests, whether private or national.