Embed Size (px)
Citation preview

From the Dmaker, LongHarvard T.HDepartmentof Public HHealth EcoObesity PreVictoria, AuUniversity o
AddressSocial andHealth, 677jbarrett@hsp
0749-379http://dx
148 Am
Cost Effectiveness of an ElementarySchool Active Physical Education Policy
Jessica L. Barrett, MPH, Steven L. Gortmaker, PhD, Michael W. Long, ScD, Zachary J. Ward, MPH,Stephen C. Resch, PhD, Marj L. Moodie, DrPH, Rob Carter, PhD, Gary Sacks, PhD,
Boyd A. Swinburn, MD, Y. Claire Wang, MD, ScD, Angie L. Cradock, ScD
ep, C.oeanovestf AcoBeHh.7/.do
J P
Introduction: Many American children do not meet recommendations for moderate to vigorousphysical activity (MVPA). Although school-based physical education (PE) provides children withopportunities for MVPA, less than half of PE minutes are typically active. The purpose of this studyis to estimate the cost effectiveness of a state “active PE” policy implemented nationally requiringthat at least 50% of elementary school PE time is spent in MVPA.
Methods: A cohort model was used to simulate the impact of an active PE policy on physicalactivity, BMI, and healthcare costs over 10 years for a simulated cohort of the 2015 U.S. populationaged 6–11 years. Data were analyzed in 2014.
Results: An elementary school active PE policy would increase MVPA per 30-minute PE class by1.87 minutes (95% uncertainty interval [UI]¼1.23, 2.51) and cost $70.7 million (95% UI¼$51.1,$95.9 million) in the first year to implement nationally. Physical activity gains would cost $0.34 perMET-hour/day (95% UI¼$0.15, $2.15), and BMI could be reduced after 2 years at a cost of $401 perBMI unit (95% UI¼$148, $3,100). From 2015 to 2025, the policy would cost $235 million (95% UI¼$170 million, $319 million) and reduce healthcare costs by $60.5 million (95% UI¼$7.93 million,$153 million).
Conclusions: Implementing an active PE policy at the elementary school level could have a smallimpact on physical activity levels in the population and potentially lead to reductions in BMI andobesity-related healthcare expenditures over 10 years.(Am J Prev Med 2015;49(1):148–159) & 2015 American Journal of Preventive Medicine
Introduction
Physical activity has positive impacts on children’shealth,1 academic achievement, and cognition.2,3
Physically active youth may be more likely tomaintain a physically active lifestyle into adulthood,4–6
and children with better motor skills are more likely to be
artment of Social and Behavioral Sciences (Barrett, Gort-radock), Center for Health Decision Science (Ward, Resch),Chan School of Public Health, Boston, Massachusetts;
f Health Policy and Management (Wang), Mailman Schoollth, Columbia University, New York, New York; Deakinmics (Moodie, Carter), WHO Collaborating Centre forntion (Sacks, Swinburn), Deakin University, Melbourne,ralia; and the School of Population Health (Swinburn),uckland, Auckland, New Zealandrrespondence to: Jessica L. Barrett, MPH, Department ofhavioral Sciences, Harvard T.H. Chan School of Publicuntington Ave, 7th Floor, Boston MA 02115. E-mail:harvard.edu.$36.00i.org/10.1016/j.amepre.2015.02.005
rev Med 2015;49(1):148–159 & 2015 Ame
physically active during childhood7–9 and later in life.10
Empirical evidence has not shown a consistent impact ofphysical activity on BMI,11–18 but recent experimentaland epidemiologic evidence demonstrates that changesin physical activity can lead to changes in BMI.19,20
National guidelines from the USDHHS suggest thatchildren and adolescents should spend at least 60minutes per day in physical activity.21 However, themost recent available national data indicate that only42% of children aged 6–11 years obtain at least 60minutes per day of moderate to vigorous physical activity(MVPA).22 Recognizing the crucial role of schools inhelping children meet physical activity guidelines, theIOM recommends that elementary schools provide anaverage of 30 minutes per day (150 minutes per week) ofhigh-quality curricular physical education (PE), duringwhich students spend at least half of class time engaged inMVPA.23
However, only 4% of elementary schools currentlyprovide 150 minutes per week of PE.24,25 Although 99%
rican Journal of Preventive Medicine � Published by Elsevier Inc.

Barrett et al / Am J Prev Med 2015;49(1):148–159 149
of elementary schools require some PE,26 students attendPE class for 97 minutes per week on average, typically in2–3 class periods of 30–45 minutes each.27 During anaverage PE class, students spend less than half of classtime engaged in MVPA.28–31 PE activity levels are lowerwhen more lesson time is spent in management andknowledge activities such as organizing students andreviewing rules and techniques,28,32,33 and when PEclasses are led by generalist classroom teachers insteadof trained PE specialists (i.e., teachers certified or licensedto teach PE).28,30,34
Several controlled experiments provide evidence thatPE can be modified to increase activity levels. A recentmeta-analysis35 found that active PE interventionsincreased lesson time spent in MVPA by an absolutedifference of 10.37%, and among studies in whichteachers learned instruction-based strategies to encour-age MVPA, the difference was 6.27%. Two notableevidence-based PE programs—the Sports, Play, andActive Recreation for Kids (SPARK) trial30 and the Childand Adolescent Trial for Cardiovascular Health(CATCH)29—provide a model for implementation ofsuch teaching strategies. Both programs provided schoolswith curricula and portable equipment designed toengage students in more MVPA during PE class andtrained PE teachers on how to implement the curricu-lum.29,30 In follow-up and dissemination studies, SPARKand CATCH investigators demonstrated that PEimprovements were sustainable and translatable.36–40
The programs have been widely disseminated to date,and the curricula, equipment, and training are commer-cially available.41,42
In recent years, school districts and states havepursued “active PE” policies, or policies aimed atincreasing MVPA levels during PE class. Between the2006–2007 and 2010–2011 school years, the proportionof school districts addressing activity levels during PE intheir local school wellness policies significantly increasedfrom 28% to 51% at the elementary school level.43
Between 2001 and 2007, state legislatures introduced 43bills related to activity levels during PE, and 11 bills wereenacted.44 As of 2014, Texas, Oklahoma, Arizona, andthe District of Columbia had policies specifying that 50%of PE time for elementary school students be devoted toMVPA.45,46 However, active PE policies frequently lackspecific language addressing implementation or moni-toring,45,47 making them difficult to enforce.To date, little evidence exists describing the cost
effectiveness of physical activity interventions onimproving physical activity levels, BMI, and health out-comes.48–52 Cost-effectiveness analysis can provide val-uable information to decision makers for settingpriorities and allocating resources.53,54 This paper
July 2015
describes a simulation modeling analysis estimating thecost effectiveness of an active PE policy on physicalactivity and BMI, using the best available evidence.
MethodsIntervention
The modeled intervention was an “active PE” policy, specified asthe implementation of a state policy directing state boards ofeducation (i.e., boards with regulatory or policy authority ineducational settings) to include in the state’s elementary schoolPE curriculum a requirement that 50% of PE time be devoted toMVPA. The intervention was based on policies passed by statelegislatures in Texas (SB 891, 2009) and Oklahoma (SB 1876,2010). Implementation of the active PE policy was assumed to takeplace during existing PE classes (i.e., no PE minutes would beadded), and would include providing schools with PE curricula,portable equipment, and teacher training, similar to the SPARKand CATCH PE programs. The intervention also included amonitoring component, which was considered necessary toachieve implementation, whereby principals would be trained toevaluate activity levels during PE classes as part of regular teacherevaluations.
Current Practice
The comparator for this intervention was current practice. Texas,Oklahoma, Arizona, and the District of Columbia were consideredas having elementary school active PE policies as of 2014.45,46
Other states that had policies requiring a non-specific amount ofMVPA during PE, an amount of MVPA o50% of PE time, orMVPA during the school day but not specifically during PE wereeligible to receive the modeled intervention. In the absence of anactive PE policy intervention, elementary school students wereestimated to engage in MVPA for 40%35 of 97 weekly PEminutes,27 on average. The average proportion of PE classestaught by PE specialists (compared with classroom teachers) wasestimated at 86% based on a national survey.24
Modeling Framework
A detailed description of the Childhood Obesity Intervention CostEffectiveness Study (CHOICES) modeling framework is providedelsewhere.55 A team from the Harvard School of Public Health,Columbia Mailman School of Public Health, Deakin University,and the University of Queensland in Australia adapted andmodified the Australian Assessing Cost Effectiveness (ACE)53 inObesity52 and ACE-Prevention49,56 methodologies to create theCHOICES model. The simulation model was developed as aMicrosoft Excel–based Markov cohort model based on ACE,56
but modified and replicated in a compiled programming language(Java) for CHOICES. The model was populated to represent the2015 U.S. population and followed for 10 years without replace-ment (i.e., closed cohort) to evaluate the shift in BMI and relatedhealthcare cost reductions due to the intervention operating in“steady state” (i.e., at its most likely effectiveness potential) over ameaningful 10-year policy window. The impact of the interventionwas estimated using the best available evidence from randomizedtrials and epidemiologic and economic studies. The CHOICES

Barrett et al / Am J Prev Med 2015;49(1):148–159150
evidence review protocol, derived from Cochrane guidelines andthe Grades of Recommendation, Assessment, Development andEvaluation (GRADE) approach,57,58 prioritized evidence obtainedfrom RCTs, controlled natural or quasi experiments, and longi-tudinal studies of change in exposure and change in outcome.55
The modified model estimated an added healthcare cost of $282(2014 U.S. dollars) per year for obese compared to non-obesechildren and youth aged 6–19 years.59 Because there is littleevidence60 for maintenance of childhood intervention effects overthe 20–35 years required to impact obesity-related disease andhealthcare costs, the CHOICES model estimated outcomes in a 10-year window only. Appendix Figure 1 displays the logic pathwaylinking the active PE policy to change in obesity-relatedhealthcare costs.
Implementation and Equity Considerations
The framework also incorporated broader aspects of prioritysetting and included a qualitative assessment of key issues relevantto stakeholders.53 As described elsewhere,55 an expert stakeholderpanel of physical activity and PE researchers and governmentpublic health practitioners was convened to help frame theintervention, identify relevant resources for simulation modeling,and provide input regarding broader key issues relevant toimplementation. Implementation considerations included levelof evidence, equity, acceptability, feasibility, sustainability, sideeffects, and social and policy norms.
Policy/Program Reach
The active PE policy intervention was scaled to the national level.Using nationally representative data,61–63 the target populationwas estimated to be 18.5 million children aged 6–11 yearsattending more than 47,000 public elementary schools in the47 states eligible to newly adopt the active PE policy, represent-ing 75% of the total 2015 U.S. population aged 6–11 years.Students enrolled in private or home schooling and thoseresiding in states that had already enacted an active PE policywere not included.
Estimates of the total number of people reached by theintervention (intent-to-treat [ITT] population) and receiving ahealth benefit from the intervention (benefiting population) werecalculated, assuming all 47 states without an existing active PEpolicy would adopt the policy and all PE teachers in those stateswould receive training to implement the policy. The ITTpopulation was defined as children in the target population whoattended an elementary school offering any PE and regularlyparticipated in any PE, and the benefiting population wasconfined to those children taught by PE teachers who actuallyimplemented the policy. Based on studies of the ongoing main-tenance38 and institutionalization39 of the CATCH PE program,the implementation rate among trained PE teachers was estimatedat 72%.
Assessment of Benefit
Expected effectiveness of the active PE policy on per capita MVPAwas modeled using results from a recent meta-analysis35 of activePE trials. Intervention-related increase in MVPA during PE classwas estimated as 6.24% of class time (i.e., the average effectobserved when teaching strategies were used to increase MVPA
levels).35 MVPA minutes were also converted to MET-hoursgained, assuming an average MET level of 4.5. Total daily increasein physical activity on PE days was assumed to be equal to thephysical activity increase during PE class, based on evidencesuggesting that children do not compensate for increased schoolday physical activity during other times of the same day.64–68
Two studies identified from 4600 reviewed according to theCHOICES evidence review protocol55 were used to estimate thechange in BMI expected from a change in MVPA. One study19
provided evidence of change in BMI resulting from a change inobjectively measured MVPA in an RCT of a school-based physicalactivity intervention with no co-interventions. Another study20
provided evidence of the change in BMI resulting from change inMVPA using a 6-year longitudinal observational design. Based onresults from the two studies, each 1-minute increase in regular dailyMVPA was estimated to result in an average per capita BMIreduction of 0.023. This estimate is similar to the expected BMIchange of 0.018 calculated according to the model of childhoodenergy balance developed by Hall and colleagues.69 The Appendixprovides more details regarding the review of the relationshipbetween physical activity and BMI.
Costs of Intervention
The 1-year and 10-year costs of implementing the policy in theclosed cohort were estimated in 2014 U.S. dollars using a modifiedsocietal perspective,54,70 because the health and economic burdenof obesity is borne and should be addressed at the societal level.71
Start-up costs were not included according to established proto-cols,72,73 but were conceptualized as providing an introductory fulltraining to all PE teachers and a set of PE curricula and equipmentto every school (estimates of start-up costs given in Appendix).Resources required to sustain regular implementation of the activePE policy were identified as (1) training PE teachers on strategiesand curricula to implement active PE; (2) training schoolprincipals on how to assess whether PE teachers are using activePE strategies in their lessons; (3) replacement of equipment andcurricular materials needed to maintain active PE; and (4) state PEcoordinator time for oversight, implementation, and monitoringof the active PE policy. Two levels of training for PE teachers weremodeled—an intensive training for teachers newly hired in aschool district, and a refresher training for teachers returning tothe same school district. Additional training time during existingtraining opportunities was included for directing principals onhow to observe and assess, as part of regular evaluations ofteachers, whether PE teachers incorporated active PE strategiesinto their lessons. Teachers’ time costs for training were assumedto be covered by annual professional development allowances incurrent practice; thus, only training facilitator time costs wereincluded for PE teacher training. Nearly all (96%) states and schooldistricts provide funding for or offer some physical activity–relatedprofessional development for PE teachers, with 67% of states and55% of districts offering opportunities on the topic of methods toincrease MVPA levels during PE class.74 Appendix Table 1 showsline-item costs included in the cost calculation.
Cost-Effectiveness Analysis
The incremental cost effectiveness of the active PE interventioncompared to current practice was expressed as the cost (in 2014
www.ajpmonline.org

Barrett et al / Am J Prev Med 2015;49(1):148–159 151
U.S. dollars) per MET-hour increase per day after 1 year and costper BMI unit change after 2 years. The full BMI effect was assumedto occur after 2 years of intervention to account for the time courseof weight change.69 The 10-year cost of implementing theintervention, reduced healthcare costs, and net costs (10-yearintervention costs plus reduced healthcare costs) were estimated.Intervention implementation was simulated for individuals in the2015 cohort for as long as they remained in the target age rangeduring the 10-year time frame. Therefore, the average interventionduration across the cohort was 3.5 years. The model assumed thatBMI effects achieved after implementing the policy were main-tained for 10 years. Because no changes in obesity-related morbid-ity and mortality were expected in children, changes in disability-adjusted life years were not estimated.
Sensitivity Analyses
Probabilistic sensitivity analyses were conducted by simultane-ously sampling values from within specified distributions usingMonte Carlo simulations in @RISK, version 6.1.2, to estimatephysical activity and BMI changes over 10,000 iterations and inJava to estimate 10-year outcomes over 1,000,000 iterations. Datawere analyzed in 2014. Table 1 shows uncertainty intervals (UIs)modeled around mean values for key model variables.Uncertainty about the specification of the modeled intervention
was assessed by comparing the primary scenario to a secondaryscenario in which more PE time was added as a result of theintervention. In the SPARK trial,30 a positive side effect (hereafter,the “SPARK effect”) was that trained classroom teachers and PEspecialists provided an additional 27 and 42 minutes of PE perweek, respectively. In the secondary scenario, the increase inMVPA minutes gained from adding new PE minutes with 46% oftime spent in MVPA35 (i.e., at the intervention level) was added tothe increase expected from the primary scenario. Additional PEminutes provided by classroom teachers were assumed to replacetime spent in other academic subjects at no cost. Costs associatedwith additional PE minutes provided by PE specialists includedcosts of training the additional number of PE specialists needed tocover those instruction minutes while maintaining the sameteacher–student ratio. Costs of hiring the additional PE specialists(i.e., annual wages) were not included.Additional sensitivity analyses were conducted. To provide a
benchmark for expected impact of the intervention under perfectcompliance, a univariate sensitivity analysis was conducted assum-ing 100% implementation among trained teachers. Sensitivity to theparameter estimating the change in BMI from a change in MVPAwas examined by alternatively using the model developed by Hallet al.69 The impact of the active PE policy was also calculatedassuming all children reached attended PE class for 150 minutesper week. The costs of providing a full training to the additional PEspecialists needed to provide PE at the current teacher–studentratio were added to all other intervention costs. Annual wages ofnewly hired PE specialists were considered start-up costs and wereexcluded (estimates of start-up costs shown in Appendix).
ResultsIf an active PE policy were enacted in the 47 states currentlylacking the policy, an estimated 46,700 elementary schools
July 2015
providing PE would be impacted. On average, a total of169,000 teachers would be trained on strategies to promoteactive PE. The intervention would reach 17.6 (95%UI¼17.4, 17.7) million students aged 6–11 years (i.e., ITTpopulation), representing 95% of the 18.5 million childrenin the target population and 71% of the 24.6 millionchildren in the total U.S. population aged 6–11 years.National implementation of an elementary school
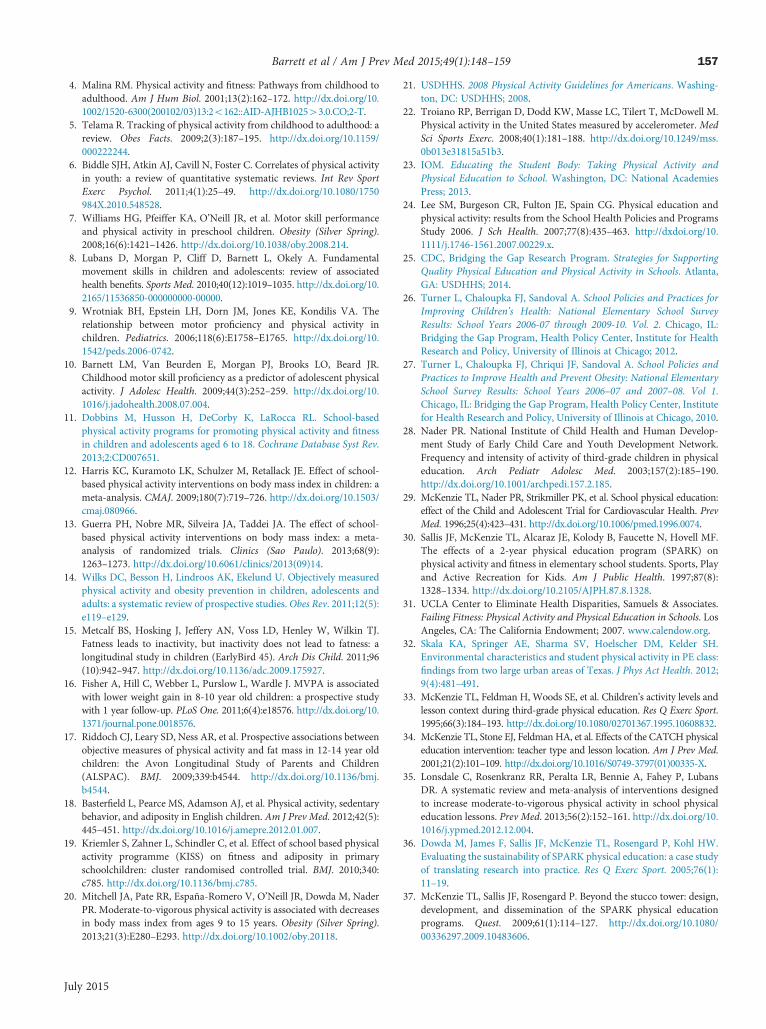
active PE policy would cost $70.7 million (95% UI¼$51.1 million, 95.9 million) in the first year (Table 2), or$4.03 per person reached. The intervention wouldincrease mean MVPA per benefiting child by 1.87minutes (95% UI¼1.23, 2.51) during a 30-minute PEclass, representing a 16% increase over existing MVPAlevels during PE. The intervention would increase meanper capita MVPA levels by 157 minutes per year (95%UI¼25, 335) and cost $0.34 per MET-hour gained (95%UI¼$0.15, 2.15). After 2 years, this physical activityincrease could reduce mean per capita BMI in thepopulation reached by 0.020 BMI units (95% UI¼0.003,0.050), costing $401 per BMI unit reduced (95% UI¼$148, $3,100). The distribution of cost-effectivenessresults is presented in Figure 1. Over the period from2015 to 2025, the intervention would cost $1,720 per BMIunit reduced (95% UI¼$272, $5,710). The BMI reduc-tions achieved after the intervention would avert anestimated $60.5 million in healthcare costs (95% UI¼$7.93 million, $153 million), resulting in net costs of $175million (95% UI¼$62.9 million, $277 million).Table 3 shows results of the sensitivity analyses. If active
PE were implemented by 100% of trained teachers, theresulting increase in children benefiting would reduce thecost per BMI unit reduced to $287 (95%UI¼$108, $2,170),and healthcare cost savings over 10 years would rise to$84.4 million. If additional minutes of PE at 50% MVPAwere provided by trained PE specialists (the SPARK effect,secondary scenario), mean per capita MVPA wouldincrease by 629 minutes per year (95% UI¼389, 925)among the population reached at an estimated annualintervention cost of $78.5 million (95% UI¼$57.5 million,$105 million). The intervention with the SPARK effectwould cost $111 per BMI unit reduced (95% UI¼$54.1,$310) and reduce healthcare costs after 10 years by $241million (95% UI¼$89.7 million, $457 million). If allchildren attended PE for 150 minutes per week, imple-menting the active PE intervention would cost $305 perBMI unit reduced (95% UI¼$143, $856).
DiscussionNational implementation of a state active PE policy wouldincrease school-based MVPA by 16% (approximately 1minute per day) among 17.6 million children aged 6–11

Table 1. Key Model Variables: Mean Values and 95% UIs
Parameter Mean (95% UI) Sources and modeling parameters
Policy/program reach
Percent of children regularlyparticipating in PE, among thosewhose schools offer PE
96 (95, 97) Samples drawn from a uniform distribution (min¼95, max¼97)based on estimates reported by school administrators in New York75
and California76
Percent of trained physicaleducators that implement thepolicy (% benefiting among ITT)
72 (58, 87) Samples drawn from a beta distribution (min¼54, mode¼70,max¼95) based on two studies of ongoing implementation of theCATCH active PE curriculum38,39
Assessment of benefit
Weekly minutes of PE provided toelementary school students
97 (16, 185) Samples drawn from a normal distribution (M=94.4, SD=45.6)based on estimates from one nationally representative survey ofschool administrators27
Percent of PE class spent in MVPAat baseline
40 (21, 56) Samples drawn from a beta distribution (min¼13.5%, mode¼44.5%,max¼48.6%) based on a meta-analysis of interventions designed toincrease MVPA during PE using teaching strategies35
Increase in percent of PE classspent in MVPA due to active PEintervention
6.24%(4.10%, 8.38%)
Samples drawn from a normal distribution (M¼6.27%, SE¼1.08%)based on a meta-analysis of interventions designed to increaseMVPA during PE using instruction strategies35
Change in BMI per 1-minute changein daily MVPA
0.023(0.010, 0.039)
Samples drawn from a uniform distribution between parametersdrawn from a normal distribution (M¼0.02, SE¼0.008) based onestimates from a group RCT19 and a beta distribution (min¼0.005,mode¼0.02, max¼0.06) based on mean estimates for the 10th,50th, and 90th percentiles of BMI from a longitudinal observationalstudy20
Costs of intervention
Principal time costs (FTE,nationally) for attending training onevaluating active PE
10.8 (7.0, 14.6) Samples drawn from a beta distribution for annual minutes oftraining time (min¼10, mode¼20, max¼30) for one principal in allITT schools; assumes 1 FTE¼8 hours/day for 180 days/year
Training facilitator time costs (FTE,nationally) for training principalsand physical educators
3.4 (1.5, 8.1) Trainer time costs calculated as the sum of trainee time costs(principals þ physical educators) divided by number of trainees pertrainer, with samples drawn from a uniform distribution (min¼30,max¼40); assumes 1 trainer FTE¼8 hours/day for 260 days/year
Pages (millions, nationally) of activePE training materials for physicaleducators
0.6 (0.2, 1.5) Physical educators receive pages of active PE materials sampledfrom beta distributions (full training for new teachers: min¼5,mode¼10, max¼15; brief training every other year for returningteachers: min¼2, mode¼5, max¼10)
Sets (nationally) of active PEcurricula and equipment
9900 (7200, 13400) Samples drawn from a beta distribution for the frequency (years) withwhich each ITT school replaces one set of active PE curriculum andequipment (min¼3, mode¼5, max¼7)
Unit cost ($) of active PE curriculumand equipment set
6900 (6200, 7500) One set includes one package for a class of 36 students in grades K-2 and one package for grades 3–5; samples drawn from uniformdistributions (K-2: min¼1,900, max¼3,100; 3–5: min¼3,100,max¼3,200) based on estimates from two commercial websites;2010 cost inflated to 2014
$, U.S. dollars; FTE, full-time equivalent; ITT, intent-to-treat; MVPA, moderate to vigorous physical activity; PE, physical education, UI, uncertaintyinterval.
Barrett et al / Am J Prev Med 2015;49(1):148–159152
years and cost an estimated $401 per BMI unit reductionafter 2 years. BMI reductions could be achieved throughsmall but measureable increases in physical activity levels,at a cost of $0.34 per MET-hour gained. The active PEpolicy intervention falls within the range of $0.19–$0.40(converted from 2007 to 2014 U.S. dollars) per MET-hour
suggested as a benchmark of cost effectiveness for inter-ventions targeting youth.48 Although there is no estab-lished benchmark of cost effectiveness for BMI unitreductions, the active PE intervention is cheaper on averagethan estimates reported for clinical and surgical interven-tions for obese children and adolescents—estimated in the
www.ajpmonline.org

Table 2. Mean Cost-Effectiveness Results With 95% Uncertainty Intervals
Total population reached (ITT) aged 6–11 years (millions) 17.6 (17.4, 17.7)
Total population benefiting (millions) 12.6 (10.2, 15.3)
First-year intervention cost ($ millions) 70.7 (51.1, 95.9)
Short-term outcomesa
Average daily increase in minutes of MVPA per child in the population reachedb 0.87 (0.14, 1.86)
Average daily increase in MET-hours per child in the population reachedb 0.065 (0.010, 0.139)
Mean BMI unit reduction per child in the population reachedc 0.020 (0.003, 0.050)
Total population MET-hours gained (millions) 206 (33.0, 440)
Total BMI units reduced (thousands)c 319 (41.7, 806)
Cost ($) per MET-hour gained 0.34 (0.15, 2.15)
Cost ($) per BMI unit reducedc 401 (148, 3100)
10-year outcomesd
Cohort 10-year intervention costs ($ millions) 235 (170, 319)
Healthcare costse ($ millions) –60.5 (–153, –7.93)
Net costsf ($ millions) 175 (62.9, 277)
aAll short-term outcomes were modeled using probabilistic uncertainty analysis over 10,000 iterations in @Risk.bOn school days.cBMI reductions were assumed to occur after 2 years of intervention. Cost per BMI was based on the cost to implement the intervention for 2 years.dAll 10-year outcomes were modeled using probabilistic uncertainty analysis over 1,000,000 iterations in Java. Health effects and costs associatedwith 10-year outcomes over the period 2015–2025 are discounted at 3% annually. Intervention costs are borne by the 2015 closed cohort and do notrepresent the annual costs of implementing the policy.
eHealthcare costs over 10 years refers to the simulated difference in healthcare costs due to the intervention over the period 2015–2025 for abaseline cohort of the U.S. population in 2015, reported as present value in 2014 dollars discounted at 3% annually.
fNet costs are the sum of intervention costs and healthcare costs (i.e., savings in healthcare costs due to the intervention) over 10 years.$, 2014 U.S. dollars; ITT, intent-to-treat; MVPA, moderate-to-vigorous physical activity.
Barrett et al / Am J Prev Med 2015;49(1):148–159 153
range of $1,000–$2,100 per BMI unit change.55,77–79
Compared with these clinical interventions and otherinterventions concurrently modeled in the CHOICESproject,55 the active PE intervention has a small effecton BMI (i.e., a 0.1% reduction), corresponding to aweight reduction of approximately 30 grams (0.07pounds) for an average 8-year-old girl. The effect iswithin range of per capita BMI reductions estimated inthe Australian ACE-Obesity cost-effectiveness analysesof a walking school bus program (0.03)80, an afterschoolphysical activity program (0.07)81, and a communityprogram promoting active transportation to school(0.01–0.07).82 Greater impact of the active PE inter-vention could be achieved if 100% of trained teachersimplemented the policy or if PE were provided for therecommended 150 minutes per week, but BMI effectsmay still be small. However, reversing the childhoodobesity epidemic requires combining many interven-tions in different settings where children spend theirtime, and even small effects may help accomplishthis goal.
July 2015
Implementation and Equity ConsiderationsAreas for concern regarding implementation of the activePE policy include the potential for increasing inequityand acceptability issues among key stakeholders(Table 4). Because PE is less likely to be provided incommunities with more low-income and racial/ethnicminority students,76,83,84 the intervention may increaseexisting income-related and racial/ethnic disparities inobesity. As specified, the active PE policy interventionwould be implemented within existing PE minutes, sostudents in schools currently providing little or nominutes of PE class would receive less or no benefit,potentially exacerbating existing chronic disease dispar-ities. Also, the acceptability of devoting resources to anyPE policy may be limited given increased emphasisamong educators and education administrators on aca-demic progress and performance on standardized tests,especially in light of budget constraints.27,85,89 Eventhough PE is a key educational component of primaryand secondary education, it often does not hold the samepriority as other subjects.

Figure 1. Distribution (A, B) and cost-effectiveness acceptability (C, D) curves of estimated cost per MET-hour gained and costper BMI unit reduction for the primary Active PE scenario.Note: Panels (A) and (B) depict the distribution of results for cost per MET-hour gained and cost per BMI unit reduction, respectively. Panels (C) and (D) depictthe cumulative probability that cost-effectiveness results are below the cost per benefit cut points along the horizontal axis. Distributions were derived fromsimulation modeling of the active PE intervention primary scenario using probabilistic uncertainty analysis over 10,000 iterations via @Risk in Excel.PE, physical education.
Barrett et al / Am J Prev Med 2015;49(1):148–159154
Strengths of the active PE policy intervention includeits feasibility and acceptability relative to other PEinterventions, such as offering more PE time or offeringPE in schools currently not offering it, which would bevery costly given already stretched school budgets andthe pressure to succeed on academic measures. Imple-mentation of active PE policies may be an incrementalway of changing the social norms and culture aroundincorporating health-promoting physical activity into theschool day. Trained teachers may also be effective inpromoting movement during other parts of the schoolday.23,88
In addition to the BMI-mediated reductions inhealthcare costs, increased physical activity may leadto other benefits not explicitly incorporated in thismodel. Physical activity has been shown to be inde-pendently associated with improvements in fitness andreductions in the risk of heart disease, diabetes mellitus,osteoporosis, and high blood pressure.1 The long-termeffects of physical activity include substantial mortalitybenefits,90 which can be achieved from changes inMVPA as small as 15 minutes per day.91 Consideringthat physical activity tracks from childhood to adult-hood, increasing children’s daily MVPA by just a few
minutes may not be trivial, especially over the course ofa lifetime. Of particular interest in the school setting isevidence that physical activity can improve cognitivefunction, mood, and academic performance.2,3,23 It is alimitation of the current model that other physicalactivity–related health and cognitive outcomes andpotential long-term increases in wages and productivityare not quantified, and these impacts should be consid-ered in future studies of school-based physical activityinterventions.
LimitationsThere are several other limitations to the CHOICESmodeling approach. The intervention-related BMIreduction occurring after 2 years was assumed to persistfor 10 years (i.e., a child’s BMI trajectory was shifteddown in level), which may be optimistic. However, theBMI effect occurring after just 2 years of interventionmay underestimate the true effect size, as children wouldbe exposed to the intervention each year they attendedpublic elementary school. Physical activity increasesduring childhood may have the potential to impact evenlonger-term positive outcomes, ideally through changesin lifelong physical activity habits. Simulation modeling
www.ajpmonline.org

Table 3. Mean Sensitivity Analysis Results With 95% Uncertainty Intervals
Secondaryscenario (SPARKeffect): increaseMVPA þ increasePE time provided
100%implementationamong trained
teachersChange in BMI
using Hall Model69
Students attend PEclass 150 minutes per
week
Total population reached(ITT) aged 6–11 years(millions)
17.6 (17.4, 17.7) 17.6 (17.4, 17.7) 17.6 (17.4, 17.7) 17.6 (17.4, 17.7)
Total population benefiting(millions)
12.6 (10.2, 15.3) 17.6 (17.4, 17.7) 12.6 (10.2, 15.3) 12.6 (10.2, 15.3)
First-year intervention cost($ millions)
78.5 (57.5, 105) 70.7 (51.1, 95.9) 70.7 (51.1, 95.9) 70.7 (51.1, 95.9)
Short-term outcomesa
Average daily increasein minutes of MVPA perchild in the populationreachedb
3.49 (2.16, 5.14) 0.87 (0.14, 1.86) 0.87 (0.14, 1.86) 1.34 (0.84, 1.92)
Average daily increase inMET-hours per child in thepopulation reachedb
0.262 (0.162, 0.385) 0.065 (0.010, 0.139) 0.065 (0.010, 0.139) 0.100 (0.063, 0.144)
Mean BMI unit reduction perchild in the populationreachedc
0.0879 (0.029, 0.151) 0.020 (0.003, 0.050) 0.015 (0.002, 0.033) 0.030 (0.012, 0.058)
Total population MET-hoursgained (millions)
828 (513, 1220) 288 (47, 596) 206 (33, 440) 318 (200, 455)
Total BMI units reduced(thousands)c
1280 (473, 2430) 445 (59.5, 1,120) 246 (39.1, 524) 489 (186, 931)
Cost ($) per MET-hour gained 0.09 (0.06, 0.17) 0.25 (0.11, 1.52) 0.34 (0.15, 2.15) 0.26 (0.15, 0.47)
Cost ($) per BMI unitreducedc
111 (54.1, 310) 287 (108, 2170) 520 (223, 3270) 305 (143, 856)
10-year outcomesd
Cohort 10-year interventioncosts ($ millions)
261 (191, 350) 235 (170, 319) 235 (170, 319) 275 (186, 396)
Healthcare costse
($ millions)–241 (–457, –89.7) –84.4 (–211, –11.3) –43.6 (–92.9, –6.95) –92.8 (–176, –35.4)
Net costsf ($ millions) 20.1 (–207, 198) 151 (9.28, 266) 192 (108, 282) 182 (60.3, 318)
aAll short-term outcomes were modeled using probabilistic uncertainty analysis over 10,000 iterations in @Risk.bOn school days.cBMI reductions were assumed to occur after 2 years of intervention. Cost per BMI was based on the cost to implement the intervention for 2 years.dAll 10-year outcomes were modeled using probabilistic uncertainty analysis over 1,000,000 iterations in Java. Health effects and costs associatedwith 10-year outcomes over the period 2015–2025 are discounted at 3% annually. Intervention costs are borne by the 2015 closed cohort, and donot represent the annual costs of implementing the policy.
eHealthcare costs over 10 years refers to the simulated difference in healthcare costs due to the intervention over the period 2015–2025 for abaseline cohort of the U.S. population in 2015, reported as present value in 2014 dollars discounted at 3% annually.
fNet costs are the sum of intervention costs and healthcare costs (i.e., savings in healthcare costs due to the intervention) over 10 years.$, 2014 U.S. dollars; ITT, intent-to-treat; MVPA, moderate-to-vigorous physical activity; PE, physical education.
Barrett et al / Am J Prev Med 2015;49(1):148–159 155
relies on many assumptions that limit conclusions;however, this study performed extensive probabilisticsensitivity analyses to relax assumptions around severalmodel parameters. Although the model utilized the bestavailable experimental and epidemiologic evidence, eachstudy comes with its own limitations.
July 2015
ConclusionsImplementing an active PE policy at the elementaryschool level could have a small impact on physicalactivity levels in the population and potentially lead toreductions in BMI and obesity-related healthcare expen-ditures over 10 years. There is strong evidence that

Table 4. Implementation and Equity Considerations
Level ofevidence Equity
Acceptabilityto
stakeholders Feasibility Sustainability Side effectsSocial andpolicy norms
One meta-analysis of 8RCTs observedstatisticallysignificanteffects ofmodified PEimplementationon change inMVPA during PEclass35
One RCT19 andone longitudinalobservationalstudy20 showimpact ofchange inphysical activityon change inBMI
Potential toincreasedisparities forchildrenprovided lessfrequent or noPE (e.g., low-incomestudents andstudents ofcolor)76,83,84
Potential todecreasedisparities,because obesechildren havelower levels ofMVPA duringPE atbaseline76
Three statesand the Districtof Columbiaalready havepoliciesrequiring 50%MVPA inPE45,46
Schooladministratorsmay hesitate tospend moneyand effort onimproving PEin the face ofacademicpressures27,85
Classroomteachers maynot beinterested inspending efforton PE training
Economiccrises amongschools,educationagencies, andstate and localgovernmentsmay make itdifficult toprioritizePE27,85
Schools withlimitedinfrastructurefor PE may findit difficult toimplementactive PE27,85
More feasiblethan addingPE timebecause oflower cost andlesscompetitionwithacademic time
Monitoringcompliance tothe policy maybe difficult45
Ongoing teachertraining canimprovesustainability86
Low levels ofschool teacherandadministratorattrition87 canassist long-termimplementationandminimize costs
Positive: Otherbenefits ofphysicalactivity,includingcardiovascularhealth, mentalhealth,classroombehavior,cognition, andacademicachieve-ment1–3,35
Successfullybeing able toimplementmore active PEwithin existingPE may leadthe way formore PE timeand otherpromotion ofphysical activityduring theschool day23,88
Decision Point:Sufficientevidence ofeffectiveness
Disparitieslikely toincrease onaverage
Acceptable topolicymakers,but competinginterests forimplementers
Concern forfinancialfeasibility, butmore feasiblethan addingPE time
Sustainable ifsystem forongoing trainingand monitoringin place
Positive sideeffects onlyexpected
Potential tolead to otherschool-basedhealthpromotionstrategies
MVPA, moderate to vigorous physical activity; PE, physical education.
Barrett et al / Am J Prev Med 2015;49(1):148–159156
school-based physical activity interventions, includingthose targeting PE, can successfully increase physicalactivity levels among children and adolescents.11,92–96
This paper demonstrates the positive impact of an activePE policy, at a cost that appears reasonable compared toalternative approaches for increasing physical activityamong children.
The authors thank the stakeholder group for their guidanceand direction, and acknowledge the Assessing Cost Effective-ness team for their role in developing the modeling framework.This work was supported in part by grants from the RobertWood Johnson Foundation (number 66284); the Donald andSue Pritzker Nutrition and Fitness Initiative; and the JPBFoundation and is a product of a Centre for ResearchExcellence in Obesity Policy and Food Systems supported bythe Australian National Health and Medical Research Centre(grant number 1041020) and a Prevention Research Centersupported by Cooperative Agreement U48/DP00064-00S1
from CDC, including the Nutrition and Obesity Policy,Research and Evaluation Network. The findings and conclu-sions in this report are those of the author(s) and do notnecessarily represent the official position of CDC.No financial disclosures were reported by the authors of
this paper.
References1. Physical Activity Guidelines Advisory Committee. Physical Activity
Guidelines Advisory Committee Report, 2008. Washington, DC:USDHHS; 2008.
2. Lees C, Hopkins J. Effect of aerobic exercise on cognition, academicachievement, and psychosocial function in children: a systematicreview of randomized control trials. Prev Chronic Dis. 2013;10:E174.http://dx.doi.org/10.5888/pcd10.130010.
3. Fedewa AL, Ahn S. The effects of physical activity and physical fitnesson children’s achievement and cognitive outcomes: a meta-analysis.Res Q Exerc Sport. 2011;82(3):521–535. http://dx.doi.org/10.1080/02701367.2011.10599785.
www.ajpmonline.org
Barrett et al / Am J Prev Med 2015;49(1):148–159 157
4. Malina RM. Physical activity and fitness: Pathways from childhood toadulthood. Am J Hum Biol. 2001;13(2):162–172. http://dx.doi.org/10.1002/1520-6300(200102/03)13:2o162::AID-AJHB102543.0.CO;2-T.
5. Telama R. Tracking of physical activity from childhood to adulthood: areview. Obes Facts. 2009;2(3):187–195. http://dx.doi.org/10.1159/000222244.
6. Biddle SJH, Atkin AJ, Cavill N, Foster C. Correlates of physical activityin youth: a review of quantitative systematic reviews. Int Rev SportExerc Psychol. 2011;4(1):25–49. http://dx.doi.org/10.1080/1750984X.2010.548528.
7. Williams HG, Pfeiffer KA, O’Neill JR, et al. Motor skill performanceand physical activity in preschool children. Obesity (Silver Spring).2008;16(6):1421–1426. http://dx.doi.org/10.1038/oby.2008.214.
8. Lubans D, Morgan P, Cliff D, Barnett L, Okely A. Fundamentalmovement skills in children and adolescents: review of associatedhealth benefits. Sports Med. 2010;40(12):1019–1035. http://dx.doi.org/10.2165/11536850-000000000-00000.
9. Wrotniak BH, Epstein LH, Dorn JM, Jones KE, Kondilis VA. Therelationship between motor proficiency and physical activity inchildren. Pediatrics. 2006;118(6):E1758–E1765. http://dx.doi.org/10.1542/peds.2006-0742.
10. Barnett LM, Van Beurden E, Morgan PJ, Brooks LO, Beard JR.Childhood motor skill proficiency as a predictor of adolescent physicalactivity. J Adolesc Health. 2009;44(3):252–259. http://dx.doi.org/10.1016/j.jadohealth.2008.07.004.
11. Dobbins M, Husson H, DeCorby K, LaRocca RL. School-basedphysical activity programs for promoting physical activity and fitnessin children and adolescents aged 6 to 18. Cochrane Database Syst Rev.2013;2:CD007651.
12. Harris KC, Kuramoto LK, Schulzer M, Retallack JE. Effect of school-based physical activity interventions on body mass index in children: ameta-analysis. CMAJ. 2009;180(7):719–726. http://dx.doi.org/10.1503/cmaj.080966.
13. Guerra PH, Nobre MR, Silveira JA, Taddei JA. The effect of school-based physical activity interventions on body mass index: a meta-analysis of randomized trials. Clinics (Sao Paulo). 2013;68(9):1263–1273. http://dx.doi.org/10.6061/clinics/2013(09)14.
14. Wilks DC, Besson H, Lindroos AK, Ekelund U. Objectively measuredphysical activity and obesity prevention in children, adolescents andadults: a systematic review of prospective studies. Obes Rev. 2011;12(5):e119–e129.
15. Metcalf BS, Hosking J, Jeffery AN, Voss LD, Henley W, Wilkin TJ.Fatness leads to inactivity, but inactivity does not lead to fatness: alongitudinal study in children (EarlyBird 45). Arch Dis Child. 2011;96(10):942–947. http://dx.doi.org/10.1136/adc.2009.175927.
16. Fisher A, Hill C, Webber L, Purslow L, Wardle J. MVPA is associatedwith lower weight gain in 8-10 year old children: a prospective studywith 1 year follow-up. PLoS One. 2011;6(4):e18576. http://dx.doi.org/10.1371/journal.pone.0018576.
17. Riddoch CJ, Leary SD, Ness AR, et al. Prospective associations betweenobjective measures of physical activity and fat mass in 12-14 year oldchildren: the Avon Longitudinal Study of Parents and Children(ALSPAC). BMJ. 2009;339:b4544. http://dx.doi.org/10.1136/bmj.b4544.
18. Basterfield L, Pearce MS, Adamson AJ, et al. Physical activity, sedentarybehavior, and adiposity in English children. Am J Prev Med. 2012;42(5):445–451. http://dx.doi.org/10.1016/j.amepre.2012.01.007.
19. Kriemler S, Zahner L, Schindler C, et al. Effect of school based physicalactivity programme (KISS) on fitness and adiposity in primaryschoolchildren: cluster randomised controlled trial. BMJ. 2010;340:c785. http://dx.doi.org/10.1136/bmj.c785.
20. Mitchell JA, Pate RR, España-Romero V, O’Neill JR, Dowda M, NaderPR. Moderate-to-vigorous physical activity is associated with decreasesin body mass index from ages 9 to 15 years. Obesity (Silver Spring).2013;21(3):E280–E293. http://dx.doi.org/10.1002/oby.20118.
July 2015
21. USDHHS. 2008 Physical Activity Guidelines for Americans. Washing-ton, DC: USDHHS; 2008.
22. Troiano RP, Berrigan D, Dodd KW, Masse LC, Tilert T, McDowell M.Physical activity in the United States measured by accelerometer. MedSci Sports Exerc. 2008;40(1):181–188. http://dx.doi.org/10.1249/mss.0b013e31815a51b3.
23. IOM. Educating the Student Body: Taking Physical Activity andPhysical Education to School. Washington, DC: National AcademiesPress; 2013.
24. Lee SM, Burgeson CR, Fulton JE, Spain CG. Physical education andphysical activity: results from the School Health Policies and ProgramsStudy 2006. J Sch Health. 2007;77(8):435–463. http://dxdoi.org/10.1111/j.1746-1561.2007.00229.x.
25. CDC, Bridging the Gap Research Program. Strategies for SupportingQuality Physical Education and Physical Activity in Schools. Atlanta,GA: USDHHS; 2014.
26. Turner L, Chaloupka FJ, Sandoval A. School Policies and Practices forImproving Children’s Health: National Elementary School SurveyResults: School Years 2006-07 through 2009-10. Vol. 2. Chicago, IL:Bridging the Gap Program, Health Policy Center, Institute for HealthResearch and Policy, University of Illinois at Chicago; 2012.
27. Turner L, Chaloupka FJ, Chriqui JF, Sandoval A. School Policies andPractices to Improve Health and Prevent Obesity: National ElementarySchool Survey Results: School Years 2006–07 and 2007–08. Vol 1.Chicago, IL: Bridging the Gap Program, Health Policy Center, Institutefor Health Research and Policy, University of Illinois at Chicago, 2010.
28. Nader PR. National Institute of Child Health and Human Develop-ment Study of Early Child Care and Youth Development Network.Frequency and intensity of activity of third-grade children in physicaleducation. Arch Pediatr Adolesc Med. 2003;157(2):185–190.http://dx.doi.org/10.1001/archpedi.157.2.185.
29. McKenzie TL, Nader PR, Strikmiller PK, et al. School physical education:effect of the Child and Adolescent Trial for Cardiovascular Health. PrevMed. 1996;25(4):423–431. http://dx.doi.org/10.1006/pmed.1996.0074.
30. Sallis JF, McKenzie TL, Alcaraz JE, Kolody B, Faucette N, Hovell MF.The effects of a 2-year physical education program (SPARK) onphysical activity and fitness in elementary school students. Sports, Playand Active Recreation for Kids. Am J Public Health. 1997;87(8):1328–1334. http://dx.doi.org/10.2105/AJPH.87.8.1328.
31. UCLA Center to Eliminate Health Disparities, Samuels & Associates.Failing Fitness: Physical Activity and Physical Education in Schools. LosAngeles, CA: The California Endowment; 2007. www.calendow.org.
32. Skala KA, Springer AE, Sharma SV, Hoelscher DM, Kelder SH.Environmental characteristics and student physical activity in PE class:findings from two large urban areas of Texas. J Phys Act Health. 2012;9(4):481–491.
33. McKenzie TL, Feldman H, Woods SE, et al. Children’s activity levels andlesson context during third-grade physical education. Res Q Exerc Sport.1995;66(3):184–193. http://dx.doi.org/10.1080/02701367.1995.10608832.
34. McKenzie TL, Stone EJ, Feldman HA, et al. Effects of the CATCH physicaleducation intervention: teacher type and lesson location. Am J Prev Med.2001;21(2):101–109. http://dx.doi.org/10.1016/S0749-3797(01)00335-X.
35. Lonsdale C, Rosenkranz RR, Peralta LR, Bennie A, Fahey P, LubansDR. A systematic review and meta-analysis of interventions designedto increase moderate-to-vigorous physical activity in school physicaleducation lessons. Prev Med. 2013;56(2):152–161. http://dx.doi.org/10.1016/j.ypmed.2012.12.004.
36. Dowda M, James F, Sallis JF, McKenzie TL, Rosengard P, Kohl HW.Evaluating the sustainability of SPARK physical education: a case studyof translating research into practice. Res Q Exerc Sport. 2005;76(1):11–19.
37. McKenzie TL, Sallis JF, Rosengard P. Beyond the stucco tower: design,development, and dissemination of the SPARK physical educationprograms. Quest. 2009;61(1):114–127. http://dx.doi.org/10.1080/00336297.2009.10483606.

Barrett et al / Am J Prev Med 2015;49(1):148–159158
38. McKenzie TL, Li D, Derby CA, Webber LS, Luepker RV, Cribb P.Maintenance of effects of the CATCH physical education program: resultsfrom the CATCH-ON study. Health Educ Behav. 2003;30(4):447–462.http://dx.doi.org/10.1177/1090198103253535.
39. Hoelscher DM, Feldman HA, Johnson CC, et al. School-based healtheducation programs can be maintained over time: results from theCATCH Institutionalization study. Prev Med. 2004;38(5):594–606.http://dx.doi.org/10.1016/j.ypmed.2003.11.017.
40. Heath EM, Coleman KJ. Evaluation of the institutionalization of thecoordinated approach to child health (CATCH) in a U.S./Mexico bordercommunity. Health Educ Behav. 2002;29(4):444–460. http://dx.doi.org/10.1177/109019810202900405.
41. CATCH for Schools K-8. www.catchusa.org/catchschools.htm.42. SPARK. www.sparkpe.org/.43. Chriqui JF, Resnick EA, Schneider L, et al. School District Wellness
Policies: Evaluating Progress and Potential for Improving Children’sHealth Five Years after the Federal Mandate. School Years 2006–07through 2010-11. Chicago, IL: Bridging the Gap Program, HealthPolicy Center, Institute for Health Research and Policy, University ofIllinois at Chicago; 2013.
44. Eyler AA, Brownson RC, Aytur SA, et al. Examination of trends andevidence-based elements in state physical education legislation: acontent analysis. J Sch Health. 2010;80(7):326–332. http://dx.doi.org/10.1111/j.1746-1561.2010.00509.x.
45. Carlson JA, Sallis JF, Chriqui JF, Schneider L, McDermid LC, Agron P.State policies about physical activity minutes in physical education orduring school. J Sch Health. 2013;83(3):150–156. http://dx.doi.org/10.1111/josh.12010.
46. Levi J, Vinter S, Richardson L, Laurent R, Segal LM. F as in Fat: HowObesity Policies Are Failing in America 2009 (Supplement). Washington,DC: Trust for America’s Health, RobertWood Johnson Foundation; 2009.
47. Cradock AL, Barrett JL, Carnoske C, et al. Roles and strategies of stateorganizations related to school-based physical education and physicalactivity policies. J Public Health Manag Pract. 2013;19(3)(suppl 1):S34–S40. http://dx.doi.org/10.1097/PHH.0b013e3182840da2.
48. Wu S, Cohen D, Shi Y, Pearson M, Sturm R. Economic analysis ofphysical activity interventions. Am J Prev Med. 2011;40(2):149–158.http://dx.doi.org/10.1016/j.amepre.2010.10.029.
49. Forster M, Veerman JL, Barendregt JJ, Vos T. Cost-effectiveness ofdiet and exercise interventions to reduce overweight and obesity. Int JObes (Lond). 2011;35(8):1071–1078. http://dx.doi.org/10.1038/ijo.2010.246.
50. Roux L, Pratt M, Tengs TO, et al. Cost effectiveness of community-based physical activity interventions. Am J Prev Med. 2008;35(6):578–588. http://dx.doi.org/10.1016/j.amepre.2008.06.040.
51. Müller-Riemenschneider F, Reinhold T, Willich SN. Cost-effectivenessof interventions promoting physical activity. Br J Sports Med. 2009;43(1):70–76. http://dx.doi.org/10.1136/bjsm.2008.053728.
52. Haby MM, Vos T, Carter R, et al. A new approach to assessing thehealth benefit from obesity interventions in children and adolescents:the assessing cost-effectiveness in obesity project. Int J Obes (Lond).2006;30(10):1463–1475. http://dx.doi.org/10.1038/sj.ijo.0803469.
53. Carter R, Vos T, Moodie M, HabyM,Magnus A, Mihalopoulos C. Prioritysetting in health: Origins, description and application of the Assessing CostEffectiveness (ACE) Initiative. Expert Rev Pharmacoecon Outcomes Res.2008;8:593–617. http://dx.doi.org/10.1586/14737167.8.6.593.
54. Drummond M, Scuplher M, Torrance G, O’Brien B, Stoddard G.Methods for the Economic Evaluation of Health Care Programmes.Oxford: Oxford University Press; 2005.
55. Gortmaker SL, Long MW, Resch SC. Cost effectiveness of childhoodobesity interventions: evidence and methods for CHOICES. Am J PrevMed. 2015;49(1):102–111.
56. Vos T, Carter R, Barendregt J, et al. Assessing Cost-Effectiveness inPrevention (ACE-Prevention): Final Report. Melbourne: University ofQueensland, Brisbane and Deakin University; 2010.
57. Guyatt GH, Oxman AD, Vist GE, et al. GRADE: what is "quality ofevidence" and why is it important to clinicians? Br Med J. 2008;336(7651):995–999B. http://dx.doi.org/10.1136/bmj.39490.551019.BE.
58. Green JPH, ed. Cochrane Handbook for Systematic Reviews ofInterventions. Version 5.2.10: The Cochrane Collaboration; 2011.
59. Finkelstein EA, Trogdon JG. Public health interventions for addressingchildhood overweight: analysis of the business case. Am J Public Health.2008;98(3):411–415. http://dx.doi.org/10.2105/AJPH.2007.114991.
60. Segal L, Dalziel K. Economic evaluation of obesity interventions in childrenand adults. Int J Obes (Lond). 2007;31(7):1183–11814; author reply 1185.
61. U.S. Census Bureau. 2012 National Population Projections. www.census.gov/population/projections/data/national/2012/downloadablefiles.html.
62. U.S. Department of Education. Digest of Education Statistics 2013.www.nces.ed.gov/programs/digest/2013menu_tables.asp.
63. U.S. Department of Education, National Center for Education Statistics.Common Core of Data (CCD), Public Elementary/Secondary SchoolUniverse Survey Data, 2011-12. www.nces.ed.gov/ccd/pubschuniv.asp.
64. Long MW, Sobol AM, Cradock AL, Subramanian SV, Blendon RJ,Gortmaker SL. School-day and overall physical activity among youth.Am J Prev Med. 2013;45(2):150–157. http://dx.doi.org/10.1016/j.amepre.2013.03.011.
65. Baggett CD, Stevens J, Catellier DJ, et al. Compensation or displacement ofphysical activity in middle-school girls: the Trial of Activity for AdolescentGirls. Int J Obes (Lond). 2010;34(7):1193–1199. http://dx.doi.org/10.1038/ijo.2010.31.
66. Goodman A, Mackett RL, Paskins J. Activity compensation andactivity synergy in British 8-13 year olds. Prev Med. 2011;53(4–5):293–298. http://dx.doi.org/10.1016/j.ypmed.2011.07.019.
67. Dale D, Corbin CB, Dale KS. Restricting opportunities to be activeduring school time: do children compensate by increasing physicalactivity levels after school? Res Q Exerc Sport. 2000;71(3):240–248. http://dx.doi.org/10.1080/02701367.2000.10608904.
68. Morgan CF, Beighle A, Pangrazi RP. What are the contributory andcompensatory relationships between physical education and physicalactivity in children? Res Q Exerc Sport. 2007;78(5):407–412.http://dx.doi.org/10.1080/02701367.2007.10599440.
69. Hall KD, Butte NF, Swinburn BA, Chow CC. Dynamics of childhoodgrowth and obesity: development and validation of a quantitativemathematical model. Lancet Diabetes Endocrinol. 2013;1(2):97–105.http://dx.doi.org/10.1016/S2213-8587(13)70051-2.
70. Gold MR, Siegel JE, Russell LB, Weinstein MC. Cost-effectiveness inHealth and Medicine. New York: Oxford University Press; 1996.
71. Gortmaker SL, Swinbum BA, Levy D, et al. Obesity 4 Changing thefuture of obesity: science, policy, and action. Lancet. 2011;378(9793):838–847. http://dx.doi.org/10.1016/S0140-6736(11)60815-5.
72. Carter R, Moodie M, Markwick A, et al. Assessing Cost-Effectiveness inObesity (ACE-Obesity): an overview of the ACE approach, economicmethods and cost results. BMC Public Health. 2009;9:419.http://dx.doi.org/10.1186/1471-2458-9-419.
73. Vos T, Carter R, Doran C, Anderson I, Lopez A, Wilson A. ACE-Prevention Project 2005-09. Economic Evaluation Protocol. 2007.
74. CDC. Results From the School Health Policies and Practices Study 2012.Atlanta, GA: Adolescent and School Health, CDC; 2013. http://dx.doi.org/10.1186/1472-6963-14-44.
75. Office of the New York State Comptroller. School Districts’ ComplianceWith Physical Education Regulations. Albany, NY: Office of the NewYork State Comptroller, Division of Local Government and SchoolAccountability; 2008.
76. Health Impact Assessment Group, UCLA School of Public Health.Health Impact Assessment (HIA) of Potential Modifications to PhysicalEducation Requirements in California. Los Angeles, CA: UCLA Schoolof Public Health; June 9, 2007.
77. Wright DR, Taveras EM, Gillman MW, et al. The cost of a primarycare-based childhood obesity prevention intervention. BMC HealthServ Res. 2014;14:44.
www.ajpmonline.org

Barrett et al / Am J Prev Med 2015;49(1):148–159 159
78. Black JA, White B, Viner RM, Simmons RK. Bariatric surgery for obesechildren and adolescents: a systematic review and meta-analysis. ObesRev. 2013;14(8):634–644. http://dx.doi.org/10.1111/obr.12037.
79. Weiner JP, Goodwin SM, Chang HY, et al. Impact of bariatric surgeryon health care costs of obese persons: a 6-year follow-up of surgical andcomparison cohorts using health plan data. JAMA Surg. 2013;148(6):555–562. http://dx.doi.org/10.1001/jamasurg.2013.1504.
80. Moodie M, Haby M, Galvin L, Swinburn B, Carter R. Cost-effective-ness of active transport for primary school children—Walking SchoolBus program. Int J Behav Nutr Phys Act. 2009;6:63. http://dx.doi.org/10.1186/1479-5868-6-63.
81. Moodie ML, Carter RC, Swinburn BA, Haby MM. The cost-effective-ness of Australia’s Active After-School Communities program. Obesity(Silver Spring). 2010;18(8):1585–1592. http://dx.doi.org/10.1038/oby.2009.401.
82. Moodie M, Haby MM, Swinburn B, Carter R. Assessing cost-effectiveness in obesity: active transport program for primary schoolchildren—TravelSMART Schools Curriculum program. J Phys ActHealth. 2011;8(4):503–515.
83. Parsad B, Lewis L. Calories In, Calories Out: Food and Exercise inPublic Elementary Schools, 2005 (NCES 2006-057). Washington, DC:National Center for Education Statistics, U.S. Department of Education;2006.
84. San Diego State University. Physical Education Matters. Los Angeles,CA: The California Endowment, January 2007. www.calendow.org.
85. Barroso CS, McCullum-Gomez C, Hoelscher DM, Kelder SH, MurrayNG. Self-reported barriers to quality physical education by physicaleducation specialists in Texas. J Sch Health. 2005;75(8):313–319.http://dx.doi.org/10.1111/j.1746-1561.2005.tb07348.x.
86. Kelder SH, Mitchell PD, McKenzie TL, et al. Long-term implementa-tion of the CATCH physical education program. Health Educ Behav.2003;30(4):463–475. http://dx.doi.org/10.1177/1090198103253538.
87. U.S. Department of Education. NCES Schools and Staffing Survey /Teacher Follow up Survey 2008-2009. www.nces.ed.gov/surveys/sass/tables/tfs0809_021_cf1n.asp.
88. Carson RL, Castelli DM, Pulling Kuhn AC, et al. Impact of trainedchampions of comprehensive school physical activity programs onschool physical activity offerings, youth physical activity and sedentarybehaviors. Prev Med. 2014;69(suppl 1):S12–S19. http://dx.doi.org/10.1016/j.ypmed.2014.08.025.
July 2015
89. Clarke J, Fletcher B, Lancashire E, Pallan M, Adab P. The views ofstakeholders on the role of the primary school in preventing childhoodobesity: a qualitative systematic review. Obes Rev. 2013;14(12):975–988.http://dx.doi.org/10.1111/obr.12058.
90. Lee IM, Shiroma EJ, Lobelo F, et al. Effect of physical inactivity onmajornon-communicable diseases worldwide: an analysis of burden of diseaseand life expectancy. Lancet. 2012;380(9838):219–229. http://dx.doi.org/10.1016/S0140-6736(12)61031-9.
91. Wen CP, Wai JP, Tsai MK, et al. Minimum amount of physical activityfor reduced mortality and extended life expectancy: a prospectivecohort study. Lancet. 2011;378(9798):1244–1253. http://dx.doi.org/10.1016/S0140-6736(11)60749-6.
92. Brown T, Summerbell C. Systematic review of school-based interven-tions that focus on changing dietary intake and physical activity levelsto prevent childhood obesity: an update to the obesity guidanceproduced by the National Institute for Health and Clinical Excellence.Obes Rev. 2009;10(1):110–141. http://dx.doi.org/10.1111/j.1467-789X.2008.00515.x.
93. Kahn EB, Ramsey LT, Brownson RC, et al. The effectiveness ofinterventions to increase physical activity. A systematic review. Am JPrev Med. 2002;22(4)(suppl):73–107. http://dx.doi.org/10.1016/S0749-3797(02)00434-8.
94. Salmon J, Booth ML, Phongsavan P, Murphy N, Timperio A.Promoting physical activity participation among children and adoles-cents. Epidemiol Rev. 2007;29:144–159. http://dx.doi.org/10.1093/epirev/mxm010.
95. Doak CM, Visscher TL, Renders CM, Seidell JC. The prevention ofoverweight and obesity in children and adolescents: a review ofinterventions and programmes. Obes Rev. 2006;7(1):111–136. http://dx.doi.org/10.1111/j.1467-789X.2006.00234.x.
96. Flodmark CE, Marcus C, Britton M. Interventions to prevent obesity inchildren and adolescents: a systematic literature review. Int J Obes(Lond). 2006;30(4):579–589. http://dx.doi.org/10.1038/sj.ijo.0803290.
Appendix
Supplementary data
Supplementary data associated with this article can be found athttp://dx.doi.org/10.1016/j.amepre.2015.02.005.