Embed Size (px)
Citation preview
Cost-effectiveness Cost-effectiveness Analysis: Analysis:
Overview & Developing an Overview & Developing an analysisanalysis
Training in Clinical ResearchTraining in Clinical Research
UCSF Department of EpidemiologyUCSF Department of Epidemiology and Biostatistics and Biostatistics
Jim G. KahnJim G. Kahn
26 January 201226 January 2012
OutlineOutline
OverviewOverview
Components of cost-effectiveness analysisComponents of cost-effectiveness analysis
Steps in cost-effectiveness analysisSteps in cost-effectiveness analysis
Implications of CEAImplications of CEA

Why do cost-Why do cost-effectiveness analysis?effectiveness analysis?

Why do cost-Why do cost-effectiveness analysis?effectiveness analysis?
• Resource allocation is a reality:Resource allocation is a reality:
among social goods, within health careamong social goods, within health care• $ for one intervention decreases $ for another – via $ for one intervention decreases $ for another – via
budgetsbudgets• We don’t like to spend huge $ on health care that We don’t like to spend huge $ on health care that
hardly workshardly works
• Use health care $ to do most good: CEA is a measure Use health care $ to do most good: CEA is a measure of efficiencyof efficiency
efficient allocation saves lives, improves healthefficient allocation saves lives, improves health
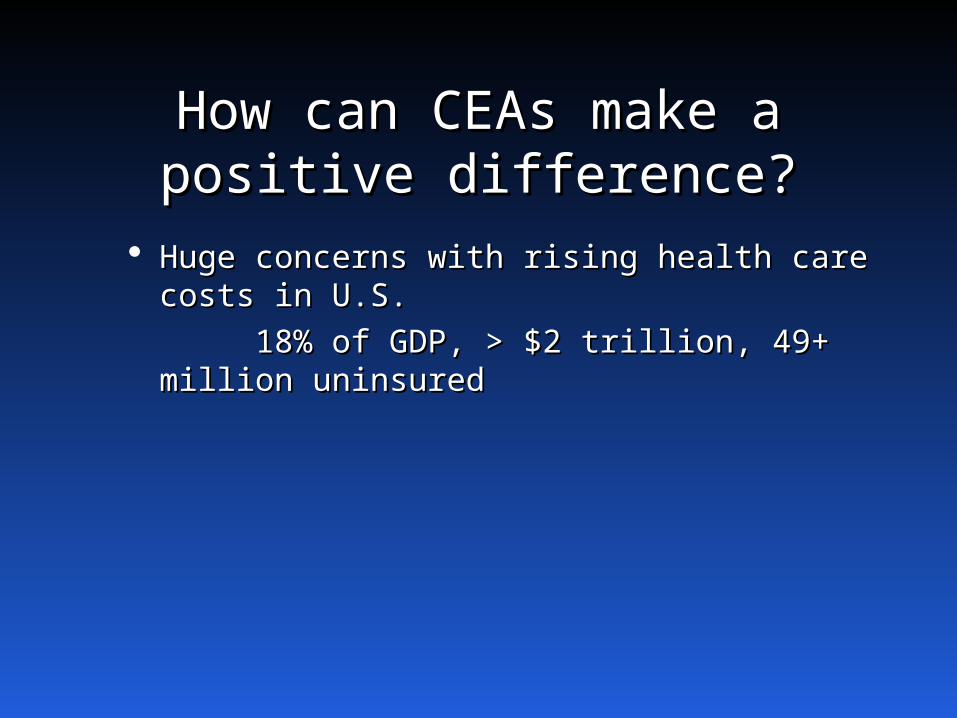
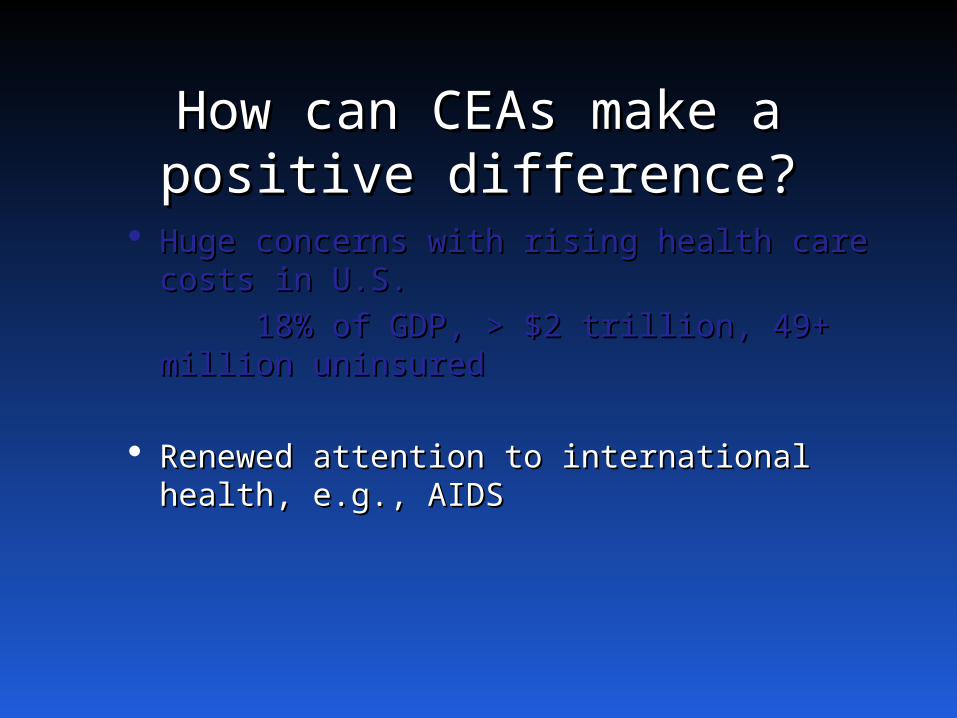
How can CEAs make a How can CEAs make a positive difference?positive difference?
Huge concerns with rising health care costs Huge concerns with rising health care costs in U.S.in U.S.
18% of GDP, > $2 trillion, 49+ million 18% of GDP, > $2 trillion, 49+ million uninsureduninsured

How can CEAs make a How can CEAs make a positive difference?positive difference?
Huge concerns with rising health care costs Huge concerns with rising health care costs in U.S.in U.S.
18% of GDP, > $2 trillion, 49+ million 18% of GDP, > $2 trillion, 49+ million uninsureduninsured
Renewed attention to international health, Renewed attention to international health, e.g., AIDSe.g., AIDS
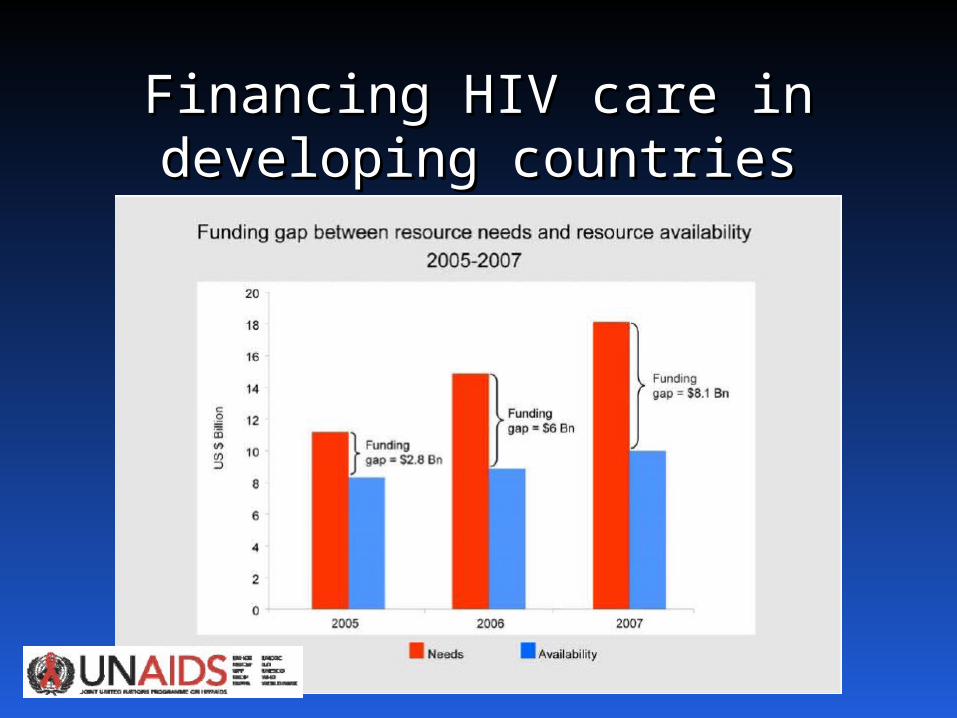
Financing HIV care in Financing HIV care in developing countriesdeveloping countries
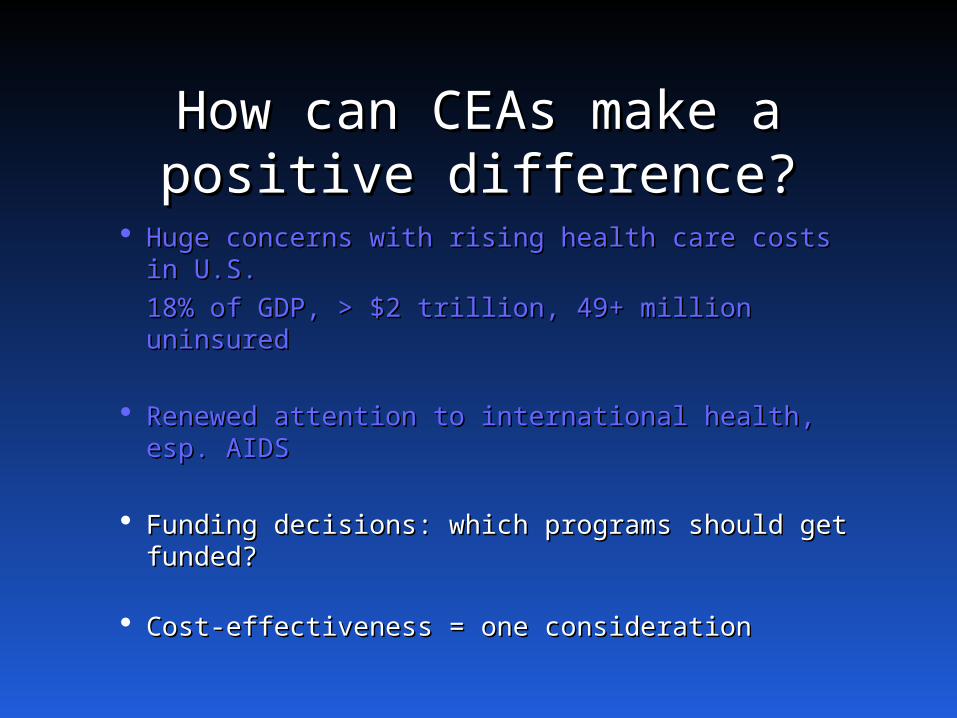
How can CEAs make a How can CEAs make a positive difference?positive difference?
Huge concerns with rising health care costs in U.S.Huge concerns with rising health care costs in U.S.
18% of GDP, > $2 trillion, 49+ million 18% of GDP, > $2 trillion, 49+ million uninsureduninsured
Renewed attention to international health, esp. Renewed attention to international health, esp. AIDSAIDS
Funding decisions: which programs should get Funding decisions: which programs should get funded?funded?
Cost-effectiveness = one considerationCost-effectiveness = one consideration

Medical interventions Medical interventions need to be judged by the need to be judged by the
value they providevalue they provide


The Basic QuestionThe Basic Question
What health benefits do we getWhat health benefits do we getfor money we spend on health care?for money we spend on health care?
Cost-effectiveness Cost-effectiveness analysis in contextanalysis in context
Prior lectures on clinical decision analysis & Prior lectures on clinical decision analysis & utilitiesutilities
Now add Now add costscosts
CE Question FormulationCE Question Formulation
What What addedadded health benefits are realized health benefits are realized for each for each addedadded dollar spent on health dollar spent on health
care?care?
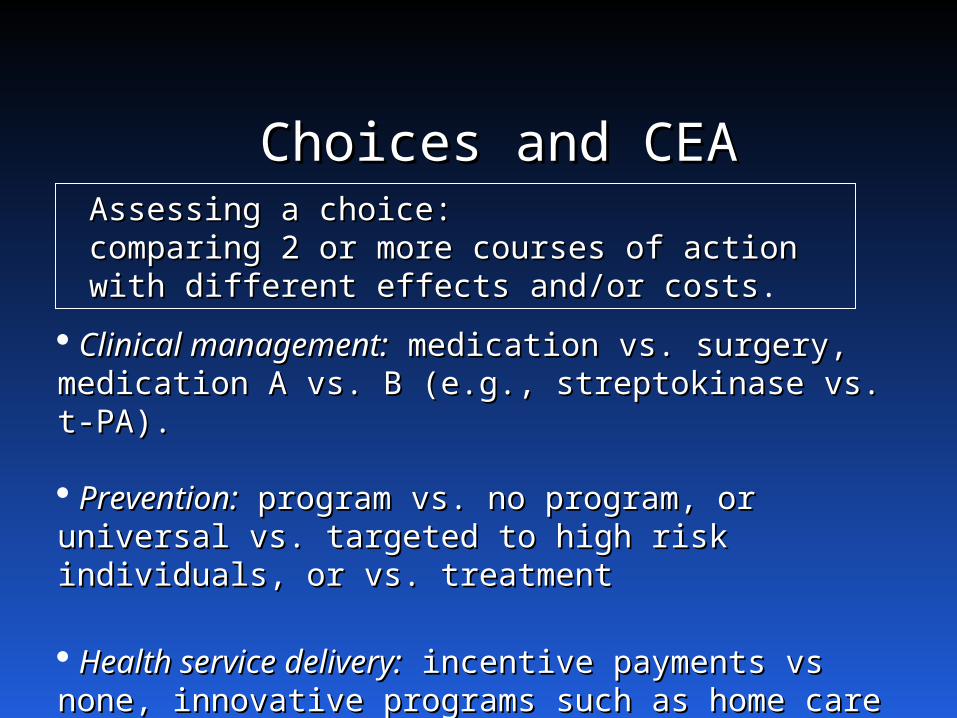
Choices and CEAChoices and CEA
Clinical management:Clinical management: medication vs. surgery, medication vs. surgery, medication A vs. B (e.g., streptokinase vs. t-PA).medication A vs. B (e.g., streptokinase vs. t-PA).
Prevention:Prevention: program vs. no program, or universal program vs. no program, or universal vs. targeted to high risk individuals, or vs. vs. targeted to high risk individuals, or vs. treatmenttreatment
Health service delivery:Health service delivery: incentive payments vs incentive payments vs none, innovative programs such as home care vs none, innovative programs such as home care vs none.none.
Assessing a choice: Assessing a choice: comparing 2 or more courses of action with comparing 2 or more courses of action with different effects and/or costsdifferent effects and/or costs.
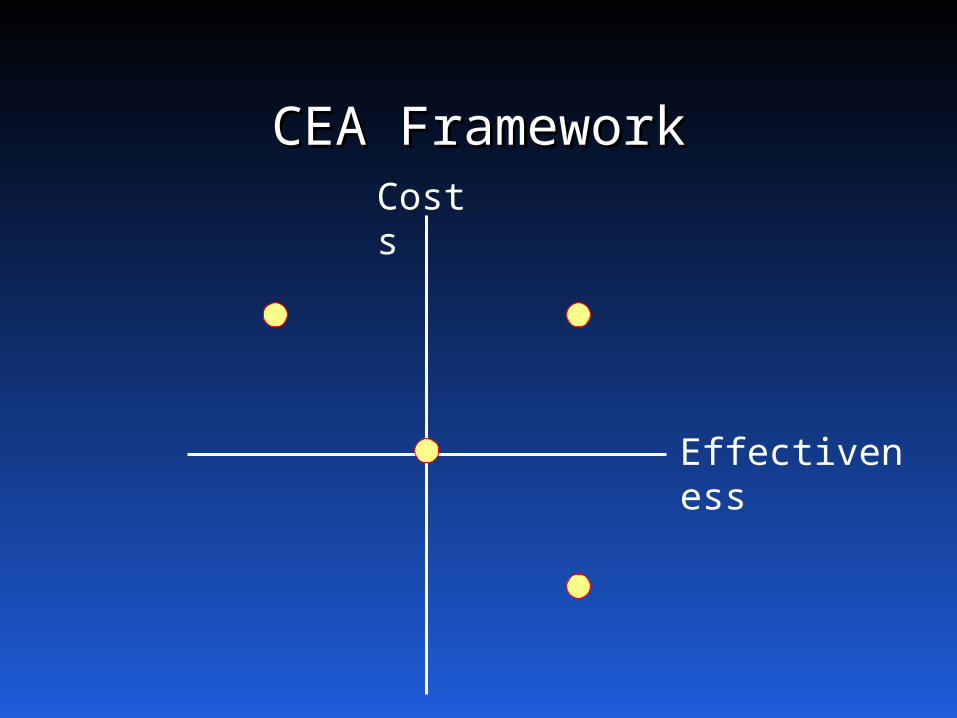
CEA FrameworkCEA FrameworkCosts
Effectiveness
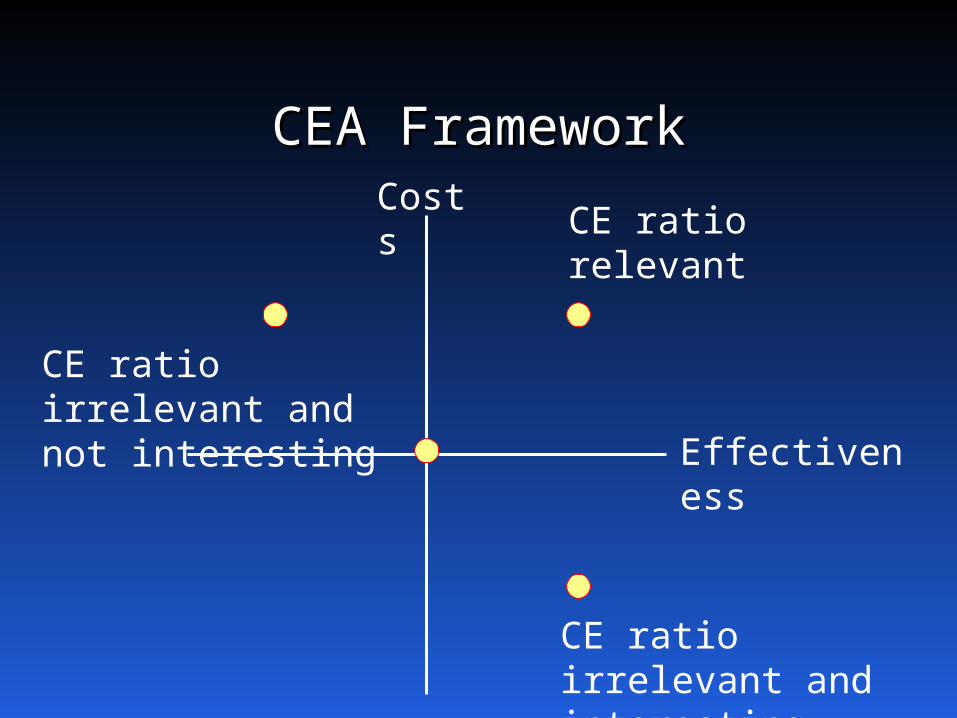
CEA FrameworkCEA FrameworkCosts
Effectiveness
CE ratio irrelevant and interesting
CE ratio irrelevant and not interesting
CE ratio relevant
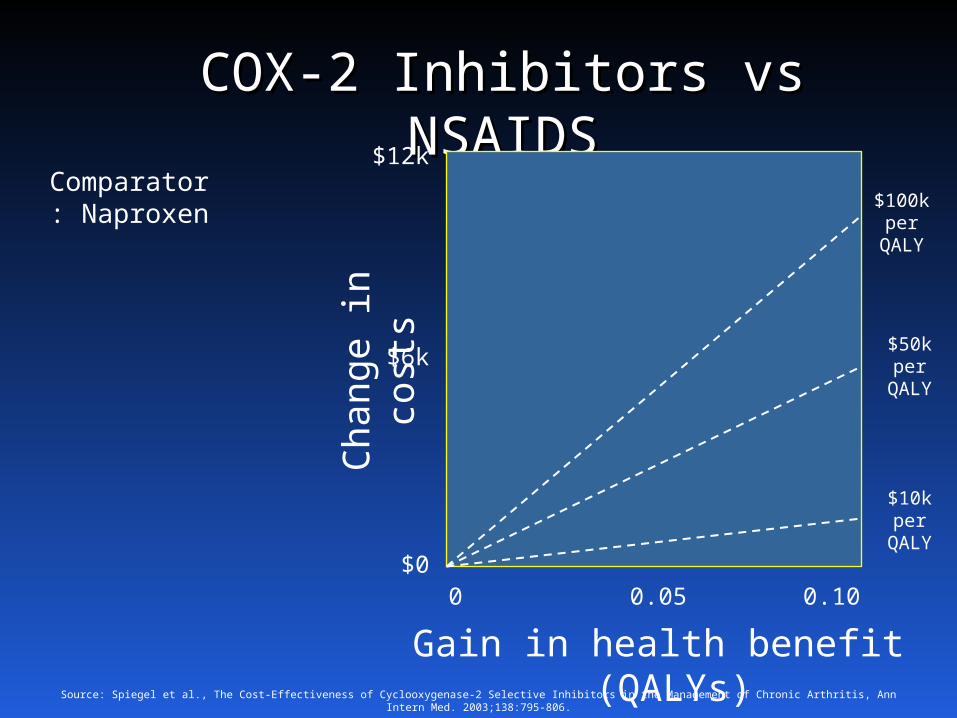
COX-2 Inhibitors vs COX-2 Inhibitors vs NSAIDSNSAIDS
Ch
ang
e in c
ost
s
Gain in health benefit (QALYs)
Comparator: Naproxen
0 0.100.05
$12k
$6k
$0
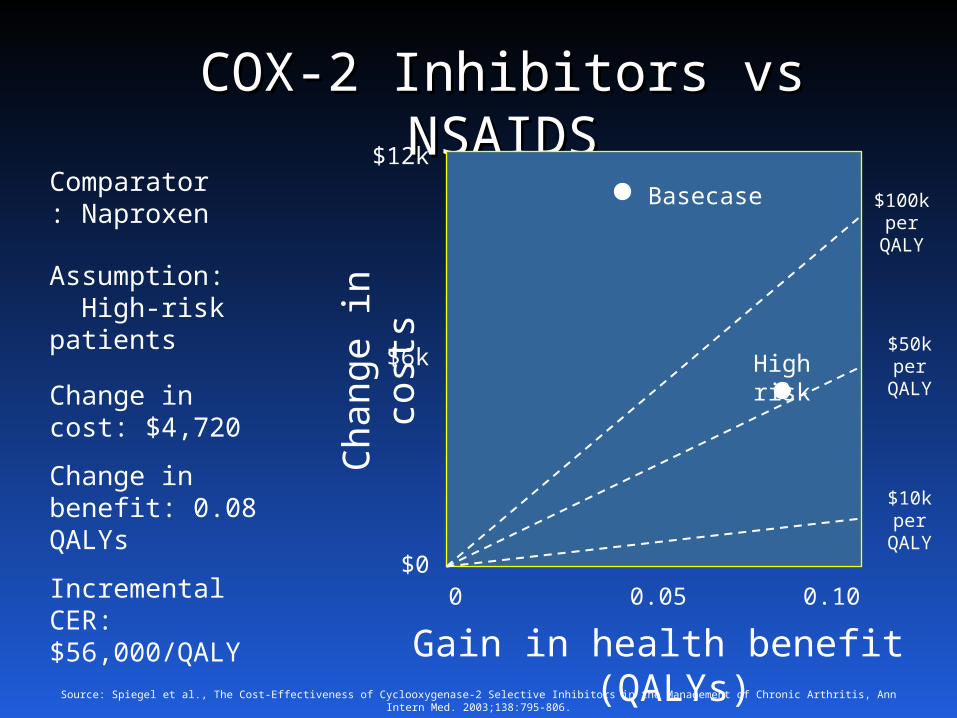
Source: Spiegel et al., The Cost-Effectiveness of Cyclooxygenase-2 Selective Inhibitors in the Management of Chronic Arthritis, Ann Intern Med. 2003;138:795-806.
$100k per
QALY
$10k per
QALY
$50k per
QALY
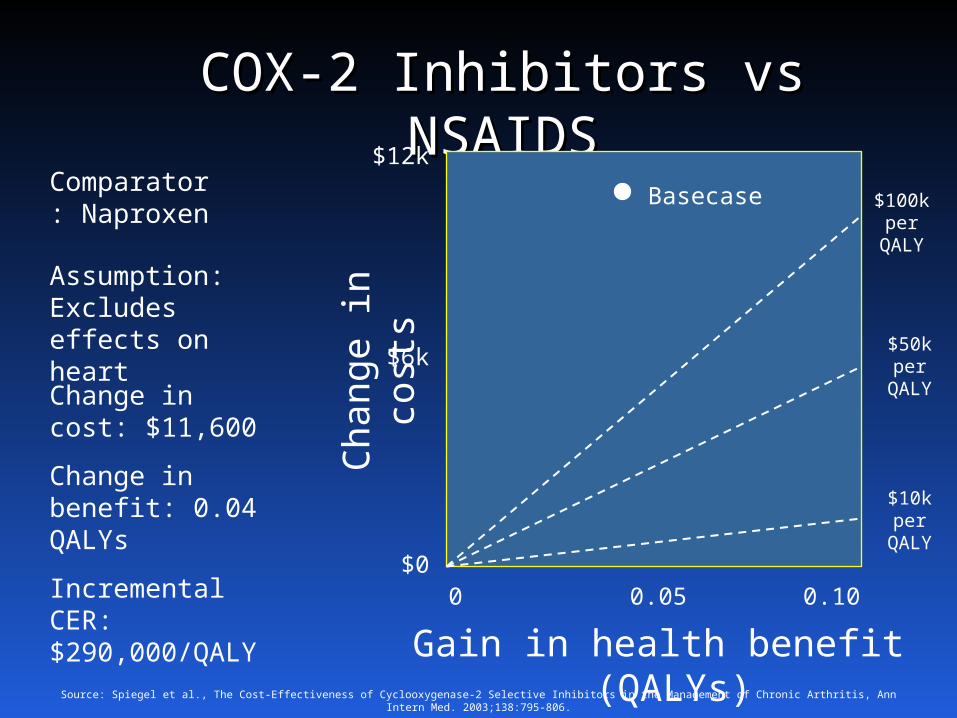
COX-2 Inhibitors vs COX-2 Inhibitors vs NSAIDSNSAIDS
Ch
ang
e in c
ost
s
Gain in health benefit (QALYs)
Comparator: Naproxen
0 0.100.05
$12k
$6k
$0
Source: Spiegel et al., The Cost-Effectiveness of Cyclooxygenase-2 Selective Inhibitors in the Management of Chronic Arthritis, Ann Intern Med. 2003;138:795-806.
$100k per
QALY
$10k per
QALY
$50k per
QALY
Assumption: Excludes effects on heart
Change in cost: $11,600
Change in benefit: 0.04 QALYs
Incremental CER: $290,000/QALY
Basecase
COX-2 Inhibitors vs COX-2 Inhibitors vs NSAIDSNSAIDS
Ch
ang
e in c
ost
s
Gain in health benefit (QALYs)
Comparator: Naproxen
0 0.100.05
$12k
$6k
$0
Source: Spiegel et al., The Cost-Effectiveness of Cyclooxygenase-2 Selective Inhibitors in the Management of Chronic Arthritis, Ann Intern Med. 2003;138:795-806.
$100k per
QALY
$10k per
QALY
$50k per
QALY
Basecase
Assumption: High-risk patients
Change in cost: $4,720
Change in benefit: 0.08 QALYs
Incremental CER: $56,000/QALY
High risk
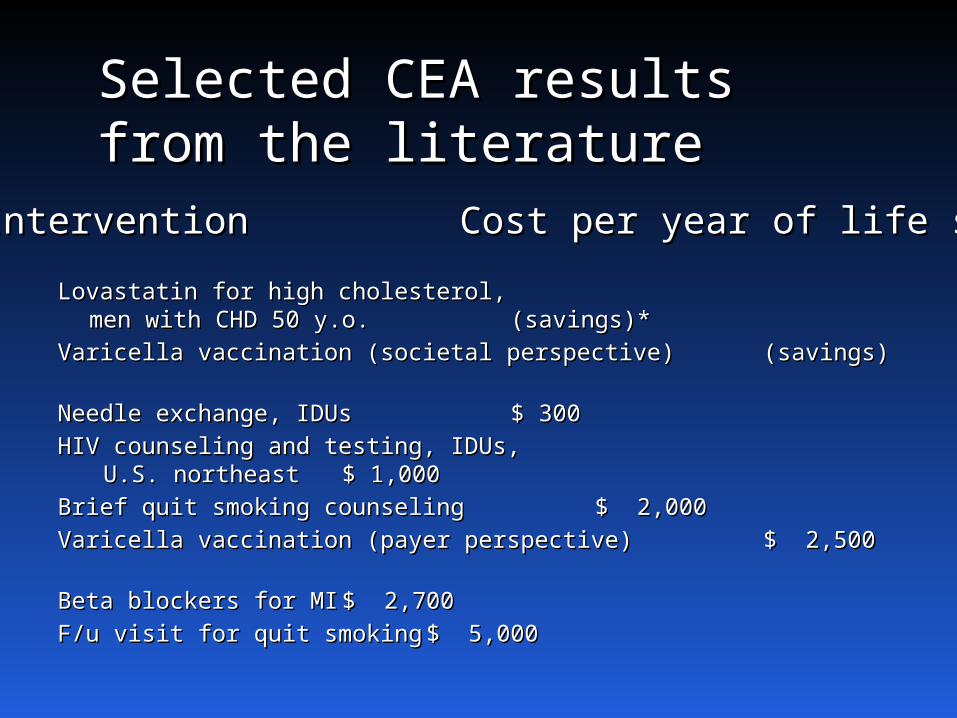
Lovastatin for high cholesterol, Lovastatin for high cholesterol, men with CHD 50 y.o.men with CHD 50 y.o. (savings)*(savings)*
Varicella vaccination (societal perspective)Varicella vaccination (societal perspective) (savings)(savings)Needle exchange, IDUsNeedle exchange, IDUs $ 300$ 300HIV counseling and testing, IDUs,HIV counseling and testing, IDUs,
U.S. northeast U.S. northeast $ 1,000$ 1,000Brief quit smoking counselingBrief quit smoking counseling $ 2,000$ 2,000Varicella vaccination (payer perspective)Varicella vaccination (payer perspective) $ 2,500$ 2,500Beta blockers for MIBeta blockers for MI $ 2,700$ 2,700F/u visit for quit smokingF/u visit for quit smoking $ 5,000$ 5,000
InterventionIntervention Cost per year of life savedCost per year of life saved
Selected CEA results Selected CEA results from the literaturefrom the literature
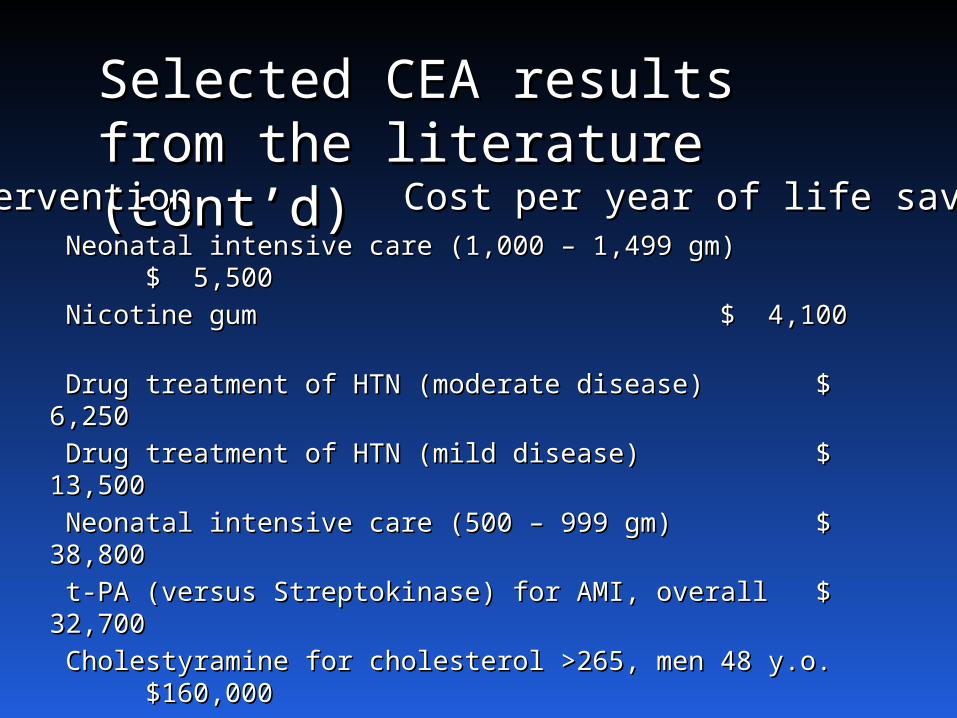
Selected CEA results Selected CEA results from the literature from the literature (cont’d)(cont’d)
Neonatal intensive care (1,000 – 1,499 gm)Neonatal intensive care (1,000 – 1,499 gm) $ $ 5,5005,500 Nicotine gumNicotine gum $ 4,100$ 4,100 Drug treatment of HTN (moderate disease)Drug treatment of HTN (moderate disease) $ $ 6,2506,250 Drug treatment of HTN (mild disease)Drug treatment of HTN (mild disease) $ 13,500$ 13,500 Neonatal intensive care (500 – 999 gm)Neonatal intensive care (500 – 999 gm) $ 38,800$ 38,800 t-PA (versus Streptokinase) for AMI, overallt-PA (versus Streptokinase) for AMI, overall $ 32,700$ 32,700 Cholestyramine for cholesterol >265, men 48 y.o.Cholestyramine for cholesterol >265, men 48 y.o.$160,000$160,000 t-PA (versus Streptokinase) for inferiort-PA (versus Streptokinase) for inferior
wall AMI, ≤40 y.o. wall AMI, ≤40 y.o. $ 203,100$ 203,100 Lovastatin for high cholesterol,Lovastatin for high cholesterol,
low-risk men 30 y.o. low-risk men 30 y.o. $ 1 million$ 1 million
InterventionIntervention Cost per year of life savedCost per year of life saved
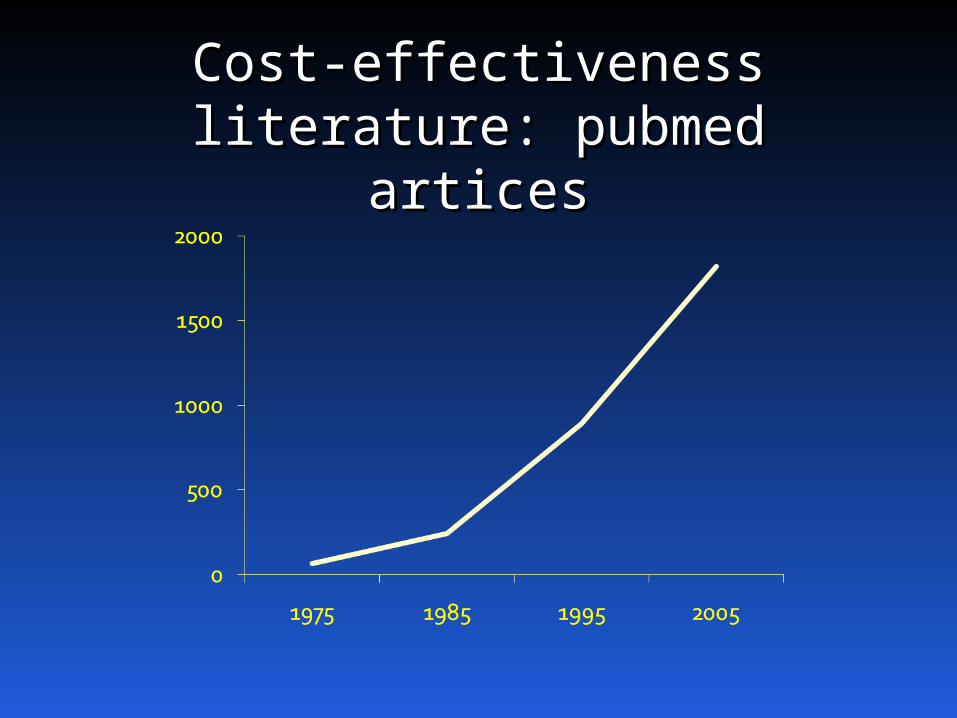
Cost-effectiveness Cost-effectiveness literature: pubmed literature: pubmed
articesartices
OutlineOutline
OverviewOverview
Components of cost-effectiveness analysisComponents of cost-effectiveness analysis
Steps in cost-effectiveness analysisSteps in cost-effectiveness analysis
Implications of CEAImplications of CEA
Two major components of CEA:Two major components of CEA:
1. Outcome measuresOutcome measures
2.2. Input dataInput data
1. Outcomes1. Outcomes
Cost-effectiveness analysis in health care Cost-effectiveness analysis in health care assesses the incremental assesses the incremental gain in health gain in health status status achievable with incremental achievable with incremental increase in health care resourcesincrease in health care resources
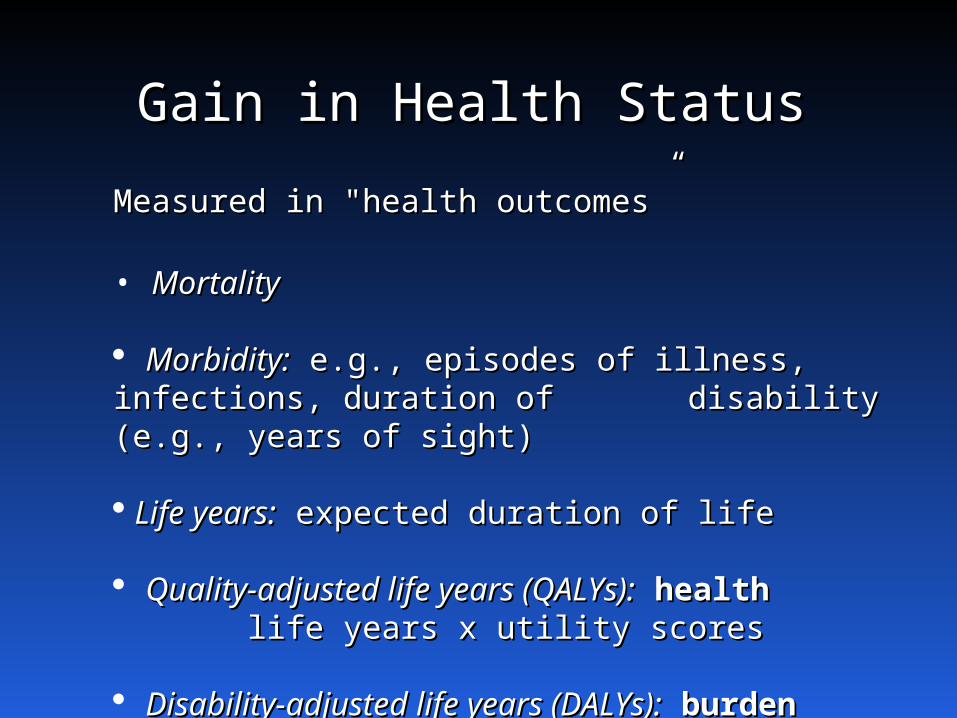
Gain in Health StatusGain in Health Status
Measured in "health outcomes”Measured in "health outcomes”
• MortalityMortality
Morbidity:Morbidity: e.g., episodes of illness, infections, e.g., episodes of illness, infections, duration of duration of disability (e.g., years of sight)disability (e.g., years of sight)
Life years:Life years: expected duration of life expected duration of life
Quality-adjusted life years (QALYs):Quality-adjusted life years (QALYs): healthhealth life years x utility scores life years x utility scores
Disability-adjusted life years (DALYs):Disability-adjusted life years (DALYs): burdenburden life years lost + life years * disability weight life years lost + life years * disability weight
Increase in health care Increase in health care resources resources
Difference in resources between less Difference in resources between less and more expensive course of action.and more expensive course of action.
Unit = dollars (or any currency), to Unit = dollars (or any currency), to allow resources of all types to be allow resources of all types to be summed and comparedsummed and compared
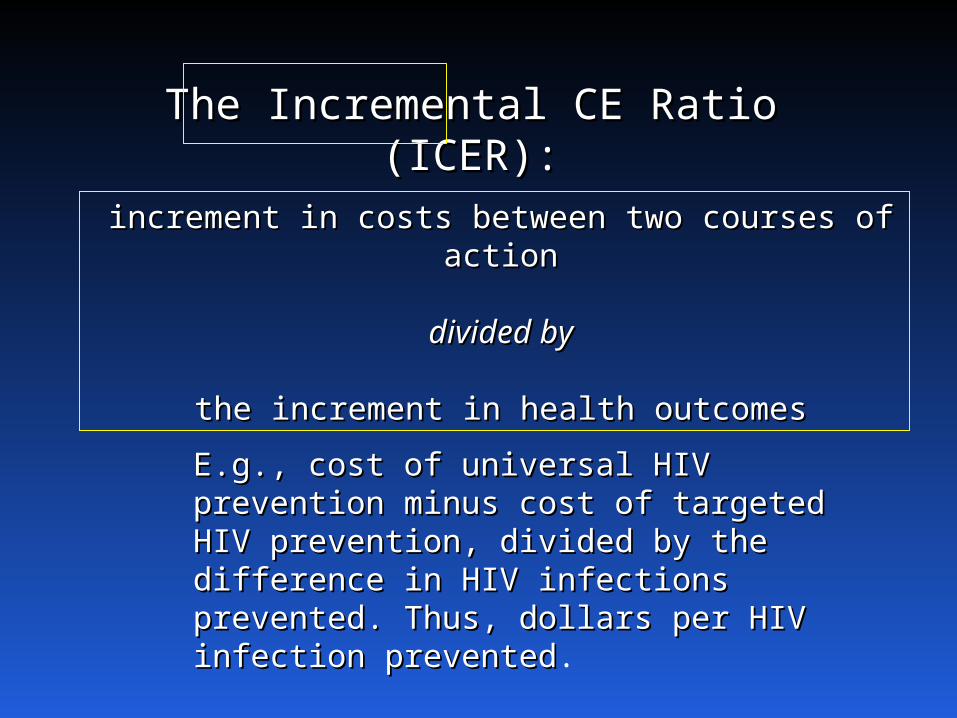
The Incremental CE Ratio The Incremental CE Ratio (ICER):(ICER):
increment in costs between two courses of actionincrement in costs between two courses of action
divided bydivided by
the increment in health outcomesthe increment in health outcomes
E.g., cost of universal HIV prevention E.g., cost of universal HIV prevention minus cost of targeted HIV prevention, minus cost of targeted HIV prevention, divided by the difference in HIV divided by the difference in HIV infections prevented. Thus, dollars per infections prevented. Thus, dollars per HIV infection preventedHIV infection prevented.

Other CE outcomesOther CE outcomes
• Cost-utility analysis (CUA)Cost-utility analysis (CUA): dollars per QALY gained. : dollars per QALY gained. Often used interchangeably with “CEA”. Often used interchangeably with “CEA”.
• Cost per DALY avertedCost per DALY averted – adopted in global health. – adopted in global health. Approx. the negative version of cost per QALY Approx. the negative version of cost per QALY gained.gained.
• Cost-benefit analysis (CBA)Cost-benefit analysis (CBA): Health outcomes : Health outcomes translated into financial values (e.g., willingness to translated into financial values (e.g., willingness to pay). Difference (rather than ratio) used: dollars pay). Difference (rather than ratio) used: dollars spent on the intervention spent on the intervention minusminus dollars saved in dollars saved in benefitsbenefits.
2. Input data2. Input data
Broad set of input data on health outcomes Broad set of input data on health outcomes and costs. and costs.
Data collected using various techniques.Data collected using various techniques.
How does it all fit together?How does it all fit together?

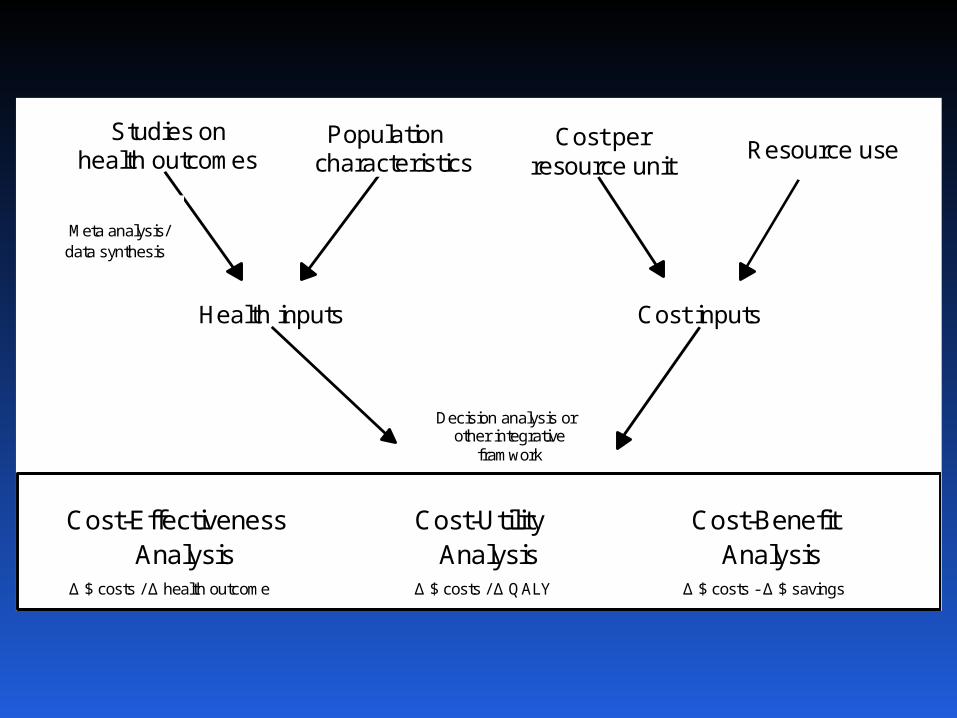
Studies on health outcomes
Health inputs
Decision analysis or other integrative
framwork
fr Cost-Effectiveness
Analysis Δ $ costs / Δ health outcome
Cost inputs
Meta analysis/ data synthesis
Population characteristics
Cost per resource unit
Resource use
Cost-Utility
Analysis Δ $ costs / Δ QALY
Cost-Benefit Analysis
Δ $ costs - Δ $ savings
OutlineOutline
OverviewOverview
Components of cost-effectiveness analysisComponents of cost-effectiveness analysis
Steps in cost-effectiveness analysisSteps in cost-effectiveness analysis
Implications of CEAImplications of CEA
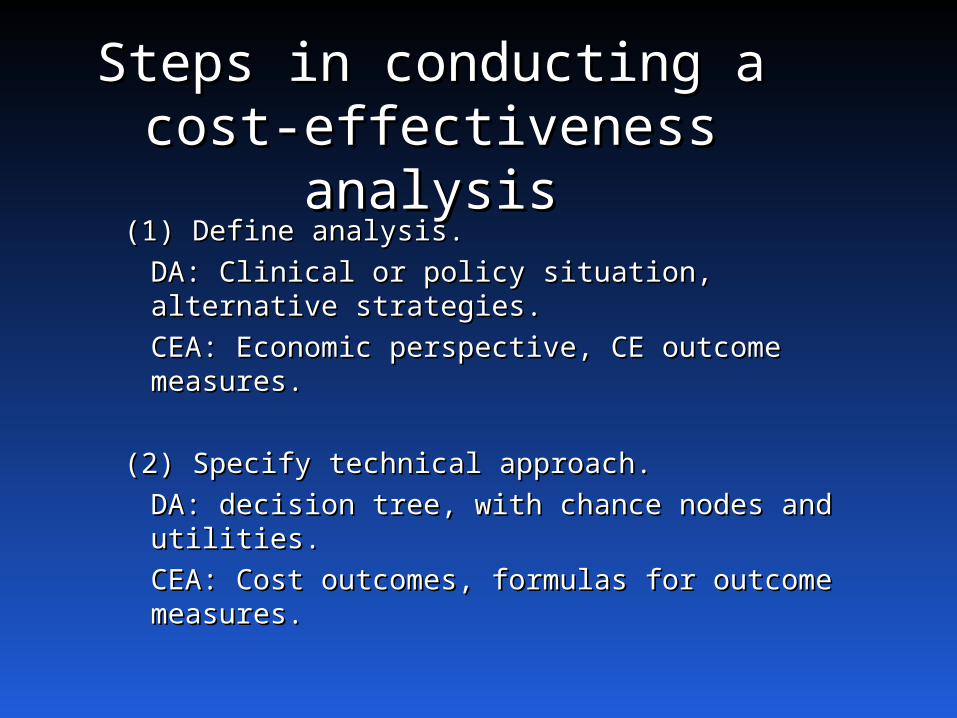
Steps in conducting a Steps in conducting a cost-effectiveness cost-effectiveness
analysisanalysis(1) Define analysis.(1) Define analysis.
DA: Clinical or policy situation, alternative DA: Clinical or policy situation, alternative strategies. strategies.
CEA: Economic perspective, CE outcome CEA: Economic perspective, CE outcome measures.measures.
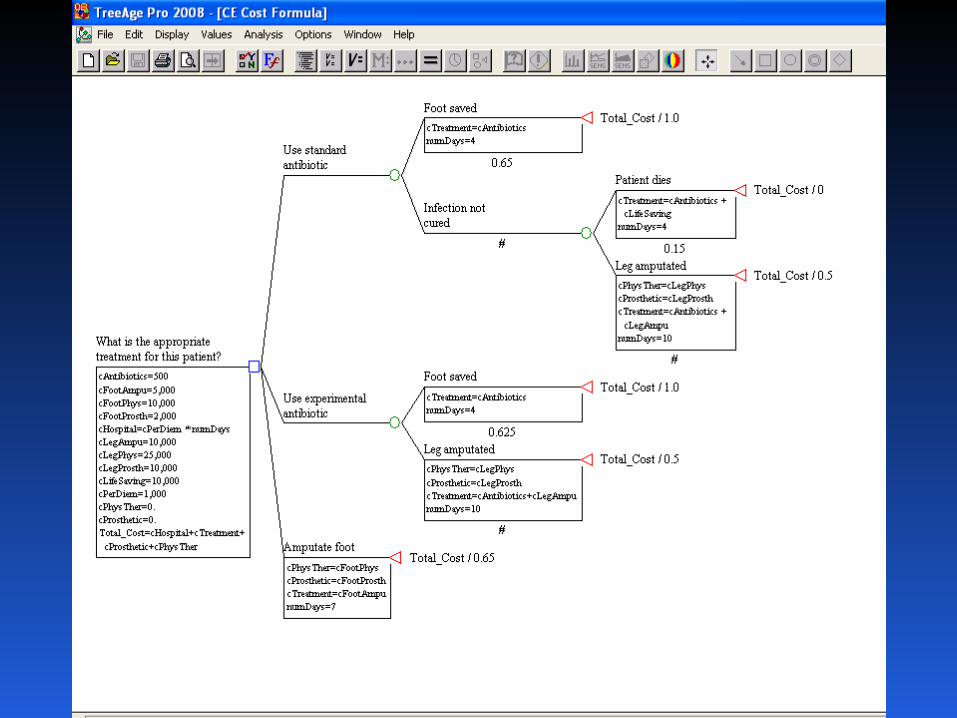
(2) Specify technical approach.(2) Specify technical approach.
DA: decision tree, with chance nodes and DA: decision tree, with chance nodes and utilities.utilities.
CEA: Cost outcomes, formulas for outcome CEA: Cost outcomes, formulas for outcome measures.measures.
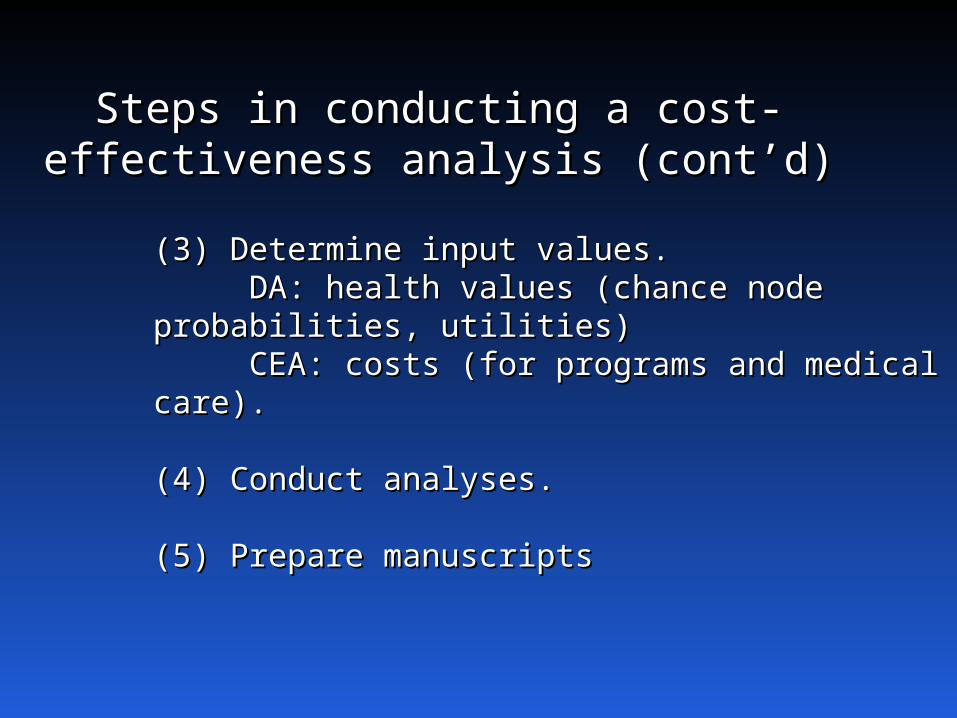
Steps in conducting a cost-Steps in conducting a cost-effectiveness analysis effectiveness analysis
(cont’d)(cont’d)
(3) Determine input values. (3) Determine input values. DA: health values (chance node DA: health values (chance node
probabilities, utilities)probabilities, utilities)CEA: costs (for programs and medical CEA: costs (for programs and medical
care). care).
(4) Conduct analyses. (4) Conduct analyses.
(5) Prepare manuscripts(5) Prepare manuscripts
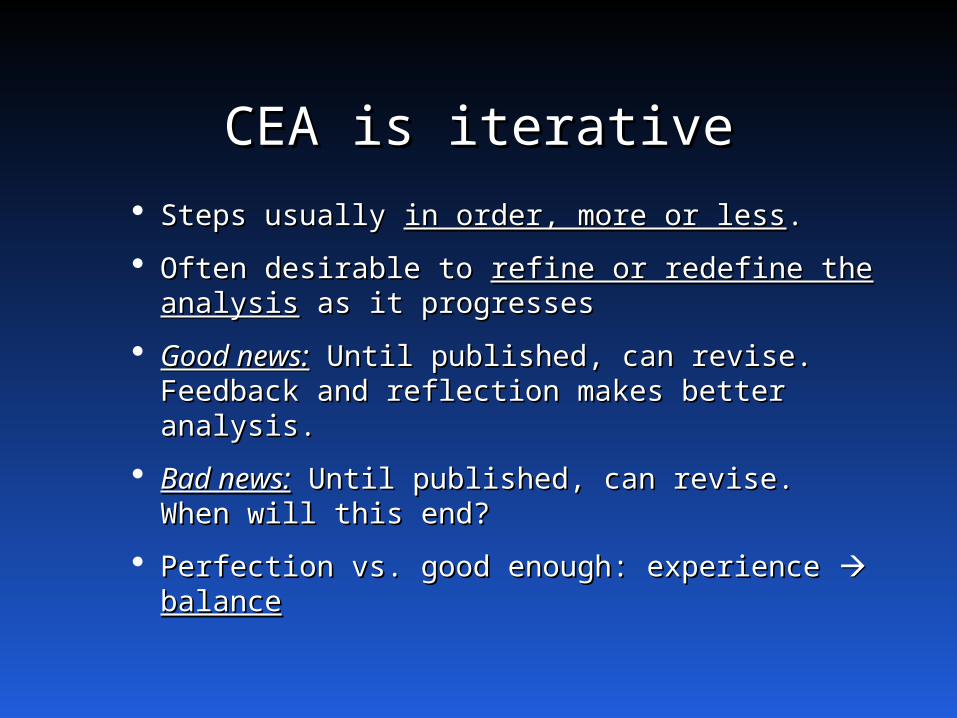
CEA is iterativeCEA is iterative Steps usually Steps usually in order, more or lessin order, more or less. .
Often desirable to Often desirable to refine or redefine the refine or redefine the analysisanalysis as it progresses as it progresses
Good news:Good news: Until published, can revise. Until published, can revise. Feedback and reflection makes better analysis.Feedback and reflection makes better analysis.
Bad news:Bad news: Until published, can revise. Until published, can revise. When will this end?When will this end?
Perfection vs. good enough: experience Perfection vs. good enough: experience balancebalance
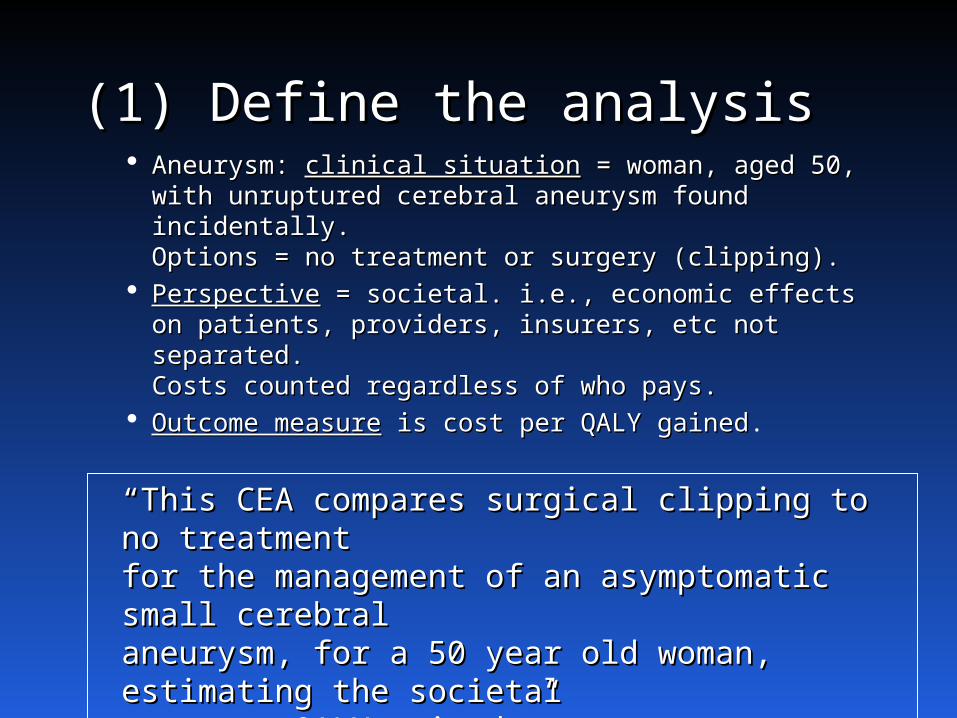
(1) Define the analysis(1) Define the analysis Aneurysm: Aneurysm: clinical situationclinical situation = woman, aged 50, = woman, aged 50,
with unruptured cerebral aneurysm found with unruptured cerebral aneurysm found incidentally. incidentally. Options = no treatment or surgery (clipping).Options = no treatment or surgery (clipping).
PerspectivePerspective = societal. i.e., economic effects on = societal. i.e., economic effects on patients, providers, insurers, etc not separated. patients, providers, insurers, etc not separated. Costs counted regardless of who pays.Costs counted regardless of who pays.
Outcome measureOutcome measure is cost per QALY gained is cost per QALY gained.
““This CEA compares surgical clipping to no This CEA compares surgical clipping to no treatment treatment for the management of an asymptomatic small for the management of an asymptomatic small cerebral cerebral aneurysm, for a 50 year old woman, estimating aneurysm, for a 50 year old woman, estimating the societalthe societalcost per QALY gained.”cost per QALY gained.”
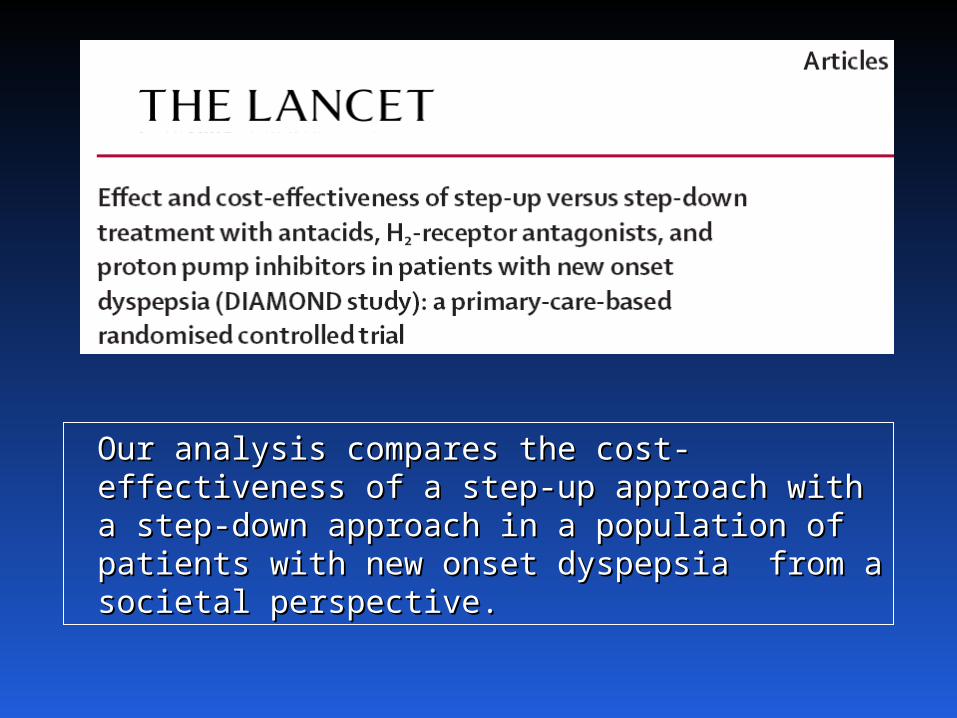
Our analysis compares the cost-effectiveness of Our analysis compares the cost-effectiveness of a step-up approach with a step-down approach a step-up approach with a step-down approach in a population of patients with new onset in a population of patients with new onset dyspepsia from a societal perspective.dyspepsia from a societal perspective.

Specify the technical Specify the technical approachapproach
• Spreadsheet / decision tree analysisSpreadsheet / decision tree analysis
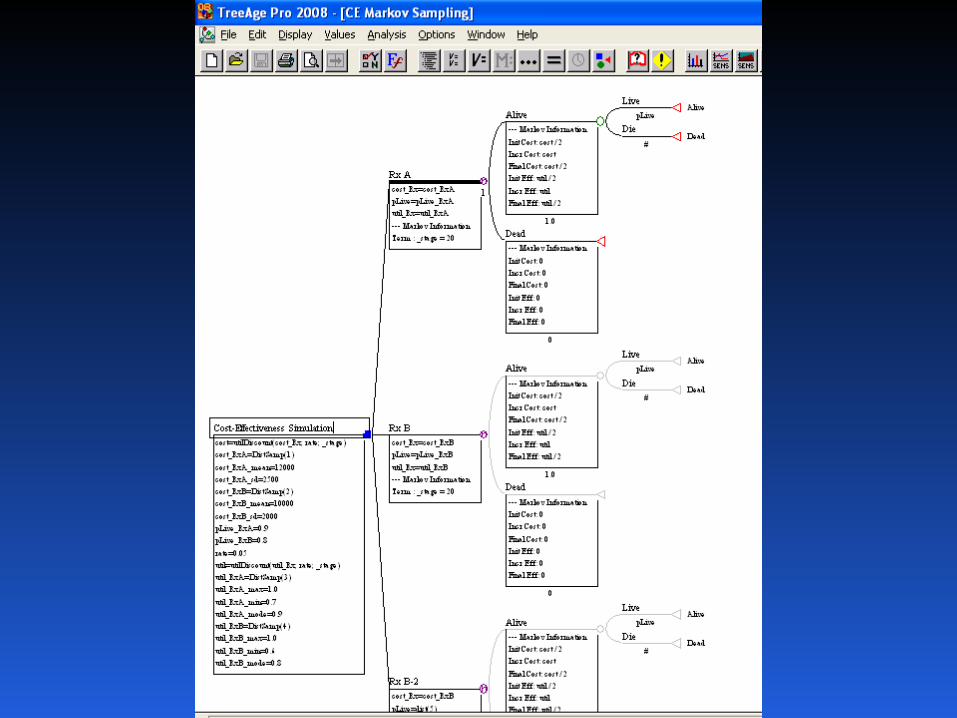
• Markov modelMarkov model
• SimulationSimulation
• Dynamic modelsDynamic models
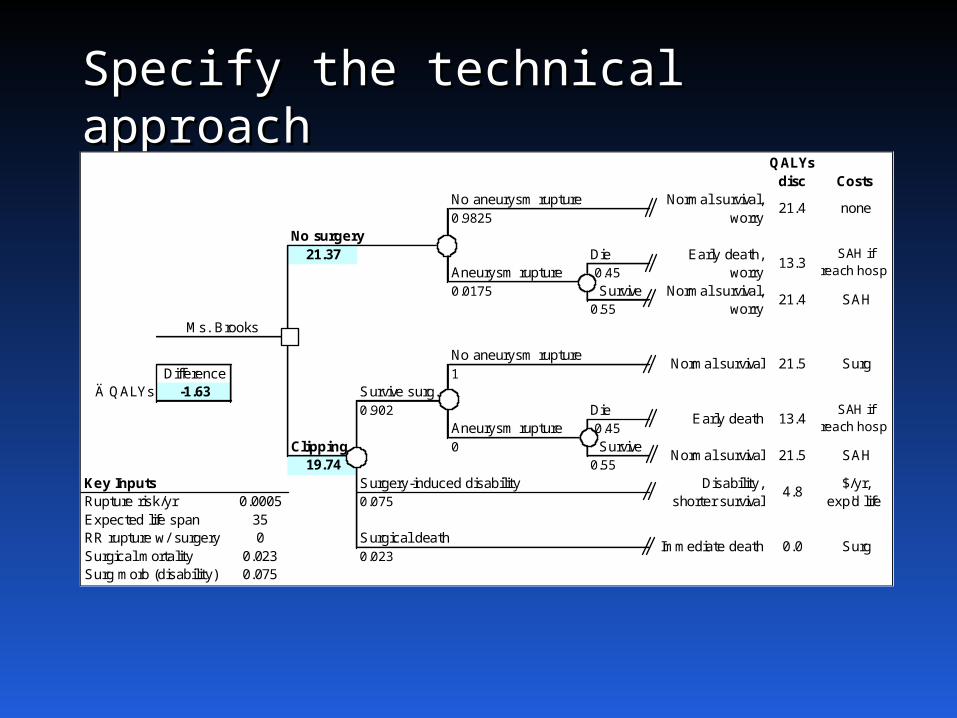
Specify the technical Specify the technical approachapproach
QALYsdisc Costs
No aneurysm rupture0.9825
No surgery21.37 Die
Aneurysm rupture 0.45
0.0175 Survive0.55
No aneurysm ruptureDifference 1
Ä QALYs -1.63 Survive surg.0.902 Die
Aneurysm rupture 0.45
Clipping 0 Survive19.74 0.55
Key Inputs Surgery-induced disabilityRupture risk/yr 0.0005 0.075
Expected life span 35RR rupture w/ surgery 0 Surgical deathSurgical mortality 0.023 0.023Surg morb (disability) 0.075
0.0
Disability, shorter survival
SAH if reach hosp
SAH
$/yr, exp'd life
Surg
none
SAH if reach hosp
SAH
Surg
13.4
Ms. Brooks
13.3
21.4Normal survival,
worry
21.5
4.8
Immediate death
Normal survival,worry
21.4
Normal survival
Normal survival
Early death,worry
Early death
21.5
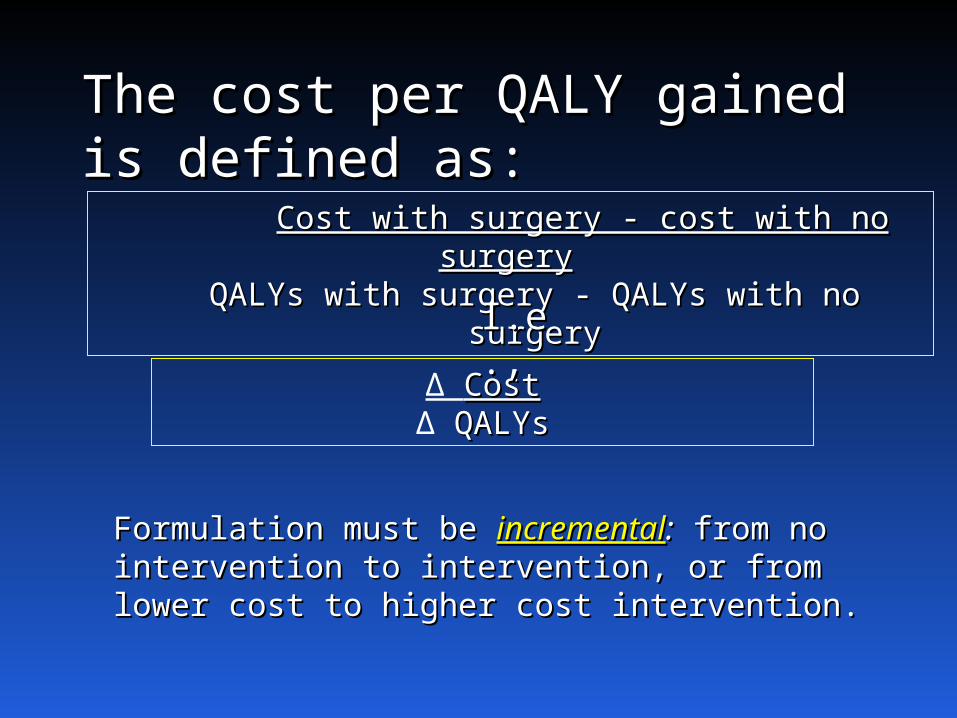
The cost per QALY gained The cost per QALY gained is defined as:is defined as:
Cost with surgery - cost with no surgeryCost with surgery - cost with no surgeryQALYs with surgery - QALYs with no surgeryQALYs with surgery - QALYs with no surgery
Δ CostCostΔ QALYsQALYs
Formulation must be Formulation must be incrementalincremental:: from no from no intervention to intervention, or from lower cost to intervention to intervention, or from lower cost to higher cost intervention.higher cost intervention.
I.e.,I.e.,

(3) Determine input values(3) Determine input values
Here are key cost inputsHere are key cost inputs:
Cost inputCost input Value (range)Value (range) SourceSource
ClippingClipping $25,150 (18,000-35,000)$25,150 (18,000-35,000)Cohort study – Cohort study –
cost accounting cost accounting systemsystem
Moderate/severe Moderate/severe disabilitydisability $20,000/yr (13,000-30,000)$20,000/yr (13,000-30,000) Published Published
estimateestimateSAH hospitalizationSAH hospitalization $47,000 ($33,000-$67,000)$47,000 ($33,000-$67,000) Cohort study – Cohort study –
cost cost accounting accounting systemsystemDiscount rateDiscount rate 3% (0-5)3% (0-5) CEA CEA guidelinesguidelines
(3) Determine input values (3) Determine input values (cont’d)(cont’d)
Both effectiveness and cost must be discounted Both effectiveness and cost must be discounted
e.g., $47,000 for SAH hospitalization, average 17 e.g., $47,000 for SAH hospitalization, average 17 years into the future, NPV = $35,912years into the future, NPV = $35,912.
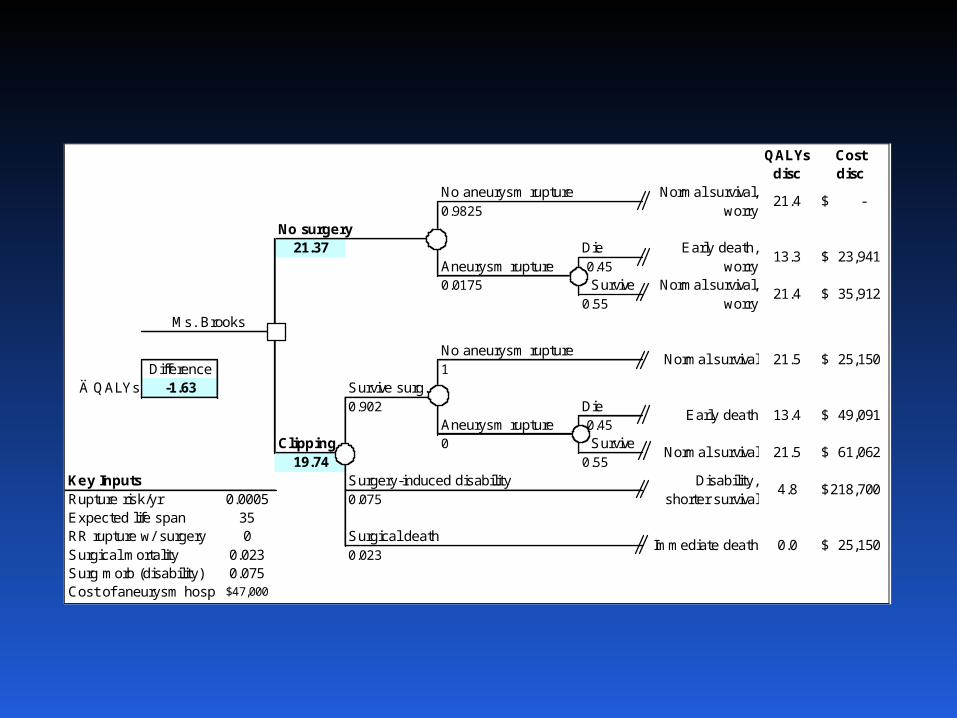
QALYsdisc
Cost disc
No aneurysm rupture0.9825
No surgery21.37 Die
Aneurysm rupture 0.450.0175 Survive
0.55
No aneurysm ruptureDifference 1
Ä QALYs -1.63 Survive surg.0.902 Die
Aneurysm rupture 0.45Clipping 0 Survive
19.74 0.55Key Inputs Surgery-induced disabilityRupture risk/yr 0.0005 0.075Expected life span 35RR rupture w/ surgery 0 Surgical deathSurgical mortality 0.023 0.023Surg morb (disability) 0.075Cost of aneurysm hosp 47,000$
21.5
4.8
Immediate death
Normal survival,worry
21.4
Normal survival
Normal survival
Early death,worry
Early death
21.5
13.4
Ms. Brooks
13.3
21.4Normal survival,
worry
-$
23,941$
35,912$
25,150$
49,091$
61,062$
218,700$
25,150$ 0.0
Disability, shorter survival
(4) Conduct analyses(4) Conduct analyses
How are calculations done?How are calculations done?
• By handBy handInstructive once, inefficient and error-prone with multiple Instructive once, inefficient and error-prone with multiple calculations. Does anyone know how to do long division calculations. Does anyone know how to do long division anymore?anymore?
• SpreadsheetsSpreadsheets Flexible –any structure, input, calculation, outcome, Flexible –any structure, input, calculation, outcome,
or format E.g., infectious disease epidemic or format E.g., infectious disease epidemic modeling, modeling,
or interacting Markov models or interacting Markov models Must program some standard CEA tasks.Must program some standard CEA tasks.For Monte Carlo and other sensitivity analyses, Crystal For Monte Carlo and other sensitivity analyses, Crystal Ball.Ball.
(4) Conduct analyses (cont’d)(4) Conduct analyses (cont’d)
• Decision analysis packages Decision analysis packages
SMLTREE, DATA, TreeAge, etcSMLTREE, DATA, TreeAge, etc
Designed to do CEA tasks, eg trees, inputs, Designed to do CEA tasks, eg trees, inputs, outputs, simple Markov, SA.outputs, simple Markov, SA.
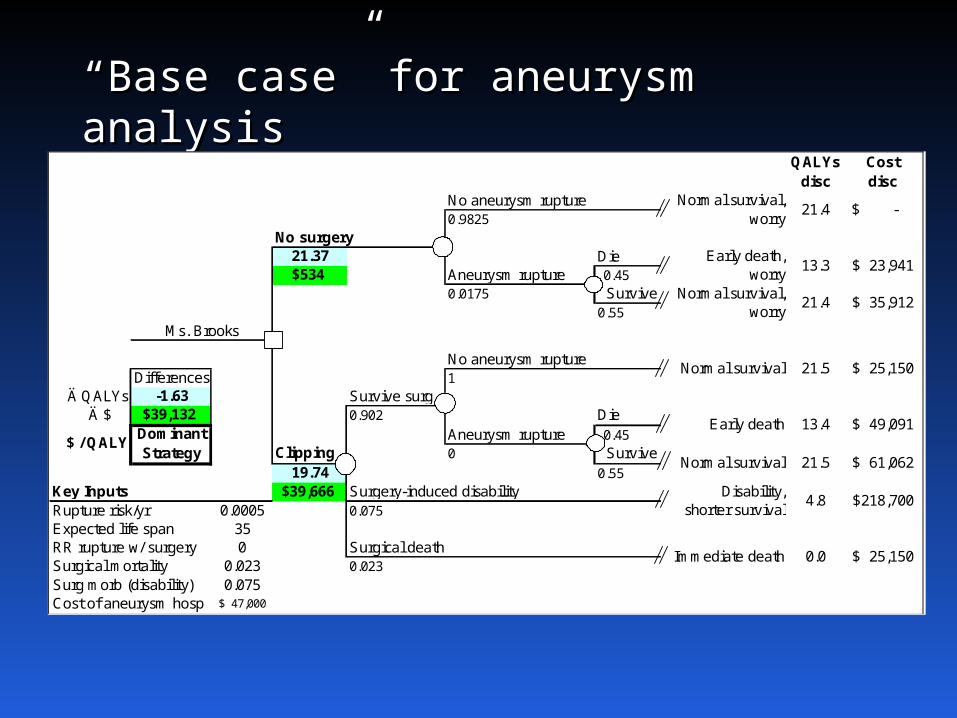
““Base case” for aneurysm Base case” for aneurysm analysisanalysis
QALYsdisc
Costdisc
No aneurysm rupture0.9825
No surgery21.37 Die$534 Aneurysm rupture 0.45
0.0175 Survive0.55
No aneurysm ruptureDifferences 1
Ä QALYs -1.63 Survive surg.Ä $ $39,132 0.902 Die
Aneurysm rupture 0.45Clipping 0 Survive
19.74 0.55Key Inputs $39,666 Surgery-induced disabilityRupture risk/yr 0.0005 0.075Expected life span 35RR rupture w/ surgery 0 Surgical deathSurgical mortality 0.023 0.023
Surg morb (disability) 0.075Cost of aneurysm hosp 47,000$
21.5
4.8
Immediate death
Normal survival,worry
21.4
Normal survival
Normal survival
Early death,worry
Early death
21.5
13.4
Ms. Brooks
13.3
21.4Normal survival,
worry
-$
23,941$
35,912$
25,150$
Dominant Strategy
$ / QALY49,091$
61,062$
218,700$
25,150$ 0.0
Disability, shorter survival
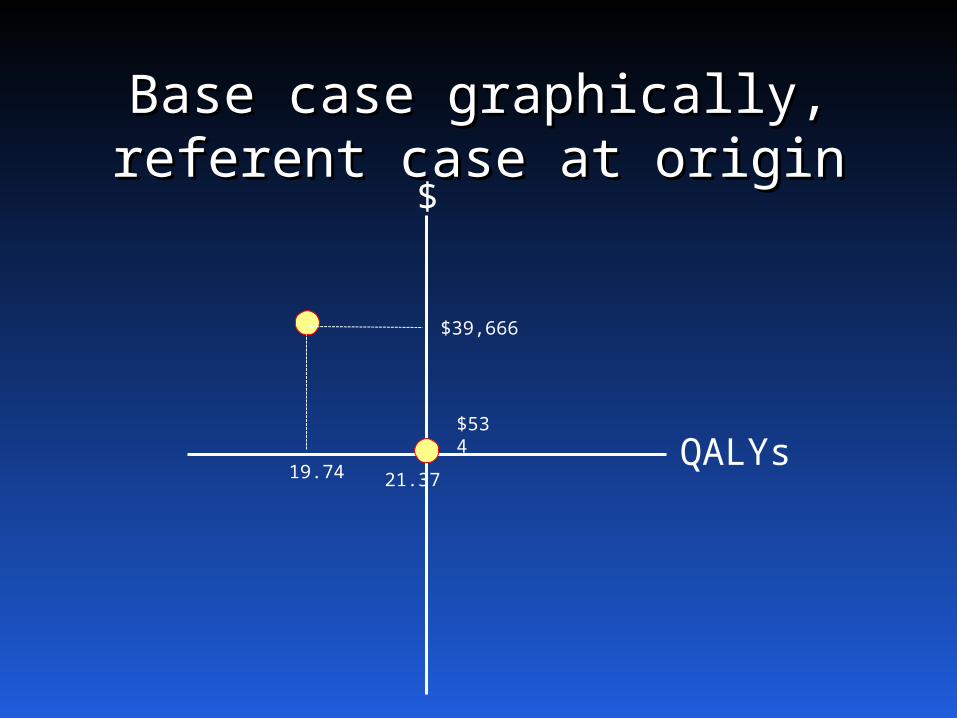
Base case graphically, Base case graphically, referent case at originreferent case at origin
$
QALYs21.37
$534
$39,666
19.74
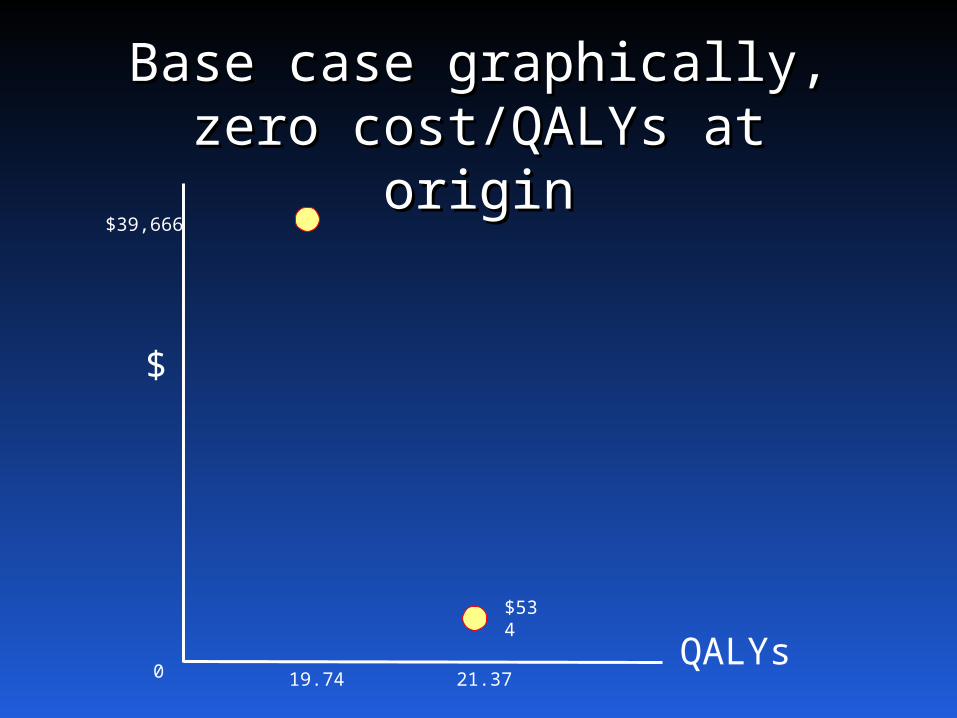
Base case graphically,Base case graphically,zero cost/QALYs at zero cost/QALYs at
originorigin
$
QALYs21.37
$534
$39,666
19.740
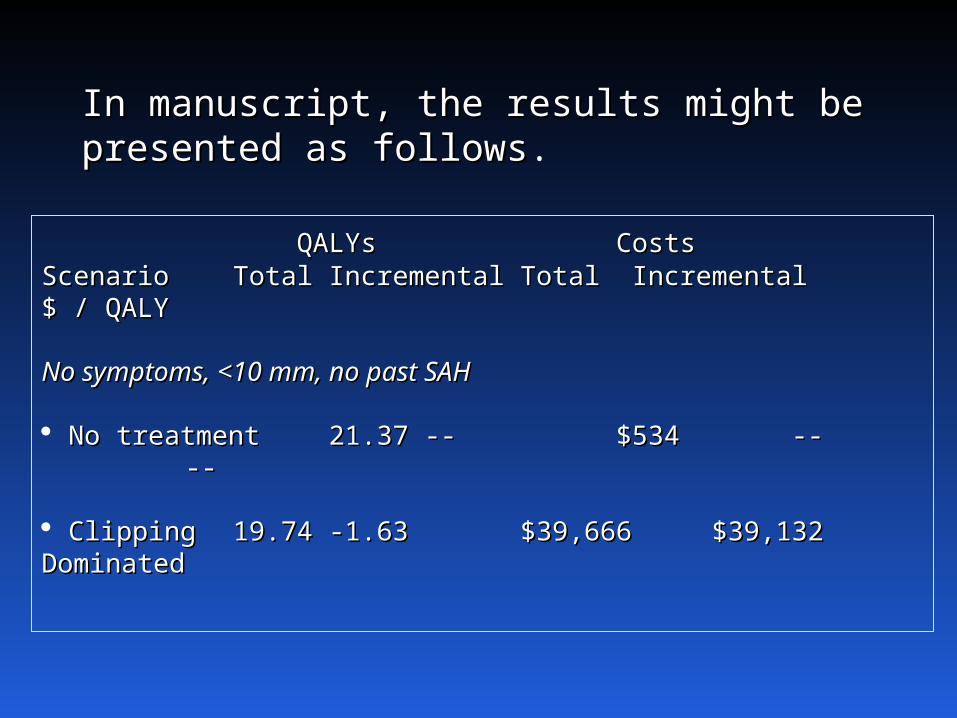
In manuscript, the results might be In manuscript, the results might be presented as followspresented as follows.
QALYsQALYs CostsCostsScenarioScenario TotalTotal IncrementalIncremental TotalTotal Incremental $ / Incremental $ / QALYQALY
No symptoms, <10 mm, no past SAHNo symptoms, <10 mm, no past SAH
No treatmentNo treatment 21.3721.37 ---- $534$534 -- -- -- --
ClippingClipping 19.7419.74 -1.63-1.63 $39,666$39,666 $39,132 $39,132 DominatedDominated
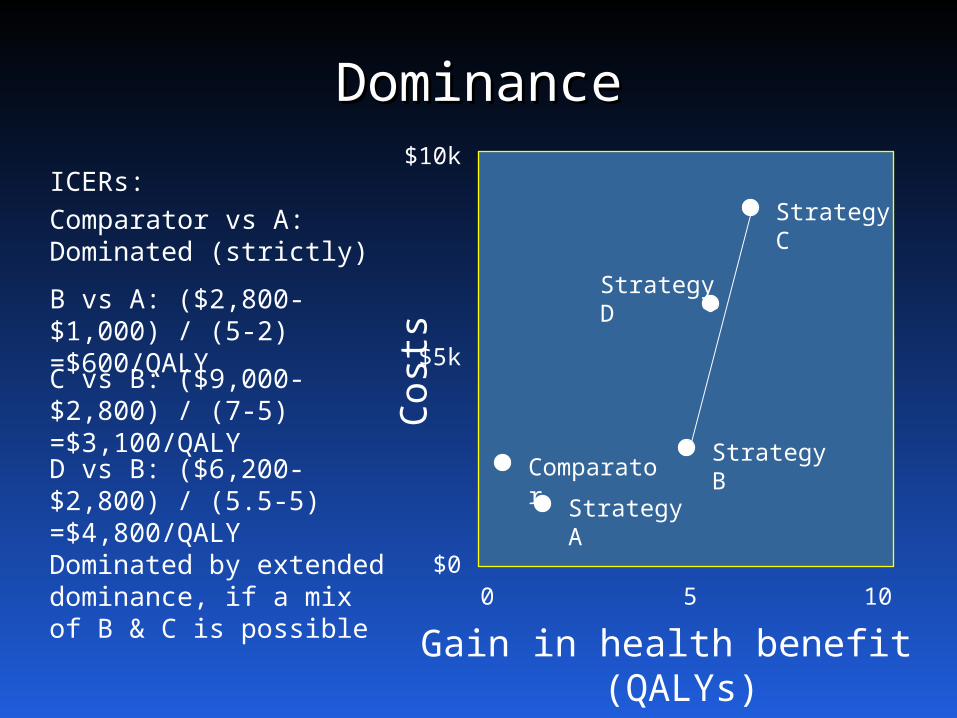
DominanceDominance
Cost
s
Gain in health benefit (QALYs)
0 105
$10k
$5k
$0
Comparator Strategy A
Strategy B
Strategy C
Strategy D
ICERs:Comparator vs A: Dominated (strictly)
B vs A: ($2,800-$1,000) / (5-2)=$600/QALYC vs B: ($9,000-$2,800) / (7-5)=$3,100/QALYD vs B: ($6,200-$2,800) / (5.5-5)=$4,800/QALYDominated by extended dominance, if a mix of B & C is possible
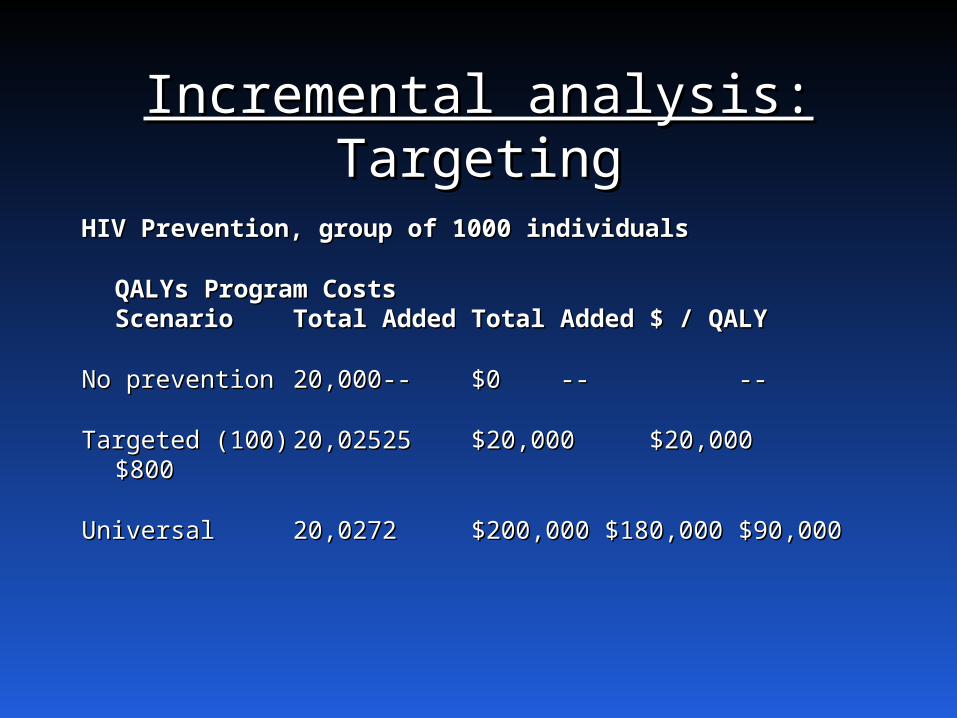
Incremental analysis:Incremental analysis: TargetingTargeting
HIV Prevention, group of 1000 individualsHIV Prevention, group of 1000 individuals
QALYsQALYs Program CostsProgram CostsScenarioScenario TotalTotal AddedAdded TotalTotal AddedAdded $ / $ / QALYQALY
No preventionNo prevention 20,00020,000---- $0$0 ---- ----
Targeted (100)Targeted (100) 20,02520,0252525 $20,000$20,000 $20,000$20,000$800$800
UniversalUniversal 20,02720,02722 $200,000 $180,000$200,000 $180,000 $90,000$90,000
Drugs
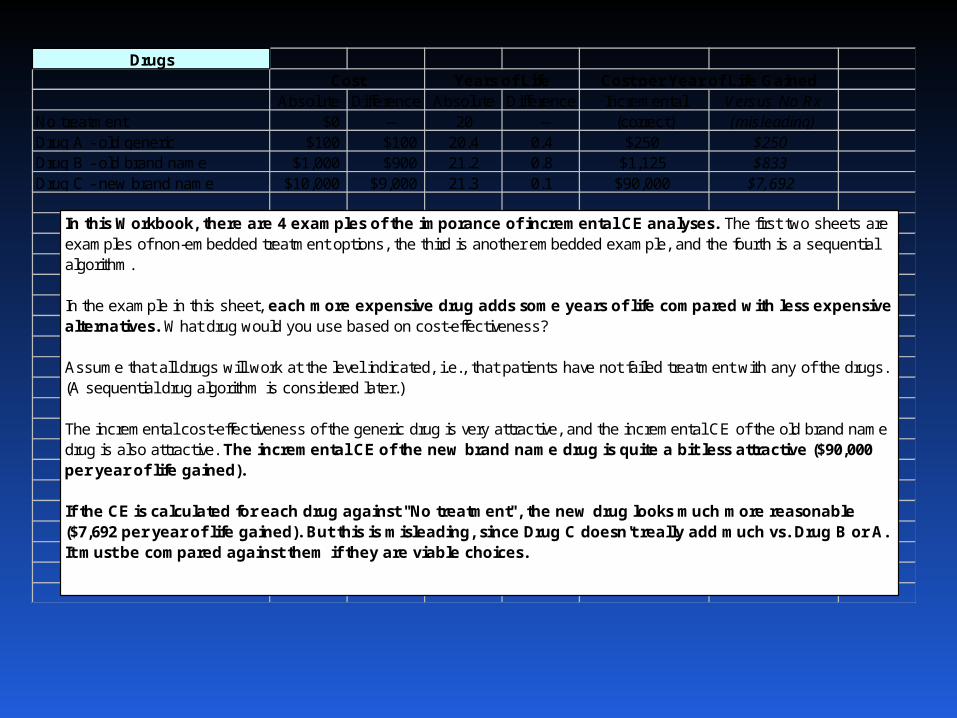
Absolute Difference Absolute Difference Incremental Versus No RxNo treatment $0 -- 20 -- (correct) (misleading)Drug A - old generic $100 $100 20.4 0.4 $250 $250Drug B - old brand name $1,000 $900 21.2 0.8 $1,125 $833Drug C - new brand name $10,000 $9,000 21.3 0.1 $90,000 $7,692
Cost Years of Life Cost per Year of Life Gained
In this Workbook, there are 4 examples of the imporance of incremental CE analyses. The first two sheets are examples of non-embedded treatment options, the third is another embedded example, and the fourth is a sequential algorithm.
In the example in this sheet, each more expensive drug adds some years of life compared with less expensive alternatives. What drug would you use based on cost-effectiveness?
Assume that all drugs will work at the level indicated, i.e., that patients have not failed treatment with any of the drugs. (A sequential drug algorithm is considered later.) The incremental cost-effectiveness of the generic drug is very attractive, and the incremental CE of the old brand name drug is also attractive. The incremental CE of the new brand name drug is quite a bit less attractive ($90,000 per year of life gained).
If the CE is calculated for each drug against "No treatment", the new drug looks much more reasonable ($7,692 per year of life gained). But this is misleading, since Drug C doesn't really add much vs. Drug B or A. It must be compared against them if they are viable choices.
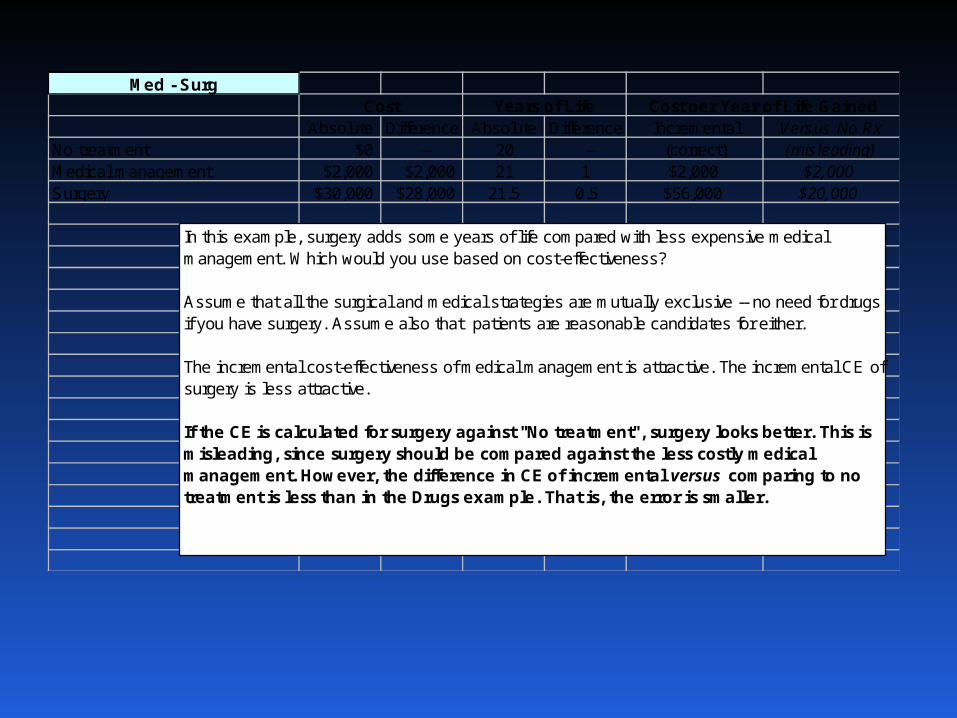
Med - Surg
Absolute Difference Absolute Difference Incremental Versus No RxNo treatment $0 -- 20 -- (correct) (misleading)Medical management $2,000 $2,000 21 1 $2,000 $2,000Surgery $30,000 $28,000 21.5 0.5 $56,000 $20,000
Cost Years of Life Cost per Year of Life Gained
In this example, surgery adds some years of life compared with less expensive medical management. Which would you use based on cost-effectiveness?
Assume that all the surgical and medical strategies are mutually exclusive -- no need for drugs if you have surgery. Assume also that patients are reasonable candidates for either.
The incremental cost-effectiveness of medical management is attractive. The incremental CE of surgery is less attractive.
If the CE is calculated for surgery against "No treatment", surgery looks better. This is misleading, since surgery should be compared against the less costly medical management. However, the difference in CE of incremental versus comparing to no treatment is less than in the Drugs example. That is, the error is smaller.
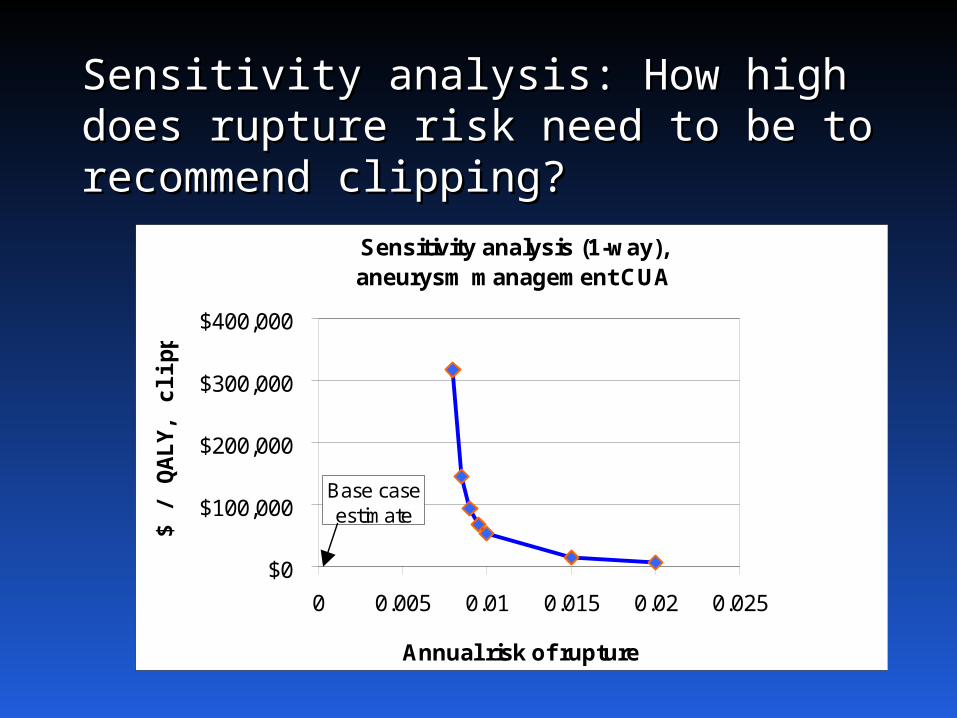
Sensitivity analysis: How high Sensitivity analysis: How high does rupture risk need to be does rupture risk need to be to recommend clipping?to recommend clipping?
Sensitivity analysis (1-way),aneurysm management CUA
$0
$100,000
$200,000
$300,000
$400,000
0 0.005 0.01 0.015 0.02 0.025
Annual risk of rupture
$ /
QA
LY, c
lipp
ing
Base case estimate
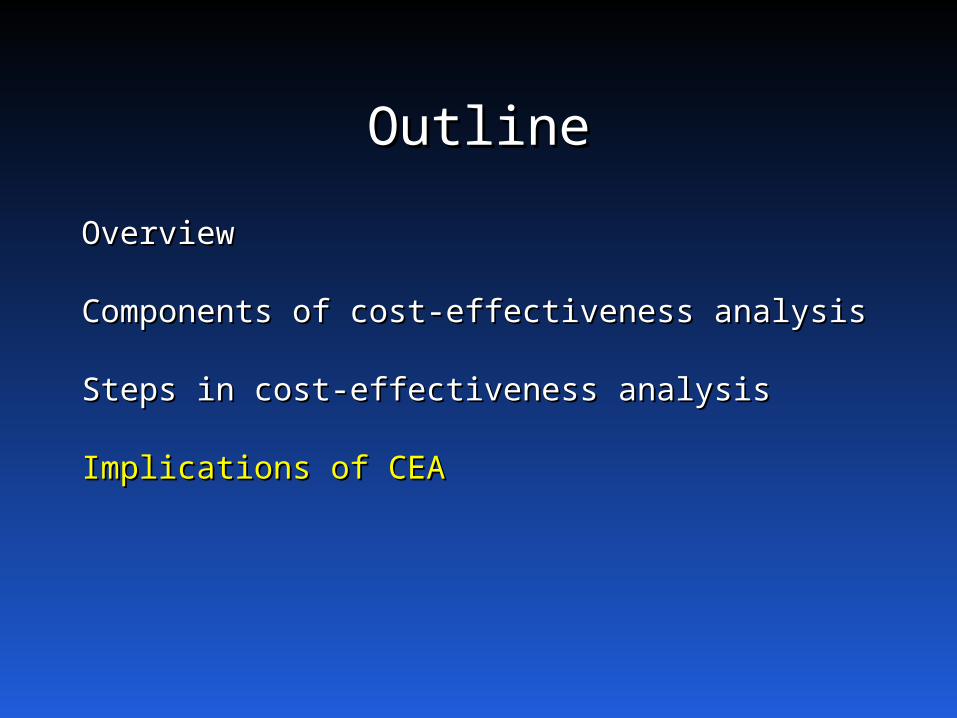
OutlineOutline
OverviewOverview
Components of cost-effectiveness analysisComponents of cost-effectiveness analysis
Steps in cost-effectiveness analysisSteps in cost-effectiveness analysis
Implications of CEAImplications of CEA
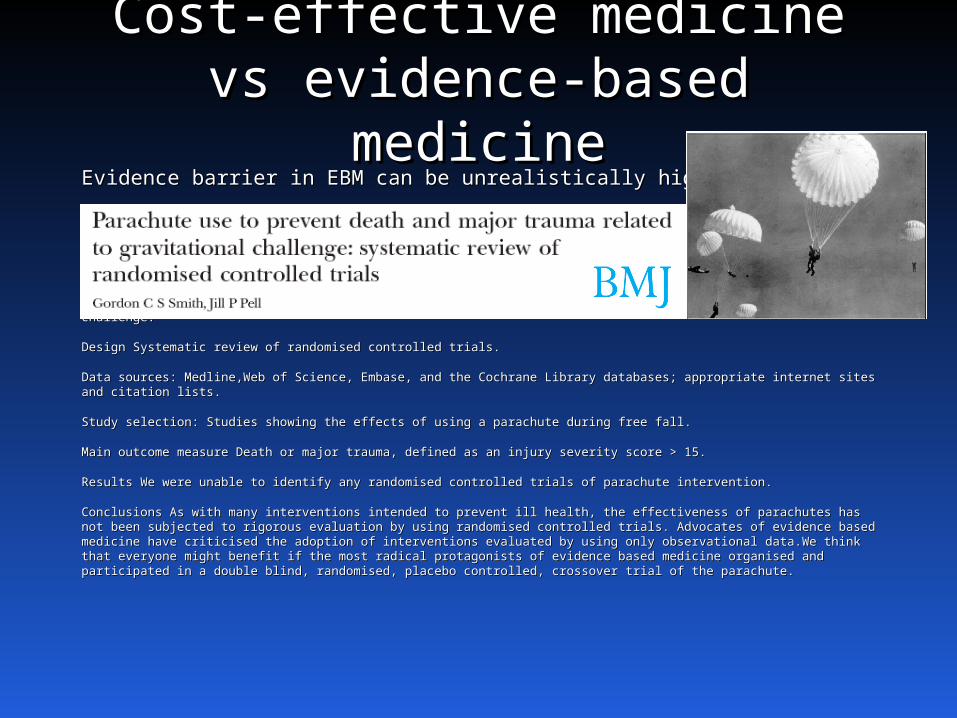
Cost-effective medicine Cost-effective medicine vs evidence-based vs evidence-based
medicinemedicineEvidence barrier in EBM can be unrealistically high.Evidence barrier in EBM can be unrealistically high.
Objectives To determine whether parachutes are effective in preventing major trauma related to gravitational challenge.Objectives To determine whether parachutes are effective in preventing major trauma related to gravitational challenge.
Design Systematic review of randomised controlled trials.Design Systematic review of randomised controlled trials.
Data sources: Medline,Web of Science, Embase, and the Cochrane Library databases; appropriate internet sites and citation lists.Data sources: Medline,Web of Science, Embase, and the Cochrane Library databases; appropriate internet sites and citation lists.
Study selection: Studies showing the effects of using a parachute during free fall.Study selection: Studies showing the effects of using a parachute during free fall.
Main outcome measure Death or major trauma, defined as an injury severity score > 15.Main outcome measure Death or major trauma, defined as an injury severity score > 15.
Results We were unable to identify any randomised controlled trials of parachute intervention.Results We were unable to identify any randomised controlled trials of parachute intervention.
Conclusions As with many interventions intended to prevent ill health, the effectiveness of parachutes has not been subjected to Conclusions As with many interventions intended to prevent ill health, the effectiveness of parachutes has not been subjected to rigorous evaluation by using randomised controlled trials. Advocates of evidence based medicine have criticised the adoption of rigorous evaluation by using randomised controlled trials. Advocates of evidence based medicine have criticised the adoption of interventions evaluated by using only observational data.We think that everyone might benefit if the most radical protagonists of interventions evaluated by using only observational data.We think that everyone might benefit if the most radical protagonists of evidence based medicine organised and participated in a double blind, randomised, placebo controlled, crossover trial of the parachute.evidence based medicine organised and participated in a double blind, randomised, placebo controlled, crossover trial of the parachute.
Cost-effective medicine Cost-effective medicine vs evidence-based vs evidence-based
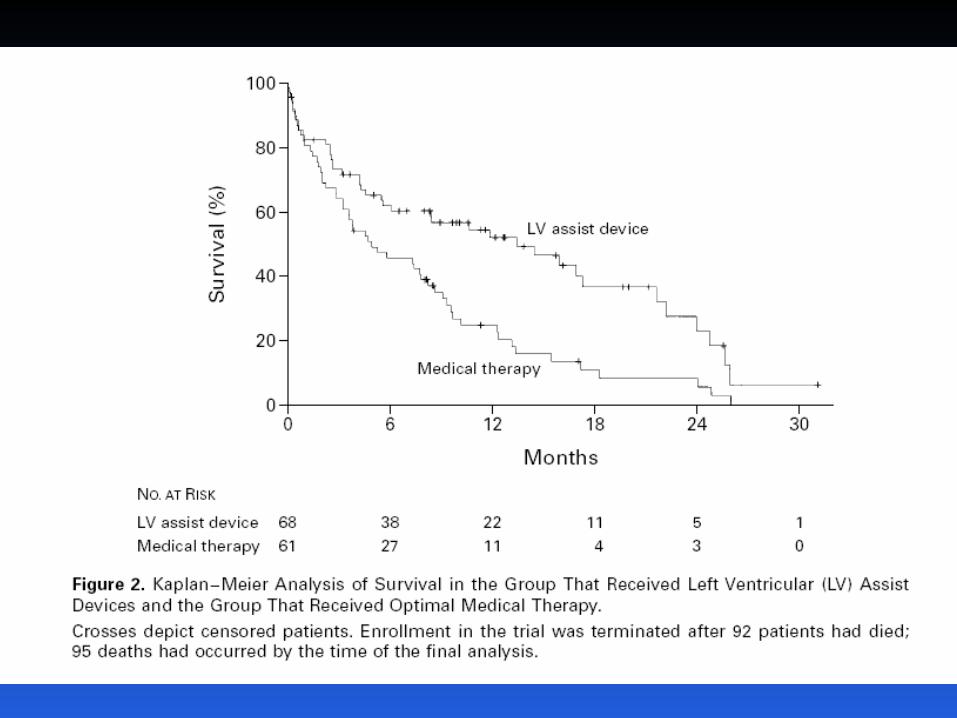
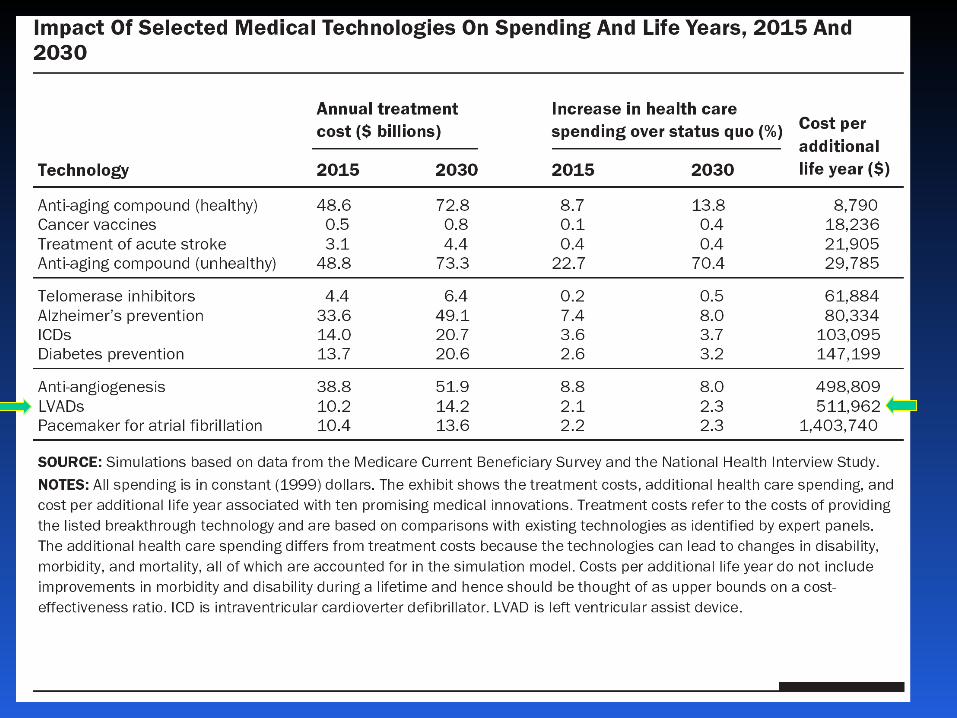
medicinemedicine• EBM only tells you whether something works, EBM only tells you whether something works, not whether we should pay for it.not whether we should pay for it.
– LVAD exampleLVAD example–Many other similar examplesMany other similar examples
• Evidence of effectiveness Evidence of effectiveness Evidence of Evidence of valuevalue
What does CEA say about What does CEA say about value of life?value of life?
• A cost-effectiveness threshold is one way to use A cost-effectiveness threshold is one way to use CEA to determine which interventions represent CEA to determine which interventions represent good value.good value.
• In the US and OECD countries, that threshold is In the US and OECD countries, that threshold is probably around $150,000 per QALY gained.probably around $150,000 per QALY gained.
• What is the threshold in other countries?What is the threshold in other countries?– Related to per-capita GDP as a proxy for incomeRelated to per-capita GDP as a proxy for income– Less that 1 x pcGDP: very good valueLess that 1 x pcGDP: very good value– 1-3 x pcGDP: acceptable (WHO threshold – 3x)1-3 x pcGDP: acceptable (WHO threshold – 3x)

CEA can seem an odd CEA can seem an odd input …input …
CEA abuse …CEA abuse …
Defend policies deemed unacceptable for Defend policies deemed unacceptable for other reasons (depriving of rights, unfair, other reasons (depriving of rights, unfair, cruel, etc)cruel, etc)
Methods correct but interpretation skewedMethods correct but interpretation skewed
Methods incorrect or strategies not Methods incorrect or strategies not consideredconsidered

What’s next?What’s next?
• Data inputsData inputs
• Sensitivity analysesSensitivity analyses
• Markov simulationsMarkov simulations