Embed Size (px)
Citation preview

The Australian Centre for
Health Services Innovation
Cost-Effectiveness Analysis and Implications for Health
Librarians
9th July 2015
Dr Son Nghiem Senior Research Fellow
Victoria McCreanor Research Associate
Greg Merlo Research Assistant

This booklet is not to be reproduced without approval.
THE AUSTRALIAN CENTRE FOR HEALTH SERVICES INNOVATION
Institute for Health & Biomedical Innovation
Queensland University of Technology 60 Musk Avenue, KELVIN GROVE Q 4059
www.aushsi.org.au

23/06/2015
Cost‐effectiveness Analysis in Heath Care ‐ Overview
Victoria McCreanor
Overview
• Cost‐effectiveness modelling studies v RCTs
• Overview of cost‐effectiveness analysis
– Decision trees
– Markov models
• Using model outcomes for decision‐making
– Cost‐effectiveness plane
– Probabilistic sensitivity analysis
• Brainstorming activity
Cost‐effectiveness Studies v RCT
1

23/06/2015
Clinical Study Designs – Evidence Pyramid
Meta‐analyses of RCT data
Randomised Controlled Trials (RCT)
Case Control Studies (patients are matched)
Cohort Studies (populations are followed over time)
Case Series (reports of individuals) Expert Opinion
RCT as the gold standard for economic evaluation?
Some Limitations
1. Often only compare one alternative with placebo or existing practice
2. Short time frame and long term outcomes
3. High internal validity but poor generalizability
4. Might be better sources for some of the information
Very good for estimating effectiveness and causality
Confounders are randomly assigned
RCT as the gold standard for economic evaluation?
NO
Useful for informing the effectiveness of any new intervention
One piece of the jigsaw
Not particularly good for making a decision
2

23/06/2015
Modelling Studies
Enable comparison of all relevant competing interventions
Include long‐term cost and quality and length of life outcomes
Findings are generalizable compared to those achieved in a controlled experiment
RCT has developed a central role in applied cost‐effectiveness studies
Goal is to decide whether to adopt a new technology/service
A framework is needed:Estimates all costs and effects Includes all relevant interventionsIncludes appropriate time horizon Covers specific patient groupsUses the best available evidence in an explicit and transparent way
“These requirements suggest that, in most circumstances, the use of a single RCT as a vehicle for economic analysis will be an inadequate and a partial basis for decision making”
“RCT evidence should be viewed as simply one of the sources of evidence, which must be placed in a broader framework of evidence synthesis and decision analysis.”
Overview of Cost‐effectiveness Analysis
3

23/06/2015
To understand the value for money of a new service or intervention we estimate how:
Costs will change
Benefits (QALYs) will change
Delta = “change in”
An Incremental Cost‐Effectiveness Ratio
QALY = Quality‐Adjusted Life‐Year • Generic measure of effectiveness of a treatment• Allows comparison across different diseases areas• Takes into account effects of treatment on both quality of life and length of life
ICER• Measures changes to both COSTS (C) and EFFECTS (E)
ICER
Decision Trees
What is the decision
New surgical technique
Use old technique
Patient lives
Patient dies
Chance events Endpoints
Patient lives
Patient dies
4

23/06/2015
Patient lives (0.9)
Patient dies (0.1)
Chance events
Patient lives (0.8)
Patient dies (0.2)
The probability of the event happening for each decision
The sum of the probabilities for each chance node must equal 1
Data
=1
=1
Endpoints
The values for the endpoints for each decision.
Four sets of costs and health benefits
New & lives
New & dies
Old & lives
Old & dies
= $150 + 10 years
= $130 + 0 years
= $50 + 10 years
= $30 + 0 years
Data
How they work
New surgical technique
Use old technique
Patient lives (0.9)
Patient dies (0.1)
Patient lives (0.8)
Patient dies (0.2)
Evaluate this way
$150 + 10 years
$130 + 0 years
$50 + 10 years
$30 + 0 years
5

23/06/2015
How they work
New surgical technique
Patient lives (0.9)$150 + 10 years
When the patient lives:
the expected value of the costs is $150 * 0.9 = $135the expected value of the health benefits is 10 * 0.9 = 9 years
How they work
New surgical technique
Patient dies (0.1)$130 + 0 years
When the patient dies:
the expected value of the costs is $130 * 0.1 = $13the expected value of the health benefits is 0 * 0.1 = 0 years
How they work
New surgical technique
Patient lives (0.9)
Patient dies (0.1)
$150 + 10 years
$150 + 0 years
$148 and 9 years
6

23/06/2015
How they work
Use old technique
Patient lives (0.8) $50 + 10 years
When the patient lives:
the expected value of the costs is $50 * 0.8 = $40the expected value of the health benefits is 10 * 0.8 = 8 years
Use old technique
Patient dies (0.2)$30 + 0 years
When the patient dies:
the expected value of the costs is $30 * 0.2 = $6the expected value of the health benefits is 0 * 0.2 = 0 years
How they work
How they work
Use old technique
Patient lives (0.8)
Patient dies (0.2)
$50 + 10 years
$30 + 0 years
$46 and 8 years
7
23/06/2015
Add all branches and compare
These guys need to learn about state based models
Often called ‘Markov Models’
The states are independent and exhaustive
Movements between them are based on transition probabilities
The model updates at regular cycles defined in weeks/months/year
Costs and health benefits are attributed to someone who spends one cycle in any state
The Essentials of state based models
8

23/06/2015
Healthy Sick
Dead
Transition to:
Transition from: Healthy Sick Dead CHECK
Healthy 0.6 0.3 0.1 1
Sick 0 0.8 0.2 1
Dead 0 0 1 1
Dead state absorbs peopleNo one can leave the model
Markov Models – States0.6
0.3
0.1
0.8
0.2
1
Cycles – simulating a cohort of 1000 patients
Healthy Sick Dead
Cycle 1
Cycle 2
1000 0 0
0.6=600
0
0.3=3000.1=100
600 300 100
360 420 220
0.6=360 0.3=180
0
0.8=240
0.1=60
0.2=60
1=100
0
Cycles – simulating a cohort of 1000 patients
Healthy Sick Dead
Cycle 1
Cycle 2
1000 0 0
0.6=600
0
0.3=3000.1=100
600 300 100
360 420 220
0.6=360 0.3=180
0
0.8=240
0.1=60
0.2=60
1=100
0
9
23/06/2015
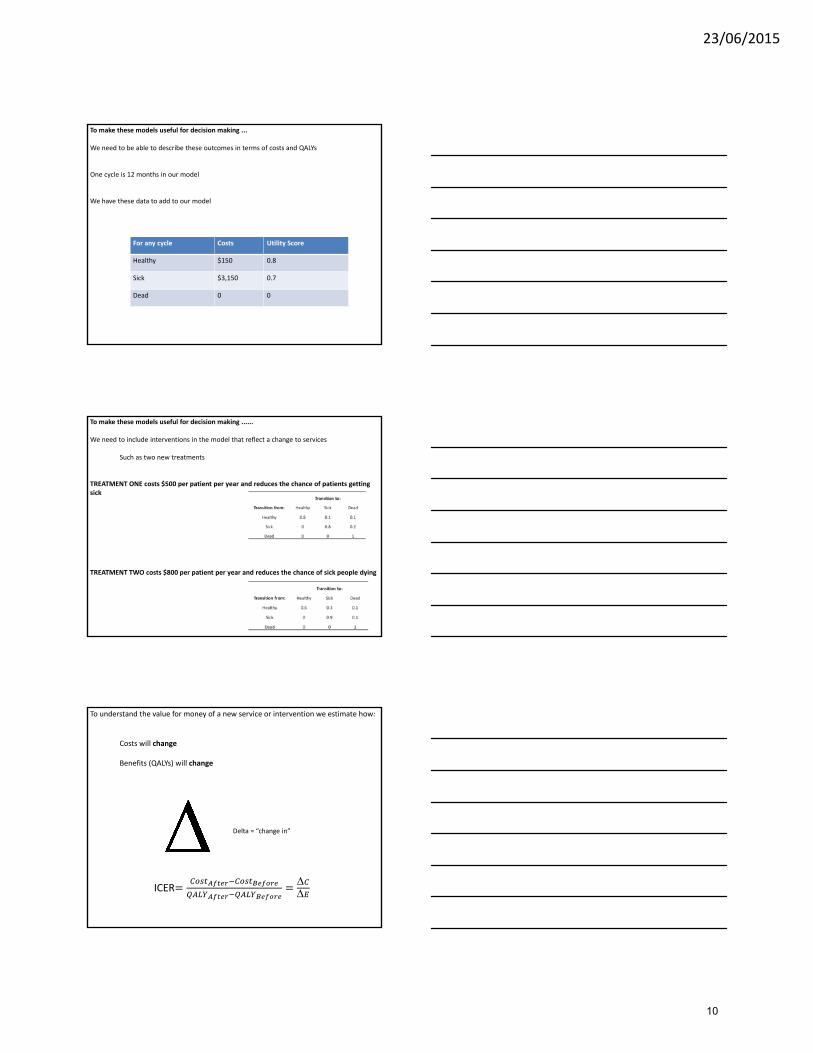
To make these models useful for decision making ...
We need to be able to describe these outcomes in terms of costs and QALYs
One cycle is 12 months in our model
We have these data to add to our model
For any cycle Costs Utility Score
Healthy $150 0.8
Sick $3,150 0.7
Dead 0 0
To make these models useful for decision making ......
We need to include interventions in the model that reflect a change to services
Such as two new treatments
TREATMENT ONE costs $500 per patient per year and reduces the chance of patients getting sick
TREATMENT TWO costs $800 per patient per year and reduces the chance of sick people dying
To understand the value for money of a new service or intervention we estimate how:
Costs will change
Benefits (QALYs) will change
Delta = “change in”
ICER
10

23/06/2015
Treatment Two
Transition from: Healthy Sick Dead 1000 Healthy Sick Dead Check
Healthy 0.6 0.3 0.1 Cycle 1 600 300 100 1,000
Sick 0 0.9 0.1 Cycle 2 360 450 190 1,000
Dead 0 0 1 Cycle 3 216 513 271 1,000
Cycle 4 130 527 344 1,000
Cycle 5 78 513 410 1,000
Cycle 6 47 485 469 1,000
Cycle 7 28 450 522 1,000
Cycle 8 17 414 570 1,000
Cycle 9 10 377 613 1,000
Cycle 10 6 343 651 1,000
Transition to:
Treatment One
Transition from: Healthy Sick Dead 1000 Healthy Sick Dead Check
Healthy 0.8 0.1 0.1 Cycle 1 800 100 100 1,000
Sick 0 0.8 0.2 Cycle 2 640 160 200 1,000
Dead 0 0 1 Cycle 3 512 192 296 1,000
Cycle 4 410 205 386 1,000
Cycle 5 328 205 468 1,000
Cycle 6 262 197 541 1,000
Cycle 7 210 184 607 1,000
Cycle 8 168 168 664 1,000
Cycle 9 134 151 715 1,000
Cycle 10 107 134 758 1,000
Transition to:
Costs QALYs
485,000 710
680,000 624
777,600 544
808,960 471
796,672 406
756,941 347
701,235 296
637,534 252
571,264 213
506,001 180
Costs QALYs
1,188,600 690
1,635,340 603
1,812,190 532
1,835,201 472
1,773,564 421
1,668,289 377
1,543,450 338
1,412,957 303
1,190,141 272
1,354,303 245
Treatment One 6,721,207$ 4,043
Treatment Two 15,414,036$ 4,252
Δ 8,692,829$ 210
ICER T1 vs T2 41,448$
After the changeBaseline comparator
Costs
Health Benefits in QALYs
The Change
$15,414,036$6,721,207 $8,692,829
4,2524,043 210
A change to costs of $8,692,829 gives 210 QALYS
NEW SERVICE ‘X’
Our ICER:
ΔΔ
$8,692,829
210$41,448
The cost per QALY gained is the change to costs divided by the change to health benefits, and is $41,448.
Higher costs
Lower costs
More health
Baseline Comparator
or Existing Practice
Less Health
$8,692,829
210 years of life
The cost‐effectiveness plane
11

23/06/2015
Using Model Outcomes for Decision‐Making
Lower Costs
Higher Costs
More QALYsFewer QALYs
A decision‐making tool
Most lie here
12

23/06/2015
Before
Lower Costs
Higher Costs
More QALYsFewer QALYs
$8,692,829
210
Are we willing to pay $41,448 per QALY?
After
NEW SERVICE ‘X’
In Australia, we are generally willing to pay $40,000 ‐$60,000 per QALY gained
Willingness to pay threshold (WTP)
Probabilistic Sensitivity Analysis (PSA)
• Very useful for decision‐making if there is uncertainty around different parameters in the model
• Run the model 1,000s of times using randomly selected values from uncertainty ranges or distributions – Monte Carlo Simulation (named after the casino)
• Lots of different point estimates
• Count how many fall under the WTP threshold of the decision‐maker
• Gives probability of cost‐effectiveness, depending on WTP threshold
PSA ResultsWTP Threshold
13

23/06/2015
Brainstorming
What search terms would you use to find papers which use this kind of analysis or
modelling?
Brainstorming – search terms
https://bubbl.us/mindmap
14

23/06/2015
• CEA = Cost‐effectiveness Analysis
• ICER = Incremental Cost‐effectiveness Ratio
• Markov Model – Health state‐based model
• Monte Carlo Simulation – random draws for sensitivity
analysis
• QALY = Quality‐Adjusted Life‐Year
• PSA = Probabilistic Sensitivity Analysis
• WTP = Willingness to Pay
Some Terminology
Next up:
How do we get the values for all the parameters in our model?
15

23/06/2015
How to measure costs
Gregory Merlo
Overview
• How to measure costs?
• How to measure health benefits?
The Challenge
Costing involves identifying, measuring and valuing all resource changes that occur if a health intervention is carried out.
The aim is to value the use of all scarce health care resources needed to produce a certain health effect.
16

23/06/2015
Medical resources, directly needed for the intervention
Non‐medical resources needed for the intervention
Patient time including productivity changes
Time of informal carers and other costs of informal care
new health services
programme
Outcome: changes in health benefits
Humans, Space and Things
Medical resources, directly needed for the intervention
Non‐medical resources needed for the intervention
Patient time including productivity changes
Time of informal carers and other costs of informal care
Humans
Space
Things
identify, measure and value
17

23/06/2015
Humans, Space and Things
Combining all three is normally required to supply health services
Humans, Space and Things
Time off work or normal activities
Medical resources, directly needed for the intervention
Non‐medical resources needed for the intervention
Patient time including productivity changes
Time of informal carers and other costs of informal care
Time off work, or normal activities
Not being able to do something productive implies a loss or cost
Salaried or non‐salaried equally valid
18

23/06/2015
Medical resources, directly needed for the intervention
Non‐medical resources needed for the intervention
Resource changes occur inside and outside of the health care system and both now and in the future.
Practical issues to guide costing method
A. Can they be measured with accuracy?
B. Can they be valued?
C. Are the costs large?
D. Will they be considered by the decision maker?
A. Can they be measured with accuracy?
HumansHow much time is given up
Prospective time‐and‐motion studiesIndividual activity diariesSurveys or interviews
SpaceUse plans or a tape measure
ThingsCount them
B. Can they be valued?
HumansFind out salariesInclude pension & leave costs
SpaceWhat does the market say space is worth
Things
Durable thingsupfront investment costs are allocatedmaintenance costs
Disposable thingsprice paid
19

23/06/2015
C. Are the costs large?
HumansPeople are expensive, depends on their time
SpaceHow much space is required and is it valuable
ThingsDepends on the project (robot surgery vs. hand hygiene)
Medical resources, directly needed for the intervention
Non‐medical resources needed for the intervention
Patient time including productivity changes
time of informal carers and other costs of informal care
Ward Manager Hospital CEO Minister
?
?
?
D. Will they be considered by the decision maker?
How to measure health benefits
20

23/06/2015
“procedures should be ranked so that activities that generate more gains to health for every £ of resources take priority over those that generate less; thus the general standard of health in the community would be correspondingly higher”
Medical Management or CABG
gains to health are used for cost effectiveness analysis….often cost‐utility analysis
Include gains to both duration of life quality of life
Quality Adjusted Life Years
QALYs
Estimate changes to the quantity of life
Expressed as survival, few problems of comparison
ALIVE DEAD
21

23/06/2015
QALYs
Estimate changes to the quality of life
Index of health utility between zero and one
1
0The advantage of QALYs All changes to health can be valued an so any health programme compared
Where do health utility weights come from?
Describe the health state Value it
fully mobile, no physical pain, able to engage socially that’s worth ?
Social function restrictions, no pain, some psychological distress that’s worth ?
Low energy, some pain, minor psychological distress that’s worth?
unconscious, unable to move or function that’s worth?
Three popular approaches (that differ)
Visual Analogue Scale easy to use
Time Trade off experimentsforce choices
Standard Gamble experiments
22

23/06/2015
Visual Analogue Scale
10 years of perfect health followed by death □
9 years of perfect health followed by death □
8 years of perfect health followed by death □
7 years of perfect health followed by death □
6 years of perfect health followed by death □
5 years of perfect health followed by death □
4 years of perfect health followed by death □
3 years of perfect health followed by death □
2 years of perfect health followed by death □
1 years of perfect health followed by death □
□ 10 years with no sight followed by death
□ 10 years with no sight followed by death
□ 10 years with no sight followed by death
□ 10 years with no sight followed by death
□ 10 years with no sight followed by death
□ 10 years with no sight followed by death
□ 10 years with no sight followed by death
□ 10 years with no sight followed by death
□ 10 years with no sight followed by death
□ 10 years with no sight followed by death
Which option would you prefer?
Time Trade Off
Alternative 2 Alternative 1
How many years in perfect health will you trade for.
Divide years by 10 to get a utility score.
Standard Gamble
23

23/06/2015
0.1
0.2
0.3
0.4
0.5
0.6
0.7
0.8
0.9
1.0
Standard Gamble
Alternative 1 is you accept a treatment with a probability of perfect health or instant death
Alternative 2 is to remain in the health state
At what probability are you indifferent between alternatives?
probability
These exercises can be done on real patients with the health conditions
Advantage is it avoids need to describe the health state
Disadvantage is it adds distress to patients
Who should we get this information from?
An alternative is to use a Multi‐Attribute Utility Scale
Standardised health state classifications with pre‐existing set of utility weights
EQ‐5D is popular (AQoL is an Australian one)
Three levels for each dimension of health
1 = no problem2 = some problems3 = extreme problems
EQ‐5D
11111 = best possible health state
Health Utility Index close to 1
24

23/06/2015
Three levels for each dimension of health
1 = no problem2 = some problems3 = extreme problems
EQ‐5D
33333 = best possible health state
Health Utility Index close to zero
243 unique states exist
2
2
2
1
1 Josephine Patient is 22211
Josephine Patient occupies one of the 243 unique health states in the EQ‐5DThey have all been valued (TTO or SG) by a representative sample of the population
Her Health utility score is 0.57
EMBASE search
Research Question– Is screening for type 2 diabetes in adults cost effective?
Search terms (and synonyms)– Type 2 diabetes
– Screening
– Cost effectiveness (or economic evaluation)• https://sites.google.com/a/york.ac.uk/issg‐search‐filters‐resource/filters‐to‐find‐i
25

23/06/2015
Economic evaluation search filters
York university– https://sites.google.com/a/york.ac.uk/issg‐search‐filters‐resource/filters‐to‐find‐i
OptionsNHS EED – recommended
• http://www.crd.york.ac.uk/crdweb/searchstrategies.asp
SIGN – Pragmatic but untested• http://www.sign.ac.uk/methodology/filters.html#econ
HIRU – Tested but not pragmatic!• http://hiru.mcmaster.ca/hiru/HIRU_Hedges_EMBASE_Strategies.aspx
26

22/06/2015
Health Economics and
Systematic Review
Son Nghiem
HEALTH ECONOMICS
What is health economics?
A branch of economics concerned with issues related to efficiency, effectiveness, value and behavior in the
production and consumption of health and health care
Adapted from G. Baio (2013) Bayesian Methods in Health Economics
27

22/06/2015
What do health economists do?
• Analyze the efficiency and equity in health care financing
• Identify determinants of health care demand• Estimate and predict of trends in health care costs• Determine the labor market in health care• Analyzing the budget system and inventory management
Health
careEconomics
Health Economics
What is a Systematic Review?
A review of a clearly formulated questionthat uses systematic and explicit methodsto identify, select, and critically appraiserelevant research, and to collect and analyze data from the studies that are included in the review.
Cochrane Collaboration (2005) Glossary of Terms in The Cochrane Collaboration
QuestionScoping search
Full searchTitle and abstract screening
Full text screening
Additional searching
Included references agreed
Data extraction
Synthesis
Writing up
Reference management
Protocol
Update search
Full text retrieval
Systematic review process
Publication
28

22/06/2015
Systematic vs Traditional Review
Review Team
• Clinical expert – Initiates, defines, selects topic.
• Clinical expert – Partners in above process, and collaborates in review to prevent bias.
• Statistician– Provides methodological oversight, ensures process quality for entire
project.
• Librarian– Provides methodological oversight, ensues process quality for
information search process.
• Healthcare Consumer– Provides insight into the priorities for research, information conduit
for relating priorities and findings between consumers and clinicians.
29

22/06/2015
Research Questions
Example Research Question
• Are antiseptic washes more effective than non-antiseptic washes at preventing nosocomialinfections in patients undergoing surgery?
intervention comparison
outcome population
Mind map research question
Research question
1st
theme
4th
theme3rd
theme
2nd
theme
synonym
synonym
synonym
synonym
synonym
synonym
synonym
synonym
synonym
synonym synonym
synonym
30

22/06/2015
Construct search phrases
1st theme OR OR OR
AND
2nd theme OR OR OR
AND
3rd theme OR OR OR
AND
4th theme? OR OR OR
Example search phrase
(cost benefit* or cost effectiveness
or economic*)
AND
(disability
insurance[Title/Abstract] OR
national health[Title/Abstract] OR
health insurance[Title/Abstract])
NOT
(drug* or obesity or diabetes or
cancer or heart or wound* or
disease or illness)
Identifying sources
• Databases? Cochrane, NHS EED, HTA, DARE, Bibliomap
• Websites?Google? Search by Organisation
• Hand searching?Which journals are key to your work?
• Snowballing?WoK or Scopus
• Books?LibrarySearch or COPAC or GoogleBooks
• Grey literature?Google: blog search; SIGLE; conference proceedings
• Ongoing trials?Trials registers
31

22/06/2015
Reference management
SoftwareDatabase connectivity
Import format
Word processor integrationPDF Organization
BibDesk Good Excellent Lyx Good
EndNote Excellent Good MS Word, OpenOffice, Pages N/A
JabRef Good Excellent OpenOffice, MS Word, Lyx N/A
KBibTeX Excellent Fair Lyx N/A
Mendeley Excellent Fair MS Word, OpenOffice Excellent
Papers Excellent Poor MS Word, OpenOffice, Pages N/A
Qiqqa Fair Fair MS Word, Lyx N/A
Docear Poor Good MS Word, Pages, TexEdit, Lyx Excellent
Zotero Good Good MS Word, OpenOffice, GoogleDocs Good
META-ANALYSIS
• The analysis of other analyses
• Uses data from randomized controlled trials
• Aggregates and combines the results of comparable studies into a coherent account to discover main effects
• Often uses statistical processes
• Looks at effect size, not only statistical significance
• Combines the results of small-scale studies
• Uses transparent means to draw conclusions
Meta‐analysis
Synthesis: complete pooling
, , … , , , … , , , … ,
Study 1 Study 2 Study n
G. Baio (2013) Bayesian Methods in Health Economics
32

22/06/2015
Synthesis: No pooling
1
, , … , , , … , , , … ,
Study 1 Study 2 Study n
2 n
G. Baio (2013) Bayesian Methods in Health Economics
Synthesis: mixed
, , … , , , … , , , … ,
Study 1 Study 2 Study n
1 2 n
G. Baio (2013) Bayesian Methods in Health Economics
Bias in meta‐analysisPublication bias:
Studies never published
Studies with no beneficial effect of treatment
Studies sponsored by pharmaceutical industry
Studies from a single centre versus multiple centers
Language bias:
Positive findings published in a international journal
Negative findings published in a local journal
Database bias:
Journals not indexed in major databases
“Doing a meta-analysis is easy, doing one well is hard”Ingram Olkin
33

23/06/2015
Example paper
“Different strategies for screening and prevention of type 2 diabetes in adults: cost effectiveness analysis”
Questions
What type of economic evaluation does the paper describe?
What interventions are compared in the evaluation?
Where can you find the sources for the parameters of the economic evaluation?
Do you think screening for type II diabetes is cost effective? Why?
34

RESEARCH
Different strategies for screening and prevention of type 2diabetes in adults: cost effectiveness analysis
Clare L Gillies, lecturer in medical statistics ,1 Paul C Lambert, senior lecturer in medical statistics,1
Keith R Abrams, professor of medical statistics,1 Alex J Sutton, reader in medical statistics,1 Nicola J Cooper,MRC training fellow in health services research,1 Ron T Hsu, senior clinical teaching fellow in epidemiologyand public health,1 Melanie J Davies, professor of diabetesmedicine,2 Kamlesh Khunti, professor of primarycare diabetes and vascular medicine3
ABSTRACT
Objective To compare four potential screening strategies,
and subsequent interventions, for the prevention and
treatment of type 2 diabetes: (a) screening for type 2
diabetes to enable early detection and treatment, (b)
screening for type 2 diabetes and impaired glucose
tolerance, intervening with lifestyle interventions in those
with a diagnosis of impaired glucose tolerance to delay or
prevent diabetes, (c) as for (b) but with pharmacological
interventions, and (d) no screening.
DesignCost effectivenessanalysis basedondevelopment
and evaluation of probabilistic, comprehensive economic
decision analytic model, from screening to death.
Setting A hypothetical population, aged 45 at time of
screening, with above average risk of diabetes.
Data sourcesPublishedclinical trials andepidemiological
studies retrieved fromelectronicbibliographicdatabases;
supplementary data obtained from the Department of
Health statistics for England and Wales, the screening
those at risk (STAR) study, and the Leicester divisionof the
ADDITION study.
Methods A hybrid decision tree/Markov model was
developed to simulate the long term effects of each
screening strategy, in terms of both clinical and cost
effectiveness outcomes. The base case model assumed a
50 year time horizon with discounting of both costs and
benefits at 3.5%. Sensitivity analyses were carried out to
investigate assumptions of the model and to identify
which model inputs had most impact on the results.
Results Estimated costs for each quality adjusted life year
(QALY) gained (discounted at 3.5% a year for both costs
and benefits) were £14150 (€17560; $27860) for
screening for type 2 diabetes, £6242 for screening for
diabetes and impaired glucose tolerance followed by
lifestyle interventions, and £7023 for screening for
diabetes and impaired glucose tolerance followed by
pharmacological interventions, all compared with no
screening. At a willingness-to-pay threshold of £20000the probability of the intervention being cost effectivewas
49%, 93%, and 85% for each of the active screening
strategies respectively.
Conclusions Screening for type 2 diabetes and impaired
glucose tolerance, with appropriate intervention for those
with impaired glucose tolerance, in an above average risk
population aged 45, seems to be cost effective. The cost
effectiveness of a policy of screening for diabetes alone,
which offered no intervention to those with impaired
glucose tolerance, is still uncertain.
INTRODUCTION
In 2000, an estimated 171 million people worldwidehad diabetes and numbers are projected to double by2030.1 Life expectancy in people with diabetes mightbe shortenedbyasmuchas15years.2Currently there isno systematic or structured screening policy for type 2diabetes in the United Kingdom, though some generalguidance has recently been issued by the NationalScreening Committee.3 One approach to screeningwould be to screen only for type 2 diabetes, which willallow for early diagnosis and treatment. This might beimportant as early detection and treatment couldprevent future associated microvascular and macro-vascular complications. An estimated 50% of peoplewith diabetes are currently undiagnosed,4 and atpresentation around 20-30% have already developedcomplications.5 An alternative screening approachwould be to lower the threshold of the screening testand to screen for impaired glucose tolerance and type 2diabetes together. As well as allowing for earlierdiagnosis of type 2 diabetes, interventions can beadministered to those identified with impaired glucosetolerance to attempt to delay the onset of type 2diabetes. A recent systematic review andmeta-analysisof intervention trials for prevention of type 2 diabetes6
foundboth lifestyle andpharmacological interventionssignificantly reduced the risk of type 2 diabetes inpeople with impaired glucose tolerance.As no definitive trials have examined the effective-
ness of screening for type 2 diabetes or impairedglucose tolerance,7 8 assessment of such policies has sofar been conducted through simulation studies. Severaldecision models have been compiled that haveassessed either the clinical and cost effectiveness of
1Centre for Biostatistics andGenetic Epidemiology,Department of Health Sciences,University of Leicester, LeicesterLE1 7RH2Department of CardiovascularSciences, University of Leicester3Division of General Practice andPrimary Health Care, Departmentof Health Sciences, University ofLeicester
Correspondence to: C L [email protected]
doi:10.1136/bmj.39545.585289.25
BMJ | ONLINE FIRST | bmj.com page 1 of 11

interventions to prevent type 2 diabetes9-16 or strategiesfor screening and early detection of diabetes.7 17-20
Previous models of screening for type 2 diabetesalone have generally assessed the impact of earlytreatment on cardiovascular events, though someadditionally included microvascular events such asretinopathy. Overall most of the models producedfavourable results for screening, but cost effectivenessvaried with age group screened and the populationtargeted for screening. Only two studies reported costsfor a UK setting,7 19 one of which had a limited time
horizon of five years.19 Both of these studies concludedthere was still uncertainty concerning the cost effec-tiveness of screening for diabetes.Of the eight models assessing cost effectiveness of
interventions for prevention of diabetes, only threeincluded costs of identifying individuals with impairedglucose tolerance.10 12 16 The time horizon over whichthe models were run ranged from just three years afterthe intervention up to the expected lifetime of thepopulation. Models used data from various sourcesfrom published trials, epidemiological studies, andnational statistics. In general data were limited to a fewsources. All models compared a strategy of inter-ventions against no interventions, rather than screen-ing for impaired glucose tolerance followed byinterventions, compared with no screening. All butonemodel simulated populationswhere all individualshad impaired glucose tolerance at the start of themodeland the end state was development of diabetes, ordeath, hence only a limited section of the diseasepathway was modelled. Also the models did not takeinto account that screening for impaired glucosetolerance will at the same time allow individuals withundiagnoseddiabetes tobe identified, thus allowing forearly treatment and possibly reducing rates of compli-cations. Hence, while these studies offer an assessmentof the cost effectiveness of interventions for preventionof diabetes, none assessed the impact of screeningfollowed by interventions on the whole disease path-way. In 2007 Waugh et al assessed screening orintervention strategies for type 2 diabetes in a thoroughreview of previous decision models.7
We compared three active screening strategies: (a) aone-off screening for type 2 diabetes; (b) screening forimpaired glucose tolerance and type 2 diabetes andintervening with lifestyle interventions in those withimpaired glucose tolerance; and (c) as for (b) but withpharmacological interventions. We compared thesethree active screening strategies against a fourthstrategy of no screening (current practice). The fullpathway from screening, to interventions and treat-ment for type 2 diabetes, all the way through to death,was modelled. This model directly compares the twoalternative approaches of screening for type 2 diabetesalone or screening for impaired glucose tolerance andtype 2 diabetes together. When modelling the effec-tiveness of interventions,weused all data fromrelevantrandomised controlled trials6 and included uncertaintyaround model inputs when appropriate. By carryingout several sensitivity analyses we investigated theessential elements that affect the cost and clinicaleffectiveness of different screening policies.
METHODS
The hybrid model consists of a decision tree and aMarkov model (fig 1). The decision tree comprisesthree main arms, representing no screening, screeningfor undiagnosed type 2 diabetes, and screening forimpaired glucose tolerance and undiagnosed diabetes,with either lifestyle or pharmacological interventionsapplied in those with impaired glucose tolerance.
Positive
Negative
Screened forimpaired glucose
tolerance anddiabetes
Screeningresult
Truestatus
Decision treePrevalences are required for each arm, along with sensitivities and specificities of given
screening test. Decision tree determines starting numbers in each Markov state
Markov modelIncidence rates required for each transition, adjusted for intervention and treatment effects.
Four Markov models will be run, one for each screening/intervention strategy
Treatment orintervention
applied
Type 2 diabetes (screen detected)
Impaired glucose tolerance (diagnosed)
Normal glucose tolerance
Normal glucosetolerance
Death
Type 2 diabetes (undiagnosed)
Impaired glucose tolerance (undiagnosed)
Impaired glucosetolerance (undiagnosed)
Impaired glucosetolerance (diagnosed)
Type 2 diabetes(undiagnosed)
Type 2 diabetes(clinically detected)
Type 2 diabetes(screen detected)
Normal glucose tolerance
Yes
Yes
No
No
No
No
Positive
Not screened
Negative
Screened fordiabetes
Type 2 diabetes (screen detected)
Impaired glucose tolerance (undiagnosed)
Normal glucose tolerance
Type 2 diabetes (undiagnosed)
Impaired glucose tolerance (undiagnosed)
Normal glucose tolerance
Yes
No
No
Type 2 diabetes (undiagnosed)
Impaired glucose tolerance (undiagnosed)
Normal glucose tolerance
No
No
No
No
No
No
Fig 1 | Decision model comparing no screening, screening for type 2 diabetes, and screening for
impaired glucose tolerance and diabetesand intervening to delay or prevent type 2 diabetes with
either lifestyle or pharmacological interventions
RESEARCH
page 2 of 11 BMJ | ONLINE FIRST | bmj.com

Individualswhohave alreadybeen identified as havingtype 2 diabetes are excluded from the screeningprocess. The decision tree uses prevalence of impairedglucose tolerance and undiagnosed type 2 diabetes and
estimates sensitivity andspecificityof a screening test todetermine how many individuals from the populationstart in each state of the Markov model. The Markovmodel consists of seven states: normal glucose
Table 1 | Estimates used to determine parameters for decisionmodel
Parameter Distribution Value (SE) Source(s)
Data for decision tree
Prevalences Dirichlet Normal glucose tolerance 83%; impaired glucosetolerance 12%; type 2 diabetes 5%
STAR study24
Screening test efficiency Multi-nominal For type 2 diabetes: sensitivity 89.5%, specificity91.3%; for impaired glucose tolerance and type 2diabetes: sensitivity 59.4%, specificity 88.0%
STAR study24
Transition rates (per 100 person years)
Normal to impaired glucose tolerance:
<65 years Log normal 1.66 (0.08)Baltimore study33
≥65 years Log normal 2.49 (0.11)
Impaired glucose tolerance to type 2diabetes
Log normal 1.96 (0.25) 12 studies25-36
Time spent with undetecteddiabetes (years)
Log normal 1.65 (0.68) Harris37
Mortality rates (per 100 person years)
45-54 years — 0.32
DoH statistics (2000)
55-64 years — 0.84
65-74 years — 2.36
75-84 years — 6.09
≥85 years — 15.68
Increased risk of deathwithdiabetes(hazard ratio)
Log normal 0.756 (0.087) DECODE38
Increased risk of death for 1%increase in HbA1c (hazard ratio)
Log normal 0.104 (0.039) Rossing39
Intervention effects on risk of developing type 2 diabetes (hazard ratio)
Lifestyle v standard treatment Log normal −0.646 (0.099) 12 studies6
Antidiabetic drugs v placebo Log normal −0.425 (0.141) 9 studies6
HbA1c
Undiagnosed diabetes Normal 9.0% (0.056) UKPDS40
Screen detected diabetes Normal 7.0% (0.028) UKPDS41
Clinically detected diabetes Normal 7.9% (0.042) UKPDS41
Utilities
Undiagnosed diabetes Normal 0.788 (0.020)† ADDITION34
Screen detected diabetes Normal 0.788 (0.020)‡ ADDITION34
Clinically detected diabetes Normal 0.771 (0.035)‡ UKPDS43 44
Costs*
Screening tests:
FPG test — £0.40/personNHS (2006)
OGTT test — £1.30/person
Nurse cost — £26/hour Curtis45
Metformin intervention — £16.10/year NHS (2006)
Lifestyle intervention:
Year 1 — £398/yearAvenell9
Subsequent years — £280/year
Undiagnosed diabetes:
Year before diagnosis — £114/yearGulliford,46 Curtis45
Years 2-5 before diagnosis — £22/year
Diagnosed diabetes:
Screen detected Normal £2490 (53.3)/yearUKPDS47
Clinically detected Normal £2756 (63.1)/year
FPG=fasting plasma glucose; OGTT=oral glucose tolerance test.
*Costs are standardised to 2006.48
†Constant for all time spent with undetected type 2 diabetes.
‡Starting utility, which was then decreased for each year spent with diabetes because of predicted increases in complications, based on UKPDS
data.44 45
RESEARCH
BMJ | ONLINE FIRST | bmj.com page 3 of 11

tolerance, undiagnosed impaired glucose tolerance,diagnosed impairedglucose tolerance, death, and threestates for people with diabetes (undiagnosed, diag-nosed clinically, or diagnosed through screening,either from a screening test or because they arediagnosed with impaired glucose tolerance initiallyand hence enter a surveillance programme). We ranfour Markov models simultaneously, one for each ofthe screening strategies. Whether type 2 diabetes andimpaired glucose tolerance are diagnosed or undiag-noseddetermineswhether the patients receive relevanttreatments or interventions, and they are modelledaccordingly in terms of transition rates to other states.For example, individuals identified with impairedglucose tolerance receive an intervention and theestimated intervention effect slows their progression todevelopment of diabetes. Eachmodel cycle representsone year and the model is run for a time horizon of50 years. Table 1 summarised all the model inputs.When more than one estimate was available for aparameter, we pooled estimates using a Bayesianrandom effects meta-analysis within the comprehen-sivedecisionmodel.Model results includebothclinicaland cost effectiveness outcomes, with cost per qualityadjusted life year (QALY) being the primary outcome.We investigated both an undiscounted model and amodel with costs and benefits discounted at 3.5%
annually, as recommendedby theNational Institute forHealth and Clinical Excellence.21
The hybrid model was implemented within Win-BUGS using a Bayesian comprehensive decisionmodelling approach.22 We adopted this approachbecause of its flexibility in terms of statisticalmodellingand it enabled us to include and propagate alluncertainty in parameters throughout the model.22
We assumed non-informative prior distributions forall model parameters. Model parameters were esti-mated by usingMarkov chainMonte Carlo simulationmethods.23 Results are based on a sample of 20 000simulations, following a “burn in” of 10 000, and weassessed convergence of the Markov chain by visuallyinspecting trace plots and by running multiple chainswith different initial values.23 We have reported theresults from the decision model with 95% credibilityintervals, which are analogous to confidence intervals.
Data for the decision tree
The base case scenario for the model was a one-offscreening for a population aged 45, in whom type 2diabetes had not previously been diagnosed. Data forthe decision tree—that is, test sensitivity and specificityand prevalence of impaired glucose tolerance and type2 diabetes—were taken from the screening those at risk(STAR) study.24 For this study, individuals aged 40-75
Table 2 | Clinical and cost outcomes fromdecisionmodel, where prevalence of impaired glucose tolerancewas 15%and type 2
diabetes7.5%,andsensitivityandspecificityofscreeningtestswas85%and80%,respectively.Figuresaremeanvaluesperperson
(95%credible intervals) for no screening andmeandifference fromor comparedwithno screening (95%credible intervals) for all
other strategies
No screening Screening for diabetes only
Screening for diabetes and impaired glucose tolerance
Lifestyle interventionsPharmacologicalinterventions
Undiscounted
Total life years 30.34 (27.75 to 32.86) 0.06 (0.02 to 0.12) 0.15 (0.08 to 0.22) 0.13 (0.06 to 0.20)
QALYs 28.06 (23.49 to 32.01) 0.07 (−0.03 to 0.18) 0.22 (0.08 to 0.36) 0.17 (0.03 to 0.32)
Years spent without diabetes 20.85 (10.36 to 29.45) — 0.33 (0.21 to 0.43) 0.20 (0.10 to 0.37)
Lifetime risk of diabetes (%) 64.55 (18.02 to 91.83) — −0.98 (−0.50 to −1.42) −0.54 (−0.21 to −1.17)
Total cost 17 290 (5746 to 39580) 730 (−9 to 2341) 610 (−373 to 2693) 579 (−428 to 2658)
Cost per life year gained — 11 460 4179 4768
Cost per QALY gained — 8681 2863 3429
Cost per case prevented — — 62 810 105 000
Probability of cost effectiveness at willingness to pay threshold per QALY (%):
£20 000 68.1 98.6 94.7
£30 000 76.5 99.6 97.3
Discounted at 3.5% a year for both costs and benefits
Total life years 18.19 (17.25 to 18.98) 0.02 (−0.01 to 0.05) 0.05 (0.03 to 0.08) 0.05 (0.02 to 0.07)
QALYs 17.13 (15.02 to 18.49) 0.03 (−0.02 to 0.09) 0.09 (0.03 to 0.17) 0.07 (0.01 to 0.15)
Years spent diabetes free 13.69 (7.99 to 17.08) — 0.17 (0.11 to 0.23) 0.11 (0.06 to 0.19)
Total cost 7636 (2636 to 19 370) 587 (61 to 1525) 580 (−103 to 1760) 528 (−163 to 1719)
Cost per life year gained — 23 710 10 900 11 690
Cost per QALY gained — 14 150 6242 7023
Probability of cost effectiveness at willingness to pay threshold per QALY (%):
£20 000 48.6 93.0 85.0
£30 000 60.8 97.4 91.6
RESEARCH
page 4 of 11 BMJ | ONLINE FIRST | bmj.com

(white) or 25-75 (non-white) from 15 general practicesin Leicestershire who had at least one recognised riskfactor for type 2 diabetes were invited for screening.Risk factors includedaknownhistoryof coronaryheartdisease, hypertension, dyslipidaemia, cerebrovasculardisease, a first degree relative with type 2 diabetes, anda bodymass index (BMI) >25. Therefore the screeningdata included in the primary model were from apopulation considered to be “at risk”of type 2diabetes.For the base case model we used data only from whitepatients, though we used the data on South Asians forsensitivity analyses to assess results for different ethnicgroups.
Transition rates and HbA1c concentrations
To estimate annual transition rates we used severalsources, including epidemiological studies and clinicaltrials.25-36 To estimate the annual transition rate fromundiagnosed to clinically diagnosed diabetes, we usedthe estimated average timepeoplehavediabetes beforebeing diagnosed.37 We estimated the effects of inter-ventions on the transition from impaired glucosetolerance to diabetes using studies identified in a recentmeta-analysis of lifestyle and pharmacological inter-vention trials.6 Death rates were taken from Depart-ment of Health statistics for England and Wales for2000 and were increased for people with diabetescompared with those without.38 For the three diabeticstates (undiagnosed, clinically diagnosed, and screendetected) death rates varied depending on predictedHbA1c (haemoglobin A1c) concentrations.39 HbA1c
waspredicted to behighest in peoplewith undiagnoseddiabetes, as they are yet to receive any interventions,and was estimated by using HbA1c concentrations atentry to the UK prospective diabetes study40 before
treatment began. We expected HbA1c concentrationsto be the best controlled in people with diabetesdetected by screening because of early detection, andestimated levels using the 10 year average from theintensively treated group in the UK prospectivediabetes study.41 For people with clinically diagnoseddiabetes, we used the HbA1c concentrations of thegroup receiving conventional treatment in the UKprospective diabetes study.41
Quality of life variables
For the states of normal glucose tolerance, undiag-nosed impaired glucose tolerance, and diagnosedimpaired glucose tolerance, we assumed the utilityvalue to be that of full health and set at 1.We calculated
Value willing to pay for each QALY gained (£)
Prob
abil
ity
of b
eing
cos
t eff
ecti
ve
0 10 000 20 000 30 000 40 000 50 0000
0.2
0.4
0.6
0.8
1.0
Screening for impaired glucose tolerance anddiabetes followed by lifestyle interventions
Screening for impaired glucose tolerance anddiabetes followed by pharmacological interventions
Screening for diabetes only
Fig 2 | Cost effectiveness acceptability curves for each of three
active screening strategies compared with no screening
(discounted estimates)
Table 3 | Results (undiscounted)of sensitivity analyses for varyingprevalence ratesof impairedglucose tolerance,normalglucose
tolerance, and type 2 diabetes
Prevalence* No screeningScreening for type 2
diabetes only
Screening for type 2 diabetes and impaired glucosetolerance
Lifestyle interventionsPharmacologicalinterventions
QALY
83/12/5 28.06 (23.49 to 32.01) 28.12 (23.58 to 32.08) 28.26 (23.74 to 32.23) 28.22 (23.69 to 32.18)
70/20/10 28.26 (24.72 to 31.18) 28.26 (24.79 to 31.14) 28.47 (25.02 to 31.34) 28.41 (24.96 to 31.29)
10/60/30 23.75 (21.82 to 25.58) 24.16 (22.40 to 25.85) 24.91 (23.15 to 26.55) 24.67 (22.89 to 26.35)
Total cost (££)
83/12/5 17 290 (5746 to 39 580) 18 040 (7083 to 39 970) 17 910 (7124 to 39 740) 17 900 (7061 to 39 710)
70/20/10 21 320 (9132 to 41 270) 22 780 (12 470 to 41 840) 22 620 (12 650 to 41 370) 22 560 (12 540 to 41 420)
10/60/30 38 440 (19 740 to 49 690) 42 580 (32 660 to 51 190) 41 980 (33 990 to 49 980) 41 830 (33 530 to 50 090)
Cost per QALY gained (££)
83/12/5 — 8681 2863 3429
70/20/10 — 8617 3203 3809
10/60/30 — 8464 3148 3781
Probability (%) of being cost effective at willingness to pay threshold of ££20 000/££30 000 per QALY
83/12/5 — 68/76 99/100 95/97
70/20/10 — 68/76 98/99 93/96
10/60/30 — 68/76 98/99 93/96
*Impaired glucose tolerance/normal glucose tolerance/type 2 diabetes.
RESEARCH
BMJ | ONLINE FIRST | bmj.com page 5 of 11

utilities for thosewithundiagnosed and screendetecteddiabetes from EQ-5D data, using data on individualpatients made available by the Leicester arm of theADDITION study.42 The data were of a screendetected sample population with type 2 diabetes atbaseline. For peoplewith clinically diagnoseddiabetes,utilities were taken from those reported by the UKprospective diabetes study as this comprised a clini-cally detected sample.43 The utility for undiagnoseddiabeteswas kept constant for thewhole duration spentin this state as we assumed that if complicationsdeveloped, which reduced the quality of life, then adiagnosis would be made. For the states of clinicallyand screen detected diabetes we needed to account forthe fact that duration of diabetes would lead to anincreased number of complications and hence areduction in the utility value. This was done by usingreported complication rates, modelled for duration ofdiabetes and adjusted for estimated HbA1c
concentrations in each group and their estimated effecton utility values.43 44 Hence, utilities decreased for eachyear of duration of diabetes, to reflect increasingincidence of complications. Because of a higherpredicted HbA1c concentration, the utility value waslower at diagnosis and decreased marginally morerapidly in individuals clinically diagnosed comparedwith those who were screen detected.
Economic variables
We estimated costs from various sources. Screeningcosts included the costs of an initial screening test offasting plasma glucose and a confirmatory oral glucosetolerance test in those who tested positive. Weestimated the cost of nurse time of 5 minutes for thescreening test and 25 minutes for the oral glucosetolerance test.45 People with undiagnosed diabetesincur costs before diagnosis because of increased visitsto the general practitioner and prescriptions,46 with a
Table 4 | Results (undiscounted) of sensitivity analyses for varying compliance rates
Compliance No screeningScreening for type 2
diabetes only
Screening for type 2 diabetes and impaired glucosetolerance
Lifestyle interventionsPharmacologicalinterventions
Compliance with screening (%)
QALY:
100 28.06 (23.49 to 32.01) 28.12 (23.58 to 32.08) 28.26 (23.74 to 32.23) 28.22 (23.69 to 32.18)
70 28.06 (23.49 to 32.01) 28.07 (23.52 to 32.05) 28.17 (23.64 to 32.16) 28.14 (23.60 to 32.13)
50 28.06 (23.49 to 32.01) 28.04 (23.51 to 32.04) 28.13 (23.61 to 32.13) 28.10 (23.59 to 32.11)
Total cost (£):
100 17 290 (5746 to 39 580) 18 040 (7083 to 39 970) 17 910 (7124 to 39 740) 17 900 (7061 to 39 710)
70 17 290 (5746 to 39 580) 18 070 (6777 to 39 800) 18 080 (6957 to 39 620) 18 070 (6907 to 39 710)
50 17 290 (5746 to 39 580) 17 870 (6409 to 39 750) 17 930 (6705 to 39 680) 17 910 (6671 to 39 690)
Cost (£) per QALY gained:
100 — 8681 2863 3429
70 — 8732 3112 3800
50 — 8743 3515 4192
Probability of being cost effective at willingness to pay threshold of £20 000/£30 000 per QALY (%):
100 — 68/76 99/100 95/97
70 — 69/77 98/99 93/96
50 — 68/77 97/98 92/95
Compliance with interventions (%)
QALY:
100 28.06 (23.49 to 32.01) 28.12 (23.58 to 32.08) 28.26 (23.74 to 32.23) 28.22 (23.69 to 32.18)
70 28.06 (23.49 to 32.01) 28.12 (23.58 to 32.08) 28.22 (23.69 to 32.18) 28.19 (23.66 to 32.15)
50 28.06 (23.49 to 32.01) 28.12 (23.58 to 32.08) 28.19 (23.66 to 32.15) 28.17 (23.64 to 32.13)
Total cost (£):
100 17 290 (5746 to 39 580) 18 040 (7083 to 39 970) 17 910 (7124 to 39 740) 17 900 (7061 to 39 710)
70 17 290 (5746 to 39 580) 18 040 (7083 to 39 970) 18 140 (7343 to 39 950) 18 040 (7209 to 39 880)
50 17 290 (5746 to 39 580) 18 040 (7083 to 39 970) 18 261 (7455 to 40 050) 18 120 (7302 to 39 960)
Cost (£) per QALY gained:
100 — 2863 3429
70 — 4947 5039
50 — 6634 6243
Probability of being cost effective at willingness to pay threshold of £20 000/£30 000 per QALY (%):
100 — 99/100 95/97
70 — 94/97 89/94
50 — 88/93 84/90
RESEARCH
page 6 of 11 BMJ | ONLINE FIRST | bmj.com

reported average of three additional visits the yearbefore diagnosis and an average of 1.4 additional visitsin the two to five years before diagnosis. An estimationof these costswas included.45 For lifestyle interventionswe included dietitian costs and costs of twice weeklygroup exercise sessions, as detailed in a previousstudy.9 Costs of pharmacological interventions werebased on 250 mg of metformin three times a day, thestandard dose used by most intervention studies. Forpeople with diagnosed diabetes, we took averageannual costs of antidiabetic treatment, implementationof treatment, and costs of complications from the UKprospective diabetes study.47 For the people withdiabetes detected at screening, in whom we wouldexpect costs of complications to be lower,weused costsfrom the intensively treated arm of theUKprospectivediabetes study. For those with clinically diagnoseddiabetes, which represents how individuals are diag-nosed currently, we used the reported costs of theconventionally treated group. All costs are reported in2006 UK £, standardised by using inflation indices.45
Sensitivity analyses and model extensions
We carried out sensitivity analyses using a range ofvalues of prevalence of disease, as well as compliancelevels to both screening and interventions. Changingprevalence allows us to assess the effectiveness of thescreening strategies for different “at risk” populations.The effects of compliance to both screening andinterventions were also important as we assumed100% compliance to both in the base case model,which could never be achieved in practice.To evaluate the robustness of the model we also
carried out sensitivity analyses on model inputs,particularly those that were estimated from only oneor two sources or were thought to be important driversin themodel.Thesewere sensitivities of screening tests,
costs of interventions, costs of diabetes, effectiveness ofinterventions, previous distributions on the standarddeviations between studies of the four meta-analysesrun within the model, and the time horizon the modelwas run for.For the base case scenario we considered only a one-
off screening at age 45. The model was extendedfurther to assess the impact of having one or twoadditional screenings, at age 50 and 60. This was doneby applying the test sensitivities from the STAR studyto the numbers in the states of undiagnosed impairedglucose tolerance and type 2 diabetes at the corre-sponding model cycle and moving the individuals tothe relevant diagnosed state.Though the base case model used prevalences and
test sensitivities and specificities of a white population,the effect of screening a South Asian or a mixed racepopulation is also relevant in theUK. South Asians arethought to have a greater risk of type 2 diabetes, with agreater prevalence of impaired glucose tolerance and ahigher transition rate to type 2 diabetes. We extendedthis model with data from the STAR study andestimated the transition rate from impaired glucosetolerance to type 2 diabetes from the Indian diabetesprevention programme.48
RESULTS
Table 2 shows clinical and cost effectiveness outcomesfor an undiscountedmodel and amodel discounted forboth costs andbenefits at 3.5%ayear.Discounted costsfor each QALY gained, compared with no screening,were £14 150 (€17 560; $27 860) for type 2 diabetesscreening, £6242 for screening for diabetes andimpaired glucose tolerancewith lifestyle interventions,and£7023 for screening forbothdiabetes and impairedglucose tolerance with pharmacological interventions.Costs were lower in the undiscounted model: £8681,
Table 5 | Results ofmodel extensions for number of screens (undiscounted)
No of screens No screeningScreening for type 2
diabetes only
Screening for type 2 diabetes and impaired glucosetolerance
Lifestyle interventionsPharmacologicalinterventions
QALY
1 28.06 (23.49 to 32.01) 28.12 (23.58 to 32.08) 28.26 (23.74 to 32.23) 28.22 (23.69 to 32.18)
2 28.06 (23.49 to 32.01) 28.13 (23.74 to 32.06) 28.56 (24.74 to 32.30) 28.44 (24.45 to 32.24)
3 28.06 (23.49 to 32.01) 28.15 (23.86 to 32.16) 28.80 (25.04 to 32.32) 28.62 (24.70 to 32.26)
Total cost (££)
1 17 290 (5746 to 39 580) 18 040 (7083 to 39 970) 17 910 (7124 to 39 740) 17 900 (7061 to 39 710)
2 17 290 (5746 to 39 580) 18 850 (7491 to 40 980) 19 300 (7570 to 41 160) 19 150 (7468 to 41 150)
3 17 290 (5746 to 39 580) 19 670 (7735 to 42 110) 20 220 (7740 to 42 210) 19 860 (7621 to 42 210)
Cost per QALY gained (££)
1 — 8681 2863 3429
2 — 9544 2777 3317
3 — 10 360 2966 3517
Probability of being cost effective at willingness to pay threshold of ££20 000/££30 000 per QALY (%)
1 — 68/76 99/100 95/97
2 — 57/66 99/100 96/98
3 — 54/64 99/100 97/99
RESEARCH
BMJ | ONLINE FIRST | bmj.com page 7 of 11

£2863, and £3429 for every QALY gained, respec-tively. At a willingness to pay threshold of £20 000 perQALY the probability of each strategy being costeffectivewas49% for screening for type2diabetesonly,93% for screening for both diabetes and impairedglucose tolerance and lifestyle interventions, and 85%for screening for both diabetes and impaired glucosetolerance and pharmacological intervention. Figure 2shows cost effectiveness acceptability curves, illustrat-ing the probability of cost effectiveness over a range ofwillingness to pay thresholds.
Discounted QALYs gained compared with noscreening were 0.03 (−0.02 to 0.09) for diabetesscreening, 0.09 (0.03 to 0.17) for screening and lifestyleinterventions, and 0.07 (0.01 to 0.15) for screeningwithpharmacological interventions. Both the interventionstrategies showed potential benefits in terms of averageyears spent without diabetes and cases of diabetesprevented.Although clinical effects seem small, itmustbe remembered they are average gains across apopulation, in which only 17% had either impairedglucose tolerance or undiagnosed type 2 diabetes at thetime of screening.
Tables 3 and 4 show the results of the moreimportant sensitivity analyses (undiscounted). Increas-ing the prevalence of impaired glucose tolerance andtype 2 diabetes decreased the QALYs and increasedtotal costs of each screening strategy. The comparisonsof the three active screening/intervention strategiescompared with no screening remained fairly constantin terms of costs per QALY and probability of costeffectiveness (table 3). When we lowered compliancewith screening, the impact on results was also minimal(table 4). Reducing compliance with interventions,however, had a greater impact in that the total costs andcost per QALY gained increased for both the
screening/intervention strategies. The probabilitythat these strategies were cost effective comparedwithno screening still remainedhigh,withanestimatedprobability of 88% for screening with lifestyle inter-ventions and 84% for screening with pharmacologicalinterventions at the willingness to pay threshold of£20 000.
Other sensitivity analyses did not change the resultsenough to alter the conclusions of the model. Increas-ing the costs of both lifestyle and pharmacologicalinterventionsby a factor of 10 reduced theprobabilitiesof cost effectiveness of their respective screeningstrategies to 73% and 93%, at the willingness to paythresholdof£20 000. Increasing the costs ofdiabetesbya factor of two reduced the probability of costeffectiveness to 49% for screening for type 2 diabetesonly, 93% for screening with lifestyle interventions,and 85% for screening with pharmacological inter-ventions at the same threshold. As we increased thetime horizon the model was run for, the probability ofthe three active screening strategies being cost effectivecomparedwith no screening increased. This is becausethe benefits of screening or interventions are not allimmediate and most occur in later years of the model,when type 2 diabetes is either delayedor complicationsare reduced through early diagnosis and treatment.The intervention strategies became cost effective whenwe considered a time horizon of at least 30 years(probability of being cost effective of 0.97 for lifestyleand 0.91 for pharmacological interventions at thewillingness to pay threshold of £20 000). Overall, themodel’s conclusions were robust to changes made tothe sensitivity analyses, giving strength to the conclu-sions.
Tables 5 and 6 give the results of the modelextensions as undiscounted estimates. Increasing the
Table 6 | Results ofmodel extensions for different ethnic groups (undiscounted)
Ethnic group No screeningScreening for type 2
diabetes only
Screening for type 2 diabetes and impaired glucosetolerance
Lifestyle interventionsPharmacologicalinterventions
QALY
White 28.06 (23.49 to 32.01) 28.12 (23.58 to 32.08) 28.26 (23.74 to 32.23) 28.22 (23.69 to 32.18)
South Asian 25.24 (20.65 to 30.79) 25.35 (20.83 to 30.91) 25.47 (20.96 to 31.02) 25.43 (20.92 to 30.98)
Mixed* 27.10 (23.79 to 30.31) 27.18 (23.88 to 30.39) 27.32 (24.02 to 30.53) 27.27 (23.99 to 30.53)
Total cost (££)
White 17 290 (5746 to 39 580) 18 040 (7083 to 39 970) 17 910 (7124 to 39 740) 17 900 (7061 to 39 710)
South Asian 28 250 (10 170 to 55 120) 29 390 (12 270 to 55 490) 29 420 (12 500 to 55 220) 29 480 (12 550 to 55 270)
Mixed* 22 145 (8345 to 41 657) 23 051 (9820 to 42 131) 22 973 (9809 to 41 962) 22 976 (11 885 to 42 006)
Cost per QALY gained (££)
White — 8681 2863 3429
South Asian — 8168 4657 5643
Mixed* — 8523 3555 4497
Probability of being cost effective at willingness to pay threshold of ££20 000/££30 000 per QALY (%)
White — 68/76 99/100 95/97
South Asian — 68/75 89/94 83/88
Mixed* — 69/77 98/99 96/98
*Modelled as 30% South Asian and 70% white.
RESEARCH
page 8 of 11 BMJ | ONLINE FIRST | bmj.com

number of screenings of the population increased bothtotal costs and QALYs, which resulted in minimalincreases in the cost per QALY for each of the threeactive strategies (table 5).Whenwe ran themodel for aSouth Asian cohort, results for QALYs were lowerbecause of a higher prevalence of type 2 diabetes at thestart of the model and an increased rate of transition todiabetes (table 6). Neither increasing the number ofscreens nor consideringdifferent ethnic cohorts led to achange in the overall model conclusions, in that boththe strategies involving interventions for prevention ofdiabetes seem to be cost effective compared with noscreening in an “at risk” population.
DISCUSSION
Screening for impaired glucose tolerance in people atrisk of diabetes and intervening with either lifestyle orpharmacological interventions is a cost effective healthpolicy. Although screening for type 2 diabetes alonegave a relatively low predicted incremental cost perQALYof £14 150, because of uncertainty in themodelthe probability of this strategy being cost effective wasonly 49%at thewillingness to pay thresholdof £20 000.
Strengths and weaknesses
Previous studies have compared the cost and clinicaleffectiveness of intervening in people with impairedglucose to delay onset of type 2 diabetes.9-16 Resultswere all favourable in terms of cost and clinicaleffectiveness but as themodels were designed to assessthe effectiveness of interventions rather than screeningand intervening, none of themodels included a state ofundiagnosed diabetes and assumed management ofdiabetes started as soon as the disease developed. Ourmodel considered the whole screening and inter-vention pathway from screening to death and acomparison of different approaches to diabetes screen-ing and prevention.Differences in clinical outcomes between the no
screening strategy and the three active screeningstrategies were small, partly because they werereported as an average for a screened population withmixed glucose tolerance. Also microvascular andmacrovascular outcomes were not measured individu-ally in this model, which might show benefits from theearly detection or delay of type 2 diabetes.
Our model makes several assumptions. No transi-tion was allowed from normal glucose tolerance todiabeteswithout first passing through impairedglucosetolerance. This is because it is clinically unlikely that anindividual would change from normal glucose toler-ance to diabetes within a year, which is one modelcycle. No transition was allowed from diabetes back toimpairedglucose toleranceor from impaired tonormalglucose tolerance. This is clinically accurate becauseonce an individual has a diagnosis of type 2 diabetes,even if their glucose tolerance improves, they are stillclinically defined as having diabetes. Also once anindividual has had impaired glucose tolerance, even iftheir glucose tolerance improves their future risk ofdiabetes is probablymore similar to that in individualswith impaired glucose tolerance rather than those whohave always had normal glucose tolerance.Another assumption was that the HbA1c concentra-
tion of those with diabetes who were clinicallydiagnosed would be similar to the 10 year average ofan intensively treated group of people with diabetesfrom the UK prospective diabetes study.41 Thisassumption was made in the absence of long termclinical data on individuals whose diabetes wasdetected by screening. Although 10 year averages ofHbA1c concentrations were used for people withdiabetes, when we ran our model for longer timehorizons the HbA1c concentrations were potentiallyunderestimated, which means complication rates andtheir effects on utilities and mortality might also bemoderately underestimated. Further data are neededon how HbA1c concentration could be expected toincrease over time to allow more accurate modelling.Screening costs incorporated within the model
included only costs of the test and the nurse’s time,therefore representing the costs of opportunisticscreening. We did not include further costs ofestablishing systematic screening, such as the identifi-cation of eligible patients, the issuing of invitations toscreening, and the chasing up of non-attenders. Inpractice, these additional costs would be small for eachindividual screened, particularly if screening wasincorporated into current health checks.Whenmodel-ling costs of treatment and complications associatedwith diabetes, we used the average yearly costs takenfrom the UK prospective diabetes study. As costswould be expected to start off low and then increase,this means that costs of diabetes might be initiallyoverestimated when an individual receives the diag-nosis and eventually underestimated by this model. Inaddition, as average costs were used, we did notaccount for issues of competing risks of complicationsassociatedwith diabetes. Unfortunately, yearly data oncosts of diabetes, or how the occurrence of complica-tions impacted on the probability of other complica-tions occurring, were not available to enable us tomodel costs more accurately. The issue of competingrisks arises not just for costs but also for the annualprobabilities of complications. Ideally,weneeddataonindividual patients to enable the correlation structure
WHAT IS ALREADY KNOWN ON THIS TOPIC
In people with impaired glucose tolerance interventions are clinically and cost effective
Screening for type 2 diabetes to allow early detectionmight be cost effective in certain groups
WHAT THIS STUDY ADDS
Modelling the whole screening and intervention pathway from screening to death shows thatscreening for type 2 diabetes and impaired glucose tolerance, followed by interventions,seems to be cost effective compared with no screening
Uncertainty still exists concerning the cost effectivenessof screening for type2diabetes alone
Screening populations with a higher prevalence of glucose intolerance might result in betterclinical outcomes, although cost effectiveness seems unaffected
RESEARCH
BMJ | ONLINE FIRST | bmj.com page 9 of 11

in both the probabilities and costs to be appropriatelyaccounted for.
As we ran the model for a time horizon of 50 years,the screened population (aged 45 at the start) agedwitheach cycle of the model, thus, when possible, weincorporated time dependent model parameters. Forsome parameters, such as the treatment interventioneffects, however, we assumed that the effect wasconstant over time.Additionally, although compliancewas high in the intervention trials fromwhich estimatesof their effectiveness were obtained, it is still to bedetermined whether compliance could be maintainedoutside a trial setting. Therefore long term compliancewith interventions is an important consideration.Sensitivity analyses of compliance with interventionsfound that even with compliance rates as low as 50%,the screening strategies involving either lifestyle orpharmacological interventions were still cost effectivewhen compared with a strategy of no screening.
Conclusions
A policy of a one-off screening for type 2 diabetes andimpaired glucose tolerance, with appropriate inter-vention for those identified with impaired glucosetolerance, seems to be cost effective in an “at risk”population. Changing compliance with screening orinterventions or increasing the number of screeningsdid not change the conclusions of themodel.Given theuncertainty in the results presented here, particularlyfor the assessment of screening for type 2 diabetes,further research is needed on the long term clinicaleffects of early diagnosis. Furthermore, to model thetwo strategies that involved interventions more accu-rately, we require additional information on long termcompliance with interventions and their potentialharms and benefits.
We thank the STAR study, in particular Jenny Tringham, and the Leicester
arm of the ADDITION study, for providing the data on individual patients
that were used for the analyses. We also thank Philip Clarke for advice on
the UKPDS outcomes model.Contributors:CLG performed the data extraction and analyses, wrote the
first draft of the article, and is guarantor. KRA and PCL gave detailed advice
at all stages of the analyses. All authors contributed to the writing of the
paper and gave substantial advice and input into the study. KRA and KK
had the initial idea for this project.Funding:CLG is funded jointly by the UK Medical Research Council and the
Economic and Social Research Council, under an interdisciplinary
postgraduate research studentship in the social and medical sciences. NJC
is funded by a Medical Research Council training fellowship in health
services research.Competinginterests:MJD and KK have received sponsorship for attending
conferences and small honorariums and funding for research from
pharmaceutical companies that manufacture hypoglycaemic and anti-
obesity drugs. KRA has also received funding for research from
pharmaceutical companies that manufacture hypoglycaemic and anti-
obesity drugs and has acted as a paid consultant to consultancy
companies who undertake work for the healthcare industry generally.Ethical approval: Not required.Provenance and peer review: Not commissioned; externally peer
reviewed.
1 Wild S, Roglic G, Green A, Sicree R, King H. Global prevalence ofdiabetes: estimates for the year 2000 and projections for 2030.Diabetes Care 2004;27:1047-53.
2 Donnelly R, Emslie-Smith AM, Gardner ID, Morris AD. ABC of arterialand venous vascular disease: Vascular complications of diabetes.BMJ 2000;320:1062-6.
3 UK National Screening Committee. Handbook for vascular riskassessment, risk reduction and risk management. Leicester:University of Leicester, 2008.
4 King H, Aubert RE, HermanWH. Global burden of diabetes, 1995-2025: prevalence numerical estimates, and projections. DiabetesCare 1998;21:1414-31.
5 DECODE study group, European Diabetes Epidemiology Group.Glucose tolerance and mortality: comparison of WHO and AmericanDiabetes Association diagnostic criteria. Diabetes epidemiology:collaborative analysis of diagnostic criteria in Europe. Lancet1999;354:617-21.
6 Gillies CL, AbramsKR, Lambert PC, CooperNJ, SuttonAJ, HsuRT, et al.Pharmacological and lifestyle interventions toprevent or delay type2diabetes in people with impaired glucose tolerance. BMJ2007;334:299-302.
7 Waugh N, Scotland G, McNamee P, Gillett M, Brennan A, Goyder E,et al. Screening for type 2 diabetes: literature review and economicmodelling. Health Technol Assess 2007;11:1-125.
8 Davies MJ, Tringham JR, Troughton J, Khunti KK. Prevention of type 2diabetesmellitus. A reviewof theevidenceand its application inaUKsetting. Diabet Med 2004;21:403-14.
9 Avenell A, Broom J, Brown TJ, Poobalan A, Aucott L, Stearns SC, et al.Systematic review of the long-term effects and economicconsequences of treatments for obesity and implications for healthimprovement. Health Technol Assess 2004;8:1-182.
10 CaroJJ,GetsiosD,CarosI,KlittichWS,O’Brien JA.Economicevaluationof therapeutic interventions to prevent type 2 diabetes in Canada.Diabet Med 2004;21:1229-36.
11 Eddy DM, Schlessinger L, Kahn R. Clinical outcomes and cost-effectiveness of strategies for managing people at high risk fordiabetes. Ann Intern Med 2005;143:251-64.
12 Herman WH, Hoerger TJ, Brandle M, Hicks K, Sorensen S, Zhang P,et al. The cost-effectiveness of lifestyle modification or metformin inpreventing type2diabetes inadultswith impairedglucose tolerance.Ann Intern Med 2005;142:323-32.
13 Icks A, Rathmann W, Haastert B, Gandjour A, Holle R, John J, et al.Clinical and cost-effectiveness of primary prevention of type 2diabetes in a “real world” routing healthcare setting: model based onthe KORA Survey 2000. Diabet Med 2007;24:473-80.
14 Jacobs-van der Bruggen MAM, Bos G, Bemelmans WJ,Hoogenveen RT, Vijgen SM, Baan CA. Lifestyle interventions are cost-effective inpeoplewithdifferent levelsofdiabetes risk.DiabetesCare2007;30:128-34.
15 Palmer AJ, Roze S, Valentine WJ, Spinas GA, Shaw JE, Zimmet PZ.Intensive lifestyle changes or metformin in patients with impairedglucose tolerance: modeling the long-term health economicimplications of the diabetes prevention program in Australia, France,Germany, Switzerland, and the United Kingdom. Clin Ther2004;26:304-21.
16 Segal L, Dalton AC, Richardson J. Cost-effectiveness of the primaryprevention of non-insulin dependent diabetes mellitus. HealthPromot Int 1998;13:197-209.
17 CDCDiabetesCost-EffectivenessStudyGroup. Thecost-effectivenessof screening for type 2 diabetes. JAMA 1998;280:1757-63.
18 Chen THH, Yen MF, Tung TH. A computer simulated model for cost-effectivenessanalysis ofmass screening for type2diabetesmellitus.Diabetes Res Clin Pract 2001;54:S37-42.
19 Glumer C, Yuyun M, Griffin S, Farewell D, Spiegelhalter D,Kinmouth AL, et al. What determines the cost-effectiveness ofdiabetes screening? Diabetologia 2006;49:1536-44.
20 Hoerger TJ, Harris R, Hicks KA, Donahue K, Sorensen S, Engelgau M.Screening for type 2 diabetesmellitus: a cost-effectiveness analysis.Ann Intern Med 2004;140:756-8.
21 National Institute for Clinical Excellence. Guide to the methods oftechnology appraisal. London: NICE, 2004.
22 Cooper NJ, Sutton AJ, Abrams KR, Turner D,Wailoo A. Comprehensivedecision analytical modelling in economic evaluation: a Bayesianapproach. Health Econ 2004;13:203-26.
23 Spiegelhalter DJ, Thomas A, Best NG, Gilks W. BUGS: Bayesianinference using Gibbs sampling, version 1.4.1. Cambridge: MRCBiostatistics Unit, 2003.
24 Davies MJ, Tringham JR, Jarvis J, Skinner TC, Farooqi AM, Khunti K.Systematic screening for type 2 diabetes mellitus: results of a largepopulation based study targeting those with conventional riskfactors. Diabet Med 2005;22(suppl 2):99.
25 Bonora E, Kiechl S, Willeit J, Oberhollenzer F, Egger G, Meigs JB, et al.Population-based incidence rates and risk factors for type2diabetesin white individuals: the Bruneck study. Diabetes 2004;53:1782-9.
26 Chiasson JL, Josse RG, Gomis R, Hanefeld M, Karasik A, Laakso M.Acarbose for preventionof type2diabetesmellitus: theSTOP-NIDDMrandomised trial. Lancet 2002;359:2072-7.
RESEARCH
page 10 of 11 BMJ | ONLINE FIRST | bmj.com

27 DeVegt F,Dekker JM, JagerA,HienkensE,KostensePJ, StehouwerCD,et al. Relation of impaired fasting and postload glucosewith incidenttype 2 diabetes in a Dutch population: the Hoorn study. JAMA2001;285:2109-13.
28 Edelstein SL, Knowler WC, Bain RP, Andres R, Barrett-Connor EL,Dowse GK, et al. Predictors of progression from impaired glucosetolerance to NIDDM: an analysis of six prospective studies. Diabetes1997;46:701-10.
29 Eriksson J, Lindstrom J, Valle T, Aunola S, Hamalainen H, Ilanne-Parikka P, et al. Prevention of type II diabetes in subjects withimpaired glucose tolerance: the diabetes prevention study (DPS) inFinland.Studydesignand1-year interimreportonthefeasibilityof thelifestyle intervention programme. Diabetologia 1999;42:793-801.
30 Eriksson JG,LehtovirtaM,EhrnstromB,SalmelaS,GroopL. Long-termbeneficial effects of glipizide treatment on glucose tolerance insubjects with impaired glucose tolerance. J Intern Med2006;259:553-60.
31 Jarrett RJ, Keen H, Fuller JH, McCartney M. Worsening to diabetes inmen with impaired glucose tolerance (“borderline diabetes”).Diabetologia 1979;16:25-30.
32 Knowler WC, Barrett-Connor E, Fowler SE, Hamman RF, Lachin JM,Walker EA, et al. Reduction in the incidence of type 2 diabetes withlifestyle intervention or metformin. N Engl J Med 2002;346:393-403.
33 Meigs JB, Muller DC, Nathan DM, Blake DR, Andres R, BaltimoreLongitudinal Study. The natural history of progression from normalglucose tolerance to type 2 diabetes in the Baltimore longitudinalstudy of aging. Diabetes 2003;52:1475-84.
34 Rasmussen SS, Glumer C, SandbaekA, Lauritzen T, Borch-JohnsenK.Progression from impaired fasting glucose and impaired glucosetolerance to diabetes in a high-risk screening programme in generalpractice: the ADDITION study, Denmark. Diabetologia2006;50:293-7.
35 Wareham NJ, Byrne CD, Williams R, Day NE, Hales CN. Fastingproinsulin concentrations predict the development of type 2diabetes. Diabetes Care 1999;22:262-70.
36 Wein P, Beischer N, Harris C, Permezel M. A trial of simple versusintensified dietary modification for prevention of progression todiabetesmellitus inwomenwith impairedglucose tolerance.AustNZJ Obstet Gynaecol 1999;39:162-6.
37 Harris MI, Klein R, Welborn TA, KnuimanMW, Harris MI, Klein R, et al.Onset of NIDDM occurs at least 4-7 yr before clinical diagnosis.Diabetes Care 1992;15:815-9.
38 DECODE Study Group, European Diabetes Epidemiology Group.Glucose tolerance and mortality: comparison of WHO and AmericanDiabetes Association diagnostic criteria. Diabetes epidemiology:collaborative analysis of diagnostic criteria in Europe. Lancet1999;354:617-21.
39 Rossing P, Hougaard P, Borch-Johnsen K, Parving HH, Rossing P,Hougaard P, et al. Predictors of mortality in insulin dependentdiabetes: 10 year observational follow up study. BMJ1996;313:779-84.
40 Turner RC, Holman RR, Mathews DR, Oakes SF, Bassett PA,Stratton IM, et al. Study design, progress and performance (UKPDSVIII). Diabetologia 1991;34:877-90.
41 UK Prospective Diabetes Study (UKPDS) Group. Intensive blood-glucose control with sulphonylureas or insulin compared withconventional treatmentandriskofcomplicationsinpatientswithtype2 diabetes (UKPDS 33). Lancet 1998;352:837-53.
42 Srinivasan BT, Davies MJ, Webb D, Healey E, Farooqi A, Hiles S, et al.Baseline charactersitics and risk of progression from prediabetes totype 2 diabetes in a multiethnic, population based screening.Diabetic Med 2007;24(suppl 1):51.
43 Clarke P, Gray A, Holman R. Estimating utility values for health statesof type 2 diabetic patients using the EQ-5D (UKPDS 62).Med DecisMaking 2002;4:340-9.
44 Clarke PM, Gray AM, Briggs A, Farmer AJ, Fenn P, Stevens RJ, et al. Amodeltoestimatethelifetimehealthoutcomesofpatientswithtype2diabetes: the United Kingdom prospective diabetes study (UKPDS)outcomes model (UKPDS 68). Diabetologia 2004;47:1747-59.
45 Curtis L, Netten A. Unit costs of health and social care. Canterbury:Personal Social Services Research Unit, University of Kent, 2006.
46 Gulliford MC, Charlton J, Latinovic R. Increased utilization of primarycare 5 years before diagnosis of type 2 diabetes. Diabetes Care2005;28:47-52.
47 Clarke PM, Gray AM, Briggs A, Stevens RJ, Matthews DR, Holman RR.Cost-utility analyses of intensive blood glucose and tight bloodpressure control in type 2 diabetes. Diabetologia 2004;48:868-77.
48 Ramachandran A, Snehalatha C, Mary S, Mukesh B, Bhaskar AD,Vijay V. The Indian diabetes prevention programme shows thatlifestylemodificationandmetformin prevent type2diabetes inAsianIndian subjects with impaired glucose tolerance (IDPP-1).Diabetologia 2006;49:289-97.
Accepted: 25 March 2008
RESEARCH
BMJ | ONLINE FIRST | bmj.com page 11 of 11