Embed Size (px)
Citation preview

Cost and Performance Baseline for Fossil Energy Plants Volume 2: Coal to Synthetic Natural Gas and Ammonia July 5, 2011 DOE/NETL- 2010/1402

Disclaimer This report was prepared as an account of work sponsored by an agency of the United States Government. Neither the United States Government nor any agency thereof, nor any of their employees, makes any warranty, express or implied, or assumes any legal liability or responsibility for the accuracy, completeness, or usefulness of any information, apparatus, product, or process disclosed, or represents that its use would not infringe privately owned rights. Reference therein to any specific commercial product, process, or service by trade name, trademark, manufacturer, or otherwise does not necessarily constitute or imply its endorsement, recommendation, or favoring by the United States Government or any agency thereof. The views and opinions of authors expressed therein do not necessarily state or reflect those of the United States Government or any agency thereof.

COST AND PERFORMANCE BASELINE FOR FOSSIL ENERGY PLANTS
VOLUME 2: COAL TO SYNTHETIC NATURAL GAS AND AMMONIA
DOE/NETL-2010/1402
Final Report
July 5, 2011
NETL Contact: Larry Rath
Senior Analyst Office of Systems, Analyses and Planning
National Energy Technology Laboratory www.netl.doe.gov

This page intentionally left blank

Cost and Performance Baseline for Coal-to-SNG and Ammonia (Volume 2)
i
Table of Contents LIST OF EXHIBITS................................................................................................................... III PREPARED BY .........................................................................................................................VII ACKNOWLEDGMENTS ....................................................................................................... VIII LIST OF ACRONYMS AND ABBREVIATIONS .................................................................. IX EXECUTIVE SUMMARY ...........................................................................................................1
CONVERSION EFFICIENCY .............................................................................................................4 TOTAL OVERNIGHT COST .............................................................................................................5 FIRST YEAR COST OF PRODUCTION ...............................................................................................6 FIRST YEAR COST OF CO2 AVOIDED ...........................................................................................12 ECONOMIC PATHWAYS ...............................................................................................................13
1. INTRODUCTION ................................................................................................................19 2. GENERAL EVALUATION BASIS ...................................................................................21
2.1 SITE CHARACTERISTICS ..................................................................................................21 2.2 PLANT PRODUCTION CAPACITY ......................................................................................22 2.3 COAL CHARACTERISTICS ................................................................................................24 2.4 PRODUCT SPECIFICATIONS ..............................................................................................29 2.5 ENVIRONMENTAL TARGETS ............................................................................................30 2.6 CAPACITY FACTOR .........................................................................................................31 2.7 RAW WATER WITHDRAWAL AND CONSUMPTION ...........................................................32 2.8 COST ESTIMATING METHODOLOGY ................................................................................33
2.8.1 Capital Costs ....................................................................................................................................... 33 2.8.2 Operations and Maintenance Costs ..................................................................................................... 42 2.8.3 CO2 Transport, Storage, and Monitoring ............................................................................................ 43 2.8.4 Finance Structure, Discounted Cash Flow Analysis, and First-Year Cost of SNG ............................. 47 2.8.5 Ammonia Price .................................................................................................................................... 50
3. SNG AND SNG AND AMMONIA CO-PRODUCTION FACILITIES .........................55 3.1 MAJOR PROCESS AREAS .................................................................................................55
3.1.1 Coal Receiving and Storage................................................................................................................. 55 3.1.2 Coal Drying ......................................................................................................................................... 56 3.1.3 Air Separation Unit Choice ................................................................................................................. 58 3.1.4 Gasifier ................................................................................................................................................ 61 3.1.5 Water Gas Shift Reactors ..................................................................................................................... 62 3.1.6 Mercury Removal ................................................................................................................................. 63 3.1.7 Acid Gas Removal (AGR) Process Selection ....................................................................................... 64 3.1.8 Methanation, Synthetic Natural Gas Purification and Compression ................................................... 66 3.1.9 Pressure Swing Adsorber (Co-Production Cases Only) ...................................................................... 67 3.1.10 Ammonia Synthesis (Co-Production Cases Only)................................................................................ 67 3.1.11 Zinc Oxide Guard Bed ......................................................................................................................... 68 3.1.12 Sulfur Recovery/Tail Gas Cleanup Process Selection ......................................................................... 69 3.1.13 Slag Handling ...................................................................................................................................... 71 3.1.14 Steam Generation Island ..................................................................................................................... 72 3.1.15 Accessory Electric Plant ...................................................................................................................... 74 3.1.16 Instrumentation and Control................................................................................................................ 74
4. BITUMINOUS COAL CASES ...........................................................................................77 4.1 SYNTHETIC NATURAL GAS PRODUCTION USING ILLINOIS NO. 6 COAL ............................77
4.1.1 Process Description ............................................................................................................................. 77 4.1.2 Key System Assumptions ...................................................................................................................... 87 4.1.3 Sparing Philosophy .............................................................................................................................. 89

Cost and Performance Baseline for Coal-to-SNG and Ammonia (Volume 2)
ii
4.1.4 Cases 1 and 2 Performance Results ..................................................................................................... 89 4.1.5 Cases 1 and 2 Equipment Lists .......................................................................................................... 103 4.1.6 Cases 1 and 2 Cost Estimating .......................................................................................................... 118
4.2 SYNTHETIC NATURAL GAS AND AMMONIA CO-PRODUCTION USING ILLINOIS NO. 6 COAL129 4.2.1 Process Description ........................................................................................................................... 129 4.2.2 Key System Assumptions .................................................................................................................... 139 4.2.3 Cases 3 and 4 Performance Results ................................................................................................... 140 4.2.4 Cases 3 and 4 Equipment Lists .......................................................................................................... 155 4.2.5 Cases 3 and 4 Cost Estimating .......................................................................................................... 174
5. LOW RANK COAL CASES .............................................................................................185 5.1 SYNTHETIC NATURAL GAS PRODUCTION USING ROSEBUD PRB COAL ........................185
5.1.1 Process Description ........................................................................................................................... 185 5.1.2 Key System Assumptions .................................................................................................................... 192 5.1.3 Cases 5 and 6 Performance Results ................................................................................................... 193 5.1.4 Cases 5 and 6 Equipment Lists .......................................................................................................... 207 5.1.5 Cases 5 and 6 Cost Estimating .......................................................................................................... 223
5.2 SYNTHETIC NATURAL GAS PRODUCTION USING NORTH DAKOTA LIGNITE COAL ........234 5.2.1 Process Description ........................................................................................................................... 234 5.2.2 Key System Assumptions .................................................................................................................... 241 5.2.3 Cases 7 and 8 Performance Results ................................................................................................... 242 5.2.4 Cases 7 and 8 Equipment Lists .......................................................................................................... 256 5.2.5 Cases 7 and 8 Cost Estimating .......................................................................................................... 273
6. SUMMARY ........................................................................................................................285 6.1 PERFORMANCE ..............................................................................................................285 6.2 ECONOMICS ..................................................................................................................288 6.3 CARBON DIOXIDE EMISSIONS/MITIGATION ..................................................................291 6.4 RAW WATER WITHDRAWAL AND CONSUMPTION .........................................................292
7. REFERENCES ...................................................................................................................295

Cost and Performance Baseline for Coal-to-SNG and Ammonia (Volume 2)
iii
List of Exhibits Exhibit ES-1 Case Descriptions ..................................................................................................... 3Exhibit ES-2 Cost and Performance Summary and Environmental Profile .................................. 4Exhibit ES-3 Net Plant Conversion Efficiency (HHV) ................................................................. 5Exhibit ES-4 Total Overnight Cost and Total As-spent Capital ..................................................... 7Exhibit ES-5 Economic Parameters Used to Calculate FYCOP ................................................... 8Exhibit ES-6 FYCOP by Cost Component .................................................................................... 9Exhibit ES-7 FYCOP Sensitivity to ROE .................................................................................... 10Exhibit ES-8 FYCOP Sensitivity to Fuel Costs ........................................................................... 11Exhibit ES-9 FYCOP Sensitivity to Capacity Factor .................................................................. 11Exhibit ES-10 CO2 Avoided Cost ................................................................................................. 12Exhibit ES-11 Case 2 Economic Pathway with Favorable Financial Structure ........................... 14Exhibit ES-12 Case 4 Economic Pathway with Favorable Financial Structure ........................... 15Exhibit ES-13 Case 2 Economic Pathway with Mature Technology ........................................... 16Exhibit ES-14 Case 4 Economic Pathway with Mature Technology ........................................... 17Exhibit 2-1 Ambient Conditions .................................................................................................. 21Exhibit 2-2 Site Characteristics ................................................................................................... 22Exhibit 2-3 Proposed Capacity for SNG Plants in the United States .......................................... 23Exhibit 2-4 U.S. Ammonia Plants ................................................................................................ 23Exhibit 2-5 Illinois No. 6 Bituminous, Old Ben Mine ................................................................. 26Exhibit 2-6 Montana Rosebud PRB, Area D, Western Energy Co. Mine ................................... 27Exhibit 2-7 North Dakota Beulah-Zap Lignite, Freedom, ND Mine ........................................... 28Exhibit 2-8 SNG Pipeline Requirements ..................................................................................... 29Exhibit 2-9 Ammonia Quality Requirements .............................................................................. 30Exhibit 2-10 Capital Cost Levels and their Elements .................................................................. 33Exhibit 2-11 Features of an AACE Class 4 Cost Estimate ........................................................... 35Exhibit 2-12 AACE Guidelines for Process Contingency ........................................................... 38Exhibit 2-13 Owner’s Costs Included in TOC ............................................................................. 40Exhibit 2-14 CO2 Pipeline Specification ..................................................................................... 44Exhibit 2-15 Deep Saline Aquifer Specification ......................................................................... 45Exhibit 2-16 Global Economic Assumptions .............................................................................. 47Exhibit 2-17 Financial Structure for High Risk Fuels Projects ................................................... 48Exhibit 2-18 Economic Parameters for FYCOP Calculation ...................................................... 49Exhibit 2-19 Monthly U.S. Prices of Natural Gas and Ammonia ............................................... 51Exhibit 2-20 Price Projections for Natural Gas Consumers ........................................................ 52Exhibit 2-21 Global Ammonia Utilization .................................................................................. 52Exhibit 2-22 U.S. Farmer Ammonia and Industrial Natural Gas Prices ...................................... 53Exhibit 3-1 WTA Process Schematic .......................................................................................... 58Exhibit 3-2 Typical ASU Process Schematic .............................................................................. 61Exhibit 3-3 Haldor Topsoe TREMP™ High Temperature Methanation Process ....................... 66Exhibit 3-4 Ammonia Synthesis Loop Configuration ................................................................. 68Exhibit 3-5 Typical Three-Stage Claus Sulfur Plant ................................................................... 70Exhibit 4-1 Case 1 Block Flow Diagram, Bituminous Coal to SNG without Carbon
Sequestration ......................................................................................................................... 78

Cost and Performance Baseline for Coal-to-SNG and Ammonia (Volume 2)
iv
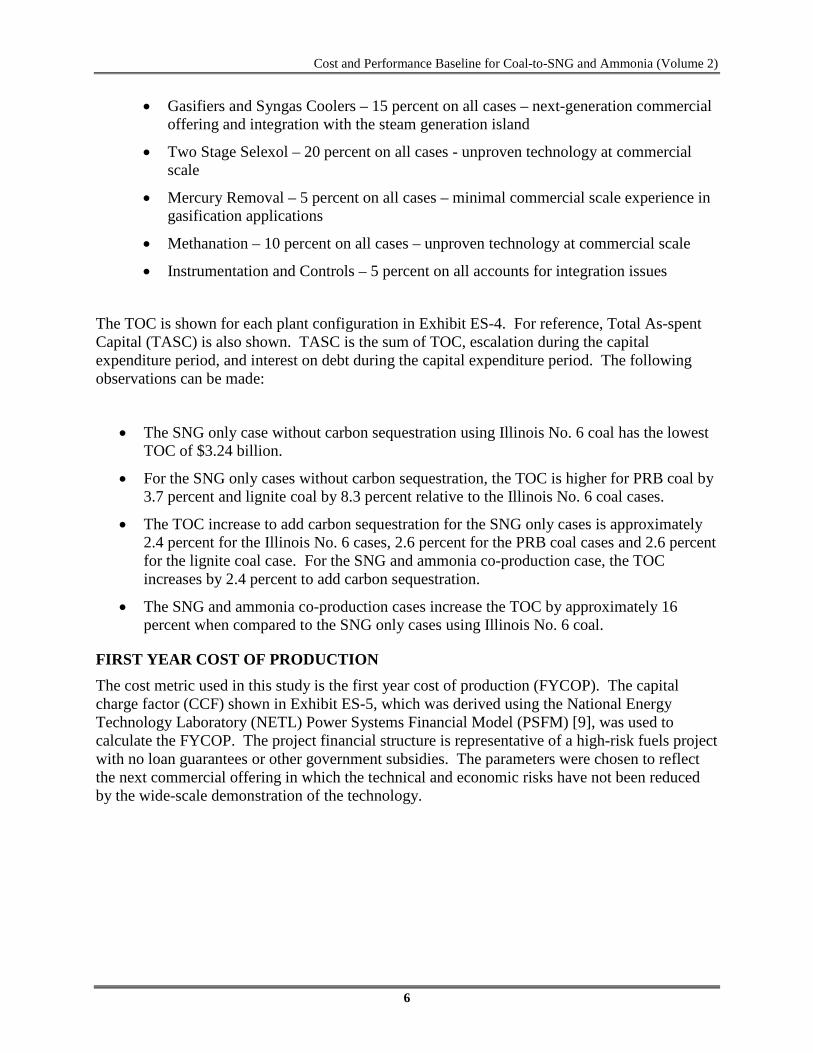
Exhibit 4-2 Case 1 Stream Table, Bituminous Coal to SNG without Carbon Sequestration ...... 79Exhibit 4-3 Case 2 Block Flow Diagram, Bituminous Coal to SNG with Carbon Sequestration 81Exhibit 4-4 Case 2 Stream Table, Bituminous Coal to SNG with Carbon Sequestration ........... 82Exhibit 4-5 Cases 1 and 2 Plant Study Configuration Matrix ..................................................... 87Exhibit 4-6 Balance of Plant Assumptions .................................................................................. 88Exhibit 4-7 Cases 1 and 2 Plant Performance Summary ............................................................. 90Exhibit 4-8 Cases 1 and 2 Air Emissions ..................................................................................... 91Exhibit 4-9 Cases 1 and 2 Carbon Balance .................................................................................. 92Exhibit 4-10 Cases 1 and 2 Sulfur Balance ................................................................................. 93Exhibit 4-11 Cases 1 and 2 Water Balance .................................................................................. 94Exhibit 4-12 Case 1 Gasification and ASU Heat and Mass Balance ........................................... 96Exhibit 4-13 Case 1 Gas Cleanup Heat and Mass Balance ......................................................... 97Exhibit 4-14 Case 1 Methanation and Power Block Heat and Mass Balance ............................. 98Exhibit 4-15 Case 2 Gasifier and ASU Heat and Mass Balance ................................................. 99Exhibit 4-16 Case 2 Gas Cleanup Heat and Mass Balance ....................................................... 100Exhibit 4-17 Case 2 Methanation and Power Block Heat and Mass Balance ........................... 101Exhibit 4-18 Cases 1 and 2 Energy Balance .............................................................................. 102Exhibit 4-19 Case 1 Total Plant Cost Details ............................................................................ 119Exhibit 4-20 Case 1 Initial and Annual O&M Costs ................................................................. 123Exhibit 4-21 Case 2 Total Plant Cost Details ............................................................................ 124Exhibit 4-22 Case 2 Initial and Annual O&M Costs ................................................................. 128Exhibit 4-23 Case 3 Block Flow Diagram, Bituminous Coal to SNG and Ammonia without
Carbon Sequestration .......................................................................................................... 131Exhibit 4-24 Case 3 Stream Table, Bituminous Coal to SNG and Ammonia without Carbon
Sequestration ....................................................................................................................... 132Exhibit 4-25 Case 4 Block Flow Diagram, Bituminous Coal to SNG and Ammonia with Carbon
Sequestration ....................................................................................................................... 135Exhibit 4-26 Case 4 Stream Table, Bituminous Coal to SNG and Ammonia with Carbon
Sequestration ....................................................................................................................... 136Exhibit 4-27 Cases 3 and 4 Plant Study Configuration Matrix ................................................. 139Exhibit 4-28 Cases 3 and 4 Plant Performance Summary ......................................................... 141Exhibit 4-29 Cases 3 and 4 Air Emissions ................................................................................. 142Exhibit 4-30 Cases 3 and 4 Carbon Balance .............................................................................. 143Exhibit 4-31 Cases 3 and 4 Sulfur Balance ............................................................................... 144Exhibit 4-32 Cases 3 and 4 Water Balance ................................................................................ 145Exhibit 4-33 Case 3 Gasification and ASU Heat and Mass Balance ......................................... 146Exhibit 4-34 Case 3 Gas Cleanup Heat and Mass Balance ....................................................... 147Exhibit 4-35 Case 3 Methanation and Power Block Heat and Mass Balance ........................... 148Exhibit 4-36 Case 3 Ammonia Production Heat and Mass Balance ......................................... 149Exhibit 4-37 Case 4 Gasification and ASU Heat and Mass Balance ......................................... 150Exhibit 4-38 Case 4 Gas Cleanup Heat and Mass Balance ....................................................... 151Exhibit 4-39 Case 4 Methanation and Power Block Heat and Mass Balance ........................... 152Exhibit 4-40 Case 4 Ammonia Production Heat and Mass Balance ......................................... 153Exhibit 4-41 Cases 3 and 4 Energy Balance .............................................................................. 154Exhibit 4-42 Case 3 Total Plant Cost Details ............................................................................ 175Exhibit 4-43 Case 3 Initial and Annual O&M Costs ................................................................. 179

Cost and Performance Baseline for Coal-to-SNG and Ammonia (Volume 2)
v
Exhibit 4-44 Case 4 Total Plant Cost Details ............................................................................ 180Exhibit 4-45 Case 4 Initial and Annual O&M Costs ................................................................. 184Exhibit 5-1 Case 5 Block Flow Diagram, Subbituminous Rosebud PRB Coal to SNG without
Carbon Sequestration .......................................................................................................... 186Exhibit 5-2 Case 5 Stream Table, Subbituminous Rosebud Coal to SNG without Carbon
Sequestration ....................................................................................................................... 187Exhibit 5-3 Case 6 Block Flow Diagram, Subbituminous Rosebud Coal to SNG with Carbon
Sequestration ....................................................................................................................... 189Exhibit 5-4 Case 6 Stream Table, Subbituminous Rosebud PRB Coal to SNG with Carbon
Sequestration ....................................................................................................................... 190Exhibit 5-5 Cases 5 and 6 Plant Study Configuration Matrix ................................................... 192Exhibit 5-6 Cases 5 and 6 Plant Performance Summary ........................................................... 194Exhibit 5-7 Cases 5 and 6 Air Emissions ................................................................................... 195Exhibit 5-8 Cases 5 and 6 Carbon Balance ................................................................................ 196Exhibit 5-9 Cases 5 and 6 Sulfur Balance ................................................................................. 197Exhibit 5-10 Cases 5 and 6 Water Balance ................................................................................ 198Exhibit 5-11 Case 5 Gasification and ASU Heat and Mass Balance ......................................... 200Exhibit 5-12 Case 5 Gas Cleanup Heat and Mass Balance ....................................................... 201Exhibit 5-13 Case 5 Methanation and Power Block Heat and Mass Balance ........................... 202Exhibit 5-14 Case 6 Gasification and ASU Heat and Mass Balance ......................................... 203Exhibit 5-15 Case 6 Gas Cleanup Heat and Mass Balance ....................................................... 204Exhibit 5-16 Case 6 Methanation and Power Block Heat and Mass Balance ........................... 205Exhibit 5-17 Cases 5 and 6 Energy Balance .............................................................................. 206Exhibit 5-18 Case 5 Total Plant Cost Details ............................................................................ 224Exhibit 5-19 Case 5 Initial and Annual O&M Costs ................................................................. 228Exhibit 5-20 Case 6 Total Plant Cost Details ............................................................................ 229Exhibit 5-21 Case 6 Initial and Annual O&M Costs ................................................................. 233Exhibit 5-22 Case 7 Block Flow Diagram, North Dakota Lignite Coal to SNG without Carbon
Sequestration ....................................................................................................................... 235Exhibit 5-23 Case 7 Stream Table, North Dakota Lignite Coal to SNG without Carbon
Sequestration ....................................................................................................................... 236Exhibit 5-24 Case 8 Block Flow Diagram, North Dakota Lignite to SNG with Carbon
Sequestration ....................................................................................................................... 238Exhibit 5-25 Case 8 Stream Table, North Dakota Lignite Coal to SNG with Carbon
Sequestration ....................................................................................................................... 239Exhibit 5-26 Cases 7 and 8 Plant Study Configuration Matrix ................................................. 241Exhibit 5-27 Cases 7 and 8 Plant Performance Summary ......................................................... 243Exhibit 5-28 Cases 7 and 8 Air Emissions ................................................................................. 244Exhibit 5-29 Cases 7 and 8 Carbon Balance .............................................................................. 245Exhibit 5-30 Cases 7 and 8 Sulfur Balance ............................................................................... 246Exhibit 5-31 Cases 7 and 8 Water Balance ................................................................................ 247Exhibit 5-32 Case 7 Gasification and ASU Heat and Mass Balance ......................................... 249Exhibit 5-33 Case 7 Gas Cleanup Heat and Mass Balance ....................................................... 250Exhibit 5-34 Case 7 Methanation and Power Block Heat and Mass Balance ........................... 251Exhibit 5-35 Case 8 Gasification and ASU Heat and Mass Balance ......................................... 252Exhibit 5-36 Case 8 Gas Cleanup Heat and Mass Balance ....................................................... 253

Cost and Performance Baseline for Coal-to-SNG and Ammonia (Volume 2)
vi
Exhibit 5-37 Case 8 Methanation and Power Block Heat and Mass Balance ........................... 254Exhibit 5-38 Cases 7 and 8 Energy Balance .............................................................................. 255Exhibit 5-39 Case 7 Total Plant Cost Details ............................................................................ 274Exhibit 5-40 Case 7 Initial and Annual O&M Costs ................................................................. 278Exhibit 5-41 Case 8 Total Plant Cost Details ............................................................................ 279Exhibit 5-42 Case 8 Initial and Annual O&M Costs ................................................................. 283Exhibit 6-1 Performance, Emissions, and Cost Results ............................................................. 286Exhibit 6-2 Net Plant Conversion Efficiency (HHV) ................................................................ 287Exhibit 6-3 SNG Heating Values ............................................................................................... 287Exhibit 6-4 Total Overnight Cost and Total As-spent Capital .................................................. 289Exhibit 6-5 First Year Cost of Production ................................................................................. 290Exhibit 6-6 First Year Cost of Production Components ............................................................ 290Exhibit 6-7 Impact of CO2 Tax on FYCOP ............................................................................... 291Exhibit 6-8 CO2 Emissions Normalized by Thermal Input ....................................................... 292Exhibit 6-9 Raw Water Withdrawal and Consumption ............................................................. 293

Cost and Performance Baseline for Coal-to-SNG and Ammonia (Volume 2)
vii
PREPARED BY
Research and Development Solutions, LLC (RDS)
:
UPDATED BY
Energy Sector Planning and Analysis (ESPA)
:
Robert D. Brasington formerly of Parsons Corporation
John L. Haslbeck Booz Allen Hamilton
Norma J. Kuehn Booz Allen Hamilton
Eric G. Lewis Booz Allen Hamilton
Lora L. Pinkerton WorleyParsons Group, Inc.
Marc Turner Booz Allen Hamilton
Elsy Varghese WorleyParsons Group Inc.
Mark Woods Booz Allen Hamilton
DOE Contract # DE-FE0004001

Cost and Performance Baseline for Coal-to-SNG and Ammonia (Volume 2)
viii
Acknowledgments This report was initially prepared by Research and Development Solutions, LLC (RDS) for the United States Department of Energy’s (DOE) National Energy Technology Laboratory (NETL) under DOE NETL Contract Number DE-AM26-04NT41817; Subtask 41817-401.01.04. The report was updated by Booz Allen Hamilton Inc. under DOE NETL Contract Number DE-FE0004001, Energy Sector Planning and Analysis.
The authors wish to acknowledge the excellent guidance, contributions, and cooperation of the NETL staff and other past contributors, particularly:
Larry Rath, Director of Performance Division of the Office of Program Planning, and Analysis
The authors also wish to acknowledge the valuable input to this study provided by Siemens Energy, Inc, and Leucadia Energy, LLC. However, participation by outside parties is not an endorsement of any technology or project nor does it imply that the outside party certifies or endorses the results of the work.

Cost and Performance Baseline for Coal-to-SNG and Ammonia (Volume 2)
ix
AACE Association for the Advancement of Cost Engineering LIST OF ACRONYMS AND ABBREVIATIONS
AEO Annual Energy Outlook AF Availability factor AFUDC Allowance for funds used during construction AGR Acid gas removal Aspen AspenPlus® ASU Air separation unit BEC Bare erected cost BFD Block flow diagram BFP Boiler feed pump BFW Boiler feedwater Btu British thermal unit Bscf Billion standard cubic foot Btu/lb British thermal unit per pound Btu/scf British thermal unit per standard cubic foot C4+ Butane + higher paraffins CCF Capital Charge Factor CCPI Clean Coal Power Initiative CCS Carbon capture and sequestration CFBC Circulating fluidized bed combustor cfm Cubic feet per minute CL Closed-loop cm Centimeter CO Carbon monoxide CO2 Carbon dioxide CoP Conoco Phillips COP Cost of production COS Carbonyl sulfide CRT Cathode ray tube CS Carbon steel CS2 Carbon disulfide CT Combustion turbine CWP Circulating water pump CWS Circulating water system CWT Cold water temperature DCS Distributed control system DI De-ionized DOE Department of Energy EIA Energy Information Administration EM Electromagnetic EOR Enhanced oil recovery EPA Environmental Protection Agency
Cost and Performance Baseline for Coal-to-SNG and Ammonia (Volume 2)
x
EPC Engineer/Procure/Construct EPRI Electric Power Research Institute EPCM Engineering/Procurement/Construction Management FBG Fluidized bed gasifier FEED Front-End Engineering Design ESPA Energy Sector Planning and Analysis FERC Federal Energy Regulatory Commission FGT Florida gas transmission FOAK First-of-a-kind ft Foot, Feet FW Feedwater FYCOP First year cost of production gal Gallon GDP Gross domestic product GEE General Electric Energy GHG Greenhouse gas GJ/hr Gigajoule per hour gpm Gallons per minute GRE Great River Energy H2 Hydrogen H2S Hydrogen sulfide Hg Mercury HHV Higher heating value hp Horsepower HP High-pressure HVAC Heating, ventilating, and air conditioning HWT Hot water temperature Hz Hertz ICR Information Collection Request IDGCC Integrated Drying and Gasification Combined Cycle IGCC Integrated gasification combined cycle IP Intermediate-pressure kg/GJ Kilogram per gigajoule kg/hr Kilogram per hour kJ/Nm3 Kilojoule per normal cubic meter kJ/kg Kilojoule per kilogram km Kilometer KO Knockout kV Kilovolt kW, kWe Kilowatts electric kWth Kilowatt thermal lb/hr Pound per hour lb/MMBtu Pound per million British thermal units

Cost and Performance Baseline for Coal-to-SNG and Ammonia (Volume 2)
xi
LCOP Levelized cost of production LF Levelization Factor LNG Liquefied natural gas LHV Lower heating value LP Low-pressure lpm Liters per minute m Meters m3/min Cubic meter per minute md Millidarcy MMBtu Million British thermal units (also shown as 106 Btu) MMBtu/hr Million British thermal units (also shown as 106 Btu) per hour MMkJ Million kilojoules (also shown as 106 kJ) MMscf Million standard cubic feet MNm3 Thousand normal cubic meters BNm3 Billion normal cubic meters mol% Mole percent MPa Megapascal MVA Mega volt-amp MW Megawatt MWh Megawatt-hour MWth Megawatts thermal N/A Not applicable NDL North Dakota Lignite NETL National Energy Technology Laboratory NGCC Natural gas combined cycle NH3 Ammonia Nm3 Normal cubic meter Nm3/min Normal cubic meter per minute NOAK Nth-of-a-kind No. Number NOx Oxides of nitrogen O eqv Oxygen equivalents O&GJ Oil and Gas Journal O&M Operation and maintenance O2 Oxygen OCFn Category n fixed operating cost for the initial year of operation PAS PAS, Inc. PC Pulverized coal PM Particulate matter POTW Publicly Owned Treatment Works ppm Parts per million ppmv Parts per million volume PRB Powder River Basin

Cost and Performance Baseline for Coal-to-SNG and Ammonia (Volume 2)
xii
PSA Pressure Swing Adsorption PSFM Power Systems Financial Model psi Pound per square inch psia Pound per square inch absolute psig Pound per square inch gage R&D Research and development RDS Research and Development Solutions, LLC ROE Return on equity RWE Rheinisch-Wesfälisches Elektrizitatswerk (German company) SC Supercritical scf Standard cubic feet scfm Standard cubic feet per minute SCOT Shell Claus Off-gas Treating SFG Siemens Fuel Gasification SG Specific gravity SGC Synthesis gas cooler SGS Sour gas shift SNG Synthetic Natural Gas SO2 Sulfur dioxide SRU Sulfur recovery unit STG Steam turbine generator Syngas Synthesis gas TASC Total as-spent cost TGTU Tail gas treating unit TOC Total overnight cost Tonne Metric Ton (1000 kg) TPC Total plant cost TPH Ton per hour TS&M Transport, storage, and monitoring USDA United States Department of Agricultural vol% Volume percent WB Wet bulb WGS Water gas shift wt% Weight percent WTA German acronym for “fluidized bed dryer with integrated waste heat recovery” ZnO Zinc oxide $/GJ Dollars per gigajoule $/MMBtu Dollars per million British thermal units $/MMkJ Dollars per million kilojoule $/ton Dollars per ton °C Degrees Celsius °F Degrees Fahrenheit 5-10s 50-hour work-week

Cost and Performance Baseline for Coal-to-SNG and Ammonia (Volume 2)
1
The objective of this report is to present an accurate, independent assessment of the cost and performance of bituminous, subbituminous, and lignite coal conversion systems, specifically for the production of synthetic natural gas (SNG) and ammonia, using a consistent economic approach that accurately reflects current market conditions for plants starting operation in the near term. This is Volume 2 of a four volume report. The four volume series consists of the following:
EXECUTIVE SUMMARY
• Volume 1: Bituminous Coal and Natural Gas to Electricity
• Volume 2: Coal to Synthetic Natural Gas and Ammonia (Various Coal Ranks)
• Volume 3: Low Rank Coal and Natural Gas to Electricity
• Volume 4: Bituminous Coal to Liquid Fuels with Carbon Capture
Volume 1 entitled Cost and Performance Baseline for Fossil Energy Power Plants Study, Volume 1: Bituminous Coal and Natural Gas to Electricity was recently revised and re-released in November 2010. Volume 3 was published in 2011 and Volume 4 is scheduled for publication later in 2011.
The cost and performance of a coal-to-SNG plant, with and without ammonia co-production, were evaluated in this study. The results are expected to be valuable to policy makers and will help guide research and development (R&D) efforts necessary to make SNG more cost competitive. Selection of new technologies will depend on many factors, including:
• Capital and operating costs;
• Overall conversion efficiency;
• Fuel prices;
• Cost of production (COP);
• Availability, reliability, and environmental performance; and
• Current and potential regulation of air, water, and solid waste discharges from fossil fuel-based production facilities, including a potential cap or tax on carbon dioxide (CO2) emissions.
Eight coal-based plants using the Siemens gasifier were analyzed as listed in Exhibit ES-1. The list includes six SNG production cases using various coal ranks and two SNG and ammonia co-production cases using bituminous coal only. All cases require carbon capture prior to the methanation reactors and the ammonia (NH3) plant in co-production cases. In some cases the removed CO2 is sequestered, and in other cases it is released to the atmosphere. Normally cases are designated as CO2 capture and non-capture, but since all cases are capture in this study, the designation used to differentiate between cases is sequestration and non-sequestration. Each specific scenario is presented without and with carbon sequestration.
While input was sought from various technology vendors, the final assessment of performance and cost was determined independently, and may not represent the views of the technology vendors. The extent of collaboration with the technology vendors varied in scope for each of the processes within the plant, with minimal or no collaboration obtained from some vendors.

Cost and Performance Baseline for Coal-to-SNG and Ammonia (Volume 2)
2
The gasification scheme used in this study includes a partial quench followed by a syngas cooler. Heat recovery was necessary to produce enough power to satisfy internal auxiliary loads with some excess power for export in most cases. This configuration is not currently a commercial offering by Siemens, but based on personal communications, it is a configuration they are planning to offer for future coal-to-SNG projects.
The methodology included performing steady-state simulations of the various technologies using the AspenPlus® (Aspen) modeling program. The resulting mass and energy balance data from Aspen were used to size major pieces of equipment. These equipment sizes formed the basis for cost estimating. Performance and process limits were based upon published reports, information obtained from vendors and users of the technology, performance data from design/build projects, and/or best engineering judgment. Capital and operating costs were estimated based on simulation results and through a combination of vendor quotes and scaled estimates. Baseline fuel costs for this analysis were determined using data from the Energy Information Administration’s (EIA) 2008 Annual Energy Outlook (AEO). The first year of capital expenditure (2007) costs used are 1.55 dollars per gigajoule ($/GJ) (1.64 dollars per million British thermal units [$/MMBtu]) for Illinois No. 6 coal, $0.84/GJ ($0.89/MMBtu) for Powder River Basin (PRB) coal, and $0.79/GJ ($0.83/MMBtu) for North Dakota lignite (NDL). All coal prices are on a higher heating value (HHV) basis and in 2007 United States (U.S.) dollars. The Illinois No. 6 and PRB coal prices include transportation costs while the NDL coal is assumed to be used at a minemouth location. Anhydrous ammonia selling prices were determined from the historic correlation between the cost of industrial natural gas (EIA) and the price of ammonia fertilizers as paid by U.S. farmers (United States Department of Agriculture [USDA] Economic Research Service). The first year selling price of ammonia for the non-sequestration SNG and ammonia co-production facility was determined to be $880/metric ton (tonne) ($799/ton) and $913/tonne ($828/ton) with carbon sequestration. All plant configurations are evaluated on installation at a greenfield site. SNG production is limited by a nominal thermal input of 500 megawatt-thermal (MWth) to the gasifier. Based on vendor input, the actual gasifier thermal input varies according to the type of coal feed and ranges from 506 to 550 MWth. The nominal net plant production capacity of ammonia is 2,000 tonnes/day (2,204 tons/day) for the co-production cases. All cases are based on a 90 percent plant capacity factor (CF). Exhibit ES-2 shows the cost, performance, and environmental profile summary for all cases. These plants are expected to operate at full capacity when available. Since variations in fuel costs, capacity factor, and financing structure (required return on equity) can influence the economics of production, sensitivities of the first year cost of production (FYCOP) are evaluated and presented later in this Executive Summary.

Cost and Performance Baseline for Coal-to-SNG and Ammonia (Volume 2)
3
Exhibit ES-1 Case Descriptions
Case Product(s) Steam Cycle, psig/°F/°F1
Coal Type
Coal Drying
Process
Gasifier Technology Oxidant
H2S Separation/
Removal
Sulfur Removal/ Recovery
CO2 Separation
CO2 Compression/ Sequestration
1 SNG 1800/1050/1000 Illinois No. 6 Standard Siemens 99 mol%
O2 Selexol Claus Plant Selexol 2nd
stage N
2 SNG 1800/1050/1000 Illinois No. 6 Standard Siemens 99 mol%
O2 Selexol Claus Plant Selexol 2nd
stage Y
3 SNG & Ammonia 1800/1050/1000 Illinois
No. 6 Standard Siemens 99 mol% O2
Selexol Claus Plant Selexol 2nd stage N
4 SNG & Ammonia 1800/1050/1000 Illinois
No. 6 Standard Siemens 99 mol% O2
Selexol Claus Plant Selexol 2nd stage Y
5 SNG 1800/1050/1000 Montana Rosebud
PRB WTA Siemens 99 mol%
O2 Selexol Claus Plant Selexol 2nd
stage N
6 SNG 1800/1050/1000 Montana Rosebud
PRB WTA Siemens 99 mol%
O2 Selexol Claus Plant Selexol 2nd
stage Y
7 SNG 1800/1050/1000 North
Dakota Lignite
WTA Siemens 99 mol% O2
Selexol Claus Plant Selexol 2nd stage N
8 SNG 1800/1050/1000 North
Dakota Lignite
WTA Siemens 99 mol% O2
Selexol Claus Plant Selexol 2nd stage Y
1 Steam cycle reheat temperatures are nominal.

Cost and Performance Baseline for Coal-to-SNG and Ammonia (Volume 2)
4
Exhibit ES-2 Cost and Performance Summary and Environmental Profile
CONVERSION EFFICIENCY The net plant conversion efficiency (HHV basis) for all eight cases is shown in Exhibit ES-3. The conversion efficiency is the HHV of the products divided by the HHV of the coal. The primary conclusions that can be drawn are:
• The SNG production facilities feeding PRB coal have the highest conversion efficiencies of the coal types modeled in this study with a conversion efficiency of 63.1 percent for both the non-sequestration and carbon sequestration cases. This is primarily due to the low nitrogen content and high oxygen content in the design fuel, which enables the SNG produced to have a relatively lower concentration of inerts.
• The remaining six cases have essentially constant conversion efficiency (61.3 to 61.5 percent). The addition of carbon sequestration has only a minimal impact on conversion efficiency. The carbon sequestration impact is seen in the reduced available export power relative to the non-sequestration case.
PERFORMANCE Case 1 Case 2 Case 3 Case 4 Case 5 Case 6 Case 7 Case 8CO2 Sequestration No Yes No Yes No Yes No YesSNG Production (Bscf/year)1 57 56 42 42 55 55 52 52Ammonia Production (TPD)1 N/A N/A 2,204 2,204 N/A N/A N/A N/AHHV Conversion Efficiency, % 61.4% 61.3% 61.5% 61.4% 63.1% 63.1% 61.5% 61.5%Gross Power Output (kWe) 308,000 310,600 292,300 292,300 302,000 302,000 305,800 310,500Auxiliary Power Requirement (kWe) 216,350 262,090 263,600 316,030 247,570 300,190 259,740 313,930Net Power Output (kWe) 91,650 48,510 28,700 -23,730 54,430 1,810 46,060 -3,430Coal Flowrate (lb/hr) 964,752 964,752 964,000 964,000 1,259,331 1,259,331 1,564,932 1,564,932HHV Thermal Input (kWth) 3,298,455 3,298,455 3,295,885 3,295,885 3,160,745 3,160,745 3,034,796 3,034,796Raw Water Withdrawal (gpm) 7,169 7,123 7,434 7,458 4,853 5,509 4,421 5,131Process Water Discharge (gpm) 1,462 1,451 1,455 1,461 1,071 1,218 1,071 1,230Raw Water Consumption (gpm) 5,708 5,672 5,979 5,997 3,783 4,291 3,350 3,901CO2 Emissions (lb/MMBtu)2 128 5 147 10 140 0.7 147 0.9SO2 Emissions (lb/MMBtu)2 0.0274 0.0003 0.0229 0.0006 0.0218 0.0000 0.0239 0.0000NOx Emissions (lb/MMBtu)2 Negligible Negligible Negligible Negligible Negligible Negligible Negligible NegligiblePM Emissions (lb/MMBtu)2 0.007 0.007 0.007 0.007 0.007 0.007 0.007 0.007Hg Emissions (lb/MMBtu)2 5.71E-07 5.71E-07 5.71E-07 5.71E-07 3.51E-07 3.51E-07 5.60E-07 5.60E-07COSTTotal Plant Cost ($ x 1,000) 2,628,754 2,692,997 3,048,463 3,119,611 2,741,044 2,813,258 2,864,478 2,941,335Total Overnight Cost ($ x 1,000) 3,235,262 3,312,740 3,742,411 3,829,817 3,354,442 3,442,310 3,504,262 3,595,468Total As-spent Capital ($ x 1,000) 3,885,549 3,978,601 4,494,636 4,599,610 4,028,684 4,134,215 4,208,619 4,318,158SNG FYCOP ($/MMBtu)1 19.27 20.95 15.82 17.85 19.15 21.01 21.27 23.24 CO 2 TS&M Costs 0.00 0.91 0.00 1.29 0.00 0.96 0.00 1.03 Fuel Costs 2.67 2.67 1.89 1.89 1.41 1.41 1.34 1.35 Variable Costs 1.03 1.04 0.79 0.82 1.02 1.03 1.18 1.18 Fixed Costs 1.76 1.79 1.41 1.45 1.84 1.86 2.03 2.06 Electricity Costs -0.77 -0.41 -0.17 0.15 -0.46 -0.02 -0.42 0.03 Capital Costs 14.58 14.94 11.90 12.25 15.34 15.76 17.13 17.59Ammonia FYCOP3 ($/ton) - - 799 828 - - - -1 Based on a capacity factor of 90 percent for all cases2 Based on coal thermal input3 Ammonia price is correlated to historic natural gas costs
SNG OnlyRosebud PRB North Dakota LigniteIllinois No. 6 Coal
SNG Only SNG and Ammonia SNG Only

Cost and Performance Baseline for Coal-to-SNG and Ammonia (Volume 2)
5
Exhibit ES-3 Net Plant Conversion Efficiency (HHV)
TOTAL OVERNIGHT COST The Total Overnight Cost (TOC) for each plant was calculated by adding owner’s costs to the Total Plant Cost (TPC). The TPC was determined through a combination of vendor quotes and scaled estimates from previous design/build projects. TPC includes all equipment (complete with initial chemical and catalyst loadings), materials, labor (direct and indirect), engineering and construction management, and contingencies (process and project).
The capital costs have an estimated accuracy of -15%/+30%, consistent with the screening study level of design engineering applied to the various cases in the study. The value of the study lies not in the absolute accuracy of the individual cases, but in the fact that all cases were evaluated under the same set of technical and economic assumptions. The consistency of approach allows meaningful comparisons among the cases evaluated.
Project contingencies were added to the Engineering/Procurement/Construction Management (EPCM) capital accounts to cover project uncertainty and the cost of any additional equipment that would result from a detailed design. The contingencies represent costs that are expected to occur. Each bare erected cost (BEC) account was evaluated against the level of estimate detail and field experience to determine project contingency. Process contingency was added to cost account items that were deemed to pose significant risk due to lack of operating experience. The cost accounts that received a process contingency include:
0%
10%
20%
30%
40%
50%
60%
70%
SNG Illinois 6 SNG Illinois 6 w/ Capture
SNG/NH3Illinois 6
SNG/NH3 Illinois 6 w/
Capture
SNG PRB SNG PRB w/ Capture
SNG Lignite SNG Lignite w/ Capture
61.4% 61.3% 61.5% 61.4%63.1% 63.1%
61.5% 61.5%
% C
onve
rsio
n Ef
ficie
ncy
(HH
V B
asis
)
Cost and Performance Baseline for Coal-to-SNG and Ammonia (Volume 2)
6
• Gasifiers and Syngas Coolers – 15 percent on all cases – next-generation commercial offering and integration with the steam generation island
• Two Stage Selexol – 20 percent on all cases - unproven technology at commercial scale
• Mercury Removal – 5 percent on all cases – minimal commercial scale experience in gasification applications
• Methanation – 10 percent on all cases – unproven technology at commercial scale
• Instrumentation and Controls – 5 percent on all accounts for integration issues
The TOC is shown for each plant configuration in Exhibit ES-4. For reference, Total As-spent Capital (TASC) is also shown. TASC is the sum of TOC, escalation during the capital expenditure period, and interest on debt during the capital expenditure period. The following observations can be made:
• The SNG only case without carbon sequestration using Illinois No. 6 coal has the lowest TOC of $3.24 billion.
• For the SNG only cases without carbon sequestration, the TOC is higher for PRB coal by 3.7 percent and lignite coal by 8.3 percent relative to the Illinois No. 6 coal cases.
• The TOC increase to add carbon sequestration for the SNG only cases is approximately 2.4 percent for the Illinois No. 6 cases, 2.6 percent for the PRB coal cases and 2.6 percent for the lignite coal case. For the SNG and ammonia co-production case, the TOC increases by 2.4 percent to add carbon sequestration.
• The SNG and ammonia co-production cases increase the TOC by approximately 16 percent when compared to the SNG only cases using Illinois No. 6 coal.
FIRST YEAR COST OF PRODUCTION The cost metric used in this study is the first year cost of production (FYCOP). The capital charge factor (CCF) shown in Exhibit ES-5, which was derived using the National Energy Technology Laboratory (NETL) Power Systems Financial Model (PSFM) [9], was used to calculate the FYCOP. The project financial structure is representative of a high-risk fuels project with no loan guarantees or other government subsidies. The parameters were chosen to reflect the next commercial offering in which the technical and economic risks have not been reduced by the wide-scale demonstration of the technology.

Cost and Performance Baseline for Coal-to-SNG and Ammonia (Volume 2)
7
Exhibit ES-4 Total Overnight Cost and Total As-spent Capital
1,939 1,9882,271 2,325
2,024 2,079 2,120 2,179
180 185
213 218
188 193 197 202385 396
440 452
403 415 421 434125 125
125 125
126 126 126 126607 620
694 710
613 629 640 6543,235 3,313
3,742 3,830
3,354 3,442 3,504 3,5953,886 3,979
4,495 4,600
4,029 4,134 4,209 4,318
0
1,000
2,000
3,000
4,000
5,000
6,000
7,000
TOC TASC TOC TASC TOC TASC TOC TASC TOC TASC TOC TASC TOC TASC TOC TASC
SNG Illinois 6 SNG Illinois 6 w/ Capture
SNG/NH3Illinois 6
SNG/NH3 Illinois 6 w/ Capture
SNG PRB SNG PRB w/ Capture
SNG Lignite SNG Lignite w/ Capture
Capi
tal C
ost,
$1,
000,
000
TASC
Owner's Cost
Process Contingency
Project Contingency
Home Office Expense
Bare Erected Cost

Cost and Performance Baseline for Coal-to-SNG and Ammonia (Volume 2)
8
Exhibit ES-5 Economic Parameters Used to Calculate FYCOP
High Risk Fuels Financial Structure
First Year Capital Charge Factor 0.2449
The FYCOP was calculated as detailed in Section 2.8. The FYCOP is shown in Exhibit ES-6 with the capital cost, fixed operating cost, variable operating cost, electricity cost (or revenue), and fuel costs shown separately. In the carbon sequestration cases, the CO2 transport, storage, and monitoring (TS&M) costs are also shown as a separate bar segment. The following conclusions can be drawn, using first year cost as the basis for comparison:
• The co-production case using Illinois No. 6 coal without carbon sequestration has the lowest cost of the cases modeled in this study with an FYCOP of $15.82/MMBtu.
• The FYCOP is dominated by capital charges in all cases. The capital cost component of FYCOP, which includes owner’s costs, comprises 71 to 81 percent for the SNG only cases.
• The fuel cost component in the SNG only cases represents 13 percent for Illinois No. 6 coal, 7 percent for the PRB coal, and 6 percent for the lignite coal.
• The TS&M component of FYCOP in the carbon sequestration cases is 4 percent, 5 percent, and 4 percent for the Illinois No. 6 coal, PRB coal, and lignite coal respectively. For the SNG and ammonia co-production case, the TS&M account for 7 percent of the total FYCOP.
• The SNG FYCOP increases by an average amount of 9 percent with the addition of carbon sequestration for the SNG only cases and 13 percent for the co-production case. The cost of TS&M is shared between the two products in the co-production case based on the SNG-NH3 cost relationship.

Cost and Performance Baseline for Coal-to-SNG and Ammonia (Volume 2)
9
Exhibit ES-6 FYCOP by Cost Component
The EIA’s AEO 2009 shows a 2007 residential natural gas delivered price of $12.69/MMBtu. The EIA reference case projections show a price of $12.09/MMBtu in 2010, $12.50/MMBtu in 2020, and $14.31/MMBtu in 2030. The price of SNG determined in this study is generally higher than current or projected natural gas market prices. However, the assumed financing structure (addressed in Section 2.8 of this report) plays a significant role in the elevated prices. The assumed return on equity (ROE) is 20 percent. A sensitivity analysis on ROE was performed and is shown in Exhibit ES-7. As expected, as the ROE requirement increases, the cost of SNG and ammonia increases. At the assumed high-risk fuels scenario first year capital charge factor (CCF) and ROE, SNG prices range from $15.82 to $23.24/MMBtu and ammonia costs range from $799 to $828/ton. Adjusting the first year CCF to 0.1344, representative of a high-risk fuels project with a corresponding ROE of 12 percent, results in SNG FYCOP cost ranging from $9.85 to $14.85/MMBtu and ammonia cost ranging from $560 to $585/ton.
14.58 14.9411.90 12.25
15.34 15.76 17.13 17.59
1.76 1.79
1.41 1.45
1.84 1.862.03 2.06
1.03 1.04
0.79 0.82
1.02 1.031.18 1.18
2.67 2.67
1.89 1.89
1.41 1.411.34 1.35
0.91
1.29
0.96
1.0319.27
20.95
15.82
17.8519.15
21.01 21.2723.24
-5
0
5
10
15
20
25
30
35
40
SNG Illinois 6 SNG Illinois 6 w/ Capture
SNG/NH3Illinois 6
SNG/NH3 Illinois 6 w/ Capture
SNG PRB SNG PRB w/ Capture
SNG Lignite SNG Lignite w/ Capture
FYCO
P, $
/MM
Btu
CO2 TS&M Costs
Fuel Costs
Variable Costs
Fixed Costs
Capital Costs
Electricity Revenue/Cost

Cost and Performance Baseline for Coal-to-SNG and Ammonia (Volume 2)
10
Exhibit ES-7 FYCOP Sensitivity to ROE
Exhibit ES-8 shows the FYCOP sensitivity to fuel costs. As expected, all cases show a linear increase in FYCOP with the increase in coal price. Fuel cost represents a relatively minor fraction of the FYCOP so that even at a fuel price of zero, the FYCOP of SNG ranges from $13.73 to $21.89/MMBtu.
The sensitivity of FYCOP to CF is shown in Exhibit ES-9. All cases show a decrease in FYCOP with an increase in CF. The CF used in this study was 90 percent. The rate of decrease is relatively small above 90 percent with the maximum differential between 90 percent and 100 percent capacity of $1.96/MMBtu for SNG only cases and $1.52/MMBtu for the co-production cases.
0
200
400
600
800
1000
1200
1400
0
5
10
15
20
25
30
35
40
45
50
5% 10% 15% 20% 25%
Am
mon
ia LC
OP
($/t
on)
SNG
FYC
OP
($/M
MBt
u)
Return on Equity
Case 8 SNG Price
Case 2 SNG Price
Case 6 SNG Price
Case 7 SNG Price
Case 1 SNG Price
Case 5 SNG Price
Case 4 SNG Price
Case 3 SNG Price
Case 4 Ammonia Price
Case 3 Ammonia Price
High Risk Fuels ProjectROE - 12%
First Year CCF - 0.1344
High Risk Fuels Project: ROE - 20%First Year CCF - 0.2449
Ammonia Price Curves

Cost and Performance Baseline for Coal-to-SNG and Ammonia (Volume 2)
11
Exhibit ES-8 FYCOP Sensitivity to Fuel Costs
Exhibit ES-9 FYCOP Sensitivity to Capacity Factor
0
5
10
15
20
25
30
35
0 0.5 1 1.5 2 2.5 3
FYCO
P ($
/MM
Btu)
Coal Price ($/MMBtu)
SNG Lignite w/ CaptureSNG LigniteSNG PRB w/ CaptureSNG Illinois 6 w/ CaptureSNG PRBSNG Illinois 6SNG/NH3 Illinois 6 w/ CaptureSNG/NH3 Illinois 6
Montana PRB($0.89/MMBtu)ND Lignite
($0.83/MMBtu)
Illinois No. 6($1.64/MMBtu)
0
10
20
30
40
50
60
70
80
30% 40% 50% 60% 70% 80% 90% 100%
FYCO
P ($
/MM
Btu)
Capacity Factor (%)
SNG Lignite w/ Capture
SNG Lignite
SNG PRB w/ Capture
SNG Illinois 6 w/ Capture
SNG PRB
SNG Illinois 6
SNG/NH3 Illinois 6 w/ Capture
SNG/NH3 Illinois 6Study Capacity
Factor

Cost and Performance Baseline for Coal-to-SNG and Ammonia (Volume 2)
12
FIRST YEAR COST OF CO2 AVOIDED In cases where the CO2 was sequestered, the associated costs of CO2 compression and TS&M were calculated as an avoided cost, relative to the analogous non-sequestration case, as illustrated in Equation ES-1:
MMBtutonsEmissionsEmissionsMMBtuFYCOPFYCOP
CostAvoidedionsequestratwithionsequestratow
ionsequestratowionsequestratwith
/}{/$}{
/
/
−
−= (ES-1)
The resulting first year avoided costs are shown in Exhibit ES-10 for each of the four carbon sequestration cases. The cost of CO2 avoided for the SNG only cases averages $18.38/tonne ($16.67/ton) within a very narrow range. The CO2 avoided costs are lower for the co-production cases because the increase in the selling price of ammonia for the carbon sequestration case absorbs some of the costs related to the addition of compression and TS&M. For integrated gasification combined cycle (IGCC) cases in Volume 1 of this series, CO2 avoided costs range from $43-61/tonne ($39-56/ton) avoided. The avoided costs for the SNG plants are significantly lower than IGCC plants because the capital cost increase is lower (there is capture in all cases; the incremental cost is for compression and carbon sequestration only). The TOC increase from non-sequestration to sequestration cases ranges from 2.4 to 2.6 percent for the cases in this study. The capital cost increase for the IGCC cases in Volume 1 is from 13.5 to 21.1 percent.
Exhibit ES-10 CO2 Avoided Cost
16.65
13.47
16.79 16.57
0
5
10
15
20
25
30
SNG Illinois 6 SNG/NH3Illinois 6
SNG PRB SNG Lignite
CO2
Avo
ided
Cos
t ($/
ton)
CO2 Avoided Cost

Cost and Performance Baseline for Coal-to-SNG and Ammonia (Volume 2)
13
ECONOMIC PATHWAYS As stated above, the project financial structure used for the FYCOP calculations presented in this report is representative of a high-risk fuels project with no loan guarantees or other government subsidies. The parameters were chosen to reflect the next commercial offering in which the technical and economic risks have not been reduced by the wide-scale demonstration of the technology. The cost of producing SNG from coal can be substantially lower given more favorable financial and economic conditions. A more favorable structure could involve government loan guarantees, tax incentives, and shorter construction periods. Projects can also include different technologies and subsequently different capital costs, different O&M costs, production of other co-products, etc. that will impact the cost of SNG.
Exhibit ES-11 and Exhibit ES-12 show the results of adjusting selected economic assumptions for Cases 2 and 4 respectively to be representative of some of the parameters associated with a commercial coal-to-SNG project recently proposed. The modified parameters are highlighted in blue for each step. The combined modifications reduce the FYCOP by 48.6 percent for Case 2 and by 50.5 percent for Case 4. The resulting values are comparable to those quoted in the proposed project.
Loan guarantees are a near term incentive to commercialize technologies that involve high risk. Ultimately the technology must stand on its own merits. A second economic pathway was investigated to demonstrate a financial structure that would not require loan guarantees, but still achieve a similar cost of SNG. Increased commercial application of technologies reduces risks and lowers capital cost requirements. The gasification production plant capital cost in this study is based on commercial offerings; however, there have been very limited sales of these units. The costs listed reflect the “next commercial offering” level of cost rather than mature nth-of-a-kind (NOAK) cost. As technologies mature, overall costs decrease due to multiple plant completions and lessons learned.
Exhibit ES-13 and Exhibit ES-14 show the results of adjusting the financial structure to values typically assumed for a low risk power project [1
Exhibit ES-11
]. Reductions in TOC of 21.5 percent for Case 2 and 22.6 percent for Case 4 reduce the FYCOP values to match those of the examples shown in and Exhibit ES-12 respectively. While these percentages may be considered aggressive for typical first-of-a-kind (FOAK) to NOAK reductions, substantial improvements in the FYCOP are shown even when only the financial structure is modified to reflect the lower risk of mature technologies.
Additionally, after the technology matures, it may be possible for the project developer to obtain financing through the bond market and obtain longer debt payment terms than shown in Exhibit ES-13 and Exhibit ES-14 and subsequently require a lower cost of product to satisfy the equity investors. The specific financing structure options of a project developer will strongly depend on the financial wherewithal of the developer.
The FYCOP values reported in this study reflect the typical assumptions made for high risk fuels projects, which were developed for the specific purpose of comparing the relative cost of coal conversion technologies. They are not intended to represent definitive point costs; however these sensitivities to the assumed financial parameters indicate that the results are comparable to currently proposed projects.

Cost and Performance Baseline for Coal-to-SNG and Ammonia (Volume 2)
14
Exhibit ES-11 Case 2 Economic Pathway with Favorable Financial Structure (SNG from Illinois 6 with CO2 Capture)
Parameter NETL Study Step 1a Step 1b Step 1c Step 2 Step 3 Step 4 Step 5 % Debt 50% 70% 70% 70% 70% 70% 70% 70% % Equity 50% 30% 30% 30% 30% 30% 30% 30% Interest Rate 9.5% 4.5% 4.5% 4.5% 4.5% 4.5% 4.5% 4.5% Required IRROE 20.0% 20.0% 20.0% 20.0% 20.0% 20.0% 20.0% 20.0% Repayment Term (years) 15 15 30 30 30 30 30 30 Capital Expenditure Period (Months)* 60 60 60 48 48 48 48 48 Capital Cost Escalation (%/yr) 3.6% 3.6% 3.6% 3.6% 0.0% 0.0% 0.0% 0.0% Owner's Cost (%TPC) 23% 23% 23% 23% 23% 18% 18% 18% Property Taxes and Insurance (%TPC) 2.00% 2.00% 2.00% 2.00% 2.00% 2.00% 0.42% 0.42% CO2 Credit ($/Tonne) $0.00 $0.00 $0.00 $0.00 $0.00 $0.00 $0.00 $10.00 CO2 Captured (Tonne/Day) 15,134 15,134 15,134 15,134 15,134 15,134 15,134 15,134 TOC (1000$) 3,312,740 3,312,740 3,312,740 3,312,740 3,312,740 3,180,577 3,180,577 3,180,577 SNG COP $/MMBtu (excluding TS&M costs) 20.04 15.17 13.47 12.68 12.29 12.01 11.23 10.31
Incremental Step Reduction 24.3% 11.2% 5.9% 3.0% 2.3% 6.5% 8.2% Cumulative Reduction 24.3% 32.8% 36.7% 38.7% 40.1% 44.0% 48.6%
* Capital Expenditure Period (Year-by-Year Distribution) 4 years (48 months) 10 % - 40 % - 30 % - 20 % 5 years (60 months) 10 % - 30 % - 25 % - 20 % - 15 %
Sensitivity Analysis Steps 1. Modify financing structure (debt/equity & interest rate)
1a Increase percentage of debt and decrease interest on debt 1b Increase loan repayment term 1c Decrease capital expenditure period
2. Reduce capital cost escalation during the capital expenditure period 3. Reduce owner’s cost 4. Reduce taxes and insurance in fixed O&M costs 5. Assume CO2 revenue value for enhanced oil recovery

Cost and Performance Baseline for Coal-to-SNG and Ammonia (Volume 2)
15
Exhibit ES-12 Case 4 Economic Pathway with Favorable Financial Structure (SNG and Ammonia from Illinois 6 with CO2 Capture)
Parameter NETL Study Step 1a Step 1b Step 1c Step 2 Step 3 Step 4 Step 5 % Debt 50% 70% 70% 70% 70% 70% 70% 70% % Equity 50% 30% 30% 30% 30% 30% 30% 30% Interest Rate 9.5% 4.5% 4.5% 4.5% 4.5% 4.5% 4.5% 4.5% Required IRROE 20.0% 20.0% 20.0% 20.0% 20.0% 20.0% 20.0% 20.0% Repayment Term (years) 15 15 30 30 30 30 30 30 Capital Expenditure Period (Months)* 60 60 60 48 48 48 48 48 Capital Cost Escalation (%/yr) 3.6% 3.6% 3.6% 3.6% 0.0% 0.0% 0.0% 0.0% Owner's Cost (%TPC) 23% 23% 23% 23% 23% 18% 18% 18% Property Taxes and Insurance (%TPC) 2.00% 2.00% 2.00% 2.00% 2.00% 2.00% 0.42% 0.42% CO2 Credit ($/Tonne) $0.00 $0.00 $0.00 $0.00 $0.00 $0.00 $0.00 $10.00 CO2 Captured (Tonne/Day) 16,763 16,763 16,763 16,763 16,763 16,763 16,763 16,763 TOC (1000$) 3,829,817 3,829,817 3,829,817 3,829,817 3,829,817 3,684,431 3,684,431 3,684,431 SNG COP $/MMBtu (excluding TS&M costs) 16.56 12.60 11.06 10.30 9.96 9.71 9.00 8.20
Incremental Step Reduction 23.9% 12.3% 6.8% 3.4% 2.5% 7.3% 8.8% Cumulative Reduction 23.9% 33.2% 37.8% 39.9% 41.4% 45.7% 50.5%
* Capital Expenditure Period (Year-by-Year Distribution) 4 years (48 months) 10 % - 40 % - 30 % - 20 % 5 years (60 months) 10 % - 30 % - 25 % - 20 % - 15 %
Sensitivity Analysis Steps 1. Modify financing structure (debt/equity & interest rate)
1a Increase percentage of debt and decrease interest on debt 1b Increase loan repayment term 1c Decrease capital expenditure period
2. Reduce capital cost escalation during the capital expenditure period 3. Reduce owner’s cost 4. Reduce taxes and insurance in fixed O&M costs 5. Assume CO2 revenue value for enhanced oil recovery

Cost and Performance Baseline for Coal-to-SNG and Ammonia (Volume 2)
16
Exhibit ES-13 Case 2 Economic Pathway with Mature Technology (SNG from Illinois 6 with CO2 Capture)
Parameter NETL Study Step 1a Step 1b Step 2
% Debt 50% 50% 50% 50%
% Equity 50% 50% 50% 50%
Interest Rate 9.5% 4.5% 4.5% 4.5%
Required IRROE 20.0% 20.0% 12.0% 12.0%
Repayment Term (years) 15 15 15 15
Capital Expenditure Period (Months)* 60 60 60 60
Capital Cost %Escalation/yr 3.6% 3.6% 3.6% 3.6%
Owner's Cost %TPC 23% 23% 23% 23%
Property Taxes and Insurance %TPC 2.00% 2.00% 2.00% 2.00%
CO2 Credit ($/Tonne) $0.00 $0.00 $0.00 $0.00
CO2 Tonne/Day Captured 15,134 15,134 15,134 15,134
TOC (1000$) 3,312,740 3,312,740 3,312,740 2,602,157
Percent capital (TOC) reduction 0.0% 0.0% 0.0% 21.5%
SNG COP $/MMBtu (excluding TS&M costs) 20.04 18.54 12.21 10.31
Incremental Step Reduction 7.5% 34.1% 15.6%
Cumulative Reduction 7.5% 39.1% 48.6% * Capital Expenditure Period (Year-by-Year Distribution) 5 years (60 months) 10 % - 30 % - 25 % - 20 % - 15 %
Sensitivity Analysis Steps 1. Modify financing structure (debt/equity & interest rate)
1a Decrease interest on debt 1b Decrease required internal rate of return on equity (IRROE)
2. Reduce capital cost to reflect FOAK to NOAK improvements

Cost and Performance Baseline for Coal-to-SNG and Ammonia (Volume 2)
17
Exhibit ES-14 Case 4 Economic Pathway with Mature Technology (SNG and Ammonia from Illinois 6 with CO2 Capture)
Parameter NETL Study Step 1a Step 1b Step 2
% Debt 50% 50% 50% 50%
% Equity 50% 50% 50% 50%
Interest Rate 9.5% 4.5% 4.5% 4.5%
Required IRROE 20.0% 20.0% 12.0% 12.0%
Repayment Term (years) 15 15 15 15
Capital Expenditure Period (Months)* 60 60 60 60
Capital Cost %Escalation/yr 3.6% 3.6% 3.6% 3.6%
Owner's Cost %TPC 23% 23% 23% 23%
Property Taxes and Insurance %TPC 2.00% 2.00% 2.00% 2.00%
CO2 Credit ($/Tonne) $0.00 $0.00 $0.00 $0.00
CO2 Tonne/Day Captured 16,763 16,763 16,763 16,763
TOC (1000$) 3,829,817 3,829,817 3,829,817 2,962,746
Percent capital (TOC) reduction 0.0% 0.0% 0.0% 22.6%
SNG COP $/MMBtu (excluding TS&M costs) 16.56 15.67 10.02 8.20
Incremental Step Reduction 5.4% 36.0% 18.2%
Cumulative Reduction 5.4% 39.5% 50.5% * Capital Expenditure Period (Year-by-Year Distribution) 5 years (60 months) 10 % - 30 % - 25 % - 20 % - 15 %
Sensitivity Analysis Steps 1. Modify financing structure (debt/equity & interest rate)
1a Decrease interest on debt 1b Decrease required internal rate of return on equity (IRROE)
2. Reduce capital cost to reflect FOAK to NOAK improvements

Cost and Performance Baseline for Coal-to-SNG and Ammonia (Volume 2)
18
This page intentionally left blank

Cost and Performance Baseline for Coal-to-SNG and Ammonia (Volume 2)
19
1. The objective of this report is to present an accurate, independent assessment of the cost and performance of fossil energy fuel systems, specifically the Siemens gasifier using bituminous and low rank coals to produce SNG and ammonia as a co-product, in a consistent technical and economic manner that accurately reflects current market conditions for plants starting operation in the near term. This report is Volume 2 of a four volume series. The four volumes are defined below with Volume 1 having been originally published in May 2007 and the most recent revision issued in November 2010. Volume 3 was released in March and May, 2011 and Volume 4 is expected to be released later in 2011.
INTRODUCTION
• Volume 1: Bituminous Coal and Natural Gas to Electricity
• Volume 2: Coal to Synthetic Natural Gas and Ammonia (Various Coal Ranks)
• Volume 3: Low Rank Coal and Natural Gas to Electricity
• Volume 4: Bituminous Coal to Liquid Fuels with Carbon Capture
Eight cases are modeled and analyzed. Since all cases include CO2 capture the normal designation of capture and non-capture is not used in this study. Rather the cases are differentiated by the designation carbon sequestration or non-sequestration. The carbon sequestration cases assume that compression and drying are the only steps required to produce CO2 suitable for transportation and sequestration. Two cases use Illinois No. 6 bituminous coal for the production of SNG only, with and without carbon sequestration; two cases use Illinois No. 6 coal for the co-production of SNG and ammonia, with and without carbon sequestration; two cases use PRB subbituminous coal for the production of SNG only, with and without carbon sequestration; and two cases use NDL coal for the production of SNG only, also with and without carbon sequestration.
The gasification scheme used in this study includes a partial quench followed by a syngas cooler. Heat recovery was necessary to produce enough power to satisfy internal auxiliary loads with some excess power for export in most cases. This configuration is not currently a commercial offering by Siemens, but based on personal communications, it is a configuration they are considering for coal-to-SNG projects.
This Final Report covers the following eight cases:
Case 1 – This case consists of a coal to SNG plant without CO2 compression and sequestration based on a Siemens gasifier. Illinois No. 6 coal is the fuel and the plant is located at a generic site in Midwestern, U.S.
Case 2 – This case is the same as Case 1 except it includes CO2 compression and sequestration.
Case 3 – This case consists of a coal to SNG and ammonia co-production plant without CO2 compression and sequestration based on a Siemens gasifier. Illinois No. 6 coal is the fuel and the plant is located at a generic site in Midwestern, U.S.
Case 4 – This case is the same as Case 3 except it includes CO2 compression and sequestration.
Case 5 – This case includes a coal to SNG plant without CO2 compression and sequestration based on a Siemens gasifier. Rosebud PRB coal is the fuel and the plant is located at a generic site in Western, U.S.

Cost and Performance Baseline for Coal-to-SNG and Ammonia (Volume 2)
20
Case 6 – This case is the same as Case 5 except it includes CO2 compression and sequestration.
Case 7 – This case consists of a coal to SNG plant without CO2 compression and sequestration based on a Siemens gasifier. NDL coal is the fuel and the plant is located at a minemouth site in North Dakota, U.S.
Case 8 – This case is the same as Case 7 except it includes CO2 compression and sequestration.
While input was sought from various technology vendors, the final assessment of performance and cost was determined independently, and may not represent the views of the technology vendors.
Generating Unit Configurations The six SNG only cases have a nominal gasifier thermal input of 500 MW. The actual capacity varies from 506 to 549 MWth depending on coal type. This translates into a production of 52 to 57 billion standard cubic feet (Bscf)/year of SNG at 90 percent CF. This translates into a daily capacity of 158-172 million standard cubic feet (MMScf)/day of SNG. The two SNG and ammonia co-production cases are based on a standard-size 2,000 tonnes/day (2,204 tons/day) ammonia facility with the remainder of the syngas used for SNG production.
The balance of this report is organized as follows:
• Chapter 2 provides the basis for technical, environmental, and cost evaluations.
• Chapter 3 describes the major process systems for all eight cases
• Chapter 4 provides the detailed results of the four bituminous coal cases.
• Chapter 5 provides the detailed results of the four low rank coal cases.
• Chapter 0 summarizes the results of the eight cases.
• Chapter 7 contains the reference list.

Cost and Performance Baseline for Coal-to-SNG and Ammonia (Volume 2)
21
2. For each of the plant configurations in this study an Aspen model was developed and used to generate material and energy balances, which in turn were used to provide a design basis for items in the major equipment list. The equipment list and material balances were used as the basis for generating the capital and operating cost estimates. Performance and process limits were based upon published reports, information obtained from vendors of the technology, performance data from design/build utility projects, and/or best engineering judgment. Capital and operating costs were estimated by WorleyParsons Group, Inc. (WorleyParsons) based on simulation results and through a combination of vendor quotes and scaled estimates from previous design/build projects. Ultimately a first year cost of production (FYCOP) of SNG was calculated for each of the cases and is reported as the economic figure-of-merit. Due to the process requirements for both SNG and ammonia production, all cases utilize an AGR system that removes or captures the CO2 from the syngas. Some cases simply release this removed CO2 to the atmosphere and are labeled “non-sequestration.” The cases that compress the removed CO2 and include TS&M are labeled “sequestration.”
GENERAL EVALUATION BASIS
The balance of this chapter documents the design basis, environmental targets, and cost assumptions used in the study.
2.1 SITE CHARACTERISTICS The plants are located at three different generic plant sites. Plants using Illinois No. 6 coal are assumed to be located at a generic site in Midwestern, U.S. Plants using PRB coal are assumed to be located at a generic site in Montana. Plants using lignite coal are assumed to be located at a minemouth site in North Dakota. The ambient conditions for the three sites are shown in Exhibit 2-1.
Exhibit 2-1 Ambient Conditions
Location
Midwest Montana North
Dakota
Average Elevation, ft 0 3,400 1,900
Barometric Pressure, psia 14.7 13.0 13.8
Design Ambient Temperature, Dry Bulb, °F 59 42 40
Design Ambient Temperature, Wet Bulb, °F 51.5 37 36
Design Ambient Relative Humidity, % 60 62 68
The site characteristics are assumed to be the same for all plant locations, except where noted as shown in Exhibit 2-2.

Cost and Performance Baseline for Coal-to-SNG and Ammonia (Volume 2)
22
Exhibit 2-2 Site Characteristics
Location Greenfield, Midwest (Illinois No. 6 coal), Montana (PRB coal) or North Dakota (lignite coal)
Topography Level Size, acres 300 Transportation Rail Ash/Slag Disposal Off Site Water Municipal (50%) / Groundwater (50%) Access Land locked, having access by railway and highway
CO2 Storage Compressed to 15.3 MPa (2,215 psia), transported 80 kilometers (50 miles) and sequestered in a saline formation at a depth of 1,239 meters (4,055 feet)
The land area for all the production plant cases assumes 30 acres are required for the plant proper and the balance provides a buffer of approximately 0.25 miles to the fence line. The extra land could also provide for a rail loop if required.
In all cases it was assumed that the steam turbine (ST) is enclosed in a turbine building, but the gasifier is not enclosed. The following design parameters are considered site-specific, and are not quantified for this study. Allowances for normal conditions and construction are included in the cost estimates.
• Flood plain considerations
• Existing soil/site conditions
• Water discharges and reuse
• Rainfall/snowfall criteria
• Seismic design
• Buildings/enclosures
• Fire protection
• Local code height requirements
• Noise regulations – Impact on site and surrounding area
2.2 PLANT PRODUCTION CAPACITY
Currently, the only operating SNG plant (and other co-products) within the U.S. is the Dakota Gasification Company’s Great Plains Synfuels Plant. This plant has an annual production of approximately 54 Bscf [
SNG Only Plant
2Exhibit 2-3
]. In addition, there are several proposed SNG plants in the United States as listed in [3]. The gasifier capacity is coal-type dependent and the resulting SNG capacity varies accordingly. The six gasifier systems in this study result in average SNG

Cost and Performance Baseline for Coal-to-SNG and Ammonia (Volume 2)
23
outputs of 56 Bscf/yr for bituminous coal, 55 Bscf/yr for PRB coal and 52 Bscf/yr for lignite coal at 90 percent CF. These capacities are consistent with the existing plant and announced projects shown in Exhibit 2-3.
Exhibit 2-3 Proposed Capacity for SNG Plants in the United States
Project Location Feedstock Gasifier Capacity Units
Kentucky NewGas Kentucky Kentucky Bituminous
CoP E-Gas
1,700 – 1,980 (60-70)
MNm3/year (Bscf/year)
Hunton Energy Freeport Plant (Lockwood) Texas petcoke GEE 1,870 (66) MNm3/year
(Bscf/year)
South Heart North Dakota ND Lignite Lurgi 1,050 (37) MNm3/year
(Bscf/year)
Taylorville Energy Center Illinois Illinois Bituminous GEE 74 - 450
(2.6-16) MNm3/year (Bscf/year)
Southern Illinois Coal-to-SNG facility Illinois Illinois
Bituminous GEE 1,420 (50) MNm3/year (Bscf/year)
Secure Energy Decatur Gasification Illinois Illinois Bituminous Siemens 570 (20) MNm3/year
(Bscf/year)
Indiana SNG Project Indiana Illinois Bituminous GEE 1,130 (40) MNm3/year
(Bscf/year) Lake Charles Cogeneration LLC Louisiana petcoke GEE unknown
Scriba Coal Gasification Plant New York coal unknown 2,830 (100) MNm3/year (Bscf/year)
Mississippi SNG Project Mississippi petcoke CoP E-Gas 990 (35) MNm3/year
(Bscf/year)
Cash Creek SNG Project Kentucky Kentucky Bituminous GEE unknown
The co-production facility cases use the same coal type and coal feed rate as the Illinois No. 6 bituminous coal non-sequestration and sequestration SNG only cases (Cases 1 and 2) with a portion of the syngas utilized to feed a large commercial size ammonia plant and the remaining syngas utilized for SNG production. Some currently operating ammonia plants in the United States and their associated feedstock and capacity are shown in
SNG and Ammonia Co-Production Plant
Exhibit 2-4.
Exhibit 2-4 U.S. Ammonia Plants
Company Location Feedstock Capacity Units
Agrium Inc. Texas natural gas 1,342 (1,479)
tonnes/day (tons/day)
CF Industries, Inc. Louisiana natural gas 5,589 (6,156)
tonnes/day (tons/day)
Coffeyville Resources, Nitrogen Fertilizers, LLC Louisiana coal 1,027
(1,132) tonnes/day (tons/day)
Dakota Gasification Co. North Dakota coal 995
(1,095) tonnes/day (tons/day)

Cost and Performance Baseline for Coal-to-SNG and Ammonia (Volume 2)
24
Company Location Feedstock Capacity Units
Honeywell International Inc. Virginia natural gas 1,452 (1,599)
tonnes/day (tons/day)
Koch Nitrogen Co. Nebraska natural gas 726 (800)
tonnes/day (tons/day)
Mosaic Co. Louisiana coal/petcoke 1,392 (1,533)
tonnes/day (tons/day)
PCS Nitrogen, Inc., LP Georgia natural gas 1,885 (2,076)
tonnes/day (tons/day)
Rentech Energy Midwest Corp. Illinois coal 762 (839)
tonnes/day (tons/day)
The standard capacity for new ammonia plants being built today is approximately 2,000 tonnes/day (2,204 tons/day) and is used as the basis for the ammonia portion of the co-production facilities [4]. Advances in ammonia production technology have enabled even higher production rates. At higher operating pressures, higher ammonia conversion per pass is achieved. This allows ammonia plant production capacity to increase while maintaining reasonable reactor and equipment sizes [5
2.3 COAL CHARACTERISTICS
]. The remaining portion of the syngas is used to produce approximately 42 Bscf/year of SNG at 90 percent CF.
There are three design coals, bituminous Illinois No. 6 coal, subbituminous PRB coal from Montana, and lignite coal from North Dakota. The coal properties are from NETL’s Coal Quality Guidelines and are shown in Exhibit 2-5, Exhibit 2-6, and Exhibit 2-7 [6
The coal mercury (Hg) content was not available from reference
].
6 and was obtained through alternate means. Thirty-four samples of Illinois No. 6 coal have an arithmetic mean value of 0.09 parts per million (ppm) (dry basis) with standard deviation of 0.06 based on coal samples shipped by Illinois mines [7 Exhibit 2-5
]. The coal mercury content for Illinois No. 6 coal shown in was assumed to be 0.15 ppm (dry) for all Illinois No. 6 cases, which corresponds to the mean
plus one standard deviation and encompasses about 84 percent of the samples.
The mercury concentration for the low rank coals used in this study was determined from the Environmental Protection Agency’s (EPA) Information Collection Request (ICR) database. The ICR database has 137 records of Montana Rosebud subbituminous coal with an average Hg concentration of 0.056 ppm (dry) and a standard deviation of 0.025 ppm. There are 266 records for NDL from the Beulah seam with an average Hg concentration of 0.081 ppm (dry) and a standard deviation of 0.035 ppm. The mercury values in Exhibit 2-6 and Exhibit 2-7 are the mean plus one standard deviation, or 0.081 ppm (dry) for PRB coal and 0.116 ppm (dry) for NDL [8
The Power Systems Financial Model (PSFM) was used to derive the capital charge factor (CCF) for this study [
]. It was further assumed that all of the coal Hg enters the gas phase and none leaves with the bottom ash or slag.
9
The coal cost used in this study is $1.55/GJ ($1.64/MMBtu) for Illinois No. 6 coal, $0.84/GJ ($0.89/MMBtu) for PRB coal and $0.78/GJ ($0.83/MMBtu) for lignite coal (2007 cost of coal in
]. The PSFM requires that all cost inputs have a consistent cost year basis. Because the capital and operating cost estimates are in June 2007 dollars, the fuel costs must also be in June 2007 dollars

Cost and Performance Baseline for Coal-to-SNG and Ammonia (Volume 2)
25
June 2007 dollars). These costs were determined using the following information from the EIA’s 2008 AEO:
• The 2007 minemouth cost of Illinois No. 6 in 2006 dollars, $32.66/tonne ($29.63/ton), was obtained from Supplemental Table 112 of the EIA’s 2008 AEO for eastern interior high-sulfur bituminous coal. From the same table the 2007 minemouth cost of PRB coal in 2006 dollars is $13.02/tonne ($11.81/ton) and of NDL coal in 2006 dollars is $11.68/tonne ($10.59/ton).
• The cost of Illinois No. 6 coal was escalated to 2007 dollars using the gross domestic product (GDP) chain-type price index from AEO 2008, resulting in a price of $33.67/tonne ($30.55/ton) [10
• Transportation costs for Illinois No. 6 and PRB coal were estimated to be 25 percent of the minemouth cost based on the average transportation rate of the respective coals to the surrounding regions [
]. Similarly, the cost of PRB coal in 2007 dollars is $13.42/tonne ($12.17/ton) and the cost of NDL in 2007 dollars is $12.04/tonne ($10.92/ton).
11
]. The final delivered costs for Illinois No. 6 coal shown in the report is $42.09/tonne ($38.18/ton) or $1.55/GJ ($1.64/MMBtu). PRB coal has a final delivered cost of $16.77/tonne ($15.22/ton) or $0.84/GJ ($0.89/MMBtu). The NDL plant is assumed to be located at the minemouth, so transportation costs are zero. (Note: The Illinois No. 6 coal cost of $1.6366/MMBtu was used in calculations, but only two decimal places are shown in the report. Similarly, the PRB and lignite fuel costs convert to $0.8884/MMBtu and $0.8251/MMBtu, respectively.)

Cost and Performance Baseline for Coal-to-SNG and Ammonia (Volume 2)
26
Exhibit 2-5 Illinois No. 6 Bituminous, Old Ben Mine Bituminous Design Coal Analysis
Proximate Analysis Dry Basis, % As Received, % Moisture 0.0 11.12 Ash 10.91 9.70 Volatile Matter 39.37 34.99 Fixed Carbon 49.72 44.19
Total 100.0 100.0 Ultimate Analysis Dry Basis, % As Received, %
Carbon 71.72 63.75 Hydrogen 5.06 4.50 Nitrogen 1.41 1.25 Sulfur 2.82 2.51 Chlorine 0.33 0.29 Ash 10.91 9.70 Moisture 0.00 11.12 Oxygen (Note A) 7.75 6.88
Total 100.0 100.0 Heating Value Dry Basis As Received
HHV, kJ/kg 30,506 27,113 HHV, Btu/lb 13,126 11,666 LHV, kJ/kg 29,544 26,151 LHV, Btu/lb 12,712 11,252
Hardgrove Grindability Index 60 Ash Mineral Analysis %
Silica SiO2 45.0 Aluminum Oxide Al2O3 18.0 Iron Oxide Fe2O3 20.0 Titanium Dioxide TiO2 1.0 Calcium Oxide CaO 7.0 Magnesium Oxide MgO 1.0 Sodium Oxide Na2O 0.6 Potassium Oxide K2O 1.9 Sulfur Trioxide SO3 3.5 Phosphorous Pentoxide P2O5 0.2 Barium Oxide Ba2O 0.00 Strontium Oxide SrO 0.00 Unknown --- 1.8
Total 100.0 Trace Components ppmd
Mercury (Note B) Hg 0.15 Notes: A. By Difference
B. Mercury value is the mean plus one standard deviation using 2004 Keystone Coal Industry Manual

Cost and Performance Baseline for Coal-to-SNG and Ammonia (Volume 2)
27
Exhibit 2-6 Montana Rosebud PRB, Area D, Western Energy Co. Mine Subbituminous Design Coal Analysis
Proximate Analysis Dry Basis, % As Received, % Moisture 0.0 25.77 Ash 11.04 8.19 Volatile Matter 40.87 30.34 Fixed Carbon 48.09 35.70
Total 100.0 100.0 Ultimate Analysis Dry Basis, % As Received, %
Carbon 67.45 50.07 Hydrogen 4.56 3.38 Nitrogen 0.96 0.71 Sulfur 0.98 0.73 Chlorine 0.01 0.01 Ash 11.03 8.19 Moisture 0.00 25.77 Oxygen (Note A) 15.01 11.14
Total 100.0 100.0 Heating Value Dry Basis As Received
HHV, kJ/kg 26,787 19,920 HHV, Btu/lb 11,516 8,564 LHV, kJ/kg 25,810 19,195 LHV, Btu/lb 11,096 8,252
Hardgrove Grindability Index 57 Ash Mineral Analysis %
Silica SiO2 38.09 Aluminum Oxide Al2O3 16.73 Iron Oxide Fe2O3 6.46 Titanium Dioxide TiO2 0.72 Calcium Oxide CaO 16.56 Magnesium Oxide MgO 4.25 Sodium Oxide Na2O 0.54 Potassium Oxide K2O 0.38 Sulfur Trioxide SO3 15.08 Phosphorous Pentoxide P2O5 0.35 Barium Oxide Ba2O 0.00 Strontium Oxide SrO 0.00 Unknown --- 0.84
Total 100.0 Trace Components ppmd
Mercury (Note B) Hg 0.081 Notes: A. By Difference
B. Mercury value is the mean plus one standard deviation using EPA’s ICR data

Cost and Performance Baseline for Coal-to-SNG and Ammonia (Volume 2)
28
Exhibit 2-7 North Dakota Beulah-Zap Lignite, Freedom, ND Mine Lignite Design Coal Analysis
Proximate Analysis Dry Basis, % As Received, % Moisture 0.0 36.08 Ash 15.43 9.86 Volatile Matter 41.49 26.52 Fixed Carbon 43.09 27.54
Total 100.0 100.0 Ultimate Analysis Dry Basis, % As Received, %
Carbon 61.88 39.55 Hydrogen 4.29 2.74 Nitrogen 0.98 0.63 Sulfur 0.98 0.63 Chlorine 0.00 0.00 Ash 15.43 9.86 Moisture 0.00 36.08 Oxygen (Note A) 16.44 10.51
Total 100.0 100.0 Heating Value Dry Basis As Received
HHV, kJ/kg 24,254 15,391 HHV, Btu/lb 10,427 6,617 LHV, kJ/kg 23,335 14,804 LHV, Btu/lb 10,032 6,364
Hardgrove Grindability Index Not applicable Ash Mineral Analysis %
Silica SiO2 35.06 Aluminum Oxide Al2O3 12.29 Iron Oxide Fe2O3 5.12 Titanium Dioxide TiO2 0.58 Calcium Oxide CaO 14.39 Magnesium Oxide MgO 6.61 Sodium Oxide Na2O 5.18 Potassium Oxide K2O 0.64 Sulfur Trioxide SO3 16.27 Barium Oxide Ba2O 0.56 Strontium Oxide SrO 0.27 Manganese Dioxide MnO2 0.02 Unknown --- 3.00
Total 100.0 Trace Components ppmd Mercury (Note B) Hg 0.116
Notes: A. By Difference B. Mercury value is the mean plus one standard deviation using EPA’s ICR data

Cost and Performance Baseline for Coal-to-SNG and Ammonia (Volume 2)
29
2.4 PRODUCT SPECIFICATIONS
To be a viable pipeline replacement fuel for natural gas, the SNG must meet certain specifications.
Synthetic Natural Gas
Exhibit 2-8 lists generic specifications for domestic and commercial natural gas from a pipeline handbook [12
Exhibit 2-8 SNG Pipeline Requirements
].
Parameter Value
Heating Value, kJ/Nm3 (Btu/scf) > 35,367 (950)
Sulfur Content, kg/100 Nm3 (lb/100 scf) < 0.0023 (0.00014)
CO2 Content, vol % < 2 Moisture Content, kg/1000 Nm3 (lb/1000 scf) < 62.5 (3.9)
Temperature, °C (°F) < 49 (120)
As liquefied natural gas (LNG) and other non-conventional gas sources become increasingly prevalent, more attention is being placed on natural gas specifications and its interchangeability. An administrative law judge at the Federal Energy Regulatory Commission (FERC) recently ruled in favor of Florida Gas Transmission (FGT) setting stringent specifications on LNG imported through the gulf coast [13
There is a wide range of fuel quality that is acceptable to most combustion equipment, but the same equipment often will not handle high variability in the fuel quality. The SNG produced in this study falls at the low end of the acceptable quality range with HHVs ranging from 965-975 Btu/scf, Wobbe Indices in the range of 1,265-1,275, and inert concentrations ranging from 3-4.5 percent. The primary reason for the lower quality product is the absence of higher hydrocarbons. The methanation process produces only methane, and the balance of the SNG is necessarily inerts. Pure methane has a HHV of 1,012 Btu/scf and a Wobbe Index of 1,357, which represent the upper limits of the methanation process.
]. The ruling set an acceptable Wobbe Index range of 1,340-1,396 and gross heating value range of 1,025-1,110 British thermal unit per standard cubic foot (Btu/scf). The Wobbe Index is a measure of the energy carrying capacity of a given fuel and is found by dividing the fuel heating value by the square root of the specific gravity (SG). Notably the ruling was not applied to domestic gas received into FGT’s system.
The quality of the SNG produced in this study could be enhanced in a number of ways:
• Increase the oxygen purity from 99 percent to 99.5 percent (or greater) with a corresponding increase in air separation unit (ASU) cost.
• Upgrade the SNG purification system (pressure swing adsorption [PSA]) by increasing the bed depth or adding beds in series to remove additional CO2 (again at increased cost).
Ultimately the SNG purity requirements will be dictated by project location and fuel end use. The quality of the product is consistent across the cases modeled in this study.

Cost and Performance Baseline for Coal-to-SNG and Ammonia (Volume 2)
30
The two general quality specifications for commercial grade ammonia are shown in Ammonia
Exhibit 2-9 [14
Exhibit 2-9 Ammonia Quality Requirements
]. For the co-production cases, the commercial grade specification was used as the refrigeration grade specification requires further purification that was deemed beyond the scope of these baseline cases.
Parameter Commercial
Grade Refrigeration Grade Purity (min wt%) 99.5 99.98 Water (max wt%) 0.5 0.015 Inerts (max mL/g) not specified 0.1 Oil (ppm by wt) 5.0 3.0
2.5 ENVIRONMENTAL TARGETS There are relatively few emission sources associated with the SNG and ammonia production plants. The primary emissions occur when the SNG is consumed, presumably in a combustion-type process, which is outside of the battery limit of this study. The plants in this study have several point source emissions, but consist mostly of fugitive emissions, which are also beyond the scope of this study. Typical emission sources include particulate matter (PM) from the coal pile, coal transfer operations, slag handling, and the cooling tower; fugitive emissions from valves and other process equipment; and emissions from emergency generators and flare stacks. None of these operations are included in the Aspen model, and emissions from these sources are not quantified.
There are some point source emissions that are modeled and accounted for in the various cases:
• Drying in the bituminous coal cases includes combustion of a slipstream of clean syngas and Claus plant tail gas. The hot flue gases are used to dry the coal and then exhausted to atmosphere.
• In the NH3 co-production cases there is a waste heat boiler that is fueled by the PSA purification unit purge gas. Heat is recovered from the boiler exhaust gases prior to venting it to atmosphere.
• In all cases a portion of the lockhopper transport gas is vented to atmosphere.
• In all non-sequestration cases the CO2-rich gas from the two-stage Selexol process is vented to atmosphere. This stream is compressed and stored in a saline aquifer in the carbon sequestration cases.
• In all non-sequestration cases the off gas from the PSA SNG purification unit is vented to atmosphere. This stream is compressed and stored in a saline aquifer in the carbon sequestration cases.

Cost and Performance Baseline for Coal-to-SNG and Ammonia (Volume 2)
31
The only emissions reported for each case are sulfur dioxide (SO2) and CO2. In the PRB and lignite coal cases, there are no combustion operations so no SO2 emissions are reported. PM in the SNG is not released until combustion occurs and fugitive dust sources are not quantified. Similarly, mercury remaining in the SNG is not released to the atmosphere until combustion occurs. Since the fuel in the two combustion operations (coal dryer in bituminous coal cases and waste heat boiler in NH3 co-production cases) is void of nitrogen, and thermal oxides of nitrogen (NOx) formation is minimal at the temperatures of combustion, NOx is not quantified as an emission.
Since mercury is a methanation catalyst poison, essentially all of the mercury must be removed from the gas stream. The environmental target for mercury capture is greater than 90 percent. Based on experience at the Eastman Chemical plant, where synthesis gas (syngas) from a General Electric Energy (GEE) gasifier is treated, the actual mercury removal efficiency used is 95 percent. Sulfur-impregnated activated carbon is used by Eastman as the adsorbent in the packed beds operated at 30°C (86°F) and 6.2 megapascals (MPa) (900 pounds per square inch gage [psig]). Mercury removal between 90 and 95 percent has been reported with a bed life of 18 to 24 months. Removal efficiencies may be even higher, but at 95 percent the measurement precision limit was reached. Eastman has yet to experience any mercury contamination in its product [15
Since momentum for carbon regulations continues to build, CO2 emissions are also reported for each case. Because the form of emission limits, should they be imposed, is not known, CO2 emissions are reported on a pounds per million British thermal units (lb/MMBtu) heat input to the gasifier basis as well as total tons per year. The emission values were used to quantify the impact of a carbon tax later in the report.
]. Mercury removals of greater than 99 percent can be achieved by the use of dual beds, i.e., two beds in series. However, this study assumes that the use of sulfur-impregnated carbon in a single carbon bed achieves 95 percent reduction of mercury emissions, which reduces the Hg content in the clean syngas to less than 0.45 ppb in all cases.
Ultimately, the environmental regulations for an SNG or SNG and ammonia co-production plant will be established by state and local jurisdictions. However, since the emissions profiles of these plants are relatively benign, it is assumed that environmental permits will be attainable.
2.6 CAPACITY FACTOR
Electric Power Research Institute (EPRI) examined the historical forced and scheduled outage times for IGCCs and concluded that the reliability factor (which looks at forced or unscheduled outage time only) for a single train IGCC (no spares) would be about 90 percent [16
There are four operating IGCC’s worldwide that use a solid feedstock and are primarily power producers (Polk, Wabash, Buggenum, and Puertollano). A 2006 report by Higman et al. examined the reliability of these IGCC power generation units and concluded that typical annual on-stream times are around 80 percent [
]. To get the AF, one has to deduct the scheduled outage time. In reality the scheduled outage time differs from gasifier technology-to-gasifier technology, but the differences are relatively small and would have minimal impact on the CF.
17
Previous NETL studies utilizing IGCC technology have assumed a CF of 80 percent based on EPRI’s studies and Higman’s report. However, a 90 percent CF was assumed for the six gasifier
]. The CF would be somewhat less than the on-stream time since most plants operate at less than full load for some portion of the operating year.

Cost and Performance Baseline for Coal-to-SNG and Ammonia (Volume 2)
32
gasification island used in this study, which has been supported by Siemens Energy, Inc. [18
The addition of CO2 capture or an ammonia co-production facility was assumed not to impact the AF, nor was the addition of compression and sequestration. This assumption was made to enable a comparison based on the impact of capital and variable operating costs only. Any reduction in assumed CF would further increase the FYCOP for the carbon sequestration cases and ammonia co-production cases as shown in the sensitivity analysis in
]. It was assumed that if one of the six gasifiers stopped operation for maintenance or repair, reducing the CF to 83 percent, the system could operate at 100 percent capacity long enough to compensate for the down time.
Exhibit ES-9.
2.7 RAW WATER WITHDRAWAL AND CONSUMPTION A water balance was performed for each case on the major water consumers in the process. The total water demand for each subsystem was determined and internal recycle water available from various sources like boiler feedwater (BFW) blowdown and condensate from syngas was applied to offset the water demand. The difference between demand and recycle is raw water withdrawal. Raw water withdrawal is the water removed from the ground or diverted from a surface-water source for use in the plant. Raw water consumption is also accounted for as the portion of the raw water withdrawn that is evaporated, transpired, incorporated into products or otherwise not returned to the water source it was withdrawn from.
Raw water makeup was assumed to be provided 50 percent by a publicly owned treatment works (POTW) and 50 percent from groundwater. Raw water withdrawal is defined as the water metered from a raw water source and used in the plant processes for any and all purposes, such as cooling tower makeup, BFW makeup, slag handling makeup and quench system makeup. The difference between withdrawal and process water returned to the source is consumption. Consumption represents the net impact of the process on the water source.
BFW blowdown and a portion of the sour water stripper blowdown were assumed to be treated and recycled to the cooling tower. The cooling tower blowdown and the balance of the SWS blowdown streams were assumed to be treated and 90 percent returned to the water source with the balance sent to the ash ponds for evaporation.
The largest consumer of raw water in all cases is cooling tower makeup. The bituminous coal cases utilize a mechanical draft, evaporative cooling tower, and all process blowdown streams were assumed to be treated and recycled to the cooling tower. It was assumed that the PRB and NDL coal cases utilized a parallel cooling system with half of the turbine exhaust steam condensed in an air-cooled condenser and half in a water-cooled condenser.
The design ambient wet bulb (WB) temperature of 11°C (51.5°F) at the Midwestern site was used to achieve a cooling water temperature of 16°C (60°F) using an approach of 5°C (8.5°F). The conditions of 3°C (37°F) at the Montana site and 2°C (36°F) at the North Dakota site (Exhibit 2-1) were used to achieve a cooling water temperature of 9°C (48°F) and 8°C (47°F), respectively at the two sites using an approach of 6°C (11°F). The cooling water range was assumed to be 11°C (20°F) for all cases. The cooling tower makeup rate was determined using the following:[19
• Evaporative losses of 0.8 percent of the circulating water flow rate per 10°F of range
]
• Drift losses of 0.001 percent of the circulating water flow rate

Cost and Performance Baseline for Coal-to-SNG and Ammonia (Volume 2)
33
• Blowdown losses were calculated as follows: o Blowdown Losses = Evaporative Losses / (Cycles of Concentration - 1)
Where cycles of concentration are a measure of water quality and a mid-range value of 4 was chosen for this study.
The water balances presented in subsequent sections include the water demand of the major water consumers within the process, the amount provided by internal recycle, the amount of raw water withdrawal by difference, the amount of process water returned to the source and the raw water consumption, again by difference.
2.8 COST ESTIMATING METHODOLOGY The estimating methodology for capital costs, operations and maintenance costs, and CO2 TS&M costs are described below. The finance structure, basis for the discounted cash flow analysis, and first-year SNG cost calculations are also described.
2.8.1 As illustrated in
Capital Costs Exhibit 2-10, this study reports capital cost at four levels: Bare Erected Cost
(BEC), Total Plant Cost (TPC), Total Overnight Cost (TOC) and Total As-spent Capital (TASC). BEC, TPC and TOC are “overnight” costs and are expressed in “base-year” dollars. The base year is the first year of capital expenditure, which for this study is assumed to be 2007. TASC is expressed in mixed-year, current-year dollars over the entire capital expenditure period, which is assumed to last five years (2007 to 2011).
Exhibit 2-10 Capital Cost Levels and their Elements
process equipment
supporting facilities
direct and indirect laborBEC
TPC
TOC
TASC
EPC contractor services
process contingency
project contingency
preproduction costs
inventory capital
financing costsother owner’s costs
escalation during capital expenditure period
interest on debt during capital expenditure period
Bare Erected CostTotal Plant Cost
Total Overnight CostTotal As-Spent Cost
BEC, TPC and TOC are all “overnight” costs expressed
in base-year dollars.
TASC is expressed in mixed-year current dollars, spread over the capital expenditure
period.

Cost and Performance Baseline for Coal-to-SNG and Ammonia (Volume 2)
34
The BEC
The
comprises the cost of process equipment, on-site facilities and infrastructure that support the plant (e.g., shops, offices, labs, road), and the direct and indirect labor required for its construction and/or installation. The cost of EPC services and contingencies is not included in BEC. BEC is an overnight cost expressed in base-year (2007) dollars.
TPC
The
comprises the BEC plus the cost of services provided by the engineering, procurement and construction (EPC) contractor and project and process contingencies. EPC services include: detailed design, contractor permitting (i.e., those permits that individual contractors must obtain to perform their scopes of work, as opposed to project permitting, which is not included here), and project/construction management costs. TPC is an overnight cost expressed in base-year (2007) dollars.
TOC
The
comprises the TPC plus owner’s costs. TOC is an “overnight” cost, expressed in base-year (2007) dollars and as such does not include escalation during construction or interest during construction. TOC is an overnight cost expressed in base-year (2007) dollars.
TASC
Cost Estimate Basis and Classification
is the sum of all capital expenditures as they are incurred during the capital expenditure period including their escalation. TASC also includes interest during construction. Accordingly, TASC is expressed in mixed, current-year dollars over the capital expenditure period.
The TPC and Operation and Maintenance (O&M) costs for each of the cases in the study were estimated by WorleyParsons using an in-house database and conceptual estimating models. Costs were further calibrated using a combination of adjusted vendor-furnished and actual cost data from recent design projects.
The capital costs for each cost account were reviewed by comparing individual accounts across each of the cases to ensure an accurate representation of the relative cost differences between the cases and accounts.
Recommended Practice 18R-97 of the Association for the Advancement of Cost Engineering International (AACE) describes a Cost Estimate Classification System as applied in Engineering, Procurement and Construction for the process industries [20
Most techno-economic studies, including this coal-to-SNG study, completed by NETL feature cost estimates intended for the purpose of a “Feasibility Study” (AACE Class 4).
].
Exhibit 2-11 describes the characteristics of an AACE Class 4 Cost Estimate. Cost estimates in this study have an expected accuracy range of -15%/+30%.
System Code-of-Accounts The costs are grouped according to a process/system oriented code of accounts. This type of code-of-account structure has the advantage of grouping all reasonably allocable components of a system or process so they are included in the specific system account. (This would not be the case had a facility, area, or commodity account structure been chosen instead).

Cost and Performance Baseline for Coal-to-SNG and Ammonia (Volume 2)
35
Exhibit 2-11 Features of an AACE Class 4 Cost Estimate
Project Definition Typical Engineering Completed Expected Accuracy
1 to 15%
plant capacity, block schematics, indicated layout, process flow diagrams for main process systems, and preliminary engineered process and utility equipment lists
-15% to -30% on the low side, and +20% to +50% on the
high side
Gasification Plant Maturity The gasification production plant is based on commercial offerings; however, there have been very limited sales of these units. The costs listed reflect the “next commercial offering” level of cost rather than mature nth-of-a-kind (NOAK) cost. Thus, each of these cases reflects the expected cost for the next commercial sale of the gasification technology.
CO2 Removal Maturity Pre-combustion CO2 removal from syngas streams has been proven in chemical processes with similar conditions to that in gasification plants in this study, and has been demonstrated at the Great Plains Synfuels plan and in hundreds of syngas processing plants such as ammonia, methanol, hydrogen, and other petrochemical plants worldwide.
Contracting Strategy The estimates are based on an EPCM approach utilizing multiple subcontracts. This approach provides the Owner with greater control of the project, while minimizing, if not eliminating most of the risk premiums typically included in an Engineer/Procure/Construct (EPC) contract price.
In a traditional lump sum EPC contract, the Contractor assumes significant financial risk for performance, schedule, and cost up to stipulated contractual levels. However, as a result of current market conditions, EPC contractors appear more unwilling to accept significant project completion and performance risk. Rather, the current trend appears to be a modified EPC approach where much of the risk remains with the Owner. Where Contractors are willing to accept the risk in EPC type lump-sum arrangements, it is reflected in the project cost. In today’s market, Contractor premiums for accepting these risks, particularly performance risk, can be substantial and increase the overall project costs dramatically.
The EPCM approach used as the basis for the estimates here is anticipated to be the most likely contracting model for SNG/ammonia projects today. While the Owner retains the risks, the risks become reduced with time, as there is better scope definition at the time of contract award(s).
Estimate Scope The estimates represent a complete synfuels production facility, and in the co-production cases, a complete NH3 production facility on a generic site.
The plant boundary limit is defined as the total plant facility within the “fence line” including coal receiving and water supply system, but terminating at the high voltage side of the main power transformers and the compression of the SNG. The single exception to the fence line limit is in the carbon sequestration cases where costs are included for TS&M of the CO2.

Cost and Performance Baseline for Coal-to-SNG and Ammonia (Volume 2)
36
Capital Costs WorleyParsons developed the capital cost estimates for each plant using the company’s in-house database and conceptual estimating models for each of the specific technologies. This database and the respective models are maintained by WorleyParsons as part of a commercial gasification design base of experience for similar equipment in the company’s range of power and process projects. A reference bottoms-up estimate for each major system provides the basis for the estimating models.
Other key estimate considerations include the following:
• Labor costs are based on Midwest, Merit Shop. The estimating models are based on U.S. Gulf Coast and the labor has been factored to Midwest. The basis for the factors is the PAS, Inc. (PAS) “Merit Shop Wage & Benefit Survey,” which is published annually. Based on the data provided in PAS, WorleyParsons used the weighted average payroll plus fringe rate for a standard craft distribution as developed for the estimating models. PAS presents information for eight separate regions. For this study, Region 5 (IL, IN, MI, MN, OH, and WI) was selected. The weighted average rate for Region 8 (CO, MT, ND, SD, UT, and WY) is within one-half of one percent of that for Region 5. Given the accuracy limits of the studies, the differential is insignificant.
• The estimates are based on a competitive bidding environment, with adequate skilled craft labor available locally.
• Labor is based on a 50-hour work-week (5-10s). No additional incentives such as per- diems or bonuses have been included to attract craft labor.
• While not included at this time, labor incentives may ultimately be required to attract and retain skilled labor depending on the amount of competing work in the region, and the availability of skilled craft in the area at the time the projects proceed to construction.
• The estimates are based on a greenfield sites.
• The sites are considered to be Seismic Zone 1, relatively level, and free from hazardous materials, archeological artifacts, or excessive rock. Soil conditions are considered adequate for spread footing foundations. The soil bearing capability is assumed adequate such that piling is not needed to support the foundation loads.
• Costs are limited to within the “fence line,” terminating at the high voltage side of the main power transformers with the exception of costs included for TS&M of CO2 in all carbon sequestration cases.
• Engineering and Construction Management are estimated at 10 percent of BEC. These costs consist of all home office engineering and procurement services as well as field construction management costs. Site staffing generally includes a construction manager, resident engineer, scheduler, and personnel for project controls, document control, materials management, site safety, and field inspection.
• All capital costs are presented as “Overnight Costs” in June 2007 dollars. Escalation to period-of-performance is specifically excluded in the TPC. However, the CCF used to calculate FYCOP includes capital cost escalation during construction of 3.6 percent.

Cost and Performance Baseline for Coal-to-SNG and Ammonia (Volume 2)
37
Price Fluctuations During the course of this study, the prices of equipment and bulk materials fluctuated quite substantially. Some reference quotes pre-dated the 2007 year cost basis while others were received post-2007. All vendor quotes used to develop these estimates were adjusted to June 2007 dollars accounting for the price fluctuations. Adjustments of costs pre-dating 2007 benefitted from a vendor survey of actual and projected pricing increases from 2004 through mid-2007 that WorleyParsons conducted for another project. The results of that survey were used to validate/recalibrate the corresponding escalation factors used in the conceptual estimating models. The more recent economic down turn has resulted in a reduction of commodity prices such that many price indices have similar values in January 2010 compared to June 2007. For example, the Chemical Engineering Plant Cost Index was 532.7 in June 2007 and 532.9 in January 2010, and the Gross Domestic Product Chain-type Price Index was 106.7 on July 1, 2007 and 110.0 on January 1, 2010. While these overall indices are nearly constant, it should be noted that the cost of individual equipment types may still deviate from the June 2007 reference point.
Exclusions The capital cost estimate includes all anticipated costs for equipment and materials, installation labor, professional services (Engineering and Construction Management), and contingency. The following items are excluded from the capital costs:
• Escalation to period-of-performance
• Owner’s costs – these are accounted for separately and are described below.
• All taxes, with the exception of payroll and property taxes (property taxes are included with the fixed O&M costs)
• Site specific considerations – including, but not limited to, seismic zone, accessibility, local regulatory requirements, excessive rock, piles, laydown space, etc.
• Labor incentives in excess of a 5-10s
• Additional premiums associated with an EPC contracting approach
Contingency Process and project contingencies are included in estimates to account for unknown costs that are omitted or unforeseen due to a lack of complete project definition and engineering. Contingencies are added because experience has shown that such costs are likely, and expected, to be incurred even though they cannot be explicitly determined at the time the estimate is prepared.
Capital cost contingencies do not cover uncertainties or risks associated with
• scope changes • changes in labor availability or productivity • delays in equipment deliveries • changes in regulatory requirements • unexpected cost escalation • performance of the plant after startup (e.g., availability, efficiency)

Cost and Performance Baseline for Coal-to-SNG and Ammonia (Volume 2)
38
Process Contingency Process contingency is intended to compensate for uncertainty in cost estimates caused by performance uncertainties associated with the development status of a technology. Process contingencies are applied to each plant section based on its current technology status.
As shown in Exhibit 2-12, AACE International Recommended Practice 16R-90 provides guidelines for estimating process contingency based on EPRI philosophy [21
Process contingencies have been applied to the estimates in this study as follows:
].
• Gasifiers and Syngas Coolers – 15 percent on all cases – next-generation commercial offering
• Two Stage Selexol – 20 percent on all cases - unproven technology at commercial scale
• Methanation Process – 10 percent on all cases – unproven technology at commercial scale
• Mercury Removal – 5 percent on all cases – minimal commercial scale experience in gasification applications
• Instrumentation and Controls – 5 percent for integration issues
Exhibit 2-12 AACE Guidelines for Process Contingency
Technology Status Process Contingency
(% of Associated Process Capital)
New concept with limited data 40+
Concept with bench-scale data 30-70
Small pilot plant data 20-35
Full-sized modules have been operated 5-20
Process is used commercially 0-10
Process contingency is typically not applied to costs that are set equal to a research goal or programmatic target since these values presume to reflect the total cost.
Project Contingency AACE 16R-90 states that project contingency for a “budget-type” estimate (AACE Class 4 or 5) should be 15 to 30 percent of the sum of BEC, EPC fees and process contingency. This was used as a general guideline, but some project contingency values outside of this range occur based on WorleyParsons’ in-house experience.

Cost and Performance Baseline for Coal-to-SNG and Ammonia (Volume 2)
39
Owner’s Costs Exhibit 2-13 explains the estimation method for owner’s costs. With some exceptions, the estimation method follows guidelines in Sections 12.4.7 to 12.4.12 of AACE International Recommended Practice No. 16R-90 [21]. The Electric Power Research Institute’s “Technical Assessment Guide (TAG®) – Power Generation and Storage Technology Options” also has guidelines for estimating owner’s costs. The EPRI and AACE guidelines are very similar. In instances where they differ, this study has sometimes adopted the EPRI approach.

Cost and Performance Baseline for Coal-to-SNG and Ammonia (Volume 2)
40
Exhibit 2-13 Owner’s Costs Included in TOC
Owner’s Cost Estimate Basis
Prepaid Royalties
Any technology royalties are assumed to be included in the associated equipment cost, and thus are not included as an owner’s cost.
Preproduction (Start-Up)
Costs
• 6 months operating labor • 1 month maintenance materials at full capacity • 1 month non-fuel consumables at full capacity • 1 month waste disposal • 25% of one month’s fuel cost at full capacity • 2% of TPC
Compared to AACE 16R-90, this includes additional costs for operating labor (6 months versus 1 month) to cover the cost of training the plant operators, including their participation in startup, and involving them occasionally during the design and construction. AACE 16R-90 and EPRI TAG® differ on the amount of fuel cost to include; this estimate follows EPRI.
Working Capital
Although inventory capital (see below) is accounted for, no additional costs are included for working capital.
Inventory Capital
• 0.5% of TPC for spare parts • 60 day supply (at full capacity) of fuel. Not applicable for natural gas. • 60 day supply (at full capacity) of non-fuel consumables (e.g., chemicals and catalysts) that are stored on site. Does not
include catalysts and adsorbents that are batch replacements such as WGS, COS, and SCR catalysts and activated carbon.
AACE 16R-90 does not include an inventory cost for fuel, but EPRI TAG® does.
Land • $3,000/acre (300 acres for IGCC and PC, 100 acres for NGCC)
Financing Cost
• 2.7% of TPC
This financing cost (not included by AACE 16R-90) covers the cost of securing financing, including fees and closing costs but not including interest during construction (or AFUDC). The “rule of thumb” estimate (2.7% of TPC) is based on a 2008 private communication with a capital services firm.

Cost and Performance Baseline for Coal-to-SNG and Ammonia (Volume 2)
41
Owner’s Cost Estimate Basis
Other Owner’s
Costs
• 15% of TPC
This additional lumped cost is not included by AACE 16R-90 or EPRI TAG®. The “rule of thumb” estimate (15% of TPC) is based on a 2009 private communication with WorleyParsons. Significant deviation from this value is possible as it is very site and owner specific. The lumped cost includes:
- Preliminary feasibility studies, including a Front-End Engineering Design (FEED) study - Economic development (costs for incentivizing local collaboration and support) - Construction and/or improvement of roads and/or railroad spurs outside of site boundary - Legal fees - Permitting costs - Owner’s engineering (staff paid by owner to give third-party advice and to help the owner oversee/evaluate the work of
the EPC contractor and other contractors) - Owner’s contingency (Sometimes called “management reserve”, these are funds to cover costs relating to delayed startup,
fluctuations in equipment costs, unplanned labor incentives in excess of a five-day/ten-hour-per-day work week. Owner’s contingency is NOT a part of project contingency.)
This lumped cost does NOT include:
- EPC Risk Premiums (Costs estimates are based on an Engineering Procurement Construction Management approach utilizing multiple subcontracts, in which the owner assumes project risks for performance, schedule and cost)
- Transmission interconnection: the cost of interconnecting with power transmission infrastructure beyond the plant busbar. - Taxes on capital costs: all capital costs are assumed to be exempt from state and local taxes. - Unusual site improvements: normal costs associated with improvements to the plant site are included in the bare erected
cost, assuming that the site is level and requires no environmental remediation. Unusual costs associated with the following design parameters are excluded: flood plain considerations, existing soil/site conditions, water discharges and reuse, rainfall/snowfall criteria, seismic design, buildings/enclosures, fire protection, local code height requirements, noise regulations.

Cost and Performance Baseline for Coal-to-SNG and Ammonia (Volume 2)
42
2.8.2 The production costs or operating costs and related maintenance expenses (O&M) pertain to those charges associated with operating and maintaining the plants over their expected life. These costs include:
Operations and Maintenance Costs
• Operating labor
• Maintenance – material and labor
• Administrative and support labor
• Consumables
• Fuel
• Waste disposal
• Co-product or by-product credit (that is, a negative cost for any by-products sold) There are two components of O&M costs; fixed O&M, which is independent of product production, and variable O&M, which is proportional to product production.
Operating Labor Operating labor cost was determined based on of the number of operators required for each specific case. The average base labor rate used to determine annual cost is $34.65/hour (hr) in 2007 dollars. The associated labor burden is estimated at 30 percent of the base labor rate.
All cases have two skilled operators, one foreman, and three laboratory technician positions. The co-production plants have 13 operator positions, whereas the SNG only plants have 12 operator positions. This differs from Volumes 1 and 3 of the Baseline Series, which use nine operator positions for the non-capture cases and ten for the capture cases. The number of the other labor personnel remains the same.
Maintenance Material and Labor Maintenance cost was evaluated on the basis of relationships of maintenance cost to initial capital cost. This represents a weighted analysis in which the individual cost relationships were considered for each major plant component or section.
Administrative and Support Labor Labor administration and overhead charges are assessed at a rate of 25 percent of the burdened O&M labor.
Consumables The cost of consumables, including fuel, was determined on the basis of individual rates of consumption, the unit cost of each specific consumable commodity, and the plant annual operating hours.
Quantities for major consumables such as fuel were taken from technology-specific heat and mass balance diagrams developed for each plant application. Other consumables were evaluated on the basis of the quantity required using reference data.

Cost and Performance Baseline for Coal-to-SNG and Ammonia (Volume 2)
43
The quantities for initial fills and daily consumables were calculated on a 100 percent operating capacity basis. The annual cost for the daily consumables was then adjusted to incorporate the annual plant operating basis, or CF.
Initial fills of the consumables, fuels and chemicals, are different from the initial chemical loadings, which are included with the equipment pricing in the capital cost.
Waste Disposal Waste quantities and disposal costs were determined similarly to the consumables. The slag and spent ZnO sorbent from each case are considered wastes with disposal costs of $17.89/tonne ($16.23/ton). The carbon used for mercury control is considered a hazardous waste with disposal cost of $919/tonne ($834/ton).
Co-Products and By-Products The primary products in this study are SNG in all cases and ammonia in the co-production cases. The by-products include sulfur, electricity, and potentially CO2. Due to the variable marketability of the sulfur, no credit or disposal cost was used. The electricity produced in excess of internal requirements was assumed sold on the open market at a price of $58/megawatt-hour (MWh). CO2 was assumed to be a waste product that is either vented to atmosphere or compressed and sequestered with the associated costs. A sensitivity analysis was done to determine the economic impact of selling the CO2 for enhanced oil recovery (EOR) at one extreme and debiting the project for CO2 emissions assuming a carbon tax at the other extreme.
It should be noted that by-product credits and/or disposal costs could potentially be an additional determining factor in the choice of technology for some companies and in selecting some sites. A high local value of the product can establish whether or not added capital should be included in the plant costs to produce a particular co-product. Slag is a potential by-product in certain markets and would have potential marketability. However, as stated above, the slag is considered waste in this study with a concomitant disposal cost.
2.8.3 For those cases that feature carbon sequestration, the capital and operating costs for CO2 TS&M were independently estimated by NETL. Those costs were converted to a FYCOP and combined with the plant capital and operating costs to produce an overall FYCOP. The TS&M costs were initially levelized over a 30-year period using the methodology described in the next subsection of this report, and subsequently converted to first year costs by dividing by the levelization factor.
CO2 Transport, Storage, and Monitoring
CO2 TS&M costs were estimated based on the following assumptions:
• CO2 is supplied to the pipeline at the plant fence line at a pressure of 15.3 MPa (2,215 psia). The CO2 product gas composition varies in the cases presented, but is expected to meet the specification described in Exhibit 2-14. A glycol dryer located near the mid-point of the compression train is used to meet the moisture specification.

Cost and Performance Baseline for Coal-to-SNG and Ammonia (Volume 2)
44
Exhibit 2-14 CO2 Pipeline Specification
Parameter Units Parameter Value
Inlet Pressure MPa (psia) 15.3 (2,215)
Outlet Pressure MPa (psia) 10.4 (1,515)
Inlet Temperature °C (°F) 35 (95)
N2 Concentration ppmv < 300
O2 Concentration ppmv < 40
Ar Concentration ppmv < 10
H2O Concentration ppmv < 150
• The CO2 is transported 80 kilometers (km) (50 miles) via pipeline to a geologic sequestration field for injection into a saline formation.
• The CO2 is transported and injected as a supercritical (SC) fluid in order to avoid two-phase flow and achieve maximum efficiency [22]. The pipeline is assumed to have an outlet pressure (above the SC pressure) of 8.3 MPa (1,200 psia) with no recompression along the way. Accordingly, CO2 flow in the pipeline was modeled to determine the pipe diameter that results in a pressure drop of 6.9 MPa (1,000 psi) over an 80 km (50 mile) pipeline length [23
• The saline formation is at a depth of 1,239 m (4,055 ft) and has a permeability of 22 millidarcy (md) (22 μm2) and formation pressure of 8.4 MPa (1,220 psig) [
]. (Although not explored in this study, the use of boost compressors and a smaller pipeline diameter could possibly reduce capital costs for sufficiently long pipelines.) The diameter of the injection pipe will be of sufficient size that frictional losses during injection are minimal and no booster compression is required at the well-head in order to achieve an appropriate down-hole pressure, with hydrostatic head making up the difference between the injection and reservoir pressure.
24
24
]. This is considered an average storage site and requires roughly one injection well for each 9,360 tonnes (10,320 tons) of CO2 injected per day [ ]. The assumed aquifer characteristics are tabulated in Exhibit 2-15.
The cost metrics utilized in this study provide a best estimate of TS&M costs for a “typical” sequestration project, and may vary significantly based on variables such as terrain to be crossed by the pipeline, reservoir characteristics, and number of land owners from which sub-surface rights must be acquired. Raw capital and operating costs are derived from detailed cost metrics found in the literature, escalated to June 2007-year dollars using appropriate price indices. These costs were then verified against values quoted by industrial sources where possible. Where regulatory uncertainty exists or costs are undefined, such as liability costs and the acquisition of underground pore volume, analogous existing policies were used for representative cost scenarios.

Cost and Performance Baseline for Coal-to-SNG and Ammonia (Volume 2)
45
Exhibit 2-15 Deep Saline Aquifer Specification
Parameter Units Base Case
Pressure MPa (psi) 8.4 (1,220)
Thickness m (ft) 161 (530)
Depth m (ft) 1,236 (4,055)
Permeability md (μm2) 22 (22)
Pipeline Distance Km (miles) 80 (50)
Injection Rate per Well Tonne (ton) CO2/day 9,360 (10,320)
The following subsections describe the sources and methodology used for each metric.
Cost Levelization and Conversion to First Year Costs Capital and operating costs were levelized over a 35-year period (30-year operational period plus 5-year capital expenditure period) and include both a 20 percent process contingency and 30 percent project contingency.
In several areas, such as Pore Volume Acquisition, Monitoring, and Liability, cost outlays occur over a longer time period, up to 100 years. In these cases a capital fund is established based on the net present value of the cost outlay, and this fund is then levelized similar to the other costs.
First year costs are calculated by dividing the levelized cost by the levelization factor. It is the first year cost that is used in this study.
Transport Costs CO2 transport costs are divided into three categories: pipeline costs, related capital expenditures, and O&M costs.
Pipeline costs are derived from data published in the Oil and Gas Journal’s (O&GJ) annual Pipeline Economics Report for existing natural gas, oil, and petroleum pipeline project costs from 1991 to 2003. These costs are expected to be analogous to the cost of building a CO2 pipeline, as noted in various studies [22,24,25
25
]. The University of California performed a regression analysis to generate cost curves from the O&GJ data for: (1) Pipeline Materials, (2) Direct Labor, (3) Indirect Costs, and (4) Right-of-way acquisition, with each represented as a function of pipeline length and diameter [ ]. These cost curves were escalated to the June 2007 year dollars used in this study.
Related capital expenditures were based on the findings of a previous study funded by NETL, Carbon Dioxide Sequestration in Saline Formations – Engineering and Economic Assessment [24]. This study utilized a similar basis for pipeline costs (O&GJ Pipeline cost data up to the year 2000), but added a CO2 surge tank and pipeline control system to the project.

Cost and Performance Baseline for Coal-to-SNG and Ammonia (Volume 2)
46
Transport O&M costs were assessed using metrics published in a second NETL sponsored report entitled Economic Evaluation of CO2 Storage and Sink Enhancement Options [22]. This study was chosen due to the reporting of O&M costs in terms of pipeline length, whereas the other studies mentioned above either (a) do not report operating costs, or (b) report them in absolute terms for one pipeline, as opposed to a length- or diameter-based metric.
Storage Costs Storage costs were divided into five categories: (1) Site Screening and Evaluation, (2) Injection Wells, (3) Injection Equipment, (4) O&M Costs, and (5) Pore Volume Acquisition. With the exception of Pore Volume Acquisition, all of the costs were obtained from Economic Evaluation of CO2 Storage and Sink Enhancement Options [22]. These costs include all of the costs associated with determining, developing, and maintaining a CO2 storage location, including site evaluation, well drilling, and the capital equipment required for distributing and injecting CO2.
Pore Volume Acquisition costs are the costs associated with acquiring rights to use the sub-surface volume where the CO2 will be stored, i.e. the pore space in the geologic formation. These costs were based on recent research by Carnegie Mellon University, which examined existing sub-surface rights acquisition as it pertains to natural gas storage [26
Liability Protection
]. The regulatory uncertainty in this area combined with unknowns regarding the number and type (private or government) of property owners, require a number of “best engineering judgment” decisions to be made. In this study it was assumed that long-term lease rights were acquired from the property owners in the projected CO2 plume growth region for a nominal fee, and that an annual “rent” was paid when the plume reached each individual acre of their property for a period of up to 100 years from the injection start date. The present value of the life cycle pore volume costs are assessed at a 10 percent discount rate and a capital fund is set up to pay for these costs over the 100 year rent scenario.
Liability Protection addresses the fact that if damages are caused by injection and long-term storage of CO2, the injecting party may bear financial liability. Several types of liability protection schemes have been suggested for CO2 storage, including Bonding, Insurance, and Federal Compensation Systems combined with either tort law (as with the Trans-Alaska Pipeline Fund), or with damage caps and preemption, as is used for nuclear energy under the Price Anderson Act [27]. However, at present, a specific liability regime has yet to be dictated either at a Federal or (to our knowledge) State level. However, certain state governments have enacted legislation, which assigns liability to the injecting party, either in perpetuity (Wyoming) or until ten years after the cessation of injection operations, pending reservoir integrity certification, at which time liability is turned over to the state (North Dakota and Louisiana) [28,29,30
Liability costs assume that a bond must be purchased before injection operations are permitted in order to establish the ability and good will of an injector to address damages where they are deemed liable. A figure of five million dollars was used for the bond based on the Louisiana fund level. This bond level may be conservatively high, in that the Louisiana fund covers both liability and monitoring, but that fund also pertains to a certified reservoir where injection
]. In the case of Louisiana, a trust fund totaling five million dollars is established over the first ten years (120 months) of injection operations for each injector. This fund is then used by the state for CO2 monitoring and, in the event of an at-fault incident, damage payments.

Cost and Performance Baseline for Coal-to-SNG and Ammonia (Volume 2)
47
operations have ceased, having a reduced risk compared to active operations. The bond cost was not escalated.
Monitoring Costs Monitoring costs were evaluated based on the methodology set forth in the IEA Greenhouse Gas (GHG) R&D Programme’s Overview of Monitoring Projects for Geologic Storage Projects report [31
2.8.4
]. In this scenario, operational monitoring of the CO2 plume occurs over thirty years (during plant operation) and closure monitoring occurs for the following fifty years (for a total of eighty years). Monitoring is via electromagnetic (EM) survey, gravity survey, and periodic seismic survey; EM and gravity surveys are ongoing while seismic survey occurs in years 1, 2, 5, 10, 15, 20, 25, and 30 during the operational period, then in years 40, 50, 60, 70, and 80 after injection ceases.
The global economic assumptions are listed in Finance Structure, Discounted Cash Flow Analysis, and First-Year Cost of SNG
Exhibit 2-16.
The finance structure was chosen based on the assumption of a high-risk fuels project. Exhibit 2-17 describes the finance structure that was assumed. This finance structure was based on information presented in a 2008 NETL report, "Recommended Project Finance Structures for the Economic Analysis of Fossil-Based Energy Projects”, based on interviews with project developers/owners, financial organizations and law firms.
Exhibit 2-16 Global Economic Assumptions
Parameter Value TAXES Income Tax Rate 38% (Effective 34% Federal, 6% State) Capital Depreciation 20 years, 150% declining balance Investment Tax Credit 0% Tax Holiday 0 years CONTRACTING AND FINANCING TERMS
Contracting Strategy Engineering Procurement Construction Management (owner assumes project risks for performance, schedule and cost)
Type of Debt Financing Non-Recourse (collateral that secures debt is limited to the real assets of the project)
Repayment Term of Debt 15 years Grace Period on Debt Repayment 0 years Debt Reserve Fund None ANALYSIS TIME PERIODS Capital Expenditure Period 5 Years Operational Period 30 years
Economic Analysis Period (used for IRROE) 35 Years (capital expenditure period plus operational period)

Cost and Performance Baseline for Coal-to-SNG and Ammonia (Volume 2)
48
Parameter Value TREATMENT OF CAPITAL COSTS Capital Cost Escalation During Capital Expenditure Period (nominal annual rate) 3.6%1
Distribution of Total Overnight Capital over the Capital Expenditure Period (before escalation)
10%, 30%, 25%, 20%, 15%
Working Capital zero for all parameters
% of Total Overnight Capital that is Depreciated 100% (this assumption introduces a very small error even if a substantial amount of TOC is actually non-depreciable)
ESCALATION OF OPERATING REVENUES AND COSTS
Escalation of COP (revenue), O&M Costs, and Fuel Costs (nominal annual rate) 3.0%2
Exhibit 2-17 Financial Structure for High Risk Fuels Projects
Type of Security
% of Total Current (Nominal) Dollar Cost
Weighted Current (Nominal) Cost
After Tax Weighted Cost of Capital
Debt 50 9.5% 4.75% Equity 50 20% 10% Total 100 N/A 14.75% 12.94%
The NETL Power Systems Financial Model (PSFM) is a nominal-dollar3
9 (current dollar)
discounted cash flow (DCF) analysis tool [ ]. As explained below, the PSFM was used to calculate first-year cost of production (FYCOP)4
.
• The FYCOP
1 A nominal average annual rate of 3.6% is assumed for escalation of capital costs during construction. This rate is equivalent to the nominal average annual escalation rate for process plant construction costs between 1947 and 2008 according to the Chemical Engineering Plant Cost Index.
is the revenue received by the generator per net unit of production (bbl, MMBtu, kg, etc.) during the plant’s first year of operation. To calculate the first-year COP, the PSFM was used to determine a “base-year” (2007) COP that, when escalated at
2 An average annual inflation rate of 3.0% is assumed. This rate is equivalent to the average annual escalation rate between 1947 and 2008 for the U.S. Department of Labor's Producer Price Index for Finished Goods, the so-called "headline" index of the various Producer Price Indices. (The Producer Price Index for the Electric Power Generation Industry may be more applicable, but that data does not provide a long-term historical perspective since it only dates back to December 2003.) 3 Since the analysis takes into account taxes and depreciation, a nominal dollar basis is preferred to properly reflect the interplay between depreciation and inflation. 4 For this calculation, “cost of product” is somewhat of a misnomer because from the production plant’s perspective it is actually the “price” received for the product generated. However, since the price paid to the plant for the product is ultimately charged to the end user, from the customer’s perspective it is part of the cost of product.

Cost and Performance Baseline for Coal-to-SNG and Ammonia (Volume 2)
49
an assumed nominal annual general inflation rate of 3 percent5
, provided the stipulated internal rate of return on equity over the entire economic analysis period (capital expenditure period plus thirty years of operation). Since this analysis assumes that COP increases over the economic analysis period at the nominal annual general inflation rate, it remains constant in real terms and the first-year COP is equivalent to the base-year COP when expressed in base-year (2007) dollars.
Since 2007 is the first year of the capital expenditure period it is also the base year for the economic analysis. Accordingly, all costs are expressed in base-year (June 2007) dollars except for TASC, which is expressed in mixed-year, current dollars.
All capital costs included in this analysis, including project development and construction costs, are assumed to be incurred during the capital expenditure period. The plants are assumed to have a capital expenditure period of five years. Since the plants begin expending capital in the base year (2007), this means that the analysis assumes that they begin operating in 2012. In addition to the capital expenditure period, the economic analysis considers thirty years of operation.
Estimating First-Year COE with Capital Charge Factors
For scenarios that adhere to the global economic assumptions listed in Exhibit 2-16 and utilize the finance structure listed in Exhibit 2-17, the following simplified equation can be used to estimate first-year COP as a function of TOC, fixed O&M, variable O&M (including fuel), capacity factor and net production. The equation requires the application of the capital charge factor (CCF) listed in Exhibit 2-18. This first year CCF is valid only for the global economic assumptions listed in Exhibit 2-16, the stated finance structure, and the stated capital expenditure period.
Exhibit 2-18 Economic Parameters for FYCOP Calculation
High Risk Fuels Financial Structure
First Year Capital Charge Factor 0.2449
All factors in the first-year COP equation are expressed in base-year dollars. The base year is the first year of capital expenditure, which for this study is assumed to be 2007. As shown in Exhibit 2-16, all factors (COP, O&M and fuel) are assumed to escalate at a nominal annual
5 This nominal escalation rate is equal to the average annual inflation rate between 1947 and 2008 for the U.S. Department of Labor’s Producer Price Index for Finished Goods. This index was used instead of the Producer Price Index for the Electric Power Generation Industry because the Electric Power Index only dates back to December 2003 and the Producer Price Index is considered the “headline” index for all of the various Producer Price Indices.

Cost and Performance Baseline for Coal-to-SNG and Ammonia (Volume 2)
50
general inflation rate of 3.0 percent. Accordingly, all first-year costs (COP and O&M) are equivalent to base-year costs when expressed in base-year (2007) dollars.
generatedproductofquantityannual
costsoperatingvariableyearfirst
costsoperatingfixed
yearfirst
chargecapitalyearfirst
COPYearFirst
++
=
(CF)(Qty))(CF)(OCOC(CCF)(TOC)
COPYearFirst VARFIX ++=
where:
First Year COP= current-dollar first-year cost of product expressed in base-year dollars per unit of product ($/bbl, $/kg, $/MMBtu, etc.))
CCF = capital charge factor taken from Exhibit 2-18 that matches the
applicable finance structure and capital expenditure period TOC = total overnight capital, expressed in base-year dollars OCFIX = the sum of all fixed annual operating costs, expressed in base-year
dollars OCVAR = the sum of all variable annual operating costs, including fuel at 100
percent capacity factor, expressed in base-year dollars CF = plant capacity factor, assumed to be constant over the operational
period
Qty = annual quantity of product generated at 100 percent capacity factor
2.8.5 Historically, the price of ammonia has been predominantly dependent on ammonia demand. However, recent volatility of natural gas prices has caused the price of ammonia to become increasingly dependent on the cost of natural gas. A report issued by the USDA found that the price correlation between natural gas and ammonia was weak at 0.17 to 0.07 prior to 2000, but became strong at 0.8 to 0.7 as natural gas prices rose after 2000 [
Ammonia Price
32
Exhibit 2-19
]. The same report states that from 2000 to 2006, rising natural gas prices resulted in a decrease of U.S. ammonia production by 44 percent while ammonia prices paid by farmers increased by 130 percent. shows historic prices of natural gas and ammonia [32]. This trend is expected to continue as natural gas prices are expected to rise. Exhibit 2-20 shows AEO 2009 price projections to 2030

Cost and Performance Baseline for Coal-to-SNG and Ammonia (Volume 2)
51
for residential, industrial and electric power natural gas users along with high and low economic growth scenarios shown as range bars [33].
Exhibit 2-19 Monthly U.S. Prices of Natural Gas and Ammonia
A cost correlation between the historic prices of U.S. industrial use natural gas ($/MMBtu) and the price of ammonia paid by U.S. farmers (dollars per ton [$/ton]) was developed to estimate the selling price of ammonia in the co-production facilities [33,34
Exhibit 2-21
]. The correlation was made to the ammonia price paid by U.S. farmers because 84 percent of global ammonia production is utilized by the fertilizer industry. illustrates ammonia end use [35
The selling price of ammonia serves as a basis to adequately compare if the synergies created from the co-production facility enhance or serve to detriment the FYCOP of SNG.
]. Non-fertilizer applications account for only 16 percent of worldwide ammonia. Direct application of ammonia for fertilization accounts for 3 percent of the total production.
Exhibit 2-22 shows the data trend for U.S. farmer ammonia prices and industrial natural gas prices. Because other secondary factors such as ammonia supply and demand and cost differences across regions influence the cost of ammonia, the trend is not entirely linear. However, as natural gas prices rise, so does the cost of ammonia.

Cost and Performance Baseline for Coal-to-SNG and Ammonia (Volume 2)
52
Exhibit 2-20 Price Projections for Natural Gas Consumers
Exhibit 2-21 Global Ammonia Utilization
0
2
4
6
8
10
12
14
16
1985 1990 1995 2000 2005 2010 2015 2020 2025 2030 2035
Nat
ural
Gas
Pri
ce (2
007$
/MM
Btu)
Year
Residential NG Price
Industrial NG Price
Electric Power NG Price

Cost and Performance Baseline for Coal-to-SNG and Ammonia (Volume 2)
53
Exhibit 2-22 U.S. Farmer Ammonia and Industrial Natural Gas Prices
The following correlation was derived from Exhibit 2-22:
This correlation was used to relate the first year price of ammonia to the first year cost of synthetic natural gas.
0
100
200
300
400
500
600
0 1 2 3 4 5 6 7 8 9 10
Am
mon
ia P
rice
s Pa
id b
y U
.S. F
arm
ers
(200
7$/t
on)
Cost of Industrial NG (2007$/MMBtu)
Farmer Price Correlation

Cost and Performance Baseline for Coal-to-SNG and Ammonia (Volume 2)
54
This page intentionally left blank

Cost and Performance Baseline for Coal-to-SNG and Ammonia (Volume 2)
55
3. Six SNG only and two SNG and ammonia co-production configurations were evaluated and the major process area descriptions are presented in this section. Each design is based on a market-ready technology that is assumed to be commercially available to support startup in the near term.
SNG AND SNG AND AMMONIA CO-PRODUCTION FACILITIES
All eight cases are based on the Siemens gasifier using either bituminous, PRB, or lignite coal, with and without carbon sequestration. As discussed in Section 2, the thermal input for the six SNG only cases varies by coal type based on vendor input [18]. The output of SNG for the co-production cases is reduced because a portion of the syngas is used to produce 2,000 tonnes/day (2,204 tons/day) of ammonia.
The evaluation scope included developing heat and mass balances and estimating plant performance. Equipment lists were developed for each design to support plant capital and operating cost estimates. The evaluation basis details, including site ambient conditions, fuel composition and environmental targets, were provided in Section 2. Section 3.1 covers general information for the major process areas of the SNG only and co-production plants.
3.1 MAJOR PROCESS AREAS All eight cases have process areas, which are common to each plant configuration such as coal receiving and storage, coal drying, oxygen supply, gas cleanup, power generation, etc. As detailed descriptions of these process areas for each case would be burdensome and repetitious, they are presented in this section for general background information, where information is present that is specific to a particular case or set of cases it is explicitly stated.
3.1.1 The function of the Coal Receiving and Storage system is to provide the equipment required for unloading, conveying, preparing, and storing the fuel delivered to the plant. The scope of the system is from the coal conveyor receiving hoppers up to the slide gate valves at the outlet of the coal storage silos.
Coal Receiving and Storage
Operation Description – The lignite plants are located at the minemouth and coal is delivered to the plant from the mine by conveyor to the plant storage and reclaim piles. Coal is delivered to the Illinois No. 6 and PRB plants by 100-car unit trains comprised of 91 tonne (100 ton) rail cars. The unloading is done by a trestle bottom dumper, which unloads the coal into two receiving hoppers.
Coal from the reclaim pile is fed directly into a vibratory feeder. The 8 centimenter (cm) x 0 (3" x 0) coal from the feeder is discharged onto a belt conveyor. Two conveyors with an intermediate transfer tower are assumed to convey the coal to the coal stacker, which transfer the coal to either the long-term storage pile or to the reclaim area. The conveyor passes under a magnetic plate separator to remove tramp iron and then to the reclaim pile.
The reclaimer loads the coal into two vibratory feeders located in the reclaim hopper under the pile. The feeders transfer the coal onto a belt conveyor that transfers the coal to the coal surge bin located in the crusher tower. The coal is reduced in size to 3 cm x 0 (1¼" x 0) by the crusher. A conveyor then transfers the coal to a transfer tower. In the transfer tower the coal is routed to the tripper, which loads the coal into one of three silos. Two sampling systems are

Cost and Performance Baseline for Coal-to-SNG and Ammonia (Volume 2)
56
supplied: the as-received sampling system and the as-fired sampling system. Data from the analyses are used to support the reliable and efficient operation of the plant.
3.1.2 Reduction in coal moisture content improves the efficiency of dry-feed gasifiers, but there is in addition a materials handling requirement. It is necessary to reduce most, if not all, of the surface moisture for coal transport properties to be acceptable. Coal moisture consists of two components, surface moisture and inherent moisture. Low rank coals have higher inherent moisture content and total moisture content than bituminous and other high rank coals and two different drying schemes are used due to this difference. After drying the coal is drawn from the surge hoppers and fed through a pressurization lock hopper system to a dense phase pneumatic conveyor, which uses CO2 from the Selexol unit that is further pressurized and used to convey the coal to the gasifiers.
Coal Drying
The coal is simultaneously crushed and dried in the coal mill then delivered to a surge hopper with an approximate 2-hour capacity. The drying medium is provided by combining off-gas from the Claus plant tail gas treatment unit (TGTU) and a slipstream of clean syngas and passing them through an incinerator. The incinerator flue gas, with an oxygen content of 6 volume percent (vol%), is then used to dry the coal in the mill. The removed moisture is vented to atmosphere through the plant stack along with the incinerator flue gas. The bituminous coal in this study is dried to 6 percent from 11.12 percent [
Bituminous Coal
18].
No specific coal drying technique is recommended by Siemens either in publications or their response to modeling questions. Therefore, the WTA drying process was chosen primarily based on a previous analysis done for the Shell gasification system that is equally applicable to a Siemens gasification system. In a recent GTC paper, Shell examined the WTA process for drying low rank coals and considered two cases [
Low Rank Coals
36
1) Case 1: Lignite coal dried from 53 to 12 percent
]:
2) Case 2: Subbituminous coal dried from 30 to 6 percent
For the Siemens gasification cases it is assumed that the subbituminous coal is dried to 6 percent moisture and the lignite to 12 percent moisture [18]. Coal drying options that were evaluated prior to selecting the WTA process included:
• Option 1: Use conventional IGCC coal drying methods, which consist of deriving heat from the combustion of natural gas and/or syngas and using the flue gas either directly or indirectly, by heating a nitrogen stream, for use in drying the coal. Some examples include the following:
o At the Buggenum facility bituminous coal is ground in a conventional roller mill and simultaneously dried using a heated inert recycle gas stream that carries the evaporated water from the system as it sweeps the PC through an internal, rotating classifier. The inert gas generator is fueled by the in-line combustion of treated syngas. Excess gas is vented on pressure control [37].

Cost and Performance Baseline for Coal-to-SNG and Ammonia (Volume 2)
57
o At the Puertollano facility, coal is ground in mills using nitrogen for drying from 10 percent to less than 2 percent moisture. The drying circuit is heated to about 250°C (482°F) by intermediate-pressure (IP)-steam and additional burning of natural gas. The report notes that a dual drying circuit using only natural gas and the produced syngas could be studied [38
• Option 2: Dry the coal using a scheme similar to the Great River Energy (GRE) Clean Coal Power Initiative (CCPI) project approach. In the case of gasification where the drying requirements are greater than in PC plants, higher grade heat than is available from the cooling water exiting the condenser will be required. However, there are many sources of low-level waste heat in a gasification-to-fuels plant and integration of this heat into the drying circuit is possible. Because of the tendency for low rank coals to spontaneously combust after the moisture is removed, it may be necessary to fluidize the coal bed with something other than air. Depending on the source of the fluidization gas, the process could become cost prohibitive.
].
• Option 3: Use the WTA process (German acronym for “fluidized bed dryer with integrated waste heat recovery” [39]) proposed by RWE, which consists of a fluid bed dryer utilizing a heat pump-type cycle with recovered coal moisture used for fluidizing the coal bed and used as the working fluid [40
• Option 4: Use a process similar to the Integrated Drying and Gasification Combined Cycle (IDGCC) being developed in Australia.
].
Conventional coal drying methods would be suitable for the low rank coals used in this study, but there is an efficiency penalty involved with burning either syngas or natural gas as a heat source and there are additional CO2 emissions generated by the process. Using steam as the heat source also impacts the production of electricity.
The GRE process has potential because of the many sources of low-grade heat in the gasification process. However, the fluidization gas source would have to be identified assuming ambient air cannot be used because of the combustion tendencies of dried, low rank coals.
The RWE process has the advantage of using steam and coal moisture as the fluidizing medium thus eliminating the spontaneous combustion concerns. However, the vapor compressor imposes a significant auxiliary load.
The IDGCC process is being commercialized by HRL Ltd. (Australia) and Harbin Power (China). They recently announced plans for a 400 MW demonstration plant in Australia [41]. The process utilizes hot syngas from an air blown fluidized bed gasifier (FBG) to dry brown coal prior to entering the gasifier. Sulfur is captured in the fluid bed and particulates are removed in a downstream candle filter. The warm, humidified syngas is then burned in a combustion turbine (GT) [42
The technology is being developed for an air-blown FBG and has features that make it less attractive in the case of an entrained-flow, oxygen-blown gasifier like the Siemens process. The coal is crushed to 10 mm top size and pressurized to 2.5 MPa (363 psi) through a lock hopper system. The FBG can accept 10 mm coal, and at that size and high moisture content the coal will still flow through the lock hoppers. However, in the case of the Siemens gasifier, the coal top size is significantly smaller (Siemens states that conventional coal pulverizers are used,
].

Cost and Performance Baseline for Coal-to-SNG and Ammonia (Volume 2)
58
which likely results in an average coal size of ≤ 500 μm for bituminous coal) and the coal must be dried prior to pressurizing to avoid lock hopper flow problems.
The WTA coal drying system was ultimately chosen for this evaluation largely because of its ability to recover the water from the coal in liquid state for use in the process (recycled to the cooling tower) and the fact that syngas is not used to provide heat for drying. In conventional dryers, the water is mixed with the heating gas and discharged to atmosphere as vapor. Recovery of the coal moisture in a liquid state results in a sizable auxiliary load.
The ‘closed’ WTA process has been demonstrated at pilot scale. Plans for a commercial demonstration of an ‘open’ version of the process have been delayed. In spite of the uncertainty of the commercial demonstration, the potential benefit of the technology was viewed to be significant enough to use the ‘closed version’ of the process in this study. A process schematic is shown in Exhibit 3-1 [43
Exhibit 3-1 WTA Process Schematic
].
3.1.3 In order to economically and efficiently support gasification projects, air separation equipment has been modified and improved in response to production requirements and the consistent need to increase single train output. “Elevated pressure” air separation designs have been implemented that result in distillation column operating pressures that are about twice as high as traditional plants. In this study, the main air compressor discharge pressure was set at 1.3 MPa
Air Separation Unit Choice

Cost and Performance Baseline for Coal-to-SNG and Ammonia (Volume 2)
59
(190 psia) compared to a traditional ASU plant operating pressure of about 0.7 MPa (105 psia) [44
Elevated Pressure ASU Experience in Gasification
]. For gasification applications the elevated pressure ASU process minimizes power consumption and decreases the size of some of the equipment items.
The Buggenum, Netherlands unit built for Demkolec was the first elevated-pressure, fully integrated ASU to be constructed. It was designed to produce up to 1,796 tonnes/day (1,980 tons per day [TPD]) of 95 percent purity oxygen for a Shell coal-based gasification unit that fuels a Siemens V94.2 GT. In normal operation at the Buggenum plant the ASU receives all of its air supply from and sends all residual nitrogen to the GT.
The Polk County, Florida ASU for the Tampa Electric IGCC is also an elevated-pressure, 95 percent purity oxygen design that provides 1,832 tonnes/day (2,020 TPD) of oxygen to a GEE coal-based gasification unit, which fuels a General Electric 7FA GT. All of the nitrogen produced in the ASU is used in the GT. The original design did not allow for air extraction from the combustion turbine (CT). After a CT air compressor failure in January, 2005, a modification was made to allow air extraction, which in turn eliminated a bottleneck in ASU capacity and increased overall power output [45
Air Separation Plant Process Description
].
The air separation plant is designed to produce 99 mole percent (mol%) oxygen (O2) for use in the gasifier [46
Exhibit 3-2
]. Conventional IGCC plants typically use oxygen purities of 95 mol%. However, the SNG product specification requires higher purity oxygen be used in the gasifier. The plant is designed with four production trains. The air compressor is powered by an electric motor. Nitrogen is also recovered, compressed, and used in the PSA process and the ammonia synthesis loop in the co-production cases only. An additional nitrogen compressor is required in the co-production cases to deliver the nitrogen to the ammonia process at a pressure of 13.6 MPa (1,975 psia). In the SNG only cases, most of the nitrogen is vented to the atmosphere without compression. A process schematic of a typical ASU is shown in .
The air is supplied from a stand-alone compressor. Air to the stand-alone compressor is first filtered in a suction filter upstream of the compressor. This air filter removes particulate, which may tend to cause compressor wheel erosion and foul intercoolers. The filtered air is then compressed in the centrifugal compressor, with intercooling between each stage. The power requirement of the stand-alone compressor is affected by elevation. This effect is accounted for in the plant performance.
Air from the stand-alone compressor is cooled and fed to an adsorbent-based pre-purifier system. The adsorbent removes water, CO2, butane + higher paraffins (C4+), and saturated hydrocarbons from the air. After passing through the adsorption beds, the air is filtered with a dust filter to remove any adsorbent fines that may be present. Downstream of the dust filter a small stream of air is withdrawn to supply the instrument air requirements of the ASU.
Regeneration of the adsorbent in the pre-purifiers is accomplished by passing a hot nitrogen stream through the off-stream bed(s) in a direction countercurrent to the normal airflow. The nitrogen is heated against extraction steam (1.7 MPa [250 psia]) in a shell and tube heat exchanger. The regeneration nitrogen drives off the adsorbed contaminants. Following regeneration, the heated bed is cooled to near normal operating temperature by passing a cool

Cost and Performance Baseline for Coal-to-SNG and Ammonia (Volume 2)
60
nitrogen stream through the adsorbent beds. The bed is re-pressurized with air and placed on stream so that the current on-stream bed(s) can be regenerated.
The air from the pre-purifier is then split into three streams. About 70 percent of the air is fed directly to the cold box. About 25 percent of the air is compressed in an air booster compressor. This boosted air is then cooled in an aftercooler against cooling water in the first stage and against chilled water in the second stage before it is fed to the cold box. The chiller utilizes low-pressure (LP) process steam at 0.45 MPa (65 psia). The remaining 5 percent of the air is fed to a turbine-driven, single-stage, centrifugal booster compressor. This stream is cooled in a shell and tube aftercooler against cooling water before it is fed to the cold box.
All three air feeds are cooled in the cold box to cryogenic temperatures against returning product oxygen and nitrogen streams in plate-and-fin heat exchangers. The large air stream is fed directly to the first distillation column to begin the separation process. The second largest air stream is liquefied against boiling liquid oxygen before it is fed to the distillation columns. The third, smallest air stream is fed to the cryogenic expander to produce refrigeration to sustain the cryogenic separation process.
Inside the cold box the air is separated into oxygen and nitrogen products. The oxygen product is withdrawn from the distillation columns as a liquid and is pressurized by a cryogenic pump. The pressurized liquid oxygen is then vaporized against the high-pressure (HP) air feed before being warmed to ambient temperature. The gaseous oxygen exits the cold box and is fed to the centrifugal compressor with intercooling between each stage of compression. The compressed oxygen is then fed to the gasification unit. Nitrogen is produced from the cold box at two pressure levels and is compressed to fulfill the needs of the PSA systems and the ammonia synthesis loop in the co-production cases only. In the SNG only cases, the nitrogen is vented to the atmosphere.

Cost and Performance Baseline for Coal-to-SNG and Ammonia (Volume 2)
61
Exhibit 3-2 Typical ASU Process Schematic
Cryogenic Air Separation Unit
Single Train
Oxygen Compressor
HP Oxygen
Nitrogen Compressor
HP Nitrogen
RegenHeater
Condensate
Steam
RegenerationNitrogen
Prepurifiers
Two StageDCA
Booster AirCompressor
AirMain Air
CompressorAir FilterCWR
CWS
Chiller CWS
CWR
SteamCond
Regen. N2Blower
Liq. OxygenPump
TurbineTurbine AirBooster
3.1.4 The Siemens gasifier was chosen for this study to allow the use of a single gasifier across all coal types and the vendor was cooperative in providing process information for this and other studies that could be applied to this study. The configuration of processing equipment downstream of the gasifier, such as syngas cooling and degree of quench, may vary with coal type and may not be representative of the latest commercial technology offering.
Gasifier
Development and Current Status – The Siemens Fuel Gasification (SFG) process is based on the Noell process, also known under the name GSP, developed by Deutsches Brennstoffinstitut Freiberg in 1975 for the gasification of domestic brown coal and other solid fuels. The Noell Group acquired the technology in 1991 and did further development to gasify waste materials and liquid residues. The gasifier was marketed under the Future Energy GmbH Company and was sold to Siemens in 2006. The first gasifier of this type was a 200 MW thermal input unit built at Schwarze Pumpe, Germany in 1984, firing high sodium lignite. It was converted to gasify natural gas and waste liquids in 1991. Other installations include a 5 MW test plant in Freiberg, Germany where alternative feed testing is ongoing and a 130 MW autothermal oil conversion plant in the Czech Republic, commissioned in 2008. Current gasifier projects include the JinCheng 1000 MW Chinese anthracite coal-to-ammonia plant (under development)[18], the Ningxia Coal Based Polypropylene Project with capacity of 2500 MW of coal to polypropylene production (scheduled for startup in April/May 2010), and the Secure Energy Decatur Coal-to-

Cost and Performance Baseline for Coal-to-SNG and Ammonia (Volume 2)
62
SNG project. Scale-up risks should be minimized with start-up of the Ningxia project, although a process contingency is still included in the cost estimates for this project.
The Siemens gasifier, which is a single-stage, entrained-flow, dry-feed gasifier, is modeled as an equilibrium reactor. Many literature references support this modeling strategy [39,47
Gasifier Capacity – The largest current commercial offering from Siemens is a nominal 500 MW thermal input gasifier, with two trains used in the JinCheng project, five trains for the Ningxia project and two trains used in the Secure Energy project. For this study, all cases use six gasifiers. Actual thermal input to each gasifier is coal-type dependent and was based on input from Siemens. The thermal input ranges from 549 MW for bituminous coal to 506 MW for lignite coal with PRB intermediate at 527 MW [
]. Steam injection is based on published data for other single-stage, entrained-flow, dry-feed gasifiers, and the oxygen injection is controlled to maintain estimated heat losses for the gasifier. It is assumed that the gasifier cooling screen that insulates the reactor walls generates LP steam.
18].
Distinguishing Characteristics – The key advantage of the Siemens coal gasification technology is its high carbon conversion with a variety of coals and reliability. Similar to other dry feed systems, the Siemens gasifier allows for minimal diluent to be used to inject the feedstock into the gasifier, which has undergone long term testing to characterize a wide range of fuels. The cooling screen is used to control the gasifier shell temperature and creates a solid and liquid slag lining along the gasifier walls instead of a refractory lining, which improves availability, startup and turndown time, and reduces the concerns surrounding coal, and specifically, ash properties. The raw syngas is tar free due to the high gasification temperatures, which improves the downstream gas cleanup. The water quench simplifies the high temperature syngas cooling, improving reliability, resulting in syngas with a high water content, which contributes to the water gas shift (WGS) reaction, benefitting CO2 capture and chemical synthesis applications where hydrogen (H2) and CO2 is preferable to carbon monoxide (CO) production.
The main disadvantage to this, and all dry feed systems, is the need to dry the coal for transport and injection into the gasifier. Water content is generally inversely proportional to coal rank, so, while this gasifier can handle a wide range of fuels, the coal processing and drying can impact performance with different rank coals.
Important Coal Characteristics – The Siemens gasifier is generally able to fire any type of coal, petcoke, and mixed feeds.
3.1.5 Selection of Technology - In all cases, the gasifier product must be converted to satisfy the requirements for the SNG methanation process and/or the ammonia synthesis loop. The methanation process requires a 3:1 H2 to CO ratio, while the ammonia synthesis loop requires that the maximum amount of hydrogen is produced that is technically and economically feasible.
Water Gas Shift Reactors
The concept is to convert the syngas carbon monoxide to hydrogen and CO2 by reacting the CO with water over a bed of catalyst.
Water Gas Shift: CO + H2O ↔ CO2 + H2

Cost and Performance Baseline for Coal-to-SNG and Ammonia (Volume 2)
63
The CO shift converter can be located either upstream of the acid gas removal (AGR) step (SGS [sour gas shift]) or immediately downstream (sweet gas shift). If the CO converter is located downstream of the AGR, then the metallurgy of the unit is less stringent, but additional equipment must be added to the process. Products from the gasifier are quenched with water and contain a portion of the water vapor necessary to meet the water-to-gas criteria at the reactor inlet. If the CO converter is located downstream of the AGR, then the gasifier product would first have to be cooled and the free water separated and treated. Then additional steam would have to be generated and re-injected into the CO converter feed to meet the required water-to-gas ratio. If the CO converter is located upstream of the AGR step, no additional equipment is required. This is because the CO converter promotes carbonyl sulfide (COS) hydrolysis without a separate catalyst bed. Therefore, for this study the CO converter was located upstream of the AGR unit and is referred to as SGS.
Process Description – The two methods to control the amount of shift achieved are the H2O:CO molar ratio and/or the amount of bypass around the shift reactor.
The individual process descriptions for the SNG and co-production portions of the SGS reactors, including steam requirements and bypass ratios, are presented in Sections 4.1 through 5.2.
3.1.6 A gasification facility has the potential of removing mercury in a more simple and cost-effective manner than conventional PC plants. This is because mercury can be removed from the syngas at elevated pressure and prior to product synthesis so that syngas volumes are much smaller than flue gas volumes in comparable PC cases. A conceptual design for a carbon bed adsorption system was developed for mercury control in the gasification plants being studied. Data on the performance of carbon bed systems were obtained from the Eastman Chemical Company, which uses carbon beds at its syngas facility in Kingsport, Tennessee [
Mercury Removal
15]. The coal mercury content (0.15 ppm dry for Illinois No. 6, 0.081 ppm dry for PRB, and 0.116 ppm dry for lignite) and carbon bed removal efficiency (95 percent) were discussed previously in Section 2.5. Gasification-specific design considerations are discussed below.
Carbon Bed Location – The packed carbon bed vessels are located upstream of the AGR process and syngas enters at a temperature near 38°C (100°F). Consideration was given to locating the beds further upstream before the COS hydrolysis/SGS unit at a temperature near 204°C (400°F). However, while the mercury removal efficiency of carbon has been found to be relatively insensitive to pressure variations, temperature adversely affects the removal efficiency [48
15]. Eastman Chemical also operates their beds ahead of their sulfur recovery unit (SRU) at a
temperature of 30°C (86°F) [ ].
Consideration was also given to locating the beds downstream of the AGR. However, it was felt that removing the mercury and other contaminants before the AGR unit would enhance the performance of both the AGR and SRU and increase the life of the various solvents.
Process Parameters – An empty vessel basis gas residence time of approximately 20 seconds was used based on Eastman Chemical’s experience [15]. Allowable gas velocities are limited by considerations of particle entrainment, bed agitation, and pressure drop. One-foot-per-second superficial velocity is in the middle of the range normally encountered [48] and was selected for this application.

Cost and Performance Baseline for Coal-to-SNG and Ammonia (Volume 2)
64
The bed density of 30 lb/ft3 was based on the Calgon Carbon Corporation HGR-P sulfur-impregnated pelletized activated carbon [49
Carbon Replacement Time – Eastman Chemicals replaces its bed every 18 to 24 months [
]. These parameters determined the size of the vessels and the amount of carbon required. Each gasifier train has one mercury removal bed and there are three gasifier trains in each case, resulting in three carbon beds per case.
15]. However, bed replacement is not because of mercury loading, but for other reasons including:
• A buildup in pressure drop
• A buildup of water in the bed
• A buildup of other contaminants For this study a 24 month carbon replacement cycle was assumed. Under these assumptions, the mercury loading in the bed would build up to 0.64 weight percent (wt%). Mercury capacity of sulfur-impregnated carbon can be as high as 20 wt% [50
3.1.7
]. The mercury laden carbon is considered to be a hazardous waste, and the disposal cost estimate reflects this categorization.
Gasification of coal to generate a chemical product produces a syngas that must be treated prior to further utilization. A portion of the treatment consists of AGR and sulfur recovery. To protect the methanation catalyst, the sulfur content of the syngas must be reduced to below 1 ppm to achieve reasonable catalyst life [
Acid Gas Removal (AGR) Process Selection
51,52]. This includes all sulfur species, but in particular the total of COS and hydrogen sulfide (H2S). A two-stage Selexol Process is capable of cleaning the syngas to these low sulfur levels [53
COS Hydrolysis
].
The use of COS hydrolysis pretreatment in the feed to the AGR process provides a means to reduce the COS concentration. The WGS catalyst also serves to hydrolyze COS, so only the portion of the syngas bypassing the shift reactors must pass through a COS reactor. In the low rank coal cases the syngas sulfur content and WGS bypass fraction are low enough to eliminate the need for a COS reactor in the bypass stream.
This method was first commercially proven at the Buggenum plant, and was also used at both the Tampa Electric and Wabash River IGCC projects. Several catalyst manufacturers including Haldor Topsoe and Porocel offer a catalyst that promotes the COS hydrolysis reaction. The COS hydrolysis reactor designs are based on information from Porocel. The SGS reactors also reduce COS to H2S as discussed in Section 3.1.5.
The COS hydrolysis reaction is equimolar with a slightly exothermic heat of reaction. The reaction is represented as follows:
COS + H2O ↔ CO2 + H2S
Since the reaction is exothermic, higher conversion is achieved at lower temperatures. However, at lower temperatures, the reaction kinetics are slower. Since the exit gas COS concentration is critical to the amount of H2S that must be removed with the AGR process, a retention time of 50-75 seconds was used to achieve 99.5 percent conversion of the COS. The Porocel activated alumina-based catalyst, designated as Hydrocel 640 catalyst, promotes the COS hydrolysis reaction without promoting reaction of H2S and CO to form COS and H2.

Cost and Performance Baseline for Coal-to-SNG and Ammonia (Volume 2)
65
Although the reaction is exothermic, the heat of reaction is dissipated among the large amount of non-reacting components. Therefore, the reaction is essentially isothermal. The product gas, now containing less than 4 parts per million volume (ppmv) of COS, is cooled prior to entering the mercury removal process and the AGR.
Acid Gas Removal All cases in this study require the removal of hydrogen sulfide and carbon dioxide from the syngas stream. Since the two-stage Selexol process has demonstrated the ability to achieve the low sulfur levels required, and it is also an effective process to remove CO2, it was used for all cases in this study. The Rectisol process would be equally effective in this application, but at greater capital and operating costs. A brief process description follows.
Untreated syngas enters the first of two absorbers where H2S is preferentially removed using loaded solvent from the CO2 absorber. The gas exiting the H2S absorber passes through the second absorber where CO2 is removed using first flash regenerated, chilled solvent followed by thermally regenerated solvent added near the top of the column. The treated gas exits the absorber and is sent either to the methanation reactors for SNG production or to the ammonia synthesis loop.
The amount of hydrogen remaining in the syngas stream is dependent on the Selexol process design conditions. In this study, hydrogen recovery is 99.4 percent. The minimal hydrogen slip to the carbon sequestration stream maximizes the overall plant efficiency. The Selexol plant cost estimates are based on a plant designed to recover this high percentage of hydrogen. The balance of the hydrogen is either co-sequestered with the CO2, destroyed in the Claus plant burner, or recycled to the gasifier.
The CO2 loaded solvent exits the CO2 absorber and a portion is sent to the H2S absorber, a portion is sent to a reabsorber and the remainder is sent to a series of flash drums for regeneration. The CO2 product stream is obtained from the three flash drums, and after flash regeneration the solvent is chilled and returned to the CO2 absorber.
The rich solvent exiting the H2S absorber is combined with the rich solvent from the reabsorber and the combined stream is heated using the lean solvent from the stripper. The hot, rich solvent enters the H2S concentrator and partially flashes. The remaining liquid contacts nitrogen from the ASU and a portion of the CO2 along with lesser amounts of H2S and COS are stripped from the rich solvent. The stripped gases from the H2S concentrator are sent to the reabsorber where the H2S and COS that were co-stripped in the concentrator are transferred to a stream of loaded solvent from the CO2 absorber. The clean gas from the reabsorber is combined with the clean gas from the H2S absorber and sent to SNG and/or NH3 production.
The solvent exiting the H2S concentrator is sent to the stripper where the absorbed gases are liberated by hot gases flowing up the column from the steam heated reboiler. Water in the overhead vapor from the stripper is condensed and returned as reflux to the stripper or exported as necessary to maintain the proper water content of the lean solvent. The acid gas from the stripper is sent to the Claus plant for further processing. The lean solvent exiting the stripper is first cooled by providing heat to the rich solvent, then further cooled by exchange with the product gas and finally chilled in the lean chiller before returning to the top of the CO2 absorber.

Cost and Performance Baseline for Coal-to-SNG and Ammonia (Volume 2)
66
3.1.8 Methanation is the hydrogenation of carbon monoxide to methane, typically performed over a nickel-based catalyst. There are two highly exothermic reactions:
Methanation, Synthetic Natural Gas Purification and Compression
CO + 3H2 ↔ CH4 + H2O (ΔH0298 = -206 kJ/mol)
CO2 + 4H2 ↔ CH4 + 2H2O (ΔH0298 = -165 kJ/mol)
Due to the highly exothermic nature of the reactions, temperature control and high temperature tolerant catalysts must be implemented.
The methanation system used in this study is based on the high temperature TREMP™ Process by Haldor Topsoe [54
Exhibit 3-3
]. The TREMP™ process was chosen primarily because it operates at high-temperature and because of the availability of process data in the public domain. A general schematic of the methanation process in this study is shown in . The process uses two different catalysts to account for the adiabatic temperature rise. The high temperature catalyst used in the first and second reactor can operate a range of 300°C (572°F) to 700°C (1290°F) and the low temperature catalyst in the “clean up” reactor can operate at inlet temperatures as low as 200°C (392°F). The process has the ability to make superheated steam at two pressure levels: 12.41 MPa/566°C (1,800 psia/1,050°F) and 4.14 MPa/288°C (600 psia/550°F). The HP steam is used to drive a subcritical turbine, and the medium pressure steam is used for process requirements like shift steam in the WGS reactors.
Exhibit 3-3 Haldor Topsoe TREMP™ High Temperature Methanation Process
High TemperatureReactor
High TemperatureReactor
Low Temperature“Clean Up” Reactor
Super-heater
Knock-out
DrumHP
BoilerHP
BoilerHP
BoilerBFW
Heater
RecycleCompressor
Synthetic Natural Gasto Purification and Compression
Condensate
Syngas fromSelexol Unit
The syngas from the Selexol Unit, with a H2 to CO ratio of approximately 3:1, is combined with a recycle stream and fed to the first high temperature reactor after being preheated to the minimum catalyst temperature. The reactor temperature for the first high temperature reactor is maintained below the catalyst threshold by varying the amount of recycle mixed with the syngas. After the second high temperature reactor, the syngas is fed to a low temperature “clean up” reactor that reduces the hydrogen content of the SNG product to 0.5 to 1 vol%.
After the methanation reactors the process condensate is removed from the product stream and the SNG product is then passed through a molecular sieve where it removes nearly all of the remaining water and 98.5 vol% of the CO2, which is vented through the plant stack [55]. The

Cost and Performance Baseline for Coal-to-SNG and Ammonia (Volume 2)
67
SNG product is further compressed to 6.21 MPa (900 psia) to meet pipeline pressure specifications [56
3.1.9
].
The PSA unit is used to purify the syngas from the NH3-production Selexol unit and the purge gas from the ammonia synthesis loop. The operation of a PSA unit for ammonia production based on syngas derived from gasification has been demonstrated at the Coffeyville Resources Fertilizer Complex albeit at a smaller scale.
Pressure Swing Adsorber (Co-Production Cases Only)
The PSA unit produces 98.8 vol% hydrogen with a recovery efficiency of 94 vol%. Typical recovery efficiencies are from 88 to 90 vol%. The use of nitrogen as the purging medium in the desorption cycle enables the high recovery efficiency used in this study [57
The PSA process is accomplished in a series of five steps. The gas is fed to the unit at HP, where impurities are adsorbed and the hydrogen product is produced. When the first adsorber is at capacity, it is taken off-line and the syngas is feed to another adsorber. Hydrogen remains trapped in the adsorbent space. To recover this hydrogen, the adsorber is co-currently depressurized from the product side, and the hydrogen is withdrawn. Nitrogen is used to repressurize and purge other adsorbers. After the hydrogen recovery is complete, the impurities have migrated to the top of the adsorbent bed, filling the bed to capacity. The bed is partly regenerated by depressurization towards the feed end, and the impurities are rejected to the PSA off-gas. The adsorbent is purged with more nitrogen at constant off-gas pressure to further regenerate the bed. The adsorber is repressurized with hydrogen from the co-current depressurization and with a slipstream from the hydrogen product prior to the introduction of the feed gas [
].
14].
3.1.10 Ammonia synthesis occurs through the hydrogenation of nitrogen over an iron based catalyst. The hydrogen is derived from the shifted syngas purified by a two-stage Selexol unit and the PSA unit. The nitrogen is produced from the ASU. Co-production cases include the cost and performance adjustments for nitrogen compression.
Ammonia Synthesis (Co-Production Cases Only)
N2 + 3H2 ↔ 2NH3 (ΔH0298 = -46 kJ/mol)
The synthesis of ammonia typically takes place at pressure in the range of 10.00 to 24.99 MPa (1,450 to 3,625 psia) at a temperature of 343°C to 550°C (650 to 1,022°F) [58
Exhibit 3-4
]. For this study the gas enters the reactor at 14.00 MPa (2,030 psia) and 343°C (650°F). The configuration modeled in this study is based on the Haldor Topsoe S-300 Ammonia Synthesis Loop and is shown in . The path of the feed gas through the system is shown in red.

Cost and Performance Baseline for Coal-to-SNG and Ammonia (Volume 2)
68
Exhibit 3-4 Ammonia Synthesis Loop Configuration
RecycleCompressor
Liquid NH3Cooler
Liquid NH3Cooler
HPBoiler
FinalReheater
Recycle LoopHeater
Recycle LoopHeater
Super-heater
Radial BedReactor
Purge Gasto PSA System
Make-upCompressor
H2/N2Feed Gas
AmmoniaProduct
The makeup gas from the PSA system is introduced into the synthesis loop before the separation of the ammonia product. Each reactor pass converts only 20 to 30 percent due to the unfavorable equilibrium conditions. Due to the exothermic nature of the reaction, superheated steam at 12.51 MPa (1,815 psia) and HP steam at 4.14 MPa (600 psia) can be generated in the synthesis loop. The ammonia is separated/condensed by a refrigeration system.
Purge gas is removed from the system to reduce the concentration of catalyst poisons and inerts such as argon and methane. Permanent poisons are sulfur containing compounds. Temporary catalyst poisons can cause deactivation during the time of exposure. Typical poisons are oxygen containing compounds, such as carbon oxides, water, and oxygen. Catalyst poisoning is a function of the total concentration of oxygen equivalents (O eqv) [59
ppm O eqv = 2 x (ppm O2) + 2 x (ppm CO2) + ppm CO + ppm H2O
].
Less than 2 ppm O eqv is considered ideal and at higher concentrations the catalyst will begin to show a loss of activity. Cases 3 and 4 achieve below 1 total ppm O equivalent.
3.1.11 The sulfur removal requirements for the methanation and ammonia processes are at the extreme limit of Selexol’s capabilities. To protect against system upsets or fluctuations in coal sulfur content, a zinc oxide guard bed was included in each case to remove trace sulfur contaminants.
Zinc Oxide Guard Bed
A zinc oxide bed can absorb over 99.99 percent of the inlet H2S and can absorb a maximum of 39.3 pounds of sulfur per pound of pure zinc oxide (ZnO). In this study it was assumed that the bed would reach 70 percent of saturation at breakthrough.

Cost and Performance Baseline for Coal-to-SNG and Ammonia (Volume 2)
69
3.1.12 Currently, most of the world’s sulfur is produced from the acid gases coming from gas treating. The Claus process remains the mainstay for sulfur recovery. Conventional three-stage Claus plants, with indirect reheat and feeds with a high H2S content, can approach 98 percent sulfur recovery efficiency. However, since environmental regulations have become more stringent, sulfur recovery plants are required to recover sulfur with over 99.8 percent efficiency. To meet these stricter regulations, the Claus process underwent various modifications and add-ons.
Sulfur Recovery/Tail Gas Cleanup Process Selection
The add-on modification to the Claus plant selected for this study can be considered a separate option from the Claus process. In this context, it is often called a TGTU process.
The Claus Process The Claus process converts H2S to elemental sulfur via the following reactions:
H2S + 3/2 O2 ↔ H2O + SO2
2H2S + SO2 ↔ 2H2O + 3S
The second reaction, the Claus reaction, is equilibrium limited. The overall reaction is:
3H2S + 3/2 O2 ↔ 3H2O + 3S The sulfur in the vapor phase exists as S2, S6, and S8 molecular species, with the S2 predominant at higher temperatures, and S8 predominant at lower temperatures.
A simplified process flow diagram of a typical three-stage Claus plant is shown in Exhibit 3-5 [60]. One-third of the H2S is burned in the furnace with oxygen from the air to give sufficient SO2 to react with the remaining H2S. Since these reactions are highly exothermic, a waste heat boiler that recovers this heat to generate HP steam usually follows the furnace. Sulfur is condensed in a condenser that follows the HP steam recovery section. LP steam is raised in the condenser. The tail gas from the first condenser then goes to several catalytic conversion stages, usually two to three, where the remaining sulfur is recovered via the Claus reaction. Each catalytic stage consists of gas preheat, a catalytic reactor, and a sulfur condenser. The liquid sulfur goes to the sulfur pit, while the tail gas proceeds to the incinerator or for further processing in a TGTU.

Cost and Performance Baseline for Coal-to-SNG and Ammonia (Volume 2)
70
Exhibit 3-5 Typical Three-Stage Claus Sulfur Plant
Claus Plant Sulfur Recovery Efficiency The Claus reaction is equilibrium limited, and sulfur conversion is sensitive to the reaction temperature. The highest sulfur conversion in the thermal zone is limited to about 75 percent. Typical furnace temperatures are in the range from 1,093 to 1,427°C (2,000 to 2,600°F), and as the temperature decreases, conversion increases dramatically.
Claus plant sulfur recovery efficiency depends on many factors:
• H2S concentration of the feed gas
• Number of catalytic stages
• Gas reheat method In order to keep Claus plant recovery efficiencies approaching 94 to 96 percent for feed gases that contain about 20 to 50 percent H2S, a split-flow design is often used. In this version of the Claus plant, part of the feed gas is bypassed around the furnace to the first catalytic stage, while the rest of the gas is oxidized in the furnace to mostly SO2. This results in a more stable temperature in the furnace.
Oxygen-Blown Claus Large diluent streams in the feed to the Claus plant, such as N2 from combustion air, or a high CO2 content in the feed gas, lead to higher cost Claus processes and any add-on or tail gas units. One way to reduce diluent flows through the Claus plant and to obtain stable temperatures in the furnace for dilute H2S streams is the oxygen-blown Claus process.
The oxygen-blown Claus process was originally developed to increase capacity at existing conventional Claus plants and to increase flame temperatures of low H2S content gases. The

Cost and Performance Baseline for Coal-to-SNG and Ammonia (Volume 2)
71
process has also been used to provide the capacity and operating flexibility for sulfur plants where the feed gas is variable in flow and composition such as often found in refineries. The application of the process has now been extended to grass roots installations, even for rich H2S feed streams, to provide operating flexibility at lower costs than would be the case for conventional Claus units. At least four of the recently built gasification plants in Europe use oxygen enriched Claus units.
Oxygen enrichment results in higher temperatures in the front-end furnace, potentially reaching temperatures as high as 1,593 to 1,649°C (2,900 to 3,000°F) as the enrichment moves beyond 40 to 70 vol% O2 in the oxidant feed stream. Although oxygen enrichment has many benefits, its primary benefit for lean H2S feeds is a stable furnace temperature. Sulfur recovery is not significantly enhanced by oxygen enrichment. Because the gasification process already requires an ASU, the oxygen-blown Claus plant was chosen for all cases.
Tail Gas Treating In many refinery and other conventional Claus applications, tail gas treating involves the removal of the remaining sulfur compounds from gases exiting the SRU. Tail gas from a typical Claus process, whether a conventional Claus or one of the extended versions of the process, usually contains small, but varying quantities of COS, carbon disulfide (CS2), H2S, SO2, and elemental sulfur vapors. In addition, there may be H2, CO, and CO2 in the tail gas. In order to remove the rest of the sulfur compounds from the tail gas, all of the sulfur-bearing species must first be converted to H2S. Then, the resulting H2S is absorbed into a solvent and the clean gas vented or recycled for further processing. The clean gas resulting from the hydrolysis step can undergo further cleanup in a dedicated absorption unit or be integrated with an upstream AGR unit. The latter option is particularly suitable with physical absorption solvents. The approach of treating the tail gas in a dedicated amine absorption unit and recycling the resulting acid gas to the Claus plant is the one used by the SCOT process. With tail gas treatment, Claus plants can achieve overall removal efficiencies in excess of 99.9 percent.
In the case of gasification-based applications, the tail gas from the Claus plant can be catalytically hydrogenated and then recycled back into the system with the choice of location being technology dependent, or it can be treated with a SCOT-type process. The low rank coal cases in this report all use a catalytic hydrogenation step with tail gas recycle to the AGR. The bituminous coal cases utilize the SCOT process with acid gas recycled back to the AGR and the clean gas used for coal drying. The Shell Puertollano plant treats the tail gas in a similar manner, but the recycle endpoint is not specified [38].
Flare Stack A self-supporting, refractory-lined, carbon steel (CS) flare stack is typically provided to combust and dispose of unreacted gas during startup, shutdown, and upset conditions. However, in all eight cases a flare stack was provided for syngas dumping during startup, shutdown, etc. This flare stack eliminates the need for a separate Claus plant flare.
3.1.13 The slag handling system conveys, stores, and disposes of slag removed from the gasification process. Spent material drains from the gasifier bed into a water bath in the bottom of the gasifier vessel. A slag crusher receives slag from the water bath and grinds the material into pea-
Slag Handling

Cost and Performance Baseline for Coal-to-SNG and Ammonia (Volume 2)
72
sized fragments. A slag/water slurry that is between 5 and 10 percent solids leaves the gasifier pressure boundary through the use of lockhoppers to a series of dewatering bins.
The slag is dewatered, the water is clarified and recycled and the dried slag is transferred to a storage area for disposal.
In this study the slag bins were sized for a nominal holdup capacity of 72 hours of full-load operation. At periodic intervals, a convoy of slag-hauling trucks will transit the unloading station underneath the hopper and remove a quantity of slag for disposal. Approximately 30-50 truckloads per day are required to remove the total quantity of slag produced by the plant, depending on coal type, operating at nominal rated power. While the slag is suitable for use as a component of road paving mixtures, it was assumed in this study that the slag would be landfilled at a specified cost.
3.1.14 Steam Turbine Generator and Auxiliaries
Steam Generation Island
The ST consists of an HP section, an IP section, and one double-flow LP section, all connected to the generator by a common shaft. The HP and IP sections are contained in a single-span, opposed-flow casing, with the double-flow LP section in a separate casing.
Superheated main steam is combined in a header, and then passes through the stop valves and control valves and enters the turbine at 12.4 MPa/566°C (1800 psig/1050°F). The steam initially enters the turbine near the middle of the HP span, flows through the turbine. After passing through the IP section, the steam enters a crossover pipe, which transports the steam to the LP section. The steam divides into two paths and flows through the LP sections, exhausting downward into the condenser. In the Midwestern location cases the single condenser is water-cooled. In the Montana and North Dakota location cases the steam exiting the turbine splits evenly between a water–cooled condenser and an air-cooled condenser.
The generator is a hydrogen-cooled synchronous type, generating power at 24 kilovolt (kV). A static, transformer type exciter is provided. The generator is cooled with a hydrogen gas recirculation system using fans mounted on the generator rotor shaft. The heat absorbed by the gas is removed as it passes over finned tube gas coolers mounted in the stator frame. Gas is prevented from escaping at the rotor shafts by a closed-loop (CL) oil seal system. The oil seal system consists of storage tank, pumps, filters, and pressure controls, all skid-mounted.
The STG is controlled by a triple-redundant, microprocessor-based electro-hydraulic control system. The system provides digital control of the unit in accordance with programmed control algorithms, color cathode ray tube (CRT) operator interfacing, and data link interfaces to the balance-of-plant distributed control system (DCS), and incorporates on-line repair capability.
Feedwater System The function of the feedwater (FW) system is to pump the various FW streams from the deaerator storage tank to the respective vaporizers. Two 50 percent capacity boiler feed pumps (BFPs) are provided for each of three pressure levels, HP, IP, and LP. Each pump is provided with inlet and outlet isolation valves, and outlet check valve. Minimum flow recirculation to prevent overheating and cavitation of the pumps during startup and low loads is provided by an automatic recirculation valve and associated piping that discharges back to the deaerator storage tank. Pneumatic flow control valves control the recirculation flow.

Cost and Performance Baseline for Coal-to-SNG and Ammonia (Volume 2)
73
The FW pumps are supplied with instrumentation to monitor and alarm on low oil pressure, or high bearing temperature. FW pump suction pressure and temperature are also monitored. In addition, the suction of each BFP is equipped with a startup strainer.
Main and Reheat Steam Systems The function of the main steam system is to convey main steam generated in the raw gas coolers and the methanation and ammonia synthesis superheater (where applicable) outlets to the HP turbine stop valves.
Main steam at approximately 12.4 MPa/566°C (1800 psig/1050°F) exits through a motor-operated stop/check valve and a motor-operated gate valve, and is routed to a single line feeding the HP turbine. Cold reheat steam at 3.5 MPa/376°C (501 psia/708°F) exits the HP turbine, flows through a motor-operated isolation gate valve, to the syngas cooler. Hot reheat steam at approximately 3.5 MPa/538°C (501 psia/1000°F) exits the syngas cooler and is routed to the IP turbines.
Safety valves are installed to comply with appropriate codes and to ensure the safety of personnel and equipment.
Circulating Water System The circulating water system (CWS) is a closed-cycle cooling water system that supplies cooling water to the condenser to condense the main turbine exhaust steam (all of the exhaust steam in Midwestern locations and half of the steam in the Montana and North Dakota locations). The system also supplies cooling water to the AGR plant as required, and to the auxiliary cooling system. The auxiliary cooling system is a CL process that utilizes a higher quality water to remove heat from compressor intercoolers, oil coolers and other ancillary equipment and transfers that heat to the main circulating cooling water system in plate and frame heat exchangers. The heat transferred to the circulating water in the condenser and other applications is removed by a mechanical draft cooling tower.
The system consists of two 50 percent capacity vertical CWPs, a mechanical draft evaporative cooling tower, and CS cement-lined interconnecting piping. The pumps are single-stage vertical pumps. The piping system is equipped with butterfly isolation valves and all required expansion joints. The cooling tower is a multi-cell wood frame counter flow mechanical draft cooling tower.
The condenser is a single-pass, horizontal type with divided water boxes. All of the steam is condensed using cooling water for the bituminous coal cases. There are two separate circulating water circuits in each box. One-half of the condenser can be removed from service for cleaning or for plugging tubes. This can be done during normal operation at reduced load.
Midwestern Location Cases
The condenser is equipped with an air extraction system to evacuate the condenser steam space for removal of non-condensable gases during ST operation and to rapidly reduce the condenser pressure from atmospheric pressure before unit startup and admission of steam to the condenser.
Exhaust steam from the ST is split 50/50 to a surface condenser cooled with cooling water and to an air-cooled condenser used ambient air and forced convection. A decision to use a parallel
Montana and North Dakota Location Cases

Cost and Performance Baseline for Coal-to-SNG and Ammonia (Volume 2)
74
wet/dry cooling system was based primarily on the plans for the Xcel Energy Comanche 3 PC plant currently in start up, and the desire to reduce the plant water requirement in western locations where water constraints are frequently encountered. With the relatively low ambient temperature, the performance impact from the parallel cooling, as compared to wet cooling, is minor.
The major impact of parallel cooling is a significant reduction in water requirement when compared to a wet cooling system. This impact is included in the water balance presented later in this report.
With this cooling system and the specific ambient temperature, a condenser pressure of 0.005 MPa (0.698 psia) (condensing temperature of 32°C [90°F]) is used in the Western location cases as compared to 0.007 MPa (0.983 psia) (condensing temperature of 38°C [101°F]) used in the Midwestern location cases.
Raw Water, Fire Protection, and Cycle Makeup Water Systems The raw water system supplies cooling tower makeup, cycle makeup, service water, and potable water requirements. The water source is 50 percent from a POTW and 50 percent from groundwater. Booster pumps within the plant boundary provide the necessary pressure.
The fire protection system provides water under pressure to the fire hydrants, hose stations, and fixed water suppression system within the buildings and structures. The system consists of pumps, underground and aboveground supply piping, distribution piping, hydrants, hose stations, spray systems, and deluge spray systems. One motor-operated booster pump is supplied on the intake structure of the cooling tower with a diesel engine backup pump installed on the water inlet line.
The cycle makeup water system provides high quality demineralized water for makeup to the steam cycle, for steam injection ahead of the WGS reactors and gasifier, and for injection steam to the auxiliary boiler for control of NOx emissions, if required.
The cycle makeup system consists of two 100 percent trains, each with a full-capacity activated carbon filter, primary cation exchanger, primary anion exchanger, mixed bed exchanger, recycle pump, and regeneration equipment. The equipment is skid-mounted and includes a control panel and associated piping, valves, and instrumentation.
3.1.15 The accessory electric plant consists of switchgear and control equipment, generator equipment, station service equipment, conduit and cable trays, and wire and cable. It also includes the main power transformer, all required foundations, and standby equipment.
Accessory Electric Plant
3.1.16 An integrated plant-wide DCS is provided. The DCS is a redundant microprocessor-based, functionally DCS. The control room houses an array of multiple video monitor (CRT) and keyboard units. The CRT/keyboard units are the primary interface between the generating process and operations personnel. The DCS incorporates plant monitoring and control functions for all the major plant equipment. The DCS is designed to be operational and accessible 99.5
Instrumentation and Control

Cost and Performance Baseline for Coal-to-SNG and Ammonia (Volume 2)
75
percent of the time it is required (99.5 percent availability). The plant equipment and the DCS are designed for automatic response to load changes from minimum load to 100 percent. Startup and shutdown routines are manually implemented, with operator selection of modular automation routines available. The exception to this, and an important facet of the control system for gasification, is the critical controller system, which is a part of the license package from the gasifier supplier and is a dedicated and distinct hardware segment of the DCS.
This critical controller system is used to control the gasification process. The partial oxidation of the fuel feed and oxygen feed streams to form a syngas product is a stoichiometric, temperature- and pressure-dependent reaction. The critical controller utilizes a redundant microprocessor executing calculations and dynamic controls at 100- to 200-millisecond intervals. The enhanced execution speeds as well as evolved predictive controls allow the critical controller to mitigate process upsets and maintain the reactor operation within a stable set of operating parameters.

Cost and Performance Baseline for Coal-to-SNG and Ammonia (Volume 2)
76
This page intentionally left blank

Cost and Performance Baseline for Coal-to-SNG and Ammonia (Volume 2)
77
4. This section contains an evaluation of plant designs for Cases 1 through 4, which are based on the Siemens gasifier using Illinois No. 6 coal as the fuel. All cases capture CO2 from the syngas stream because of the necessary process conditions for chemical production, but in one case CO2 is released to the atmosphere and in the other it is compressed and sequestered. Cases 1 and 2 are very similar in terms of process, equipment, scope and arrangement, except that Case 2 utilizes a CO2 compression train to enable transportation and sequestration. The same is true for Cases 3 and 4.
BITUMINOUS COAL CASES
Section 4.1 covers the two SNG cases using Illinois No. 6 coal. Section 4.2 covers the two SNG and ammonia co-production cases using Illinois No. 6 coal. Each section is structured analogously as follows:
• Process and System Description provides an overview of the technology operation as applied.
• Key Assumptions is a summary of relevant study and modeling assumptions.
• Sparing Philosophy is provided.
• Performance Results provide the main modeling results, including the performance summary, environmental performance, carbon balance, sulfur balance, water balance, mass and energy balance diagrams, and mass and energy balance tables.
• Equipment List provides an itemized list of major equipment with account codes that correspond to the cost accounts in the Cost Estimates section.
• Cost Estimates provides a summary of capital and operating costs. If the information is identical to that presented for the non-sequestration cases, a reference is made to the earlier section rather than repeating the information.
4.1 SYNTHETIC NATURAL GAS PRODUCTION USING ILLINOIS NO. 6 COAL
4.1.1 In this section the overall Siemens gasification process for the production of SNG for Cases 1 and 2 is described. The only major process difference is that Case 2 employs CO2 compression and sequestration. The system description follows the block flow diagrams (BFDs) in
Process Description
Exhibit 4-1 and Exhibit 4-3 and stream numbers reference the same exhibit. The tables in Exhibit 4-2 and Exhibit 4-4 provide process data for the numbered streams in the BFD.
Coal Preparation and Feed Systems Coal receiving and handling is covered in Section 3.1.1. The receiving and handling subsystem ends at the coal silo. The Siemens process uses a dry feed system which is sensitive to the coal moisture content. Coal moisture consists of two parts, surface moisture and inherent moisture. For coal to flow smoothly through the lock hoppers, the surface moisture must be removed. The bituminous coal used in this study contains 11.12 percent moisture on an as-received basis (stream 6). It was assumed that the bituminous coal must be dried to 6 percent moisture to allow for smooth flow through the dry feed system (stream 10).

Cost and Performance Baseline for Coal-to-SNG and Ammonia (Volume 2)
78
Exhibit 4-1 Case 1 Block Flow Diagram, Bituminous Coal to SNG without Carbon Sequestration
PARTIAL RAW GAS QUENCH AND COOLING
WATER-GAS SHIFT REACTORS & GAS COOLING
WATER SCRUBBER
ELEVATEDPRESSURE
ASU
SIEMENS GASIFIER
MERCURYREMOVAL
DUAL-STAGE
SELEXOL UNIT
CLAUSPLANT
1AIR TO ASU
2 3
VENTGAS
SULFUR PLANT
OXIDANT
4
10
13
GASIFIEROXIDANT
DRIEDCOAL
SLAG
16
31
32
TAIL GAS HYDROLYSIS AND TREATMENT UNIT
33
SULFUR PRODUCT
SYNGAS
COAL DRYER
6
WETCOAL
95
15
TO SOUR WATER
STRIPPER
STEAM
3019
CO2 VENT
22
SHIFT STEAM
11
STACK GAS
12
34
14QUENCHWATER
17
METHANATION REACTORS
26
SNG PURIFICATION
28
SNG FOR EXPORT
27 PURIFICATION OFF-GAS
25PILOT FUEL
WGS BYPASS
11
STEAM TURBINE
36 37
PROCESS STEAM
CONDENSATE
DRY GAS PREP
23
24
7
AIR
8
20
SNG COMPRESSION
29
21
COS HYDROLYSIS 18
LOCK-HOPPER
VENT
TRANSPORT CO2
Note: Block Flow Diagram is not intended to represent a complete material balance. Only major process streams and equipment are shown. See H&MB diagram for more detail.
TRANSPORT CO2
35

Cost and Performance Baseline for Coal-to-SNG and Ammonia (Volume 2)
79
Exhibit 4-2 Case 1 Stream Table, Bituminous Coal to SNG without Carbon Sequestration
1 2 3 4 5 6 7 8 9 10 11 12 13 14 15 16 17 18 19V-L Mole Fraction
Ar 0.0092 0.0091 0.0101 0.0101 0.0000 0.0000 0.0092 0.0084 0.0064 0.0000 0.0001 0.0000 0.0000 0.0000 0.0019 0.0020 0.0020 0.0020 0.0000CH4 0.0000 0.0000 0.0000 0.0000 0.0000 0.0000 0.0000 0.0000 0.0000 0.0000 0.0000 0.0000 0.0000 0.0000 0.0000 0.0000 0.0000 0.0000 0.0000CO 0.0000 0.0000 0.0000 0.0000 0.0000 0.0000 0.0000 0.0000 0.0000 0.0000 0.0119 0.0015 0.0000 0.0000 0.4228 0.4387 0.4387 0.4387 0.0000CO2 0.0003 0.0004 0.0000 0.0000 0.0000 0.0000 0.0003 0.1134 0.0869 0.0000 0.9736 0.1231 0.0000 0.0000 0.0380 0.0394 0.0394 0.0400 0.0000COS 0.0000 0.0000 0.0000 0.0000 0.0000 0.0000 0.0000 0.0000 0.0000 0.0000 0.0001 0.0000 0.0000 0.0000 0.0005 0.0006 0.0006 0.0000 0.0000H2 0.0000 0.0000 0.0000 0.0000 0.0000 0.0000 0.0000 0.0000 0.0000 0.0000 0.0127 0.6936 0.0000 0.0000 0.2001 0.2076 0.2076 0.2076 0.0000H2O 0.0099 0.0039 0.0000 0.0000 1.0000 0.0000 0.0099 0.1726 0.3661 0.0000 0.0015 0.0979 0.0000 1.0000 0.3261 0.3009 0.3009 0.3004 1.0000H2S 0.0000 0.0000 0.0000 0.0000 0.0000 0.0000 0.0000 0.0000 0.0000 0.0000 0.0000 0.0000 0.0000 0.0000 0.0058 0.0060 0.0060 0.0066 0.0000N2 0.7732 0.9790 0.0004 0.0004 0.0000 0.0000 0.7732 0.6276 0.4809 0.0000 0.0001 0.0171 0.0000 0.0000 0.0046 0.0047 0.0047 0.0047 0.0000NH3 0.0000 0.0000 0.0000 0.0000 0.0000 0.0000 0.0000 0.0000 0.0000 0.0000 0.0000 0.0000 0.0000 0.0000 0.0000 0.0000 0.0000 0.0000 0.0000O2 0.2074 0.0076 0.9895 0.9895 0.0000 0.0000 0.2074 0.0780 0.0597 0.0000 0.0000 0.0668 0.0000 0.0000 0.0000 0.0000 0.0000 0.0000 0.0000SO2 0.0000 0.0000 0.0000 0.0000 0.0000 0.0000 0.0000 0.0000 0.0000 0.0000 0.0000 0.0000 0.0000 0.0000 0.0000 0.0000 0.0000 0.0000 0.0000
Total 1.0000 1.0000 1.0000 1.0000 1.0000 0.0000 1.0000 1.0000 1.0000 0.0000 1.0000 1.0000 0.0000 1.0000 1.0000 1.0000 1.0000 1.0000 1.0000
V-L Flowrate (kgmol/hr) 51,091 40,346 151 10,249 3,445 0 3,513 4,336 5,659 0 3,569 14,109 0 14,021 53,959 52,011 7,721 7,721 14,746V-L Flowrate (kg/hr) 1,474,339 1,134,515 4,838 328,760 62,065 0 101,361 123,623 147,458 0 154,354 158,594 0 252,597 1,091,692 1,056,587 156,847 156,847 265,661Solids Flowrate (kg/hr) 0 0 0 0 0 437,604 0 0 0 413,769 0 332,351 43,828 0 0 0 0 0 0
Temperature (°C) 15 24 32 32 343 15 15 1,278 143 71 83 18 1,500 216 260 215 215 215 288Pressure (MPa, abs) 0.10 0.11 0.86 0.86 5.10 0.10 0.10 0.10 0.10 0.10 5.62 5.62 4.24 8.274 3.89 3.76 3.76 3.69 4.14Enthalpy (kJ/kg) 30.93 30.58 26.94 26.94 3,177.81 --- 30.93 1,884.17 835.89 --- 31.45 4,685.53 --- 1,017.873 1,148.27 1,011.50 1,011.50 1,011.03 3,070.04Density (kg/m3) 1.2 1.3 11.0 11.0 20.1 --- 1.2 0.2 0.8 --- 98.9 28.4 --- 782.0 17.9 19.0 19.0 18.7 18.2V-L Molecular Weight 28.857 28.120 32.078 32.078 18.015 --- 28.857 28.514 26.059 --- 43.248 11.241 --- 18.015 20.232 20.314 20.314 20.314 18.015
V-L Flowrate (lbmol/hr) 112,637 88,948 332 22,595 7,595 0 7,744 9,558 12,475 0 7,868 31,105 0 30,912 118,960 114,666 17,022 17,022 32,510V-L Flowrate (lb/hr) 3,250,361 2,501,177 10,665 724,793 136,831 0 223,464 272,542 325,090 0 340,292 349,640 0 556,880 2,406,768 2,329,375 345,789 345,789 585,682Solids Flowrate (lb/hr) 0 0 0 0 0 964,752 0 0 0 912,204 0 732,709 96,625 0 0 0 0 0 0
Temperature (°F) 59 74 90 90 650 59 59 2,332 290 160 181 65 2,732 420 500 418 418 419 550Pressure (psia) 14.7 16.4 125.0 125.0 740.0 14.7 14.7 14.7 14.7 14.4 815.0 815.0 614.7 1,200.0 564.7 544.7 544.7 534.7 600.0Enthalpy (Btu/lb) 13.3 13.1 11.6 11.6 1,366.2 --- 13.3 810.0 359.4 --- 13.5 2,014.4 --- 437.6 493.7 434.9 434.9 434.7 1,319.9Density (lb/ft3) 0.076 0.081 0.685 0.685 1.257 --- 0.076 0.014 0.048 --- 6.174 1.774 --- 48.817 1.120 1.189 1.189 1.166 1.135
A - Reference conditions are 32.02 F & 0.089 PSIA
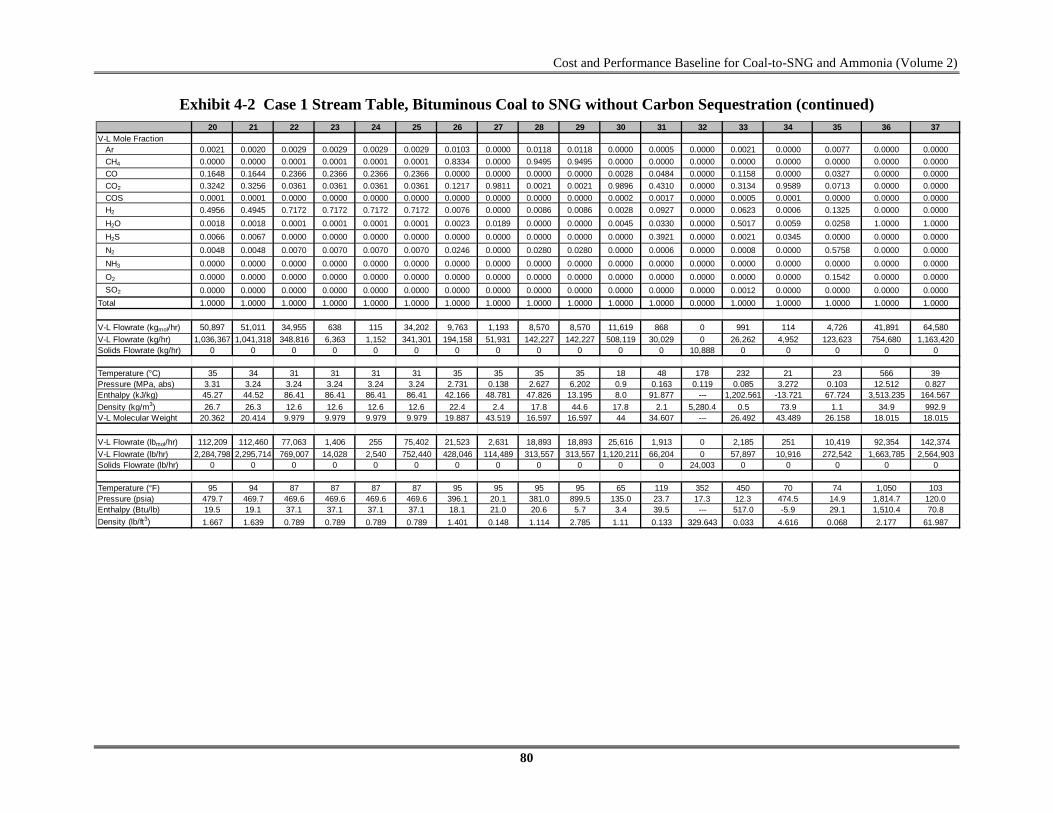
Cost and Performance Baseline for Coal-to-SNG and Ammonia (Volume 2)
80
Exhibit 4-2 Case 1 Stream Table, Bituminous Coal to SNG without Carbon Sequestration (continued) 20 21 22 23 24 25 26 27 28 29 30 31 32 33 34 35 36 37
V-L Mole FractionAr 0.0021 0.0020 0.0029 0.0029 0.0029 0.0029 0.0103 0.0000 0.0118 0.0118 0.0000 0.0005 0.0000 0.0021 0.0000 0.0077 0.0000 0.0000CH4 0.0000 0.0000 0.0001 0.0001 0.0001 0.0001 0.8334 0.0000 0.9495 0.9495 0.0000 0.0000 0.0000 0.0000 0.0000 0.0000 0.0000 0.0000CO 0.1648 0.1644 0.2366 0.2366 0.2366 0.2366 0.0000 0.0000 0.0000 0.0000 0.0028 0.0484 0.0000 0.1158 0.0000 0.0327 0.0000 0.0000CO2 0.3242 0.3256 0.0361 0.0361 0.0361 0.0361 0.1217 0.9811 0.0021 0.0021 0.9896 0.4310 0.0000 0.3134 0.9589 0.0713 0.0000 0.0000COS 0.0001 0.0001 0.0000 0.0000 0.0000 0.0000 0.0000 0.0000 0.0000 0.0000 0.0002 0.0017 0.0000 0.0005 0.0001 0.0000 0.0000 0.0000H2 0.4956 0.4945 0.7172 0.7172 0.7172 0.7172 0.0076 0.0000 0.0086 0.0086 0.0028 0.0927 0.0000 0.0623 0.0006 0.1325 0.0000 0.0000H2O 0.0018 0.0018 0.0001 0.0001 0.0001 0.0001 0.0023 0.0189 0.0000 0.0000 0.0045 0.0330 0.0000 0.5017 0.0059 0.0258 1.0000 1.0000H2S 0.0066 0.0067 0.0000 0.0000 0.0000 0.0000 0.0000 0.0000 0.0000 0.0000 0.0000 0.3921 0.0000 0.0021 0.0345 0.0000 0.0000 0.0000N2 0.0048 0.0048 0.0070 0.0070 0.0070 0.0070 0.0246 0.0000 0.0280 0.0280 0.0000 0.0006 0.0000 0.0008 0.0000 0.5758 0.0000 0.0000NH3 0.0000 0.0000 0.0000 0.0000 0.0000 0.0000 0.0000 0.0000 0.0000 0.0000 0.0000 0.0000 0.0000 0.0000 0.0000 0.0000 0.0000 0.0000O2 0.0000 0.0000 0.0000 0.0000 0.0000 0.0000 0.0000 0.0000 0.0000 0.0000 0.0000 0.0000 0.0000 0.0000 0.0000 0.1542 0.0000 0.0000SO2 0.0000 0.0000 0.0000 0.0000 0.0000 0.0000 0.0000 0.0000 0.0000 0.0000 0.0000 0.0000 0.0000 0.0012 0.0000 0.0000 0.0000 0.0000
Total 1.0000 1.0000 1.0000 1.0000 1.0000 1.0000 1.0000 1.0000 1.0000 1.0000 1.0000 1.0000 0.0000 1.0000 1.0000 1.0000 1.0000 1.0000
V-L Flowrate (kgmol/hr) 50,897 51,011 34,955 638 115 34,202 9,763 1,193 8,570 8,570 11,619 868 0 991 114 4,726 41,891 64,580V-L Flowrate (kg/hr) 1,036,367 1,041,318 348,816 6,363 1,152 341,301 194,158 51,931 142,227 142,227 508,119 30,029 0 26,262 4,952 123,623 754,680 1,163,420Solids Flowrate (kg/hr) 0 0 0 0 0 0 0 0 0 0 0 0 10,888 0 0 0 0 0
Temperature (°C) 35 34 31 31 31 31 35 35 35 35 18 48 178 232 21 23 566 39Pressure (MPa, abs) 3.31 3.24 3.24 3.24 3.24 3.24 2.731 0.138 2.627 6.202 0.9 0.163 0.119 0.085 3.272 0.103 12.512 0.827Enthalpy (kJ/kg) 45.27 44.52 86.41 86.41 86.41 86.41 42.166 48.781 47.826 13.195 8.0 91.877 --- 1,202.561 -13.721 67.724 3,513.235 164.567Density (kg/m3) 26.7 26.3 12.6 12.6 12.6 12.6 22.4 2.4 17.8 44.6 17.8 2.1 5,280.4 0.5 73.9 1.1 34.9 992.9V-L Molecular Weight 20.362 20.414 9.979 9.979 9.979 9.979 19.887 43.519 16.597 16.597 44 34.607 --- 26.492 43.489 26.158 18.015 18.015
V-L Flowrate (lbmol/hr) 112,209 112,460 77,063 1,406 255 75,402 21,523 2,631 18,893 18,893 25,616 1,913 0 2,185 251 10,419 92,354 142,374V-L Flowrate (lb/hr) 2,284,798 2,295,714 769,007 14,028 2,540 752,440 428,046 114,489 313,557 313,557 1,120,211 66,204 0 57,897 10,916 272,542 1,663,785 2,564,903Solids Flowrate (lb/hr) 0 0 0 0 0 0 0 0 0 0 0 0 24,003 0 0 0 0 0
Temperature (°F) 95 94 87 87 87 87 95 95 95 95 65 119 352 450 70 74 1,050 103Pressure (psia) 479.7 469.7 469.6 469.6 469.6 469.6 396.1 20.1 381.0 899.5 135.0 23.7 17.3 12.3 474.5 14.9 1,814.7 120.0Enthalpy (Btu/lb) 19.5 19.1 37.1 37.1 37.1 37.1 18.1 21.0 20.6 5.7 3.4 39.5 --- 517.0 -5.9 29.1 1,510.4 70.8Density (lb/ft3) 1.667 1.639 0.789 0.789 0.789 0.789 1.401 0.148 1.114 2.785 1.11 0.133 329.643 0.033 4.616 0.068 2.177 61.987

Cost and Performance Baseline for Coal-to-SNG and Ammonia (Volume 2)
81
Exhibit 4-3 Case 2 Block Flow Diagram, Bituminous Coal to SNG with Carbon Sequestration
PARTIAL RAW GAS QUENCH AND COOLING
WATER-GAS SHIFT REACTORS & GAS COOLING
WATER SCRUBBER
ELEVATEDPRESSURE
ASU
SIEMENS GASIFIER
MERCURYREMOVAL
DUAL-STAGE
SELEXOL UNIT
CLAUSPLANT
1AIR TO ASU
2 3
VENTGAS
SULFUR PLANT
OXIDANT
4
10
13
GASIFIEROXIDANT
DRIEDCOAL
SLAG
16
31
32
TAIL GAS HYDROLYSIS AND TREATMENT UNIT
33
SULFUR PRODUCTSYNGAS
COAL DRYER
6
WETCOAL
95
15
TO SOUR WATER
STRIPPER
STEAM
3019 CO2
PRODUCT
22
SHIFT STEAM
STACK GAS
34
14QUENCHWATER
17
METHANATION REACTORS
26
SNG PURIFICATION
28
27PURIFICATION OFF-
GAS TO CO2 COMPRESSION
25PILOT FUEL
WGS BYPASS
11
STEAM TURBINE
36 37
PROCESS STEAM
CONDENSATE
DRY GAS PREP
35
23
24
7
AIR
8
20
CO2 COMPRESSION
27
SNG FOR EXPORT
SNG COMPRESSION
29
21
COS HYDROLYSIS
18TRANSPORT
CO2
11
LOCK-HOPPER
VENT
TRANSPORT CO2
12
Note: Block Flow Diagram is not intended to represent a complete material balance. Only major process streams and equipment are shown. See H&MB diagram for more detail.
PURIFICATION OFF-GAS
TO CO2 COMPRESSOR
FROM LOCK HOPPERS

Cost and Performance Baseline for Coal-to-SNG and Ammonia (Volume 2)
82
Exhibit 4-4 Case 2 Stream Table, Bituminous Coal to SNG with Carbon Sequestration 1 2 3 4 5 6 7 8 9 10 11 12 13 14 15 16 17 18 19
V-L Mole FractionAr 0.0092 0.0091 0.0101 0.0101 0.0000 0.0000 0.0092 0.0084 0.0064 0.0000 0.0001 0.0000 0.0000 0.0000 0.0019 0.0020 0.0020 0.0020 0.0000CH4 0.0000 0.0000 0.0000 0.0000 0.0000 0.0000 0.0000 0.0000 0.0000 0.0000 0.0000 0.0000 0.0000 0.0000 0.0000 0.0000 0.0000 0.0000 0.0000CO 0.0000 0.0000 0.0000 0.0000 0.0000 0.0000 0.0000 0.0000 0.0000 0.0000 0.0046 0.0006 0.0000 0.0000 0.4229 0.4388 0.4388 0.4388 0.0000CO2 0.0003 0.0004 0.0000 0.0000 0.0000 0.0000 0.0003 0.1133 0.0869 0.0000 0.9902 0.1240 0.0000 0.0000 0.0381 0.0395 0.0395 0.0401 0.0000COS 0.0000 0.0000 0.0000 0.0000 0.0000 0.0000 0.0000 0.0000 0.0000 0.0000 0.0001 0.0000 0.0000 0.0000 0.0005 0.0006 0.0006 0.0000 0.0000H2 0.0000 0.0000 0.0000 0.0000 0.0000 0.0000 0.0000 0.0000 0.0000 0.0000 0.0048 0.6935 0.0000 0.0000 0.1999 0.2074 0.2074 0.2074 0.0000H2O 0.0099 0.0039 0.0000 0.0000 1.0000 0.0000 0.0099 0.1718 0.3648 0.0000 0.0001 0.0978 0.0000 1.0000 0.3262 0.3010 0.3010 0.3004 1.0000H2S 0.0000 0.0000 0.0000 0.0000 0.0000 0.0000 0.0000 0.0000 0.0000 0.0000 0.0000 0.0000 0.0000 0.0000 0.0058 0.0060 0.0060 0.0066 0.0000N2 0.7732 0.9790 0.0004 0.0004 0.0000 0.0000 0.7732 0.6281 0.4817 0.0000 0.0000 0.0172 0.0000 0.0000 0.0046 0.0047 0.0047 0.0047 0.0000NH3 0.0000 0.0000 0.0000 0.0000 0.0000 0.0000 0.0000 0.0000 0.0000 0.0000 0.0000 0.0000 0.0000 0.0000 0.0000 0.0000 0.0000 0.0000 0.0000O2 0.2074 0.0076 0.9895 0.9895 0.0000 0.0000 0.2074 0.0785 0.0602 0.0000 0.0000 0.0669 0.0000 0.0000 0.0000 0.0000 0.0000 0.0000 0.0000SO2 0.0000 0.0000 0.0000 0.0000 0.0000 0.0000 0.0000 0.0000 0.0000 0.0000 0.0000 0.0000 0.0000 0.0000 0.0000 0.0000 0.0000 0.0000 0.0000
Total 1.0000 1.0000 1.0000 1.0000 1.0000 0.0000 1.0000 1.0000 1.0000 0.0000 1.0000 1.0000 0.0000 1.0000 1.0000 1.0000 1.0000 1.0000 1.0000
V-L Flowrate (kgmol/hr) 51,089 40,345 151 10,248 3,445 0 3,531 4,355 5,678 0 3,530 14,089 0 14,016 53,935 51,984 7,779 7,779 14,732V-L Flowrate (kg/hr) 1,474,284 1,134,472 4,848 328,738 62,065 0 101,888 124,203 148,038 0 154,354 158,594 0 252,508 1,091,580 1,056,432 158,081 158,081 265,396Solids Flowrate (kg/hr) 0 0 0 0 0 437,604 0 0 0 413,769 0 332,351 43,828 0 0 0 0 0 0
Temperature (°C) 15 24 32 32 343 15 15 1,274 143 71 82 18 1,500 216 260 215 215 215 288Pressure (MPa, abs) 0.10 0.11 0.86 0.86 5.10 0.10 0.10 0.10 0.10 0.10 5.62 5.62 4.24 8.274 3.89 3.76 3.76 3.69 4.14Enthalpy (kJ/kg) 30.93 30.58 26.94 26.94 3,177.81 --- 30.93 1,875.99 833.13 --- 27.52 4,692.64 --- 1,017.873 1,148.09 1,011.26 1,011.26 1,010.79 3,070.04Density (kg/m3) 1.2 1.3 11.0 11.0 20.1 --- 1.2 0.2 0.8 --- 101.2 28.5 --- 782.0 17.9 19.1 19.1 18.7 18.2V-L Molecular Weight 28.857 28.120 32.078 32.078 18.015 --- 28.857 28.521 26.073 --- 43.732 11.256 --- 18.015 20.239 20.322 20.322 20.322 18.015
V-L Flowrate (lbmol/hr) 112,633 88,944 333 22,593 7,595 0 7,784 9,601 12,518 0 7,781 31,061 0 30,901 118,905 114,606 17,149 17,149 32,478V-L Flowrate (lb/hr) 3,250,240 2,501,083 10,688 724,742 136,831 0 224,625 273,820 326,368 0 340,292 349,640 0 556,684 2,406,522 2,329,035 348,508 348,508 585,098Solids Flowrate (lb/hr) 0 0 0 0 0 964,752 0 0 0 912,204 0 732,709 96,625 0 0 0 0 0 0
Temperature (°F) 59 74 90 90 650 59 59 2,325 290 160 179 65 2,732 420 500 418 418 419 550Pressure (psia) 14.7 16.4 125.0 125.0 740.0 14.7 14.7 14.7 14.7 14.4 815.0 815.0 614.7 1,200.0 564.7 544.7 544.7 534.7 600.0Enthalpy (Btu/lb) 13.3 13.1 11.6 11.6 1,366.2 --- 13.3 806.5 358.2 --- 11.8 2,017.5 --- 437.6 493.6 434.8 434.8 434.6 1,319.9Density (lb/ft3) 0.076 0.081 0.685 0.685 1.257 --- 0.076 0.014 0.048 --- 6.320 1.778 --- 48.817 1.120 1.190 1.190 1.167 1.135
A - Reference conditions are 32.02 F & 0.089 PSIA

Cost and Performance Baseline for Coal-to-SNG and Ammonia (Volume 2)
83
Exhibit 4-4 Case 2 Stream Table, Bituminous Coal to SNG with Carbon Sequestration (continued) 20 21 22 23 24 25 26 27 28 29 30 31 32 33 34 35 36 37
V-L Mole FractionAr 0.0020 0.0020 0.0029 0.0029 0.0029 0.0029 0.0103 0.0000 0.0118 0.0118 0.0001 0.0005 0.0000 0.0021 0.0000 0.0036 0.0000 0.0000CH4 0.0000 0.0000 0.0001 0.0001 0.0001 0.0001 0.8318 0.0000 0.9495 0.9495 0.0000 0.0000 0.0000 0.0000 0.0000 0.0000 0.0000 0.0000CO 0.1652 0.1649 0.2372 0.2372 0.2372 0.2372 0.0000 0.0000 0.0000 0.0000 0.0046 0.0485 0.0000 0.1153 0.0000 0.0065 0.0000 0.0000CO2 0.3241 0.3255 0.0361 0.0361 0.0361 0.0361 0.1236 0.9814 0.0021 0.0021 0.9902 0.4310 0.0000 0.3149 0.9630 0.5446 0.0000 0.0000COS 0.0001 0.0001 0.0000 0.0000 0.0000 0.0000 0.0000 0.0000 0.0000 0.0000 0.0001 0.0017 0.0000 0.0005 0.0000 0.0000 0.0000 0.0000H2 0.4953 0.4942 0.7166 0.7166 0.7166 0.7166 0.0075 0.0000 0.0085 0.0085 0.0048 0.0927 0.0000 0.0611 0.0006 0.2924 0.0000 0.0000H2O 0.0018 0.0018 0.0001 0.0001 0.0001 0.0001 0.0023 0.0186 0.0000 0.0000 0.0001 0.0330 0.0000 0.5024 0.0059 0.1514 1.0000 1.0000H2S 0.0066 0.0067 0.0000 0.0000 0.0000 0.0000 0.0000 0.0000 0.0000 0.0000 0.0000 0.3920 0.0000 0.0021 0.0304 0.0000 0.0000 0.0000N2 0.0048 0.0048 0.0070 0.0070 0.0070 0.0070 0.0245 0.0000 0.0280 0.0280 0.0000 0.0006 0.0000 0.0008 0.0000 0.0014 0.0000 0.0000NH3 0.0000 0.0000 0.0000 0.0000 0.0000 0.0000 0.0000 0.0000 0.0000 0.0000 0.0000 0.0000 0.0000 0.0000 0.0000 0.0000 0.0000 0.0000O2 0.0000 0.0000 0.0000 0.0000 0.0000 0.0000 0.0000 0.0000 0.0000 0.0000 0.0000 0.0000 0.0000 0.0000 0.0000 0.0000 0.0000 0.0000SO2 0.0000 0.0000 0.0000 0.0000 0.0000 0.0000 0.0000 0.0000 0.0000 0.0000 0.0000 0.0000 0.0000 0.0008 0.0000 0.0000 0.0000 0.0000
Total 1.0000 1.0000 1.0000 1.0000 1.0000 1.0000 1.0000 1.0000 1.0000 1.0000 1.0000 1.0000 0.0000 1.0000 1.0000 1.0000 1.0000 1.0000
V-L Flowrate (kgmol/hr) 50,851 50,965 34,927 638 115 34,174 9,775 1,212 8,562 8,562 14,470 867 0 992 114 576 42,211 65,028V-L Flowrate (kg/hr) 1,035,837 1,040,786 349,074 6,379 1,152 341,543 194,891 52,765 142,126 142,126 632,824 29,996 0 26,303 4,949 15,936 760,442 1,171,495Solids Flowrate (kg/hr) 0 0 0 0 0 0 0 0 0 0 0 0 10,891 0 0 0 0 0
Temperature (°C) 35 34 31 31 80 31 35 35 35 35 32 48 178 232 21 51 566 39Pressure (MPa, abs) 3.31 3.24 3.24 3.24 5.10 3.24 2.73 0.138 2.627 6.202 15.272 0.2 0.119 0.085 3.272 0.103 12.512 0.827Enthalpy (kJ/kg) 45.24 44.50 86.27 86.27 234.71 86.27 42.02 48.480 47.817 13.183 -216.068 91.9 --- 1,202.323 -13.694 240.482 3,513 164.549Density (kg/m3) 26.7 26.3 12.7 12.7 17.0 12.7 22.5 2.4 17.9 44.6 799.5 2.1 5,279.9 0.5 74.0 1.1 34.9 992.9V-L Molecular Weight 20.370 20.422 9.994 9.994 9.994 9.994 19.938 43.526 16.599 16.599 43.732 35 --- 26.526 43.529 27.652 18.015 18.015
V-L Flowrate (lbmol/hr) 112,108 112,359 77,001 1,407 254 75,340 21,549 2,673 18,877 18,877 31,902 1,911 0 2,186 251 1,271 93,059 143,362V-L Flowrate (lb/hr) 2,283,630 2,294,540 769,577 14,063 2,540 752,974 429,662 116,328 313,334 313,334 1,395,138 66,130 0 57,988 10,910 35,132 1,676,488 2,582,704Solids Flowrate (lb/hr) 0 0 0 0 0 0 0 0 0 0 0 0 24,010 0 0 0 0 0
Temperature (°F) 95 94 87 87 177 87 95 95 95 95 90 119 352 450 70 123 1,050 103Pressure (psia) 479.7 469.7 469.6 469.6 740.0 469.6 396.1 20.1 381.0 899.5 2,215.0 23.7 17.3 12.3 474.5 14.9 1,814.7 120.0Enthalpy (Btu/lb) 19.5 19.1 37.1 37.1 100.9 37.1 18.1 20.8 20.6 5.7 -92.9 39.5 --- 516.9 -5.9 103.4 1,510 70.7Density (lb/ft3) 1.667 1.640 0.790 0.790 1.061 0.790 1.405 0.148 1.114 2.786 49.913 0 329.612 0.033 4.620 0.069 2.177 61.987

Cost and Performance Baseline for Coal-to-SNG and Ammonia (Volume 2)
84
The coal is simultaneously crushed and dried in the coal mill then delivered to a surge hopper with an approximate 2-hour capacity. The drying medium is provided by combining the off-gas from the Claus plant TGTU and a slipstream of clean syngas (stream 23) and passing them through the incinerator. The incinerator flue gas, with an oxygen content of 8 vol%, is then used to dry the coal in the mill (stream 8).
The coal is drawn from the surge hoppers and fed through a pressurization lock hopper system to a dense phase pneumatic conveyor, which uses CO2 from the Selexol unit (stream 11) to convey the coal to the gasifiers. CO2 is chosen instead of N2 as the transport medium due to the process needs of the methanation section, which requires a low level of inerts for a more high value product and also eliminates the need for further SNG product purification. Approximately 50 percent of the coal transport CO2 is vented from the lock hopper. In the non-sequestration case, the CO2 is simply vented to the atmosphere and in the sequestration case approximately 97 percent of the CO2 is recovered and compressed for sequestration.
Gasifier There are six Siemens dry feed, pressurized, down flow, entrained, slagging gasifiers, operating at 4.24 MPa (615 psia). Coal reacts with oxygen (stream 4) and steam (stream 5) at a temperature of 1,499°C (2,730°F) to produce principally hydrogen and carbon monoxide. The clean syngas recycle stream is used as pilot fuel for the gasifier burners. The Siemens gasifiers use a ‘cooling screen’ (heat exchanger tubes) in the gasification zone of the gasifier. Circulating water passes through these heat exchangers and LP steam is generated in an external steam drum. Molten slag builds up a layer on the cooling screen and protects the cooling screen against the high reaction temperatures. Liquid slag from the reaction phase only comes in contact with the solidified slag layer and hence no corrosion of the reactor wall can take place. The gasifier reaction temperature is maintained by setting the oxygen/feedstock (primary) and steam to feedstock (secondary) ratios within precise limits.
Raw Gas Cooling/Particulate Removal The Siemens system in this study uses a partial water quench to 899°C (1,650°F) with a syngas cooler for steam generation. High-temperature heat recovery in each gasifier train is accomplished in three steps, including the gasifier cooling screen. The product gas from the gasifier is cooled using quench water (stream 14) to lower the temperature below the ash melting point. Syngas then goes through a raw gas cooler, which lowers the gas temperature to 260°C (500°F), and produces HP steam for use in the steam cycle.
The ash that is not carried out with the gas forms slag and runs down the interior walls, exiting the gasifier in liquid form. The slag is solidified in a quench tank for disposal (stream 13). Lockhoppers are used to reduce the pressure of the solids from 4.24 MPa (615 psia) to ambient.
Syngas Scrubber/Sour Water Stripper Downstream of the quench section is a raw gas scrubber system including two venturi scrubbers and a partial condenser. In two successive venturi scrubbers the raw gas is intensely mixed with water to remove the fine ash and soot particles. Cyclone-type separators remove water and particles from the raw gas flow. The scrubbers run on circuit water and additional water (e.g., gas condensate from the downstream gas cooling after CO shift, if applicable). To reduce fine particles and the salty fogs from the raw gas, a partial condensation of the raw gas is done downstream of the scrubber unit. In the partial condenser the raw gas is cooled down to

Cost and Performance Baseline for Coal-to-SNG and Ammonia (Volume 2)
85
condense a portion of the water content and separate fine particles. This generated gas condensate is separated from the raw gas and collected in a separator drum with a demister.
The sour water stripper removes NH3, SO2, and other impurities from the waste stream of the scrubber. The sour gas stripper consists of a sour drum that accumulates sour water from the gas scrubber and condensate from synthesis gas coolers (SGCs). Sour water from the drum flows to the sour stripper, which consists of a packed column with a steam-heated reboiler. Sour gas is stripped from the liquid and sent to the SRU. Remaining water is sent to wastewater treatment.
Sour Gas Shift and COS Hydrolysis The SGS and COS hydrolysis units are employed in combination to achieve a 3:1 H2 to CO ratio required for methanation and to reduce the amount of COS entering the AGR system. H2S and COS are at significant concentrations, requiring removal to achieve the low design level necessary for methanation synthesis. H2S is removed in an AGR process; however, because COS is not readily removed, it is catalytically converted to H2S in the SGS reactor and COS hydrolysis unit.
Following the water scrubber, the gas is reheated to 214°C (418°F) and fed to the SGS and COS hydrolysis reactors. This raw gas reheat temperature is controlled to achieve a nominal temperature of 232°C (450°F) entering the SGS reactor when combined with steam injection. Approximately 85 percent of the raw gas stream exiting the scrubber is sent to the SGS reactor. Steam (stream 19) is injected into the SGS reactor at 288°C (550°F) and 4.14 MPa (600 psia) to drive the shift reaction and maintain a 0.3 H2O to dry gas ratio exiting the reactor. The remaining raw gas from the scrubber is sent to the hydrolysis reactor in the bypass (stream 17) and COS is hydrolyzed with steam over a catalyst bed to H2S, which is more easily removed by the AGR solvent.
Mercury Removal and Acid Gas Removal
Before the raw fuel gas can be treated in the AGR process, it must be cooled to about 35°C (95°F). During this cooling through a series of heat exchangers, most of the water vapor condenses. This water, which contains some NH3, is sent to the sour water stripper. The cooled syngas (stream 20) then passes through a carbon bed to remove 95 percent of the Hg (Section 3.1.6).
The AGR process is a two stage Selexol process where H2S is removed in the first stage and CO2 in the second stage of absorption. The process results in three product streams, the clean syngas (stream 22), a CO2-rich stream (streams 11 and 30), and an acid gas feed to the Claus plant (stream 31). In both cases, the acid gas contains about 40 percent H2S and 45 percent CO2 with the balance primarily H2 and CO. The CO2-rich stream is discussed further in the CO2 compression section.
CO2 Compression CO2 from the AGR process is generated at two pressure levels, a LP stream at 0.12 MPa (17 psia) and an HP stream at 1.03 MPa (150 psia). For the non-sequestration case (Case 1), a portion of the captured CO2 from the HP stream is further compressed to 5.62 MPa (815 psia) to provide the transport medium in the coal feed/lock hopper system and the remaining CO2 is vented to the atmosphere. For the carbon sequestration case (Case 2), the LP stream is compressed to 1.0 MPa (150 psia) and then combined with the HP stream. The combined

Cost and Performance Baseline for Coal-to-SNG and Ammonia (Volume 2)
86
stream is further compressed to a SC condition at 15.3 MPa (2,215 psia) using a multiple-stage, intercooled compressor. At 5.17 MPa (750 psia), a portion of the CO2 compression stream is withdrawn, further compressed to 5.86 MPa (850 psia) using a boost compressor (stream 11), and sent to the lock hopper system. During compression, the CO2 stream is dehydrated to a dewpoint of -40ºC (-40°F) with triethylene glycol prior to extraction of the transport CO2. The raw CO2 stream from the Selexol process contains over 99 percent CO2. The dehydrated CO2 (stream 30 in Exhibit 4-3) is transported to the plant fence line and is sequestration ready. CO2 TS&M costs were estimated using the methodology described in Section 2.8.
Methanation System and SNG Compression Clean syngas from the Selexol unit (stream 25) is sent to the methanation reactors after syngas is withdrawn to fulfill the requirements of the gasifier (stream 24) and the coal drying system (stream 23). The syngas is reacted over three methanation reactors with interstage cooling that generates superheated HP and medium pressure steam as described in Section 3.1.8. Process condensate is removed from the SNG product (stream 26), which now contains approximately 83 vol% CH4. The SNG product is further purified by a molecular sieve, which removes 98.5 vol% of the CO2 and all of the water. The purification off-gas (stream 27) contains over 98 vol% CO2 and is either vented in the non-sequestration case or sent to CO2 compression for sequestration in the carbon sequestration case. The purified SNG product stream (stream 28) is compressed to 6.21 MPa (900 psia) to meet natural gas pipeline specifications (stream 29).
Claus Unit The SRU is a Claus bypass type SRU utilizing oxygen instead of air. The Claus plant produces molten sulfur (stream 32) by reacting approximately one third of the H2S in the feed to SO2, then reacting the H2S and SO2 to sulfur and water. The combination of Claus technology and SCOT tail gas technology results in an overall sulfur recovery exceeding 99 percent.
Utilizing oxygen instead of air in the Claus plant reduces the overall cost of the sulfur recovery plant. The sulfur plant produces elemental sulfur. Feed for each case consists of acid gas from both the acid gas cleanup unit (stream 31) and a vent stream from the sour water stripper in the gasifier section.
In the furnace waste heat boiler steam is generated. This steam is used to satisfy all Claus process preheating and reheating requirements as well as to provide some steam to the medium-pressure steam header. The sulfur condensers produce 0.45 MPa (65 psia) steam for the LP steam header.
Power Block The methanation system and syngas cooler in the gasifier generates superheated steam that is used to power a commercially available ST using a 12.4MPa/566°C (1800 psig/1050°F) steam cycle (stream 36).
Air Separation Unit (ASU) The ASU is designed to produce 99 mol% O2 for use in the gasifier (stream 4) and SRU (stream 3). The plant is designed with four production trains. The main air compressor is powered by an electric motor. Nitrogen is vented to the atmosphere or used for ammonia synthesis in the co-production cases.

Cost and Performance Baseline for Coal-to-SNG and Ammonia (Volume 2)
87
Balance of Plant Balance of plant items were covered in Section 3.1.
4.1.2 System assumptions for Cases 1 and 2, Siemens gasifier using Illinois No. 6 coal with and without carbon sequestration, are compiled in
Key System Assumptions
Exhibit 4-5.
Exhibit 4-5 Cases 1 and 2 Plant Study Configuration Matrix
Case 1 Case 2 Gasifier Pressure, MPa (psia) 4.2 (615) 4.2 (615) O2:Coal Ratio, kg O2/kg dry coal 0.784 0.784 Carbon Conversion, % 99.5 99.5 Syngas HHV at Gasifier Outlet, kJ/Nm3 (Btu/scf) 10,283 (276) 10,283 (276)
Steam Cycle, MPa/°C (psig/°F) 12.4/566/534 (1800/1050/994)
12.4/566/533 (1800/1050/992)
Condenser Pressure, mm Hg (in Hg) 51 (2.0) 51 (2.0)
Combustion Turbine N/A N/A Gasifier Technology Siemens Siemens Oxidant 99 vol% Oxygen 99 vol% Oxygen Coal Illinois No. 6 Illinois No. 6 Coal Feed Moisture Content, % 11.12 11.12 COS Hydrolysis Reactor Yes Yes Water Gas Shift Yes Yes H2S Separation Selexol (1st Stage) Selexol (1st Stage) Sulfur Removal, % 99.3 99.9 CO2 Separation Selexol (2nd Stage) Selexol (2nd Stage) CO2 Sequestered, % N/A 62.3
Sulfur Recovery Claus Plant with Tail Gas
Treatment / Elemental Sulfur
Claus Plant with Tail Gas Treatment / Elemental
Sulfur
Methanation System Based on Haldor Topsoe TREMP™ Process
Based on Haldor Topsoe TREMP™ Process
Particulate Control Scrubber and AGR Absorber
Scrubber and AGR Absorber
Mercury Control Carbon Bed Carbon Bed NOx Control N/A N/A

Cost and Performance Baseline for Coal-to-SNG and Ammonia (Volume 2)
88
Balance of Plant – All Cases The balance of plant assumptions are common to all cases and are presented in Exhibit 4-6.
Exhibit 4-6 Balance of Plant Assumptions
Recirculating Wet Cooling Tower Cooling water system Fuel and Other storage
Coal 30 days Slag 30 days Sulfur 30 days Sorbent 30 days
Plant Distribution Voltage Motors below 1hp 110/220 volt Motors between 1 hp and 250 hp 480 volt
Motors between 250 hp and 5,000 hp 4,160 volt
Motors above 5,000 hp 13,800 volt Steam Generators 24,000 volt Grid Interconnection Voltage 345 kV
Water and Waste Water
Makeup Water
The water supply is 50 percent from a local Publicly Owned Treatment Works and 50 percent from groundwater, and is assumed to be in sufficient quantities to meet plant makeup requirements. Makeup for potable, process, and de-ionized (DI) water is drawn from municipal sources
Process Wastewater
Water associated with gasification activity and storm water that contacts equipment surfaces is collected and treated for discharge through a permitted discharge.
Sanitary Waste Disposal
Design includes a packaged domestic sewage treatment plant with effluent discharged to the industrial wastewater treatment system. Sludge is hauled off site. Packaged plant was sized for 5.68 cubic meters per day (1,500 gallons per day)
Water Discharge Most of the process wastewater is recycled to the cooling tower basin. Blowdown is treated for chloride and metals, and discharged.

Cost and Performance Baseline for Coal-to-SNG and Ammonia (Volume 2)
89
4.1.3 The sparing philosophy for Cases 1 and 2 is provided below. Single trains are utilized throughout with exceptions where equipment capacity requires an additional train. There is no redundancy other than normal sparing of rotating equipment.
Sparing Philosophy
The plant design consists of the following major subsystems:
• Three ASUs (3 x 33%).
• Six trains of coal drying and dry feed systems (6 x 17%).
• Six trains of gasification, including gasifier and SGC (6 x 17%).
• Three trains of syngas clean-up process (3 x 33%).
• Three trains of two-stage Selexol (3 x 33%).
• Three trains of methanation reactors (3 x 33%).
• Two trains of Claus-based sulfur recovery (2 x 50%).
• One ST (1 x 100%).
4.1.4 The Siemens SNG plant without and with carbon sequestration and using Illinois No. 6 coal produces an average net output of 57 Bscf/year at 90 percent CF. The HHV conversion efficiency of the non-sequestration case is 61.4 percent and 61.3 percent for the carbon sequestration case.
Cases 1 and 2 Performance Results
Overall performance for the two plants is summarized in Exhibit 4-7, which includes auxiliary power requirements and production values. The ASU accounts for approximately 68 percent of the total auxiliary load in the non-sequestration case and 54 percent in the carbon sequestration case, distributed between the main air compressor, the oxygen compressor, and ASU auxiliaries. CO2 compression accounts for about 19 percent of the total auxiliary load for the carbon sequestration case. The AGR process accounts for about 13 percent and 11 percent of the auxiliary load for the non-sequestration and sequestration cases, respectively. All other individual auxiliary loads are less than 3 percent of the total.

Cost and Performance Baseline for Coal-to-SNG and Ammonia (Volume 2)
90
Exhibit 4-7 Cases 1 and 2 Plant Performance Summary
POWER SUMMARY (Gross Power at Generator Terminals, kWe) Case 1 Case 2
Steam Turbine Power 308,000 310,600 TOTAL POWER, kWe 308,000 310,600
AUXILIARY LOAD SUMMARY, kWe Coal Handling 700 700
Coal Milling 4,500 4,500 Slag Handling 1,140 1,140
Air Separation Unit Auxiliaries 1,000 1,000 Air Separation Unit Main Air Compressor 120,220 120,220
Oxygen Compressor 20,910 20,910 CO2 Solid Feed System Compressors 4,950 240
SNG Compressors 6,290 6,290 Methanation Plant Recycle Compressor 5,840 5,840
Gasifier Pilot Fuel Compressor and Incinerator Air Blower 300 300
CO2 Compressor 0 50,400 Boiler Feedwater Pumps 4,980 5,000
Condensate Pump 420 430 Quench Water Pump 640 640
Circulating Water Pump 6,240 6,200 Ground Water Pumps 650 640 Cooling Tower Fans 3,640 3,610
Scrubber Pumps 1,000 1,000 Acid Gas Removal 27,790 27,750
Steam Turbine Auxiliaries 100 100 Claus Plant/TGTU Auxiliaries 250 250
Claus Plant TG Recycle Compressor 280 280 Miscellaneous Balance of Plant2 3,000 3,000
Transformer Losses 1,510 1,650 TOTAL AUXILIARIES, kWe 216,350 262,090
NET POWER, kWe 91,650 48,510 SNG Production Rate, MNm3/hr (Mscf/hr) 202.9 (7,169) 202.7 (7,163)
Capacity Factor 90% 90% Net Exported Power Efficiency (HHV) 2.8% 1.5%
SNG Conversion Efficiency (HHVproduct/HHVcoal), % 61.4% 61.3% Coal to SNG Product Yield, MNm3
SNG/tonnecoal (MscfSNG/toncoal)
0.44 (14.9) 0.44 (14.8)
Coal Feed Flow Rate, kg/hr (lb/hr) 437,604 (964,752) 437,604 (964,752) Thermal Input,1 kWth 3,298,455 3,298,455
Condenser Cooling Duty, GJ/hr (MMBtu/hr) 1,709 (1,620) 1,730 (1,640) Raw Water Withdrawal, m3/min (gpm) 27.1 (7,169) 27.0 (7,123)
Raw Water Consumption, m3/min (gpm) 21.6 (5,708) 21.5 (5,672) 1 - HHV of Illinois No. 6 coal is 27,135 kJ/kg (11,666 Btu/lb) 2 - Includes plant control systems, lighting, heating, ventilating, and air conditioning (HVAC), and miscellaneous low voltage loads

Cost and Performance Baseline for Coal-to-SNG and Ammonia (Volume 2)
91
Environmental Performance The environmental targets for emissions of Hg, NOx, SO2, and PM were discussed in Section 2.5. A summary of the plant air emissions for Cases 1 and 2 is presented in Exhibit 4-8. The first emissions metric is based on coal heat input to the gasifier.
Exhibit 4-8 Cases 1 and 2 Air Emissions
kg/GJ (lb/106 Btu)
Tonne/year (ton/year)
90% capacity factor Case 1 Case 2 Case 1 Case 2
SO2 0.012
(0.027) 0.0001
(0.0003) 1,103
(1,216) 11 (12)
NOX Negligible Negligible Negligible Negligible
Particulates 0.003 (0.0071)
0.003 (0.0071) 286 (315) 286 (315)
Hg 2.46E-7 (5.71E-7)
2.46E-7 (5.71E-7)
0.023 (0.025)
0.023 (0.025)
CO2 55 (128) 2.1 (4.9) 5,169,343 (5,698,226)
195,324 (215,308)
The low level of SO2 emissions in Case 2 is achieved by capture of the sulfur in the gas by the two-stage Selexol AGR process and co-sequestration with the CO2 product stream. The clean syngas exiting the AGR process has a sulfur concentration of less than 5 ppmv in both cases. The H2S-rich regeneration gas from the AGR system is fed to a Claus plant, producing elemental sulfur. The Claus plant tail gas is treated using an amine based system to capture most of the remaining sulfur. The clean syngas from the tail gas treatment unit is combined with a slipstream of clean syngas from the Selexol process, passed through an incinerator, and the hot, inert incinerator offgas is used to dry coal prior to being vented to the atmosphere. The higher sulfur emissions in Case 1 are due to the sulfur contained in the CO2-rich stream from the Selexol process, which is vented rather than sequestered.
NOX emissions are negligible because no CT is used for power generation.
Particulate discharge to the atmosphere is limited to extremely low values by the use of a syngas scrubber and the gas washing effect of the AGR absorber. The particulate emissions represent filterable particulate only.
Ninety five percent of mercury is captured from the syngas by an activated carbon bed. CO2 emissions represent the uncontrolled (Case 1) and controlled (Case 2) discharge from the process.
The carbon balance for the two cases is shown in Exhibit 4-9. The carbon input to the plant consists of carbon in the air in addition to carbon in the coal. Carbon in the air is not used in the carbon capture equation below, but it is not neglected in the balance since Aspen accounts for air components throughout. Carbon leaves the plant as SNG product, unburned carbon in the slag,

Cost and Performance Baseline for Coal-to-SNG and Ammonia (Volume 2)
92
CO2 in the coal dryer incinerator stack gas and ASU vent gas, and the CO2 product (either vented or sequestered). The carbon capture efficiency is presented in two distinct ways. The first way defines capture as the amount of carbon in the CO2 product for sequestration relative to the amount of carbon in the coal less carbon contained in the slag, and is represented by the following fraction:
(Carbon in Product for Sequestration)/[(Carbon in the Coal)-(Carbon in Slag)] or
Non sequestration (Case 1) 381,246/(614,979-3,075)*100 = 62.3% (Case 2)
The second way does not penalize the production facility for the carbon converted to SNG product, as the end use of the SNG is unknown. In a carbon constrained scenario, the SNG may or may not be used in a scenario where carbon capture and sequestration (CCS) is implemented (or to what extent the capture is accomplished). For this method the burden of carbon mitigation falls on the end-user. The following fraction represents this scenario:
[(Carbon in Product for Sequestration) + (Carbon in SNG Product)]/[(Carbon in the Coal)-(Carbon in Slag)] or
(0 + 215,937)/(614,979 – 3,075)*100 = 35.3% (Case 1) (381,246 + 215,774)/(614,979-3,075)*100 = 97.6% (Case 2)
Exhibit 4-9 Cases 1 and 2 Carbon Balance
Carbon In, kg/hr (lb/hr) Carbon Out, kg/hr (lb/hr) Case 1 Case 2 Case 1 Case 2
Coal 278,950 (614,979)
278,950 (614,979) Slag 1,395
(3,075) 1,395 (3,075)
Air (CO2) 214 (472) 214 (473) SNG Purification Off-Gas
14,062 (31,001) N/A
ASU Vent 201 (442) 200 (442)
SNG 97,947 (215,937)
97,874 (215,774)
CO2 Selexol Vent 138,526 (305,398) N/A
CO2 Lock Hopper Vent
21,126 (46,575) 841 (1,855)
CO2 Product N/A 172,930 (381,246)
Stack 5,907 (13,023)
5,924 (13,061)
Total 279,164 (615,451)
279,164 (615,451) Total 279,164
(615,451) 279,164
(615,451)

Cost and Performance Baseline for Coal-to-SNG and Ammonia (Volume 2)
93
Exhibit 4-10 shows the sulfur balance for the plant. Sulfur input comes solely from the sulfur in the coal. Sulfur output includes the sulfur recovered in the Claus plant, sulfur emitted in the stack gas, and sulfur co-sequestered with the CO2 product. Sulfur in the slag is considered negligible. The total sulfur capture is represented by the following fraction:
(Sulfur byproduct + Sulfur in CO2 product)/Sulfur in the coal or (24,003 + 0)/24,181 = 99.3% (Case 1)
(24,010 + 157)/24,181 = 99.9% (Case 2)
Exhibit 4-10 Cases 1 and 2 Sulfur Balance
Sulfur In, kg/hr (lb/hr) Sulfur Out, kg/hr (lb/hr) Case 1 Case 2 Case 1 Case 2
Coal 10,968 (24,181)
10,968 (24,181)
Elemental Sulfur
10,888 (24,003)
10,891 (24,010)
SNG 5 (12) 5 (12)
CO2 Vent Streams/Stack 75 (166) 1 (3)
CO2 Product N/A 71 (157)
Total 10,968 (24,181)
10,968 (24,181) Total 10,968
(24,181) 10,968
(24,181)
Exhibit 4-11 shows the overall water balance for the plant. Water demand represents the total amount of water required for a particular process. Some water is recovered within the process, primarily as syngas condensate, and is re-used as internal recycle. The difference between demand and recycle is raw water withdrawal. Raw water withdrawal is defined as the water removed from the ground or diverted from a surface-water source for use in the plant and was assumed to be provided 50 percent by a POTW and 50 percent from groundwater. Raw water withdrawal can be represented by the water metered from a raw water source and used in the plant processes for any and all purposes, such as cooling tower makeup, BFW makeup, quench system makeup, and slag handling makeup. The difference between water withdrawal and process water discharge is defined as water consumption and can be represented by the portion of the raw water withdrawn that is evaporated, transpired, incorporated into products or otherwise not returned to the water source from which it was withdrawn. Water consumption represents the net impact of the plant process on the water source.

Cost and Performance Baseline for Coal-to-SNG and Ammonia (Volume 2)
94
Exhibit 4-11 Cases 1 and 2 Water Balance
Case 1 Case 2 Water Demand, m3/min (gpm)
Slag Handling 0.95 (251) 0.95 (251) Quench/Wash 4.2 (1,114) 4.2 (1,113) Condenser Makeup 5.9 (1,548) 5.9 (1,547) Gasifier Steam 1.0 (274) 1.0 (274) Shift Steam 4.4 (1,171) 4.4 (1,170) BFW Makeup 0.39 (103) 0.39 (103) Cooling Tower 24.3 (6,417) 24.1 (6,370)
Total 35.3 (9,330) 35.1 (9,282) Internal Recycle, m3/min (gpm)
Slag Handling 0.95 (251) 0.95 (251) Quench/Wash 4.2 (1,114) 4.2 (1,113) Condenser Makeup 0.0 (0) 0.0 (0) Cooling Tower 3.0 (796) 3.0 (794) Water from Coal Drying 0.0 (0) 0.0 (0) BFW Blowdown 0.39 (103) 0.39 (103) SWS Blowdown 0.71 (187) 0.71 (187) SWS Excess 1.9 (505) 1.9 (504)
Total 8.2 (2,161) 8.2 (2,159) Raw Water Withdrawal, m3/min (gpm)
Slag Handling 0.0 (0) 0.0 (0) Quench/Wash 0.0 (0) 0.0 (0) Condenser Makeup 5.9 (1,548) 5.9 (1,547) Gasifier Steam 1.0 (274) 1.0 (274) Shift Steam 4.4 (1,171) 4.4 (1,170) BFW Makeup 0.39 (103) 0.39 (103) Cooling Tower 21.3 (5,621) 21.1 (5,576)
Total 27.1 (7,169) 27.0 (7,123) Process Water Discharge, m3/min (gpm)
SWS Blowdown 0.07 (19) 0.07 (19) Cooling Tower Blowdown 5.5 (1,443) 5.4 (1,433)
Total 5.5 (1,462) 5.5 (1,451) Raw Water Consumption, m3/min (gpm)
Slag Handling 0.0 (0) 0.0 (0) Quench/Wash 0.0 (0) 0.0 (0) SWS Blowdown -0.07 (-19) -0.07 (-19) Condenser Makeup 5.9 (1,548) 5.9 (1,547) Cooling Tower 15.8 (4,178) 15.7 (4,144)
Total 21.6 (5,708) 21.5 (5,672)

Cost and Performance Baseline for Coal-to-SNG and Ammonia (Volume 2)
95
Heat and Mass Balance Diagrams Heat and mass balance diagrams are shown for the following subsystems in Exhibit 4-12 through Exhibit 4-17:
• Coal gasification and ASU
• Syngas cleanup (including sulfur recovery and tail gas recycle)
• Methanation, SNG purification, compression, and power cycle
An overall plant energy balance is provided in tabular form in Exhibit 4-18 for the two cases.

Cost and Performance Baseline for Coal-to-SNG and Ammonia (Volume 2)
96
Exhibit 4-12 Case 1 Gasification and ASU Heat and Mass Balance
Claus Tail Gas
NOTES:
1. ENTHALPY REFERENCE POINT IS NATURAL STATE AT 32 °F AND 0.08865 PSIA
DOE/NETL
ILLINOIS NO. 6 SNG PLANTCASE 1
HEAT AND MATERIAL FLOW DIAGRAM
COST AND PERFORMANCE BASELINE VOL. 2CASE 1
ASU AND GASIFICATION
DWG. NO.
BL-HMB-CS-1-PG-1
PLANT PERFORMANCE SUMMARY
LEGEND
P ABSOLUTE PRESSURE, PSIAF TEMPERATURE, °FW FLOWRATE, LBM/HR H ENTHALPY, BTU/LBM
MWE POWER, MEGAWATTS ELECTRICAL
PAGES
1 OF 3
Ambient Air
IntercooledAir Compressor
ElevatedPressure
ASU
IntercooledOxygen Compressor
Milled Coal
ASUVent
SlagRemoval
Slag
GROSS PLANT POWER: 308 MWEAUXILIARY LOAD: 216 MWENET PLANT POWER: 92 MWESNG PRODUCTION: 7,169 MSCF/HR
Dried CoalCoal
Feeding
Steam
CO2 to Lock Hoppers
BoostCompressor
Siemens Gasifier
964,752 W
3,250,361 W59.0 T14.7 P13.3 H
724,793 W90.0 T
125.0 P11.6 H
724,793 W516.2 T740.0 P107.1 H
136,831 W650.0 T740.0 P
1,316.8 H
96,625 W
ENG UNITS
To Claus Plant
10,665 W90.0 T
125.0 P11.6 H
2,501,177 W74.4 T16.4 P13.1 H
325,090 W290.0 T14.7 P
359.4 H
272,542 W2,332.4 T
14.7 P810.0 H
SyngasQuenchCooler
Syngas to Scrubber
SHSteam
4
1
106
3
13
5
2
Quench Water
15
Lock HopperVent
170,146 W
340,292 W181.3 T815.0 P13.5 H
11
340,292 W60.0 T
149.7 P1.8 H
14
556,880 W
SHSteam
SHSteam
2,406,768 W499.7 T564.7 P493.7 H
Air
Oxygen
Nitrogen
Coal/Char/Slurry/Slag
Sour Gas
Sour Water
Water
Steam
CO2
Tail Gas/Flue Gas
Pilot Fuel24
2,540 W176.8 T740.0 P101.1 H
1,082,350 W65.2 T
815.0 P2,014.4 H
Coal Dryer
Coal Dryer Incinerator
Incinerator FanCombustion Air
Syngas
Synthesis Gas
Coal DryerStack Gas
23
9
7
8
35
223,464 W59.0 T14.7 P13.3 H
912,204 W
272,542 W74.2 T14.9 P29.1 H
14,028 W87.0 T
469.6 P37.1 H
12
HPBFW

Cost and Performance Baseline for Coal-to-SNG and Ammonia (Volume 2)
97
Exhibit 4-13 Case 1 Gas Cleanup Heat and Mass Balance
Mercury Removal
KnockOut
DrumRaw Syngasto Scrubber
SourDrum
To Water Treatment
Makeup Water
CatalyticReactorBeds
HighTemperature
Shift
Blowdown
FromASULP CO2
ShiftSteam
HP BFW
SyngasCoolers
SourStripper
Two-StageSelexol
Clean Gas
CO2
Acid Gas
SyngasScrubber Condensate
To DeaeratorCondensate
585,682 W550.0 T600.0 P
1,270.5 H
2,329,375 W418.4 T544.7 P434.9 H
2,406,768 W499.7 T564.7 P493.7 H
2,329,375 W360.8 T554.7 P412.1 H
2,295,714 W94.1 T
469.7 P19.1 H
769,007 W87.0 T
469.6 P37.1 H
66,204 W119.0 T23.7 P39.5 H
1,120,211 W64.8 T
135.0 P3.4 H
935,051 W339.3 T115.0 P339.2 H
2,915,056 W516.6 T519.7 P435.3 H
752,440 W87.0 T
469.6 P37.1 H
24,003 W
5,032 W293.0 T65.0 P
1,036.0 H
10,665 W90.0 T
125.0 P11.6 H
NOTES:
1. ENTHALPY REFERENCE POINT IS NATURAL STATE AT 32 °F AND 0.08865 PSIA
DOE/NETL
ILLINOIS NO. 6 SNG PLANTCASE 1
HEAT AND MATERIAL FLOW DIAGRAM
COST AND PERFORMANCE BASELINE VOL. 2CASE 1
GAS CLEANUP
DWG. NO.
BL-HMB-CS-1-PG-2
PLANT PERFORMANCE SUMMARY
LEGEND
P ABSOLUTE PRESSURE, PSIAF TEMPERATURE, °FW FLOWRATE, LBM/HR H ENTHALPY, BTU/LBM
MWE POWER, MEGAWATTS ELECTRICAL
Air
Oxygen
Nitrogen
Coal/Char/Slurry/Slag
Synthesis Gas
PAGES
2 OF 3
Sour Gas
Sour Water
Water
Steam
GROSS PLANT POWER: 308 MWEAUXILIARY LOAD: 216 MWENET PLANT POWER: 92 MWESNG PRODUCTION: 7,169 MSCF/HR
1,983,586 W418.4 T544.7 P434.9 H
345,789 W
22
20
15
33
CO2
Tail Gas/Flue Gas
16
17
19345,789 W
418.9 T534.7 P434.7 H
2,284,798 W95.0 T
479.7 P19.5 H
High TemperatureMethanation Reactor
Pre-heater
Tail Gas Cleanup Unit
3
21
CO2 to LockHoppers
VentedCO2 Product
Claus Plant
Tail Gas
Furnace
Sulfur
32
31
HP CO2
30
894,215 W60.0 T
135.0 P3.8 H
566,288 W60.0 T
149.7 P1.8 H
340,292 W60.0 T
149.7 P1.8 H
Syngas toMethanation
BoostCompressor
2,540 W
Pilot Fuelto Gasifier
2,540 W176.8 T740.0 P101.1 H
24 25
Condensatefrom Methnation
HT ShiftPre-heater
57,897 W450.0 T12.3 P
517.0 H
34
10,916 W70.0 T
474.5 P-5.9 H
Tail GasCompressor
COS Hydrolysis
18
Incinerator Fuel23
To Coal Dryer
35
14,028 W87.0 T
469.6 P37.1 H
272,542 W
74.2 T14.9 P29.1 H

Cost and Performance Baseline for Coal-to-SNG and Ammonia (Volume 2)
98
Exhibit 4-14 Case 1 Methanation and Power Block Heat and Mass Balance
Steam Seal Regulator
65 PSIA HeaderSteam Injection
To Gasifier
Make-up
GlandSteam
CondenserCondensate to Preheating
CondensatePump
2,564,903 W101.1 T
1.0 P69.1 H
774,218 W
1,663,785 W1,050.0 T1,814.7 P1,510.4 H
2,564,903 W102.5 T120.0 P70.8 H
1,400 W
1,400 W212.0 T14.7 P
179.9 H
136,831 W650.0 T740.0 P
1,316.8 H
NOTES:
1. ENTHALPY REFERENCE POINT IS NATURAL STATE AT 32 °F AND 0.08865 PSIA
DOE/NETL
ILLINOIS NO. 6 SNG PLANTCASE 5
HEAT AND MATERIAL FLOW DIAGRAM
COST AND PERFORMANCE BASELINE VOL. 2CASE 1
METHANATION AND POWER BLOCK
DWG. NO.
BL-HMB-CS-1-PG-3
PLANT PERFORMANCE SUMMARY
LEGEND
P ABSOLUTE PRESSURE, PSIAF TEMPERATURE, °FW FLOWRATE, LBM/HR H ENTHALPY, BTU/LBM
MWE POWER, MEGAWATTS ELECTRICAL
Air
Oxygen
Nitrogen
Coal/Char/Slurry/Slag
Synthesis Gas
PAGES
3 OF 3
Sour Gas
Sour Water
Water
Steam
GROSS PLANT POWER: 308 MWEAUXILIARY LOAD: 216 MWENET PLANT POWER: 92 MWESNG PRODUCTION: 7,169 MSCF/HR
Flue Gas
Deaerator
HT Reactor
LP TURBINE GENERATORHP
TURBINEIP
TURBINE
HOT WELL
AIR-COOLED CONDENSER CONDENSER
IP Pump
To Shift SteamProduction
LP Pump
250 PSIAAttemperating Water
HP Pump
RecycleCompressor
Syngas fromSelexol Unit
KnockOut
Drum
Molecular Sieve
Purification Unit
Multistage Intercooled
SNG Compressor
Clean UpReatorHT Reactor
PurificationOff-Gas
SNGProduct
Condensate toSour Drum
ReactorPre-heater
IP BFW
SH Shift Steam
IP/LP BFW
IP/LP Steam IP Steam IP BFW
36
37
1,712,037 W
752,440 W87.0 T
469.6 P37.1 H
25
572.0 T447.5 P631.3 H
587.8 T475.0 P640.4 H
572.0 T464.6 P567.8 H
1,290.3 T457.5 P
1,103.4 H
2,114,905 W
1,035.6 T436.8 P971.4 H
392.0 T426.8 P583.3 H
655.4 T416.1 P782.6 H
335.0 T406.1 P413.2 H
428,046 W95.0 T
396.1 P18.1 H
114,489 W95.0 T20.1 P21.0 H 313,557 W
95.0 T381.0 P20.6 H
95.0 T899.5 P
5.7 H
799,492 W278.9 T450.0 P248.5 H
672,549 W
235,000 W298.0 T65.0 P
1,178.6 H
1,543,774 W501.9 T65.0 P
1,283.0 H
IP BFW
14,034 W278.8 T379.0 P248.2 H
26
27 28 29
10,910 W657.8 T18.0 P
1,362.5 H
To Syngas CoolerSH Steam from Syngas Cooler
Reheater(Syngas Cooler)
P-640
AttemperationWater
1,607,011 W994.4 T501.4 P
1,516.9 H
21,128 W

Cost and Performance Baseline for Coal-to-SNG and Ammonia (Volume 2)
99
Exhibit 4-15 Case 2 Gasifier and ASU Heat and Mass Balance
Claus Tail Gas
NOTES:
1. ENTHALPY REFERENCE POINT IS NATURAL STATE AT 32 °F AND 0.08865 PSIA
DOE/NETL
ILLINOIS NO. 6 SNG PLANTW/ CO2 CAPTURE
CASE 2
HEAT AND MATERIAL FLOW DIAGRAM
COST AND PERFORMANCE BASELINE VOL. 2CASE 2
ASU AND GASIFICATION
DWG. NO.
BL-HMB-CS-2-PG-1
PLANT PERFORMANCE SUMMARY
LEGEND
P ABSOLUTE PRESSURE, PSIAF TEMPERATURE, °FW FLOWRATE, LBM/HR H ENTHALPY, BTU/LBM
MWE POWER, MEGAWATTS ELECTRICAL
PAGES
1 OF 3
Ambient Air
IntercooledAir Compressor
ElevatedPressure
ASU
IntercooledOxygen Compressor
Milled Coal
ASUVent
SlagRemoval
Slag
GROSS PLANT POWER: 311 MWEAUXILIARY LOAD: 262 MWENET PLANT POWER: 49 MWESNG PRODUCTION: 7,163 MSCF/HR
Dried CoalCoal
Feeding
Steam
CO2 to Lock Hoppers
BoostCompressor
Siemens Gasifier
964,752 W
3,250,240 W59.0 T14.7 P13.3 H
724,742 W90.0 T
125.0 P11.6 H
136,831 W650.0 T740.0 P
1,316.8 H
1,849,838 W2,732.0 T
604.7 P1,135.4 H
96,625 W
ENG UNITS
To Claus Plant
10,688 W90.0 T
125.0 P11.6 H
2,501,083 W74.4 T16.4 P13.1 H
326,368 W290.0 T14.7 P
358.2 H
273,820 W2,324.7 T
14.7 P806.5 H
SyngasQuenchCooler
Raw Syngasto Scrubber
SHSteam
1
106
3
13
5
2
Quench Water
15
6,787 W
340,292 W179.4 T815.0 P11.8 H
11
340,292 W165.5 T750.0 P
9.5 H
14
556,684 W
SHSteam
SHSteam
2,406,522 W499.7 T564.7 P493.6 H
Air
Oxygen
Nitrogen
Coal/Char/Slurry/Slag
Sour Gas
Sour Water
Water
Steam
CO2
Tail Gas/Flue Gas
Pilot Fuel24
2,540 W176.8 T740.0 P100.9 H
1,082,350 W
Coal Dryer
Coal Dryer Incinerator
Incinerator FanCombustion Air
Syngas
Synthesis Gas
Coal DryerStack Gas
23
9
7
8
35
224,625 W59.0 T14.7 P13.3 H
912,204 W
35,132 W123.0 T14.9 P
103.4 H
14,063 W87.0 T
469.6 P37.1 H
12
HP Vent toCO2 Compressor
Lock HopperAtmospheric Vent
LP Vent toCO2 Compressor
135,586 W 27,773 W
4
HPBFW

Cost and Performance Baseline for Coal-to-SNG and Ammonia (Volume 2)
100
Exhibit 4-16 Case 2 Gas Cleanup Heat and Mass Balance
SNG PurificationOff Gas
Mercury Removal
KnockOut
DrumRaw Syngasto Scrubber
SourDrum
To Water Treatment
Makeup Water
CatalyticReactorBeds
HighTemperature
Shift
Blowdown
FromASU
ShiftSteam
HP BFW
SyngasCoolers
SourStripper
Two-StageSelexol
Clean Gas
CO2
Acid Gas
SyngasScrubber Condensate
To DeaeratorCondensate
585,098 W550.0 T600.0 P
1,270.5 H
2,329,035 W418.4 T544.7 P434.8 H
2,406,522 W499.7 T564.7 P493.6 H
2,329,035 W360.8 T554.7 P412.0 H
2,294,540 W94.1 T
469.7 P19.1 H
769,577 W87.0 T
469.6 P37.1 H
66,130 W119.0 T23.7 P39.5 H
340,292 W165.5 T750.0 P
9.5 H
934,234 W339.3 T115.0 P339.2 H
2,914,132 W516.7 T519.7 P435.4 H
752,974 W87.0 T
469.6 P37.1 H
24,010 W
5,180 W292.0 T65.0 P
1,006.8 H
10,688 W90.0 T
125.0 P11.6 H
NOTES:
1. ENTHALPY REFERENCE POINT IS NATURAL STATE AT 32 °F AND 0.08865 PSIA
DOE/NETL
ILLINOIS NO. 6 SNG PLANTW/ CO2 CAPATURE
CASE 2
HEAT AND MATERIAL FLOW DIAGRAM
COST AND PERFORMANCE BASELINE VOL. 2CASE 2
GAS CLEANUP
DWG. NO.
BL-HMB-CS-2-PG-2
PLANT PERFORMANCE SUMMARY
LEGEND
P ABSOLUTE PRESSURE, PSIAF TEMPERATURE, °FW FLOWRATE, LBM/HR H ENTHALPY, BTU/LBM
MWE POWER, MEGAWATTS ELECTRICAL
Air
Oxygen
Nitrogen
Coal/Char/Slurry/Slag
Synthesis Gas
PAGES
2 OF 3
Sour Gas
Sour Water
Water
Steam
GROSS PLANT POWER: 311 MWEAUXILIARY LOAD: 262 MWENET PLANT POWER: 49 MWESNG PRODUCTION: 7,163 MSCF/HR
1,980,527 W418.4 T544.7 P434.8 H
348,508 W
22
20
15
33
CO2
Tail Gas/Flue Gas
16
17
19348,508 W
419.0 T534.7 P434.6 H
2,283,630 W95.0 T
479.7 P19.5 H
High TemperatureMethanation Reactor
Pre-heater
Tail Gas Cleanup Unit
3
21
CO2 toSequestration
CO2 toLock Hoppers
Claus Plant
Tail Gas
Furnace
Sulfur
32
31
1,395,138 W
90.0 T2,215.0 P
-92.9 H
Syngas toMethanation
BoostCompressor
2,540 W
Pilot Fuelto Gasifier
2,540 W176.8 T740.0 P100.9 H
24
25
Condensatefrom Methnation
HT ShiftPre-heater
57,988 W450.0 T12.3 P
516.9 H
34 10,910 W70.0 T
474.5 P-5.9 H
COS Hydrolysis
18
Incinerator Fuel23
To Coal Dryer
27
35
14,063 W87.0 T
469.6 P37.1 H
35,132 W123.0 T14.9 P
103.4 H
Multistage Intercooled CO2
Compressor
30
HP CO2
LP LockHopper Vent HP Lock
Hopper Vent
LP CO2
116,328 W95.0 T20.1 P20.8 H
27,773 W
135,586 W
701,234 W83.4 T
149.7 P6.7 H
1,037,286 W51.9 T16.7 P6.5 HTail Gas
Compressor

Cost and Performance Baseline for Coal-to-SNG and Ammonia (Volume 2)
101
Exhibit 4-17 Case 2 Methanation and Power Block Heat and Mass Balance
Steam Seal Regulator
65 PSIA HeaderSteam Injection
To Gasifier
Make-up
GlandSteam
CondenserCondensate to Preheating
CondensatePump
2,582,704 W101.1 T
1.0 P69.1 H
773,525 W
1,676,488 W1,050.0 T1,814.7 P1,510.4 H
2,582,704 W102.5 T120.0 P70.7 H
1,400 W
1,400 W212.0 T14.7 P
179.9 H
136,831 W650.0 T740.0 P
1,316.8 H
NOTES:
1. ENTHALPY REFERENCE POINT IS NATURAL STATE AT 32 °F AND 0.08865 PSIA
DOE/NETL
ILLINOIS NO. 6 SNG PLANTW/ CO2 CAPTURE
CASE 2
HEAT AND MATERIAL FLOW DIAGRAM
COST AND PERFORMANCE BASELINE VOL. 2CASE 2
METHANATION AND POWER BLOCK
DWG. NO.
BL-HMB-CS-2-PG-3
PLANT PERFORMANCE SUMMARY
LEGEND
P ABSOLUTE PRESSURE, PSIAF TEMPERATURE, °FW FLOWRATE, LBM/HR H ENTHALPY, BTU/LBM
MWE POWER, MEGAWATTS ELECTRICAL
Air
Oxygen
Nitrogen
Coal/Char/Slurry/Slag
Synthesis Gas
PAGES
3 OF 3
Sour Gas
Sour Water
Water
Steam
GROSS PLANT POWER: 311 MWEAUXILIARY LOAD: 262 MWENET PLANT POWER: 49 MWESNG PRODUCTION: 7,163 MSCF/HR
Flue Gas
Deaerator
HT Reactor
LP TURBINE GENERATORHP
TURBINEIP
TURBINE
HOT WELL
AIR-COOLED CONDENSER CONDENSER
IP Pump
To Shift SteamProduction
LP Pump
250 PSIAAttemperating Water
HP Pump
RecycleCompressor
Syngas fromSelexol Unit
KnockOut
Drum
Molecular Sieve
Purification Unit
Multistage Intercooled
SNG Compressor
Clean UpReatorHT Reactor
Purification Off-Gas(To CO2 Compressor)
SNGProduct
Condensate toSour Drum
ReactorPre-heater
SH Steam fromSyngas Cooler
IP BFW
SH ShiftSteam
IP/LP BFW
IP/LP Steam IP Steam IP BFW
36
37
1,725,670 W
752,974 W87.0 T
469.6 P37.1 H
25
572.0 T447.5 P629.7 H
587.8 T475.0 P638.8 H
572.0 T464.6 P566.5 H
1,290.2 T457.5 P
1,101.1 H
2,118,638 W
1,035.8 T436.8 P969.2 H
392.0 T426.8 P581.4 H
655.0 T416.1 P780.0 H
335.0 T406.1 P412.8 H
429,662 W95.0 T
396.1 P18.1 H
116,328 W95.0 T20.1 P20.8 H 313,334 W
95.0 T381.0 P20.6 H
95.0 T899.5 P
5.7 H
788,093 W288.8 T450.0 P258.6 H
672,225 W
239,143 W298.0 T65.0 P
1,178.6 H
1,558,124 W500.0 T65.0 P
1,282.1 H
IP BFW
13,827 W288.7 T379.0 P258.3 H
26
27 28 29
10,912 W657.6 T18.0 P
1,362.4 H
To Syngas Cooler
AttemperationWater
To Gasifier
Reheater(Syngas Cooler)
1,620,752 W991.8 T501.4 P
1,515.5 H
21,860 W

Cost and Performance Baseline for Coal-to-SNG and Ammonia (Volume 2)
102
Exhibit 4-18 Cases 1 and 2 Energy Balance
HHV Sensible + Latent Power Total Case 1 Case 2 Case 1 Case 2 Case 1 Case 2 Case 1 Case 2 Heat In, GJ/hr (MMBtu/hr)
Coal 11,874 (11,255)
11,874 (11,255) 12.1 (11.5) 12.1 (11.5) 0 (0) 0 (0) 11,887 (11,266) 11,887 (11,266)
ASU Air 0 (0) 0 (0) 48.7 (46.2) 49.6 (47.0) 0 (0) 0 (0) 49 (46) 50 (47) Raw Water Makeup 0 (0) 0 (0) 102.0 (96.7) 101.4 (96.1) 0 (0) 0 (0) 102 (97) 101 (96) Auxiliary Power 0 (0) 0 (0) 0.0 (0.0) 0.0 (0.0) 779 (738) 944 (894) 779 (738) 944 (894)
Totals 11,874 (11,255)
11,874 (11,255) 162.9 (154.4) 163.1 (154.6) 779 (738) 944 (894) 12,816 (12,147) 12,981 (12,304)
Heat Out, GJ/hr (MMBtu/hr) ASU Intercoolers 0 (0) 0 (0) 325 (308) 325 (308) 0 (0) 0 (0) 325 (308) 325 (308) ASU Vent 0 (0) 0 (0) 34.7 (32.9) 34.7 (32.9) 0 (0) 0 (0) 35 (33) 35 (33) Slag 46 (43) 46 (43) 79.1 (75.0) 79.1 (75.0) 0 (0) 0 (0) 125 (118) 125 (118) Coal Drying Stack Gas 0 (0) 0 (0) 123.3 (116.8) 123.3 (116.9) 0 (0) 0 (0) 123 (117) 123 (117) Sulfur 101 (96) 101 (96) 1.2 (1.2) 1.2 (1.2) 0 (0) 0 (0) 102 (97) 102 (97) Auxiliary Cooling Loads 0 (0) 0 (0) 882 (836) 842 (798) 0 (0) 0 (0) 882 (836) 842 (798) CO2 0 (0) 0 (0) 6.5 (6.1) -136.7 (-129.6) 0 (0) 0 (0) 6 (6) -137 (-130) Cooling Tower Blowdown 0 (0) 0 (0) 40.6 (38.5) 40.3 (38.2) 0 (0) 0 (0) 41 (38) 40 (38)
SNG 7,272 (6,892)
7,266 (6,887) 1.9 (1.8) 1.9 (1.8) 0 (0) 0 (0) 7,274 (6,894) 7,268 (6,888)
SNG Purification Off-Gas 0 (0) 0 (0) 3 (2) 3 (2) 0 (0) 0 (0) 3 (2) 3 (2) Condenser 0 (0) 0 (0) 1,710 (1,621) 1,727 (1,637) 0 (0) 0 (0) 1,710 (1,621) 1,727 (1,637)
Process Losses* 0 (0) 0 (0) 1,082 (1,026) 1,410 (1,336) 0 (0) 0 (0) 1,082 (1,026) 1,410 (1,336)
Power 0 (0) 0 (0) 0.0 (0.0) 0.0 (0.0) 1,109 (1,051)
1,118 (1,060) 1,109 (1,051) 1,118 (1,060)
Totals 7,418 (7,031)
7,412 (7,026) 4,289 (4,065) 4,450 (4,218) 1,109
(1,051) 1,118
(1,060) 12,816 (12,147) 12,981 (12,304)
* Includes other energy losses not explicitly accounted for in the model.

Cost and Performance Baseline for Coal-to-SNG and Ammonia (Volume 2)
103
4.1.5 Major equipment items for the Siemens gasifier SNG plant without and with carbon sequestration using Illinois No. 6 coal are shown in the following tables. The accounts used in the equipment list correspond to the account numbers used in the cost estimates in Section
Cases 1 and 2 Equipment Lists
4.1.6. In general, the design conditions include a 10 percent contingency for flows and heat duties and a 21 percent contingency for heads on pumps and fans.

Cost and Performance Baseline for Coal-to-SNG and Ammonia (Volume 2)
104
ACCOUNT 1 COAL HANDLING Equipment
No. Description Type Operating Qty. Spares Case 1 Design
Condition Case 2 Design
Condition
1 Bottom Trestle Dumper and Receiving Hoppers
N/A 2 0 181 tonne (200 ton) 181 tonne (200 ton)
2 Feeder Belt 2 0 572 tonne/hr (630 tph) 572 tonne/hr (630 tph)
3 Conveyor No. 1 Belt 1 0 1,134 tonne/hr (1,250 tph)
1,134 tonne/hr (1,250 tph)
4 Transfer Tower No. 1 Enclosed 1 0 N/A N/A
5 Conveyor No. 2 Belt 1 0 1,134 tonne/hr (1,250 tph)
1,134 tonne/hr (1,250 tph)
6 As-Received Coal Sampling System Two-stage 1 0 N/A N/A
7 Stacker/Reclaimer Traveling, linear 1 0 1,134 tonne/hr
(1,250 tph) 1,134 tonne/hr
(1,250 tph) 8 Reclaim Hopper N/A 2 1 91 tonne (100 ton) 91 tonne (100 ton) 9 Feeder Vibratory 2 1 363 tonne/hr (400 tph) 363 tonne/hr (400 tph)
10 Conveyor No. 3 Belt w/ tripper 1 0 726 tonne/hr (800 tph) 726 tonne/hr (800 tph)
11 Crusher Tower N/A 1 0 N/A N/A
12 Coal Surge Bin w/ Vent Filter Dual outlet 2 0 363 tonne (400 ton) 363 tonne (400 ton)
13 Crusher Impactor reduction 2 0 8 cm x 0 - 3 cm x 0
(3" x 0 - 1-1/4" x 0) 8 cm x 0 - 3 cm x 0 (3" x 0 - 1-1/4" x 0)
14 As-Fired Coal Sampling System
Swing hammer 1 1 N/A N/A

Cost and Performance Baseline for Coal-to-SNG and Ammonia (Volume 2)
105
Equipment No. Description Type Operating
Qty. Spares Case 1 Design Condition
Case 2 Design Condition
15 Conveyor No. 4 Belt w/tripper 1 0 726 tonne/hr (800 tph) 726 tonne/hr (800 tph)
16 Transfer Tower No. 2 Enclosed 1 0 N/A N/A
17 Conveyor No. 5 Belt w/ tripper 1 0 726 tonne/hr (800 tph) 726 tonne/hr (800 tph)
18 Coal Silo w/ Vent Filter and Slide Gates Field erected 3 0 1,633 tonne (1,800 ton) 1,633 tonne (1,800 ton)
ACCOUNT 2 COAL PREPARATION AND FEED
Equipment No. Description Type Operating
Qty. Spares Case 1 Design Condition
Case 2 Design Condition
1 Feeder Vibratory 6 0 82 tonne/hr (90 tph) 82 tonne/hr (90 tph)
2 Conveyor No. 6 Belt w/tripper 3 0 163 tonne/hr (180 tph) 163 tonne/hr (180 tph)
3 Roller Mill Feed Hopper Dual Outlet 3 0 318 tonne (350 ton) 318 tonne (350 ton)
4 Weigh Feeder Belt 6 0 82 tonne/hr (90 tph) 82 tonne/hr (90 tph) 5 Pulverizer Rotary 6 0 82 tonne/hr (90 tph) 82 tonne/hr (90 tph)
ACCOUNT 3 FEEDWATER AND MISCELLANEOUS SYSTEMS AND EQUIPMENT
Equipment No. Description Type Operating
Qty. Spares Case 1 Design Condition
Case 2 Design Condition
1 Demineralized Water Storage Tank
Vertical, cylindrical, outdoor
3 0 635,949 liters (168,000 gal)
635,949 liters (168,000 gal)

Cost and Performance Baseline for Coal-to-SNG and Ammonia (Volume 2)
106
Equipment No. Description Type Operating
Qty. Spares Case 1 Design Condition
Case 2 Design Condition
2 Condensate Pumps Vertical canned 2 1
10,751 lpm @ 91 m H2O (2,840 gpm @ 300 ft
H2O)
10,826 lpm @ 91 m H2O (2,860 gpm @ 300 ft
H2O)
3 Deaerator Horizontal spray type 2 0 806,034 kg/hr
(1,777,000 lb/hr) 806,487 kg/hr
(1,778,000 lb/hr)
4 Intermediate Pressure Feedwater Pump
Horizontal centrifugal, single stage
2 1 6,359 lpm @ 341 m H2O
(1,680 gpm @ 1120 ft H2O)
6,322 lpm @ 335 m H2O (1,670 gpm @ 1100 ft
H2O)
5 High Pressure Feedwater Pump
Barrel type, multi-stage, centrifugal
2 1 HP water: 7,419 lpm @
1,676 m H2O (1,960 gpm @ 5,500 ft H2O)
HP water: 7,457 lpm @ 1,676 m H2O (1,970
gpm @ 5,500 ft H2O)
6 Auxiliary Boiler Shop fabricated, water tube
1 0
18,144 kg/hr, 2.8 MPa, 343°C
(40,000 lb/hr, 400 psig, 650°F)
18,144 kg/hr, 2.8 MPa, 343°C
(40,000 lb/hr, 400 psig, 650°F)
7 Service Air Compressors
Flooded Screw 3 1 28 m3/min @ 0.7 MPa
(1,000 scfm @ 100 psig) 28 m3/min @ 0.7 MPa
(1,000 scfm @ 100 psig)
8 Instrument Air Dryers Duplex, regenerative 3 1 28 m3/min (1,000 scfm) 28 m3/min (1,000 scfm)
9 Closed Cycle Cooling Heat Exchangers
Plate and frame 2 0 664 GJ/hr (629
MMBtu/hr) 642 GJ/hr (608
MMBtu/hr) each
10 Closed Cycle Cooling Water Pumps
Horizontal centrifugal 2 1
238,102 lpm @ 21 m H2O
(62,900 gpm @ 70 ft H2O)
230,153 lpm @ 21 m H2O
(60,800 gpm @ 70 ft H2O)

Cost and Performance Baseline for Coal-to-SNG and Ammonia (Volume 2)
107
Equipment No. Description Type Operating
Qty. Spares Case 1 Design Condition
Case 2 Design Condition
11 Engine-Driven Fire Pump
Vertical turbine, diesel engine
1 1 3,785 lpm @ 107 m H2O
(1,000 gpm @ 350 ft H2O)
3,785 lpm @ 107 m H2O (1,000 gpm @ 350 ft
H2O)
12 Fire Service Booster Pump
Two-stage horizontal centrifugal
1 1 2,650 lpm @ 76 m H2O (700 gpm @ 250 ft H2O)
2,650 lpm @ 76 m H2O (700 gpm @ 250 ft H2O)
13 Raw Water Pumps Stainless steel, single suction
2 1 7,533 lpm @ 18 m H2O
(1,990 gpm @ 60 ft H2O)
7,457 lpm @ 18 m H2O (1,970 gpm @ 60 ft
H2O)
14 Ground Water Pumps Stainless steel, single suction
4 1 3,748 lpm @ 268 m H2O (990 gpm @ 880 ft H2O)
3,748 lpm @ 268 m H2O (990 gpm @ 880 ft H2O)
15 Filtered Water Pumps Stainless steel, single suction
2 1 6,095 lpm @ 49 m H2O
(1,610 gpm @ 160 ft H2O)
6,095 lpm @ 49 m H2O (1,610 gpm @ 160 ft
H2O)
16 Filtered Water Tank Vertical, cylindrical 2 0 2,933,694 liter
(775,000 gal) 2,929,909 liter (774,000 gal)
17 Makeup Water Demineralizer
Anion, cation, and mixed bed
2 0 2,688 lpm (710 gpm) 2,688 lpm (710 gpm)
18 Liquid Waste Treatment System 1 0 10 years, 24-hour storm 10 years, 24-hour storm

Cost and Performance Baseline for Coal-to-SNG and Ammonia (Volume 2)
108
ACCOUNT 4 GASIFIER, ASU, AND ACCESSORIES INCLUDING LOW TEMPERATURE HEAT RECOVERY
Equipment No. Description Type Operating
Qty. Spares Case 1 Design Condition
Case 2 Design Condition
1 Gasifier
Pressurized dry-feed, entrained bed
6 0 1,905 tonne/day, 4.2
MPa (2,100 tpd, 615 psia)
1,905 tonne/day, 4.2 MPa
(2,100 tpd, 615 psia)
2 Synthesis Gas Cooler
Convective spiral-wound tube boiler
6 0 200,034 kg/hr (441,000 lb/hr)
200,034 kg/hr (441,000 lb/hr)
3 Syngas Scrubber Including Sour Water Stripper
Vertical upflow 6 0 200,034 kg/hr
(441,000 lb/hr) 200,034 kg/hr
(441,000 lb/hr)
4 Raw Gas Coolers
Shell and tube with condensate drain
12 0 415,491 kg/hr (916,000 lb/hr)
415,491 kg/hr (916,000 lb/hr)
5 Raw Gas Knockout Drum
Vertical with mist eliminator
3 0
380,110 kg/hr, 35°C, 3.3 MPa
(838,000 lb/hr, 95°F, 485 psia)
379,657 kg/hr, 35°C, 3.3 MPa
(837,000 lb/hr, 95°F, 485 psia)
6 Flare Stack
Self-supporting, carbon steel, stainless steel top, pilot ignition
3 0 400,068 kg/hr (882,000 lb/hr) syngas
400,068 kg/hr (882,000 lb/hr) syngas

Cost and Performance Baseline for Coal-to-SNG and Ammonia (Volume 2)
109
Equipment No. Description Type Operating
Qty. Spares Case 1 Design Condition
Case 2 Design Condition
7 ASU Main Air Compressor
Centrifugal, multi-stage 3 0
7,391 m3/min @ 1.3 MPa
(261,000 scfm @ 190 psia)
7,391 m3/min @ 1.3 MPa
(261,000 scfm @ 190 psia)
8 Cold Box Vendor design 3 0
2,903 tonne/day (3,200 tpd) of
99% purity oxygen
2,903 tonne/day (3,200 tpd) of
99% purity oxygen
9 Oxygen Compressor Centrifugal, multi-stage 3 0
1,472 m3/min (52,000 scfm)
Suction - 0.9 MPa (130 psia)
Discharge - 5.1 MPa (740 psia)
1,472 m3/min (52,000 scfm)
Suction - 0.9 MPa (130 psia)
Discharge - 5.1 MPa (740 psia)
10 Coal Feed System CO2 Compressor
Centrifugal, multi-stage 3 0
510 m3/min (18,000 scfm)
Suction - 1.0 MPa (150 psia)
Discharge - 5.7 MPa (820 psia)
510 m3/min (18,000 scfm)
Suction - 5.2 MPa (750 psia)
Discharge - 5.7 MPa (820 psia)
ACCOUNT 5A SYNGAS CLEANUP
Equipment No. Description Type Operating
Qty. Spares Case 1 Design Condition
Case 2 Design Condition
1 Mercury Adsorber Sulfated carbon bed 3 0
380,110 kg/hr (838,000 lb/hr)
35°C (95°F) 3.3 MPa (480 psia)
379,657 kg/hr (837,000 lb/hr)
35°C (95°F) 3.3 MPa (480 psia)

Cost and Performance Baseline for Coal-to-SNG and Ammonia (Volume 2)
110
Equipment No. Description Type Operating
Qty. Spares Case 1 Design Condition
Case 2 Design Condition
2 Zinc Oxide Guard Bed Fixed bed 1 0 450 Nm3/min
(15,891 acfm) 450 Nm3/min (15,877 acfm)
3 Sulfur Plant Claus type 2 0 144 tonne/day (158 tpd) 144 tonne/day (158 tpd)
4 COS Hydrolysis Reactor
Fixed bed, catalytic 3 0
57,606 kg/hr (127,000 lb/hr) 216°C (420°F)
3.7 MPa (540 psia)
58,060 kg/hr (128,000 lb/hr) 216°C (420°F)
3.7 MPa (540 psia)
5 Water Gas Shift Reactor
Fixed bed, catalytic 3 0
427,284 kg/hr (942,000 lb/hr) 232°C (450°F)
3.7 MPa (540 psia)
426,830 kg/hr (941,000 lb/hr) 232°C (450°F)
3.7 MPa (540 psia)
6 Shift Reactor Heat Recovery Exchanger
Shell and Tube 3 0
Exchanger 1: 45 GJ/hr (43 MMBtu/hr)
Exchanger 2: 81 GJ/hr (77 MMBtu/hr)
Exchanger 3: 18 GJ/hr (17 MMBtu/hr)
Exchanger 1: 45 GJ/hr (43 MMBtu/hr)
Exchanger 2: 81 GJ/hr (77 MMBtu/hr)
Exchanger 3: 18 GJ/hr (17 MMBtu/hr)
7 Acid Gas Removal Plant
Two-stage Selexol 3 0
381,925 kg/hr (842,000 lb/hr)
34°C (94°F) 3.2 MPa (470 psia)
381,471 kg/hr (841,000 lb/hr)
34°C (94°F) 3.2 MPa (470 psia)
8 Tail Gas Treatment Unit
Proprietary amine, absorber/stripper
2 0
11,552 kg/hr (25,467 lb/hr) 49°C (120°F)
0.1 MPa (10.6 psia)
11,570 kg/hr (25,508 lb/hr) 49°C (120°F)
0.1 MPa (10.6 psia)

Cost and Performance Baseline for Coal-to-SNG and Ammonia (Volume 2)
111
Equipment No. Description Type Operating
Qty. Spares Case 1 Design Condition
Case 2 Design Condition
9 Tail Gas Treatment Incinerator N/A 2 0
59,021 kg/hr (130,120 lb/hr)
23°C (74°F) 0.1 MPa (14.9 psia)
59,021 kg/hr (130,120 lb/hr)
23°C (74°F) 0.1 MPa (14.9 psia)
10 Tail Gas Recycle Compressor Centrifugal 2 1 2,807 kg/hr @ 03.3 MPa
(6,189 lb/hr @ 475 psia) 2,806 kg/hr @ 03.3 MPa (6,186 lb/hr @ 475 psia)
ACCOUNT 5A SNG PRODUCTION/METHANATION SYSTEM
Equipment No. Description Type Operating
Qty. Spares Case 1 Design Condition
Case 2 Design Condition
1 Methanation Reactor Preheater
Shell and Tube 3 0 95 GJ/hr (90 MMBtu/hr) 95 GJ/hr (90 MMBtu/hr)
2 Methanation Reactor 1
Fixed Bed, catalytic 3 0
476,726 kg/hr (1,051,000 lb/hr) 699°C (1,290°F)
3.2 MPa (460 psia)
477,633 kg/hr (1,053,000 lb/hr) 699°C (1,290°F)
3.2 MPa (460 psia)
3 Methanation Reactor Intercooler 1
Shell and Tube 3 0 413 GJ/hr (391
MMBtu/hr) 413 GJ/hr (391
MMBtu/hr)
4 Methanation Reactor Intercooler 2
Shell and Tube 3 0 111 GJ/hr (105
MMBtu/hr) 111 GJ/hr (105
MMBtu/hr)
5 Methanation Reactor 2
Fixed Bed, catalytic 3 0
125,191 kg/hr (276,000 lb/hr) 560°C (1040°F)
3.1 MPa (450 psia)
125,191 kg/hr (276,000 lb/hr) 560°C (1040°F)
3.1 MPa (450 psia)
6 Methanation Reactor Intercooler 3
Shell and Tube 3 0 29 GJ/hr (28 MMBtu/hr) 29 GJ/hr (28 MMBtu/hr)

Cost and Performance Baseline for Coal-to-SNG and Ammonia (Volume 2)
112
Equipment No. Description Type Operating
Qty. Spares Case 1 Design Condition
Case 2 Design Condition
7 Methanation Reactor 3
Fixed Bed, catalytic 3 0
125,191 kg/hr (276,000 lb/hr) 349°C (660°F)
3.0 MPa (430 psia)
125,191 kg/hr (276,000 lb/hr) 343°C (650°F)
3.0 MPa (430 psia)
8 Methanation Reactor Intercooler 4
Shell and Tube 3 0 41 GJ/hr (39 MMBtu/hr) 41 GJ/hr (39 MMBtu/hr)
9 Methanation Reactor Intercooler 5
Shell and Tube 3 0 66 GJ/hr (63 MMBtu/hr) 66 GJ/hr (62 MMBtu/hr)
10 SNG Purification Condenser 1
Shell and Tube 3 0 55 GJ/hr (52 MMBtu/hr) 55 GJ/hr (52 MMBtu/hr)
11 SNG Purification Condenser 2
Shell and Tube 3 0 33 GJ/hr (31 MMBtu/hr) 33 GJ/hr (32 MMBtu/hr)
12 Methanation Recycle Compressor Centrifugal 3 1
8,668 m3/min (306,100 scfm)
Suction - 3.1 MPa (448 psia)
Discharge - 3.3 MPa (475 psia)
8,668 m3/min (306,100 scfm)
Suction - 3.1 MPa (448 psia)
Discharge - 3.3 MPa (475 psia)
13 Molecular Sieve Purification Reactor Fixed bed 6 0
39,463 kg/hr (87,000 lb/hr) 129°C (265°F)
2.8 MPa (401 psia)
39,463 kg/hr (87,000 lb/hr) 129°C (265°F)
2.8 MPa (401 psia)
14 SNG Product Compressor
Centrifugal, Multi-staged 3 1
1,240 m3/min (43,800 scfm)
2.6 MPa (381 psia) 6.2 MPa (899 psia)
1,240 m3/min (43,800 scfm)
2.6 MPa (381 psia) 6.2 MPa (899 psia)

Cost and Performance Baseline for Coal-to-SNG and Ammonia (Volume 2)
113
ACCOUNT 5B CO2 COMPRESSION
Equipment No. Description Type Operating
Qty. Spares Case 1 Design Condition
Case 2 Design Condition
1 CO2 Compressor
Integrally geared, multi-stage centrifugal
4 0 N/A
1,572 m3/min @ 15.3 MPa (55,500 scfm @ 2,215 psia)
ACCOUNT 6 COMBUSTION TURBINE AND AUXILIARIES
Equipment No. Description Type Operating
Qty. Spares Case 1 Design Condition
Case 2 Design Condition
1 Combustion Turbine N/A N/A N/A N/A N/A
2 Combustion Turbine Generator N/A N/A N/A N/A N/A
ACCOUNT 7 DUCTING & STACK
Equipment No. Description Type Operating
Qty. Spares Case 1 Design Condition
Case 2 Design Condition
1 Stack CS plate, type 409SS liner
1 0 76 m (250 ft) high x 3.0 m (10 ft) diameter
76 m (250 ft) high x 2.8 m (9 ft) diameter

Cost and Performance Baseline for Coal-to-SNG and Ammonia (Volume 2)
114
ACCOUNT 8 STEAM TURBINE GENERATOR AND AUXILIARIES
Equipment No. Description Type Operating
Qty. Spares Case 1 Design Condition
Case 2 Design Condition
1 Steam Turbine Commercially available 1 0
324 MW 12.4 MPa/566°C (1800 psig/
1050°F)
327 MW 12.4 MPa/566°C (1800 psig/
1050°F)
2 Steam Turbine Generator
Hydrogen cooled, static excitation 1 0 360 MVA @ 0.9 p.f., 24
kV, 60 Hz, 3-phase 360 MVA @ 0.9 p.f., 24
kV, 60 Hz, 3-phase
3 Surface Condenser
Single pass, divided waterbox including vacuum pumps
1 0
1,878 GJ/hr (1,780 MMBtu/hr), Condensing
temperature 16°C (60°F), Ambient
temperature 11°C (20°F)
1,899 GJ/hr (1,800 MMBtu/hr), Condensing
temperature 16°C (60°F), Ambient
temperature 11°C (20°F)
4 Air-cooled Condenser --- N/A N/A N/A N/A
ACCOUNT 9 COOLING WATER SYSTEM
Equipment No. Description Type Operating
Qty. Spares Case 1 Design Condition
Case 2 Design Condition
1 Circulating Water Pumps Vertical, wet pit 2 1 624,593 lpm @ 30 m
(165,000 gpm @ 100 ft) 620,808 lpm @ 30 m
(164,000 gpm @ 100 ft)
2 Cooling Tower Evaporative, mechanical draft, multi-cell
1 0
11°C (51.5°F) wet bulb / 16°C (60°F) CWT / 27°C (80°F) HWT / 3,492 GJ/hr (3,310
MMBtu/hr) heat duty
11°C (51.5°F) wet bulb / 16°C (60°F) CWT / 27°C (80°F) HWT / 3,461 GJ/hr (3,280
MMBtu/hr) heat duty

Cost and Performance Baseline for Coal-to-SNG and Ammonia (Volume 2)
115
ACCOUNT 10 SLAG RECOVERY AND HANDLING
Equipment No. Description Type Operating
Qty. Spares Case 1 Design Condition
Case 2 Design Condition
1 Slag Quench Tank Water bath 6 0 151,416 liters (40,000 gal)
151,416 liters (40,000 gal)
2 Slag Crusher Roll 6 0 8 tonne/hr (9 tph) 8 tonne/hr (9 tph) 3 Slag Depressurizer Proprietary 6 0 8 tonne/hr (9 tph) 8 tonne/hr (9 tph)
4 Slag Receiving Tank Horizontal, weir 6 0 90,850 liters (24,000 gal) 90,850 liters (24,000 gal)
5 Black Water Overflow Tank
Shop fabricated 6 41,640 liters (11,000 gal) 41,640 liters (11,000 gal)
6 Slag Conveyor Drag chain 6 0 8 tonne/hr (9 tph) 8 tonne/hr (9 tph)
7 Slag Separation Screen Vibrating 6 0 8 tonne/hr (9 tph) 8 tonne/hr (9 tph)
8 Coarse Slag Conveyor Belt/bucket 6 0 8 tonne/hr (9 tph) 8 tonne/hr (9 tph)
9 Fine Ash Settling Tank
Vertical, gravity 6 0 132,489 liters (35,000
gal) 132,489 liters (35,000
gal)
10 Fine Ash Recycle Pumps
Horizontal centrifugal 6 3 38 lpm @ 14 m H2O
(10 gpm @ 46 ft H2O) 38 lpm @ 14 m H2O
(10 gpm @ 46 ft H2O)
11 Grey Water Storage Tank Field erected 6 0 41,640 liters (11,000 gal) 41,640 liters (11,000 gal)
12 Grey Water Pumps Centrifugal 6 3 151 lpm @ 433 m H2O
(40 gpm @ 1,420 ft H2O)
151 lpm @ 433 m H2O (40 gpm @ 1,420 ft
H2O)
13 Slag Storage Bin Vertical, field erected 6 0 544 tonne (600 tons) 544 tonne (600 tons)
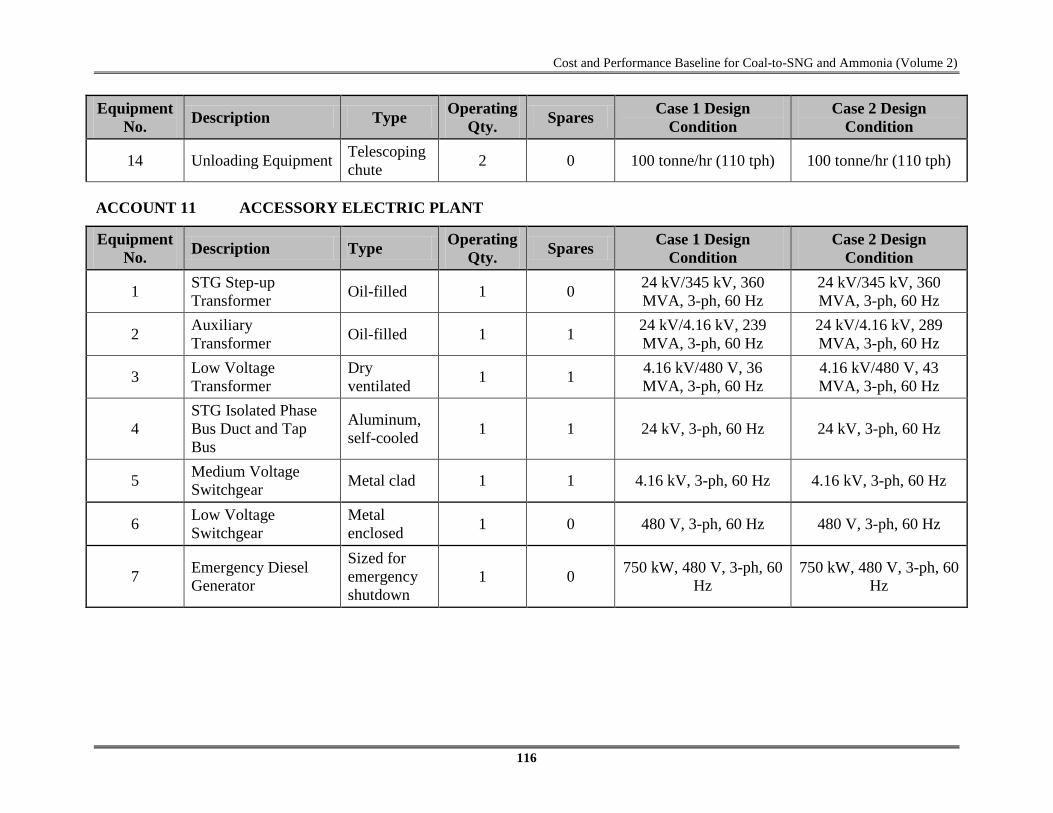
Cost and Performance Baseline for Coal-to-SNG and Ammonia (Volume 2)
116
Equipment No. Description Type Operating
Qty. Spares Case 1 Design Condition
Case 2 Design Condition
14 Unloading Equipment Telescoping chute 2 0 100 tonne/hr (110 tph) 100 tonne/hr (110 tph)
ACCOUNT 11 ACCESSORY ELECTRIC PLANT
Equipment No. Description Type Operating
Qty. Spares Case 1 Design Condition
Case 2 Design Condition
1 STG Step-up Transformer Oil-filled 1 0 24 kV/345 kV, 360
MVA, 3-ph, 60 Hz 24 kV/345 kV, 360 MVA, 3-ph, 60 Hz
2 Auxiliary Transformer Oil-filled 1 1 24 kV/4.16 kV, 239
MVA, 3-ph, 60 Hz 24 kV/4.16 kV, 289 MVA, 3-ph, 60 Hz
3 Low Voltage Transformer
Dry ventilated 1 1 4.16 kV/480 V, 36
MVA, 3-ph, 60 Hz 4.16 kV/480 V, 43 MVA, 3-ph, 60 Hz
4 STG Isolated Phase Bus Duct and Tap Bus
Aluminum, self-cooled 1 1 24 kV, 3-ph, 60 Hz 24 kV, 3-ph, 60 Hz
5 Medium Voltage Switchgear Metal clad 1 1 4.16 kV, 3-ph, 60 Hz 4.16 kV, 3-ph, 60 Hz
6 Low Voltage Switchgear
Metal enclosed 1 0 480 V, 3-ph, 60 Hz 480 V, 3-ph, 60 Hz
7 Emergency Diesel Generator
Sized for emergency shutdown
1 0 750 kW, 480 V, 3-ph, 60 Hz
750 kW, 480 V, 3-ph, 60 Hz

Cost and Performance Baseline for Coal-to-SNG and Ammonia (Volume 2)
117
ACCOUNT 12 INSTRUMENTATION AND CONTROLS
Equipment No.
Description Type Operating
Qty. Spares Case 1 Design Condition
Case 2 Design Condition
1 DCS - Main Control
Monitor/keyboard; Operator printer (laser color); Engineering printer (laser B&W)
1 0
Operator stations/printers and
engineering stations/printers
Operator stations/printers and
engineering stations/printers
2 DCS - Processor
Microprocessor with redundant input/output 1 0 N/A N/A
3 DCS - Data Highway Fiber optic 1 0 Fully redundant, 25%
spare Fully redundant, 25%
spare

Cost and Performance Baseline for Coal-to-SNG and Ammonia (Volume 2)
118
4.1.6 The cost estimating methodology was described previously in Section
Cases 1 and 2 Cost Estimating 2.8.
The TPC organized by cost account; owner’s costs; TOC; and initial and annual O&M costs for the SNG plant without sequestration using Illinois No. 6 coal (Case 1) are shown in Exhibit 4-19 and Exhibit 4-20. The same data for the SNG plant with carbon sequestration using Illinois No. 6 coal (Case 2) are shown in Exhibit 4-21, and Exhibit 4-22.
The estimated TOC of the SNG plant without carbon sequestration is 3.24 billion dollars and with carbon sequestration is 3.31 billion dollars. Project and process contingencies represent 11.9 and 3.9 percent for the non-sequestration case and 11.9 and 3.8 percent for the sequestration case. The FYCOP is $19.27/MMBtu for the non-sequestration case and $20.95/MMBtu for the carbon sequestration case as shown in Exhibit ES-6.

Cost and Performance Baseline for Coal-to-SNG and Ammonia (Volume 2)
119
Exhibit 4-19 Case 1 Total Plant Cost Details
Client: USDOE/NETL R e port Da te : 2010-Feb-18Project: Cost & Performance Baseline for Fossil Energy Plants Vol.2
Case: Case 1 - Siemens Quench SNG Production w/o CO2Plant Size: 91.65 MW,net Est imate Type: Conceptual Cost Base (Jun) 2007 ($x1000)
Acct Equipment Material Labor Sales Bare Erected Eng'g CM Total Plant CostNo. I tem/Descript ion Cost Cost Direct Indirect Tax Cost $ H.O.& Fee Process Project $
1 COAL & SORBENT HANDLING1.1 Coal Receive & Unload $5,729 $0 $2,800 $0 $0 $8,529 $764 $0 $1,859 $11,1521.2 Coal Stackout & Reclaim $7,404 $0 $1,795 $0 $0 $9,198 $806 $0 $2,001 $12,0051.3 Coal Conveyors & Yd Crush $6,883 $0 $1,776 $0 $0 $8,659 $760 $0 $1,884 $11,3031.4 Other Coal Handling $1,801 $0 $411 $0 $0 $2,212 $194 $0 $481 $2,8861.5 Sorbent Receive & Unload $0 $0 $0 $0 $0 $0 $0 $0 $0 $01.6 Sorbent Stackout & Reclaim $0 $0 $0 $0 $0 $0 $0 $0 $0 $01.7 Sorbent Conveyors $0 $0 $0 $0 $0 $0 $0 $0 $0 $01.8 Other Sorbent Handling $0 $0 $0 $0 $0 $0 $0 $0 $0 $01.9 Coal & Sorbent Hnd.Foundations $0 $4,054 $10,138 $0 $0 $14,192 $1,360 $0 $3,110 $18,662
SUBTOTAL 1 . $21 ,817 $4,054 $16,919 $0 $0 $42,790 $3,884 $0 $9,335 $56,009 2 COAL & SORBENT PREP & FEED
2.1 Coal Crushing & Drying $92,942 $0 $13,543 $0 $0 $106,485 $9,671 $0 $23,231 $139,3872.2 Prepared Coal Storage & Feed $4,402 $1,053 $690 $0 $0 $6,146 $526 $0 $1,334 $8,0062.3 Dry Coal Injection System $144,878 $1,681 $13,455 $0 $0 $160,014 $13,782 $0 $34,759 $208,5552.4 Misc.Coal Prep & Feed $2,421 $1,762 $5,282 $0 $0 $9,464 $870 $0 $2,067 $12,4012.5 Sorbent Prep Equipment $0 $0 $0 $0 $0 $0 $0 $0 $0 $02.6 Sorbent Storage & Feed $0 $0 $0 $0 $0 $0 $0 $0 $0 $02.7 Sorbent Injection System $0 $0 $0 $0 $0 $0 $0 $0 $0 $02.8 Booster Air Supply System $0 $0 $0 $0 $0 $0 $0 $0 $0 $02.9 Coal & Sorbent Feed Foundation $0 $9,409 $7,725 $0 $0 $17,135 $1,587 $0 $3,744 $22,466
SUBTOTAL 2. $244,643 $13,906 $40,695 $0 $0 $299,244 $26,435 $0 $65,136 $390,814 3 FEEDWATER & MISC. BOP SYSTEMS
3.1 Feedwater System $3,562 $1,655 $2,008 $0 $0 $7,225 $653 $0 $1,576 $9,4543.2 Water Makeup & Pretreating $832 $87 $465 $0 $0 $1,385 $132 $0 $455 $1,9713.3 Other Feedwater Subsystems $3,867 $1,169 $1,913 $0 $0 $6,949 $631 $0 $1,516 $9,0963.4 Service Water Systems $476 $981 $3,404 $0 $0 $4,861 $474 $0 $1,601 $6,9363.5 Other Boiler Plant Systems $2,556 $991 $2,455 $0 $0 $6,002 $569 $0 $1,314 $7,8853.6 FO Supply Sys & Nat Gas $102 $210 $188 $0 $0 $500 $48 $0 $110 $6583.7 Waste Treatment Equipment $1,164 $0 $710 $0 $0 $1,873 $182 $0 $617 $2,6733.8 Misc. Power Plant Equipment $1,721 $230 $884 $0 $0 $2,836 $274 $0 $933 $4,042
SUBTOTAL 3. $14,281 $5,323 $12,026 $0 $0 $31 ,631 $2,964 $0 $8,121 $42,715 4 GASIFIER & ACCESSORIES
4.1 Gasifier, Syngas Cooler & Auxiliaries $325,844 $0 $150,858 $0 $0 $476,702 $42,340 $71,505 $88,582 $679,1294.2 Syngas Cooling w/4.1 $0 w/ 4.1 $0 $0 $0 $0 $0 $0 $04.3 ASU/Oxidant Compression $238,715 $0 w/equip. $0 $0 $238,715 $23,139 $0 $26,185 $288,0394.4 LT Heat Recovery & FG Saturation $49,590 $0 $18,374 $0 $0 $67,963 $6,510 $0 $14,895 $89,3694.5 Misc. Gasification Equipment w/4.1&4.2 $0 w/4.1&4.2 $0 $0 $0 $0 $0 $0 $04.6 Flare Stack System $0 $2,333 $950 $0 $0 $3,283 $315 $0 $719 $4,3174.7 CO2 Solid Feed System Compressors $10,520 $2,525 $3,787 $0 $0 $16,832 $1,683 $0 $3,703 $22,2184.8 Major Component Rigging w/4.1&4.2 $0 w/4.1&4.2 $0 $0 $0 $0 $0 $0 $04.9 Gasification Foundations $0 $21,143 $12,064 $0 $0 $33,207 $3,040 $0 $9,062 $45,309
SUBTOTAL 4. $624,669 $26,001 $186,032 $0 $0 $836,702 $77,027 $71 ,505 $143,146 $1 ,128,380
TOTAL PLANT COST SUMMARY
Contingencies

Cost and Performance Baseline for Coal-to-SNG and Ammonia (Volume 2)
120
Exhibit 4-19 Case 1 Total Plant Cost Details (continued) Acct Equipment Material Labor Sales Bare Erected Eng'g CM Total Plant CostNo. Item/Description Cost Cost Direct Indirect Tax Cost $ H.O.& Fee Process Project $
5A GAS CLEANUP & PIPING5A.1 Double Stage Selexol $125,892 $0 $106,823 $0 $0 $232,715 $22,506 $46,543 $60,353 $362,1165A.2 Elemental Sulfur Plant $16,274 $3,243 $20,996 $0 $0 $40,513 $3,935 $0 $8,890 $53,3385A.3 Mercury Removal $2,454 $0 $1,868 $0 $0 $4,322 $417 $216 $991 $5,947
5A.4a Shift Reactors $10,461 $0 $4,211 $0 $0 $14,672 $1,407 $0 $3,216 $19,2945A.4b COS Hydrolysis $1,988 $0 $2,596 $0 $0 $4,583 $446 $0 $1,006 $6,035
5A.5 Methanation $28,050 $11,220 $16,830 $0 $0 $56,100 $5,610 $5,610 $13,464 $80,7845A.6 SNG Purification & Compression $19,850 $7,940 $11,910 $0 $0 $39,700 $3,970 $0 $8,734 $52,4045A.7 Fuel Gas Piping $0 $1,753 $1,228 $0 $0 $2,981 $276 $0 $652 $3,9095A.9 Process Interconnects $0 $12,000 $18,000 $0 $0 $30,000 $3,000 $0 $6,600 $39,600
5A.10 HGCU Foundations $0 $1,776 $1,145 $0 $0 $2,920 $268 $0 $957 $4,1455A.11 Zinc Oxide Guard Bed $793 $0 $146 $0 $0 $939 $94 $0 $207 $1,239
SUBTOTAL 5A. $205,762 $37,932 $185,752 $0 $0 $429,446 $41 ,930 $52,369 $105,068 $628,812 5B CO2 COMPRESSION
5B.1 CO2 Removal System $0 $0 $0 $0 $0 $0 $0 $0 $0 $05B.2 CO2 Compression & Drying $0 $0 $0 $0 $0 $0 $0 $0 $0 $0
SUBTOTAL 5B. $0 $0 $0 $0 $0 $0 $0 $0 $0 $0 6 COMBUSTION TURBINE/ACCESSORIES
6.1 Combustion Turbine Generator $0 $0 $0 $0 $0 $0 $0 $0 $0 $06.2 Syngas Expander $0 $0 $0 $0 $0 $0 $0 $0 $0 $06.3 Compressed Air Piping $0 $0 $0 $0 $0 $0 $0 $0 $0 $06.9 Combustion Turbine Foundations $0 $0 $0 $0 $0 $0 $0 $0 $0 $0
SUBTOTAL 6. $0 $0 $0 $0 $0 $0 $0 $0 $0 $0 7 HRSG, DUCTING & STACK
7.1 Heat Recovery Steam Generator $0 $0 $0 $0 $0 $0 $0 $0 $0 $07.2 HRSG Accessories $0 $0 $0 $0 $0 $0 $0 $0 $0 $07.3 Ductwork $0 $480 $343 $0 $0 $823 $72 $0 $179 $1,0747.4 Stack $1,814 $0 $682 $0 $0 $2,496 $239 $0 $274 $3,0097.9 HRSG,Duct & Stack Foundations $0 $364 $349 $0 $0 $713 $66 $0 $234 $1,013
SUBTOTAL 7. $1 ,814 $844 $1 ,373 $0 $0 $4,032 $378 $0 $686 $5,096 8 STEAM TURBINE GENERATOR
8.1 Steam TG & Accessories $31,384 $0 $5,672 $0 $0 $37,056 $3,557 $0 $4,061 $44,6748.2 Turbine Plant Auxiliaries $178 $0 $520 $0 $0 $698 $68 $0 $77 $8438.3 Condenser & Auxiliaries $5,445 $0 $1,666 $0 $0 $7,111 $680 $0 $779 $8,5708.4 Steam Piping $5,365 $0 $3,774 $0 $0 $9,139 $785 $0 $2,481 $12,4058.9 TG Foundations $0 $1,125 $1,901 $0 $0 $3,026 $287 $0 $994 $4,307
SUBTOTAL 8. $42,372 $1 ,125 $13,534 $0 $0 $57,031 $5,377 $0 $8,392 $70,800
Contingencies

Cost and Performance Baseline for Coal-to-SNG and Ammonia (Volume 2)
121
Exhibit 4-19 Case 1 Total Plant Cost Details (continued) Acct Equipment Material Labor Sales Bare Erected Eng'g CM Total Plant CostNo. Item/Description Cost Cost Direct Indirect Tax Cost $ H.O.& Fee Process Project $
9 COOLING WATER SYSTEM9.1 Cooling Towers $8,833 $0 $1,607 $0 $0 $10,440 $994 $0 $1,715 $13,1499.2 Circulating Water Pumps $2,343 $0 $91 $0 $0 $2,434 $204 $0 $396 $3,0349.3 Circ.Water System Auxiliaries $186 $0 $27 $0 $0 $213 $20 $0 $35 $2689.4 Circ.Water Piping $0 $7,768 $2,014 $0 $0 $9,782 $884 $0 $2,133 $12,8009.5 Make-up Water System $440 $0 $629 $0 $0 $1,069 $103 $0 $234 $1,4069.6 Component Cooling Water Sys $917 $1,097 $780 $0 $0 $2,794 $262 $0 $611 $3,6679.9 Circ.Water System Foundations $0 $2,850 $4,844 $0 $0 $7,694 $729 $0 $2,527 $10,951
SUBTOTAL 9. $12,719 $11 ,715 $9,992 $0 $0 $34,426 $3,197 $0 $7,652 $45,27410 ASH/SPENT SORBENT HANDLING SYS
10.1 Slag Dewatering & Cooling $36,268 $0 $35,772 $0 $0 $72,040 $6,980 $0 $7,902 $86,92210.2 Gasifier Ash Depressurization w/10.1 w/10.1 w/10.1 $0 $0 $0 $0 $0 $0 $010.3 Cleanup Ash Depressurization w/10.1 w/10.1 w/10.1 $0 $0 $0 $0 $0 $0 $010.4 High Temperature Ash Piping $0 $0 $0 $0 $0 $0 $0 $0 $0 $010.5 Other Ash Recovery Equipment $0 $0 $0 $0 $0 $0 $0 $0 $0 $010.6 Ash Storage Silos $818 $0 $890 $0 $0 $1,708 $166 $0 $281 $2,15410.7 Ash Transport & Feed Equipment $1,097 $0 $265 $0 $0 $1,362 $127 $0 $223 $1,71210.8 Misc. Ash Handling Equipment $1,694 $2,076 $620 $0 $0 $4,390 $418 $0 $721 $5,52910.9 Ash/Spent Sorbent Foundation $0 $72 $91 $0 $0 $163 $15 $0 $54 $232
SUBTOTAL 10. $39,877 $2,148 $37,637 $0 $0 $79,662 $7,706 $0 $9,181 $96,54911 ACCESSORY ELECTRIC PLANT
11.1 Generator Equipment $446 $0 $441 $0 $0 $887 $85 $0 $97 $1,06911.2 Station Service Equipment $5,293 $0 $477 $0 $0 $5,770 $532 $0 $630 $6,93311.3 Switchgear & Motor Control $9,786 $0 $1,780 $0 $0 $11,566 $1,073 $0 $1,896 $14,53511.4 Conduit & Cable Tray $0 $4,546 $14,997 $0 $0 $19,543 $1,890 $0 $5,358 $26,79211.5 Wire & Cable $0 $8,686 $5,707 $0 $0 $14,393 $1,046 $0 $3,860 $19,29811.6 Protective Equipment $0 $855 $3,112 $0 $0 $3,967 $387 $0 $653 $5,00811.7 Standby Equipment $330 $0 $322 $0 $0 $652 $62 $0 $107 $82111.8 Main Power Transformers $8,795 $0 $182 $0 $0 $8,977 $682 $0 $1,449 $11,10811.9 Electrical Foundations $0 $198 $518 $0 $0 $716 $69 $0 $235 $1,020
SUBTOTAL 11 . $24,651 $14,285 $27,537 $0 $0 $66,472 $5,825 $0 $14,286 $86,58312 INSTRUMENTATION & CONTROL
12.1 IGCC Control Equipment w/4.1 $0 w/4.1 $0 $0 $0 $0 $0 $0 $012.2 Combustion Turbine Control w/6.1 $0 w/6.1 $0 $0 $0 $0 $0 $0 $012.3 Steam Turbine Control w/8.1 $0 w/8.1 $0 $0 $0 $0 $0 $0 $012.4 Other Major Component Control $539 $0 $360 $0 $0 $899 $85 $45 $154 $1,18312.5 Signal Processing Equipment w/12.7 $0 w/12.7 $0 $0 $0 $0 $0 $0 $012.6 Control Boards,Panels & Racks $358 $0 $229 $0 $0 $587 $56 $29 $134 $80612.7 Computer & Accessories $5,727 $0 $183 $0 $0 $5,910 $542 $296 $675 $7,42312.8 Instrument Wiring & Tubing $0 $2,901 $5,930 $0 $0 $8,831 $749 $442 $2,505 $12,52712.9 Other I & C Equipment $4,270 $0 $2,073 $0 $0 $6,343 $597 $317 $1,089 $8,346
SUBTOTAL 12. $10,894 $2,901 $8,776 $0 $0 $22,571 $2,029 $1 ,129 $4,558 $30,286
Contingencies

Cost and Performance Baseline for Coal-to-SNG and Ammonia (Volume 2)
122
Exhibit 4-19 Case 1 Total Plant Cost Details (continued) Acct Equipment Material Labor Sales Bare Erected Eng'g CM Total Plant CostNo. Item/Description Cost Cost Direct Indirect Tax Cost $ H.O.& Fee Process Project $
13 IMPROVEMENTS TO SITE13.1 Site Preparation $0 $147 $3,143 $0 $0 $3,290 $327 $0 $1,085 $4,70213.2 Site Improvements $0 $2,615 $3,476 $0 $0 $6,091 $601 $0 $2,008 $8,70013.3 Site Facilities $4,687 $0 $4,946 $0 $0 $9,632 $950 $0 $3,175 $13,756
SUBTOTAL 13. $4,687 $2,762 $11 ,564 $0 $0 $19,013 $1 ,877 $0 $6,267 $27,15814 BUILDINGS & STRUCTURES
14.1 Combustion Turbine Area $0 $0 $0 $0 $0 $0 $0 $0 $0 $014.2 Steam Turbine Building $0 $2,691 $3,834 $0 $0 $6,525 $600 $0 $1,069 $8,19414.3 Administration Building $0 $870 $630 $0 $0 $1,500 $134 $0 $245 $1,87914.4 Circulation Water Pumphouse $0 $160 $90 $0 $0 $250 $22 $0 $41 $31214.5 Water Treatment Buildings $0 $696 $679 $0 $0 $1,375 $124 $0 $225 $1,72414.6 Machine Shop $0 $445 $305 $0 $0 $750 $67 $0 $123 $93914.7 Warehouse $0 $726 $464 $0 $0 $1,190 $105 $0 $194 $1,48914.8 Other Buildings & Structures $0 $528 $411 $0 $0 $940 $84 $0 $205 $1,22914.9 Waste Treating Building & Str. $0 $1,181 $2,258 $0 $0 $3,439 $321 $0 $752 $4,511
SUBTOTAL 14. $0 $7,297 $8,671 $0 $0 $15,968 $1 ,456 $0 $2,853 $20,277
TOTAL COST $1,248,184 $130,294 $560,509 $0 $0 $1 ,938,987 $180,084 $125,003 $384,680 $2,628,754
Owner's CostsPreproduction Costs
6 Months All Labor $21,5231 Month Maintenance Materials $3,796
1 Month Non-fuel Consumables $8161 Month Waste Disposal $577
25% of 1 Months Fuel Cost at 100% CF $3,3622% of TPC $52,575
Total $82,649Inventory Capital
60 day supply of fuel and consumables at 100% CF $28,1840.5% of TPC (spare parts) $13,144
Total $41,328
Initial Cost for Catalyst and Chemicals $16,342Land $900
Other Owner's Costs $394,313Financing Costs $70,976
Total Overnight Costs (TOC) $3,235,262TASC Multiplier 1.201
Total As-Spent Cost (TASC) $3,885,549
Contingencies

Cost and Performance Baseline for Coal-to-SNG and Ammonia (Volume 2)
123
Exhibit 4-20 Case 1 Initial and Annual O&M Costs INITIAL & ANNUAL O&M EXPENSES Cost Base (Jun): 2007
Case 1 - Siemens Quench SNG Production w/o CO2 MWe-net: 92SNG (MMbtu/hr): 6892 Capacity Factor (%): 90
OPERATING & MAINTENANCE LABOROperating Labor
Operating Labor Rate(base): 34.65 $/hour Operating Labor Burden: 30.00 % of base Labor O-H Charge Rate: 25.00 % of labor
Total Operating Labor Requirements(O.J.)per Shift: 1 unit/mod. Plant Skilled Operator 2.0 2.0 Operator 12.0 12.0 Foreman 1.0 1.0 Lab Tech's, etc. 3.0 3.0 TOTAL-O.J.'s 18.0 18.0
Annual Cost Annual Unit Cost$ $/MMBtu
Annual Operating Labor Cost $7,102,696 $0.131Maintenance Labor Cost $27,333,527 $0.503Administrative & Support Labor $8,609,056 $0.158Property Taxes and Insurance $52,575,070 $0.968TOTAL FIXED OPERATING COSTS $95,620,348 $1.760VARIABLE OPERATING COSTS
$/MMBtuMaintenance Material Cost $41 ,000,290 $0.75453
Consumables Consumption Unit Initial Fill Initial Fill /Day Cost Cost
Water(/1000 gallons) 0 5,162 1.08 $0 $1 ,834,102 $0.03375
ChemicalsMU & WT Chem. (lb) 0 30,752 0.17 $0 $1,748,328 $0.03217Carbon (Mercury Removal) (lb) 228,466 391 1.05 $239,928 $134,960 $0.00248COS Catalyst (m3) 116 0 2,397.36 $277,521 $78,053 $0.00144Water Gas Shift Catalyst (ft3) 5,515 4.72 498.83 $2,750,848 $773,676 $0.01424ZnO Sorbent (ton) 150 0.51 12,574.00 $1,887,818 $2,123,795 $0.03908Methanation Catalyst (ft3) 12,295 9.36 440.00 $5,410,004 $1,352,501 $0.02489Selexol Solution (gal) 431,115 137 13.40 $5,776,182 $602,843 $0.01109SCR Catalyst (m3) 0 0 0.00 $0 $0 $0.00000Aqueous Ammonia (ton) 0 0 0.00 $0 $0 $0.00000Claus Catalyst (ft3) w/equip 3.75 131.27 $0 $161,773 $0.00298
Subtotal Chemicals $16,342,301 $6,975,929 $0.12838
OtherSupplemental Fuel (MBtu) 0 0 0.00 $0 $0 $0.00000Supplemental Electricity (for consumption) (MW 0 0 61.60 $0 $0 $0.00000Gases,N2 etc. (/100scf) 0 0 0.00 $0 $0 $0.00000L.P. Steam (/1000 pounds) 0 0 0.00 $0 $0 $0.00000
Subtotal Other $0 $0 $0.00000
Waste DisposalSpent Mercury Catalyst (lb.) 0 391 0.42 $0 $53,599 $0.00099Spent ZnO Sorbent (ton) 0 0.51 16.23 $0 $2,740 $0.00005Flyash (ton) 0 0 0.00 $0 $0 $0.00000Slag (ton) 0 1,160 16.23 $0 $6,180,087 $0.11373
Subtotal-Waste Disposal $0 $6,236,427 $0.11477
By-products & Emissions Sulfur (tons) 0 288 0.00 $0 $0 $0.00000Supplemental Electricity (for sale) (MWh) 0 2,200 58.00 $0 -$41,908,979 -$0.77125
Subtotal By-Products $0 -$41 ,908,979 -$0.77125
TOTAL VARIABLE OPERATING COSTS $16,342,301 $14,137,770 $0.26018
Fuel (ton) 0 11,577 38.18 $0 $145,217,654 $2.67245

Cost and Performance Baseline for Coal-to-SNG and Ammonia (Volume 2)
124
Exhibit 4-21 Case 2 Total Plant Cost Details
Client: USDOE/NETL R e port Da te : 2010-Feb-18Project: Cost & Performance Baseline for Fossil Energy Plants Vol.2
Case: Case 2 - Siemens Quench SNG Production w/ CO2Plant Size: 48.51 MW,net Est imate Type: Conceptual Cost Base (Jun) 2007 ($x1000)
Acct Equipment Material Labor Sales Bare Erected Eng'g CM Total Plant CostNo. I tem/Descript ion Cost Cost Direct Indirect Tax Cost $ H.O.& Fee Process Project $
1 COAL & SORBENT HANDLING1.1 Coal Receive & Unload $5,729 $0 $2,800 $0 $0 $8,529 $764 $0 $1,859 $11,1521.2 Coal Stackout & Reclaim $7,404 $0 $1,795 $0 $0 $9,198 $806 $0 $2,001 $12,0051.3 Coal Conveyors & Yd Crush $6,883 $0 $1,776 $0 $0 $8,659 $760 $0 $1,884 $11,3031.4 Other Coal Handling $1,801 $0 $411 $0 $0 $2,212 $194 $0 $481 $2,8861.5 Sorbent Receive & Unload $0 $0 $0 $0 $0 $0 $0 $0 $0 $01.6 Sorbent Stackout & Reclaim $0 $0 $0 $0 $0 $0 $0 $0 $0 $01.7 Sorbent Conveyors $0 $0 $0 $0 $0 $0 $0 $0 $0 $01.8 Other Sorbent Handling $0 $0 $0 $0 $0 $0 $0 $0 $0 $01.9 Coal & Sorbent Hnd.Foundations $0 $4,054 $10,138 $0 $0 $14,192 $1,360 $0 $3,110 $18,662
SUBTOTAL 1 . $21 ,817 $4,054 $16,919 $0 $0 $42,790 $3,884 $0 $9,335 $56,009 2 COAL & SORBENT PREP & FEED
2.1 Coal Crushing & Drying $92,942 $0 $13,543 $0 $0 $106,485 $9,671 $0 $23,231 $139,3872.2 Prepared Coal Storage & Feed $4,402 $1,053 $690 $0 $0 $6,146 $526 $0 $1,334 $8,0062.3 Dry Coal Injection System $144,878 $1,681 $13,455 $0 $0 $160,014 $13,782 $0 $34,759 $208,5552.4 Misc.Coal Prep & Feed $2,421 $1,762 $5,282 $0 $0 $9,464 $870 $0 $2,067 $12,4012.5 Sorbent Prep Equipment $0 $0 $0 $0 $0 $0 $0 $0 $0 $02.6 Sorbent Storage & Feed $0 $0 $0 $0 $0 $0 $0 $0 $0 $02.7 Sorbent Injection System $0 $0 $0 $0 $0 $0 $0 $0 $0 $02.8 Booster Air Supply System $0 $0 $0 $0 $0 $0 $0 $0 $0 $02.9 Coal & Sorbent Feed Foundation $0 $9,409 $7,725 $0 $0 $17,135 $1,587 $0 $3,744 $22,466
SUBTOTAL 2. $244,643 $13,906 $40,695 $0 $0 $299,244 $26,435 $0 $65,136 $390,814 3 FEEDWATER & MISC. BOP SYSTEMS
3.1 FeedwaterSystem $3,582 $1,664 $2,019 $0 $0 $7,265 $657 $0 $1,584 $9,5063.2 Water Makeup & Pretreating $829 $87 $463 $0 $0 $1,378 $131 $0 $453 $1,9623.3 Other Feedwater Subsystems $3,889 $1,176 $1,923 $0 $0 $6,988 $634 $0 $1,524 $9,1463.4 Service Water Systems $474 $976 $3,389 $0 $0 $4,839 $472 $0 $1,593 $6,9053.5 Other Boiler Plant Systems $2,545 $986 $2,444 $0 $0 $5,974 $567 $0 $1,308 $7,8493.6 FO Supply Sys & Nat Gas $102 $210 $188 $0 $0 $500 $48 $0 $110 $6583.7 Waste Treatment Equipment $1,158 $0 $707 $0 $0 $1,865 $182 $0 $614 $2,6603.8 Misc. Power Plant Equipment $1,721 $230 $884 $0 $0 $2,836 $274 $0 $933 $4,042
SUBTOTAL 3. $14,299 $5,330 $12,016 $0 $0 $31 ,645 $2,965 $0 $8,120 $42,729 4 GASIFIER & ACCESSORIES
4.1 Gasifier, Syngas Cooler & Auxiliaries $325,819 $0 $150,846 $0 $0 $476,665 $42,337 $71,500 $88,575 $679,0774.2 Syngas Cooling w/4.1 $0 w/ 4.1 $0 $0 $0 $0 $0 $0 $04.3 ASU/Oxidant Compression $238,715 $0 w/equip. $0 $0 $238,715 $23,139 $0 $26,185 $288,0394.4 LT Heat Recovery & FG Saturation $49,540 $0 $18,356 $0 $0 $67,896 $6,504 $0 $14,880 $89,2804.5 Misc. Gasification Equipment w/4.1&4.2 $0 w/4.1&4.2 $0 $0 $0 $0 $0 $0 $04.6 Flare Stack System $0 $2,332 $949 $0 $0 $3,281 $315 $0 $719 $4,3154.7 CO2 Solid Feed System Compressors $6,696 $1,607 $2,411 $0 $0 $10,713 $1,071 $0 $2,357 $14,1424.8 Major Component Rigging w/4.1&4.2 $0 w/4.1&4.2 $0 $0 $0 $0 $0 $0 $04.9 Gasification Foundations $0 $21,143 $12,064 $0 $0 $33,207 $3,040 $0 $9,062 $45,309
SUBTOTAL 4. $620,771 $25,082 $184,626 $0 $0 $830,479 $76,405 $71 ,500 $141 ,779 $1 ,120,162
TOTAL PLANT COST SUMMARY
Contingencies

Cost and Performance Baseline for Coal-to-SNG and Ammonia (Volume 2)
125
Exhibit 4-21 Case 2 Total Plant Cost Details (continued) Acct Equipment Material Labor Sales Bare Erected Eng'g CM Total Plant CostNo. I tem/Descript ion Cost Cost Direct Indirect Tax Cost $ H.O.& Fee Process Project $
5A GAS CLEANUP & PIPING5A.1 Double Stage Selexol $125,787 $0 $106,734 $0 $0 $232,521 $22,487 $46,504 $60,302 $361,8155A.2 Elemental Sulfur Plant $16,277 $3,244 $21,000 $0 $0 $40,521 $3,936 $0 $8,891 $53,3495A.3 Mercury Removal $2,453 $0 $1,867 $0 $0 $4,320 $417 $216 $991 $5,943
5A.4a Shift Reactors $10,448 $0 $4,205 $0 $0 $14,653 $1,405 $0 $3,212 $19,2695A.4b COS Hydrolysis $1,999 $0 $2,611 $0 $0 $4,610 $448 $0 $1,012 $6,0705A.5 Methanation $28,050 $11,220 $16,830 $0 $0 $56,100 $5,610 $5,610 $13,464 $80,7845A.6 SNG Purification & Compression $19,850 $7,940 $11,910 $0 $0 $39,700 $3,970 $0 $8,734 $52,4045A.7 Fuel Gas Piping $0 $1,752 $1,227 $0 $0 $2,979 $276 $0 $651 $3,9075A.9 Process Interconnects $0 $12,000 $18,000 $0 $0 $30,000 $3,000 $0 $6,600 $39,600
5A.10 HGCU Foundations $0 $1,774 $1,144 $0 $0 $2,918 $268 $0 $956 $4,1435A.11 Zinc Oxide Guard Bed $792 $0 $146 $0 $0 $938 $94 $0 $206 $1,239
SUBTOTAL 5A. $205,656 $37,931 $185,674 $0 $0 $429,261 $41 ,912 $52,330 $105,019 $628,522 5B CO2 COMPRESSION
5B.1 CO2 Removal System $0 $0 $0 $0 $0 $0 $0 $0 $0 $05B.2 CO2 Compression & Drying $34,256 $0 $20,173 $0 $0 $54,428 $5,240 $0 $11,934 $71,602
SUBTOTAL 5B. $34,256 $0 $20,173 $0 $0 $54,428 $5,240 $0 $11 ,934 $71 ,602 6 COMBUSTION TURBINE/ACCESSORIES
6.1 Combustion Turbine Generator $0 $0 $0 $0 $0 $0 $0 $0 $0 $06.2 Syngas Expander $0 $0 $0 $0 $0 $0 $0 $0 $0 $06.3 Compressed Air Piping $0 $0 $0 $0 $0 $0 $0 $0 $0 $06.9 Combustion Turbine Foundations $0 $0 $0 $0 $0 $0 $0 $0 $0 $0
SUBTOTAL 6 $0 $0 $0 $0 $0 $0 $0 $0 $0 $0 7 HRSG, DUCTING & STACK
7.1 Heat Recovery Steam Generator $0 $0 $0 $0 $0 $0 $0 $0 $0 $07.2 HRSG Accessories $0 $0 $0 $0 $0 $0 $0 $0 $0 $07.3 Ductwork $0 $0 $0 $0 $0 $0 $0 $0 $0 $07.4 Stack $0 $0 $0 $0 $0 $0 $0 $0 $0 $07.9 HRSG,Duct & Stack Foundations $0 $0 $0 $0 $0 $0 $0 $0 $0 $0
SUBTOTAL 7. $0 $0 $0 $0 $0 $0 $0 $0 $0 $0 8 STEAM TURBINE GENERATOR
8.1 Steam TG & Accessories $31,587 $0 $5,484 $0 $0 $37,071 $3,557 $0 $4,063 $44,6918.2 Turbine Plant Auxiliaries $173 $0 $504 $0 $0 $677 $66 $0 $74 $8178.3 Condenser & Auxiliaries $5,488 $0 $1,616 $0 $0 $7,104 $679 $0 $778 $8,5618.4 Steam Piping $5,591 $0 $3,933 $0 $0 $9,525 $818 $0 $2,586 $12,9298.9 TG Foundations $0 $1,091 $1,844 $0 $0 $2,934 $278 $0 $964 $4,176
SUBTOTAL 8. $42,839 $1 ,091 $13,381 $0 $0 $57,310 $5,399 $0 $8,465 $71 ,174
Contingencies

Cost and Performance Baseline for Coal-to-SNG and Ammonia (Volume 2)
126
Exhibit 4-21 Case 2 Total Plant Cost Details (continued) Acct Equipment Material Labor Sales Bare Erected Eng'g CM Total Plant CostNo. I tem/Descript ion Cost Cost Direct Indirect Tax Cost $ H.O.& Fee Process Project $
9 COOLING WATER SYSTEM9.1 Cooling Towers $8,777 $0 $1,597 $0 $0 $10,373 $988 $0 $1,704 $13,0659.2 Circulating Water Pumps $2,333 $0 $88 $0 $0 $2,421 $203 $0 $394 $3,0189.3 Circ.Water System Auxiliaries $185 $0 $26 $0 $0 $212 $20 $0 $35 $2679.4 Circ.Water Piping $0 $7,740 $2,007 $0 $0 $9,747 $881 $0 $2,125 $12,7539.5 Make-up Water System $438 $0 $627 $0 $0 $1,065 $102 $0 $233 $1,4019.6 Component Cooling Water Sys $914 $1,093 $778 $0 $0 $2,784 $261 $0 $609 $3,6549.9 Circ.Water System Foundations $0 $2,834 $4,818 $0 $0 $7,652 $725 $0 $2,513 $10,891
SUBTOTAL 9. $12,647 $11 ,667 $9,940 $0 $0 $34,254 $3,181 $0 $7,614 $45,04810 ASH/SPENT SORBENT HANDLING SYS
10.1 Slag Dewatering & Cooling $36,268 $0 $35,772 $0 $0 $72,040 $6,980 $0 $7,902 $86,92210.2 Gasifier Ash Depressurization w/10.1 w/10.1 w/10.1 $0 $0 $0 $0 $0 $0 $010.3 Cleanup Ash Depressurization w/10.1 w/10.1 w/10.1 $0 $0 $0 $0 $0 $0 $010.4 High Temperature Ash Piping $0 $0 $0 $0 $0 $0 $0 $0 $0 $010.5 Other Ash Recovery Equipment $0 $0 $0 $0 $0 $0 $0 $0 $0 $010.6 Ash Storage Silos $818 $0 $890 $0 $0 $1,708 $166 $0 $281 $2,15410.7 Ash Transport & Feed Equipment $1,097 $0 $265 $0 $0 $1,362 $127 $0 $223 $1,71210.8 Misc. Ash Handling Equipment $1,694 $2,076 $620 $0 $0 $4,390 $418 $0 $721 $5,52910.9 Ash/Spent Sorbent Foundation $0 $72 $91 $0 $0 $163 $15 $0 $54 $232
SUBTOTAL 10. $39,877 $2,148 $37,637 $0 $0 $79,662 $7,706 $0 $9,181 $96,54911 ACCESSORY ELECTRIC PLANT
11.1 Generator Equipment $435 $0 $431 $0 $0 $866 $83 $0 $95 $1,04311.2 Station Service Equipment $5,740 $0 $517 $0 $0 $6,258 $577 $0 $683 $7,51811.3 Switchgear & Motor Control $10,612 $0 $1,930 $0 $0 $12,542 $1,163 $0 $2,056 $15,76111.4 Conduit & Cable Tray $0 $4,930 $16,263 $0 $0 $21,193 $2,050 $0 $5,811 $29,05311.5 Wire & Cable $0 $9,419 $6,189 $0 $0 $15,608 $1,134 $0 $4,185 $20,92711.6 Protective Equipment $0 $855 $3,112 $0 $0 $3,967 $387 $0 $653 $5,00811.7 Standby Equipment $330 $0 $322 $0 $0 $652 $62 $0 $107 $82111.8 Main Power Transformers $9,427 $0 $182 $0 $0 $9,609 $729 $0 $1,551 $11,88911.9 Electrical Foundations $0 $198 $518 $0 $0 $716 $69 $0 $235 $1,020
SUBTOTAL 11 . $26,544 $15,402 $29,464 $0 $0 $71 ,410 $6,254 $0 $15,377 $93,04112 INSTRUMENTATION & CONTROL
12.1 IGCC Control Equipment w/4.1 $0 w/4.1 $0 $0 $0 $0 $0 $0 $012.2 Combustion Turbine Control w/6.1 $0 w/6.1 $0 $0 $0 $0 $0 $0 $012.3 Steam Turbine Control w/8.1 $0 w/8.1 $0 $0 $0 $0 $0 $0 $012.4 Other Major Component Control $536 $0 $358 $0 $0 $894 $85 $45 $153 $1,17712.5 Signal Processing Equipment w/12.7 $0 w/12.7 $0 $0 $0 $0 $0 $0 $012.6 Control Boards,Panels & Racks $356 $0 $228 $0 $0 $584 $55 $29 $134 $80212.7 Computer & Accessories $5,696 $0 $182 $0 $0 $5,879 $540 $294 $671 $7,38312.8 Instrument Wiring & Tubing $0 $2,885 $5,899 $0 $0 $8,784 $745 $439 $2,492 $12,46012.9 Other I & C Equipment $4,247 $0 $2,062 $0 $0 $6,309 $594 $315 $1,083 $8,301
SUBTOTAL 12. $10,835 $2,885 $8,729 $0 $0 $22,450 $2,018 $1 ,123 $4,533 $30,124
Contingencies

Cost and Performance Baseline for Coal-to-SNG and Ammonia (Volume 2)
127
Exhibit 4-21 Case 2 Total Plant Cost Details (continued) Acct Equipment Material Labor Sales Bare Erected Eng'g CM Total Plant CostNo. I tem/Descript ion Cost Cost Direct Indirect Tax Cost $ H.O.& Fee Process Project $
13 IMPROVEMENTS TO SITE13.1 Site Preparation $0 $147 $3,143 $0 $0 $3,290 $327 $0 $1,085 $4,70213.2 Site Improvements $0 $2,615 $3,476 $0 $0 $6,091 $601 $0 $2,008 $8,70013.3 Site Facilities $4,687 $0 $4,946 $0 $0 $9,632 $950 $0 $3,175 $13,756
SUBTOTAL 13. $4,687 $2,762 $11 ,564 $0 $0 $19,013 $1 ,877 $0 $6,267 $27,15814 BUILDINGS & STRUCTURES
14.1 Combustion Turbine Area $0 $0 $0 $0 $0 $0 $0 $0 $0 $014.2 Steam Turbine Building $0 $2,624 $3,738 $0 $0 $6,361 $585 $0 $1,042 $7,98914.3 Administration Building $0 $870 $630 $0 $0 $1,500 $134 $0 $245 $1,87914.4 Circulation Water Pumphouse $0 $160 $90 $0 $0 $250 $22 $0 $41 $31214.5 Water Treatment Buildings $0 $693 $676 $0 $0 $1,368 $124 $0 $224 $1,71614.6 Machine Shop $0 $445 $305 $0 $0 $750 $67 $0 $123 $93914.7 Warehouse $0 $726 $464 $0 $0 $1,190 $105 $0 $194 $1,48914.8 Other Buildings & Structures $0 $528 $411 $0 $0 $940 $84 $0 $205 $1,22914.9 Waste Treating Building & Str. $0 $1,181 $2,258 $0 $0 $3,439 $321 $0 $752 $4,511
SUBTOTAL 14. $0 $7,227 $8,572 $0 $0 $15,798 $1 ,441 $0 $2,825 $20,064
TOTAL COST $1,278,871 $129,485 $579,389 $0 $0 $1 ,987,745 $184,716 $124,952 $395,583 $2,692,997
Owner's CostsPreproduction Costs
6 Months All Labor $21,7501 Month Maintenance Materials $3,847
1 Month Non-fuel Consumables $8131 Month Waste Disposal $577
25% of 1 Months Fuel Cost at 100% CF $3,3622% of TPC $53,860
Total $84,209Inventory Capital
60 day supply of fuel and consumables at 100% CF $28,1810.5% of TPC (spare parts) $13,465
Total $41,646
Initial Cost for Catalyst and Chemicals $16,327Land $900
Other Owner's Costs $403,950Financing Costs $72,711
Total Overnight Costs (TOC) $3,312,740TASC Multiplier 1.201
Total As-Spent Cost (TASC) $3,978,601
Contingencies

Cost and Performance Baseline for Coal-to-SNG and Ammonia (Volume 2)
128
Exhibit 4-22 Case 2 Initial and Annual O&M Costs INITIAL & ANNUAL O&M EXPENSES Cost Base (Jun): 2007
Case 2 - Siemens Quench SNG Production w/ CO2 MWe-net: 49SNG (MMbtu/hr): 6886 Capacity Factor (%): 90
OPERATING & MAINTENANCE LABOROperating Labor
Operating Labor Rate(base): 34.65 $/hour Operating Labor Burden: 30.00 % of base Labor O-H Charge Rate: 25.00 % of labor
Total Operating Labor Requirements(O.J.)per Shift: 1 unit/mod. Plant Skilled Operator 2.0 2.0 Operator 12.0 12.0 Foreman 1.0 1.0 Lab Tech's, etc. 3.0 3.0 TOTAL-O.J.'s 18.0 18.0
Annual Cost Annual Unit Cost$ $/MMBtu
Annual Operating Labor Cost $7,102,696 $0.131Maintenance Labor Cost $27,697,722 $0.510Administrative & Support Labor $8,700,105 $0.160Property Taxes and Insurance $53,859,942 $0.992TOTAL FIXED OPERATING COSTS $97,360,465 $1.793VARIABLE OPERATING COSTS
$/MMBtuMaintenance Material Cost $41 ,546,584 $0.76523
Consumables Consumption Unit Initial Fill Initial Fill /Day Cost Cost
Water(/1000 gallons) 0 5,129 1.08 $0 $1 ,822,333 $0.03356
ChemicalsMU & WT Chem.(lb) 0 30,554 0.17 $0 $1,737,110 $0.03200Carbon (Mercury Removal) (lb) 228,257 391 1.05 $239,709 $134,836 $0.00248COS Catalyst (m3) 117 0 2,397.36 $279,597 $78,637 $0.00145Water Gas Shift Catalyst (ft3) 5,505 4.71 498.83 $2,746,203 $772,369 $0.01423ZnO Sorbent (ton) 150 0.51 12,574.00 $1,885,197 $2,120,847 $0.03906Methanation Catalyst (ft3) 12,289 9.35 440.00 $5,407,162 $1,351,791 $0.02490Selexol Solution (gal) 430,618 137 13.40 $5,769,523 $602,148 $0.01109SCR Catalyst (m3) 0 0 0.00 $0 $0 $0.00000Aqueous Ammonia (ton) 0 0 0.00 $0 $0 $0.00000Claus Catalyst (ft3) w/equip 3.75 131.27 $0 $161,817 $0.00298
Subtotal Chemicals $16,327,392 $6,959,555 $0.12819
OtherSupplemental Fuel (MBtu) 0 0 0.00 $0 $0 $0.00000Supplemental Electricity (for consumption) (MW 0 0 61.60 $0 $0 $0.00000Gases,N2 etc.(/100scf) 0 0 0.00 $0 $0 $0.00000L.P. Steam(/1000 pounds) 0 0 0.00 $0 $0 $0.00000
Subtotal Other $0 $0 $0.00000
Waste DisposalSpent Mercury Catalyst (lb.) 0 391 0.42 $0 $53,551 $0.00099Spent ZnO Sorbent (ton) 0 0.51 16.23 $0 $2,737 $0.00005Flyash (ton) 0 0 0.00 $0 $0 $0.00000Slag (ton) 0 1,160 16.23 $0 $6,180,087 $0.11383
Subtotal-Waste Disposal $0 $6,236,374 $0.11487
By-products & Emissions Sulfur (tons) 0 288 0.00 $0 $0 $0.00000Supplemental Electricity (for sale) (MWh) 0 1,164 58.00 $0 -$22,182,265 -$0.40857
Subtotal By-Products $0 -$22,182,265 -$0.40857
TOTAL VARIABLE OPERATING COSTS $16,327,392 $34,382,582 $0.63328
Fuel (ton) 0 11,577 38.18 $0 $145,217,654 $2.67471

Cost and Performance Baseline for Coal-to-SNG and Ammonia (Volume 2)
129
4.2 SYNTHETIC NATURAL GAS AND AMMONIA CO-PRODUCTION USING ILLINOIS NO. 6 COAL
4.2.1 In this section the overall Siemens gasification process for producing SNG and ammonia production is described. All major process systems for coal handling and drying, gasifier, raw gas cooling/particulate removal, syngas scrubbing, and SNG production are the same as previously described for Cases 1 and 2. Only the major process areas for ammonia production and their subsequent integration with the SNG portion of the plant are described in this section. The process BFDs for the Illinois No. 6 coal non-sequestration and sequestration co-production cases are shown in
Process Description
Exhibit 4-23 and Exhibit 4-25. The associated stream tables are shown in Exhibit 4-24 for the non-sequestration case and Exhibit 4-26 for the carbon sequestration case.
Sour Gas Shift for Ammonia Production Two SGS units are employed to maximize the hydrogen production necessary for ammonia synthesis and to reduce the amount of COS entering the AGR system. A H2O to CO ratio of 3.0 is maintained to drive the shift reaction to an approximate fractional conversion of 99 percent for CO.
Following the water scrubber, approximately 24 percent of the total raw gas stream is utilized for ammonia production. This raw gas stream (stream 30) is combined with shift steam (stream 31) in the first reactor. The stream exiting the first reactor is cooled to 232°C (450°F) to help further drive the shift reaction in the second reactor. The shifted syngas exits the second reactor with nearly all the available carbon monoxide shifted to hydrogen.
Mercury Removal and Acid Gas Removal Before the raw gas can be treated in the AGR process, it must be cooled to about 35°C (95°F). During this cooling sequence through a series of heat exchangers, most of the water vapor condenses. This water, which contains some NH3, is sent to the sour water stripper. The cooled syngas (stream 32) then passes through a carbon bed to remove 95 percent of the Hg (Section 3.1.6).
The AGR process is a two stage Selexol process where H2S is removed in the first stage and CO2 is removed in the second stage of absorption. The process results in three product streams. A high hydrogen syngas (stream 34) is combined with the purge gas from the ammonia synthesis loop (stream 40) and sent to the PSA process. A CO2-rich stream is combined with the CO2-rich stream from the SNG production trains and either vented to the atmosphere in the non-sequestration case or compressed for sequestration in the carbon sequestration case. A portion of the CO2 product stream is withdrawn and further compressed to 5.62 MPa (815 psia) to provide the fluid for coal transport (stream 12). The acid gas stream (stream 43) is combined with its counterpart in the SNG production train (stream 42) and fed to the Claus plant (stream 44). In both cases, the acid gas contains nearly 40 percent H2S and nearly 50 percent CO2, with the balance primarily H2 and CO.
Pressure Swing Absorption The PSA unit is used to purify the syngas stream entering the ammonia synthesis loop to acceptable levels of contaminants for the ammonia catalyst as described in Section 3.1.10.

Cost and Performance Baseline for Coal-to-SNG and Ammonia (Volume 2)
130
The high hydrogen syngas from the Selexol unit (stream 34) is combined with the ammonia purge gas (stream 40) and feed to the PSA unit at 3.24 MPa (470 psia) and 21°C (69°F). The PSA unit produces a 99 vol% H2 stream for ammonia synthesis (stream 37). Purge nitrogen (stream 35) enters the PSA beds from the ASU to increase the hydrogen recovery to 94 vol%. The tail gas from the PSA unit (stream 36) is sent to a waste heat recovery boiler.
Ammonia Synthesis Loop The purified H2 stream from the PSA unit is combined with additional nitrogen from the ASU (stream 4) to maintain a 3:1 molar ratio of H2 to N2 entering the ammonia reactor. The combined stream is compressed to 13.62 MPa (1,975 psia) before being fed into the synthesis loop (stream 38). The ammonia reactor converts H2 and N2 into NH3 at a pressure of 14.0 MPa (2,030 psia) due to further compression within the synthesis loop. The ammonia product is refrigerated to −25°C (−13°F) and sent to storage vessels (stream 39). Approximately five percent of the maximum flow in the ammonia synthesis loop is treated in the PSA unit (stream 40) to keep concentrations of inerts such as CH4, Ar, and O2 from building up in the synthesis loop. The ammonia synthesis loop produces anhydrous ammonia with a purity of 99.5 wt%.
CO2 Compression, Claus Unit, Power Block The process parameters are the same as previously discussed in Section 4.1.1.

Cost and Performance Baseline for Coal-to-SNG and Ammonia (Volume 2)
131
Exhibit 4-23 Case 3 Block Flow Diagram, Bituminous Coal to SNG and Ammonia without Carbon Sequestration
PARTIAL RAW GAS QUENCH AND COOLING
WATER-GAS SHIFT
REACTORS & GAS COOLING
WATER SCRUBBER
ELEVATEDPRESSURE
ASU
SIEMENS GASIFIER
MERCURYREMOVAL
DUAL-STAGE
SELEXOL UNIT
CLAUS PLANT
COAL DRYER
METHANATION REACTORS
26
SNG PURIFICATION
28
SNG FOR EXPORT
27 PURIFICATION OFF-GAS
STEAM TURBINE
49 50
PROCESS STEAM
CONDENSATE
DRY GAS PREP
SNG COMPRESSION
29
COS HYDROLYSIS
MERCURYREMOVAL
DUAL-STAGE
SELEXOL UNIT
PSA
7 11
9
8
16
30
WATER-GAS SHIFT
REACTORS & GAS COOLING
17
TAIL GAS HYDROLYSIS AND TREATMENT UNIT
AMMONIAPRODUCTION
18
20
21
19
32 33 34 37 38
43
42
4446
23
4035
36 39
12
1
2 3
5
6
14
10
15
47
22
48
24
DRIEDCOALWET
COAL
TRANSPORT CO2
COALDRYERSTACK GAS
AIR TO ASU
VENTGAS
SULFUR PLANT
OXIDANT
GASIFIEROXIDANT
SLAG
STEAM
QUENCHWATER
AIR
TO SOUR WATER STRIPPER
SHIFT STEAM
WGS BYPASS
TO SOUR WATER STRIPPER
31
SHIFT STEAM
SULFUR PRODUCT
CO2VENT
45
PURGE GAS TO WASTE HEAT
BOILER
AMMONIAPRODUCT
AMMONIA PURGE
RECYCLE
25
TO COALDRYING
25
4
NITROGEN
41
4 NITROGENTO AMMONIA PLANT
TRANSPORTCO2
PURGENITROGEN
CLEANSYNGAS
12
LOCK-HOPPER
VENT
13
Note: Block Flow Diagram is not intended to represent a complete material balance. Only major process streams and equipment are shown. See H&MB diagram for more detail.
35 NITROGENTO PSA

Cost and Performance Baseline for Coal-to-SNG and Ammonia (Volume 2)
132
Exhibit 4-24 Case 3 Stream Table, Bituminous Coal to SNG and Ammonia without Carbon Sequestration 1 2 3 4 5 6 7 8 9 10 11 12 13 14 15 16 17 18
V-L Mole FractionAr 0.0092 0.0101 0.0101 0.0000 0.0101 0.0000 0.0000 0.0092 0.0084 0.0064 0.0000 0.0001 0.0000 0.0000 0.0000 0.0020 0.0020 0.0020CH4 0.0000 0.0000 0.0000 0.0000 0.0000 0.0000 0.0000 0.0000 0.0000 0.0000 0.0000 0.0000 0.0000 0.0000 0.0000 0.0000 0.0000 0.0000CO 0.0000 0.0000 0.0000 0.0000 0.0000 0.0000 0.0000 0.0000 0.0000 0.0000 0.0000 0.0081 0.0010 0.0000 0.0000 0.4205 0.4364 0.4364CO2 0.0003 0.0005 0.0000 0.0000 0.0000 0.0000 0.0000 0.0003 0.1192 0.0916 0.0000 0.9781 0.1235 0.0000 0.0000 0.0399 0.0415 0.0415COS 0.0000 0.0000 0.0000 0.0000 0.0000 0.0000 0.0000 0.0000 0.0000 0.0000 0.0000 0.0001 0.0000 0.0000 0.0000 0.0005 0.0006 0.0006H2 0.0000 0.0000 0.0000 0.0000 0.0000 0.0000 0.0000 0.0000 0.0000 0.0000 0.0000 0.0121 0.6937 0.0000 0.0000 0.1971 0.2046 0.2046H2O 0.0099 0.0044 0.0000 0.0000 0.0000 1.0000 0.0000 0.0099 0.1710 0.3627 0.0000 0.0014 0.0979 0.0000 1.0000 0.3295 0.3042 0.3042H2S 0.0000 0.0000 0.0000 0.0000 0.0000 0.0000 0.0000 0.0000 0.0000 0.0000 0.0000 0.0000 0.0000 0.0000 0.0000 0.0058 0.0060 0.0060N2 0.7732 0.9765 0.0004 1.0000 0.0004 0.0000 0.0000 0.7732 0.6234 0.4793 0.0000 0.0001 0.0171 0.0000 0.0000 0.0046 0.0047 0.0047NH3 0.0000 0.0000 0.0000 0.0000 0.0000 0.0000 0.0000 0.0000 0.0000 0.0000 0.0000 0.0000 0.0000 0.0000 0.0000 0.0000 0.0000 0.0000O2 0.2074 0.0085 0.9895 0.0000 0.9895 0.0000 0.0000 0.2074 0.0780 0.0600 0.0000 0.0000 0.0668 0.0000 0.0000 0.0000 0.0000 0.0000SO2 0.0000 0.0000 0.0000 0.0000 0.0000 0.0000 0.0000 0.0000 0.0000 0.0000 0.0000 0.0000 0.0000 0.0000 0.0000 0.0000 0.0000 0.0000
Total 1.0000 1.0000 1.0000 1.0000 1.0000 1.0000 0.0000 1.0000 1.0000 1.0000 0.0000 1.0000 1.0000 0.0000 1.0000 1.0000 1.0000 1.0000
V-L Flowrate (kgmol/hr) 51,682 36,441 151 3,127 10,369 3,442 0 3,538 4,396 5,718 0 3,559 14,094 0 14,055 53,960 39,309 5,856V-L Flowrate (kg/hr) 1,491,391 1,025,161 4,845 87,594 332,612 62,017 0 102,084 125,819 149,636 0 154,233 158,471 0 253,210 1,095,758 801,642 119,422Solids Flowrate (kg/hr) 0 0 0 0 0 0 437,263 0 0 0 413,446 0 332,092 43,794 0 0 0 0
Temperature (°C) 15 25 32 72 32 343 15 15 1,260 143 71 83 18 1,500 216 260 214 214Pressure (MPa, abs) 0.10 0.11 0.86 3.24 0.86 5.10 0.10 0.10 0.10 0.10 0.10 5.62 5.62 4.24 8.274 3.89 3.76 3.76Enthalpy (kJ/kg) 30.93 32.59 26.94 69.15 26.94 3,177.81 --- 30.93 1,853.88 826.48 --- 31.02 4,689.64 --- 1,017.873 1,152.07 1,014.68 1,014.68Density (kg/m3) 1.2 1.3 11.0 31.6 11.0 20.1 --- 1.2 0.2 0.8 --- 99.3 28.4 --- 782.0 18.0 19.1 19.1V-L Molecular Weight 28.857 28.132 32.078 28.013 32.078 18.015 --- 28.857 28.621 26.169 --- 43.334 11.244 --- 18.015 20.307 20.393 20.393
V-L Flowrate (lbmol/hr) 113,940 80,339 333 6,894 22,859 7,589 0 7,799 9,692 12,606 0 7,847 31,073 0 30,987 118,962 86,662 12,910V-L Flowrate (lb/hr) 3,287,954 2,260,094 10,681 193,111 733,283 136,724 0 225,056 277,383 329,890 0 340,027 349,368 0 558,232 2,415,734 1,767,318 263,281Solids Flowrate (lb/hr) 0 0 0 0 0 0 964,000 0 0 0 911,493 0 732,139 96,550 0 0 0 0
Temperature (°F) 59 76 90 162 90 650 59 59 2,300 290 160 181 65 2,732 420 500 418 418Pressure (psia) 14.7 16.4 125.0 470.0 125.0 740.0 14.7 14.7 14.7 14.7 14.4 815.0 815.0 614.7 1,200.0 564.7 544.7 544.7Enthalpy (Btu/lb) 13.3 14.0 11.6 29.7 11.6 1,366.2 --- 13.3 797.0 355.3 --- 13.3 2,016.2 --- 437.6 495.3 436.2 436.2Density (lb/ft3) 0.076 0.080 0.685 1.973 0.685 1.257 --- 0.076 0.014 0.048 --- 6.197 1.775 --- 48.817 1.125 1.195 1.195
A - Reference conditions are 32.02 F & 0.089 PSIA

Cost and Performance Baseline for Coal-to-SNG and Ammonia (Volume 2)
133
Exhibit 4-24 Case 3 Stream Table, Bituminous Coal to SNG and Ammonia without Carbon Sequestration (continued)
19 20 21 22 23 24 25 26 27 28 29 30 31 32 33 34 35 36V-L Mole Fraction
Ar 0.0020 0.0000 0.0021 0.0021 0.0030 0.0030 0.0030 0.0105 0.0000 0.0120 0.0120 0.0020 0.0000 0.0018 0.0018 0.0029 0.0000 0.0072CH4 0.0000 0.0000 0.0000 0.0000 0.0001 0.0001 0.0001 0.8302 0.0000 0.9496 0.9496 0.0000 0.0000 0.0000 0.0000 0.0001 0.0000 0.0002CO 0.4364 0.0000 0.1647 0.1642 0.2372 0.2372 0.2372 0.0000 0.0000 0.0000 0.0000 0.4364 0.0000 0.0037 0.0037 0.0061 0.0000 0.0166CO2 0.0420 0.0000 0.3264 0.3284 0.0366 0.0366 0.0366 0.1253 0.9816 0.0021 0.0021 0.0415 0.0000 0.4192 0.4192 0.0530 0.0000 0.1443COS 0.0000 0.0000 0.0001 0.0001 0.0000 0.0000 0.0000 0.0000 0.0000 0.0000 0.0000 0.0006 0.0000 0.0000 0.0000 0.0000 0.0000 0.0000H2 0.2046 0.0000 0.4935 0.4919 0.7160 0.7160 0.7160 0.0070 0.0000 0.0080 0.0080 0.2046 0.0000 0.5636 0.5636 0.9309 0.0000 0.1939H2O 0.3036 1.0000 0.0018 0.0018 0.0001 0.0001 0.0001 0.0023 0.0184 0.0000 0.0000 0.3042 1.0000 0.0017 0.0017 0.0001 0.0000 0.0004H2S 0.0066 0.0000 0.0066 0.0067 0.0000 0.0000 0.0000 0.0000 0.0000 0.0000 0.0000 0.0060 0.0000 0.0057 0.0057 0.0000 0.0000 0.0000N2 0.0047 0.0000 0.0049 0.0048 0.0071 0.0071 0.0071 0.0247 0.0000 0.0282 0.0282 0.0047 0.0000 0.0042 0.0042 0.0069 1.0000 0.6195NH3 0.0000 0.0000 0.0000 0.0000 0.0000 0.0000 0.0000 0.0000 0.0000 0.0000 0.0000 0.0000 0.0000 0.0000 0.0000 0.0000 0.0000 0.0180O2 0.0000 0.0000 0.0000 0.0000 0.0000 0.0000 0.0000 0.0000 0.0000 0.0000 0.0000 0.0000 0.0000 0.0000 0.0000 0.0000 0.0000 0.0000SO2 0.0000 0.0000 0.0000 0.0000 0.0000 0.0000 0.0000 0.0000 0.0000 0.0000 0.0000 0.0000 0.0000 0.0000 0.0000 0.0000 0.0000 0.0000
Total 1.0000 1.0000 1.0000 1.0000 1.0000 1.0000 1.0000 1.0000 1.0000 1.0000 1.0000 1.0000 1.0000 1.0000 1.0000 1.0000 1.0000 1.0000
V-L Flowrate (kgmol/hr) 5,856 10,935 38,282 38,406 26,217 115 645 7,292 917 6,375 6,375 12,685 12,748 14,332 14,332 8,622 1,245 3,164V-L Flowrate (kg/hr) 119,422 196,998 783,015 788,417 262,604 1,151 6,461 145,836 39,914 105,923 105,923 258,689 229,661 288,176 288,176 40,467 34,881 79,621Solids Flowrate (kg/hr) 0 0 0 0 0 0 0 0 0 0 0 0 0 0 0 0 0 0
Temperature (°C) 215 288 35 35 31 80 31 35 35 35 35 214 288 35 35 31 72 21Pressure (MPa, abs) 3.69 4.14 3.31 3.24 3.24 5.10 3.24 2.73 0.14 2.627 6.202 3.756 4.137 3.37 3.3 3.238 3.241 0.138Enthalpy (kJ/kg) 1,014.21 3,070.04 44.97 44.66 86.06 234.17 86.06 41.84 48.20 47.750 13.125 1,014.683 3,070.036 44.67 44.2 190.221 69.152 24.935Density (kg/m3) 18.8 18.2 26.8 26.4 12.7 17.0 12.7 22.6 2.4 17.9 44.7 19.1 18.2 27.1 26.5 5.9 31.6 1.4V-L Molecular Weight 20.393 18.015 20.454 20.529 10.017 10.017 10.017 20.000 43.532 16.615 16.615 20.393 18.015 20.107 20.107 4.693 28.013 25.164
V-L Flowrate (lbmol/hr) 12,910 24,108 84,396 84,670 57,797 253 1,422 16,076 2,021 14,055 14,055 27,966 28,105 31,597 31,597 19,009 2,745 6,976V-L Flowrate (lb/hr) 263,281 434,306 1,726,252 1,738,163 578,942 2,538 14,243 321,514 87,994 233,520 233,520 570,311 506,315 635,320 635,320 89,214 76,900 175,534Solids Flowrate (lb/hr) 0 0 0 0 0 0 0 0 0 0 0 0 0 0 0 0 0 0
Temperature (°F) 418 550 95 95 87 177 87 95 95 95 95 418 550 95 94 87 162 69Pressure (psia) 534.7 600.0 479.7 469.7 469.6 740.0 469.6 396.1 20.1 381.0 899.5 544.7 600.0 489.2 479.2 469.6 470.0 20.0Enthalpy (Btu/lb) 436.0 1,319.9 19.3 19.2 37.0 100.7 37.0 18.0 20.7 20.5 5.6 436.2 1,319.9 19.2 19.0 81.8 29.7 10.7Density (lb/ft3) 1.172 1.135 1.675 1.647 0.792 1.063 0.792 1.409 0.148 1.116 2.789 1.195 1.135 1.690 1.657 0.371 1.973 0.089

Cost and Performance Baseline for Coal-to-SNG and Ammonia (Volume 2)
134
Exhibit 4-24 Case 3 Stream Table, Bituminous Coal to SNG and Ammonia without Carbon Sequestration (continued) 37 38 39 40 41 42 43 44 45 46 47 48 49 50
V-L Mole FractionAr 0.0013 0.0010 0.0005 0.0035 0.0000 0.0005 0.0005 0.0005 0.0000 0.0019 0.0000 0.0034 0.0000 0.0000CH4 0.0000 0.0000 0.0000 0.0000 0.0000 0.0000 0.0000 0.0000 0.0000 0.0000 0.0000 0.0000 0.0000 0.0000CO 0.0000 0.0000 0.0000 0.0000 0.0021 0.0480 0.0011 0.0350 0.0000 0.1014 0.0000 0.0060 0.0000 0.0000CO2 0.0000 0.0000 0.0000 0.0000 0.9906 0.4323 0.5377 0.4614 0.0000 0.3385 0.9629 0.5672 0.0000 0.0000COS 0.0000 0.0000 0.0000 0.0000 0.0001 0.0017 0.0001 0.0012 0.0000 0.0005 0.0000 0.0000 0.0000 0.0000H2 0.9905 0.7491 0.0030 0.7328 0.0030 0.0917 0.1024 0.0946 0.0000 0.0589 0.0005 0.2694 0.0000 0.0000H2O 0.0000 0.0000 0.0000 0.0000 0.0041 0.0329 0.0314 0.0325 0.0000 0.4950 0.0059 0.1525 1.0000 1.0000H2S 0.0000 0.0000 0.0000 0.0000 0.0000 0.3923 0.3264 0.3741 0.0000 0.0021 0.0306 0.0000 0.0000 0.0000N2 0.0082 0.2499 0.0011 0.2448 0.0000 0.0006 0.0005 0.0006 0.0000 0.0008 0.0000 0.0014 0.0000 0.0000NH3 0.0000 0.0000 0.9954 0.0190 0.0000 0.0000 0.0000 0.0000 0.0000 0.0000 0.0000 0.0000 0.0000 0.0000O2 0.0000 0.0000 0.0000 0.0000 0.0000 0.0000 0.0000 0.0000 0.0000 0.0000 0.0000 0.0000 0.0000 0.0000SO2 0.0000 0.0000 0.0000 0.0000 0.0000 0.0000 0.0000 0.0000 0.0000 0.0009 0.0000 0.0000 0.0000 0.0000
Total 1.0000 1.0000 1.0000 1.0000 1.0000 1.0000 1.0000 1.0000 0.0000 1.0000 1.0000 1.0000 1.0000 1.0000
V-L Flowrate (kgmol/hr) 9,704 12,831 4,898 3,001 13,431 657 252 909 0 1,058 124 604 40,998 76,214V-L Flowrate (kg/hr) 22,125 109,719 83,324 26,398 587,552 22,772 8,966 31,738 0 28,599 5,403 17,274 738,585 1,373,008Solids Flowrate (kg/hr) 0 0 0 0 0 0 0 0 10,893 0 0 0 0 0
Temperature (°C) 21 21 -25 -28 5 48 48 48 177 232 35 51 566 39Pressure (MPa, abs) 3.238 13.614 13.048 3.238 0.115 0.163 0.163 0.163 0.119 0.085 3.272 0.103 12.512 0.827Enthalpy (kJ/kg) 267.348 68.637 -1,408.059 -99.171 7.544 91.640 87.876 90.577 --- 1,168.962 -1.583 232.751 3,513.235 164.154Density (kg/m3) 3.0 44.6 668.8 13.9 2.2 2.1 2.2 2.1 5,281.2 0.5 67.9 1.2 34.9 993.0V-L Molecular Weight 2.280 8.551 17.010 8.796 43.745 34.656 35.628 34.925 --- 27.035 43.530 28.598 18.015 18.015
V-L Flowrate (lbmol/hr) 21,394 28,288 10,799 6,616 29,611 1,449 555 2,003 0 2,332 274 1,332 90,384 168,022V-L Flowrate (lb/hr) 48,777 241,888 183,698 58,197 1,295,330 50,203 19,766 69,969 0 63,051 11,911 38,083 1,628,301 3,026,965Solids Flowrate (lb/hr) 0 0 0 0 0 0 0 0 24,016 0 0 0 0 0
Temperature (°F) 69 70 -13 -19 42 119 119 119 351 450 95 123 1,050 102Pressure (psia) 469.6 1,974.5 1,892.5 469.6 16.7 23.7 23.7 23.7 17.3 12.3 474.5 14.9 1,814.7 120.0Enthalpy (Btu/lb) 114.9 29.5 -605.4 -42.6 3.2 39.4 37.8 38.9 --- 502.6 -0.7 100.1 1,510.4 70.6Density (lb/ft3) 0.186 2.787 41.749 0.865 0.137 0.133 0.137 0.134 329.697 0.034 4.237 0.072 2.177 61.989

Cost and Performance Baseline for Coal-to-SNG and Ammonia (Volume 2)
135
Exhibit 4-25 Case 4 Block Flow Diagram, Bituminous Coal to SNG and Ammonia with Carbon Sequestration
PARTIAL RAW GAS QUENCH AND COOLING
WATER-GAS SHIFT
REACTORS & GAS COOLING
WATER SCRUBBER
ELEVATEDPRESSURE
ASU
SIEMENS GASIFIER
MERCURYREMOVAL
DUAL-STAGE
SELEXOL UNIT
CLAUS PLANT
COAL DRYER
METHANATION REACTORS
26
SNG PURIFICATION
28
SNG FOR EXPORT
27
PURIFICATION OFF-GASTO CO2
COMPRESSION
STEAM TURBINE
49 50
PROCESS STEAM
CONDENSATE
DRY GAS PREP
SNG COMPRESSION
29
COS HYDROLYSIS
MERCURYREMOVAL
DUAL-STAGE
SELEXOL UNIT
PSA
7 11
9
8
16
30
WATER-GAS SHIFT
REACTORS & GAS COOLING
17
TAIL GAS HYDROLYSIS AND TREATMENT UNIT
AMMONIAPRODUCTION
18
20
21
19
32 33 34 37 38
43
42
4446
23
CO2 COMPRESSION
4035
36 39
12
28
41
1
2 3
5
6
14
10
15
47
22
48
24
DRIEDCOALWET
COAL
COALDRYERSTACK GAS
AIR TO ASU
VENTGAS
SULFUR PLANT
OXIDANT
GASIFIEROXIDANT
SLAG
STEAM
QUENCHWATER
AIR
TO SOUR WATER STRIPPER
SHIFT STEAM
WGS BYPASS
TO SOUR WATER STRIPPER
31
SHIFT STEAM
SULFUR PRODUCT
CO2 PRODUCT
45
PURGE GAS TO WASTE HEAT
BOILER
AMMONIAPRODUCT
AMMONIA PURGE
RECYCLE
25
TO COALDRYING
25
4
NITROGEN
NITROGENREACTANT TO
AMMONIA PLANT
TRANSPORTCO2
PURGENITROGEN
CLEANSYNGAS
TRANSPORT CO2
12
LOCK-HOPPER
VENT
13
Note: Block Flow Diagram is not intended to represent a complete material balance. Only major process streams and equipment are shown. See H&MB diagram for more detail.
PURIFICATION OFF-GAS
35
4
NITROGENTO PSA

Cost and Performance Baseline for Coal-to-SNG and Ammonia (Volume 2)
136
Exhibit 4-26 Case 4 Stream Table, Bituminous Coal to SNG and Ammonia with Carbon Sequestration 1 2 3 4 5 6 7 8 9 10 11 12 13 14 15 16 17
V-L Mole FractionAr 0.0092 0.0101 0.0101 0.0000 0.0101 0.0000 0.0000 0.0092 0.0084 0.0064 0.0000 0.0000 0.0000 0.0000 0.0000 0.0020 0.0020CH4 0.0000 0.0000 0.0000 0.0000 0.0000 0.0000 0.0000 0.0000 0.0000 0.0000 0.0000 0.0000 0.0000 0.0000 0.0000 0.0000 0.0000CO 0.0000 0.0000 0.0000 0.0000 0.0000 0.0000 0.0000 0.0000 0.0000 0.0000 0.0000 0.0032 0.0004 0.0000 0.0000 0.4206 0.4365CO2 0.0003 0.0005 0.0000 0.0000 0.0000 0.0000 0.0000 0.0003 0.1204 0.0924 0.0000 0.9918 0.1242 0.0000 0.0000 0.0400 0.0415COS 0.0000 0.0000 0.0000 0.0000 0.0000 0.0000 0.0000 0.0000 0.0000 0.0000 0.0000 0.0001 0.0000 0.0000 0.0000 0.0005 0.0006H2 0.0000 0.0000 0.0000 0.0000 0.0000 0.0000 0.0000 0.0000 0.0000 0.0000 0.0000 0.0047 0.6936 0.0000 0.0000 0.1970 0.2044H2O 0.0099 0.0044 0.0000 0.0000 0.0000 1.0000 0.0000 0.0099 0.1711 0.3635 0.0000 0.0001 0.0978 0.0000 1.0000 0.3295 0.3042H2S 0.0000 0.0000 0.0000 0.0000 0.0000 0.0000 0.0000 0.0000 0.0000 0.0000 0.0000 0.0000 0.0000 0.0000 0.0000 0.0058 0.0060N2 0.7732 0.9765 0.0004 1.0000 0.0004 0.0000 0.0000 0.7732 0.6227 0.4782 0.0000 0.0000 0.0172 0.0000 0.0000 0.0046 0.0047NH3 0.0000 0.0000 0.0000 0.0000 0.0000 0.0000 0.0000 0.0000 0.0000 0.0000 0.0000 0.0000 0.0000 0.0000 0.0000 0.0000 0.0000O2 0.2074 0.0085 0.9895 0.0000 0.9895 0.0000 0.0000 0.2074 0.0774 0.0595 0.0000 0.0000 0.0669 0.0000 0.0000 0.0000 0.0000SO2 0.0000 0.0000 0.0000 0.0000 0.0000 0.0000 0.0000 0.0000 0.0000 0.0000 0.0000 0.0000 0.0000 0.0000 0.0000 0.0000 0.0000
Total 1.0000 1.0000 1.0000 1.0000 1.0000 1.0000 0.0000 1.0000 1.0000 1.0000 0.0000 1.0000 1.0000 0.0000 1.0000 1.0000 1.0000
V-L Flowrate (kgmol/hr) 51,694 36,451 156 3,127 10,366 3,442 0 3,516 4,374 5,696 0 3,525 14,077 0 14,050 53,938 39,291V-L Flowrate (kg/hr) 1,491,725 1,025,437 4,997 87,591 332,535 62,017 0 101,453 125,255 149,072 0 154,233 158,471 0 253,117 1,095,588 801,497Solids Flowrate (kg/hr) 0 0 0 0 0 0 437,263 0 0 0 413,446 0 332,092 43,794 0 0 0
Temperature (°C) 15 25 32 117 32 343 15 15 1,265 143 71 82 18 1,500 216 260 214Pressure (MPa, abs) 0.10 0.11 0.86 3.24 0.86 5.10 0.10 0.10 0.10 0.10 0.10 5.62 5.62 4.24 8.274 3.89 3.76Enthalpy (kJ/kg) 30.93 32.59 26.94 117.12 26.94 3,177.81 --- 30.93 1,860.19 827.90 --- 27.40 4,694.27 --- 1,017.873 1,151.80 1,014.38Density (kg/m3) 1.2 1.3 11.0 27.9 11.0 20.1 --- 1.2 0.2 0.8 --- 101.4 28.5 --- 782.0 18.0 19.2V-L Molecular Weight 28.857 28.132 32.078 28.013 32.078 18.015 --- 28.857 28.637 26.172 --- 43.759 11.257 --- 18.015 20.312 20.399
V-L Flowrate (lbmol/hr) 113,965 80,361 343 6,893 22,854 7,589 0 7,751 9,643 12,557 0 7,770 31,035 0 30,975 118,912 86,623V-L Flowrate (lb/hr) 3,288,691 2,260,701 11,017 193,105 733,114 136,724 0 223,666 276,140 328,647 0 340,026 349,368 0 558,027 2,415,359 1,766,999Solids Flowrate (lb/hr) 0 0 0 0 0 0 964,000 0 0 0 911,493 0 732,138 96,550 0 0 0
Temperature (°F) 59 76 90 242 90 650 59 59 2,308 290 160 179 65 2,732 420 500 418Pressure (psia) 14.7 16.4 125.0 470.0 125.0 740.0 14.7 14.7 14.7 14.7 14.4 815.0 815.0 614.7 1,200.0 564.7 544.7Enthalpy (Btu/lb) 13.3 14.0 11.6 50.4 11.6 1,366.2 --- 13.3 799.7 355.9 --- 11.8 2,018.2 --- 437.6 495.2 436.1Density (lb/ft3) 0.076 0.080 0.685 1.739 0.685 1.257 --- 0.076 0.014 0.048 --- 6.328 1.779 --- 48.817 1.125 1.196
A - Reference conditions are 32.02 F & 0.089 PSIA

Cost and Performance Baseline for Coal-to-SNG and Ammonia (Volume 2)
137
Exhibit 4-26 Case 4 Stream Table, Bituminous Coal to SNG and Ammonia with Carbon Sequestration (continued)
18 19 20 21 22 23 24 25 26 27 28 29 30 31 32 33 34V-L Mole Fraction
Ar 0.0020 0.0020 0.0000 0.0021 0.0021 0.0030 0.0030 0.0030 0.0105 0.0000 0.0120 0.0120 0.0020 0.0000 0.0018 0.0018 0.0029CH4 0.0000 0.0000 0.0000 0.0000 0.0000 0.0001 0.0001 0.0001 0.8300 0.0000 0.9496 0.9496 0.0000 0.0000 0.0000 0.0000 0.0001CO 0.4365 0.4365 0.0000 0.1647 0.1642 0.2372 0.2372 0.2372 0.0000 0.0000 0.0000 0.0000 0.4365 0.0000 0.0037 0.0037 0.0061CO2 0.0415 0.0421 0.0000 0.3265 0.3285 0.0366 0.0366 0.0366 0.1255 0.9817 0.0022 0.0022 0.0415 0.0000 0.4193 0.4193 0.0530COS 0.0006 0.0000 0.0000 0.0001 0.0001 0.0000 0.0000 0.0000 0.0000 0.0000 0.0000 0.0000 0.0006 0.0000 0.0000 0.0000 0.0000H2 0.2044 0.2044 0.0000 0.4933 0.4917 0.7160 0.7160 0.7160 0.0070 0.0000 0.0080 0.0080 0.2044 0.0000 0.5634 0.5634 0.9309H2O 0.3042 0.3036 1.0000 0.0018 0.0018 0.0001 0.0001 0.0001 0.0023 0.0183 0.0000 0.0000 0.3042 1.0000 0.0017 0.0017 0.0001H2S 0.0060 0.0066 0.0000 0.0066 0.0068 0.0000 0.0000 0.0000 0.0000 0.0000 0.0000 0.0000 0.0060 0.0000 0.0057 0.0057 0.0000N2 0.0047 0.0047 0.0000 0.0049 0.0048 0.0071 0.0071 0.0071 0.0247 0.0000 0.0282 0.0282 0.0047 0.0000 0.0042 0.0042 0.0069NH3 0.0000 0.0000 0.0000 0.0000 0.0000 0.0000 0.0000 0.0000 0.0000 0.0000 0.0000 0.0000 0.0000 0.0000 0.0000 0.0000 0.0000O2 0.0000 0.0000 0.0000 0.0000 0.0000 0.0000 0.0000 0.0000 0.0000 0.0000 0.0000 0.0000 0.0000 0.0000 0.0000 0.0000 0.0000SO2 0.0000 0.0000 0.0000 0.0000 0.0000 0.0000 0.0000 0.0000 0.0000 0.0000 0.0000 0.0000 0.0000 0.0000 0.0000 0.0000 0.0000
Total 1.0000 1.0000 1.0000 1.0000 1.0000 1.0000 1.0000 1.0000 1.0000 1.0000 1.0000 1.0000 1.0000 1.0000 1.0000 1.0000 1.0000
V-L Flowrate (kgmol/hr) 5,852 5,852 10,939 38,269 38,397 26,203 115 654 7,287 918 6,369 6,369 12,679 12,748 14,327 14,327 8,618V-L Flowrate (kg/hr) 119,381 119,381 197,069 782,967 788,515 262,524 1,151 6,555 145,785 39,955 105,827 105,827 258,642 229,652 288,150 288,150 40,455Solids Flowrate (kg/hr) 0 0 0 0 0 0 0 0 0 0 0 0 0 0 0 0 0
Temperature (°C) 214 215 288 35 35 31 80 31 35 35 35 35 214 288 35 35 31Pressure (MPa, abs) 3.76 3.69 4.14 3.31 3.24 3.24 5.10 3.24 2.73 0.14 2.627 6.202 3.756 4.137 3.37 3.3 3.238Enthalpy (kJ/kg) 1,014.38 1,013.91 2,955.16 44.96 44.63 86.04 234.12 86.04 41.82 48.17 47.750 13.124 1,014.380 2,955.157 44.65 44.2 190.183Density (kg/m3) 19.2 18.8 18.2 26.8 26.4 12.7 17.0 12.7 22.6 2.4 17.9 44.7 19.2 18.2 27.1 26.6 5.9V-L Molecular Weight 20.399 20.399 18.015 20.460 20.536 10.019 10.019 10.019 20.006 43.533 16.615 16.615 20.399 18.015 20.112 20 4.694
V-L Flowrate (lbmol/hr) 12,902 12,902 24,116 84,369 84,652 57,768 253 1,442 16,065 2,023 14,042 14,042 27,953 28,104 31,587 31,587 18,999V-L Flowrate (lb/hr) 263,189 263,189 434,462 1,726,146 1,738,377 578,766 2,538 14,451 321,400 88,085 233,309 233,309 570,209 506,295 635,261 635,261 89,187Solids Flowrate (lb/hr) 0 0 0 0 0 0 0 0 0 0 0 0 0 0 0 0 0
Temperature (°F) 418 418 550 95 95 87 177 87 95 95 95 95 418 550 95 94 87Pressure (psia) 544.7 534.7 600.0 479.7 469.7 469.6 740.0 469.6 396.1 20.1 381.0 899.5 544.7 600.0 489.2 479.2 469.6Enthalpy (Btu/lb) 436.1 435.9 1,270.5 19.3 19.2 37.0 100.7 37.0 18.0 20.7 20.5 5.6 436.1 1,270.5 19.2 19.0 81.8Density (lb/ft3) 1.196 1.173 1.135 1.675 1.648 0.792 1.063 0.792 1.410 0.148 1.116 2.789 1.196 1.135 1.690 1.658 0.371

Cost and Performance Baseline for Coal-to-SNG and Ammonia (Volume 2)
138
Exhibit 4-26 Case 4 Stream Table, Bituminous Coal to SNG and Ammonia with Carbon Sequestration (continued) 35 36 37 38 39 40 41 42 43 44 45 46 47 48 49 50
V-L Mole FractionAr 0.0000 0.0072 0.0013 0.0010 0.0005 0.0035 0.0000 0.0005 0.0005 0.0005 0.0000 0.0020 0.0000 0.0035 0.0000 0.0000CH4 0.0000 0.0002 0.0000 0.0000 0.0000 0.0000 0.0000 0.0000 0.0000 0.0000 0.0000 0.0000 0.0000 0.0000 0.0000 0.0000CO 0.0000 0.0166 0.0000 0.0000 0.0000 0.0000 0.0032 0.0477 0.0011 0.0349 0.0000 0.1032 0.0000 0.0057 0.0000 0.0000CO2 0.0000 0.1443 0.0000 0.0000 0.0000 0.0000 0.9918 0.4296 0.5376 0.4594 0.0000 0.3331 0.9316 0.5770 0.0000 0.0000COS 0.0000 0.0000 0.0000 0.0000 0.0000 0.0000 0.0001 0.0017 0.0001 0.0012 0.0000 0.0004 0.0001 0.0000 0.0000 0.0000H2 0.0000 0.1938 0.9905 0.7490 0.0030 0.7324 0.0047 0.0910 0.1023 0.0941 0.0000 0.0588 0.0005 0.2585 0.0000 0.0000H2O 0.0000 0.0004 0.0000 0.0000 0.0000 0.0000 0.0001 0.0327 0.0314 0.0323 0.0000 0.4947 0.0059 0.1538 1.0000 1.0000H2S 0.0000 0.0000 0.0000 0.0000 0.0000 0.0000 0.0000 0.3962 0.3265 0.3770 0.0000 0.0020 0.0619 0.0001 0.0000 0.0000N2 1.0000 0.6196 0.0082 0.2500 0.0011 0.2451 0.0000 0.0006 0.0005 0.0006 0.0000 0.0008 0.0000 0.0014 0.0000 0.0000NH3 0.0000 0.0180 0.0000 0.0000 0.9954 0.0190 0.0000 0.0000 0.0000 0.0000 0.0000 0.0000 0.0000 0.0000 0.0000 0.0000O2 0.0000 0.0000 0.0000 0.0000 0.0000 0.0000 0.0000 0.0000 0.0000 0.0000 0.0000 0.0000 0.0000 0.0000 0.0000 0.0000SO2 0.0000 0.0000 0.0000 0.0000 0.0000 0.0000 0.0000 0.0000 0.0000 0.0000 0.0000 0.0049 0.0000 0.0000 0.0000 0.0000
Total 1.0000 1.0000 1.0000 1.0000 1.0000 1.0000 1.0000 1.0000 1.0000 1.0000 0.0000 1.0000 1.0000 1.0000 1.0000 1.0000
V-L Flowrate (kgmol/hr) 1,245 3,164 9,699 12,825 4,897 3,000 16,002 661 252 913 0 1,066 128 594 40,943 76,182V-L Flowrate (kg/hr) 34,865 79,621 22,112 109,703 83,295 26,414 700,235 22,915 8,966 31,881 0 28,895 5,548 17,247 737,593 1,372,447Solids Flowrate (kg/hr) 0 0 0 0 0 0 0 0 0 0 10,895 0 0 0 0 0
Temperature (°C) 117 25 25 21 -25 -28 35 48 48 48 177 232 35 51 566 39Pressure (MPa, abs) 3.241 0.138 3.238 13.614 13.048 3.238 15.272 0.163 0.163 0.163 0.119 0.085 3.272 0.103 12.512 0.827Enthalpy (kJ/kg) 117.116 30.226 323.138 68.608 -1,408.062 -99.105 -209.042 91.358 87.862 90.375 --- 1,165.597 -1.733 229.322 3,513.235 164.155Density (kg/m3) 27.9 1.4 2.9 44.7 668.7 13.9 779.4 2.1 2.2 2.1 5,281.0 0.5 67.5 1.2 34.9 993.0V-L Molecular Weight 28.013 25.166 2.280 8.554 17.010 8.805 43.759 34.655 35.629 34.923 --- 27.098 43.222 29.027 18.015 18.015
V-L Flowrate (lbmol/hr) 2,744 6,975 21,382 28,275 10,795 6,614 35,278 1,458 555 2,013 0 2,351 283 1,310 90,263 167,953V-L Flowrate (lb/hr) 76,865 175,535 48,749 241,854 183,634 58,232 1,543,753 50,520 19,766 70,286 0 63,702 12,231 38,023 1,626,113 3,025,728Solids Flowrate (lb/hr) 0 0 0 0 0 0 0 0 0 0 24,019 0 0 0 0 0
Temperature (°F) 242 77 77 70 -13 -19 95 119 119 119 351 450 95 123 1,050 102Pressure (psia) 470.0 20.0 469.6 1,974.5 1,892.5 469.6 2,215.0 23.7 23.7 23.7 17.3 12.3 474.5 14.9 1,814.7 120.0Enthalpy (Btu/lb) 50.4 13.0 138.9 29.5 -605.4 -42.6 -89.9 39.3 37.8 38.9 --- 501.1 -0.7 98.6 1,510.4 70.6Density (lb/ft3) 1.739 0.087 0.183 2.788 41.749 0.866 48.656 0.133 0.137 0.134 329.679 0.034 4.214 0.073 2.177 61.989

Cost and Performance Baseline for Coal-to-SNG and Ammonia (Volume 2)
139
4.2.2 System assumptions for Cases 3 and 4, Siemens gasifier using Illinois No. 6 coal with and without carbon sequestration, are compiled in
Key System Assumptions
Exhibit 4-27.
Exhibit 4-27 Cases 3 and 4 Plant Study Configuration Matrix
Case Case 3 Case 4 Gasifier Pressure, MPa (psia) 4.2 (615) 4.2 (615) O2:Coal Ratio, kg O2/kg dried coal 0.794 0.794 Carbon Conversion, % 99.5 99.5 Syngas HHV at Gasifier Outlet, kJ/Nm3 (Btu/scf) 10,237 (275) 10,237 (275)
Steam Cycle, MPa/°C (psig/°F) 12.4/566/536 (1800/1050/996)
12.4/566/537 (1800/1050/999)
Condenser Pressure, mm Hg (in Hg) 51 (2.0) 51 (2.0)
Combustion Turbine N/A N/A Gasifier Technology Siemens Siemens Oxidant 99 vol% Oxygen 99 vol% Oxygen Coal Illinois No. 6 Illinois No. 6 Coal Feed Moisture Content, % 11.12 11.12 COS Hydrolysis Reactor Yes Yes Water Gas Shift Yes Yes H2S Separation Selexol (1st Stage) Selexol (1st Stage) Sulfur Removal, % 99.4 99.9 CO2 Separation Selexol (2nd Stage) Selexol (2nd Stage) CO2 Sequestered, % N/A 69.0
Sulfur Recovery Claus Plant with Tail Gas
Treatment / Elemental Sulfur
Claus Plant with Tail Gas Treatment / Elemental
Sulfur
Methanation System Based on Haldor Topsoe TREMP™ Process
Based on Haldor Topsoe TREMP™ Process
Ammonia Synthesis Loop Based on Haldor Topsoe
S-300 reactor with KM1R catalyst
Based on Haldor Topsoe S-300 reactor with KM1R
catalyst
Particulate Control Scrubber and AGR Absorber
Scrubber and AGR Absorber
Mercury Control Carbon Bed Carbon Bed NOx Control N/A N/A
Balance of Plant and Sparing Philosophy The ammonia system feed and recycle compressors have 100 percent spares and the refrigeration unit is 2 x 50 percent. Consistent with other sections of the plant, non-rotating equipment is not spared in the ammonia plant.

Cost and Performance Baseline for Coal-to-SNG and Ammonia (Volume 2)
140
The remaining balance of plant assumptions and sparing philosophy are common to all cases and are presented in Section 4.1.
4.2.3 The Siemens SNG and ammonia co-production plant without and with carbon sequestration and using Illinois No. 6 coal produces a net SNG output of 42 Bscf/year (90 percent CF) and 2,204 TPD of ammonia.
Cases 3 and 4 Performance Results
Overall performance for the two plants is summarized in Exhibit 4-28, which includes auxiliary power requirements and production values. The ASU accounts for approximately 55 percent of the total auxiliary load in the non-sequestration case and 44 percent in the sequestration case, distributed between the main air compressor, the oxygen compressor, and ASU auxiliaries. CO2 compression accounts for about 18 percent of the total auxiliary load for the sequestration case. The AGR process accounts for about 11 percent and 9 percent of the auxiliary load for the non-sequestration and sequestration cases, respectively. The ammonia production process accounts for about 16 percent and 13 percent of the auxiliary load for the non-sequestration and sequestration cases, respectively. All other individual auxiliary loads are less than 3 percent of the total.

Cost and Performance Baseline for Coal-to-SNG and Ammonia (Volume 2)
141
Exhibit 4-28 Cases 3 and 4 Plant Performance Summary
POWER SUMMARY (Gross Power at Generator Terminals, kWe) Case 3 Case 4
Steam Turbine Power 292,300 292,300 TOTAL POWER, kWe 292,300 292,300
AUXILIARY LOAD SUMMARY, kWe Coal Handling 700 700
Coal Milling 4,500 4,500 Slag Handling 1,140 1,140
Air Separation Unit Auxiliaries 1,000 1,000 Air Separation Unit Main Air Compressor 121,610 121,640
Oxygen Compressor 16,750 16,740 Nitrogen Compressor 9,570 9,570
CO2 Solid Feed System Compressors 4,980 240 SNG Compressors 4,680 4,680
Methanation Plant Recycle Compressor 4,390 4,390 Ammonia Plant Compressors 26,290 26,610
Ammonia Plant Refrigeration System 15,590 15,580 Gasifier Pilot Fuel Compressor and Incinerator Air Blower 300 300
CO2 Compressor N/A 56,650 Boiler Feedwater Pumps 5,170 5,170
Condensate Pump 500 500 Quench Water Pump 640 640
Circulating Water Pump 6,200 6,220 Ground Water Pumps 670 680 Cooling Tower Fans 3,610 3,620
Scrubber Pumps 1,000 1,000 Acid Gas Removal 29,050 29,050
Steam Turbine Auxiliaries 100 100 Claus Plant/TGTU Auxiliaries 250 250
Claus Plant TG Recycle Compressor 310 320 Miscellaneous Balance of Plant2 3,000 3,000
Transformer Losses 1,600 1,740 TOTAL AUXILIARIES, kWe 263,600 316,030
NET POWER, kWe 28,700 -23,730 SNG Production Rate, MNm3/hr (Mscf/hr) 150.9 (5,333) 150.8 (5,328)
Ammonia Production Rate, kg/hr (lb/hr) 83,324 (183,698) 83,295 (183,634) Conversion Efficiency (HHVproduct/HHVcoal), % 61.5% 61.4%
Coal Feed Flow Rate, kg/hr (lb/hr) 437,263 (964,000) 437,263 (964,000) Thermal Input1, kWth 3,295,885 3,295,885
Condenser Cooling Duty, GJ/hr (MMBtu/hr) 1,772 (1,680) 1,772 (1,680) Raw Water Withdrawal, m3/min (gpm) 28.1 (7,434) 28.2 (7,458)
Raw Water Consumption, m3/min (gpm) 22.6 (5,979) 22.7 (5,997) 1 - HHV of Illinois No. 6 coal is 27,135 kJ/kg (11,666 Btu/lb) 2 - Includes plant control systems, lighting, HVAC, and miscellaneous low voltage loads

Cost and Performance Baseline for Coal-to-SNG and Ammonia (Volume 2)
142
Environmental Performance The environmental targets for emissions of Hg, NOx, SO2, and PM were presented in Section 2.5. A summary of the plant air emissions for Cases 3 and 4 is presented in Exhibit 4-29.
Exhibit 4-29 Cases 3 and 4 Air Emissions
kg/GJ (lb/106 Btu)
Tonne/year (ton/year)
90% capacity factor Case 3 Case 4 Case 3 Case 4
SO2 0.010
(0.023) 0.0002
(0.0006) 920 (1,014) 23 (26)
NOX Negligible Negligible Negligible Negligible
Particulates 0.003 (0.0071)
0.003 (0.0071) 286 (315) 286 (315)
Hg 2.46E-7 (5.71E-7)
2.46E-7 (5.71E-7)
0.023 (0.025)
0.023 (0.025)
CO2 63.0
(146.5) 4.1 (9.5) 5,891,839 (6,494,641)
384,029 (423,320)
The low level of SO2 emissions in Case 4 is achieved by capture of the sulfur in the gas by the two-stage Selexol AGR process and co-sequestration with the CO2 product. The clean syngas exiting the AGR process has a sulfur concentration of approximately 5 ppmv in both cases. The H2S-rich regeneration gas from the AGR system is fed to a Claus plant, producing elemental sulfur. The Claus plant tail gas is treated using an amine based system to capture most of the remaining sulfur. The clean syngas from the TGTU is combined with a slipstream of clean syngas from the Selexol process, passed through an incinerator, and the hot, inert incinerator offgas is used to dry coal prior to being vented to the atmosphere. The higher sulfur emissions in Case 3 are due to the sulfur contained in the CO2-rich stream from the Selexol process, which is vented rather than sequestered.
NOX emissions are negligible because no CT is used for power generation.
Particulate discharge to the atmosphere is limited to extremely low values by the use of a syngas scrubber and the gas washing effect of the AGR absorber. The particulate emissions represent filterable particulate only.
Ninety five percent of mercury is captured from the syngas by an activated carbon bed. CO2 emissions represent the uncontrolled (Case 3) and controlled (Case 4) discharge from the process.
The carbon balance for the two cases is shown in Exhibit 4-30. The carbon input to the plant consists of carbon in the air in addition to carbon in the coal. Carbon in the air is not used in the carbon capture equation below, but it is not neglected in the balance since Aspen accounts for air components throughout. Carbon leaves the plant as unburned carbon in the slag,

Cost and Performance Baseline for Coal-to-SNG and Ammonia (Volume 2)
143
Exhibit 4-30 Cases 3 and 4 Carbon Balance
Carbon In, kg/hr (lb/hr) Carbon Out, kg/hr (lb/hr) Case 3 Case 4 Case 3 Case 4
Coal 278,732 (614,499)
278,732 (614,499) Slag 1,394
(3,072) 1,394 (3,072)
Air (CO2) 228 (503) 228 (503) SNG
Purification Off-Gas
10,810 (23,832) N/A
ASU Vent 203 (447) 203 (447)
SNG 72,874 (160,660)
72,809 (160,517)
CO2 Selexol Vent
160,170 (353,115) N/A
CO2 Lock Hopper Vent
21,082 (46,477) 840 (1,852)
CO2 Product N/A 191,257 (421,650)
Stack 6,294 (13,876)
6,324 (13,942)
PSA Purge Gas
6,133 (13,521)
6,132 (13,519)
Total 278,961 (615,003)
278,960 (615,003) Total 278,961
(615,003) 278,960
(615,003)
CO2 in the stack gas, waste heat boiler gas, ASU vent gas, SNG product, and the CO2 product (either vented or sequestered). The carbon capture efficiency is presented in two distinct ways. The first way defines capture as the amount of carbon in the CO2 product for sequestration relative to the amount of carbon in the coal less carbon contained in the slag, and is represented by the following fraction:
(Carbon in Product for Sequestration)/[(Carbon in the Coal)-(Carbon in Slag)] or Non sequestration (Case 3)
(421,650)/(614,499-3,072)*100 = 69.0% (Case 4)
The second way does not penalize the production facility for the carbon converted to SNG product, as the end use of the SNG is unknown. In a carbon constrained scenario, the SNG may or may not be used in a scenario where CCS is implemented. For this method, the burden of carbon mitigation falls on the end-user. The following fraction represents this scenario:
[(Carbon in Product for Sequestration) + (Carbon in SNG Product)]/[(Carbon in the Coal)-(Carbon in Slag)] or
(0 + 160,660)/(614,499 – 3,072)*100 = 26.3% (Case 3) (421,650 + 160,517)/(614,499-3,072)*100 = 95.2% (Case 4)

Cost and Performance Baseline for Coal-to-SNG and Ammonia (Volume 2)
144
Exhibit 4-31 shows the sulfur balance for the plant. Sulfur input comes solely from the sulfur in the coal. Sulfur output includes the sulfur recovered in the Claus plant, sulfur in the SNG product, sulfur emitted in the stack gas, and sulfur co-sequestered with the CO2 product (Case 4 only). Sulfur in the slag is considered negligible. The total sulfur capture is represented by the following fraction:
(Sulfur byproduct + Sulfur in CO2 product)/Sulfur in the coal or (24,016 + 0)/24,162 = 99.4 percent (Case 3)
(24,019 + 128)/24,162 = 99.9 percent (Case 4)
Exhibit 4-31 Cases 3 and 4 Sulfur Balance
Sulfur In, kg/hr (lb/hr) Sulfur Out, kg/hr (lb/hr) Case 3 Case 4 Case 3 Case 4
Coal 10,960 (24,162)
10,960 (24,162)
Elemental Sulfur
10,893 (24,016)
10,895 (24,019)
SNG 4 (9) 4 (9) Ammonia 0 (0) 0 (0) CO2 Vent
Streams/Stack 61 (134) 2 (4)
CO2 Product N/A 58 (128) PSA Purge
Gas 1 (3) 1 (3)
Total 10,960 (24,162)
10,960 (24,162) Total 10,960
(24,162) 10,960
(24,162)
Exhibit 4-32 shows the overall water balance for the plant. Water demand represents the total amount of water required for a particular process. Some water is recovered within the process, primarily as syngas condensate, and is re-used as internal recycle. The difference between demand and recycle is raw water withdrawal. Raw water withdrawal is defined as the water removed from the ground or diverted from a surface-water source for use in the plant and was assumed to be provided 50 percent by a POTW and 50 percent from groundwater. Raw water withdrawal can be represented by the water metered from a raw water source and used in the plant processes for any and all purposes, such as cooling tower makeup, BFW makeup, quench system makeup, and slag handling makeup. The difference between water withdrawal and process water discharge is defined as water consumption and can be represented by the portion of the raw water withdrawn that is evaporated, transpired, incorporated into products or otherwise not returned to the water source from which it was withdrawn. Water consumption represents the net impact of the plant process on the water source balance.

Cost and Performance Baseline for Coal-to-SNG and Ammonia (Volume 2)
145
Exhibit 4-32 Cases 3 and 4 Water Balance
Case 3 Case 4 Water Demand, m3/min (gpm)
Slag Handling 0.95 (251) 0.95 (251) Quench/Wash 4.2 (1,116) 4.2 (1,116) Condenser Makeup 8.5 (2,258) 8.5 (2,258) Gasifier Steam 1.0 (273) 1.0 (273) Shift Steam 7.1 (1,881) 7.1 (1,882) BFW Makeup 0.39 (103) 0.39 (103) Cooling Tower 24.1 (6,371) 24.2 (6,396)
Total 37.8 (9,996) 37.9 (10,021) Internal Recycle, m3/min (gpm)
Slag Handling 0.95 (251) 0.95 (251) Quench/Wash 4.2 (1,116) 4.2 (1,116) Condenser Makeup 0.0 (0) 0.0 (0) Cooling Tower 4.5 (1,195) 4.5 (1,196) Water from Coal Drying 0.0 (0) 0.0 (0) BFW Blowdown 0.39 (103) 0.39 (103) SWS Blowdown 0.85 (224) 0.85 (224) SWS Excess 3.3 (868) 3.3 (869)
Total 9.7 (2,563) 9.7 (2,563) Raw Water Withdrawal, m3/min (gpm)
Slag Handling 0.0 (0) 0.0 (0) Quench/Wash 0.0 (0) 0.0 (0) Condenser Makeup 8.5 (2,258) 8.5 (2,258) Gasifier Steam 1.0 (273) 1.0 (273) Shift Steam 7.1 (1,881) 7.1 (1,882) BFW Makeup 0.39 (103) 0.39 (103) Cooling Tower 19.6 (5,176) 19.7 (5,200)
Total 28.1 (7,434) 28.2 (7,458) Process Water Discharge, m3/min (gpm)
SWS Blowdown 0.08 (22) 0.08 (22) Cooling Tower Blowdown 5.4 (1,433) 5.4 (1,438)
Total 5.5 (1,455) 5.5 (1,461) Raw Water Consumption, m3/min (gpm)
Slag Handling 0.0 (0) 0.0 (0) Quench/Wash 0.0 (0) 0.0 (0) SWS Blowdown -0.08 (-22) -0.08 (-22) Condenser Makeup 8.5 (2,258) 8.5 (2,258) Cooling Tower 14.2 (3,743) 14.2 (3,761)
Total 22.6 (5,979) 22.7 (5,997)
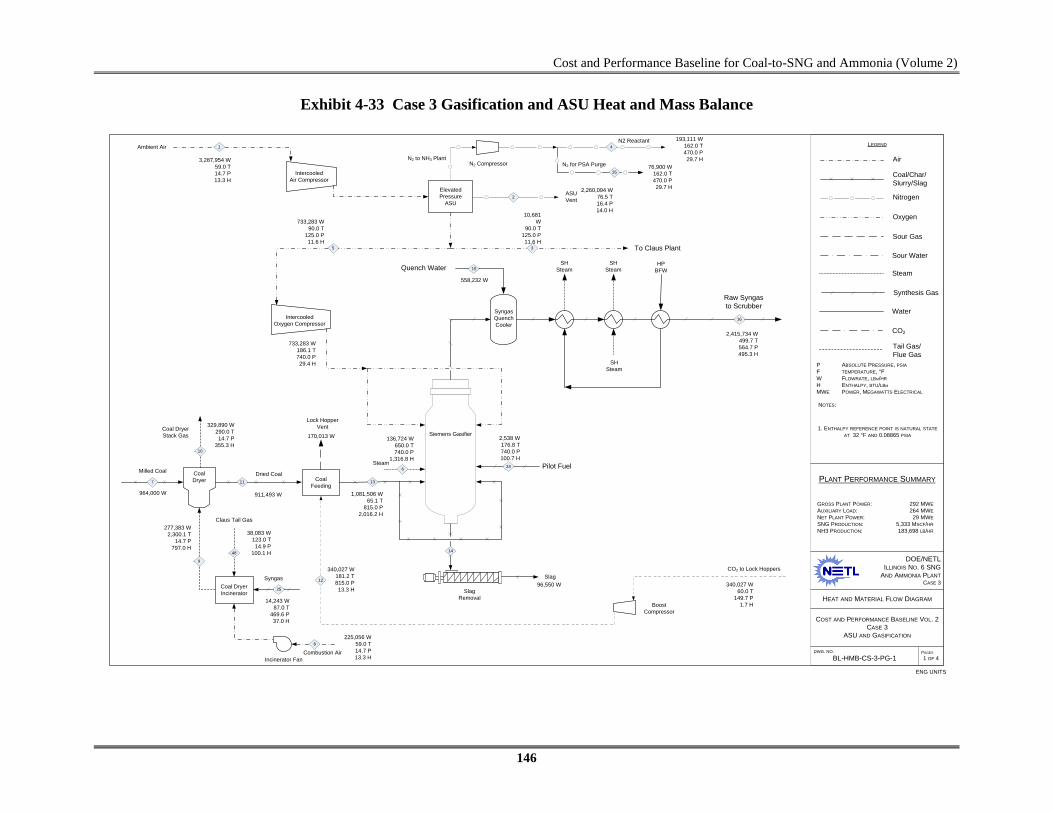
Cost and Performance Baseline for Coal-to-SNG and Ammonia (Volume 2)
146
Exhibit 4-33 Case 3 Gasification and ASU Heat and Mass Balance
N2 Reactant
N2 to NH3 Plant
Claus Tail Gas
NOTES:
1. ENTHALPY REFERENCE POINT IS NATURAL STATE AT 32 °F AND 0.08865 PSIA
DOE/NETLILLINOIS NO. 6 SNG
AND AMMONIA PLANTCASE 3
HEAT AND MATERIAL FLOW DIAGRAM
COST AND PERFORMANCE BASELINE VOL. 2CASE 3
ASU AND GASIFICATION
DWG. NO.
BL-HMB-CS-3-PG-1
PLANT PERFORMANCE SUMMARY
LEGEND
P ABSOLUTE PRESSURE, PSIAF TEMPERATURE, °FW FLOWRATE, LBM/HR H ENTHALPY, BTU/LBM
MWE POWER, MEGAWATTS ELECTRICAL
PAGES
1 OF 4
Ambient Air
IntercooledAir Compressor
ElevatedPressure
ASU
IntercooledOxygen Compressor
Milled Coal
ASUVent
SlagRemoval
Slag
GROSS PLANT POWER: 292 MWEAUXILIARY LOAD: 264 MWENET PLANT POWER: 29 MWESNG PRODUCTION: 5,333 MSCF/HRNH3 PRODUCTION: 183,698 LB/HR
Dried CoalCoal
Feeding
Steam
CO2 to Lock Hoppers
BoostCompressor
Siemens Gasifier
964,000 W
3,287,954 W59.0 T14.7 P13.3 H
733,283 W90.0 T
125.0 P11.6 H
733,283 W186.1 T740.0 P29.4 H
136,724 W650.0 T740.0 P
1,316.8 H
96,550 W
ENG UNITS
To Claus Plant
10,681 W
90.0 T125.0 P11.6 H
2,260,094 W76.5 T16.4 P14.0 H
329,890 W290.0 T14.7 P
355.3 H
277,383 W2,300.1 T
14.7 P797.0 H
SyngasQuenchCooler
Raw Syngasto Scrubber
SHSteam
5
1
117
3
14
6
2
Quench Water
16
Lock HopperVent
170,013 W
340,027 W181.2 T815.0 P13.3 H
12340,027 W
60.0 T149.7 P
1.7 H
15
558,232 W
SHSteam
SHSteam
2,415,734 W499.7 T564.7 P495.3 H
Air
Oxygen
Nitrogen
Coal/Char/Slurry/Slag
Sour Gas
Sour Water
Water
Steam
CO2
Tail Gas/Flue Gas
Pilot Fuel24
2,538 W176.8 T740.0 P100.7 H
1,081,506 W65.1 T
815.0 P2,016.2 H
Coal Dryer
Coal Dryer Incinerator
Incinerator FanCombustion Air
Syngas
Synthesis Gas
Coal DryerStack Gas
25
10
8
9
48
225,056 W59.0 T14.7 P13.3 H
911,493 W
38,083 W123.0 T14.9 P
100.1 H
14,243 W87.0 T
469.6 P37.0 H
13
193,111 W162.0 T470.0 P29.7 H
4
N2 for PSA Purge35
76,900 W162.0 T470.0 P29.7 H
N2 Compressor
HPBFW

Cost and Performance Baseline for Coal-to-SNG and Ammonia (Volume 2)
147
Exhibit 4-34 Case 3 Gas Cleanup Heat and Mass Balance
Mercury Removal
KnockOut
Drum
Raw Syngasto Scrubber
SourDrum
To Water Treatment
Makeup Water
CatalyticReactorBeds
HighTemperature
Shift
Blowdown
FromASU
LP CO2
ShiftSteam
HP BFW
SyngasCoolers
SourStripper
Two-StageSelexol
Clean Gas
CO2
Acid Gas
SyngasScrubber
CondensateTo DeaeratorCondensate
434,306 W550.0 T600.0 P
1,270.5 H
1,767,318 W417.8 T544.7 P436.2 H
2,415,734 W499.7 T564.7 P495.3 H
2,337,629 W361.6 T554.7 P414.1 H
1,738,163 W94.6 T
469.7 P19.2 H
578,942 W87.0 T
469.6 P37.0 H
50,203 W119.0 T23.7 P39.4 H
1,295,330 W41.5 T16.7 P3.2 H
1,117,815 W339.3 T115.0 P339.2 H
562,160 W87.0 T
469.6 P37.0 H
24,016 W
6,416 W291.1 T65.0 P
973.8 H
10,681 W90.0 T
125.0 P11.6 H
NOTES:
1. ENTHALPY REFERENCE POINT IS NATURAL STATE AT 32 °F AND 0.08865 PSIA
DOE/NETLILLINOIS NO. 6 SNG
AND AMMONIA PLANTCASE 3
HEAT AND MATERIAL FLOW DIAGRAM
COST AND PERFORMANCE BASELINE VOL. 2CASE 3
GAS CLEANUP
DWG. NO.
BL-HMB-CS-3-PG-2
PLANT PERFORMANCE SUMMARY
LEGEND
P ABSOLUTE PRESSURE, PSIAF TEMPERATURE, °FW FLOWRATE, LBM/HR H ENTHALPY, BTU/LBM
MWE POWER, MEGAWATTS ELECTRICAL
Air
Oxygen
Nitrogen
Coal/Char/Slurry/Slag
Synthesis Gas
PAGES
2 OF 4
Sour Gas
Sour Water
Water
Steam
GROSS PLANT POWER: 292 MWEAUXILIARY LOAD: 264 MWENET PLANT POWER: 29 MWESNG PRODUCTION: 5,333 MSCF/HRNH3 PRODUCTION: 183,698 LB/HR
1,504,037 W
263,281 W
23
21
16
46
CO2
Tail Gas/Flue Gas
17
18
20
263,281 W418.3 T534.7 P436.0 H
1,726,252 W95.0 T
479.7 P19.3 H
High TemperatureMethanation Reactor
Pre-heater
Tail Gas Cleanup Unit
3
22
CO2 to LockHoppers
VentedCO2 Product
Claus Plant
Tail Gas
Furnace
Sulfur
45
42
HP CO2
41
1,002,155 W42.0 T16.7 P3.7 H
633,202 W60.0 T
149.7 P1.7 H
340,027 W60.0 T
149.7 P1.7 H
Syngas toMethanation
BoostCompressor
2,538 W
Pilot Fuelto Gasifier
2,538 W176.8 T740.0 P100.7 H
24
Condensatefrom Methnation
63,051 W450.0 T12.3 P
502.6 H
47
11,911 W95.0 T
474.5 P-0.7 H
Tail GasCompressor
COS Hydrolysis
19
Incinerator Fuel25
To Coal Dryer
48
14,243 W87.0 T
469.6 P37.0 H
38,083 W123.0 T14.9 P
100.1 H
To NH3 Production
30
570,311 W417.8 T544.7 P436.2 H
2,201,624 W506.6 T519.7 P430.1 H
From NH3Plant AGR Unit
43
19,766 W119.0 T23.7 P37.8 H
44
69,969 W119.0 T23.7 P38.9 H
CO2 from NH3 PlantAGR Unit
526,339 W60.0 T
135.0 P2.8 H
From NH3 PlantKnockout Drum

Cost and Performance Baseline for Coal-to-SNG and Ammonia (Volume 2)
148
Exhibit 4-35 Case 3 Methanation and Power Block Heat and Mass Balance
Steam Seal Regulator
65 PSIA HeaderSteam Injection
To GasifierMake-up
GlandSteam
CondenserCondensate to Preheating
CondensatePump
3,026,965 W101.1 T
1.0 P69.1 H
1,128,953 W
1,628,301 W1,050.0 T1,814.7 P1,510.4 H
3,026,965 W102.4 T120.0 P70.6 H
1,400 W
1,400 W212.0 T14.7 P
179.9 H
136,724 W650.0 T740.0 P
1,316.8 H
NOTES:
1. ENTHALPY REFERENCE POINT IS NATURAL STATE AT 32 °F AND 0.08865 PSIA
DOE/NETLILLINOIS NO. 6 SNG
AND AMMONIA PLANTCASE 3
HEAT AND MATERIAL FLOW DIAGRAM
COST AND PERFORMANCE BASELINE VOL. 2CASE 3
METHANATION AND POWER BLOCK
DWG. NO.
BL-HMB-CS-3-PG-3
PLANT PERFORMANCE SUMMARY
LEGEND
P ABSOLUTE PRESSURE, PSIAF TEMPERATURE, °FW FLOWRATE, LBM/HR H ENTHALPY, BTU/LBM
MWE POWER, MEGAWATTS ELECTRICAL
Air
Oxygen
Nitrogen
Coal/Char/Slurry/Slag
Synthesis Gas
PAGES
3 OF 4
Sour Gas
Sour Water
Water
Steam
GROSS PLANT POWER: 292 MWEAUXILIARY LOAD: 264 MWENET PLANT POWER: 29 MWESNG PRODUCTION: 5,333 MSCF/HRNH3 PRODUCTION: 183,698 LB/HR
Flue Gas
Deaerator
HT Reactor
LP TURBINE GENERATORHP
TURBINEIP
TURBINE
HOT WELL
AIR-COOLED CONDENSER CONDENSER
IP Pump
To Shift SteamProduction
LP Pump
250 PSIAAttemperating Water
HP Pump
RecycleCompressor
Syngas fromSelexol Unit
KnockOut
Drum
Molecular Sieve
Purification Unit
Multistage Intercooled
SNG Compressor
Clean UpReatorHT Reactor
PurificationOff-Gas
SNGProduct
Condensate toSour Drum
ReactorPre-heater
SH Steam fromSyngas Cooler
IP BFW
SH Shift Steam
IP/LP BFW
IP/LP Steam IP Steam IP BFW
49
50
1,676,540 W
562,160 W87.0 T
469.6 P37.0 H
572.0 T447.5 P629.2 H
587.7 T475.0 P638.2 H
572.0 T464.6 P566.5 H
1,286.4 T457.5 P
1,096.8 H
1,599,984 W
1,031.0 T436.8 P964.6 H
392.0 T426.8 P580.9 H
649.6 T416.1 P774.9 H
335.0 T406.1 P412.1 H
321,514 W95.0 T
396.1 P18.0 H
95.0 T20.1 P20.7 H
233,520 W95.0 T
381.0 P20.5 H
233,520 W95.0 T
899.5 P5.6 H
1,128,263 W278.6 T450.0 P248.2 H
835,485 W
571,473 W298.0 T65.0 P
1,178.6 H
1,314,630 W503.2 T65.0 P
1,283.6 H
IP BFW
14,459 W278.5 T379.0 P247.9 H
26
27 28 29
10,910 W658.0 T18.0 P
1,362.6 H
To Shift Steam105,137 W550.0 T600.0 P
1,255.0 H
P-753
To Syngas Cooler
Reheater(Syngas Cooler)
AttemperationWater
1,380,249 W996.3 T501.4 P
1,517.9 H
21,656 W

Cost and Performance Baseline for Coal-to-SNG and Ammonia (Volume 2)
149
Exhibit 4-36 Case 3 Ammonia Production Heat and Mass Balance
AmmoniaProduct
NOTES:
1. ENTHALPY REFERENCE POINT IS NATURAL STATE AT 32 °F AND 0.08865 PSIA
DOE/NETLILLINOIS NO. 6 SNG
AND AMMONIA PLANTCASE 3
HEAT AND MATERIAL FLOW DIAGRAM
COST AND PERFORMANCE BASELINE VOL. 2CASE 3
AMMONIA PRODUCTION
DWG. NO.
BL-HMB-CS-3-PG-3
PLANT PERFORMANCE SUMMARY
LEGEND
P ABSOLUTE PRESSURE, PSIAF TEMPERATURE, °FW FLOWRATE, LBM/HR H ENTHALPY, BTU/LBM
MWE POWER, MEGAWATTS ELECTRICAL
Air
CO2
Nitrogen
Coal/Char/Slurry/Slag
Synthesis Gas
PAGES
4 OF 4
Ammonia Process Gas
Sour Water
Water
Steam
GROSS PLANT POWER: 292 MWEAUXILIARY LOAD: 264 MWENET PLANT POWER: 29 MWESNG PRODUCTION: 5,333 MSCF/HRNH3 PRODUCTION: 183,698 LB/HR
Ammonia
Radial BedReactor
Superheater
RecycleCompressor
FinalReheater
RecycleLoop Heater
AmmoniaFlash Tank
AmmoniaFlash Tank
IP Steam
1,024,695 W650.0 T
2,030.0 P504.2 H
1,024,695 W949.5 T
1,955.0 P711.0 H
1,024,695 W720.0 T
1,954.0 P527.0 H
1,024,695 W73.5 T
1,948.0 P-2.4 H
1,024,695 W420.9 T
2,035.0 P316.5 H
1,024,695 W
241,888 W
193,111 W162.0 T470.0 P29.7 H
1,024,695 W-13.3 T
1,892.5 P-42.8 H
39
IP Boiler RecycleLoop Heater
BFW
MakeupCompressor
Shifted Syngas
Liquid NH3Cooler
Purge Gas
Liquid NH3Cooler
4
38
40
37
48,777 W69.2 T
469.6 P114.9 H
183,698 W-13.3 T
1,892.5 P-605.4 H
58,197 W-19.2 T
469.6 P-42.6 H
Shift Reactor 1
Shift Steam506,315 W
550.0 T600.0 P
1,270.5 H
570,311 W417.8 T544.7 P436.2 H
31
30
Shift Reactor 2
SyngasCoolers
Mercury Removal
Two-StageSelexol
Clean Gas
CO2
Acid Gas
PSA Unit
Acid Gas toClaus Plant
43
CO2 Product
Purge Nitrogen
WHB
WHB CombustionAir Fan
WHB Stack Gas
Flue Gas
35
76,900 W162.0 T470.0 P29.7 H1,076,627 W
450.0 T534.2 P643.3 H
32
635,320 W95.0 T
489.2 P19.2 H
33635,320 W
94.2 T479.2 P19.0 H
34
89,214 W87.0 T
469.6 P81.8 H
36175,534 W
69.2 T20.0 P10.7 H
124,353 W59.0 T16.2 P10.6 H
299,887 W325.0 T15.7 P
169.4 H
BFW
Steam/WaterMixture
19,766 W119.0 T23.7 P37.8 H
526,339 W60.0 T
135.0 P2.8 H
KnockoutDrum
CondensateTo Sour Drum

Cost and Performance Baseline for Coal-to-SNG and Ammonia (Volume 2)
150
Exhibit 4-37 Case 4 Gasification and ASU Heat and Mass Balance
N2 Reactant
N2 to NH3 Plant
Claus Tail Gas
NOTES:
1. ENTHALPY REFERENCE POINT IS NATURAL STATE AT 32 °F AND 0.08865 PSIA
DOE/NETLILLINOIS NO. 6 SNG
AND AMMONIA PLANTW/ CO2 CAPTURE
CASE 4
HEAT AND MATERIAL FLOW DIAGRAM
COST AND PERFORMANCE BASELINE VOL. 2CASE 4
ASU AND GASIFICATION
DWG. NO.
BL-HMB-CS-4-PG-1
PLANT PERFORMANCE SUMMARY
LEGEND
P ABSOLUTE PRESSURE, PSIAF TEMPERATURE, °FW FLOWRATE, LBM/HR H ENTHALPY, BTU/LBM
MWE POWER, MEGAWATTS ELECTRICAL
PAGES
1 OF 4
Ambient Air
IntercooledAir Compressor
ElevatedPressure
ASU
IntercooledOxygen Compressor
Milled Coal
ASUVent
SlagRemoval
Slag
GROSS PLANT POWER: 292 MWEAUXILIARY LOAD: 316 MWENET PLANT POWER: -24 MWESNG PRODUCTION: 5,328 MSCF/HRNH3 PRODUCTION: 183,634 LB/HR
Dried CoalCoal
Feeding
Steam
CO2 to Lock Hoppers
BoostCompressor
Siemens Gasifier
964,000 W
3,288,691 W59.0 T14.7 P13.3 H
733,114 W90.0 T
125.0 P11.6 H
733,114 W186.1 T740.0 P29.4 H
136,724 W650.0 T740.0 P
1,316.8 H
96,550 W
ENG UNITS
To Claus Plant
11,017 W
90.0 T125.0 P11.6 H
2,260,701 W76.5 T16.4 P14.0 H
328,647 W290.0 T14.7 P
355.9 H
276,140 W2,308.2 T
14.7 P799.7 H
SyngasQuenchCooler
Raw Syngasto Scrubber
SHSteam
5
1
117
3
14
6
2
Quench Water
16
Lock HopperVent
6,782 W
340,026 W179.4 T815.0 P11.8 H
12340,026 W
165.5 T750.0 P
9.5 H
15
558,027 W
SHSteam
SHSteam
2,415,359 W499.7 T564.7 P495.2 H
Air
Oxygen
Nitrogen
Coal/Char/Slurry/Slag
Sour Gas
Sour Water
Water
Steam
CO2
Tail Gas/Flue Gas
Pilot Fuel24
2,538 W176.8 T740.0 P100.7 H
1,081,506 W64.7 T
815.0 P2,018.2 H
Coal Dryer
Coal Dryer Incinerator
Incinerator FanCombustion Air
Syngas
Synthesis Gas
Coal DryerStack Gas
25
10
8
9
48
223,666 W59.0 T14.7 P13.3 H
911,493 W
38,023 W123.0 T14.9 P98.6 H
14,451 W87.0 T
469.6 P37.0 H
13
193,105 W242.0 T470.0 P50.4 H
4
N2 for PSA Purge35 76,865 W
242.0 T470.0 P50.4 H
N2 Compressor
HPBFW

Cost and Performance Baseline for Coal-to-SNG and Ammonia (Volume 2)
151
Exhibit 4-38 Case 4 Gas Cleanup Heat and Mass Balance
Mercury Removal
KnockOut
Drum
Raw Syngasto Scrubber
SourDrum
To Water Treatment
Makeup Water
CatalyticReactorBeds
HighTemperature
Shift
Blowdown
FromASU
ShiftSteam
HP BFW
SyngasCoolers
SourStripper
Two-StageSelexol
Clean Gas
CO2
Acid Gas
SyngasScrubber
CondensateTo DeaeratorCondensate
434,462 W550.0 T600.0 P
1,270.5 H
1,766,999 W417.8 T544.7 P436.1 H
2,415,359 W499.7 T564.7 P495.2 H
2,337,208 W361.6 T554.7 P414.0 H
1,738,377 W94.6 T
469.7 P19.2 H
578,766 W87.0 T
469.6 P37.0 H
50,520 W119.0 T23.7 P39.3 H
1,117,862 W339.3 T115.0 P339.2 H
561,777 W87.0 T
469.6 P37.0 H
24,019 W
6,417 W291.1 T65.0 P
973.8 H
11,017 W90.0 T
125.0 P11.6 H
NOTES:
1. ENTHALPY REFERENCE POINT IS NATURAL STATE AT 32 °F AND 0.08865 PSIA
DOE/NETLILLINOIS NO. 6 SNG
AND AMMONIA PLANTW/ CO2 CAPTURE
CASE 4
HEAT AND MATERIAL FLOW DIAGRAM
COST AND PERFORMANCE BASELINE VOL. 2CASE 4
GAS CLEANUP
DWG. NO.
BL-HMB-CS-4-PG-2
PLANT PERFORMANCE SUMMARY
LEGEND
P ABSOLUTE PRESSURE, PSIAF TEMPERATURE, °FW FLOWRATE, LBM/HR H ENTHALPY, BTU/LBM
MWE POWER, MEGAWATTS ELECTRICAL
Air
Oxygen
Nitrogen
Coal/Char/Slurry/Slag
Synthesis Gas
PAGES
2 OF 4
Sour Gas
Sour Water
Water
Steam
GROSS PLANT POWER: 292 MWEAUXILIARY LOAD: 316 MWENET PLANT POWER: -24 MWESNG PRODUCTION: 5,328 MSCF/HRNH3 PRODUCTION: 183,634 LB/HR
1,503,810 W
263,189 W
23
21
16
46
CO2
Tail Gas/Flue Gas
17
18
20
263,189 W418.3 T534.7 P435.9 H
1,726,146 W95.0 T
479.7 P19.3 H
High TemperatureMethanation Reactor
Pre-heater
Tail Gas Cleanup Unit
3
22
Claus Plant
Tail Gas
Furnace
Sulfur
45
42
Syngas toMethanation
BoostCompressor
2,538 W
Pilot Fuelto Gasifier
2,538 W176.8 T740.0 P100.7 H
24
Condensatefrom Methnation
63,702 W450.0 T12.3 P
501.1 H
4712,231 W
95.0 T474.5 P
-0.7 H
Tail GasCompressor
COS Hydrolysis
19
Incinerator Fuel25
To Coal Dryer
48
14,451 W87.0 T
469.6 P37.0 H
38,023 W123.0 T14.9 P98.6 H
To NH3 Production
30
570,209 W417.8 T544.7 P436.1 H
2,201,461 W506.7 T519.7 P430.1 H
From NH3Plant AGR Unit
43
19,766 W119.0 T23.7 P37.8 H
44
70,286 W119.0 T23.7 P38.9 H
From NH3 PlantKnockout Drum
SNG PurificationOff Gas
340,026 W165.5 T750.0 P
9.5 H
CO2 to Sequestration
CO2 toLock Hoppers
1,543,753 W95.0 T
2,215.0 P-89.9 H
27
41
LP LockHopper Vent HP Lock
Hopper Vent
LP CO2
27,751 W
135,480 W
768,698 W81.4 T
149.7 P6.2 H
1,118,018 W49.8 T16.7 P5.7 H
HP CO2
CO2 from NH3 Plant
526,308 W60.0 T
135.0 P2.8 H
95.0 T20.1 P20.7 H

Cost and Performance Baseline for Coal-to-SNG and Ammonia (Volume 2)
152
Exhibit 4-39 Case 4 Methanation and Power Block Heat and Mass Balance
Steam Seal Regulator
65 PSIA HeaderSteam Injection
To GasifierMake-up
GlandSteam
CondenserCondensate to Preheating
CondensatePump
3,025,728 W101.1 T
1.0 P69.1 H
1,129,574 W
1,626,113 W1,050.0 T1,814.7 P1,510.4 H
3,025,728 W102.4 T120.0 P70.6 H
1,400 W
1,400 W212.0 T14.7 P
179.9 H
136,724 W650.0 T740.0 P
1,316.8 H
NOTES:
1. ENTHALPY REFERENCE POINT IS NATURAL STATE AT 32 °F AND 0.08865 PSIA
DOE/NETLILLINOIS NO. 6 SNG
AND AMMONIA PLANTW/ CO2 CAPTURE
CASE 4
HEAT AND MATERIAL FLOW DIAGRAM
COST AND PERFORMANCE BASELINE VOL. 2CASE 4
METHANATION AND POWER BLOCK
DWG. NO.
BL-HMB-CS-4-PG-3
PLANT PERFORMANCE SUMMARY
LEGEND
P ABSOLUTE PRESSURE, PSIAF TEMPERATURE, °FW FLOWRATE, LBM/HR H ENTHALPY, BTU/LBM
MWE POWER, MEGAWATTS ELECTRICAL
Air
Oxygen
Nitrogen
Coal/Char/Slurry/Slag
Synthesis Gas
PAGES
3 OF 4
Sour Gas
Sour Water
Water
Steam
GROSS PLANT POWER: 292 MWEAUXILIARY LOAD: 316 MWENET PLANT POWER: -24 MWESNG PRODUCTION: 5,328 MSCF/HRNH3 PRODUCTION: 183,634 LB/HR
Flue Gas
Deaerator
HT Reactor
LP TURBINE GENERATORHP
TURBINEIP
TURBINE
HOT WELL
AIR-COOLED CONDENSER CONDENSER
IP Pump
To Shift SteamProduction
LP Pump
250 PSIAAttemperating Water
HP Pump
RecycleCompressor
Syngas fromSelexol Unit
KnockOut
Drum
Molecular Sieve
Purification Unit
Multistage Intercooled
SNG Compressor
Clean UpReatorHT Reactor
PurificationOff-Gas
SNGProduct
Condensate toSour Drum
ReactorPre-heater
SH Steam fromSyngas Cooler
IP BFW
SH Shift Steam
IP/LP BFW
IP/LP Steam IP Steam IP BFW
49
50
1,674,411 W
561,777 W87.0 T
469.6 P37.0 H
572.0 T447.5 P629.0 H
587.7 T475.0 P638.1 H
572.0 T464.6 P566.3 H
1,286.5 T457.5 P
1,096.6 H
1,598,903 W
1,031.1 T436.8 P964.4 H
392.0 T426.8 P580.7 H
649.6 T416.1 P774.7 H
335.0 T406.1 P412.1 H
321,400 W95.0 T
396.1 P18.0 H
95.0 T20.1 P20.7 H
233,309 W95.0 T
381.0 P20.5 H
233,309 W95.0 T
899.5 P5.6 H
1,129,561 W278.6 T450.0 P248.2 H
835,387 W
571,489 W298.0 T65.0 P
1,178.6 H
1,312,757 W505.5 T65.0 P
1,284.8 H
IP BFW
14,394 W278.5 T379.0 P247.9 H
26
27 28 29
10,908 W658.3 T18.0 P
1,362.7 H
To Shift Steam105,776 W550.0 T600.0 P
1,255.0 H
To Syngas Cooler
AttemperationWater
1,377,381 W999.5 T501.4 P
1,519.6 H
21,706 W

Cost and Performance Baseline for Coal-to-SNG and Ammonia (Volume 2)
153
Exhibit 4-40 Case 4 Ammonia Production Heat and Mass Balance
N2 Reactant
AmmoniaProduct
NOTES:
1. ENTHALPY REFERENCE POINT IS NATURAL STATE AT 32 °F AND 0.08865 PSIA
DOE/NETLILLINOIS NO. 6 SNG
AND AMMONIA PLANTW/ CO2 CAPTURE
CASE 4
HEAT AND MATERIAL FLOW DIAGRAM
COST AND PERFORMANCE BASELINE VOL. 2CASE 4
AMMONIA PRODUCTION
DWG. NO.
BL-HMB-CS-4-PG-3
PLANT PERFORMANCE SUMMARY
LEGEND
P ABSOLUTE PRESSURE, PSIAF TEMPERATURE, °FW FLOWRATE, LBM/HR H ENTHALPY, BTU/LBM
MWE POWER, MEGAWATTS ELECTRICAL
Air
CO2
Nitrogen
Coal/Char/Slurry/Slag
Synthesis Gas
PAGES
4 OF 4
Ammonia Process Gas
Sour Water
Water
Steam
GROSS PLANT POWER: 292 MWEAUXILIARY LOAD: 316 MWENET PLANT POWER: -24 MWESNG PRODUCTION: 5,328 MSCF/HRNH3 PRODUCTION: 183,634 LB/HR
Ammonia
Radial BedReactor
Superheater
RecycleCompressor
FinalReheater
RecycleLoop Heater
AmmoniaFlash Tank
AmmoniaFlash Tank
IP Steam
1,025,099 W650.0 T
2,030.0 P503.8 H
1,025,099 W949.5 T
1,955.0 P710.4 H
1,025,099 W720.0 T
1,954.0 P526.6 H
1,025,099 W73.5 T
1,948.0 P-2.4 H
1,025,099 W420.9 T
2,035.0 P316.2 H
1,025,099 W
241,854 W
193,105 W242.0 T470.0 P50.4 H
1,025,099 W-13.3 T
1,892.5 P-42.8 H
39
IP Boiler RecycleLoop Heater
BFW
MakeupCompressor
Shifted Syngas
Liquid NH3Cooler
Purge Gas
Liquid NH3Cooler
38
40
37
48,749 W77.1 T
469.6 P138.9 H
183,634 W-13.3 T
1,892.5 P-605.4 H
58,232 W-19.2 T
469.6 P-42.6 H
Shift Reactor 1
Shift Steam506,295 W
550.0 T600.0 P
1,270.5 H
570,209 W417.8 T544.7 P436.1 H
31
30
Shift Reactor 2
SyngasCoolers
Mercury Removal
Two-StageSelexol
Clean Gas
CO2
Acid Gas
PSA Unit
Acid Gas toClaus Plant
43
CO2 Product
Purge Nitrogen
WHB
WHB CombustionAir Fan
WHB Stack Gas
Flue Gas
35
76,865 W242.0 T470.0 P50.4 H1,076,504 W
450.0 T534.2 P643.3 H
32
635,261 W95.0 T
489.2 P19.2 H
33635,261 W
94.2 T479.2 P19.0 H
34
89,187 W87.0 T
469.6 P81.8 H
36175,535 W
77.1 T20.0 P13.0 H
124,191 W59.0 T16.0 P10.6 H
299,726 W325.0 T15.5 P
169.4 H
4
BFW
Steam/WaterMixture
19,766 W119.0 T23.7 P37.8 H
526,308 W60.0 T
135.0 P2.8 H
KnockoutDrum
CondensateTo Sour Drum
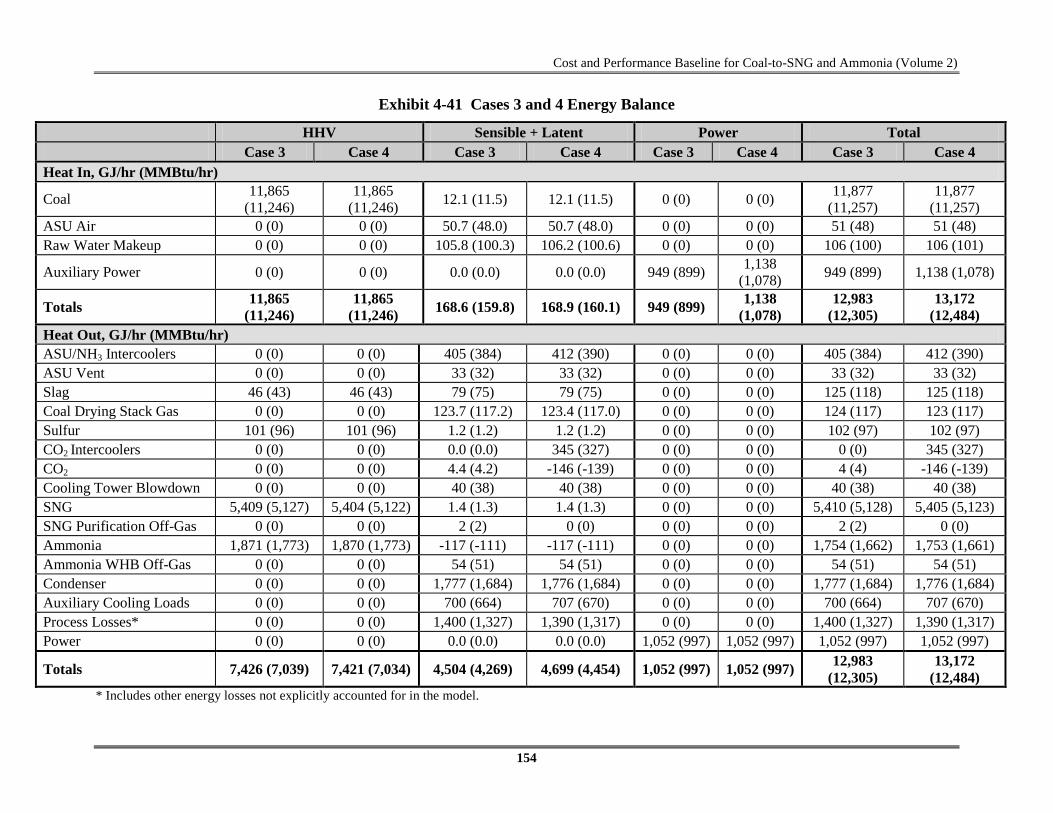
Cost and Performance Baseline for Coal-to-SNG and Ammonia (Volume 2)
154
Exhibit 4-41 Cases 3 and 4 Energy Balance
HHV Sensible + Latent Power Total Case 3 Case 4 Case 3 Case 4 Case 3 Case 4 Case 3 Case 4 Heat In, GJ/hr (MMBtu/hr)
Coal 11,865 (11,246)
11,865 (11,246) 12.1 (11.5) 12.1 (11.5) 0 (0) 0 (0) 11,877
(11,257) 11,877
(11,257) ASU Air 0 (0) 0 (0) 50.7 (48.0) 50.7 (48.0) 0 (0) 0 (0) 51 (48) 51 (48) Raw Water Makeup 0 (0) 0 (0) 105.8 (100.3) 106.2 (100.6) 0 (0) 0 (0) 106 (100) 106 (101)
Auxiliary Power 0 (0) 0 (0) 0.0 (0.0) 0.0 (0.0) 949 (899) 1,138 (1,078) 949 (899) 1,138 (1,078)
Totals 11,865 (11,246)
11,865 (11,246) 168.6 (159.8) 168.9 (160.1) 949 (899) 1,138
(1,078) 12,983
(12,305) 13,172
(12,484) Heat Out, GJ/hr (MMBtu/hr) ASU/NH3 Intercoolers 0 (0) 0 (0) 405 (384) 412 (390) 0 (0) 0 (0) 405 (384) 412 (390) ASU Vent 0 (0) 0 (0) 33 (32) 33 (32) 0 (0) 0 (0) 33 (32) 33 (32) Slag 46 (43) 46 (43) 79 (75) 79 (75) 0 (0) 0 (0) 125 (118) 125 (118) Coal Drying Stack Gas 0 (0) 0 (0) 123.7 (117.2) 123.4 (117.0) 0 (0) 0 (0) 124 (117) 123 (117) Sulfur 101 (96) 101 (96) 1.2 (1.2) 1.2 (1.2) 0 (0) 0 (0) 102 (97) 102 (97) CO2 Intercoolers 0 (0) 0 (0) 0.0 (0.0) 345 (327) 0 (0) 0 (0) 0 (0) 345 (327) CO2 0 (0) 0 (0) 4.4 (4.2) -146 (-139) 0 (0) 0 (0) 4 (4) -146 (-139) Cooling Tower Blowdown 0 (0) 0 (0) 40 (38) 40 (38) 0 (0) 0 (0) 40 (38) 40 (38) SNG 5,409 (5,127) 5,404 (5,122) 1.4 (1.3) 1.4 (1.3) 0 (0) 0 (0) 5,410 (5,128) 5,405 (5,123) SNG Purification Off-Gas 0 (0) 0 (0) 2 (2) 0 (0) 0 (0) 0 (0) 2 (2) 0 (0) Ammonia 1,871 (1,773) 1,870 (1,773) -117 (-111) -117 (-111) 0 (0) 0 (0) 1,754 (1,662) 1,753 (1,661) Ammonia WHB Off-Gas 0 (0) 0 (0) 54 (51) 54 (51) 0 (0) 0 (0) 54 (51) 54 (51) Condenser 0 (0) 0 (0) 1,777 (1,684) 1,776 (1,684) 0 (0) 0 (0) 1,777 (1,684) 1,776 (1,684) Auxiliary Cooling Loads 0 (0) 0 (0) 700 (664) 707 (670) 0 (0) 0 (0) 700 (664) 707 (670) Process Losses* 0 (0) 0 (0) 1,400 (1,327) 1,390 (1,317) 0 (0) 0 (0) 1,400 (1,327) 1,390 (1,317) Power 0 (0) 0 (0) 0.0 (0.0) 0.0 (0.0) 1,052 (997) 1,052 (997) 1,052 (997) 1,052 (997)
Totals 7,426 (7,039) 7,421 (7,034) 4,504 (4,269) 4,699 (4,454) 1,052 (997) 1,052 (997) 12,983 (12,305)
13,172 (12,484)
* Includes other energy losses not explicitly accounted for in the model.

Cost and Performance Baseline for Coal-to-SNG and Ammonia (Volume 2)
155
4.2.4 Major equipment items for the Siemens gasifier SNG and ammonia co-production plant without and with carbon sequestration using Illinois No. 6 coal are shown in the following tables. The accounts used in the equipment list correspond to the account numbers used in the cost estimates in Section
Cases 3 and 4 Equipment Lists
4.2.5. In general, the design conditions include a 10 percent contingency for flows and heat duties and a 21 percent contingency for heads on pumps and fans.

Cost and Performance Baseline for Coal-to-SNG and Ammonia (Volume 2)
156
ACCOUNT 1 COAL HANDLING Equipment
No. Description Type Operating Qty. Spares Case 3 Design
Condition Case 4 Design
Condition
1 Bottom Trestle Dumper and Receiving Hoppers
N/A 2 0 181 tonne (200 ton) 181 tonne (200 ton)
2 Feeder Belt 2 0 572 tonne/hr (630 tph) 572 tonne/hr (630 tph)
3 Conveyor No. 1 Belt 1 0 1,134 tonne/hr (1,250 tph)
1,134 tonne/hr (1,250 tph)
4 Transfer Tower No. 1 Enclosed 1 0 N/A N/A
5 Conveyor No. 2 Belt 1 0 1,134 tonne/hr (1,250 tph)
1,134 tonne/hr (1,250 tph)
6 As-Received Coal Sampling System Two-stage 1 0 N/A N/A
7 Stacker/Reclaimer Traveling, linear 1 0 1,134 tonne/hr
(1,250 tph) 1,134 tonne/hr
(1,250 tph) 8 Reclaim Hopper N/A 2 1 91 tonne (100 ton) 91 tonne (100 ton) 9 Feeder Vibratory 2 1 363 tonne/hr (400 tph) 363 tonne/hr (400 tph)
10 Conveyor No. 3 Belt w/ tripper 1 0 726 tonne/hr (800 tph) 726 tonne/hr (800 tph)
11 Crusher Tower N/A 1 0 N/A N/A
12 Coal Surge Bin w/ Vent Filter Dual outlet 2 0 363 tonne (400 ton) 363 tonne (400 ton)
13 Crusher Impactor reduction 2 0 8 cm x 0 - 3 cm x 0
(3" x 0 - 1-1/4" x 0) 8 cm x 0 - 3 cm x 0 (3" x 0 - 1-1/4" x 0)
14 As-Fired Coal Sampling System
Swing hammer 1 1 N/A N/A

Cost and Performance Baseline for Coal-to-SNG and Ammonia (Volume 2)
157
Equipment No. Description Type Operating
Qty. Spares Case 3 Design Condition
Case 4 Design Condition
15 Conveyor No. 4 Belt w/tripper 1 0 726 tonne/hr (800 tph) 726 tonne/hr (800 tph)
16 Transfer Tower No. 2 Enclosed 1 0 N/A N/A
17 Conveyor No. 5 Belt w/ tripper 1 0 726 tonne/hr (800 tph) 726 tonne/hr (800 tph)
18 Coal Silo w/ Vent Filter and Slide Gates
Field erected 3 0 1,633 tonne (1,800 ton) 1,633 tonne (1,800 ton)
ACCOUNT 2 COAL PREPARATION AND FEED
Equipment No. Description Type Operating
Qty. Spares Case 3 Design Condition
Case 4 Design Condition
1 Feeder Vibratory 6 0 82 tonne/hr (90 tph) 82 tonne/hr (90 tph)
2 Conveyor No. 6
Belt w/tripper 3 0 163 tonne/hr (180 tph) 163 tonne/hr (180 tph)
3 Roller Mill Feed Hopper Dual Outlet 3 0 318 tonne (350 ton) 318 tonne (350 ton)
4 Weigh Feeder Belt 6 0 82 tonne/hr (90 tph) 82 tonne/hr (90 tph) 5 Pulverizer Rotary 6 0 82 tonne/hr (90 tph) 82 tonne/hr (90 tph)

Cost and Performance Baseline for Coal-to-SNG and Ammonia (Volume 2)
158
ACCOUNT 3 FEEDWATER AND MISCELLANEOUS SYSTEMS AND EQUIPMENT
Equipment No. Description Type Operating
Qty. Spares Case 3 Design Condition
Case 4 Design Condition
1 Demineralized Water Storage Tank
Vertical, cylindrical, outdoor
3 0 726,799 liters (192,000 gal)
726,799 liters (192,000 gal)
2 Condensate Pumps
Vertical canned 2 1
12,681 lpm @ 91 m H2O (3,350 gpm @ 300 ft
H2O)
12,681 lpm @ 91 m H2O (3,350 gpm @ 300 ft
H2O)
3 Deaerator Horizontal spray type 2 0 920,793 kg/hr
(2,030,000 lb/hr) 920,793 kg/hr
(2,030,000 lb/hr)
4
Intermediate Pressure Feedwater Pump
Horizontal centrifugal, single stage
2 1 8,479 lpm @ 341 m H2O
(2,240 gpm @ 1120 ft H2O)
8,517 lpm @ 341 m H2O (2,250 gpm @ 1120 ft
H2O)
5 High Pressure Feedwater Pump
Barrel type, multi-stage, centrifugal
2 1 HP water: 7,268 lpm @
1,676 m H2O (1,920 gpm @ 5,500 ft H2O)
HP water: 7,230 lpm @ 1,676 m H2O (1,910 gpm
@ 5,500 ft H2O)
6 Auxiliary Boiler Shop fabricated, water tube
1 0
18,144 kg/hr, 2.8 MPa, 343°C
(40,000 lb/hr, 400 psig, 650°F)
18,144 kg/hr, 2.8 MPa, 343°C
(40,000 lb/hr, 400 psig, 650°F)
7 Service Air Compressors
Flooded Screw 3 1 28 m3/min @ 0.7 MPa
(1,000 scfm @ 100 psig) 28 m3/min @ 0.7 MPa
(1,000 scfm @ 100 psig)
8 Instrument Air Dryers
Duplex, regenerative 3 1 28 m3/min (1,000 scfm) 28 m3/min (1,000 scfm)
9 Closed Cycle Cooling Heat Exchangers
Plate and frame 2 0 608 GJ/hr
(576 MMBtu/hr) each 615 GJ/hr
(583 MMBtu/hr)

Cost and Performance Baseline for Coal-to-SNG and Ammonia (Volume 2)
159
Equipment No. Description Type Operating
Qty. Spares Case 3 Design Condition
Case 4 Design Condition
10 Closed Cycle Cooling Water Pumps
Horizontal centrifugal 2 1
218,040 lpm @ 21 m H2O
(57,600 gpm @ 70 ft H2O)
220,690 lpm @ 21 m H2O
(58,300 gpm @ 70 ft H2O)
11 Engine-Driven Fire Pump
Vertical turbine, diesel engine
1 1 3,785 lpm @ 107 m H2O
(1,000 gpm @ 350 ft H2O)
3,785 lpm @ 107 m H2O (1,000 gpm @ 350 ft
H2O)
12 Fire Service Booster Pump
Two-stage horizontal centrifugal
1 1 2,650 lpm @ 76 m H2O (700 gpm @ 250 ft H2O)
2,650 lpm @ 76 m H2O (700 gpm @ 250 ft H2O)
13 Raw Water Pumps
Stainless steel, single suction
2 1 7,798 lpm @ 18 m H2O (2,060 gpm @ 60 ft H2O)
7,836 lpm @ 18 m H2O (2,070 gpm @ 60 ft H2O)
14 Ground Water Pumps
Stainless steel, single suction
6 1 2,612 lpm @ 268 m H2O (690 gpm @ 880 ft H2O)
2,612 lpm @ 268 m H2O (690 gpm @ 880 ft H2O)
15 Filtered Water Pumps
Stainless steel, single suction
2 1 7,647 lpm @ 49 m H2O
(2,020 gpm @ 160 ft H2O)
7,647 lpm @ 49 m H2O (2,020 gpm @ 160 ft
H2O)
16 Filtered Water Tank
Vertical, cylindrical 2 0 3,660,493 liter
(967,000 gal) 3,660,493 liter (967,000 gal)
17 Makeup Water Demineralizer
Anion, cation, and mixed bed
5 0 1,703 lpm (450 gpm) 1,703 lpm (450 gpm)
18 Liquid Waste Treatment System
1 0 10 years, 24-hour storm 10 years, 24-hour storm

Cost and Performance Baseline for Coal-to-SNG and Ammonia (Volume 2)
160
ACCOUNT 4 GASIFIER, ASU, AND ACCESSORIES INCLUDING LOW TEMPERATURE HEAT RECOVERY
Equipment No. Description Type Operating
Qty. Spare
s Case 3 Design Condition Case 4 Design Condition
1 Gasifier Pressurized dry-feed, entrained bed
6 0 1,905 tonne/day, 4.2 MPa (2,100 tpd, 615 psia)
1,905 tonne/day, 4.2 MPa (2,100 tpd, 615 psia)
2 Synthesis Gas Cooler
Convective spiral-wound tube boiler
6 0 200,941 kg/hr (443,000 lb/hr)
200,941 kg/hr (443,000 lb/hr)
3
Syngas Scrubber Including Sour Water Stripper
Vertical upflow 6 0 200,941 kg/hr (443,000 lb/hr)
200,941 kg/hr (443,000 lb/hr)
4 Raw Gas Coolers
Shell and tube with condensate drain
12 0 414,583 kg/hr (914,000 lb/hr)
414,583 kg/hr (914,000 lb/hr)
5 Raw Gas Knockout Drum
Vertical with mist eliminator 3 0
287,124 kg/hr, 35°C, 3.3 MPa
(633,000 lb/hr, 95°F, 485 psia)
287,124 kg/hr, 35°C, 3.3 MPa
(633,000 lb/hr, 95°F, 485 psia)
6 Flare Stack
Self-supporting, carbon steel, stainless steel top, pilot ignition
3 0 401,883 kg/hr (886,000 lb/hr) syngas
401,883 kg/hr (886,000 lb/hr) syngas
7 ASU Main Air Compressor
Centrifugal, multi-stage 3 0 7,476 m3/min @ 1.3 MPa
(264,000 scfm @ 190 psia) 7,476 m3/min @ 1.3 MPa
(264,000 scfm @ 190 psia)
8 Cold Box Vendor design 3 0 2,994 tonne/day (3,300 tpd) of 99% purity oxygen
2,994 tonne/day (3,300 tpd) of 99% purity oxygen

Cost and Performance Baseline for Coal-to-SNG and Ammonia (Volume 2)
161
Equipment No. Description Type Operating
Qty. Spare
s Case 3 Design Condition Case 4 Design Condition
9 Oxygen Compressor
Centrifugal, multi-stage 3 0
1,501 m3/min (53,000 scfm)
Suction - 0.9 MPa 130 psia)
Discharge - 5.1 MPa (740 psia)
1,501 m3/min (53,000 scfm)
Suction - 0.9 MPa (130 psia)
Discharge - 5.1 MPa (740 psia)
10 Coal Feed System CO2 Compressor
Centrifugal, multi-stage 3 0
510 m3/min (18,000 scfm) Suction - 1.0 MPa
(150 psia) Discharge - 5.7 MPa
(820 psia)
510 m3/min (18,000 scfm) Suction - 5.2 MPa
(750 psia) Discharge - 5.7 MPa
(820 psia)
ACCOUNT 5A SYNGAS CLEANUP
Equipment No. Description Type Operating
Qty. Spare
s Case 3 Design Condition Case 4 Design Condition
1 Mercury Adsorber
Sulfated carbon bed 3 0
392,811 kg/hr (866,000 lb/hr)
35°C (95°F) 3.3 MPa (480 psia)
392,811 kg/hr (866,000 lb/hr)
35°C (95°F) 3.3 MPa (480 psia)
2 Zinc Oxide Guard Bed Fixed bed 1 0 335 Nm3/min
(11,827 acfm) 335 Nm3/min (11,817 acfm)
3 Sulfur Plant Claus type 2 0 144 tonne/day (159 tpd) 144 tonne/day (159 tpd)
4
SNG Plant COS Hydrolysis Reactor
Fixed bed, catalytic 2 0
65,771 kg/hr (145,000 lb/hr) 216°C (420°F)
3.7 MPa (540 psia)
65,771 kg/hr (145,000 lb/hr) 216°C (420°F)
3.7 MPa (540 psia)

Cost and Performance Baseline for Coal-to-SNG and Ammonia (Volume 2)
162
Equipment No. Description Type Operating
Qty. Spare
s Case 3 Design Condition Case 4 Design Condition
5 SNG Plant Water Gas Shift Reactor
Fixed bed, catalytic 2 0
483,529 kg/hr (1,066,000 lb/hr) 232°C (450°F)
3.7 MPa (540 psia)
483,529 kg/hr 1,066,000 lb/hr) 232°C (450°F)
3.7 MPa (540 psia)
6 Shift Reactor Heat Recovery Exchanger
Shell and Tube 2 each 0
Exchanger 1: 34 GJ/hr (32 MMBtu/hr)
Exchanger 2: 61 GJ/hr (57 MMBtu/hr)
Exchanger 3: 17 GJ/hr (16 MMBtu/hr)
Exchanger 1: 34 GJ/hr (32 MMBtu/hr)
Exchanger 2: 61 GJ/hr (57 MMBtu/hr)
Exchanger 3: 17 GJ/hr (16 MMBtu/hr)
7
Ammonia Plant Water Gas Shift Reactors
Fixed bed, catalytic 2 0
268,527 kg/hr (592,000 lb/hr) 249°C (480°F)
3.7 MPa (540 psia)
268,527 kg/hr (592,000 lb/hr) 249°C (480°F)
3.7 MPa (540 psia)
8
Ammonia Plant Shift Reactor Heat Recovery Exchanger
Shell and Tube 1 0 227 GJ/hr (215 MMBtu/hr) 227 GJ/hr (215 MMBtu/hr)
9 Acid Gas Removal Plant
Two-stage Selexol 3 0
394,625 kg/hr (870,000 lb/hr)
35°C (95°F) 3.2 MPa (470 psia)
394,625 kg/hr (870,000 lb/hr)
35°C (95°F) 3.2 MPa (470 psia)
10 Tail Gas Treatment Unit
Proprietary amine, absorber/stripper
2 0 12,561 kg/hr (27,692 lb/hr)
49°C (120°F) 0.1 MPa (10.6 psia)
12,625 kg/hr (27,833 lb/hr) 49°C (120°F)
0.1 MPa (10.6 psia)

Cost and Performance Baseline for Coal-to-SNG and Ammonia (Volume 2)
163
Equipment No. Description Type Operating
Qty. Spare
s Case 3 Design Condition Case 4 Design Condition
11 Tail Gas Treatment Incinerator
N/A 2 0
69,200 kg/hr (152,561 lb/hr)
24°C (75°F) 0.1 MPa (14.9 psia)
68,890 kg/hr (151,877 lb/hr)
24°C (74°F) 0.1 MPa (14.9 psia)
12 Tail Gas Recycle Compressor
Centrifugal 2 0 3,060 kg/hr @ 3.3 MPa (6,746 lb/hr @ 475 psia)
3,139 kg/hr @ 3.3 MPa (6,920 lb/hr @ 475 psia)
ACCOUNT 5A SNG PRODUCTION/METHANATION SYSTEM
Equipment No. Description Type Operating
Qty. Spares Case 3 Design Condition Case 4 Design Condition
1 Methanation Reactor Preheater
Shell and Tube 2 0 106 GJ/hr (101 MMBtu/hr) 106 GJ/hr (100 MMBtu/hr)
2 Methanation Reactor 1
Fixed Bed, catalytic 2 0
539,321 kg/hr (1,189,000 lb/hr) 699°C (1,290°F)
3.2 MPa (460 psia)
538,868 kg/hr (1,188,000 lb/hr) 699°C (1290°F)
3.2 MPa (460 psia)
3 Methanation Reactor Intercooler 1
Shell and Tube 2 0 462 GJ/hr (437 MMBtu/hr) 461 GJ/hr (437 MMBtu/hr)
4 Methanation Reactor Intercooler 2
Shell and Tube 2 0 125 GJ/hr (119 MMBtu/hr) 125 GJ/hr (119 MMBtu/hr)
5 Methanation Reactor 2
Fixed Bed, catalytic 2 0
140,160 kg/hr (309,000 lb/hr)
554°C (1,030°F) 3.1 MPa (450 psia)
140,160 kg/hr (309,000 lb/hr)
554°C (1,030°F) 3.1 MPa (450 psia)

Cost and Performance Baseline for Coal-to-SNG and Ammonia (Volume 2)
164
Equipment No. Description Type Operating
Qty. Spares Case 3 Design Condition Case 4 Design Condition
6 Methanation Reactor Intercooler 3
Shell and Tube 2 0 33 GJ/hr (31 MMBtu/hr) 33 GJ/hr (31 MMBtu/hr)
7 Methanation Reactor 3
Fixed Bed, catalytic 2 0
140,160 kg/hr (309,000 lb/hr) 343°C (650°F)
3.0 MPa (430 psia)
140,160 kg/hr (309,000 lb/hr) 343°C (650°F)
3.0 MPa (430 psia)
8 Methanation Reactor Intercooler 4
Shell and Tube 2 0 45 GJ/hr (43 MMBtu/hr) 45 GJ/hr (43 MMBtu/hr)
9 Methanation Reactor Intercooler 5
Shell and Tube 2 0 73 GJ/hr (70 MMBtu/hr) 73 GJ/hr (69 MMBtu/hr)
10 SNG Purification Condenser 1
Shell and Tube 2 0 62 GJ/hr (59 MMBtu/hr) 62 GJ/hr (59 MMBtu/hr)
11 SNG Purification Condenser 2
Shell and Tube 2 0 37 GJ/hr (35 MMBtu/hr) 37 GJ/hr (35 MMBtu/hr)
12 Methanation Recycle Compressor
Centrifugal 2 1
9,781 m3/min (345,400 scfm)
Suction - 3.1 MPa (448 psia)
Discharge - 3.3 MPa (475 psia)
9,772 m3/min (345,100 scfm)
Suction - 3.1 MPa (448 psia)
Discharge - 3.3 MPa (475 psia)

Cost and Performance Baseline for Coal-to-SNG and Ammonia (Volume 2)
165
Equipment No. Description Type Operating
Qty. Spares Case 3 Design Condition Case 4 Design Condition
13
Molecular Sieve Purification Reactor
Fixed bed 8 0 22,226 kg/hr (49,000 lb/hr)
129°C (265°F) 2.8 MPa (401 psia)
22,226 kg/hr (49,000 lb/hr) 129°C (265°F)
2.8 MPa (401 psia)
14 SNG Product Compressor
Centrifugal, Multi-staged
2 1
1,385 m3/min (48,900 scfm)
2.6 MPa (381 psia) 6.2 MPa (900 psia)
1,382 m3/min (48,800 scfm)
2.6 MPa (381 psia) 6.2 MPa (900 psia)
ACCOUNT 5A AMMONIA SYNTHESIS LOOP
Equipment No. Description Type Operating
Qty. Spares Case 3 Design Condition Case 4 Design Condition
1 Ammonia Converter Preheater 1
Shell and Tube 1 0
511,199 kg/hr (1,127,000 lb/hr)
76°C (169°F) 13.4 MPa (1,949 psia)
107 MMBtu/hr
511,652 kg/hr (1,128,000 lb/hr)
76°C (169°F) 13.4 MPa (1,949 psia)
107 MMBtu/hr
2 Ammonia Converter Preheater 2
Shell and Tube 1 0
511,199 kg/hr (1,127,000 lb/hr) 250°C (482°F)
13.4 MPa (1,949 psia) 278 MMBtu/hr
511,652 kg/hr (1,128,000 lb/hr) 250°C (482°F)
13.4 MPa (1,949 psia) 278 MMBtu/hr
3 Ammonia Converter Preheater 3
Shell and Tube 1 0
511,199 kg/hr (1,127,000 lb/hr) 382°C (720°F)
14.0 MPa (2,035 psia) 212 MMBtu/hr
511,652 kg/hr (1,128,000 lb/hr) 382°C (720°F)
14.0 MPa (2,035 psia) 211 MMBtu/hr

Cost and Performance Baseline for Coal-to-SNG and Ammonia (Volume 2)
166
Equipment No. Description Type Operating
Qty. Spares Case 3 Design Condition Case 4 Design Condition
4
Ammonia Synthesis Loop Superheater
Shell and Tube 1 0
511,199 kg/hr (1,127,000 lb/hr) 510°C (949°F)
13.5 MPa (1,955 psia) 154 MMBtu/hr
511,652 kg/hr (1,128,000 lb/hr) 510°C (949°F)
13.5 MPa (1,955 psia) 153 MMBtu/hr
5
Ammonia Synthesis Loop BFW Heater
Shell and Tube 1 0
511,199 kg/hr (1,127,000 lb/hr) 416°C (780°F)
13.5 MPa (1,955 psia) 54 MMBtu/hr
511,652 kg/hr (1,128,000 lb/hr) 416°C (780°F)
13.5 MPa (1,955 psia) 54 MMBtu/hr
6 Ammonia Converter
Haldor Topsoe S-300 Radial Flow
1 0
511,199 kg/hr 1,127,000 lb/hr) 510°C (949°F)
14.0 MPa (2,030 psia)
511,652 kg/hr 1,128,000 lb/hr) 510°C (949°F)
14.0 MPa (2,030 psia)
7 Refrigeration System
Ammonia-Based 2 0 26,025 kW refrigeration
(7,400 tons refrigeration) 26,025 kW refrigeration (7,400 tons refrigeration)
8 Primary Ammonia Separator
Refrigerated 1 0
602,824 kg/hr (1,329,000 lb/hr)
-25°C (-13°F) 13.3 MPa (1,928 psia)
603,278 kg/hr (1,330,000 lb/hr)
-25°C (-13°F) 13.3 MPa (1,928 psia)
9 Purge Separator Refrigerated 1 0
35,834 kg/hr (79,000 lb/hr) -25°C (-13°F)
13.4 MPa (1,948 psia)
35,834 kg/hr (79,000 lb/hr) -25°C (-13°F)
13.4 MPa (1,948 psia)
10
Ammonia System Feed Compressor
Centrifugal, Multi-Staged
1 1
5,573 m3/min (196,800 scfm)
Suction - 3.24MPa (470 psia)
Discharge - 13.6 MPa (1,975 psia)
5,570 m3/min (196,700 scfm)
Suction - 3.24MPa (470 psia)
Discharge - 13.6 MPa (1,975 psia)

Cost and Performance Baseline for Coal-to-SNG and Ammonia (Volume 2)
167
Equipment No. Description Type Operating
Qty. Spares Case 3 Design Condition Case 4 Design Condition
11
Ammonia System Recycle Compressor
Centrifugal 1 1
22,999 m3/min (812,200 scfm)
Suction - 13.0 MPa (1,892 psia)
Discharge - 14.0 MPa (2,035 psia)
22,990 m3/min (811,900 scfm)
Suction - 13.0 MPa (1,892 psia)
Discharge - 14.0 MPa (2,035 psia)
12
Pressure Swing Absorption System
Fixed bed 1 0
8 MM SCMD (280 MM SCFD)
21°C (69°F) 3.2 MPa (470 psia)
8 MM SCMD (280 MM SCFD)
25°C (77°F) 3.2 MPa (470 psia)
13 Ammonia Storage Vessel
Cylindrical, Refrigerated 2 0
32,683 tonnes (36,000 tons)
Stored at -23°C (-10°F) 0.1 MPa (15 psia)
32,683 tonnes (36,000 tons)
Stored at -23°C (-10°F) 0.1 MPa (15 psia)
14 Waste Heat Boiler
Shop fabricated, water tube
1 0
149,685 kg/hr (330,000 lb/hr)
1012°C (1,853°F) 0.1 MPa (20 psia)
149,685 kg/hr (330,000 lb/hr)
1014°C (1,857°F) 0.1 MPa (20 psia)

Cost and Performance Baseline for Coal-to-SNG and Ammonia (Volume 2)
168
ACCOUNT 5B CO2 COMPRESSION
Equipment No. Description Type Operating
Qty. Spares Case 3 Design Condition
Case 4 Design Condition
1 CO2 Compressor
Integrally geared, multi-stage centrifugal
4 0 N/A 1,739 m3/min @ 15.3 MPa (61,400 scfm @
2,215 psia)
ACCOUNT 6 COMBUSTION TURBINE AND AUXILIARIES
Equipment No. Description Type Operating
Qty. Spares Case 3 Design Condition
Case 4 Design Condition
1 Combustion Turbine N/A N/A N/A N/A N/A
2 Combustion Turbine Generator
N/A N/A N/A N/A N/A
ACCOUNT 7 DUCTING & STACK
Equipment No. Description Type Operating
Qty. Spares Case 3 Design Condition
Case 4 Design Condition
1 Stack CS plate, type 409SS liner
1 0 76 m (250 ft) high x 3.0 m (10 ft) diameter
76 m (250 ft) high x 2.4 m (8 ft) diameter

Cost and Performance Baseline for Coal-to-SNG and Ammonia (Volume 2)
169
ACCOUNT 8 STEAM TURBINE GENERATOR AND AUXILIARIES
Equipment No. Description Type Operating
Qty. Spares Case 3 Design Condition
Case 4 Design Condition
1 Steam Turbine
Commercially available 1 0
308 MW 12.4 MPa/566°C (1800 psig/
1050°F)
308 MW 12.4 MPa/566°C (1800 psig/
1050°F)
2 Steam Turbine Generator
Hydrogen cooled, static excitation
1 0 340 MVA @ 0.9 p.f., 24 kV, 60 Hz, 3-phase
340 MVA @ 0.9 p.f., 24 kV, 60 Hz, 3-phase
3 Surface Condenser
Single pass, divided waterbox including vacuum pumps
1 0
1,952 GJ/hr (1,850 MMBtu/hr),
Inlet water temperature 16°C (60°F),
Water temperature rise 11°C (20°F)
1,952 GJ/hr (1,850 MMBtu/hr),
Condensing temperature 16°C (60°F), Ambient
temperature 11°C (20°F)
4 Air-cooled Condenser --- N/A N/A N/A N/A
ACCOUNT 9 COOLING WATER SYSTEM
Equipment No. Description Type Operating
Qty. Spares Case 3 Design Condition
Case 4 Design Condition
1 Circulating Water Pumps
Vertical, wet pit 2 1
620,808 lpm @ 30 m (164,000 gpm @ 100 ft)
624,593 lpm @ 30 m (165,000 gpm @ 100 ft)
2 Cooling Tower
Evaporative, mechanical draft, multi-cell
1 0
11°C (51.5°F) wet bulb / 16°C (60°F) CWT / 27°C (80°F) HWT / 3,461 GJ/hr (3,280
MMBtu/hr) heat duty
11°C (51.5°F) wet bulb / 16°C (60°F) CWT / 27°C (80°F) HWT / 3,482 GJ/hr (3,300
MMBtu/hr) heat duty

Cost and Performance Baseline for Coal-to-SNG and Ammonia (Volume 2)
170
ACCOUNT 10 SLAG RECOVERY AND HANDLING
Equipment No. Description Type Operating
Qty. Spares Case 3 Design Condition Case 4 Design Condition
1 Slag Quench Tank
Water bath 6 0 151,416 liters (40,000 gal) 151,416 liters (40,000 gal)
2 Slag Crusher Roll 6 0 8 tonne/hr (9 tph) 8 tonne/hr (9 tph)
3 Slag Depressurizer
Proprietary 6 0 8 tonne/hr (9 tph) 8 tonne/hr (9 tph)
4 Slag Receiving Tank
Horizontal, weir 6 0 90,850 liters (24,000 gal) 90,850 liters (24,000 gal)
5 Black Water Overflow Tank
Shop fabricated 6 0 41,640 liters (11,000 gal) 41,640 liters (11,000 gal)
6 Slag Conveyor Drag chain 6 0 8 tonne/hr (9 tph) 8 tonne/hr (9 tph)
7 Slag Separation Screen
Vibrating 6 0 8 tonne/hr (9 tph) 8 tonne/hr (9 tph)
8 Coarse Slag Conveyor Belt/bucket 6 0 8 tonne/hr (9 tph) 8 tonne/hr (9 tph)
9 Fine Ash Settling Tank
Vertical, gravity 6 0 132,489 liters (35,000 gal) 132,489 liters (35,000 gal)

Cost and Performance Baseline for Coal-to-SNG and Ammonia (Volume 2)
171
Equipment No. Description Type Operating
Qty. Spares Case 3 Design Condition Case 4 Design Condition
10 Fine Ash Recycle Pumps
Horizontal centrifugal 6 3 38 lpm @ 14 m H2O
(10 gpm @ 46 ft H2O) 38 lpm @ 14 m H2O
(10 gpm @ 46 ft H2O)
11 Grey Water Storage Tank
Field erected 6 0 41,640 liters (11,000 gal) 41,640 liters (11,000 gal)
12 Grey Water Pumps Centrifugal 6 3 151 lpm @ 433 m H2O
(40 gpm @ 1,420 ft H2O) 151 lpm @ 433 m H2O
(40 gpm @ 1,420 ft H2O)
13 Slag Storage Bin
Vertical, field erected 6 0 544 tonne (600 tons) 544 tonne (600 tons)
14 Unloading Equipment
Telescoping chute 2 0 100 tonne/hr (110 tph) 100 tonne/hr (110 tph)

Cost and Performance Baseline for Coal-to-SNG and Ammonia (Volume 2)
172
ACCOUNT 11 ACCESSORY ELECTRIC PLANT
Equipment No. Description Type Operating
Qty. Spares Case 3 Design Condition
Case 4 Design Condition
1 STG Step-up Transformer Oil-filled 1 0 24 kV/345 kV, 340
MVA, 3-ph, 60 Hz 24 kV/345 kV, 340 MVA, 3-ph, 60 Hz
2 Auxiliary Transformer Oil-filled 1 1 24 kV/4.16 kV, 291
MVA, 3-ph, 60 Hz 24 kV/4.16 kV, 349 MVA, 3-ph, 60 Hz
3 Low Voltage Transformer
Dry ventilated 1 1 4.16 kV/480 V, 44
MVA, 3-ph, 60 Hz 4.16 kV/480 V, 52 MVA, 3-ph, 60 Hz
4
STG Isolated Phase Bus Duct and Tap Bus
Aluminum, self-cooled 1 0 24 kV, 3-ph, 60 Hz 24 kV, 3-ph, 60 Hz
5 Medium Voltage Switchgear
Metal clad 1 1 24 kV, 3-ph, 60 Hz 4.16 kV, 3-ph, 60 Hz
6 Low Voltage Switchgear
Metal enclosed 1 1 4.16 kV, 3-ph, 60 Hz 480 V, 3-ph, 60 Hz
7 Emergency Diesel Generator
Sized for emergency shutdown
1 0 750 kW, 480 V, 3-ph, 60 Hz
750 kW, 480 V, 3-ph, 60 Hz

Cost and Performance Baseline for Coal-to-SNG and Ammonia (Volume 2)
173
ACCOUNT 12 INSTRUMENTATION AND CONTROLS
Equipment No. Description Type Operating
Qty. Spares Case 3 Design Condition
Case 4 Design Condition
1 DCS - Main Control
Monitor/keyboard; Operator printer (laser color); Engineering printer (laser B&W)
1 0
Operator stations/printers and
engineering stations/printers
Operator stations/printers and
engineering stations/printers
2 DCS - Processor
Microprocessor with redundant input/output
1 0 N/A N/A
3 DCS - Data Highway Fiber optic 1 0 Fully redundant, 25%
spare Fully redundant, 25%
spare

Cost and Performance Baseline for Coal-to-SNG and Ammonia (Volume 2)
174
4.2.5 The cost estimating methodology was described previously in Section
Cases 3 and 4 Cost Estimating 2.8.
The TPC organized by cost account, owner’s costs, TOC, and initial and annual O&M costs for the SNG and ammonia co-production plant without sequestration using Illinois No. 6 coal (Case 3) are shown in Exhibit 4-42 and Exhibit 4-43, respectively. The same data for the SNG and ammonia co-production plant with sequestration using Illinois No. 6 coal (Case 4) are shown in Exhibit 4-44 and Exhibit 4-45.
The estimated TOC of the co-production plant without carbon sequestration is 3.74 billion dollars and with carbon sequestration is 3.83 billion dollars. Project and process contingencies represent 11.7 and 3.3 percent for both the non-sequestration and sequestration cases. The FYCOP for SNG is $15.82/MMBtu for the non-sequestration case and $17.85/MMBtu for the sequestration case, with a consequential selling price of ammonia of $799/ton and $828/ton for the non-sequestration and sequestration cases respectively, as shown in Exhibit ES-6.

Cost and Performance Baseline for Coal-to-SNG and Ammonia (Volume 2)
175
Exhibit 4-42 Case 3 Total Plant Cost Details
Client: USDOE/NETL R e port Da te : 2010-Feb-18Project: Cost & Performance Baseline for Fossil Energy Plants Vol.2
Case: Case 3 - Siemens Quench SNG & Ammonia Production w/o CO2Plant Size: 28.7 MW,net Est imate Type: Conceptual Cost Base (Jun) 2007 ($x1000)
Acct Equipment Material Labor Sales Bare Erected Eng'g CM Total Plant CostNo. I tem/Descript ion Cost Cost Direct Indirect Tax Cost $ H.O.& Fee Process Project $
1 COAL & SORBENT HANDLING1.1 Coal Receive & Unload $5,727 $0 $2,798 $0 $0 $8,525 $764 $0 $1,858 $11,1461.2 Coal Stackout & Reclaim $7,400 $0 $1,794 $0 $0 $9,194 $806 $0 $2,000 $12,0001.3 Coal Conveyors & Yd Crush $6,880 $0 $1,775 $0 $0 $8,655 $760 $0 $1,883 $11,2981.4 Other Coal Handling $1,800 $0 $411 $0 $0 $2,211 $193 $0 $481 $2,8851.5 Sorbent Receive & Unload $0 $0 $0 $0 $0 $0 $0 $0 $0 $01.6 Sorbent Stackout & Reclaim $0 $0 $0 $0 $0 $0 $0 $0 $0 $01.7 Sorbent Conveyors $0 $0 $0 $0 $0 $0 $0 $0 $0 $01.8 Other Sorbent Handling $0 $0 $0 $0 $0 $0 $0 $0 $0 $01.9 Coal & Sorbent Hnd.Foundations $0 $4,052 $10,133 $0 $0 $14,185 $1,360 $0 $3,109 $18,653
SUBTOTAL 1 . $21 ,806 $4,052 $16,911 $0 $0 $42,769 $3,882 $0 $9,330 $55,982 2 COAL & SORBENT PREP & FEED
2.1 Coal Crushing & Drying $92,894 $0 $13,536 $0 $0 $106,430 $9,666 $0 $23,219 $139,3152.2 Prepared Coal Storage & Feed $4,400 $1,053 $690 $0 $0 $6,143 $525 $0 $1,334 $8,0022.3 Dry Coal Injection System $144,803 $1,681 $13,448 $0 $0 $159,932 $13,775 $0 $34,741 $208,4482.4 Misc.Coal Prep & Feed $2,420 $1,761 $5,279 $0 $0 $9,459 $869 $0 $2,066 $12,3942.5 Sorbent Prep Equipment $0 $0 $0 $0 $0 $0 $0 $0 $0 $02.6 Sorbent Storage & Feed $0 $0 $0 $0 $0 $0 $0 $0 $0 $02.7 Sorbent Injection System $0 $0 $0 $0 $0 $0 $0 $0 $0 $02.8 Booster Air Supply System $0 $0 $0 $0 $0 $0 $0 $0 $0 $02.9 Coal & Sorbent Feed Foundation $0 $9,405 $7,721 $0 $0 $17,126 $1,586 $0 $3,742 $22,454
SUBTOTAL 2. $244,517 $13,899 $40,674 $0 $0 $299,090 $26,421 $0 $65,102 $390,613 3 FEEDWATER & MISC. BOP SYSTEMS
3.1 Feedwater System $3,508 $1,630 $1,977 $0 $0 $7,115 $643 $0 $1,552 $9,3103.2 Water Makeup & Pretreating $854 $89 $477 $0 $0 $1,421 $135 $0 $467 $2,0233.3 Other Feedwater Subsystems $3,808 $1,151 $1,884 $0 $0 $6,843 $621 $0 $1,493 $8,9583.4 Service Water Systems $489 $1,006 $3,493 $0 $0 $4,988 $487 $0 $1,643 $7,1183.5 Other Boiler Plant Systems $2,623 $1,016 $2,519 $0 $0 $6,158 $584 $0 $1,348 $8,0913.6 FO Supply Sys & Nat Gas $102 $210 $188 $0 $0 $500 $48 $0 $110 $6583.7 Waste Treatment Equipment $1,194 $0 $728 $0 $0 $1,922 $187 $0 $633 $2,7423.8 Misc. Power Plant Equipment $1,721 $230 $883 $0 $0 $2,834 $274 $0 $932 $4,040
SUBTOTAL 3. $14,298 $5,334 $12,150 $0 $0 $31 ,782 $2,980 $0 $8,177 $42,939 4 GASIFIER & ACCESSORIES
4.1 Gasifier, Syngas Cooler & Auxiliaries $326,034 $0 $150,944 $0 $0 $476,977 $42,364 $71,547 $88,633 $679,5214.2 Syngas Cooling w/4.1 $0 w/4.1 $0 $0 $0 $0 $0 $0 $04.3 ASU/Oxidant Compression $250,140 $0 w/equip. $0 $0 $250,140 $24,246 $0 $27,439 $301,8254.4 LT Heat Recovery & FG Saturation $55,465 $0 $20,551 $0 $0 $76,016 $7,282 $0 $16,660 $99,9584.5 Misc. Gasification Equipment w/4.1&4.2 $0 w/4.1&4.2 $0 $0 $0 $0 $0 $0 $04.6 Flare Stack System $0 $2,332 $949 $0 $0 $3,282 $315 $0 $719 $4,3154.7 CO2 Solid Feed System Compressors $10,514 $2,523 $3,785 $0 $0 $16,822 $1,682 $0 $3,701 $22,2054.8 Major Component Rigging w/4.1&4.2 $0 w/4.1&4.2 $0 $0 $0 $0 $0 $0 $04.9 Gasification Foundations $0 $21,135 $12,059 $0 $0 $33,194 $3,039 $0 $9,058 $45,291
SUBTOTAL 4. $642,153 $25,990 $188,288 $0 $0 $856,431 $78,928 $71 ,547 $146,210 $1 ,153,115
TOTAL PLANT COST SUMMARY
Contingencies

Cost and Performance Baseline for Coal-to-SNG and Ammonia (Volume 2)
176
Exhibit 4-42 Case 3 Total Plant Cost Details (continued) Acct Equipment Material Labor Sales Bare Erected Eng'g CM Total Plant CostNo. Item/Description Cost Cost Direct Indirect Tax Cost $ H.O.& Fee Process Project $
5A GAS CLEANUP & PIPING5A.1 Double Stage Selexol $128,808 $0 $109,297 $0 $0 $238,105 $23,027 $47,621 $61,751 $370,5045A.2 Elemental Sulfur Plant $16,279 $3,245 $21,003 $0 $0 $40,527 $3,937 $0 $8,893 $53,3575A.3 Mercury Removal $2,499 $0 $1,902 $0 $0 $4,401 $425 $220 $1,009 $6,056
5A.4a Shift Reactors $11,793 $0 $4,747 $0 $0 $16,540 $1,586 $0 $3,625 $21,7515A.4b COS Hydrolysis $1,494 $0 $1,951 $0 $0 $3,445 $335 $0 $756 $4,536
5A.5 Methanation $21,900 $8,760 $13,140 $0 $0 $43,800 $4,380 $4,380 $10,512 $63,0725A.6 SNG Purification & Compression $17,050 $6,820 $10,230 $0 $0 $34,100 $3,410 $0 $7,502 $45,0125A.7 Fuel Gas Piping $0 $1,749 $1,225 $0 $0 $2,974 $276 $0 $650 $3,9005A.8 Ammonia Production $171,774 $44,276 $88,551 $0 $0 $304,601 $30,460 $0 $50,259 $385,3205A.9 Process Interconnects $0 $18,400 $27,600 $0 $0 $46,000 $4,600 $0 $10,120 $60,720
5A.10 HGCU Foundations $0 $1,771 $1,142 $0 $0 $2,913 $268 $0 $954 $4,1355A.11 Zinc Oxide Guard Bed $664 $0 $122 $0 $0 $786 $79 $0 $173 $1,038
SUBTOTAL 5A. $372,262 $85,021 $280,911 $0 $0 $738,194 $72,782 $52,221 $156,204 $1 ,019,401 5B CO2 COMPRESSION
5B.1 CO2 Removal System $0 $0 $0 $0 $0 $0 $0 $0 $0 $05B.2 CO2 Compression & Drying $0 $0 $0 $0 $0 $0 $0 $0 $0 $0
SUBTOTAL 5B. $0 $0 $0 $0 $0 $0 $0 $0 $0 $0 6 COMBUSTION TURBINE/ACCESSORIES
6.1 Combustion Turbine Generator $0 $0 $0 $0 $0 $0 $0 $0 $0 $06.2 Syngas Expander $0 $0 $0 $0 $0 $0 $0 $0 $0 $06.3 Compressed Air Piping $0 $0 $0 $0 $0 $0 $0 $0 $0 $06.9 Combustion Turbine Foundations $0 $0 $0 $0 $0 $0 $0 $0 $0 $0
SUBTOTAL 6. $0 $0 $0 $0 $0 $0 $0 $0 $0 $0 7 HRSG, DUCTING & STACK
7.1 Heat Recovery Steam Generator $0 $0 $0 $0 $0 $0 $0 $0 $0 $07.2 HRSG Accessories $0 $0 $0 $0 $0 $0 $0 $0 $0 $07.3 Ductwork $0 $503 $359 $0 $0 $863 $76 $0 $188 $1,1267.4 Stack $1,814 $0 $682 $0 $0 $2,496 $239 $0 $274 $3,0097.9 HRSG,Duct & Stack Foundations $0 $364 $349 $0 $0 $713 $66 $0 $234 $1,013
SUBTOTAL 7. $1 ,814 $867 $1 ,390 $0 $0 $4,071 $381 $0 $695 $5,147 8 STEAM TURBINE GENERATOR
8.1 Steam TG & Accessories $30,291 $0 $5,224 $0 $0 $35,514 $3,408 $0 $3,892 $42,8148.2 Turbine Plant Auxiliaries $163 $0 $482 $0 $0 $645 $63 $0 $71 $7808.3 Condenser & Auxiliaries $5,594 $0 $1,578 $0 $0 $7,172 $685 $0 $786 $8,6438.4 Steam Piping $5,482 $0 $3,856 $0 $0 $9,338 $802 $0 $2,535 $12,6758.9 TG Foundations $0 $1,043 $1,764 $0 $0 $2,807 $266 $0 $922 $3,995
SUBTOTAL 8. $41 ,530 $1 ,043 $12,905 $0 $0 $55,477 $5,225 $0 $8,206 $68,908
Contingencies

Cost and Performance Baseline for Coal-to-SNG and Ammonia (Volume 2)
177
Exhibit 4-42 Case 3 Total Plant Cost Details (continued) Acct Equipment Material Labor Sales Bare Erected Eng'g CM Total Plant CostNo. Item/Description Cost Cost Direct Indirect Tax Cost $ H.O.& Fee Process Project $
9 COOLING WATER SYSTEM9.1 Cooling Towers $8,777 $0 $1,597 $0 $0 $10,373 $988 $0 $1,704 $13,0659.2 Circulating Water Pumps $2,333 $0 $85 $0 $0 $2,417 $203 $0 $393 $3,0139.3 Circ.Water System Auxiliaries $185 $0 $26 $0 $0 $212 $20 $0 $35 $2679.4 Circ.Water Piping $0 $7,740 $2,007 $0 $0 $9,747 $881 $0 $2,125 $12,7539.5 Make-up Water System $450 $0 $643 $0 $0 $1,093 $105 $0 $239 $1,4379.6 Component Cooling Water Sys $914 $1,093 $778 $0 $0 $2,784 $261 $0 $609 $3,6549.9 Circ.Water System Foundations $0 $2,834 $4,818 $0 $0 $7,652 $725 $0 $2,513 $10,891
SUBTOTAL 9. $12,658 $11 ,667 $9,953 $0 $0 $34,278 $3,183 $0 $7,619 $45,08010 ASH/SPENT SORBENT HANDLING SYS
10.1 Slag Dewatering & Cooling $36,250 $0 $35,754 $0 $0 $72,004 $6,977 $0 $7,898 $86,87910.2 Gasifier Ash Depressurization w/10.1 w/10.1 w/10.1 $0 $0 $0 $0 $0 $0 $010.3 Cleanup Ash Depressurization w/10.1 w/10.1 w/10.1 $0 $0 $0 $0 $0 $0 $010.4 High Temperature Ash Piping $0 $0 $0 $0 $0 $0 $0 $0 $0 $010.5 Other Ash Recovery Equipment $0 $0 $0 $0 $0 $0 $0 $0 $0 $010.6 Ash Storage Silos $817 $0 $889 $0 $0 $1,707 $166 $0 $281 $2,15310.7 Ash Transport & Feed Equipment $1,096 $0 $265 $0 $0 $1,361 $127 $0 $223 $1,71110.8 Misc. Ash Handling Equipment $1,693 $2,075 $620 $0 $0 $4,388 $418 $0 $721 $5,52610.9 Ash/Spent Sorbent Foundation $0 $72 $91 $0 $0 $163 $15 $0 $54 $232
SUBTOTAL 10. $39,857 $2,147 $37,618 $0 $0 $79,623 $7,702 $0 $9,177 $96,50211 ACCESSORY ELECTRIC PLANT
11.1 Generator Equipment $420 $0 $416 $0 $0 $836 $80 $0 $92 $1,00711.2 Station Service Equipment $5,754 $0 $519 $0 $0 $6,272 $578 $0 $685 $7,53611.3 Switchgear & Motor Control $10,637 $0 $1,935 $0 $0 $12,572 $1,166 $0 $2,061 $15,79911.4 Conduit & Cable Tray $0 $4,941 $16,302 $0 $0 $21,243 $2,055 $0 $5,824 $29,12211.5 Wire & Cable $0 $9,441 $6,203 $0 $0 $15,645 $1,137 $0 $4,195 $20,97711.6 Protective Equipment $0 $855 $3,111 $0 $0 $3,965 $387 $0 $653 $5,00511.7 Standby Equipment $330 $0 $322 $0 $0 $651 $62 $0 $107 $82111.8 Main Power Transformers $9,274 $0 $182 $0 $0 $9,456 $718 $0 $1,526 $11,70011.9 Electrical Foundations $0 $197 $518 $0 $0 $716 $68 $0 $235 $1,019
SUBTOTAL 11 . $26,415 $15,435 $29,506 $0 $0 $71 ,356 $6,251 $0 $15,378 $92,98512 INSTRUMENTATION & CONTROL
12.1 IGCC Control Equipment w/4.1 $0 w/4.1 $0 $0 $0 $0 $0 $0 $012.2 Combustion Turbine Control w/6.1 $0 w/6.1 $0 $0 $0 $0 $0 $0 $012.3 Steam Turbine Control w/8.1 $0 w/8.1 $0 $0 $0 $0 $0 $0 $012.4 Other Major Component Control $536 $0 $358 $0 $0 $893 $85 $45 $153 $1,17612.5 Signal Processing Equipment w/12.7 $0 w/12.7 $0 $0 $0 $0 $0 $0 $012.6 Control Boards,Panels & Racks $356 $0 $228 $0 $0 $584 $55 $29 $134 $80212.7 Computer & Accessories $5,694 $0 $182 $0 $0 $5,876 $539 $294 $671 $7,38012.8 Instrument Wiring & Tubing $0 $2,884 $5,896 $0 $0 $8,780 $745 $439 $2,491 $12,45412.9 Other I & C Equipment $4,245 $0 $2,061 $0 $0 $6,306 $593 $315 $1,082 $8,297
SUBTOTAL 12. $10,830 $2,884 $8,725 $0 $0 $22,439 $2,017 $1 ,122 $4,531 $30,110
Contingencies

Cost and Performance Baseline for Coal-to-SNG and Ammonia (Volume 2)
178
Exhibit 4-42 Case 3 Total Plant Cost Details (continued)
Acct Equipment Material Labor Sales Bare Erected Eng'g CM Total Plant CostNo. Item/Description Cost Cost Direct Indirect Tax Cost $ H.O.& Fee Process Project $
13 IMPROVEMENTS TO SITE13.1 Site Preparation $0 $147 $3,142 $0 $0 $3,289 $326 $0 $1,085 $4,70013.2 Site Improvements $0 $2,614 $3,474 $0 $0 $6,089 $601 $0 $2,007 $8,69613.3 Site Facilities $4,685 $0 $4,944 $0 $0 $9,629 $949 $0 $3,173 $13,751
SUBTOTAL 13. $4,685 $2,761 $11 ,560 $0 $0 $19,006 $1 ,877 $0 $6,265 $27,14814 BUILDINGS & STRUCTURES
14.1 Combustion Turbine Area $0 $0 $0 $0 $0 $0 $0 $0 $0 $014.2 Steam Turbine Building $0 $2,530 $3,604 $0 $0 $6,134 $564 $0 $1,005 $7,70314.3 Administration Building $0 $870 $630 $0 $0 $1,500 $134 $0 $245 $1,87914.4 Circulation Water Pumphouse $0 $160 $90 $0 $0 $250 $22 $0 $41 $31214.5 Water Treatment Buildings $0 $785 $766 $0 $0 $1,552 $140 $0 $254 $1,94514.6 Machine Shop $0 $445 $305 $0 $0 $750 $67 $0 $123 $93914.7 Warehouse $0 $762 $487 $0 $0 $1,249 $111 $0 $204 $1,56414.8 Other Buildings & Structures $0 $528 $411 $0 $0 $940 $84 $0 $205 $1,22814.9 Waste Treating Building & Str. $0 $1,299 $2,483 $0 $0 $3,782 $353 $0 $827 $4,961
SUBTOTAL 14. $0 $7,379 $8,777 $0 $0 $16,156 $1 ,474 $0 $2,902 $20,532
TOTAL COST $1,432,827 $178,481 $659,367 $0 $0 $2,270,675 $213,101 $124,890 $439,797 $3,048,463
Owner's CostsPreproduction Costs
6 Months All Labor $23,7961 Month Maintenance Materials $4,247
1 Month Non-fuel Consumables $8191 Month Waste Disposal $577
25% of 1 Months Fuel Cost at 100% CF $3,3592% of TPC $60,969
Total $93,767Inventory Capital
60 day supply of fuel and consumables at 100% CF $28,1580.5% of TPC (spare parts) $15,242
Total $43,400
Initial Cost for Catalyst and Chemicals $16,303Land $900
Other Owner's Costs $457,269Financing Costs $82,309
Total Overnight Costs (TOC) $3,742,411TASC Multiplier 1.201
Total As-Spent Cost (TASC) $4,494,636
Contingencies

Cost and Performance Baseline for Coal-to-SNG and Ammonia (Volume 2)
179
Exhibit 4-43 Case 3 Initial and Annual O&M Costs INITIAL & ANNUAL O&M EXPENSES Cost Base (Jun): 2007
Case 3 - Siemens Quench SNG & Ammonia Production w/o CO2 MWe-net: 29SNG (MMbtu/hr): 5,126 mmonia (lb/hr): 183,698 Capacity Factor (%): 90
OPERATING & MAINTENANCE LABOROperating Labor
Operating Labor Rate (base): 34.65 $/hour Operating Labor Burden: 30.00 % of base Labor O-H Charge Rate: 25.00 % of labor
Total
Skilled Operator 2.0 2.0 Operator 13.0 13.0 Foreman 1.0 1.0 Lab Tech's, etc. 3.0 3.0 TOTAL-O.J.'s 19.0 19.0
Annual Cost$
Annual Operating Labor Cost $7,497,290Maintenance Labor Cost $30,575,935Administrative & Support Labor $9,518,306Property Taxes and Insurance $60,969,265TOTAL FIXED OPERATING COSTS $108,560,796VARIABLE OPERATING COSTS
Maintenance Material Cost $45,863,903
Consumables Consumption Unit Initial Fill Initial Fill /Day Cost Cost
Water(/1000 gallons) 0 5,352 1.08 $0 $1 ,901 ,899
ChemicalsMU & WT Chem. (lb) 0 31,889 0.17 $0 $1,812,954Carbon (Mercury Removal) (lb) 234,445 401 1.05 $246,207 $138,492COS Catalyst (m3) 88 0.1 2,397.36 $210,486 $59,199Water Gas Shift Catalyst (ft3) 8,501 7.5 498.83 $4,240,751 $1,222,008ZnO Sorbent (ton) 113 0.4 12,574.00 $1,419,605 $1,597,055Methanation Catalyst (ft3) 9,191 6.99 440.00 $4,044,122 $1,011,030Selexol Solution (gal) 449,546 143 13.40 $6,023,125 $630,285SCR Catalyst (m3) 0 0 0.00 $0 $0Aqueous Ammonia (ton) 0 0 0.00 $0 $0Ammonia Catalyst (ft3) 69.74 0.6 1,701.00 $118,628 $314,201Claus Catalyst (ft3) w/equip 3.75 131.27 $0 $161,850
Subtotal Chemicals $16,302,923 $6,947,076
OtherSupplemental Fuel (MBtu) 0 0 0.00 $0 $0Supplemental Electricity (for consumption) (MWh) 0 0 61.60 $0 $0Gases, N2 etc. (/100scf) 0 0 0.00 $0 $0L.P. Steam (/1000 pounds) 0 0 0.00 $0 $0
Subtotal Other $0 $0
Waste DisposalSpent Mercury Catalyst (lb.) 0 401 0.42 $0 $55,002Spent ZnO Sorbent (ton) 0 0.39 16.23 $0 $2,061Flyash (ton) 0 0 0.00 $0 $0Slag (ton) 0 1,159 16.23 $0 $6,175,272
Subtotal-Waste Disposal $0 $6,232,335
By-products & Emissions Sulfur (tons) 0 288 0.00 $0 $0Supplemental Electricity (for sale) (MWh) 0 689 58.00 $0 -$13,123,706
Subtotal By-Products $0 -$13,123,706
TOTAL VARIABLE OPERATING COSTS $16,302,923 $47,821 ,506
Fuel (ton) 0 11,568 38.18 $0 $145,104,505

Cost and Performance Baseline for Coal-to-SNG and Ammonia (Volume 2)
180
Exhibit 4-44 Case 4 Total Plant Cost Details Client: USDOE/NETL R e port Da te : 2010-Feb-18
Project: Cost & Performance Baseline for Fossil Energy Plants Vol.2
Case: Case 4 - Siemens Quench SNG & Ammonia Production w/ CO2Plant Size: -23.73 MW,net Est imate Type: Conceptual Cost Base (Jun) 2007 ($x1000)
Acct Equipment Material Labor Sales Bare Erected Eng'g CM Contingencies Total Plant CostNo. I tem/Descript ion Cost Cost Direct Indirect Tax Cost $ H.O.& Fee Process Project $
1 COAL & SORBENT HANDLING1.1 Coal Receive & Unload $5,727 $0 $2,798 $0 $0 $8,525 $764 $0 $1,858 $11,1461.2 Coal Stackout & Reclaim $7,400 $0 $1,794 $0 $0 $9,194 $806 $0 $2,000 $12,0001.3 Coal Conveyors & Yd Crush $6,880 $0 $1,775 $0 $0 $8,655 $760 $0 $1,883 $11,2981.4 Other Coal Handling $1,800 $0 $411 $0 $0 $2,211 $193 $0 $481 $2,8851.5 Sorbent Receive & Unload $0 $0 $0 $0 $0 $0 $0 $0 $0 $01.6 Sorbent Stackout & Reclaim $0 $0 $0 $0 $0 $0 $0 $0 $0 $01.7 Sorbent Conveyors $0 $0 $0 $0 $0 $0 $0 $0 $0 $01.8 Other Sorbent Handling $0 $0 $0 $0 $0 $0 $0 $0 $0 $01.9 Coal & Sorbent Hnd.Foundations $0 $4,052 $10,133 $0 $0 $14,185 $1,360 $0 $3,109 $18,653
SUBTOTAL 1 . $21 ,806 $4,052 $16,911 $0 $0 $42,769 $3,882 $0 $9,330 $55,982 2 COAL & SORBENT PREP & FEED
2.1 Coal Crushing & Drying $92,894 $0 $13,536 $0 $0 $106,430 $9,666 $0 $23,219 $139,3152.2 Prepared Coal Storage & Feed $4,400 $1,053 $690 $0 $0 $6,143 $525 $0 $1,334 $8,0022.3 Dry Coal Injection System $144,803 $1,681 $13,448 $0 $0 $159,932 $13,775 $0 $34,741 $208,4482.4 Misc.Coal Prep & Feed $2,420 $1,761 $5,279 $0 $0 $9,459 $869 $0 $2,066 $12,3942.5 Sorbent Prep Equipment $0 $0 $0 $0 $0 $0 $0 $0 $0 $02.6 Sorbent Storage & Feed $0 $0 $0 $0 $0 $0 $0 $0 $0 $02.7 Sorbent Injection System $0 $0 $0 $0 $0 $0 $0 $0 $0 $02.8 Booster Air Supply System $0 $0 $0 $0 $0 $0 $0 $0 $0 $02.9 Coal & Sorbent Feed Foundation $0 $9,405 $7,721 $0 $0 $17,126 $1,586 $0 $3,742 $22,454
SUBTOTAL 2. $244,517 $13,899 $40,674 $0 $0 $299,090 $26,421 $0 $65,102 $390,613 3 FEEDWATER & MISC. BOP SYSTEMS
3.1 Feedwater System $3,504 $1,629 $1,975 $0 $0 $7,109 $642 $0 $1,550 $9,3013.2 Water Makeup & Pretreating $856 $89 $478 $0 $0 $1,424 $136 $0 $468 $2,0283.3 Other Feedwater Subsystems $3,805 $1,150 $1,882 $0 $0 $6,837 $621 $0 $1,492 $8,9493.4 Service Water Systems $490 $1,009 $3,501 $0 $0 $5,000 $488 $0 $1,646 $7,1343.5 Other Boiler Plant Systems $2,629 $1,019 $2,525 $0 $0 $6,172 $585 $0 $1,352 $8,1093.6 FO Supply Sys & Nat Gas $102 $210 $188 $0 $0 $500 $48 $0 $110 $6583.7 Waste Treatment Equipment $1,197 $0 $730 $0 $0 $1,927 $188 $0 $634 $2,7493.8 Misc. Power Plant Equipment $1,721 $230 $883 $0 $0 $2,834 $274 $0 $932 $4,040
SUBTOTAL 3. $14,303 $5,336 $12,163 $0 $0 $31 ,803 $2,982 $0 $8,184 $42,968 4 GASIFIER & ACCESSORIES
4.1 Gasifier, Syngas Cooler & Auxiliaries $326,007 $0 $150,932 $0 $0 $476,939 $42,361 $71,541 $88,626 $679,4674.2 Syngas Cooling w/4.1 $0 w/ 4.1 $0 $0 $0 $0 $0 $0 $04.3 ASU/Oxidant Compression $250,140 $0 w/equip. $0 $0 $250,140 $24,246 $0 $27,439 $301,8254.4 LT Heat Recovery & FG Saturation $55,463 $0 $20,550 $0 $0 $76,013 $7,281 $0 $16,659 $99,9534.5 Misc. Gasification Equipment w/4.1 $0 w/4.1&4.2 $0 $0 $0 $0 $0 $0 $04.6 Flare Stack System $0 $2,332 $949 $0 $0 $3,280 $315 $0 $719 $4,3144.7 CO2 Solid Feed System Compressors $6,692 $1,606 $2,409 $0 $0 $10,707 $1,071 $0 $2,356 $14,1344.8 Major Component Rigging w/4.1&4.2 $0 w/4.1&4.2 $0 $0 $0 $0 $0 $0 $04.9 Gasification Foundations $0 $21,135 $12,059 $0 $0 $33,194 $3,039 $0 $9,058 $45,291
SUBTOTAL 4. $638,302 $25,072 $186,899 $0 $0 $850,274 $78,312 $71 ,541 $144,856 $1 ,144,983
TOTAL PLANT COST SUMMARY

Cost and Performance Baseline for Coal-to-SNG and Ammonia (Volume 2)
181
Exhibit 4-44 Case 4 Total Plant Cost Details (continued) Acct Equipment Material Labor Sales Bare Erected Eng'g CM Contingencies Total Plant CostNo. I tem/Descript ion Cost Cost Direct Indirect Tax Cost $ H.O.& Fee Process Project $
5A GAS CLEANUP & PIPING5A.1 Double Stage Selexol $128,808 $0 $109,297 $0 $0 $238,105 $23,027 $47,621 $61,751 $370,5045A.2 Elemental Sulfur Plant $16,281 $3,245 $21,005 $0 $0 $40,531 $3,937 $0 $8,894 $53,3615A.3 Mercury Removal $2,499 $0 $1,901 $0 $0 $4,400 $425 $220 $1,009 $6,054
5A.4a Shift Reactors $11,791 $0 $4,746 $0 $0 $16,537 $1,585 $0 $3,625 $21,7475A.4b COS Hydrolysis $1,493 $0 $1,950 $0 $0 $3,443 $335 $0 $756 $4,533
5A.5 Methanation $21,900 $8,760 $13,140 $0 $0 $43,800 $4,380 $4,380 $10,512 $63,0725A.6 SNG Purification & Compression $17,050 $6,820 $10,230 $0 $0 $34,100 $3,410 $0 $7,502 $45,0125A.7 Fuel Gas Piping $0 $1,749 $1,224 $0 $0 $2,973 $276 $0 $650 $3,8985A.8 Ammonia Production $171,733 $44,261 $88,523 $0 $0 $304,517 $30,452 $0 $50,245 $385,2145A.9 Process Interconnects $0 $18,400 $27,600 $0 $0 $46,000 $4,600 $0 $10,120 $60,720
5A.10 HGCU Foundations $0 $1,771 $1,142 $0 $0 $2,912 $268 $0 $954 $4,1345A.11 Zinc Oxide Guard Bed $664 $0 $122 $0 $0 $786 $79 $0 $173 $1,038
SUBTOTAL 5A. $372,219 $85,005 $280,881 $0 $0 $738,105 $72,773 $52,221 $156,189 $1 ,019,288 5B CO2 COMPRESSION
5B.1 CO2 Removal System $0 $0 $0 $0 $0 $0 $0 $0 $0 $05B.2 CO2 Compression & Drying $38,073 $0 $22,420 $0 $0 $60,493 $5,824 $0 $13,263 $79,581
SUBTOTAL 5B. $38,073 $0 $22,420 $0 $0 $60,493 $5,824 $0 $13,263 $79,581 6 COMBUSTION TURBINE/ACCESSORIES
6.1 Combustion Turbine Generator $0 $0 $0 $0 $0 $0 $0 $0 $0 $06.2 Syngas Expander $0 $0 $0 $0 $0 $0 $0 $0 $0 $06.3 Compressed Air Piping $0 $0 $0 $0 $0 $0 $0 $0 $0 $06.9 Combustion Turbine Foundations $0 $0 $0 $0 $0 $0 $0 $0 $0 $0
SUBTOTAL 6. $0 $0 $0 $0 $0 $0 $0 $0 $0 $0 7 HRSG, DUCTING & STACK
7.1 Heat Recovery Steam Generator $0 $0 $0 $0 $0 $0 $0 $0 $0 $07.2 HRSG Accessories $0 $0 $0 $0 $0 $0 $0 $0 $0 $07.3 Ductwork $0 $0 $0 $0 $0 $0 $0 $0 $0 $07.4 Stack $0 $0 $0 $0 $0 $0 $0 $0 $0 $07.9 HRSG,Duct & Stack Foundations $0 $0 $0 $0 $0 $0 $0 $0 $0 $0
SUBTOTAL 7. $0 $0 $0 $0 $0 $0 $0 $0 $0 $0 8 STEAM TURBINE GENERATOR
8.1 Steam TG & Accessories $30,291 $0 $5,224 $0 $0 $35,514 $3,408 $0 $3,892 $42,8148.2 Turbine Plant Auxiliaries $163 $0 $482 $0 $0 $645 $63 $0 $71 $7798.3 Condenser & Auxiliaries $5,594 $0 $1,580 $0 $0 $7,174 $685 $0 $786 $8,6458.4 Steam Piping $5,477 $0 $3,853 $0 $0 $9,329 $801 $0 $2,533 $12,6638.9 TG Foundations $0 $1,043 $1,764 $0 $0 $2,807 $266 $0 $922 $3,995
SUBTOTAL 8. $41 ,524 $1 ,043 $12,902 $0 $0 $55,470 $5,224 $0 $8,204 $68,897

Cost and Performance Baseline for Coal-to-SNG and Ammonia (Volume 2)
182
Exhibit 4-44 Case 4 Total Plant Cost Details (continued) Acct Equipment Material Labor Sales Bare Erected Eng'g CM Contingencies Total Plant CostNo. I tem/Descript ion Cost Cost Direct Indirect Tax Cost $ H.O.& Fee Process Project $
9 COOLING WATER SYSTEM9.1 Cooling Towers $7,345 $0 $1,603 $0 $0 $8,949 $853 $0 $1,470 $11,2729.2 Circulating Water Pumps $2,343 $0 $85 $0 $0 $2,427 $204 $0 $395 $3,0269.3 Circ.Water System Auxiliaries $186 $0 $27 $0 $0 $213 $20 $0 $35 $2689.4 Circ.Water Piping $0 $7,768 $2,014 $0 $0 $9,782 $884 $0 $2,133 $12,8009.5 Make-up Water System $451 $0 $644 $0 $0 $1,095 $105 $0 $240 $1,4409.6 Component Cooling Water Sys $917 $1,097 $780 $0 $0 $2,794 $262 $0 $611 $3,6679.9 Circ.Water System Foundations $0 $2,845 $4,836 $0 $0 $7,680 $728 $0 $2,523 $10,931
SUBTOTAL 9. $11 ,242 $11 ,710 $9,989 $0 $0 $32,940 $3,056 $0 $7,407 $43,40310 ASH/SPENT SORBENT HANDLING SYS
10.1 Slag Dewatering & Cooling $36,250 $0 $35,754 $0 $0 $72,004 $6,977 $0 $7,898 $86,87910.2 Gasifier Ash Depressurization w/10.1 w/10.1 w/10.1 $0 $0 $0 $0 $0 $0 $010.3 Cleanup Ash Depressurization w/10.1 w/10.1 w/10.1 $0 $0 $0 $0 $0 $0 $010.4 High Temperature Ash Piping $0 $0 $0 $0 $0 $0 $0 $0 $0 $010.5 Other Ash Recovery Equipment $0 $0 $0 $0 $0 $0 $0 $0 $0 $010.6 Ash Storage Silos $817 $0 $889 $0 $0 $1,707 $166 $0 $281 $2,15310.7 Ash Transport & Feed Equipment $1,096 $0 $265 $0 $0 $1,361 $127 $0 $223 $1,71110.8 Misc. Ash Handling Equipment $1,693 $2,075 $620 $0 $0 $4,388 $418 $0 $721 $5,52610.9 Ash/Spent Sorbent Foundation $0 $72 $91 $0 $0 $163 $15 $0 $54 $232
SUBTOTAL 10. $39,857 $2,147 $37,618 $0 $0 $79,623 $7,702 $0 $9,177 $96,50211 ACCESSORY ELECTRIC PLANT
11.1 Generator Equipment $420 $0 $416 $0 $0 $836 $80 $0 $92 $1,00711.2 Station Service Equipment $6,219 $0 $560 $0 $0 $6,780 $625 $0 $740 $8,14511.3 Switchgear & Motor Control $11,498 $0 $2,091 $0 $0 $13,589 $1,260 $0 $2,227 $17,07611.4 Conduit & Cable Tray $0 $5,341 $17,620 $0 $0 $22,961 $2,221 $0 $6,295 $31,47711.5 Wire & Cable $0 $10,205 $6,705 $0 $0 $16,910 $1,228 $0 $4,535 $22,67311.6 Protective Equipment $0 $855 $3,111 $0 $0 $3,965 $387 $0 $653 $5,00511.7 Standby Equipment $330 $0 $322 $0 $0 $651 $62 $0 $107 $82111.8 Main Power Transformers $9,977 $0 $182 $0 $0 $10,159 $771 $0 $1,639 $12,56911.9 Electrical Foundations $0 $197 $518 $0 $0 $716 $68 $0 $235 $1,019
SUBTOTAL 11 . $28,443 $16,598 $31 ,524 $0 $0 $76,565 $6,703 $0 $16,524 $99,79212 INSTRUMENTATION & CONTROL
12.1 IGCC Control Equipment w/4.1 $0 w/4.1 $0 $0 $0 $0 $0 $0 $012.2 Combustion Turbine Control w/6.1 $0 w/6.1 $0 $0 $0 $0 $0 $0 $012.3 Steam Turbine Control w/8.1 $0 w/8.1 $0 $0 $0 $0 $0 $0 $012.4 Other Major Component Control $532 $0 $355 $0 $0 $888 $84 $44 $152 $1,16912.5 Signal Processing Equipment w/12.7 $0 w/12.7 $0 $0 $0 $0 $0 $0 $012.6 Control Boards,Panels & Racks $353 $0 $227 $0 $0 $580 $55 $29 $133 $79712.7 Computer & Accessories $5,657 $0 $181 $0 $0 $5,838 $536 $292 $667 $7,33312.8 Instrument Wiring & Tubing $0 $2,866 $5,858 $0 $0 $8,724 $740 $436 $2,475 $12,37512.9 Other I & C Equipment $4,218 $0 $2,048 $0 $0 $6,266 $590 $313 $1,075 $8,244
SUBTOTAL 12. $10,761 $2,866 $8,669 $0 $0 $22,296 $2,004 $1 ,115 $4,502 $29,917

Cost and Performance Baseline for Coal-to-SNG and Ammonia (Volume 2)
183
Exhibit 4-44 Case 4 Total Plant Cost Details (continued)
Acct Equipment Material Labor Sales Bare Erected Eng'g CM Contingencies Total Plant CostNo. I tem/Descript ion Cost Cost Direct Indirect Tax Cost $ H.O.& Fee Process Project $
13 IMPROVEMENTS TO SITE13.1 Site Preparation $0 $147 $3,142 $0 $0 $3,289 $326 $0 $1,085 $4,70013.2 Site Improvements $0 $2,614 $3,474 $0 $0 $6,089 $601 $0 $2,007 $8,69613.3 Site Facilities $4,685 $0 $4,944 $0 $0 $9,629 $949 $0 $3,173 $13,751
SUBTOTAL 13. $4,685 $2,761 $11 ,560 $0 $0 $19,006 $1 ,877 $0 $6,265 $27,14814 BUILDINGS & STRUCTURES
14.1 Combustion Turbine Area $0 $0 $0 $0 $0 $0 $0 $0 $0 $014.2 Steam Turbine Building $0 $2,530 $3,604 $0 $0 $6,134 $564 $0 $1,005 $7,70314.3 Administration Building $0 $870 $630 $0 $0 $1,500 $134 $0 $245 $1,87914.4 Circulation Water Pumphouse $0 $160 $90 $0 $0 $250 $22 $0 $41 $31214.5 Water Treatment Buildings $0 $787 $768 $0 $0 $1,555 $140 $0 $254 $1,95014.6 Machine Shop $0 $445 $305 $0 $0 $750 $67 $0 $123 $93914.7 Warehouse $0 $762 $487 $0 $0 $1,249 $111 $0 $204 $1,56414.8 Other Buildings & Structures $0 $528 $411 $0 $0 $940 $84 $0 $205 $1,22814.9 Waste Treating Building & Str. $0 $1,299 $2,483 $0 $0 $3,782 $353 $0 $827 $4,961
SUBTOTAL 14. $0 $7,381 $8,778 $0 $0 $16,159 $1 ,474 $0 $2,903 $20,536
TOTAL COST $1,465,733 $177,872 $680,989 $0 $0 $2,324,594 $218,235 $124,877 $451 ,906 $3,119,611
Owner's CostsPreproduction Costs
6 Months All Labor $24,4431 Month Maintenance Materials $4,391
1 Month Non-fuel Consumables $1,8901 Month Waste Disposal $577
25% of 1 Months Fuel Cost at 100% CF $3,3592% of TPC $62,392
Total $97,052Inventory Capital
60 day supply of fuel and consumables at 100% CF $28,1630.5% of TPC (spare parts) $15,598
Total $43,761
Initial Cost for Catalyst and Chemicals $16,321Land $900
Other Owner's Costs $467,942Financing Costs $84,230
Total Overnight Costs (TOC) $3,829,817TASC Multiplier 1.201
Total As-Spent Cost (TASC) $4,599,610

Cost and Performance Baseline for Coal-to-SNG and Ammonia (Volume 2)
184
Exhibit 4-45 Case 4 Initial and Annual O&M Costs INITIAL & ANNUAL O&M EXPENSES Cost Base (Jun): 2007
Case 4 - Siemens Quench SNG & Ammonia Production w/ CO2 MWe-net: -24SNG (MMbtu/hr): 5,122 mmonia (lb/hr): 183,634 Capacity Factor (%): 90
OPERATING & MAINTENANCE LABOROperating Labor
Operating Labor Rate (base): 34.65 $/hour Operating Labor Burden: 30.00 % of base Labor O-H Charge Rate: 25.00 % of labor
Total
Skilled Operator 2.0 2.0 Operator 13.0 13.0 Foreman 1.0 1.0 Lab Tech's, etc. 3.0 3.0 TOTAL-O.J.'s 19.0 19.0
Annual Cost$
Annual Operating Labor Cost $7,497,290Maintenance Labor Cost $31,612,112Administrative & Support Labor $9,777,351Property Taxes and Insurance $62,392,230TOTAL FIXED OPERATING COSTS $111,278,983VARIABLE OPERATING COSTS
Maintenance Material Cost $47,418,169
Consumables Consumption Unit Initial Fill Initial Fill /Day Cost Cost
Water(/1000 gallons) 0 5,370 1.08 $0 $1 ,908,039
ChemicalsMU & WT Chem.(lb) 0 31,991 0.17 $0 $1,818,807Carbon (Mercury Removal) (lb) 234,364 401 1.05 $246,122 $138,444COS Catalyst (m3) 88 0.1 2,397.36 $210,355 $59,162Water Gas Shift Catalyst (ft3) 8,499 7.5 498.83 $4,239,732 $1,221,706ZnO Sorbent (ton) 115 0.4 12,574.00 $1,442,149 $1,622,417Methanation Catalyst (ft3) 9,183 6.99 440.00 $4,040,718 $1,010,180Selexol Solution (gal) 449,563 143 13.40 $6,023,353 $630,308SCR Catalyst (m3) 0 0 0.00 $0 $0Aqueous Ammonia (ton) 0 0 0.00 $0 $0Ammonia Catalyst (ft3) 69.74 0.6 1,701.00 $118,628 $314,201Claus Catalyst (ft3) w/equip 3.75 131.27 $0 $161,869
Subtotal Chemicals $16,321 ,057 $6,977,094
OtherSupplemental Fuel (MBtu) 0 0 0.00 $0 $0Supplemental Electricity (for consumption) (MW 0 570 61.60 $0 $11,524,579Gases, N2 etc.(/100scf) 0 0 0.00 $0 $0L.P. Steam (/1000 pounds) 0 0 0.00 $0 $0
Subtotal Other $0 $11 ,524,579
Waste DisposalSpent Mercury Catalyst (lb.) 0 401 0.42 $0 $54,983Spent ZnO Sorbent (ton) 0 0.39 16.23 $0 $2,094Flyash (ton) 0 0 0.00 $0 $0Slag (ton) 0 1,159 16.23 $0 $6,175,271
Subtotal-Waste Disposal $0 $6,232,347
By-products & Emissions Sulfur (tons) 0 288 0.00 $0 $0Supplemental Electricity (for sale) (MWh) 0 0 58.00 $0 $0
Subtotal By-Products $0 $0
TOTAL VARIABLE OPERATING COSTS $16,321 ,057 $74,060,228
Fuel (ton) 0 11,568 38.18 $0 $145,104,475

Cost and Performance Baseline for Coal-to-SNG and Ammonia (Volume 2)
185
5.
5.1 SYNTHETIC NATURAL GAS PRODUCTION USING ROSEBUD PRB COAL
LOW RANK COAL CASES
5.1.1 In this section the overall Siemens gasification process for SNG production using Montana Rosebud PRB coal is described. The plant configurations are similar to Cases 1 and 2, with the exception of the coal type utilized and coal drying method. Only the major process areas that differ from Cases 1 and 2 are described below. Since the carbon content of the subbituminous coal used is lower than that of the bituminous coal, the coal feed rate is significantly increased. The process BFDs for the PRB coal non-sequestration and sequestration cases are shown in
Process Description
Exhibit 5-1 and Exhibit 5-3. The associated stream tables are shown in Exhibit 5-2 for the non-sequestration case and Exhibit 5-4 for the sequestration case.
The WTA coal drying process includes a water-heated-, horizontal-, rotary-kiln coal pre-heater, a fluidized bed coal dryer and a water-cooled-, horizontal-, rotary-kiln coal cooler. The moisture driven from the coal in the fluid bed dryer passes through a baghouse for particulate removal and then is split into two streams. The smaller of the two streams is compressed and used as the fluidizing medium in the coal dryer. The bulk of the removed moisture is compressed to approximately 0.77 MPa (112 psia) and the temperature is raised to about 406°C (763°F) in the process. The high temperature vapor passes through internal coils in the dryer to provide the heat to drive off the coal moisture and then exits the dryer as liquid water. The warm water is used in the coal pre-heater before being used as cooling tower makeup water (stream 7). The vapor compressor consumes the vast majority of the WTA process auxiliary load.
Coal Drying

Cost and Performance Baseline for Coal-to-SNG and Ammonia (Volume 2)
186
Exhibit 5-1 Case 5 Block Flow Diagram, Subbituminous Rosebud PRB Coal to SNG without Carbon Sequestration
PARTIAL RAW GAS QUENCH AND COOLING
WATER-GAS SHIFT REACTORS & GAS COOLING
WATER SCRUBBER
ELEVATEDPRESSURE
ASU
SIEMENS GASIFIER
MERCURYREMOVAL
DUAL-STAGE
SELEXOL UNIT
CLAUSPLANT
1AIR TO ASU
2 3
VENTGAS
SULFUR PLANT
OXIDANT
4
8
11
GASIFIEROXIDANT
DRIEDCOAL
SLAG
14
2829
HYDROGENATIONREACTOR
30
CLEAN GAS
SULFUR PRODUCT
SYNGAS
WTACOAL
DRYER6
WETCOAL
75
13
TO SOUR WATER
STRIPPER
STEAM
2717
16
CO2VENT
SHIFT STEAM
WATER
31
12QUENCHWATER
15
18
METHANATION REACTORS
23
SNG PURIFICATION
25
SNG FOR EXPORT
24 PURIFICATION OFF-GAS
20
21
22PILOT FUEL
WGS BYPASS
STEAM TURBINE
32 33
PROCESS STEAM
CONDENSATE
19
SNG COMPRESSION 26
Note: Block Flow Diagram is not intended to represent a complete material balance. Only major process streams and equipment are shown. See H&MB diagram for more detail.
9
LOCK-HOPPER
VENT
TRANSPORT CO2
10
9TRANSPORT CO2

Cost and Performance Baseline for Coal-to-SNG and Ammonia (Volume 2)
187
Exhibit 5-2 Case 5 Stream Table, Subbituminous Rosebud Coal to SNG without Carbon Sequestration 1 2 3 4 5 6 7 8 9 10 11 12 13 14 15 16 17
V-L Mole FractionAr 0.0093 0.0091 0.0101 0.0101 0.0000 0.0000 0.0000 0.0000 0.0001 0.0000 0.0000 0.0000 0.0020 0.0021 0.0021 0.0021 0.0000CH4 0.0000 0.0000 0.0000 0.0000 0.0000 0.0000 0.0000 0.0000 0.0000 0.0000 0.0000 0.0000 0.0001 0.0001 0.0001 0.0001 0.0000CO 0.0000 0.0000 0.0000 0.0000 0.0000 0.0000 0.0000 0.0000 0.0106 0.0014 0.0000 0.0000 0.4342 0.4497 0.4497 0.4497 0.0000CO2 0.0003 0.0004 0.0000 0.0000 0.0000 0.0000 0.0000 0.0000 0.9765 0.1307 0.0000 0.0000 0.0560 0.0580 0.0580 0.0580 0.0000COS 0.0000 0.0000 0.0000 0.0000 0.0000 0.0000 0.0000 0.0000 0.0001 0.0000 0.0000 0.0000 0.0002 0.0002 0.0002 0.0002 0.0000H2 0.0000 0.0000 0.0000 0.0000 0.0000 0.0000 0.0000 0.0000 0.0113 0.6295 0.0000 0.0000 0.1836 0.1901 0.1901 0.1901 0.0000H2O 0.0064 0.0026 0.0000 0.0000 1.0000 0.0000 1.0000 0.0000 0.0013 0.0985 0.0000 1.0000 0.3188 0.2945 0.2945 0.2945 1.0000H2S 0.0000 0.0000 0.0000 0.0000 0.0000 0.0000 0.0000 0.0000 0.0000 0.0000 0.0000 0.0000 0.0022 0.0023 0.0023 0.0023 0.0000N2 0.7759 0.9803 0.0004 0.0004 0.0000 0.0000 0.0000 0.0000 0.0000 0.0096 0.0000 0.0000 0.0029 0.0030 0.0030 0.0030 0.0000NH3 0.0000 0.0000 0.0000 0.0000 0.0000 0.0000 0.0000 0.0000 0.0000 0.0000 0.0000 0.0000 0.0000 0.0000 0.0000 0.0000 0.0000O2 0.2081 0.0076 0.9895 0.9895 0.0000 0.0000 0.0000 0.0000 0.0000 0.1302 0.0000 0.0000 0.0000 0.0000 0.0000 0.0000 0.0000SO2 0.0000 0.0000 0.0000 0.0000 0.0000 0.0000 0.0000 0.0000 0.0000 0.0000 0.0000 0.0000 0.0000 0.0000 0.0000 0.0000 0.0000
Total 1.0000 1.0000 1.0000 1.0000 1.0000 0.0000 1.0000 0.0000 1.0000 1.0000 0.0000 1.0000 1.0000 1.0000 1.0000 1.0000 1.0000
V-L Flowrate (kgmol/hr) 51,342 40,633 74 10,414 2,754 0 6,669 0 4,090 15,275 0 12,518 52,503 50,698 6,569 44,129 15,436V-L Flowrate (kg/hr) 1,483,532 1,143,127 2,361 334,053 49,619 0 120,139 0 177,211 202,764 0 225,516 1,102,187 1,069,647 138,592 931,055 278,087Solids Flowrate (kg/hr) 0 0 0 0 0 571,223 0 451,084 0 336,925 48,199 0 0 0 0 0 0
Temperature (°C) 6 26 32 32 343 6 34 71 76 18 1,427 216 260 214 214 214 288Pressure (MPa, abs) 0.09 0.11 0.86 0.86 5.10 0.10 0.60 0.09 5.62 5.62 4.24 8.27 3.89 3.756 3.76 3.76 4.14Enthalpy (kJ/kg) 15.71 30.53 26.94 26.94 3,177.81 --- 152.37 --- 22.14 3,807.88 --- 1,017.87 1,091.95 959.483 959.48 959.48 3,070.04Density (kg/m3) 1.1 1.3 11.0 11.0 20.1 --- 985.3 --- 103.2 33.8 --- 782.0 18.6 19.8 19.8 19.8 18.2V-L Molecular Weight 28.895 28.133 32.078 32.078 18.015 --- 18.015 --- 43.330 13.275 --- 18.015 20.993 21.099 21.099 21.099 18.015
V-L Flowrate (lbmol/hr) 113,190 89,581 162 22,959 6,072 0 14,702 0 9,017 33,675 0 27,598 115,750 111,769 14,482 97,287 34,031V-L Flowrate (lb/hr) 3,270,629 2,520,163 5,205 736,460 109,392 0 264,861 0 390,684 447,019 0 497,178 2,429,905 2,358,168 305,544 2,052,624 613,077Solids Flowrate (lb/hr) 0 0 0 0 0 1,259,331 0 994,470 0 742,793 106,261 0 0 0 0 0 0
Temperature (°F) 42 78 90 90 650 42 92 160 168 64 2,600 420 500 417 417 417 550Pressure (psia) 13.0 16.4 125.0 125.0 740.0 13.8 86.7 13.5 815.0 815.0 614.7 1,200.0 564.7 544.7 544.7 544.7 600.0Enthalpy (Btu/lb) 6.8 13.1 11.6 11.6 1,366.2 --- 65.5 --- 9.5 1,637.1 --- 437.6 469.5 412.5 412.5 412.5 1,319.9Density (lb/ft3) 0.070 0.080 0.685 0.685 1.257 --- 61.508 --- 6.441 2.111 --- 48.817 1.162 1.238 1.238 1.238 1.135
A - Reference conditions are 32.02 F & 0.089 PSIA

Cost and Performance Baseline for Coal-to-SNG and Ammonia (Volume 2)
188
Exhibit 5-2 Case 5 Stream Table, Subbituminous Rosebud Coal to SNG without Carbon Sequestration (continued) 18 19 20 21 22 23 24 25 26 27 28 29 30 31 32 33
V-L Mole FractionAr 0.0021 0.0021 0.0031 0.0031 0.0031 0.0109 0.0000 0.0126 0.0126 0.0000 0.0007 0.0000 0.0016 0.0022 0.0000 0.0000CH4 0.0001 0.0001 0.0001 0.0001 0.0001 0.8283 0.0000 0.9595 0.9595 0.0000 0.0000 0.0000 0.0000 0.0000 0.0000 0.0000CO 0.1606 0.1589 0.2361 0.2361 0.2361 0.0000 0.0000 0.0000 0.0000 0.0024 0.0594 0.0000 0.0851 0.0073 0.0000 0.0000CO2 0.3487 0.3537 0.0405 0.0405 0.0405 0.1364 0.9832 0.0024 0.0024 0.9909 0.5950 0.0000 0.4846 0.7989 0.0000 0.0000COS 0.0001 0.0001 0.0000 0.0000 0.0000 0.0000 0.0000 0.0000 0.0000 0.0001 0.0018 0.0000 0.0003 0.0000 0.0000 0.0000H2 0.4812 0.4779 0.7156 0.7156 0.7156 0.0064 0.0000 0.0075 0.0075 0.0024 0.1138 0.0000 0.0549 0.1856 0.0000 0.0000H2O 0.0018 0.0017 0.0001 0.0001 0.0001 0.0023 0.0168 0.0000 0.0000 0.0042 0.0413 0.0000 0.3702 0.0009 1.0000 1.0000H2S 0.0025 0.0025 0.0000 0.0000 0.0000 0.0000 0.0000 0.0000 0.0000 0.0000 0.1873 0.0000 0.0014 0.0041 0.0000 0.0000N2 0.0030 0.0030 0.0045 0.0045 0.0045 0.0156 0.0000 0.0180 0.0180 0.0000 0.0005 0.0000 0.0007 0.0010 0.0000 0.0000NH3 0.0000 0.0000 0.0000 0.0000 0.0000 0.0000 0.0000 0.0000 0.0000 0.0000 0.0000 0.0000 0.0000 0.0000 0.0000 0.0000O2 0.0000 0.0000 0.0000 0.0000 0.0000 0.0000 0.0000 0.0000 0.0000 0.0000 0.0000 0.0000 0.0000 0.0000 0.0000 0.0000SO2 0.0000 0.0000 0.0000 0.0000 0.0000 0.0000 0.0000 0.0000 0.0000 0.0000 0.0000 0.0000 0.0012 0.0000 0.0000 0.0000
Total 1.0000 1.0000 1.0000 1.0000 1.0000 1.0000 1.0000 1.0000 1.0000 1.0000 1.0000 0.0000 1.0000 1.0000 1.0000 1.0000
V-L Flowrate (kgmol/hr) 50,536 51,104 33,915 149 33,766 9,681 1,323 8,358 8,358 12,415 684 0 803 568 43,734 60,796V-L Flowrate (kg/hr) 1,066,602 1,087,054 342,281 1,508 340,773 195,747 57,660 138,086 138,086 543,371 24,191 0 24,674 20,452 787,876 1,095,261Solids Flowrate (kg/hr) 0 0 0 0 0 0 0 0 0 0 0 4,095 0 0 0 0
Temperature (°C) 35 34 31 80 31 35 35 35 35 5 48 175 232 21 566 33Pressure (MPa, abs) 3.34 3.27 3.24 5.10 3.24 2.77 0.14 2.627 6.202 0.115 0.16 0.1 0.085 3.341 12.512 0.827Enthalpy (kJ/kg) 42.82 41.44 85.34 232.30 85.34 40.71 46.43 47.903 12.710 7.664 101.63 --- 845.516 -8.120 3,495.174 120.842Density (kg/m3) 28.0 27.8 12.8 17.2 12.8 23.2 2.4 17.8 44.5 2.2 2.2 5,285.9 0.6 56.5 34.9 995.1V-L Molecular Weight 21.106 21.271 10.092 10.092 10.092 20.220 43.574 16.522 16.522 43.766 35.361 --- 30.719 36.012 18.015 18.015
V-L Flowrate (lbmol/hr) 111,414 112,666 74,770 329 74,440 21,342 2,917 18,425 18,425 27,371 1,508 0 1,771 1,252 96,416 134,033V-L Flowrate (lb/hr) 2,351,455 2,396,544 754,601 3,325 751,276 431,548 127,119 304,428 304,428 1,197,927 53,332 0 54,397 45,090 1,736,970 2,414,637Solids Flowrate (lb/hr) 0 0 0 0 0 0 0 0 0 0 0 9,028 0 0 0 0
Temperature (°F) 95 94 87 177 87 95 95 95 95 42 119 347 450 69 1,050 91Pressure (psia) 484.7 474.7 469.6 740.0 469.6 401.1 20.1 381.0 899.5 16.7 23.7 17.3 12.3 484.5 1,814.7 120.0Enthalpy (Btu/lb) 18.4 17.8 36.7 99.9 36.7 17.5 20.0 20.6 5.5 3.3 43.7 --- 363.5 -3.5 1,502.7 52.0Density (lb/ft3) 1.751 1.733 0.798 1.071 0.798 1.446 0.148 1.110 2.778 0.137 0.136 330 0.039 3.528 2.177 62.123

Cost and Performance Baseline for Coal-to-SNG and Ammonia (Volume 2)
189
Exhibit 5-3 Case 6 Block Flow Diagram, Subbituminous Rosebud Coal to SNG with Carbon Sequestration
PARTIAL RAW GAS QUENCH AND COOLING
WATER-GAS SHIFT REACTORS & GAS COOLING
WATER SCRUBBER
ELEVATEDPRESSURE
ASU
SIEMENS GASIFIER
MERCURYREMOVAL
DUAL-STAGE
SELEXOL UNIT
CLAUSPLANT
1AIR TO ASU
2 3
VENTGAS
SULFUR PLANT
OXIDANT
4
11
GASIFIEROXIDANT
SLAG
14
2829
HYDROGENATIONREACTOR
30
CLEAN GAS
SULFUR PRODUCT
SYNGAS
5
13
TO SOUR WATER
STRIPPER
STEAM
2717
16
CO2PRODUCT
SHIFT STEAM
31
12QUENCHWATER
15
18
METHANATION REACTORS
23
SNG PURIFICATION
25
SNG FOR EXPORT
24PURIFICATION
OFF-GAS TO CO2 COMPRESSION
20
2122PILOT
FUEL
WGS BYPASS
9
STEAM TURBINE
32 33
PROCESS STEAM
CONDENSATE
19
SNG COMPRESSION 26
CO2 COMPRESSION
24
Note: Block Flow Diagram is not intended to represent a complete material balance. Only major process streams and equipment are shown. See H&MB diagram for more detail.
8
DRIEDCOAL
WTACOAL
DRYER6
WETCOAL
7
WATER
9
LOCK-HOPPER
TRANSPORT CO2
10
VENT
PURIFICATION OFF-GAS
TRANSPORT CO2

Cost and Performance Baseline for Coal-to-SNG and Ammonia (Volume 2)
190
Exhibit 5-4 Case 6 Stream Table, Subbituminous Rosebud PRB Coal to SNG with Carbon Sequestration
1 2 3 4 5 6 7 8 9 10 11 12 13 14 15 16 17V-L Mole Fraction
Ar 0.0093 0.0091 0.0101 0.0101 0.0000 0.0000 0.0000 0.0000 0.0001 0.0000 0.0000 0.0000 0.0020 0.0021 0.0021 0.0021 0.0000CH4 0.0000 0.0000 0.0000 0.0000 0.0000 0.0000 0.0000 0.0000 0.0000 0.0000 0.0000 0.0000 0.0001 0.0001 0.0001 0.0001 0.0000CO 0.0000 0.0000 0.0000 0.0000 0.0000 0.0000 0.0000 0.0000 0.0041 0.0005 0.0000 0.0000 0.4343 0.4497 0.4497 0.4497 0.0000CO2 0.0003 0.0004 0.0000 0.0000 0.0000 0.0000 0.0000 0.0000 0.9914 0.1316 0.0000 0.0000 0.0561 0.0581 0.0581 0.0581 0.0000COS 0.0000 0.0000 0.0000 0.0000 0.0000 0.0000 0.0000 0.0000 0.0001 0.0000 0.0000 0.0000 0.0002 0.0002 0.0002 0.0002 0.0000H2 0.0000 0.0000 0.0000 0.0000 0.0000 0.0000 0.0000 0.0000 0.0043 0.6293 0.0000 0.0000 0.1833 0.1898 0.1898 0.1898 0.0000H2O 0.0064 0.0026 0.0000 0.0000 1.0000 0.0000 1.0000 0.0000 0.0001 0.0985 0.0000 1.0000 0.3189 0.2946 0.2946 0.2946 1.0000H2S 0.0000 0.0000 0.0000 0.0000 0.0000 0.0000 0.0000 0.0000 0.0000 0.0000 0.0000 0.0000 0.0022 0.0023 0.0023 0.0023 0.0000N2 0.7759 0.9803 0.0004 0.0004 0.0000 0.0000 0.0000 0.0000 0.0000 0.0096 0.0000 0.0000 0.0029 0.0030 0.0030 0.0030 0.0000NH3 0.0000 0.0000 0.0000 0.0000 0.0000 0.0000 0.0000 0.0000 0.0000 0.0000 0.0000 0.0000 0.0000 0.0000 0.0000 0.0000 0.0000O2 0.2081 0.0076 0.9895 0.9895 0.0000 0.0000 0.0000 0.0000 0.0000 0.1304 0.0000 0.0000 0.0000 0.0000 0.0000 0.0000 0.0000SO2 0.0000 0.0000 0.0000 0.0000 0.0000 0.0000 0.0000 0.0000 0.0000 0.0000 0.0000 0.0000 0.0000 0.0000 0.0000 0.0000 0.0000
Total 1.0000 1.0000 1.0000 1.0000 1.0000 0.0000 1.0000 0.0000 1.0000 0.0000 1.0000 1.0000 1.0000 1.0000 1.0000 1.0000
V-L Flowrate (kgmol/hr) 51,336 40,628 73 10,413 2,754 0 6,669 0 4,049 15,254 0 12,514 52,479 50,673 6,564 44,109 15,439V-L Flowrate (kg/hr) 1,483,363 1,142,996 2,343 334,032 49,619 0 120,139 0 177,211 202,764 0 225,439 1,102,088 1,069,598 138,555 931,043 278,144Solids Flowrate (kg/hr) 0 0 0 0 0 571,223 0 451,084 0 336,925 48,199 0 0 0 0 0 0
Temperature (°C) 6 26 32 32 343 6 34 71 75 18 1,427 216 260 214 214 214 288Pressure (MPa, abs) 0.09 0.11 0.86 0.86 5.10 0.09 0.55 0.09 5.62 5.62 4.24 8.27 3.89 3.756 3.76 3.76 4.14Enthalpy (kJ/kg) 15.71 30.53 26.94 26.94 3,177.81 --- 152.81 --- 18.45 3,812.95 --- 1,017.87 1,091.75 959.191 959.19 959.19 3,070.04Density (kg/m3) 1.1 1.3 11.0 11.0 20.1 --- 985.2 --- 105.5 33.9 --- 782.0 18.6 19.8 19.8 19.8 18.2V-L Molecular Weight 28.895 28.133 32.078 32.078 18.015 --- 18.015 --- 43.764 13.292 --- 18.015 21.001 21.108 21.108 21.108 18.015
V-L Flowrate (lbmol/hr) 113,177 89,570 161 22,957 6,072 0 14,702 0 8,927 33,630 0 27,588 115,695 111,715 14,472 97,244 34,038V-L Flowrate (lb/hr) 3,270,256 2,519,876 5,166 736,415 109,392 0 264,860 0 390,684 447,019 0 497,007 2,429,689 2,358,061 305,462 2,052,598 613,203Solids Flowrate (lb/hr) 0 0 0 0 0 1,259,331 0 994,470 0 742,793 106,261 0 0 0 0 0 0
Temperature (°F) 42 78 90 90 650 42 93 160 166 64 2,600 420 500 417 417 417 550Pressure (psia) 13.0 16.4 125.0 125.0 740.0 13.0 80.3 12.7 815.0 815.0 614.7 1,200.0 564.7 544.7 544.7 544.7 600.0Enthalpy (Btu/lb) 6.8 13.1 11.6 11.6 1,366.2 --- 65.7 --- 7.9 1,639.3 --- 437.6 469.4 412.4 412.4 412.4 1,319.9Density (lb/ft3) 0.070 0.080 0.685 0.685 1.257 --- 61.501 --- 6.587 2.116 --- 48.817 1.162 1.238 1.238 1.238 1.135
A - Reference conditions are 32.02 F & 0.089 PSIA

Cost and Performance Baseline for Coal-to-SNG and Ammonia (Volume 2)
191
Exhibit 5-4 Case 6 Stream Table, Subbituminous Rosebud PRB Coal to SNG with Carbon Sequestration (continued)
18 19 20 21 22 23 24 25 26 27 28 29 30 31 32 33V-L Mole Fraction
Ar 0.0021 0.0021 0.0031 0.0031 0.0031 0.0109 0.0000 0.0126 0.0126 0.0001 0.0007 0.0000 0.0016 0.0022 0.0000 0.0000CH4 0.0001 0.0001 0.0001 0.0001 0.0001 0.8276 0.0000 0.9590 0.9590 0.0000 0.0000 0.0000 0.0000 0.0000 0.0000 0.0000CO 0.1606 0.1589 0.2361 0.2361 0.2361 0.0000 0.0000 0.0000 0.0000 0.0041 0.0594 0.0000 0.0846 0.0074 0.0000 0.0000CO2 0.3490 0.3540 0.0406 0.0406 0.0406 0.1367 0.9833 0.0024 0.0024 0.9914 0.5957 0.0000 0.4861 0.7981 0.0000 0.0000COS 0.0001 0.0001 0.0000 0.0000 0.0000 0.0000 0.0000 0.0000 0.0000 0.0001 0.0018 0.0000 0.0003 0.0000 0.0000 0.0000H2 0.4810 0.4777 0.7155 0.7155 0.7155 0.0069 0.0000 0.0080 0.0080 0.0043 0.1139 0.0000 0.0552 0.1871 0.0000 0.0000H2O 0.0017 0.0017 0.0001 0.0001 0.0001 0.0023 0.0167 0.0000 0.0000 0.0001 0.0410 0.0000 0.3696 0.0009 1.0000 1.0000H2S 0.0025 0.0025 0.0000 0.0000 0.0000 0.0000 0.0000 0.0000 0.0000 0.0000 0.1869 0.0000 0.0014 0.0033 0.0000 0.0000N2 0.0030 0.0030 0.0045 0.0045 0.0045 0.0155 0.0000 0.0180 0.0180 0.0000 0.0005 0.0000 0.0007 0.0009 0.0000 0.0000NH3 0.0000 0.0000 0.0000 0.0000 0.0000 0.0000 0.0000 0.0000 0.0000 0.0000 0.0000 0.0000 0.0000 0.0000 0.0000 0.0000O2 0.0000 0.0000 0.0000 0.0000 0.0000 0.0000 0.0000 0.0000 0.0000 0.0000 0.0000 0.0000 0.0000 0.0000 0.0000 0.0000SO2 0.0000 0.0000 0.0000 0.0000 0.0000 0.0000 0.0000 0.0000 0.0000 0.0000 0.0000 0.0000 0.0006 0.0000 0.0000 0.0000
Total 1.0000 1.0000 1.0000 1.0000 1.0000 1.0000 1.0000 1.0000 1.0000 1.0000 0.0000 1.0000 1.0000 1.0000 1.0000
V-L Flowrate (kgmol/hr) 50,513 51,082 33,890 149 33,740 9,680 1,326 8,354 8,354 15,652 683 0 802 569 43,615 60,862V-L Flowrate (kg/hr) 1,066,572 1,087,014 342,095 1,508 340,587 195,732 57,763 137,969 137,969 684,975 24,177 0 24,640 20,441 785,734 1,096,442Solids Flowrate (kg/hr) 0 0 0 0 0 0 0 0 0 0 0 4,098 0 0 0 0
Temperature (°C) 35 34 31 80 31 35 35 35 35 35 48 175 232 21 566 33Pressure (MPa, abs) 3.38 3.31 3.24 5.10 3.24 2.77 0.14 2.627 6.202 15.272 0.163 0.12 0.1 3.341 12.512 0.827Enthalpy (kJ/kg) 42.63 41.26 85.32 232.24 85.32 40.72 46.40 47.945 12.775 -208.887 101.201 --- 844.6 -8.013 3,513.235 138.901Density (kg/m3) 28.4 28.1 12.8 17.2 12.8 23.2 2.4 17.8 44.5 778.9 2.2 5,286.0 0.6 56.4 34.9 995.1V-L Molecular Weight 21.115 21.280 10.094 10.094 10.094 20.221 43.574 16.515 16.515 43.764 35.372 --- 31 35.955 18.015 18.015
V-L Flowrate (lbmol/hr) 111,362 112,615 74,714 329 74,384 21,340 2,922 18,418 18,418 34,506 1,507 0 1,768 1,253 96,154 134,177V-L Flowrate (lb/hr) 2,351,389 2,396,455 754,191 3,325 750,866 431,516 127,346 304,170 304,170 1,510,111 53,301 0 54,322 45,065 1,732,248 2,417,240Solids Flowrate (lb/hr) 0 0 0 0 0 0 0 0 0 0 0 9,034 0 0 0 0
Temperature (°F) 95 94 87 177 87 95 95 95 95 95 119 347 450 69 1,050 91Pressure (psia) 489.7 479.7 469.6 740.0 469.6 401.1 20.1 381.0 899.5 2,215.0 23.7 17.3 12.3 484.5 1,814.7 120.0Enthalpy (Btu/lb) 18.3 17.7 36.7 99.8 36.7 17.5 19.9 20.6 5.5 -89.8 43.5 --- 363.1 -3.4 1,510.4 59.7Density (lb/ft3) 1.770 1.752 0.799 1.072 0.799 1.446 0.148 1.110 2.776 48.625 0.136 329.997 0.039 3.520 2.177 62.123

Cost and Performance Baseline for Coal-to-SNG and Ammonia (Volume 2)
192
5.1.2 System assumptions for Cases 5 and 6, Siemens gasifier using Rosebud PRB coal with and without carbon sequestration, are compiled in
Key System Assumptions
Exhibit 5-5.
Exhibit 5-5 Cases 5 and 6 Plant Study Configuration Matrix
Case Case 5 Case 6 Gasifier Pressure, MPa (psia) 4.2 (615) 4.2 (615) O2:Coal Ratio, kg O2/kg dry coal 0.731 0.731 Carbon Conversion, % 99.9 99.9 Syngas HHV at Gasifier Outlet, kJ/Nm3 (Btu/scf) 9,746 (263) 9,746 (263)
Steam Cycle, MPa/°C/°C (psig/°F/°F)
12.4/566/539 (1800/1050/1002)
12.4/566/539 (1800/1050/1002)
Condenser Pressure, mm Hg (in Hg) 36 (1.4) 36 (1.4)
CT N/A N/A Gasifier Technology Siemens Siemens Oxidant 99 vol% Oxygen 99 vol% Oxygen Coal Rosebud PRB Rosebud PRB Coal Feed Moisture Content, % 25.77 25.77 COS Hydrolysis Reactor No No WGS Yes Yes H2S Separation Selexol (1st Stage) Selexol (1st Stage) Sulfur Removal, % 98.5 99.9 CO2 Separation Selexol (2nd Stage) Selexol (2nd Stage) CO2 Sequestration, % N/A 65.8
Sulfur Recovery Claus Plant with Tail Gas
Treatment / Elemental Sulfur
Claus Plant with Tail Gas Treatment / Elemental
Sulfur
Methanation System Haldor Topsoe TREMP™ Process
Haldor Topsoe TREMP™ Process
Particulate Control Scrubber and AGR Absorber
Scrubber and AGR Absorber
Mercury Control Carbon Bed Carbon Bed NOx Control N/A N/A
Balance of Plant and Sparing Philosophy The balance of plant assumptions and sparing philosophy are common to all cases and are presented in Section 4.1.3.

Cost and Performance Baseline for Coal-to-SNG and Ammonia (Volume 2)
193
5.1.3 The Siemens SNG plant without and with carbon sequestration and using Rosebud PRB coal produces a net output of 61 Bscf/year at 100 percent capacity.
Cases 5 and 6 Performance Results
Overall performance for the two plants is summarized in Exhibit 5-6, which includes auxiliary power requirements and production values. The ASU accounts for approximately 59 percent of the total auxiliary load in non-sequestration case and 49 percent in the sequestration case, distributed between the main air compressor, the oxygen compressor, and ASU auxiliaries. CO2 compression accounts for about 19 percent in the sequestration case. The AGR process accounts for approximately 12 percent and 10 percent of the auxiliary load for the non-sequestration and sequestration cases, respectively. The WTA coal drying process accounts for 8 percent in the non-sequestration case and 7 percent in the sequestration case. All other individual auxiliary loads are less than 3 percent of the total. Both Case 5 and Case 6 are net power producers, but the net power production of Case 6 is very small. This is due to the auxiliary power required for CO2 compression.

Cost and Performance Baseline for Coal-to-SNG and Ammonia (Volume 2)
194
Exhibit 5-6 Cases 5 and 6 Plant Performance Summary
POWER SUMMARY (Gross Power at Generator Terminals, kWe) Case 5 Case 6
Steam Turbine Power 302,000 302,000 TOTAL POWER, kWe 302,000 302,000
AUXILIARY LOAD SUMMARY, kWe Coal Handling 840 840
Coal Milling 5,870 5,870 Slag Handling 1,250 1,250
WTA Coal Dryer Compressor 20,050 20,060 WTA Coal Dryer Auxiliaries 880 880
Air Separation Unit Auxiliaries 1,000 1,000 Air Separation Unit Main Air Compressor 124,170 124,160
Oxygen Compressor 21,250 21,250 CO2 Compressor 0 56,730
CO2 Solid Feed System Compressor 5,580 270 SNG Compressors 6,040 6,040
Methanation Plant Recycle Compressor 4,720 4,650 Gasifier Pilot Fuel Compressor 60 60
Boiler Feedwater Pumps 5,020 5,020 Condensate Pump 400 400
Quench Water Pump 570 570 Circulating Water Pump 4,550 5,190
Ground Water Pumps 440 500 Cooling Tower Fans 2,970 3,380
Air Cooled Condenser Fans 3,640 3,630 Scrubber Pumps 980 980
Acid Gas Removal 30,240 30,250 Steam Turbine Auxiliaries 100 100
Claus Plant/TGTU Auxiliaries 250 250 Claus Plant TG Recycle Compressor 2,120 2,130
Miscellaneous Balance of Plant2 3,000 3,000 Transformer Losses 1,580 1,730
TOTAL AUXILIARIES, kWe 247,570 300,190 NET POWER, kWe 54,430 1,810
SNG Production Rate, MNm3/hr (Mscf/hr) 197.9 (6,992) 197.8 (6,989) Capacity Factor 90% 90%
Net Exported Power Efficiency (HHV) 1.7% 0.1% SNG Conversion Efficiency (HHVproduct/HHVcoal), % 63.1% 63.1%
Coal to SNG Product Yield, MNm3SNG/tonnecoal
(MscfSNG/toncoal) 0.33 (11.1) 0.33 (11.1)
Coal Feed Flow Rate, kg/hr (lb/hr) 571,223 (1,259,331) 571,223 (1,259,331) Thermal Input,1 kWth 3,160,745 3,160,745
Condenser Cooling Duty, GJ/hr (MMBtu/hr) 1,614 (1,530) 1,625 (1,540) Raw Water Withdrawal, m3/min (gpm) 18.4 (4,853) 20.9 (5,509)
Raw Water Consumption, m3/min (gpm) 14.3 (3,783) 16.2 (4,291) 1 - HHV of Rosebud PRB coal is 19,920 kJ/kg (8,564 Btu/lb) 2 - Includes plant control systems, lighting, HVAC, and miscellaneous low voltage loads

Cost and Performance Baseline for Coal-to-SNG and Ammonia (Volume 2)
195
Environmental Performance The environmental targets for emissions of Hg, NOx, SO2, and PM were presented in Section 2.5. A summary of the plant air emissions for Cases 5 and 6 is presented in Exhibit 5-7.
Exhibit 5-7 Cases 5 and 6 Air Emissions
kg/GJ (lb/106 Btu)
Tonne/year (ton/year)
90% capacity factor Case 5 Case 6 Case 5 Case 6
SO2 0.009
(0.022) 0.000
(0.000) 840 (926) 0 (0)
NOX Negligible Negligible Negligible Negligible
Particulates 0.003 (0.0071)
0.003 (0.0071) 274 (302) 274 (302)
Hg 1.51E-7 (3.51E-7)
1.51E-7 (3.51E-7)
0.014 (0.015)
0.014 (0.015)
CO2 60.3 (140.3) 0.3 (0.7) 5,412,955 (5,966,762)
27,781 (30,624)
The low level of SO2 emissions in Case 6 is achieved by capture of the sulfur in the gas by the two-stage Selexol AGR process and co-sequestration with the CO2 product. Because the WTA coal drying process does not include combustion of SNG, there are no SO2 emissions associated with drying. Just as in the non-capture cases, the SO2 emissions are significantly less than the environmental targets of Section 2.5. The clean syngas exiting the AGR process has a sulfur concentration of approximately 2 ppmv in both cases. The H2S-rich regeneration gas from the AGR system is fed to a Claus plant, producing elemental sulfur. The tail gas is hydrogenated and recycled to the AGR unit. The higher sulfur emissions in Case 5 are due to the sulfur contained in the CO2-rich stream from the Selexol process, which is vented rather than sequestered.
NOX emissions are negligible because no CT is used for power generation.
Particulate discharge to the atmosphere is limited to extremely low values by the use of a syngas scrubber and the gas washing effect of the AGR absorber. The particulate emissions represent filterable particulate only.
Ninety five percent of mercury is captured from the syngas by an activated carbon bed.
CO2 emissions represent the uncontrolled (Case 5) and controlled (Case 6) discharge from the process. The carbon balance for the two cases is shown in Exhibit 5-8.
The carbon input to the plant consists of carbon in the air in addition to carbon in the coal. Carbon in the air is not used in the carbon capture equation below, but it is not neglected in the balance since Aspen accounts for air components throughout. Carbon leaves the plant as

Cost and Performance Baseline for Coal-to-SNG and Ammonia (Volume 2)
196
unburned carbon in the slag, ASU vent gas, SNG product, and the CO2 product (either vented or sequestered). The carbon capture efficiency is presented in two distinct ways. The first way defines capture as the amount of carbon in the CO2 product for sequestration relative to the amount of carbon in the coal less carbon contained in the slag, and is represented by the following fraction:
(Carbon in Product for Sequestration)/[(Carbon in the Coal)-(Carbon in Slag)] or
Non sequestration (Case 5)
(412,575)/(630,524-3,153)*100 = 65.8% (Case 6)
Exhibit 5-8 Cases 5 and 6 Carbon Balance
Carbon In, kg/hr (lb/hr) Carbon Out, kg/hr (lb/hr) Case 5 Case 6 Case 5 Case 6
Coal 286,001 (630,524)
286,001 (630,524) Slag 1,430
(3,153) 1,430
(3,153)
Air (CO2) 202 (446) 202 (446) SNG
Purification Off-Gas
15,627 (34,452) 0 (0)
ASU Vent 202 (446) 202 (446)
SNG 96,555 (212,866)
96,464 (212,667)
CO2 Vent 148,142 (326,598)
187,141 (412,575)
CO2 Feed Vent
24,247 (53,455) 966 (2,129)
Total 286,203 (630,969)
286,203 (630,969) Total 286,203
(630,969) 286,203
(630,969)
The second way does not penalize the production facility for the carbon converted to SNG product, as the end use of the SNG is unknown. In a carbon constrained scenario, the SNG may or may not be used in a scenario where CCS is implemented. For this method, the burden of carbon mitigation falls on the end-user. This method is represented by the following fraction:
[(Carbon in Product for Sequestration) + (Carbon in SNG Product)]/[(Carbon in the Coal)-(Carbon in Slag)] or
(0 + 212,866)/(630,524 – 3,153)*100 = 33.9% (Case 5)
(412,575 + 212,866)/(630,524-3,153)*100 = 99.7% (Case 6)
Exhibit 5-9 shows the sulfur balance for the plant. Sulfur input comes solely from the sulfur in the coal. Sulfur output includes the sulfur recovered in the Claus plant, sulfur emitted in the

Cost and Performance Baseline for Coal-to-SNG and Ammonia (Volume 2)
197
stack gas, sulfur co-sequestered with the CO2 product, and sulfur remaining in the SNG product. Sulfur in the slag is considered negligible. The total sulfur capture is represented by the following fraction:
(Sulfur byproduct + Sulfur in CO2 product)/Sulfur in the coal or (9,028 + 0)/9,161 = 98.5% (Case 5)
(9,033 + 123)/9,161 = 99.9% (Case 6)
Exhibit 5-9 Cases 5 and 6 Sulfur Balance
Sulfur In, kg/hr (lb/hr) Sulfur Out, kg/hr (lb/hr) Case 5 Case 6 Case 5 Case 6
Coal 4,155 (9,161) 4,155 (9,161) Elemental Sulfur
4,095 (9,028) 4,097 (9,033)
SNG 2 (4) 2 (4)
CO2 Vent Streams/Stack 58 (128) 0.3 (1)
CO2 Product N/A 56 (123)
Total 4,155 (9,161) 4,155 (9,161) Total 4,155 (9,161) 4,155 (9,161)
Exhibit 5-10 shows the overall water balance for the plant. Water demand represents the total amount of water required for a particular process. Some water is recovered within the process, primarily as syngas condensate, and is re-used as internal recycle. The difference between demand and recycle is raw water withdrawal. Raw water withdrawal is defined as the water removed from the ground or diverted from a surface-water source for use in the plant and was assumed to be provided 50 percent by a POTW and 50 percent from groundwater. Raw water withdrawal can be represented by the water metered from a raw water source and used in the plant processes for any and all purposes, such as cooling tower makeup, BFW makeup, quench system makeup, and slag handling makeup. The difference between water withdrawal and process water discharge is defined as water consumption and can be represented by the portion of the raw water withdrawn that is evaporated, transpired, incorporated into products or otherwise not returned to the water source from which it was withdrawn. Water consumption represents the net impact of the plant process on the water source.

Cost and Performance Baseline for Coal-to-SNG and Ammonia (Volume 2)
198
Exhibit 5-10 Cases 5 and 6 Water Balance
Case 5 Case 6 Water Demand, m3/min (gpm)
Slag Handling 1.04 (276) 1.04 (276) Quench/Wash 3.8 (994) 3.8 (994) Condenser Makeup 5.7 (1,507) 5.7 (1,507) Gasifier Steam 0.83 (219) 0.83 (219) Shift Steam 4.6 (1,226) 4.6 (1,226) BFW Makeup 0.23 (62) 0.23 (62) Cooling Tower 17.7 (4,679) 20.2 (5,334)
Total 28.2 (7,456) 30.7 (8,111) Internal Recycle, m3/min (gpm)
Slag Handling 1.04 (276) 1.04 (276) Quench/Wash 3.8 (994) 3.8 (994) Condenser Makeup 0.0 (0) 0.0 (0) Cooling Tower 5.0 (1,332) 5.0 (1,332) Water from Coal Drying 2.0 (530) 2.0 (530) BFW Blowdown 0.23 (62) 0.23 (62) SWS Blowdown 0.69 (183) 0.69 (183) SWS Excess 2.1 (558) 2.1 (558)
Total 9.9 (2,602) 9.8 (2,602) Raw Water Withdrawal, m3/min (gpm)
Slag Handling 0.0 (0) 0.0 (0) Quench/Wash 0.0 (0) 0.0 (0) Condenser Makeup 5.7 (1,507) 5.7 (1,507) Gasifier Steam 0.83 (219) 0.83 (219) Shift Steam 4.6 (1,226) 4.6 (1,226) BFW Makeup 0.23 (62) 0.23 (62) Cooling Tower 12.7 (3,347) 15.1 (4,002)
Total 18.4 (4,853) 20.9 (5,509) Process Water Discharge, m3/min (gpm)
SWS Blowdown 0.07 (18) 0.07 (18) Cooling Tower Blowdown 4.0 (1,052) 4.5 (1,200)
Total 4.1 (1,071) 4.6 (1,218) Raw Water Consumption, m3/min (gpm)
Slag Handling 0.0 (0) 0.0 (0) Quench/Wash 0.0 (0) 0.0 (0) SWS Blowdown -0.07 (-18) -0.07 (-18) Condenser Makeup 5.7 (1,507) 5.7 (1,507) Cooling Tower 8.7 (2,295) 10.6 (2,803)
Total 14.3 (3,783) 16.2 (4,291)

Cost and Performance Baseline for Coal-to-SNG and Ammonia (Volume 2)
199
Heat and Mass Balance Diagrams Heat and mass balance diagrams are shown for the following subsystems in Exhibit 5-11 through Exhibit 5-16:
• Coal gasification and ASU
• Syngas cleanup (including sulfur recovery and tail gas recycle)
• Methanation, SNG purification, SNG compression, and power cycle An overall plant energy balance is provided in tabular form in Exhibit 5-17 for the two cases.

Cost and Performance Baseline for Coal-to-SNG and Ammonia (Volume 2)
200
Exhibit 5-11 Case 5 Gasification and ASU Heat and Mass Balance
NOTES:
1. ENTHALPY REFERENCE POINT IS NATURAL STATE AT 32 °F AND 0.08865 PSIA
DOE/NETL
ROSEBUD PRB SNG PLANTCASE 5
HEAT AND MATERIAL FLOW DIAGRAM
COST AND PERFORMANCE BASELINE VOL. 2CASE 5
ASU AND GASIFICATION
DWG. NO.
BL-HMB-CS-5-PG-1
PLANT PERFORMANCE SUMMARY
LEGEND
P ABSOLUTE PRESSURE, PSIAF TEMPERATURE, °FW FLOWRATE, LBM/HR H ENTHALPY, BTU/LBM
MWE POWER, MEGAWATTS ELECTRICAL
PAGES
1 OF 3
Ambient Air
IntercooledAir Compressor
ElevatedPressure
ASU
IntercooledOxygen Compressor
Milled Coal
ASUVent
SlagRemoval
Slag
GROSS PLANT POWER: 302 MWEAUXILIARY LOAD: 248 MWENET PLANT POWER: 54 MWESNG PRODUCTION: 6,992 MSCF/HR
Dried CoalCoal
Feeding
Steam
CO2 to Lock Hoppers
BoostCompressor
Siemens Gasifier
1,259,331 W
3,270,629 W42.0 T13.0 P6.8 H
736,460 W90.0 T
125.0 P11.6 H
736,460 W516.2 T740.0 P107.1 H
109,392 W650.0 T740.0 P
1,316.8 H
1,932,727 W2,600.0 T
604.7 P1,064.7 H
106,261 W
ENG UNITS
To Claus Plant
5,205 W90.0 T
125.0 P11.6 H
WTADryer
Vapor Compressor
Condensate to Cooling Tower
2,520,163 W78.1 T16.4 P13.1 H
264,861 W225.0 T13.8 P
1,160.0 H
264,861 W92.3 T86.7 P16.1 H
SyngasQuenchCooler
Raw Syngasto Scrubber
SHSteam
4
7
1
86
3
11
5
2
Quench Water
13
Lock HopperVent
195,342 W
390,684 W168.0 T815.0 P
9.5 H
9
390,684 W60.0 T
149.7 P1.7 H
12
497,178 W
SHSteam
SHSteam
2,429,905 W499.7 T564.7 P469.5 H
Air
Oxygen
Nitrogen
Coal/Char/Slurry/Slag
Sour Gas
Sour Water
Water
Steam
CO2
Tailgas
Pilot Fuel21
3,325 W176.7 T740.0 P99.9 H
1,189,812 W64.5 T
815.0 P1,637.1 H
994,470 W
10
HPBFW

Cost and Performance Baseline for Coal-to-SNG and Ammonia (Volume 2)
201
Exhibit 5-12 Case 5 Gas Cleanup Heat and Mass Balance
Mercury Removal
KnockOut
DrumRaw Syngasto Scrubber
SourDrum
To Water Treatment
Makeup Water
CatalyticReactorBeds
HighTemperature
Shift
Blowdown
FromASULP CO2
ShiftSteam
HP BFW
SyngasCoolers
SourStripper
Two-StageSelexol
Clean Gas
CO2
Acid Gas
SyngasScrubber Condensate
To DeaeratorCondensate
613,077 W550.0 T600.0 P
1,270.5 H
2,358,168 W416.6 T544.7 P412.5 H
2,429,905 W499.7 T564.7 P469.5 H
2,358,168 W358.9 T554.7 P390.4 H
2,396,544 W93.8 T
474.7 P17.8 H
754,601 W87.0 T
469.6 P36.7 H
53,332 W119.0 T23.7 P43.7 H
1,197,927 W41.6 T16.7 P3.3 H
914,108 W339.3 T115.0 P339.2 H
2,971,245 W527.0 T524.7 P426.8 H
751,276 W87.0 T
469.6 P36.7 H
9,028 W
4,888 W293.4 T65.0 P
1,042.1 H
5,205 W90.0 T
125.0 P11.6 H
NOTES:
1. ENTHALPY REFERENCE POINT IS NATURAL STATE AT 32 °F AND 0.08865 PSIA
DOE/NETL
ROSEBUD PRB SNG PLANTCASE 5
HEAT AND MATERIAL FLOW DIAGRAM
COST AND PERFORMANCE BASELINE VOL. 2CASE 5
GAS CLEANUP
DWG. NO.
BL-HMB-CS-5-PG-2
PLANT PERFORMANCE SUMMARY
LEGEND
P ABSOLUTE PRESSURE, PSIAF TEMPERATURE, °FW FLOWRATE, LBM/HR H ENTHALPY, BTU/LBM
MWE POWER, MEGAWATTS ELECTRICAL
Air
Oxygen
Nitrogen
Coal/Char/Slurry/Slag
Synthesis Gas
PAGES
2 OF 3
Sour Gas
Sour Water
Water
Steam
GROSS PLANT POWER: 302 MWEAUXILIARY LOAD: 248 MWENET PLANT POWER: 54 MWESNG PRODUCTION: 6,992 MSCF/HR
2,052,624 W416.6 T544.7 P412.5 H
305,544 W
20
18
13
30
CO2
Tailgas
14
15
16
17
2,971,245 W862.6 T534.7 P572.3 H
2,351,455 W95.0 T
484.7 P18.4 H
High TemperatureMethanation Reactor
Pre-heater
Tail Gas Cleanup Unit
3
19
CO2 to LockHoppers
VentedCO2 Product
9
Claus Plant
Tail Gas
Furnace
Sulfur
29
28
HP CO2
27
972,924 W42.0 T16.7 P3.7 H
615,687 W60.0 T
149.7 P1.7 H
390,684 W168.0 T815.0 P
9.5 H
Syngas toMethanation
BoostCompressor
3,325 W
Pilot Fuelto Gasifier
3,325 W176.7 T740.0 P99.9 H
21
22
Condensatefrom Methnation
HT ShiftPre-heater
54,397 W450.0 T12.3 P
363.5 H
31
45,090 W69.3 T
484.5 P-3.5 H
Tail GasCompressor

Cost and Performance Baseline for Coal-to-SNG and Ammonia (Volume 2)
202
Exhibit 5-13 Case 5 Methanation and Power Block Heat and Mass Balance
Steam Seal Regulator
65 PSIA HeaderSteam Injection
To Gasifier
Make-up
GlandSteam
CondenserCondensate to Preheating
CondensatePump
2,414,637 W90.0 T0.7 P
57.9 H
772,976 W
1,736,970 W1,050.0 T1,814.7 P1,510.4 H
2,414,637 W91.5 T
120.0 P59.7 H
1,400 W
1,400 W212.0 T14.7 P
179.9 H
109,392 W650.0 T740.0 P
1,316.8 H
NOTES:
1. ENTHALPY REFERENCE POINT IS NATURAL STATE AT 32 °F AND 0.08865 PSIA
DOE/NETL
ROSEBUD PRB SNG PLANTCASE 5
HEAT AND MATERIAL FLOW DIAGRAM
COST AND PERFORMANCE BASELINE VOL. 2CASE 5
METHANATION AND POWER BLOCK
DWG. NO.
BL-HMB-CS-5-PG-3
PLANT PERFORMANCE SUMMARY
LEGEND
P ABSOLUTE PRESSURE, PSIAF TEMPERATURE, °FW FLOWRATE, LBM/HR H ENTHALPY, BTU/LBM
MWE POWER, MEGAWATTS ELECTRICAL
Air
Oxygen
Nitrogen
Coal/Char/Slurry/Slag
Synthesis Gas
PAGES
3 OF 3
Sour Gas
Sour Water
Water
Steam
GROSS PLANT POWER: 302 MWEAUXILIARY LOAD: 248 MWENET PLANT POWER: 54 MWESNG PRODUCTION: 6,992 MSCF/HR
Flue Gas
Deaerator
HT Reactor
LP TURBINE GENERATORHP
TURBINEIP
TURBINE
HOT WELL
AIR-COOLED CONDENSER CONDENSER
IP Pump
To Shift SteamProduction
LP Pump
250 PSIAAttemperating Water
HP Pump
RecycleCompressor
Syngas fromSelexol Unit
KnockOut
Drum
Molecular Sieve
Purification Unit
Multistage Intercooled
SNG Compressor
Clean UpReatorHT Reactor
PurificationOff-Gas
SNGProduct
Condensate toSour Drum
ReactorPre-heater
SH Steam fromSyngas Cooler
IP BFW
SH Shift Steam
IP/LP BFW
IP/LP Steam IP Steam IP BFW
32
33
1,782,683 W
751,276 W87.0 T
469.6 P36.7 H
22
572.0 T452.5 P628.3 H
584.8 T475.0 P635.5 H
572.0 T469.6 P565.2 H
1,285.3 T462.5 P
1,092.7 H
2,135,970 W
1,029.8 T441.8 P959.9 H
392.0 T431.8 P578.8 H
644.0 T421.1 P767.4 H
335.0 T411.1 P406.7 H
431,548 W95.0 T
401.1 P17.5 H
127,119 W95.0 T20.1 P20.0 H 304,428 W
95.0 T381.0 P20.6 H
95.0 T899.5 P
5.5 H
663,330 W281.3 T450.0 P250.9 H
589,382 W
115,800 W298.0 T65.0 P
1,178.6 H
1,513,947 W507.3 T65.0 P
1,285.7 H
IP BFW
17,173 W281.2 T379.0 P250.7 H
23
24 25 26
10,914 W658.5 T18.0 P
1,362.8 H
To Syngas Cooler
Reheater(Syngas Cooler)
1,593,354 W1,001.9 T
501.4 P1,520.9 H
17,384 W
AttemperationWater

Cost and Performance Baseline for Coal-to-SNG and Ammonia (Volume 2)
203
Exhibit 5-14 Case 6 Gasification and ASU Heat and Mass Balance
NOTES:
1. ENTHALPY REFERENCE POINT IS NATURAL STATE AT 32 °F AND 0.08865 PSIA
DOE/NETL
ROSEBUD PRB SNG PLANTW/ CO2 CAPTURE
CASE 6
HEAT AND MATERIAL FLOW DIAGRAM
COST AND PERFORMANCE BASELINE VOL. 2CASE 6
ASU AND GASIFICATION
DWG. NO.
BL-HMB-CS-6-PG-1
PLANT PERFORMANCE SUMMARY
LEGEND
P ABSOLUTE PRESSURE, PSIAF TEMPERATURE, °FW FLOWRATE, LBM/HR H ENTHALPY, BTU/LBM
MWE POWER, MEGAWATTS ELECTRICAL
PAGES
1 OF 3
Ambient Air
IntercooledAir Compressor
ElevatedPressure
ASU
IntercooledOxygen Compressor
Milled Coal
ASUVent
SlagRemoval
Slag
GROSS PLANT POWER: 302 MWEAUXILIARY LOAD: 300 MWENET PLANT POWER: 2 MWESNG PRODUCTION: 6,989 MSCF/HR
Dried CoalCoal
Feeding
Steam
CO2 to Lock Hoppers
BoostCompressor
Siemens Gasifier
1,259,331 W
3,270,256 W42.0 T13.0 P6.8 H
736,415 W90.0 T
125.0 P11.6 H
736,415 W516.2 T740.0 P107.1 H
109,392 W650.0 T740.0 P
1,366.2 H
1,932,682 W2,600.0 T
604.7 P1,064.4 H
106,261 W
ENG UNITS
To Claus Plant
5,166 W90.0 T
125.0 P11.6 H
2,519,876 W78.1 T16.4 P13.1 H
SyngasQuenchCooler
Raw Syngasto Scrubber
SHSteam
4
1
86
3
11
5
2
Quench Water
13
7,792 W
390,684 W166.3 T815.0 P
7.9 H
9
390,684 W152.5 T750.0 P
5.7 H
12
497,007 W
SHSteam
SHSteam
2,429,689 W499.7 T564.7 P469.4 H
Air
Oxygen
Nitrogen
Coal/Char/Slurry/Slag
Sour Gas
Sour Water
Water
Steam
CO2
Tail Gas/Flue Gas
Pilot Fuel21
264,860 W92.5 T80.3 P65.7 H
1,189,812 W
WTA Coal Dryer
Synthesis Gas
994,470 W
10
HP Vent toCO2 Compressor
LP Vent toCO2 Compressor
155,664 W 31,886 W
Condensate toCooling Tower
3,325 W176.7 T740.0 P99.8 H
Vapor Compressor
264,861 W225.0 T13.0 P
1,209.5 H
Lock HopperAtmospheric Vent
7
HPBFW

Cost and Performance Baseline for Coal-to-SNG and Ammonia (Volume 2)
204
Exhibit 5-15 Case 6 Gas Cleanup Heat and Mass Balance
SNG PurificationOff Gas
Mercury Removal
KnockOut
DrumRaw Syngasto Scrubber
SourDrum
To Water Treatment
Makeup Water
CatalyticReactorBeds
HighTemperature
Shift
Blowdown
FromASU
ShiftSteam
HP BFW
SyngasCoolers
SourStripper
Two-StageSelexol
Clean Gas
CO2
Acid Gas
SyngasScrubber Condensate
To DeaeratorCondensate
613,203 W550.0 T600.0 P
1,270.5 H
2,358,061 W416.6 T544.7 P412.4 H
2,429,689 W499.7 T564.7 P469.4 H
2,358,061 W358.9 T554.7 P390.3 H
2,396,455 W93.8 T
479.7 P17.7 H
754,191 W87.0 T
469.6 P36.7 H
53,301 W119.0 T23.7 P43.5 H
390,684 W152.5 T750.0 P
5.7 H
913,699 W339.3 T115.0 P339.2 H
2,971,264 W485.7 T519.7 P409.2 H
750,866 W87.0 T
469.6 P36.7 H
9,034 W
4,889 W293.4 T65.0 P
1,041.6 H
5,166 W90.0 T
125.0 P11.6 H
NOTES:
1. ENTHALPY REFERENCE POINT IS NATURAL STATE AT 32 °F AND 0.08865 PSIA
DOE/NETL
ROSEBUD PRB SNG PLANTW/ CO2 CAPTURE
CASE 6
HEAT AND MATERIAL FLOW DIAGRAM
COST AND PERFORMANCE BASELINE VOL. 2CASE 6
GAS CLEANUP
DWG. NO.
BL-HMB-CS-6-PG-2
PLANT PERFORMANCE SUMMARY
LEGEND
P ABSOLUTE PRESSURE, PSIAF TEMPERATURE, °FW FLOWRATE, LBM/HR H ENTHALPY, BTU/LBM
MWE POWER, MEGAWATTS ELECTRICAL
Air
Oxygen
Nitrogen
Coal/Char/Slurry/Slag
Synthesis Gas
PAGES
2 OF 3
Sour Gas
Sour Water
Water
Steam
GROSS PLANT POWER: 302 MWEAUXILIARY LOAD: 300 MWENET PLANT POWER: 2 MWESNG PRODUCTION: 6,989 MSCF/HR
2,052,598 W416.6 T544.7 P412.4 H
20
18
13
30
CO2
Tail Gas/Flue Gas
14
15
17
305,462 W
2,351,389 W95.0 T
489.7 P18.3 H
High TemperatureMethanation Reactor
Pre-heater
Tail Gas Cleanup Unit
3
19
CO2 toSequestration
CO2 toLock Hoppers
Claus Plant
Tail Gas
Furnace
Sulfur
29
28
1,510,111 W
95.0 T2,215.0 P
-89.8 H
Syngas toMethanation
BoostCompressor
3,325 W
Pilot Fuelto Gasifier
3,325 W176.7 T740.0 P99.8 H
21
22
Condensatefrom Methnation
HT ShiftPre-heater
54,322 W450.0 T12.3 P
363.1 H
3145,065 W
69.3 T484.5 P
-3.4 H
24
Multistage Intercooled CO2
Compressor
27
HP CO2
LP LockHopper Vent HP Lock
Hopper Vent
LP CO2
127,346 W95.0 T20.1 P19.9 H
31,886 W
155,664 W
771,490 W66.4 T
149.7 P3.0 H
1,132,369 W49.0 T16.7 P5.6 HTail Gas
Compressor
16

Cost and Performance Baseline for Coal-to-SNG and Ammonia (Volume 2)
205
Exhibit 5-16 Case 6 Methanation and Power Block Heat and Mass Balance
Steam Seal Regulator
65 PSIA HeaderSteam Injection
Make-up
GlandSteam
CondenserCondensate to Preheating
CondensatePump
2,417,240 W90.0 T0.7 P
57.9 H
773,069 W
1,732,248 W1,050.0 T1,814.7 P1,510.4 H
2,417,240 W91.5 T
120.0 P59.7 H
1,400 W
1,400 W212.0 T14.7 P
179.9 H
109,392 W650.0 T740.0 P
1,366.2 H
NOTES:
1. ENTHALPY REFERENCE POINT IS NATURAL STATE AT 32 °F AND 0.08865 PSIA
DOE/NETL
ROSEBUD PRB SNG PLANTW/ CO2 CAPTURE
CASE 6
HEAT AND MATERIAL FLOW DIAGRAM
COST AND PERFORMANCE BASELINE VOL. 2CASE 6
METHANATION AND POWER BLOCK
DWG. NO.
BL-HMB-CS-6-PG-3
PLANT PERFORMANCE SUMMARY
LEGEND
P ABSOLUTE PRESSURE, PSIAF TEMPERATURE, °FW FLOWRATE, LBM/HR H ENTHALPY, BTU/LBM
MWE POWER, MEGAWATTS ELECTRICAL
Air
Oxygen
Nitrogen
Coal/Char/Slurry/Slag
Synthesis Gas
PAGES
3 OF 3
Sour Gas
Sour Water
Water
Steam
GROSS PLANT POWER: 302 MWEAUXILIARY LOAD: 300 MWENET PLANT POWER: 2 MWESNG PRODUCTION: 6,989 MSCF/HR
Flue Gas
Deaerator
HT Reactor
LP TURBINE GENERATORHP
TURBINEIP
TURBINE
HOT WELL
AIR-COOLED CONDENSER CONDENSER
IP Pump
To Shift SteamProduction
LP Pump
250 PSIAAttemperating Water
HP Pump
RecycleCompressor
Syngas fromSelexol Unit
KnockOut
Drum
Molecular Sieve
Purification Unit
Multistage Intercooled
SNG Compressor
Clean UpReatorHT Reactor
Purification Off-Gas(To CO2 Compressor)
SNGProduct
Condensate toSour Drum
ReactorPre-heater
SH Steam fromSyngas Cooler
IP BFW
SH Shift Steam
IP/LP BFW
IP/LP Steam IP Steam IP BFW
32
33
1,778,199 W
750,866 W87.0 T
469.6 P36.7 H
22
572.0 T452.5 P627.1 H
584.8 T475.0 P634.4 H
572.0 T469.6 P563.5 H
1,290.2 T462.5 P
1,095.1 H
2,097,593 W
1,035.4 T441.8 P962.5 H
392.0 T431.8 P577.6 H
650.6 T421.1 P770.9 H
335.0 T411.1 P406.7 H
431,516 W95.0 T
401.1 P17.5 H
127,346 W95.0 T20.1 P19.9 H 304,170 W
95.0 T381.0 P20.6 H
95.0 T899.5 P
5.5 H
667,733 W281.3 T450.0 P250.9 H
592,296 W
120,000 W298.0 T65.0 P
1,178.6 H
1,512,257 W507.4 T65.0 P
1,285.7 H
IP BFW
17,206 W281.1 T379.0 P250.6 H
23
24 25 26
10,914 W658.6 T18.0 P
1,362.8 H
To Syngas Cooler
P-647
AttemperationWater
To Gasifier
Reheater(Syngas Cooler)
1,591,756 W1,002.1 T
501.4 P1,521.0 H
17,722 W

Cost and Performance Baseline for Coal-to-SNG and Ammonia (Volume 2)
206
Exhibit 5-17 Cases 5 and 6 Energy Balance
HHV Sensible + Latent Power Total Case 5 Case 6 Case 5 Case 6 Case 5 Case 6 Case 5 Case 6 Heat In, GJ/hr (MMBtu/hr)
Coal 11,379 (10,785)
11,379 (10,785) 5.8 (5.5) 5.8 (5.5) 0 (0) 0 (0) 11,385
(10,790) 11,385
(10,790) ASU Air 0 (0) 0 (0) 23.3 (22.1) 23.3 (22.1) 0 (0) 0 (0) 23 (22) 23 (22) Raw Water Makeup 0 (0) 0 (0) 25.6 (24.2) 29.0 (27.5) 0 (0) 0 (0) 26 (24) 29 (27)
Auxiliary Power 0 (0) 0 (0) 0.0 (0.0) 0.0 (0.0) 891 (845) 1,081 (1,024) 891 (845) 1,081 (1,024)
Totals 11,379 (10,785)
11,379 (10,785) 54.7 (51.9) 58.2 (55.1) 891 (845) 1,081
(1,024) 12,325
(11,682) 12,518
(11,864) Heat Out, GJ/hr (MMBtu/hr) ASU Intercoolers 0 (0) 0 (0) 325 (308) 325 (308) 0 (0) 0 (0) 325 (308) 325 (308) ASU Vent 0 (0) 0 (0) 34.9 (33.1) 34.9 (33.1) 0 (0) 0 (0) 35 (33) 35 (33) Slag 47 (44) 47 (44) 81.4 (77.1) 81.4 (77.1) 0 (0) 0 (0) 128 (122) 128 (122) Sulfur 38 (36) 38 (36) 0.5 (0.4) 0.5 (0.4) 0 (0) 0 (0) 38 (36) 38 (36) CO2 Intercoolers 0 (0) 0 (0) 0.0 (0.0) 343.7 (325.8) 0 (0) 0 (0) 0 (0) 344 (326) CO2 0 (0) 0 (0) 2.0 (1.9) -143.1 (-135.6) 0 (0) 0 (0) 2 (2) -143 (-136) Cooling Tower Blowdown 0 (0) 0 (0) 22.2 (21.0) 25.3 (24.0) 0 (0) 0 (0) 22 (21) 25 (24) SNG 7,163 (6,789) 7,158 (6,784) 1.8 (1.7) 1.8 (1.7) 0 (0) 0 (0) 7,165 (6,791) 7,160 (6,786) SNG Purification Off-Gas 0 (0) 0 (0) 3 (3) 0 (0) 0 (0) 0 (0) 3 (3) 0 (0) Condenser 0 (0) 0 (0) 1,618 (1,533) 1,620 (1,536) 0 (0) 0 (0) 1,618 (1,533) 1,620 (1,536) Non-Condenser Cooling Tower Loads* 0 (0) 0 (0) 902 (855) 1,224 (1,160) 0 (0) 0 (0) 902 (855) 1,224 (1,160)
Process Losses* 0 (0) 0 (0) 1,000 (947) 674 (639) 0 (0) 0 (0) 1,000 (947) 674 (639)
Power 0 (0) 0 (0) 0.0 (0.0) 0.0 (0.0) 1,087 (1,030)
1,087 (1,030) 1,087 (1,030) 1,087 (1,030)
Totals 7,248 (6,870) 7,243 (6,865) 3,989 (3,781) 4,188 (3,969) 1,087 (1,030)
1,087 (1,030)
12,325 (11,682)
12,518 (11,864)
* Includes other energy losses not explicitly accounted for in the model

Cost and Performance Baseline for Coal-to-SNG and Ammonia (Volume 2)
207
5.1.4 Major equipment items for the Siemens gasifier SNG plant without and with carbon sequestration using PRB coal are shown in the following tables. The accounts used in the equipment list correspond to the account numbers used in the cost estimates in Section
Cases 5 and 6 Equipment Lists
5.1.5. In general, the design conditions include a 10 percent contingency for flows and heat duties and a 21 percent contingency for heads on pumps and fans.

Cost and Performance Baseline for Coal-to-SNG and Ammonia (Volume 2)
208
ACCOUNT 1 COAL HANDLING Equipment
No. Description Type Operating Qty. Spares Case 5 Design
Condition Case 6 Design
Condition
1 Bottom Trestle Dumper and Receiving Hoppers
N/A 2 0 181 tonne (200 ton) 181 tonne (200 ton)
2 Feeder Belt 2 0 572 tonne/hr (630 tph) 572 tonne/hr (630 tph)
3 Conveyor No. 1 Belt 1 0 1,134 tonne/hr (1,250 tph)
1,134 tonne/hr (1,250 tph)
4 Transfer Tower No. 1 Enclosed 1 0 N/A N/A
5 Conveyor No. 2 Belt 1 0 1,134 tonne/hr (1,250 tph)
1,134 tonne/hr (1,250 tph)
6 As-Received Coal Sampling System Two-stage 1 0 N/A N/A
7 Stacker/Reclaimer Traveling, linear 1 0 1,134 tonne/hr (1,250
tph) 1,134 tonne/hr (1,250
tph) 8 Reclaim Hopper N/A 2 1 118 tonne (130 ton) 118 tonne (130 ton) 9 Feeder Vibratory 2 1 472 tonne/hr (520 tph) 472 tonne/hr (520 tph)
10 Conveyor No. 3 Belt w/ tripper 1 0 943 tonne/hr (1,040 tph) 943 tonne/hr (1,040 tph)
11 Crusher Tower N/A 1 0 N/A N/A
12 Coal Surge Bin w/ Vent Filter Dual outlet 2 0 472 tonne (520 ton) 472 tonne (520 ton)
13 Crusher Impactor reduction 2 0 8 cm x 0 - 3 cm x 0
(3" x 0 - 1-1/4" x 0) 8 cm x 0 - 3 cm x 0 (3" x 0 - 1-1/4" x 0)
14 As-Fired Coal Sampling System
Swing hammer 1 1 N/A N/A

Cost and Performance Baseline for Coal-to-SNG and Ammonia (Volume 2)
209
Equipment No. Description Type Operating
Qty. Spares Case 5 Design Condition
Case 6 Design Condition
15 Conveyor No. 4 Belt w/tripper 1 0 943 tonne/hr (1,040 tph) 943 tonne/hr (1,040 tph)
16 Transfer Tower No. 2 Enclosed 1 0 N/A N/A
17 Conveyor No. 5 Belt w/ tripper 1 0 943 tonne/hr (1,040 tph) 943 tonne/hr (1,040 tph)
18 Coal Silo w/ Vent Filter and Slide Gates
Field erected 3 0 2,087 tonne (2,300 ton) 2,087 tonne (2,300 ton)
ACCOUNT 2 COAL PREPARATION AND FEED
Equipment No. Description Type Operating
Qty. Spares Case 5 Design Condition
Case 6 Design Condition
1 Feeder Vibratory 6 0 109 tonne/hr (120 tph) 109 tonne/hr (120 tph)
2 Conveyor No. 6 Belt w/tripper 3 0 209 tonne/hr (230 tph) 209 tonne/hr (230 tph)
3 Roller Mill Feed Hopper Dual Outlet 3 0 417 tonne (460 ton) 417 tonne (460 ton)
4 Weigh Feeder Belt 6 0 109 tonne/hr (120 tph) 109 tonne/hr (120 tph) 5 Pulverizer Rotary 6 0 109 tonne/hr (120 tph) 109 tonne/hr (120 tph)
6 Coal Dryer Feed Hopper
Vertical Hopper 3 0 417 tonne (460 ton) 417 tonne (460 ton)
7 Coal Preheater Water Heated Horizontal Rotary Kiln
3 0
Coal feed: 209 tonne/hr (230 tph)
Heat duty: 23.3 GJ/hr (22.1 MMBtu/hr)
Coal feed: 209 tonne/hr (230 tph)
Heat duty: 23.3 GJ/hr (22.1 MMBtu/hr)

Cost and Performance Baseline for Coal-to-SNG and Ammonia (Volume 2)
210
Equipment No. Description Type Operating
Qty. Spares Case 5 Design Condition
Case 6 Design Condition
8 Coal Dryer Fluidized Bed with Internal Coils
3 0
Coal feed: 209 tonne/hr (230 tph)
Heat duty: 117 GJ/hr (111 MMBtu/hr)
Bed diameter: 14.9 m (49 ft)
Coal feed: 209 tonne/hr (230 tph)
Heat duty: 117 GJ/hr (111 MMBtu/hr)
Bed diameter: 14.9 m (49 ft)
9 Steam Compressor
Reciprocating, Multi-Stage 3 0
878 m3/min (30,990 scfm)
Suction - 0.10 MPa (13.8 psia)
Discharge - 0.77 MPa (112 psia)
878 m3/min (30,990 scfm)
Suction - 0.09 MPa (13 psia)
Discharge - 0.73 MPa (105 psia)
10 Dryer Exhaust Filter Hot Baghouse 3 0
Steam - 44,044 kg/hr (97,100 lb/hr)
Temperature - 107°C (225°F)
Steam - 44,044 kg/hr (97,100 lb/hr)
Temperature - 107°C (225°F)
11 Dry Coal Cooler
Water Cooled Horizontal Rotary Kiln
3 0 165 tonne/hr (182 tph) Heat duty - 10 GJ/hr
(9 MMBtu/hr)
165 tonne/hr (182 tph) Heat duty - 10 GJ/hr
9 MMBtu/hr)
ACCOUNT 3 FEEDWATER AND MISCELLANEOUS SYSTEMS AND EQUIPMENT
Equipment No. Description Type Operating
Qty. Spares Case 5 Design Condition Case 6 Design Condition
1 Demineralized Water Storage Tank
Vertical, cylindrical, outdoor
3 0 605,666 liters (160,000 gal)
605,666 liters (160,000 gal)
2 Condensate Pumps
Vertical canned 2 1 10,107 lpm @ 91 m H2O
(2,670 gpm @ 300 ft H2O) 10,107 lpm @ 91 m H2O
(2,670 gpm @ 300 ft H2O)

Cost and Performance Baseline for Coal-to-SNG and Ammonia (Volume 2)
211
Equipment No. Description Type Operating
Qty. Spares Case 5 Design Condition Case 6 Design Condition
3 Deaerator Horizontal spray type 2 0 769,293 kg/hr
(1,696,000 lb/hr) 770,200 kg/hr
(1,698,000 lb/hr)
4
Intermediate Pressure Feedwater Pump
Horizontal centrifugal, single stage
2 1 5,413 lpm @ 341 m H2O (1,430 gpm @ 1,120 ft
H2O)
5,451 lpm @ 341 m H2O (1,440 gpm @ 1,120 ft
H2O)
5 High Pressure Feedwater Pump
Barrel type, multi-stage, centrifugal
2 1 HP water: 7,722 lpm @
1,676 m H2O (2,040 gpm @ 5,500 ft H2O)
HP water: 7,684 lpm @ 1,676 m H2O (2,030 gpm
@ 5,500 ft H2O)
6 Auxiliary Boiler Shop fabricated, water tube
1 0
18,144 kg/hr, 2.8 MPa, 343°C
(40,000 lb/hr, 400 psig, 650°F)
18,144 kg/hr, 2.8 MPa, 343°C
(40,000 lb/hr, 400 psig, 650°F)
7 Service Air Compressors
Flooded Screw 3 1 28 m3/min @ 0.7 MPa
(1,000 scfm @ 100 psig) 28 m3/min @ 0.7 MPa
(1,000 scfm @ 100 psig)
8 Instrument Air Dryers
Duplex, regenerative 3 1 28 m3/min (1,000 scfm) 28 m3/min (1,000 scfm)
9 Closed Cycle Cooling Heat Exchangers
Plate and frame 2 0 675 GJ/hr (639 MMBtu/hr)
each 852 GJ/hr (808 MMBtu/hr)
each
10 Closed Cycle Cooling Water Pumps
Horizontal centrifugal 2 1 241,888 lpm @ 21 m H2O
(63,900 gpm @ 70 ft H2O) 305,483 lpm @ 21 m H2O (80,700 gpm @ 70 ft H2O)
11 Engine-Driven Fire Pump
Vertical turbine, diesel engine
1 1 3,785 lpm @ 107 m H2O (1,000 gpm @ 350 ft H2O)
3,785 lpm @ 107 m H2O (1,000 gpm @ 350 ft H2O)

Cost and Performance Baseline for Coal-to-SNG and Ammonia (Volume 2)
212
Equipment No. Description Type Operating
Qty. Spares Case 5 Design Condition Case 6 Design Condition
12 Fire Service Booster Pump
Two-stage horizontal centrifugal
1 1 2,650 lpm @ 76 m H2O (700 gpm @ 250 ft H2O)
2,650 lpm @ 76 m H2O (700 gpm @ 250 ft H2O)
13 Raw Water Pumps
Stainless steel, single suction
2 1 5,110 lpm @ 18 m H2O (1,350 gpm @ 60 ft H2O)
5,792 lpm @ 18 m H2O (1,530 gpm @ 60 ft H2O)
14 Ground Water Pumps
Stainless steel, single suction
3 1 3,407 lpm @ 268 m H2O (900 gpm @ 880 ft H2O)
3,861 lpm @ 268 m H2O (1,020 gpm @ 880 ft H2O)
15 Filtered Water Pumps
Stainless steel, single suction
2 1 5,905 lpm @ 49 m H2O (1,560 gpm @ 160 ft H2O)
5,905 lpm @ 49 m H2O (1,560 gpm @ 160 ft H2O)
16 Filtered Water Tank
Vertical, cylindrical 2 0 2,831,488 liter (748,000
gal) 2,831,488 liter (748,000
gal)
17 Makeup Water Demineralizer
Anion, cation, and mixed bed
4 0 1,401 lpm (370 gpm) 1,401 lpm (370 gpm)
18 Liquid Waste Treatment System
1 0 10 years, 24-hour storm 10 years, 24-hour storm

Cost and Performance Baseline for Coal-to-SNG and Ammonia (Volume 2)
213
ACCOUNT 4 GASIFIER, ASU, AND ACCESSORIES INCLUDING LOW TEMPERATURE HEAT RECOVERY
Equipment No. Description Type Operating
Qty. Spares Case 5 Design Condition Case 6 Design Condition
1 Gasifier Pressurized dry-feed, entrained bed
6 0 2,540 tonne/day, 4.2 MPa (2,800 tpd, 615 psia)
2,540 tonne/day, 4.2 MPa (2,800 tpd, 615 psia)
2 Synthesis Gas Cooler
Convective spiral-wound tube boiler
6 0 201,849 kg/hr (445,000 lb/hr)
201,849 kg/hr (445,000 lb/hr)
3
Syngas Scrubber Including Sour Water Stripper
Vertical upflow 6 0 201,849 kg/hr (445,000 lb/hr)
201,849 kg/hr (445,000 lb/hr)
4 Raw Gas Coolers
Shell and tube with condensate drain
12 0 423,655 kg/hr (934,000 lb/hr)
423,655 kg/hr (934,000 lb/hr)
5 Raw Gas Knockout Drum
Vertical with mist eliminator 3 0
390,997 kg/hr, 35°C, 3.4 MPa
(862,000 lb/hr, 95°F, 490 psia)
390,997 kg/hr, 35°C, 3.4 MPa
(862,000 lb/hr, 95°F, 495 psia)
6 Flare Stack
Self-supporting, carbon steel, stainless steel top, pilot ignition
3 0 404,151 kg/hr (891,000 lb/hr) syngas
404,151 kg/hr (891,000 lb/hr) syngas
7 ASU Main Air Compressor
Centrifugal, multi-stage 3 0 7,419 m3/min @ 1.3 MPa
(262,000 scfm @ 190 psia) 7,419 m3/min @ 1.3 MPa
(262,000 scfm @ 190 psia)

Cost and Performance Baseline for Coal-to-SNG and Ammonia (Volume 2)
214
Equipment No. Description Type Operating
Qty. Spares Case 5 Design Condition Case 6 Design Condition
8 Cold Box Vendor design 3 0 2,994 tonne/day (3,300 tpd) of 99% purity oxygen
2,994 tonne/day (3,300 tpd) of 99% purity oxygen
9 Oxygen Compressor
Centrifugal, multi-stage 3 0
1,501 m3/min (53,000 scfm)
Suction - 0.9 MPa (130 psia)
Discharge - 5.1 MPa (740 psia)
1,501 m3/min (53,000 scfm)
Suction - 0.9 MPa (130 psia)
Discharge - 5.1 MPa (740 psia)
10 CO2 Solid Feed System Compressor
Centrifugal, multi-stage 3 0
595 m3/min (21,000 scfm) Suction - 1.0 MPa
(150 psia) Discharge - 5.7 MPa
(820 psia)
595 m3/min (21,000 scfm) Suction - 5.2 MPa
(750 psia) Discharge - 5.7 MPa
(820 psia)
ACCOUNT 5A SYNGAS CLEANUP
Equipment No. Description Type Operating
Qty. Spares Case 5 Design Condition Case 6 Design Condition
1 Mercury Adsorber
Sulfated carbon bed 3 0
390,997 kg/hr (862,000 lb/hr)
35°C (95°F) 3.3 MPa (485 psia)
390,997 kg/hr (862,000 lb/hr)
35°C (95°F) 3.4 MPa (490 psia)
2 ZnO Guard Bed
Fixed bed 444 Nm3/min (15,684 acfm)
444 Nm3/min (15,672 acfm)
3 Sulfur Plant Claus type 2 0 54 tonne/day (60 tpd) 54 tonne/day (60 tpd)
4 Water Gas Shift Reactor
Fixed bed, catalytic 3 0
443,160 kg/hr (977,000 lb/hr) 232°C (450°F)
3.7 MPa (540 psia)
443,160 kg/hr (977,000 lb/hr) 232°C (450°F)
3.7 MPa (540 psia)

Cost and Performance Baseline for Coal-to-SNG and Ammonia (Volume 2)
215
Equipment No. Description Type Operating
Qty. Spares Case 5 Design Condition Case 6 Design Condition
5
Shift Reactor Heat Recovery Exchanger
Shell and Tube 3 each 0
Exchanger 1: 62 GJ/hr (58 MMBtu/hr)
Exchanger 2: 82 GJ/hr (78 MMBtu/hr)
Exchanger 3: 17 GJ/hr (16 MMBtu/hr)
Exchanger 1: 62 GJ/hr (58 MMBtu/hr)
Exchanger 2: 82 GJ/hr (78 MMBtu/hr)
Exchanger 3: 17 GJ/hr (16 MMBtu/hr)
6 Acid Gas Removal Plant
Two-stage Selexol 3 0
398,708 kg/hr (879,000 lb/hr)
34°C (94°F) 3.3 MPa (475 psia)
398,708 kg/hr (879,000 lb/hr)
34°C (94°F) 3.3 MPa (480 psia)
7 Hydrogenation Reactor
Fixed bed, catalytic 2 0
13,571 kg/hr (29,919 lb/hr) 232°C (450°F)
0.1 MPa (12.3 psia)
13,555 kg/hr (29,883 lb/hr) 232°C (450°F)
0.1 MPa (12.3 psia)
8 Tail Gas Recycle Compressor
Centrifugal 2 0 11,284 kg/hr (24,878 lb/hr) 11,279 kg/hr (24,865 lb/hr)
ACCOUNT 5B CO2 COMPRESSION
Equipment No. Description Type Operating
Qty. Spares Case 5 Design Condition
Case 6 Design Condition
1 CO2 Compressor
Integrally geared, multi-stage centrifugal
4 0 N/A 1,699 m3/min @ 15.3 MPa (60,000 scfm @
2,215 psia)

Cost and Performance Baseline for Coal-to-SNG and Ammonia (Volume 2)
216
ACCOUNT 6 COMBUSTION TURBINE AND AUXILIARIES
Equipment No. Description Type Operating
Qty. Spares Case 5 Design Condition
Case 6 Design Condition
1 Combustion Turbine N/A N/A N/A N/A N/A
2 Combustion Turbine Generator
N/A N/A N/A N/A N/A
ACCOUNT 7 DUCTING & STACK
Equipment No. Description Type Operating
Qty. Spares Case 5 Design Condition
Case 6 Design Condition
1 Stack CS plate, type 409SS liner 1 0 76 m (250 ft) high x
2.1 m (7 ft) diameter 76 m (250 ft) high x 0.6 m (2 ft) diameter
ACCOUNT 8 STEAM TURBINE GENERATOR AND AUXILIARIES
Equipment No. Description Type Operating
Qty. Spares Case 5 Design Condition
Case 6 Design Condition
1 Steam Turbine
Commercially available 1 0
318 MW 12.4 MPa/ /566°C (1800 psig/
1050°F)
318 MW 12.4 MPa/ 566°C (1800 psig/
1050°F)
2 Steam Turbine Generator
Hydrogen cooled, static excitation
1 0 350 MVA @ 0.9 p.f., 24 kV, 60 Hz, 3-phase
350 MVA @ 0.9 p.f., 24 kV, 60 Hz, 3-phase

Cost and Performance Baseline for Coal-to-SNG and Ammonia (Volume 2)
217
Equipment No. Description Type Operating
Qty. Spares Case 5 Design Condition
Case 6 Design Condition
3 Surface Condenser
Single pass, divided waterbox including vacuum pumps
1 0
886 GJ/hr (840 MMBtu/hr),
Condensing temperature 32°C (90°F), I
nlet water temperature 9°C (48°F),
Water temperature rise 11°C (20°F)
886 GJ/hr (840 MMBtu/hr),
Condensing temperature 32°C (90°F),
Inlet water temperature 9°C (48°F),
Water temperature rise 11°C (20°F)
4 Air-cooled Condenser --- 1 0
886 GJ/hr (840 MMBtu/hr),
Condensing temperature 32°C (90°F),
Ambient temperature 6°C (42°F)
886 GJ/hr (840 MMBtu/hr),
Condensing temperature 32°C (90°F),
Ambient temperature 6°C (42°F)
ACCOUNT 9 COOLING WATER SYSTEM
Equipment No. Description Type Operating
Qty. Spares Case 5 Design Condition
Case 6 Design Condition
1 Circulating Water Pumps
Vertical, wet pit 2 1 454,249 lpm @ 30 m
(120,000 gpm @ 100 ft) 518,601 lpm @ 30 m
(137,000 gpm @ 100 ft)
2 Cooling Tower
Evaporative, mechanical draft, multi-cell
1 0
3°C (37°F) wet bulb / 9°C (48°F) CWT / 20°C
(68°F) HWT / 2,543 GJ/hr (2,410 MMBtu/hr)
heat duty
3°C (37°F) wet bulb / 9°C (48°F) CWT / 20°C
(68°F) HWT / 2,901 GJ/hr (2,750 MMBtu/hr)
heat duty

Cost and Performance Baseline for Coal-to-SNG and Ammonia (Volume 2)
218
ACCOUNT 10 SLAG RECOVERY AND HANDLING
Equipment No. Description Type Operating
Qty. Spares Case 5 Design Condition Case 6 Design Condition
1 Slag Quench Tank Water bath 6 0 170,344 liters (45,000 gal) 170,344 liters (45,000 gal)
2 Slag Crusher Roll 6 0 9 tonne/hr (10 tph) 9 tonne/hr (10 tph)
3 Slag Depressurizer Proprietary 6 0 9 tonne/hr (10 tph) 9 tonne/hr (10 tph)
4 Slag Receiving Tank
Horizontal, weir 6 0 102,206 liters (27,000 gal) 102,206 liters (27,000 gal)
5 Black Water Overflow Tank
Shop fabricated 6 0 45,425 liters (12,000 gal) 45,425 liters (12,000 gal)
6 Slag Conveyor Drag chain 6 0 9 tonne/hr (10 tph) 9 tonne/hr (10 tph)
7 Slag Separation Screen
Vibrating 6 0 9 tonne/hr (10 tph) 9 tonne/hr (10 tph)
8 Coarse Slag Conveyor Belt/bucket 6 0 9 tonne/hr (10 tph) 9 tonne/hr (10 tph)
9 Fine Ash Settling Tank
Vertical, gravity 6 0 143,846 liters (38,000 gal) 143,846 liters (38,000 gal)
10 Fine Ash Recycle Pumps
Horizontal centrifugal 6 3 38 lpm @ 14 m H2O
(10 gpm @ 46 ft H2O) 38 lpm @ 14 m H2O
(10 gpm @ 46 ft H2O)
11 Grey Water Storage Tank Field erected 6 0 45,425 liters (12,000 gal) 45,425 liters (12,000 gal)
12 Grey Water Pumps Centrifugal 6 3 151 lpm @ 433 m H2O
(40 gpm @ 1,420 ft H2O) 151 lpm @ 433 m H2O
(40 gpm @ 1,420 ft H2O)
13 Slag Storage Bin
Vertical, field erected 6 0 635 tonne (700 tons) 635 tonne (700 tons)

Cost and Performance Baseline for Coal-to-SNG and Ammonia (Volume 2)
219
Equipment No. Description Type Operating
Qty. Spares Case 5 Design Condition Case 6 Design Condition
14 Unloading Equipment
Telescoping chute 2 0 109 tonne/hr (120 tph) 109 tonne/hr (120 tph)
ACCOUNT 11 SNG PRODUCTION/METHANATION SYSTEM
Equipment No. Description Type Operating
Qty. Spares Case 5 Design Condition Case 6 Design Condition
1 Methanation Reactor Preheater
Shell and Tube 3 0 95 GJ/hr (90 MMBtu/hr) 95 GJ/hr (90 MMBtu/hr)
2 Methanation Reactor 1
Fixed Bed, catalytic 3 0
480,354 kg/hr (1,059,000 lb/hr) 699°C (1,290°F)
3.2 MPa (470 psia)
474,004 kg/hr (1,045,000 lb/hr) 699°C (1,290°F)
3.2 MPa (470 psia)
3 Methanation Reactor Superheater 1
Shell and Tube 3 0 433 GJ/hr (410 MMBtu/hr) 431 GJ/hr (408 MMBtu/hr)
4 Methanation Reactor Intercooler 2
Shell and Tube 3 0 86 GJ/hr (82 MMBtu/hr) 85 GJ/hr (81 MMBtu/hr)
5 Methanation Reactor 2
Fixed Bed, catalytic 3 0
124,738 kg/hr (275,000 lb/hr)
554°C (1,030°F) 3.1 MPa ( psia)
124,738 kg/hr (275,000 lb/hr)
560°C (1,040°F) 3.1 MPa ( psia)
6 Methanation Reactor Intercooler 3
Shell and Tube 3 0 29 GJ/hr (28 MMBtu/hr) 29 GJ/hr (28 MMBtu/hr)

Cost and Performance Baseline for Coal-to-SNG and Ammonia (Volume 2)
220
Equipment No. Description Type Operating
Qty. Spares Case 5 Design Condition Case 6 Design Condition
7 Methanation Reactor 3
Fixed Bed, catalytic 3 0
124,738 kg/hr (275,000 lb/hr) 338°C (640°F)
3.0 MPa (440 psia)
124,738 kg/hr (275,000 lb/hr) 343°C (650°F)
3.0 MPa (440 psia)
8 Methanation Reactor Intercooler 4
Shell and Tube 3 0 39 GJ/hr (37 MMBtu/hr) 40 GJ/hr (38 MMBtu/hr)
9 Methanation Reactor Intercooler 5
Shell and Tube 3 0 66 GJ/hr (62 MMBtu/hr) 66 GJ/hr (62 MMBtu/hr)
10 SNG Purification Condenser 1
Shell and Tube 3 0 54 GJ/hr (51 MMBtu/hr) 54 GJ/hr (51 MMBtu/hr)
11 SNG Purification Condenser 2
Shell and Tube 3 0 33 GJ/hr (31 MMBtu/hr) 33 GJ/hr (31 MMBtu/hr)
12 Methanation Recycle Compressor
Centrifugal 3 1
8,634 m3/min (304,900 scfm)
Suction - 3.1 MPa (453 psia)
Discharge - 3.3 MPa 475 psia)
8,506 m3/min (300,400 scfm)
Suction - 3.1 MPa (453 psia)
Discharge - 3.3 MPa (475 psia)
13 Molecular Sieve Purification Reactor
Fixed bed 6 0 35,834 kg/hr (79,000 lb/hr)
35°C (95°F) 2.8 MPa (401 psia)
35,834 kg/hr (79,000 lb/hr) 35°C (95°F)
2.8 MPa (401 psia)
14 SNG Product Compressor
Centrifugal, Multi-staged 3 1
1,209 m3/min (42,700 scfm)
2.6 MPa (381 psia) 6.2 MPa (900 psia)
1,209 m3/min (42,700 scfm)
2.6 MPa (381 psia) 6.2 MPa (900 psia)

Cost and Performance Baseline for Coal-to-SNG and Ammonia (Volume 2)
221
ACCOUNT 12 ACCESSORY ELECTRIC PLANT
Equipment No. Description Type Operating
Qty. Spares Case 5 Design Condition
Case 6 Design Condition
1 STG Step-up Transformer Oil-filled 1 0 24 kV/345 kV, 350
MVA, 3-ph, 60 Hz 345 kV/24 kV, 350 MVA, 3-ph, 60 Hz
2 Auxiliary Transformer Oil-filled 1 1 24 kV/4.16 kV, 273
MVA, 3-ph, 60 Hz 24 kV/4.16 kV, 332 MVA, 3-ph, 60 Hz
3 Low Voltage Transformer
Dry ventilated 1 1 4.16 kV/480 V, 41
MVA, 3-ph, 60 Hz 4.16 kV/480 V, 50 MVA, 3-ph, 60 Hz
4 STG Isolated Phase Bus Duct and Tap Bus
Aluminum, self-cooled 1 0 24 kV, 3-ph, 60 Hz 24 kV, 3-ph, 60 Hz
5 Medium Voltage Switchgear Metal clad 1 1 4.16 kV, 3-ph, 60 Hz 4.16 kV, 3-ph, 60 Hz
6 Low Voltage Switchgear
Metal enclosed 1 1 480 V, 3-ph, 60 Hz 480 V, 3-ph, 60 Hz
7 Emergency Diesel Generator
Sized for emergency shutdown
1 0 750 kW, 480 V, 3-ph, 60 Hz
750 kW, 480 V, 3-ph, 60 Hz

Cost and Performance Baseline for Coal-to-SNG and Ammonia (Volume 2)
222
ACCOUNT 13 INSTRUMENTATION AND CONTROLS
Equipment No. Description Type Operating
Qty. Spares Case 5 Design Condition
Case 6 Design Condition
1 DCS - Main Control
Monitor/keyboard; Operator printer (laser color); Engineering printer (laser B&W)
1 0
Operator stations/printers and
engineering stations/printers
Operator stations/printers and
engineering stations/printers
2 DCS - Processor
Microprocessor with redundant input/output
1 0 N/A N/A
3 DCS - Data Highway Fiber optic 1 0 Fully redundant, 25%
spare Fully redundant, 25%
spare

Cost and Performance Baseline for Coal-to-SNG and Ammonia (Volume 2)
223
5.1.5 The cost estimating methodology was described previously in Section
Cases 5 and 6 Cost Estimating 2.8.
The TPC organized by cost account; owner’s costs; TOC; and initial and annual O&M costs for the SNG plant without sequestration using Montana Rosebud PRB coal (Case 5) are shown in Exhibit 5-18 and Exhibit 5-19, respectively. The same data for the SNG plant with sequestration using Montana Rosebud PRB coal (Case 6) are shown in Exhibit 5-20 and Exhibit 5-21.
The estimated TOC of the SNG plant without carbon sequestration is 3.35 billion dollars and with carbon sequestration is 3.44 billion dollars. Project and process contingencies represent 12.0 and 3.7 percent for both cases. The FYCOP is $19.15/MMBtu for the non-sequestration case and $21.01/MMBtu for the sequestration case as shown in Exhibit ES-6.

Cost and Performance Baseline for Coal-to-SNG and Ammonia (Volume 2)
224
Exhibit 5-18 Case 5 Total Plant Cost Details Client: USDOE/NETL R e port Da te : 2010-Feb-18
Project: Cost & Performance Baseline for Fossil Energy Plants Vol.2
Case: Case 5 - Siemens Quench SNG Production w/o CO2Plant Size: 54.43 MW,net Est imate Type: Conceptual Cost Base (Jun) 2007 ($x1000)
Acct Equipment Material Labor Sales Bare Erected Eng'g CM Contingencies Total Plant CostNo. I tem/Descript ion Cost Cost Direct Indirect Tax Cost $ H.O.& Fee Process Project $
1 COAL & SORBENT HANDLING1.1 Coal Receive & Unload $6,758 $0 $3,303 $0 $0 $10,061 $901 $0 $2,192 $13,1551.2 Coal Stackout & Reclaim $8,733 $0 $2,117 $0 $0 $10,851 $951 $0 $2,360 $14,1621.3 Coal Conveyors & Yd Crush $8,120 $0 $2,095 $0 $0 $10,215 $897 $0 $2,222 $13,3341.4 Other Coal Handling $2,124 $0 $485 $0 $0 $2,609 $228 $0 $567 $3,4051.5 Sorbent Receive & Unload $0 $0 $0 $0 $0 $0 $0 $0 $0 $01.6 Sorbent Stackout & Reclaim $0 $0 $0 $0 $0 $0 $0 $0 $0 $01.7 Sorbent Conveyors $0 $0 $0 $0 $0 $0 $0 $0 $0 $01.8 Other Sorbent Handling $0 $0 $0 $0 $0 $0 $0 $0 $0 $01.9 Coal & Sorbent Hnd.Foundations $0 $4,782 $11,959 $0 $0 $16,741 $1,605 $0 $3,669 $22,015
SUBTOTAL 1 . $25,736 $4,782 $19,958 $0 $0 $50,477 $4,582 $0 $11 ,012 $66,071 2 COAL & SORBENT PREP & FEED
2.1 Coal Crushing & Drying $110,813 $0 $16,147 $0 $0 $126,960 $11,530 $0 $27,698 $166,1882.2 Prepared Coal Storage & Feed $5,249 $1,256 $823 $0 $0 $7,328 $627 $0 $1,591 $9,5452.3 Dry Coal Injection System $172,735 $2,005 $16,042 $0 $0 $190,781 $16,432 $0 $41,443 $248,6562.4 Misc.Coal Prep & Feed $2,886 $2,100 $6,297 $0 $0 $11,284 $1,037 $0 $2,464 $14,7852.5 Sorbent Prep Equipment $0 $0 $0 $0 $0 $0 $0 $0 $0 $02.6 Sorbent Storage & Feed $0 $0 $0 $0 $0 $0 $0 $0 $0 $02.7 Sorbent Injection System $0 $0 $0 $0 $0 $0 $0 $0 $0 $02.8 Booster Air Supply System $0 $0 $0 $0 $0 $0 $0 $0 $0 $02.9 Coal & Sorbent Feed Foundation $0 $11,219 $9,211 $0 $0 $20,429 $1,892 $0 $4,464 $26,786
SUBTOTAL 2. $291 ,682 $16,580 $48,520 $0 $0 $356,782 $31 ,518 $0 $77,660 $465,959 3 FEEDWATER & MISC. BOP SYSTEMS
3.1 Feedwater System $3,669 $1,705 $2,068 $0 $0 $7,441 $673 $0 $1,623 $9,7373.2 Water Makeup & Pretreating $631 $66 $353 $0 $0 $1,050 $100 $0 $345 $1,4943.3 Other Feedwater Subsystems $3,983 $1,204 $1,970 $0 $0 $7,157 $650 $0 $1,561 $9,3683.4 Service Water Systems $361 $744 $2,581 $0 $0 $3,685 $360 $0 $1,213 $5,2583.5 Other Boiler Plant Systems $1,938 $751 $1,861 $0 $0 $4,549 $432 $0 $996 $5,9773.6 FO Supply Sys & Nat Gas $102 $210 $188 $0 $0 $500 $48 $0 $110 $6583.7 Waste Treatment Equipment $882 $0 $538 $0 $0 $1,420 $138 $0 $468 $2,0263.8 Misc. Power Plant Equipment $1,679 $225 $862 $0 $0 $2,765 $267 $0 $910 $3,942
SUBTOTAL 3. $13,244 $4,904 $10,420 $0 $0 $28,568 $2,667 $0 $7,225 $38,460 4 GASIFIER & ACCESSORIES
4.1 Gasifier, Syngas Cooler & Auxiliaries $324,959 $0 $150,456 $0 $0 $475,415 $42,226 $71,312 $88,343 $677,2954.2 Syngas Cooling w/4.1 $0 w/ 4.1 $0 $0 $0 $0 $0 $0 $04.3 ASU/Oxidant Compression $241,072 $0 w/equip. $0 $0 $241,072 $23,367 $0 $26,444 $290,8834.4 LT Heat Recovery & FG Saturation $50,885 $0 $18,854 $0 $0 $69,739 $6,680 $0 $15,284 $91,7044.5 Misc. Gasification Equipment w/4.1&4.2 $0 w/4.1&4.2 $0 $0 $0 $0 $0 $0 $04.6 Flare Stack System $0 $2,286 $930 $0 $0 $3,216 $308 $0 $705 $4,2294.7 CO2 Solid Feed System Compressors $11,668 $2,800 $4,200 $0 $0 $18,668 $1,867 $0 $4,107 $24,6424.8 Major Component Rigging w/4.1&4.2 $0 w/4.1&4.2 $0 $0 $0 $0 $0 $0 $04.9 Gasification Foundations $0 $24,156 $13,784 $0 $0 $37,940 $3,473 $0 $10,353 $51,766
SUBTOTAL 4. $628,583 $29,242 $188,224 $0 $0 $846,050 $77,921 $71 ,312 $145,236 $1 ,140,519
TOTAL PLANT COST SUMMARY

Cost and Performance Baseline for Coal-to-SNG and Ammonia (Volume 2)
225
Exhibit 5-18 Case 5 Total Plant Cost Details (continued) Acct Equipment Material Labor Sales Bare Erected Eng'g CM Contingencies Total Plant CostNo. Item/Description Cost Cost Direct Indirect Tax Cost $ H.O.& Fee Process Project $
5A GAS CLEANUP & PIPING5A.1 Double Stage Selexol $129,739 $0 $110,087 $0 $0 $239,827 $23,194 $47,965 $62,197 $373,1835A.2 Elemental Sulfur Plant $8,452 $1,685 $10,905 $0 $0 $21,041 $2,044 $0 $4,617 $27,7025A.3 Mercury Removal $2,420 $0 $1,841 $0 $0 $4,261 $412 $213 $977 $5,8635A.4 Shift Reactors $10,589 $0 $4,262 $0 $0 $14,851 $1,424 $0 $3,255 $19,5295A.5 Methanation $27,900 $11,160 $16,740 $0 $0 $55,800 $5,580 $5,580 $13,392 $80,3525A.6 SNG Purification & Compression $19,150 $7,660 $11,490 $0 $0 $38,300 $3,830 $0 $8,426 $50,5565A.7 Fuel Gas Piping $0 $1,711 $1,198 $0 $0 $2,910 $270 $0 $636 $3,8155A.9 Process Interconnects $0 $12,000 $18,000 $0 $0 $30,000 $3,000 $0 $6,600 $39,600
5A.10 HGCU Foundations $0 $1,733 $1,117 $0 $0 $2,850 $262 $0 $934 $4,0465A.11 Zinc Oxide Guard Bed $787 $0 $145 $0 $0 $932 $93 $0 $205 $1,230
SUBTOTAL 5A. $199,036 $35,949 $175,786 $0 $0 $410,771 $40,108 $53,758 $101 ,239 $605,876 5B CO2 COMPRESSION
5B.1 CO2 Removal System $0 $0 $0 $0 $0 $0 $0 $0 $0 $05B.2 CO2 Compression & Drying $0 $0 $0 $0 $0 $0 $0 $0 $0 $0
SUBTOTAL 5B. $0 $0 $0 $0 $0 $0 $0 $0 $0 $0 6 COMBUSTION TURBINE/ACCESSORIES
6.1 Combustion Turbine Generator $0 $0 $0 $0 $0 $0 $0 $0 $0 $06.2 Syngas Expander $0 $0 $0 $0 $0 $0 $0 $0 $0 $06.3 Compressed Air Piping $0 $0 $0 $0 $0 $0 $0 $0 $0 $06.9 Combustion Turbine Foundations $0 $0 $0 $0 $0 $0 $0 $0 $0 $0
SUBTOTAL 6. $0 $0 $0 $0 $0 $0 $0 $0 $0 $0 7 HRSG, DUCTING & STACK
7.1 Heat Recovery Steam Generator $0 $0 $0 $0 $0 $0 $0 $0 $0 $07.2 HRSG Accessories $0 $0 $0 $0 $0 $0 $0 $0 $0 $07.3 Ductwork $0 $334 $238 $0 $0 $572 $50 $0 $124 $7467.4 Stack $1,465 $0 $550 $0 $0 $2,015 $193 $0 $221 $2,4297.9 HRSG,Duct & Stack Foundations $0 $293 $282 $0 $0 $575 $54 $0 $189 $818
SUBTOTAL 7. $1 ,465 $627 $1 ,070 $0 $0 $3,162 $297 $0 $534 $3,993 8 STEAM TURBINE GENERATOR
8.1 Steam TG & Accessories $30,976 $0 $5,362 $0 $0 $36,338 $3,487 $0 $3,982 $43,8078.2 Turbine Plant Auxiliaries $170 $0 $494 $0 $0 $664 $65 $0 $73 $8028.3a Condenser & Auxiliaries $3,219 $0 $1,583 $0 $0 $4,802 $461 $0 $526 $5,7908.3b Air Cooled Condenser $29,498 $0 $5,914 $0 $0 $35,412 $3,541 $0 $7,791 $46,7448.4 Steam Piping $5,733 $0 $4,033 $0 $0 $9,765 $839 $0 $2,651 $13,2558.9 TG Foundations $0 $1,069 $1,806 $0 $0 $2,875 $273 $0 $944 $4,092
SUBTOTAL 8. $69,595 $1 ,069 $19,192 $0 $0 $89,856 $8,666 $0 $15,968 $114,489

Cost and Performance Baseline for Coal-to-SNG and Ammonia (Volume 2)
226
Exhibit 5-18 Case 5 Total Plant Cost Details (continued) Acct Equipment Material Labor Sales Bare Erected Eng'g CM Contingencies Total Plant CostNo. Item/Description Cost Cost Direct Indirect Tax Cost $ H.O.& Fee Process Project $
9 COOLING WATER SYSTEM9.1 Cooling Towers $7,073 $0 $1,287 $0 $0 $8,360 $796 $0 $1,373 $10,5309.2 Circulating Water Pumps $1,875 $0 $87 $0 $0 $1,961 $165 $0 $319 $2,4459.3 Circ.Water System Auxiliaries $154 $0 $22 $0 $0 $176 $17 $0 $29 $2219.4 Circ.Water Piping $0 $6,417 $1,664 $0 $0 $8,081 $730 $0 $1,762 $10,5739.5 Make-up Water System $348 $0 $498 $0 $0 $846 $81 $0 $185 $1,1139.6 Component Cooling Water Sys $757 $906 $645 $0 $0 $2,308 $216 $0 $505 $3,0299.9 Circ.Water System Foundations $0 $2,356 $4,005 $0 $0 $6,360 $603 $0 $2,089 $9,052
SUBTOTAL 9. $10,207 $9,679 $8,206 $0 $0 $28,092 $2,608 $0 $6,263 $36,96310 ASH/SPENT SORBENT HANDLING SYS
10.1 Slag Dewatering & Cooling $38,544 $0 $38,016 $0 $0 $76,559 $7,418 $0 $8,398 $92,37510.2 Gasifier Ash Depressurization w/10.1 $0 w/10.1 $0 $0 $0 $0 $0 $0 $010.3 Cleanup Ash Depressurization w/10.1 $0 w/10.1 $0 $0 $0 $0 $0 $0 $010.4 High Temperature Ash Piping $0 $0 $0 $0 $0 $0 $0 $0 $0 $010.5 Other Ash Rrecovery Equipment $0 $0 $0 $0 $0 $0 $0 $0 $0 $010.6 Ash Storage Silos $862 $0 $938 $0 $0 $1,800 $175 $0 $296 $2,27110.7 Ash Transport & Feed Equipment $1,156 $0 $279 $0 $0 $1,435 $134 $0 $235 $1,80510.8 Misc. Ash Handling Equipment $1,786 $2,188 $654 $0 $0 $4,628 $440 $0 $760 $5,82810.9 Ash/Spent Sorbent Foundation $0 $76 $96 $0 $0 $172 $16 $0 $56 $245
SUBTOTAL 10. $42,348 $2,265 $39,982 $0 $0 $84,594 $8,183 $0 $9,746 $102,52411 ACCESSORY ELECTRIC PLANT
11.1 Generator Equipment $428 $0 $424 $0 $0 $852 $81 $0 $93 $1,02611.2 Station Service Equipment $5,579 $0 $503 $0 $0 $6,082 $561 $0 $664 $7,30711.3 Switchgear & Motor Control $10,315 $0 $1,876 $0 $0 $12,191 $1,131 $0 $1,998 $15,31911.4 Conduit & Cable Tray $0 $4,792 $15,807 $0 $0 $20,598 $1,992 $0 $5,648 $28,23811.5 Wire & Cable $0 $9,155 $6,015 $0 $0 $15,170 $1,102 $0 $4,068 $20,34011.6 Protective Equipment $0 $830 $3,021 $0 $0 $3,851 $376 $0 $634 $4,86111.7 Standby Equipment $323 $0 $315 $0 $0 $639 $61 $0 $105 $80411.8 Main Power Transformers $9,154 $0 $177 $0 $0 $9,331 $708 $0 $1,506 $11,54511.9 Electrical Foundations $0 $192 $503 $0 $0 $695 $67 $0 $228 $990
SUBTOTAL 11 . $25,800 $14,968 $28,640 $0 $0 $69,408 $6,079 $0 $14,945 $90,43212 INSTRUMENTATION & CONTROL
12.1 IGCC Control Equipment w/4.1 $0 w/4.1 $0 $0 $0 $0 $0 $0 $012.2 Combustion Turbine Control w/6.1 $0 w/6.1 $0 $0 $0 $0 $0 $0 $012.3 Steam Turbine Control w/8.1 $0 w/8.1 $0 $0 $0 $0 $0 $0 $012.4 Other Major Component Control $528 $0 $353 $0 $0 $881 $83 $44 $151 $1,16012.5 Signal Processing Equipment w/12.7 $0 w/12.7 $0 $0 $0 $0 $0 $0 $012.6 Control Boards,Panels & Racks $351 $0 $225 $0 $0 $576 $54 $29 $132 $79112.7 Computer & Accessories $5,617 $0 $180 $0 $0 $5,797 $532 $290 $662 $7,28012.8 Instrument Wiring & Tubing $0 $2,845 $5,816 $0 $0 $8,661 $735 $433 $2,457 $12,28612.9 Other I & C Equipment $4,188 $0 $2,034 $0 $0 $6,221 $585 $311 $1,068 $8,185
SUBTOTAL 12. $10,684 $2,845 $8,608 $0 $0 $22,137 $1 ,990 $1 ,107 $4,470 $29,703

Cost and Performance Baseline for Coal-to-SNG and Ammonia (Volume 2)
227
Exhibit 5-18 Case 5 Total Plant Cost Details (continued) Acct Equipment Material Labor Sales Bare Erected Eng'g CM Contingencies Total Plant CostNo. Item/Description Cost Cost Direct Indirect Tax Cost $ H.O.& Fee Process Project $
13 IMPROVEMENTS TO SITE13.1 Site Preparation $0 $144 $3,080 $0 $0 $3,224 $320 $0 $1,063 $4,60713.2 Site Improvements $0 $2,563 $3,406 $0 $0 $5,969 $589 $0 $1,967 $8,52513.3 Site Facilities $4,593 $0 $4,846 $0 $0 $9,439 $931 $0 $3,111 $13,481
SUBTOTAL 13. $4,593 $2,707 $11 ,332 $0 $0 $18,632 $1 ,840 $0 $6,141 $26,61314 BUILDINGS & STRUCTURES
14.1 Combustion Turbine Area $0 $0 $0 $0 $0 $0 $0 $0 $0 $014.2 Steam Turbine Building $0 $2,580 $3,675 $0 $0 $6,255 $576 $0 $1,025 $7,85514.3 Administration Building $0 $870 $630 $0 $0 $1,500 $134 $0 $245 $1,87914.4 Circulation Water Pumphouse $0 $160 $90 $0 $0 $250 $22 $0 $41 $31214.5 Water Treatment Buildings $0 $527 $515 $0 $0 $1,042 $94 $0 $170 $1,30714.6 Machine Shop $0 $445 $305 $0 $0 $750 $67 $0 $123 $93914.7 Warehouse $0 $726 $464 $0 $0 $1,190 $105 $0 $194 $1,48914.8 Other Buildings & Structures $0 $521 $406 $0 $0 $927 $83 $0 $202 $1,21214.9 Waste Treating Building & Str. $0 $1,165 $2,226 $0 $0 $3,391 $316 $0 $741 $4,448
SUBTOTAL 14. $0 $6,994 $8,311 $0 $0 $15,304 $1 ,396 $0 $2,741 $19,441
TOTAL COST $1,322,974 $132,611 $568,248 $0 $0 $2,023,833 $187,854 $126,177 $403,179 $2,741 ,044
Owner's CostsPreproduction Costs
6 Months All Labor $21,7181 Month Maintenance Materials $3,840
1 Month Non-fuel Consumables $5751 Month Waste Disposal $634
25% of 1 Months Fuel Cost at 100% CF $1,7492% of TPC $54,821
Total $83,337Inventory Capital
60 day supply of fuel and consumables at 100% CF $14,9100.5% of TPC (spare parts) $13,705
Total $28,615
Initial Cost for Catalyst and Chemicals $15,381Land $900
Other Owner's Costs $411,157Financing Costs $74,008
Total Overnight Costs (TOC) $3,354,442TASC Multiplier 1.201
Total As-Spent Cost (TASC) $4,028,684

Cost and Performance Baseline for Coal-to-SNG and Ammonia (Volume 2)
228
Exhibit 5-19 Case 5 Initial and Annual O&M Costs INITIAL & ANNUAL O&M EXPENSES Cost Base (Jun): 2007
Case 5 - Siemens Quench SNG Production w/o CO2 MWe-net: 54SNG (MMbtu/hr): 6789 Capacity Factor (%): 90
OPERATING & MAINTENANCE LABOROperating Labor
Operating Labor Rate(base): 34.65 $/hour Operating Labor Burden: 30.00 % of base Labor O-H Charge Rate: 25.00 % of labor
Total Operating Labor Requirements(O.J.)per Shift: 1 unit/mod. Plant Skilled Operator 2.0 2.0 Operator 12.0 12.0 Foreman 1.0 1.0 Lab Tech's, etc. 3.0 3.0 TOTAL-O.J.'s 18.0 18.0
Annual Cost Annual Unit Cost$ $/MMBtu
Annual Operating Labor Cost $7,102,696 $0.133Maintenance Labor Cost $27,646,499 $0.516Administrative & Support Labor $8,687,299 $0.162Property Taxes and Insurance $54,820,873 $1.024TOTAL FIXED OPERATING COSTS $98,257,367 $1.836VARIABLE OPERATING COSTS
$/MMBtuMaintenance Material Cost $41 ,469,749 $0.77474
Consumables Consumption Unit Initial Fill Initial Fill /Day Cost Cost
Water(/1000 gallons) 0 3,494 1.08 $0 $1 ,241 ,581 $0.02320
ChemicalsMU & WT Chem. (lb) 0 20,817 0.17 $0 $1,183,517 $0.02211Carbon (Mercury Removal) (lb) 223,863 383 1.05 $235,094 $132,241 $0.00247COS Catalyst (m3) 0 0 2,397.36 $0 $0 $0.00000Water Gas Shift Catalyst (ft3) 5,564 4.76 498.83 $2,775,453 $780,596 $0.01458ZnO Sorbent (ton) 58 0.20 12,574.00 $723,651 $814,107 $0.01521Methanation Catalyst (ft3) 12,183 9.27 440.00 $5,360,314 $1,340,078 $0.02504Selexol Solution (gal) 469,206 149 13.40 $6,286,534 $656,108 $0.01226SCR Catalyst (m3) 0 0 0.00 $0 $0 $0.00000Aqueous Ammonia (ton) 0 0 0.00 $0 $0 $0.00000Claus Catalyst (ft3) w/equip 1.53 131.27 $0 $66,023 $0.00123
Subtotal Chemicals $15,381 ,047 $4,972,671 $0.09290
OtherSupplemental Fuel (MBtu) 0 0 0.00 $0 $0 $0.00000Supplemental Electricity (for consumption) (MW 0 0 61.60 $0 $0 $0.00000Gases,N2 etc. (/100scf) 0 0 0.00 $0 $0 $0.00000L.P. Steam (/1000 pounds) 0 0 0.00 $0 $0 $0.00000
Subtotal Other $0 $0 $0.00000
Waste DisposalSpent Mercury Catalyst (lb.) 0 383 0.42 $0 $52,520 $0.00098Spent ZnO Sorbent (ton) 0 0.20 16.23 $0 $1,051 $0.00002Flyash (ton) 0 0 0.00 $0 $0 $0.00000Slag (ton) 0 1,275 16.23 $0 $6,796,412 $0.12697
Subtotal-Waste Disposal $0 $6,849,982 $0.12797
By-products & Emissions Sulfur (tons) 0 108 0.00 $0 $0 $0.00000Supplemental Electricity (for sale) (MWh) 0 1,306 58.00 $0 -$24,889,315 -$0.46498
Subtotal By-Products $0 -$24,889,315 -$0.46498
TOTAL VARIABLE OPERATING COSTS $15,381 ,047 $29,644,668 $0.55382
Fuel (ton) 0 15,112 15.22 $0 $75,540,499 $1 .41125

Cost and Performance Baseline for Coal-to-SNG and Ammonia (Volume 2)
229
Exhibit 5-20 Case 6 Total Plant Cost Details Client: USDOE/NETL R e port Da te : 2010-Feb-18
Project: Cost & Performance Baseline for Fossil Energy Plants Vol.2
Case: Case 6 - Siemens Quench SNG Production w/ CO2Plant Size: 1.81 MW,net Est imate Type: Conceptual Cost Base (Jun) 2007 ($x1000)
Acct Equipment Material Labor Sales Bare Erected Eng'g CM Contingencies Total Plant CostNo. I tem/Descript ion Cost Cost Direct Indirect Tax Cost $ H.O.& Fee Process Project $
1 COAL & SORBENT HANDLING1.1 Coal Receive & Unload $6,758 $0 $3,303 $0 $0 $10,061 $901 $0 $2,192 $13,1551.2 Coal Stackout & Reclaim $8,733 $0 $2,117 $0 $0 $10,851 $951 $0 $2,360 $14,1621.3 Coal Conveyors & Yd Crush $8,120 $0 $2,095 $0 $0 $10,215 $897 $0 $2,222 $13,3341.4 Other Coal Handling $2,124 $0 $485 $0 $0 $2,609 $228 $0 $567 $3,4051.5 Sorbent Receive & Unload $0 $0 $0 $0 $0 $0 $0 $0 $0 $01.6 Sorbent Stackout & Reclaim $0 $0 $0 $0 $0 $0 $0 $0 $0 $01.7 Sorbent Conveyors $0 $0 $0 $0 $0 $0 $0 $0 $0 $01.8 Other Sorbent Handling $0 $0 $0 $0 $0 $0 $0 $0 $0 $01.9 Coal & Sorbent Hnd.Foundations $0 $4,782 $11,959 $0 $0 $16,741 $1,605 $0 $3,669 $22,015
SUBTOTAL 1 . $25,736 $4,782 $19,958 $0 $0 $50,477 $4,582 $0 $11 ,012 $66,071 2 COAL & SORBENT PREP & FEED
2.1 Coal Crushing & Drying $110,813 $0 $16,147 $0 $0 $126,960 $11,530 $0 $27,698 $166,1882.2 Prepared Coal Storage & Feed $5,249 $1,256 $823 $0 $0 $7,328 $627 $0 $1,591 $9,5452.3 Dry Coal Injection System $172,735 $2,005 $16,042 $0 $0 $190,781 $16,432 $0 $41,443 $248,6562.4 Misc.Coal Prep & Feed $2,886 $2,100 $6,297 $0 $0 $11,284 $1,037 $0 $2,464 $14,7852.5 Sorbent Prep Equipment $0 $0 $0 $0 $0 $0 $0 $0 $0 $02.6 Sorbent Storage & Feed $0 $0 $0 $0 $0 $0 $0 $0 $0 $02.7 Sorbent Injection System $0 $0 $0 $0 $0 $0 $0 $0 $0 $02.8 Booster Air Supply System $0 $0 $0 $0 $0 $0 $0 $0 $0 $02.9 Coal & Sorbent Feed Foundation $0 $11,219 $9,211 $0 $0 $20,429 $1,892 $0 $4,464 $26,786
SUBTOTAL 2. $291 ,682 $16,580 $48,520 $0 $0 $356,782 $31 ,518 $0 $77,660 $465,959 3 FEEDWATER & MISC. BOP SYSTEMS
3.1 Feedwater System $3,662 $1,702 $2,064 $0 $0 $7,428 $671 $0 $1,620 $9,7193.2 Water Makeup & Pretreating $690 $72 $386 $0 $0 $1,148 $109 $0 $377 $1,6353.3 Other Feedwater Subsystems $3,976 $1,202 $1,966 $0 $0 $7,144 $649 $0 $1,559 $9,3513.4 Service Water Systems $395 $814 $2,824 $0 $0 $4,032 $393 $0 $1,328 $5,7533.5 Other Boiler Plant Systems $2,120 $822 $2,036 $0 $0 $4,978 $472 $0 $1,090 $6,5403.6 FO Supply Sys & Nat Gas $102 $210 $188 $0 $0 $500 $48 $0 $110 $6583.7 Waste Treatment Equipment $965 $0 $589 $0 $0 $1,554 $151 $0 $512 $2,2173.8 Misc. Power Plant Equipment $1,679 $225 $862 $0 $0 $2,765 $267 $0 $910 $3,942
SUBTOTAL 3. $13,589 $5,046 $10,915 $0 $0 $29,550 $2,761 $0 $7,504 $39,816 4 GASIFIER & ACCESSORIES
4.1 Gasifier, Syngas Cooler & Auxiliaries $324,934 $0 $150,445 $0 $0 $475,379 $42,223 $71,307 $88,336 $677,2454.2 Syngas Cooling w/4.1 $0 w/ 4.1 $0 $0 $0 $0 $0 $0 $04.3 ASU/Oxidant Compression $241,072 $0 w/equip. $0 $0 $241,072 $23,367 $0 $26,444 $290,8834.4 LT Heat Recovery & FG Saturation $50,884 $0 $18,854 $0 $0 $69,738 $6,680 $0 $15,284 $91,7024.5 Misc. Gasification Equipment w/4.1 $0 w/4.1&4.2 $0 $0 $0 $0 $0 $0 $04.6 Other Gasification Equipment $0 $2,285 $930 $0 $0 $3,215 $308 $0 $705 $4,2284.7 CO2 Solid Feed System Compressors $7,427 $1,782 $2,674 $0 $0 $11,883 $1,188 $0 $2,614 $15,6854.8 Major Component Rigging w/4.1&4.2 $0 w/4.1&4.2 $0 $0 $0 $0 $0 $0 $04.9 Gasification Foundations $0 $24,156 $13,784 $0 $0 $37,940 $3,473 $0 $10,353 $51,766
SUBTOTAL 4. $624,317 $28,224 $186,685 $0 $0 $839,226 $77,240 $71 ,307 $143,736 $1 ,131 ,508
TOTAL PLANT COST SUMMARY

Cost and Performance Baseline for Coal-to-SNG and Ammonia (Volume 2)
230
Exhibit 5-20 Case 6 Total Plant Cost Details (continued) Acct Equipment Material Labor Sales Bare Erected Eng'g CM Contingencies Total Plant CostNo. I tem/Descript ion Cost Cost Direct Indirect Tax Cost $ H.O.& Fee Process Project $
5A GAS CLEANUP & PIPING5A.1 Double Stage Selexol $129,739 $0 $110,087 $0 $0 $239,826 $23,194 $47,965 $62,197 $373,1825A.2 Elemental Sulfur Plant $8,455 $1,685 $10,909 $0 $0 $21,049 $2,045 $0 $4,619 $27,7135A.3 Mercury Removal $2,401 $0 $1,827 $0 $0 $4,229 $408 $211 $970 $5,8185A.4 Shift Reactors $10,434 $0 $4,200 $0 $0 $14,633 $1,403 $0 $3,207 $19,2435A.5 Methanation $27,400 $10,960 $16,440 $0 $0 $54,800 $5,480 $5,480 $13,152 $78,9125A.6 SNG Purification & Compression $19,150 $7,660 $11,490 $0 $0 $38,300 $3,830 $0 $8,426 $50,5565A.7 Fuel Gas Piping $0 $1,710 $1,198 $0 $0 $2,908 $270 $0 $635 $3,8135A.9 Process Interconnects $0 $12,000 $18,000 $0 $0 $30,000 $3,000 $0 $6,600 $39,600
5A.10 HGCU Foundations $0 $1,732 $1,117 $0 $0 $2,848 $262 $0 $933 $4,0435A.11 Zinc Oxide Guard Bed $786 $0 $145 $0 $0 $931 $93 $0 $205 $1,229
SUBTOTAL 5A. $198,366 $35,747 $175,412 $0 $0 $409,525 $39,984 $53,657 $100,944 $604,110 5B CO2 COMPRESSION
5B.1 CO2 Removal System $0 $0 $0 $0 $0 $0 $0 $0 $0 $05B.2 CO2 Compression & Drying $36,117 $0 $21,269 $0 $0 $57,386 $5,525 $0 $12,582 $75,493
SUBTOTAL 5B. $36,117 $0 $21 ,269 $0 $0 $57,386 $5,525 $0 $12,582 $75,493 6 COMBUSTION TURBINE/ACCESSORIES
6.1 Combustion Turbine Generator $0 $0 $0 $0 $0 $0 $0 $0 $0 $06.2 Syngas Expander $0 $0 $0 $0 $0 $0 $0 $0 $0 $06.3 Compressed Air Piping $0 $0 $0 $0 $0 $0 $0 $0 $0 $06.9 Combustion Turbine Foundations $0 $0 $0 $0 $0 $0 $0 $0 $0 $0
SUBTOTAL 6. $0 $0 $0 $0 $0 $0 $0 $0 $0 $0 7 HRSG, DUCTING & STACK
7.1 Heat Recovery Steam Generator $0 $0 $0 $0 $0 $0 $0 $0 $0 $07.2 HRSG Accessories $0 $0 $0 $0 $0 $0 $0 $0 $0 $07.3 Ductwork $0 $0 $0 $0 $0 $0 $0 $0 $0 $07.4 Stack $0 $0 $0 $0 $0 $0 $0 $0 $0 $07.9 HRSG, Duct & Stack Foundations $0 $0 $0 $0 $0 $0 $0 $0 $0 $0
SUBTOTAL 7. $0 $0 $0 $0 $0 $0 $0 $0 $0 $0 8 STEAM TURBINE GENERATOR
8.1 Steam TG & Accessories $30,976 $0 $5,362 $0 $0 $36,338 $3,487 $0 $3,982 $43,8078.2 Turbine Plant Auxiliaries $169 $0 $494 $0 $0 $663 $65 $0 $73 $8018.3a Condenser & Auxiliaries $3,219 $0 $1,583 $0 $0 $4,802 $461 $0 $526 $5,7908.3b Air Cooled Condenser $29,498 $0 $5,914 $0 $0 $35,412 $3,541 $0 $7,791 $46,7448.4 Steam Piping $5,722 $0 $4,025 $0 $0 $9,747 $837 $0 $2,646 $13,2308.9 TG Foundations $0 $1,069 $1,806 $0 $0 $2,875 $273 $0 $944 $4,092
SUBTOTAL 8. $69,584 $1 ,069 $19,184 $0 $0 $89,837 $8,664 $0 $15,963 $114,464

Cost and Performance Baseline for Coal-to-SNG and Ammonia (Volume 2)
231
Exhibit 5-20 Case 6 Total Plant Cost Details (continued) Acct Equipment Material Labor Sales Bare Erected Eng'g CM Contingencies Total Plant CostNo. I tem/Descript ion Cost Cost Direct Indirect Tax Cost $ H.O.& Fee Process Project $
9 COOLING WATER SYSTEM9.1 Cooling Towers $7,758 $0 $1,411 $0 $0 $9,169 $873 $0 $1,506 $11,5499.2 Circulating Water Pumps $2,057 $0 $87 $0 $0 $2,143 $180 $0 $349 $2,6729.3 Circ.Water System Auxiliaries $166 $0 $24 $0 $0 $190 $18 $0 $31 $2409.4 Circ.Water Piping $0 $6,948 $1,801 $0 $0 $8,749 $791 $0 $1,908 $11,4489.5 Make-up Water System $376 $0 $537 $0 $0 $913 $88 $0 $200 $1,2009.6 Component Cooling Water Sys $820 $981 $698 $0 $0 $2,499 $234 $0 $547 $3,2809.9 Circ.Water System Foundations $0 $2,550 $4,335 $0 $0 $6,884 $653 $0 $2,261 $9,798
SUBTOTAL 9. $11 ,177 $10,479 $8,893 $0 $0 $30,549 $2,836 $0 $6,802 $40,18710 ASH/SPENT SORBENT HANDLING SYS
10.1 Slag Dewatering & Cooling $38,544 $0 $38,016 $0 $0 $76,559 $7,418 $0 $8,398 $92,37510.2 Gasifier Ash Depressurization w/10.1 w/10.1 w/10.1 $0 $0 $0 $0 $0 $0 $010.3 Cleanup Ash Depressurization w/10.1 w/10.1 w/10.1 $0 $0 $0 $0 $0 $0 $010.4 High Temperature Ash Piping $0 $0 $0 $0 $0 $0 $0 $0 $0 $010.5 Other Ash Recovery Equipment $0 $0 $0 $0 $0 $0 $0 $0 $0 $010.6 Ash Storage Silos $862 $0 $938 $0 $0 $1,800 $175 $0 $296 $2,27110.7 Ash Transport & Feed Equipment $1,156 $0 $279 $0 $0 $1,435 $134 $0 $235 $1,80510.8 Misc. Ash Handling Equipment $1,786 $2,188 $654 $0 $0 $4,628 $440 $0 $760 $5,82810.9 Ash/Spent Sorbent Foundation $0 $76 $96 $0 $0 $172 $16 $0 $56 $245
SUBTOTAL 10. $42,348 $2,265 $39,982 $0 $0 $84,594 $8,183 $0 $9,746 $102,52411 ACCESSORY ELECTRIC PLANT
11.1 Generator Equipment $428 $0 $424 $0 $0 $852 $81 $0 $93 $1,02611.2 Station Service Equipment $6,060 $0 $546 $0 $0 $6,606 $609 $0 $721 $7,93611.3 Switchgear & Motor Control $11,203 $0 $2,037 $0 $0 $13,240 $1,228 $0 $2,170 $16,63811.4 Conduit & Cable Tray $0 $5,204 $17,168 $0 $0 $22,372 $2,164 $0 $6,134 $30,67011.5 Wire & Cable $0 $9,943 $6,533 $0 $0 $16,476 $1,197 $0 $4,418 $22,09211.6 Protective Equipment $0 $830 $3,021 $0 $0 $3,851 $376 $0 $634 $4,86111.7 Standby Equipment $323 $0 $315 $0 $0 $639 $61 $0 $105 $80411.8 Main Power Transformers $9,866 $0 $177 $0 $0 $10,043 $762 $0 $1,621 $12,42511.9 Electrical Foundations $0 $192 $503 $0 $0 $695 $67 $0 $228 $990
SUBTOTAL 11 . $27,880 $16,169 $30,724 $0 $0 $74,773 $6,544 $0 $16,125 $97,44312 INSTRUMENTATION & CONTROL
12.1 IGCC Control Equipment w/4.1 $0 w/4.1 $0 $0 $0 $0 $0 $0 $012.2 Combustion Turbine Control w/6.1 $0 w/6.1 $0 $0 $0 $0 $0 $0 $012.3 Steam Turbine Control w/8.1 $0 w/8.1 $0 $0 $0 $0 $0 $0 $012.4 Other Major Component Control $525 $0 $351 $0 $0 $876 $83 $44 $150 $1,15212.5 Signal Processing Equipment w/12.7 $0 w/12.7 $0 $0 $0 $0 $0 $0 $012.6 Control Boards,Panels & Racks $349 $0 $223 $0 $0 $572 $54 $29 $131 $78612.7 Computer & Accessories $5,579 $0 $179 $0 $0 $5,758 $529 $288 $657 $7,23212.8 Instrument Wiring & Tubing $0 $2,826 $5,778 $0 $0 $8,604 $730 $430 $2,441 $12,20512.9 Other I & C Equipment $4,160 $0 $2,020 $0 $0 $6,180 $581 $309 $1,061 $8,131
SUBTOTAL 12. $10,613 $2,826 $8,550 $0 $0 $21 ,989 $1 ,977 $1 ,099 $4,440 $29,505

Cost and Performance Baseline for Coal-to-SNG and Ammonia (Volume 2)
232
Exhibit 5-20 Case 6 Total Plant Cost Details (continued) Acct Equipment Material Labor Sales Bare Erected Eng'g CM Contingencies Total Plant CostNo. I tem/Descript ion Cost Cost Direct Indirect Tax Cost $ H.O.& Fee Process Project $
13 IMPROVEMENTS TO SITE13.1 Site Preparation $0 $144 $3,080 $0 $0 $3,224 $320 $0 $1,063 $4,60713.2 Site Improvements $0 $2,563 $3,406 $0 $0 $5,969 $589 $0 $1,967 $8,52513.3 Site Facilities $4,593 $0 $4,846 $0 $0 $9,439 $931 $0 $3,111 $13,481
SUBTOTAL 13. $4,593 $2,707 $11 ,332 $0 $0 $18,632 $1 ,840 $0 $6,141 $26,61314 BUILDINGS & STRUCTURES
14.1 Combustion Turbine Area $0 $0 $0 $0 $0 $0 $0 $0 $0 $014.2 Steam Turbine Building $0 $2,580 $3,675 $0 $0 $6,255 $576 $0 $1,025 $7,85514.3 Administration Building $0 $870 $630 $0 $0 $1,500 $134 $0 $245 $1,87914.4 Circulation Water Pumphouse $0 $160 $90 $0 $0 $250 $22 $0 $41 $31214.5 Water Treatment Buildings $0 $577 $563 $0 $0 $1,140 $103 $0 $186 $1,43014.6 Machine Shop $0 $445 $305 $0 $0 $750 $67 $0 $123 $93914.7 Warehouse $0 $726 $464 $0 $0 $1,190 $105 $0 $194 $1,48914.8 Other Buildings & Structures $0 $521 $406 $0 $0 $927 $83 $0 $202 $1,21214.9 Waste Treating Building & Str. $0 $1,165 $2,226 $0 $0 $3,391 $316 $0 $741 $4,448
SUBTOTAL 14. $0 $7,043 $8,359 $0 $0 $15,403 $1 ,405 $0 $2,757 $19,564
TOTAL COST $1,356,002 $132,937 $589,783 $0 $0 $2,078,723 $193,059 $126,063 $415,413 $2,813,258
Owner's CostsPreproduction Costs
6 Months All Labor $21,7021 Month Maintenance Materials $3,836
1 Month Non-fuel Consumables $6301 Month Waste Disposal $634
25% of 1 Months Fuel Cost at 100% CF $1,7492% of TPC $56,265
Total $84,817Inventory Capital
60 day supply of fuel and consumables at 100% CF $14,9890.5% of TPC (spare parts) $14,066
Total $29,055
Initial Cost for Catalyst and Chemicals $16,334Land $900
Other Owner's Costs $421,989Financing Costs $75,958
Total Overnight Costs (TOC) $3,442,310TASC Multiplier 1.201
Total As-Spent Cost (TASC) $4,134,215

Cost and Performance Baseline for Coal-to-SNG and Ammonia (Volume 2)
233
Exhibit 5-21 Case 6 Initial and Annual O&M Costs INITIAL & ANNUAL O&M EXPENSES Cost Base (Jun): 2007
Case 6 - Siemens Quench SNG Production w/ CO2 MWe-net: 2SNG (MMbtu/hr): 6784 Capacity Factor (%): 90
OPERATING & MAINTENANCE LABOROperating Labor
Operating Labor Rate(base): 34.65 $/hour Operating Labor Burden: 30.00 % of base Labor O-H Charge Rate: 25.00 % of labor
Total Operating Labor Requirements(O.J.)per Shift: 1 unit/mod. Plant Skilled Operator 2.0 2.0 Operator 12.0 12.0 Foreman 1.0 1.0 Lab Tech's, etc. 3.0 3.0 TOTAL-O.J.'s 18.0 18.0
Annual Cost Annual Unit Cost$ $/MMBtu
Annual Operating Labor Cost $7,102,696 $0.133Maintenance Labor Cost $27,620,931 $0.516Administrative & Support Labor $8,680,907 $0.162Property Taxes and Insurance $56,265,151 $1.052TOTAL FIXED OPERATING COSTS $99,669,685 $1.863VARIABLE OPERATING COSTS
$/MMBtuMaintenance Material Cost $41 ,431 ,397 $0.77459
Consumables Consumption Unit Initial Fill Initial Fill /Day Cost Cost
Water(/1000 gallons) 0 3,966 1.08 $0 $1 ,409,411 $0.02635
ChemicalsMU & WT Chem.(lb) 0 23,631 0.17 $0 $1,343,498 $0.02512Carbon (Mercury Removal) (lb) 221,425 379 1.05 $232,533 $130,800 $0.00245COS Catalyst (m3) 0 0 2,397.36 $0 $0 $0.00000Water Gas Shift Catalyst (ft3) 7,553 6.47 498.83 $3,767,548 $1,059,623 $0.01981ZnO Sorbent (ton) 57 0.20 12,574.00 $721,842 $812,073 $0.01518Methanation Catalyst (ft3) 12,102 9.21 440.00 $5,324,846 $1,331,211 $0.02489Selexol Solution (gal) 469,270 149 13.40 $6,287,392 $656,198 $0.01227SCR Catalyst (m3) 0 0 0.00 $0 $0 $0.00000Aqueous Ammonia (ton) 0 0 0.00 $0 $0 $0.00000Claus Catalyst (ft3) w/equip 1.53 131.27 $0 $66,058 $0.00124
Subtotal Chemicals $16,334,162 $5,399,462 $0.10095
OtherSupplemental Fuel (MBtu) 0 0 0.00 $0 $0 $0.00000Supplemental Electricity (for consumption) (MW 0 0 61.60 $0 $0 $0.00000Gases,N2 etc.(/100scf) 0 0 0.00 $0 $0 $0.00000L.P. Steam(/1000 pounds) 0 0 0.00 $0 $0 $0.00000
Subtotal Other $0 $0 $0.00000
Waste DisposalSpent Mercury Catalyst (lb.) 0 379 0.42 $0 $51,948 $0.00097Spent ZnO Sorbent (ton) 0 0.20 16.23 $0 $1,048 $0.00002Flyash (ton) 0 0 0.00 $0 $0 $0.00000Slag (ton) 0 1,275 16.23 $0 $6,796,412 $0.12706
Subtotal-Waste Disposal $0 $6,849,407 $0.12805
By-products & Emissions Sulfur (tons) 0 108 0.00 $0 $0 $0.00000Supplemental Electricity (for sale) (MWh) 0 43 58.00 $0 -$827,662 -$0.01547
Subtotal By-Products $0 -$827,662 -$0.01547
TOTAL VARIABLE OPERATING COSTS $16,334,162 $54,262,014 $1 .01446
Fuel (ton) 0 15,112 15.22 $0 $75,540,499 $1 .41228

Cost and Performance Baseline for Coal-to-SNG and Ammonia (Volume 2)
234
5.2 SYNTHETIC NATURAL GAS PRODUCTION USING NORTH DAKOTA LIGNITE COAL
5.2.1 In this section the overall Siemens gasification process for SNG production using NDL coal is described. The plant configurations are similar to Cases 5 and 6, with the exception of the coal type utilized. Since the carbon content of the lignite coal used is lower than that of the bituminous coal and subbituminous, the coal feed rate is significantly increased. The process BFDs for the lignite coal non-sequestration and sequestration cases are shown in
Process Description
Exhibit 5-22 and Exhibit 5-24. The associated stream tables are shown in Exhibit 5-23 for the non-sequestration case and Exhibit 5-25 for the sequestration case.

Cost and Performance Baseline for Coal-to-SNG and Ammonia (Volume 2)
235
Exhibit 5-22 Case 7 Block Flow Diagram, North Dakota Lignite Coal to SNG without Carbon Sequestration
PARTIAL RAW GAS QUENCH AND COOLING
WATER-GAS SHIFT REACTORS & GAS COOLING
WATER SCRUBBER
ELEVATEDPRESSURE
ASU
SIEMENS GASIFIER
MERCURYREMOVAL
DUAL-STAGE
SELEXOL UNIT
CLAUSPLANT
1AIR TO ASU
2 3
VENTGAS
SULFUR PLANT
OXIDANT
4
10
GASIFIEROXIDANT
SLAG
13
2728
HYDROGENATIONREACTOR
29
CLEAN GAS
SULFUR PRODUCT
SYNGAS
12
TO SOUR WATER
STRIPPER
16
15
CO2VENT
SHIFT STEAM
30
11QUENCHWATER
14
17
METHANATION REACTORS
22
SNG PURIFICATION
24
SNG FOR EXPORT
23 PURIFICATION OFF-GAS
19
2021PILOT
FUEL
WGS BYPASS
STEAM TURBINE
31 32
PROCESS STEAM
CONDENSATE
18
SNG COMPRESSION 25
Note: Block Flow Diagram is not intended to represent a complete material balance. Only major process streams and equipment are shown. See H&MB diagram for more detail.
7
DRIEDCOAL
WTACOAL
DRYER5
WETCOAL
6
WATER
8
LOCK-HOPPER
TRANSPORT CO2
9
VENT
8TRANSPORT
CO2
26

Cost and Performance Baseline for Coal-to-SNG and Ammonia (Volume 2)
236
Exhibit 5-23 Case 7 Stream Table, North Dakota Lignite Coal to SNG without Carbon Sequestration 1 2 3 4 5 6 7 8 9 10 11 12 13 14 15 16 17
V-L Mole FractionAr 0.0093 0.0091 0.0101 0.0101 0.0000 0.0000 0.0000 0.0001 0.0000 0.0000 0.0000 0.0021 0.0022 0.0022 0.0022 0.0000 0.0022CH4 0.0000 0.0000 0.0000 0.0000 0.0000 0.0000 0.0000 0.0000 0.0000 0.0000 0.0000 0.0000 0.0000 0.0000 0.0000 0.0000 0.0000CO 0.0000 0.0000 0.0000 0.0000 0.0000 0.0000 0.0000 0.0097 0.0013 0.0000 0.0000 0.4252 0.4405 0.4405 0.4405 0.0000 0.1549CO2 0.0003 0.0004 0.0000 0.0000 0.0000 0.0000 0.0000 0.9785 0.1363 0.0000 0.0000 0.0718 0.0744 0.0744 0.0744 0.0000 0.3705COS 0.0000 0.0000 0.0000 0.0000 0.0000 0.0000 0.0000 0.0001 0.0000 0.0000 0.0000 0.0003 0.0003 0.0003 0.0003 0.0000 0.0001H2 0.0000 0.0000 0.0000 0.0000 0.0000 0.0000 0.0000 0.0103 0.5349 0.0000 0.0000 0.1607 0.1665 0.1665 0.1665 0.0000 0.4644H2O 0.0064 0.0026 0.0000 0.0000 0.0000 1.0000 0.0000 0.0013 0.1899 0.0000 1.0000 0.3344 0.3103 0.3103 0.3103 1.0000 0.0018H2S 0.0000 0.0000 0.0000 0.0000 0.0000 0.0000 0.0000 0.0000 0.0000 0.0000 0.0000 0.0024 0.0025 0.0025 0.0025 0.0000 0.0027N2 0.7759 0.9803 0.0004 0.0004 0.0000 0.0000 0.0000 0.0000 0.0088 0.0000 0.0000 0.0032 0.0033 0.0033 0.0033 0.0000 0.0033NH3 0.0000 0.0000 0.0000 0.0000 0.0000 0.0000 0.0000 0.0000 0.0000 0.0000 0.0000 0.0000 0.0000 0.0000 0.0000 0.0000 0.0000O2 0.2081 0.0076 0.9895 0.9895 0.0000 0.0000 0.0000 0.0000 0.1288 0.0000 0.0000 0.0000 0.0000 0.0000 0.0000 0.0000 0.0000SO2 0.0000 0.0000 0.0000 0.0000 0.0000 0.0000 0.0000 0.0000 0.0000 0.0000 0.0000 0.0000 0.0000 0.0000 0.0000 0.0000 0.0000
Total 1.0000 1.0000 1.0000 1.0000 0.0000 1.0000 0.0000 1.0000 1.0000 0.0000 1.0000 1.0000 1.0000 1.0000 1.0000 1.0000 1.0000
V-L Flowrate (kgmol/hr) 52,805 41,791 79 10,707 0 10,782 0 5,042 18,101 0 12,568 51,888 50,077 5,789 44,288 14,233 49,085V-L Flowrate (kg/hr) 1,525,805 1,175,700 2,547 343,453 0 194,238 0 218,763 269,759 0 226,410 1,125,307 1,092,655 126,310 966,345 256,405 1,074,648Solids Flowrate (kg/hr) 0 0 0 0 709,841 0 515,603 0 355,226 71,414 0 0 0 0 0 0 0
Temperature (°C) 6 26 32 32 4 33 71 76 18 1,427 216 260 215 215 215 288 35Pressure (MPa, abs) 0.09 0.11 0.86 0.86 0.10 0.35 0.09 5.62 5.62 4.24 8.27 3.89 3.756 3.76 3.76 4.14 3.34Enthalpy (kJ/kg) 15.71 30.53 26.94 26.94 --- 147.56 --- 21.89 4,183.74 --- 1,017.87 1,092.44 964.077 964.08 964.08 3,070.04 40.47Density (kg/m3) 1.1 1.3 11.0 11.0 --- 986.2 --- 103.4 42.2 --- 782.0 19.3 20.5 20.5 20.5 18.2 29.2V-L Molecular Weight 28.895 28.133 32.078 32.078 --- 18.015 --- 43.389 14.903 --- 18.015 21.687 21.820 21.820 21.820 18.015 21.894
V-L Flowrate (lbmol/hr) 116,415 92,133 175 23,605 0 23,770 0 11,115 39,906 0 27,707 114,394 110,400 12,762 97,638 31,378 108,214V-L Flowrate (lb/hr) 3,363,825 2,591,975 5,614 757,185 0 428,222 0 482,290 594,716 0 499,149 2,480,878 2,408,892 278,465 2,130,426 565,276 2,369,194Solids Flowrate (lb/hr) 0 0 0 0 1,564,932 0 1,136,710 0 783,138 157,442 0 0 0 0 0 0 0
Temperature (°F) 42 78 90 90 40 91 160 168 65 2,600 420 500 418 418 418 550 95Pressure (psia) 13.0 16.4 125.0 125.0 13.8 50.3 13.5 815.0 815.0 614.7 1,200.0 564.7 544.7 544.7 544.7 600.0 484.7Enthalpy (Btu/lb) 6.8 13.1 11.6 11.6 --- 63.4 --- 9.4 1,798.7 --- 437.6 469.7 414.5 414.5 414.5 1,319.9 17.4Density (lb/ft3) 0.070 0.080 0.685 0.685 --- 61.569 --- 6.457 2.635 --- 48.817 1.203 1.282 1.282 1.282 1.135 1.822
A - Reference conditions are 32.02 F & 0.089 PSIA

Cost and Performance Baseline for Coal-to-SNG and Ammonia (Volume 2)
237
Exhibit 5-23 Case 7 Stream Table, North Dakota Lignite Coal to SNG without Carbon Sequestration (continued) 18 19 20 21 22 23 24 25 26 27 28 29 30 31 32
V-L Mole FractionAr 0.0022 0.0034 0.0034 0.0034 0.0118 0.0000 0.0138 0.0138 0.0000 0.0007 0.0000 0.0016 0.0024 0.0000 0.0000CH4 0.0000 0.0000 0.0000 0.0000 0.8145 0.0000 0.9559 0.9559 0.0000 0.0000 0.0000 0.0000 0.0000 0.0000 0.0000CO 0.1532 0.2348 0.2348 0.2348 0.0000 0.0000 0.0000 0.0000 0.0017 0.0543 0.0000 0.0861 0.0065 0.0000 0.0000CO2 0.3756 0.0444 0.0444 0.0444 0.1478 0.9845 0.0026 0.0026 0.9925 0.5987 0.0000 0.4846 0.8126 0.0000 0.0000COS 0.0001 0.0000 0.0000 0.0000 0.0000 0.0000 0.0000 0.0000 0.0001 0.0019 0.0000 0.0003 0.0000 0.0000 0.0000H2 0.4610 0.7121 0.7121 0.7121 0.0059 0.0000 0.0069 0.0069 0.0016 0.1041 0.0000 0.0507 0.1663 0.0000 0.0000H2O 0.0018 0.0001 0.0001 0.0001 0.0023 0.0155 0.0000 0.0000 0.0041 0.0394 0.0000 0.3691 0.0009 1.0000 1.0000H2S 0.0028 0.0000 0.0000 0.0000 0.0000 0.0000 0.0000 0.0000 0.0000 0.2003 0.0000 0.0014 0.0103 0.0000 0.0000N2 0.0033 0.0051 0.0051 0.0051 0.0176 0.0000 0.0207 0.0207 0.0000 0.0005 0.0000 0.0007 0.0009 0.0000 0.0000NH3 0.0000 0.0000 0.0000 0.0000 0.0000 0.0000 0.0000 0.0000 0.0000 0.0000 0.0000 0.0000 0.0000 0.0000 0.0000O2 0.0000 0.0000 0.0000 0.0000 0.0000 0.0000 0.0000 0.0000 0.0000 0.0000 0.0000 0.0000 0.0000 0.0000 0.0000SO2 0.0000 0.0000 0.0000 0.0000 0.0000 0.0000 0.0000 0.0000 0.0000 0.0000 0.0000 0.0054 0.0000 0.0000 0.0000
Total 1.0000 1.0000 1.0000 1.0000 1.0000 1.0000 1.0000 1.0000 1.0000 1.0000 0.0000 1.0000 1.0000 1.0000 1.0000
V-L Flowrate (kgmol/hr) 49,657 31,944 183 31,762 9,214 1,363 7,851 7,851 11,969 701 0 820 572 40,826 56,932V-L Flowrate (kg/hr) 1,095,675 327,418 1,874 325,544 189,733 59,420 130,313 130,313 524,399 25,095 0 25,423 21,027 735,487 1,025,654Solids Flowrate (kg/hr) 0 0 0 0 0 0 0 0 0 0 4,382 0 0 0 0
Temperature (°C) 34 31 80 31 35 35 35 35 5 48 175 232 21 566 33Pressure (MPa, abs) 3.27 3.24 5.10 3.24 2.77 0.14 2.627 6.202 0.115 0.16 0.1 0.085 3.341 12.512 0.827Enthalpy (kJ/kg) 39.13 83.91 228.57 83.91 39.74 45.04 47.668 12.706 7.673 98.02 --- 836.767 -9.442 3,495.174 121.037Density (kg/m3) 28.9 13.0 17.4 13.0 23.6 2.4 17.9 44.7 2.2 2.2 5,285.7 0.6 58.2 34.9 995.1V-L Molecular Weight 22.065 10.250 10.250 10.250 20.592 43.606 16.597 16.597 43.812 35.777 --- 30.993 36.771 18.015 18.015
V-L Flowrate (lbmol/hr) 109,475 70,425 403 70,022 20,314 3,004 17,309 17,309 26,388 1,546 0 1,808 1,261 90,005 125,515V-L Flowrate (lb/hr) 2,415,550 721,834 4,131 717,703 418,290 130,998 287,291 287,291 1,156,103 55,324 0 56,047 46,356 1,621,472 2,261,180Solids Flowrate (lb/hr) 0 0 0 0 0 0 0 0 0 0 9,660 0 0 0 0
Temperature (°F) 94 87 177 87 95 95 95 95 42 119 347 450 69 1,050 92Pressure (psia) 474.7 469.6 740.0 469.6 401.1 20.1 381.0 899.5 16.7 23.7 17.3 12.3 484.5 1,814.7 120.0Enthalpy (Btu/lb) 16.8 36.1 98.3 36.1 17.1 19.4 20.5 5.5 3.3 42.1 --- 359.7 -4.1 1,502.7 52.0Density (lb/ft3) 1.803 0.811 1.088 0.811 1.473 0.148 1.115 2.789 0.137 0.137 330 0.039 3.636 2.177 62.122

Cost and Performance Baseline for Coal-to-SNG and Ammonia (Volume 2)
238
Exhibit 5-24 Case 8 Block Flow Diagram, North Dakota Lignite to SNG with Carbon Sequestration
PARTIAL RAW GAS QUENCH AND COOLING
WATER-GAS SHIFT REACTORS & GAS COOLING
WATER SCRUBBER
ELEVATEDPRESSURE
ASU
SIEMENS GASIFIER
MERCURYREMOVAL
DUAL-STAGE
SELEXOL UNIT
CLAUSPLANT
1AIR TO ASU
2 3
VENTGAS
SULFUR PLANT
OXIDANT
4
10
GASIFIEROXIDANT
SLAG
13
2728
HYDROGENATIONREACTOR
29
CLEAN GAS
SULFUR PRODUCT
SYNGAS
12
TO SOUR WATER
STRIPPER
2616
15
CO2PRODUCT
SHIFT STEAM
30
11QUENCHWATER
14
17
METHANATION REACTORS
22
SNG PURIFICATION
24
SNG FOR EXPORT
23PURIFICATION
OFF-GAS TO CO2 COMPRESSION
19
2021PILOT
FUEL
WGS BYPASS
8
STEAM TURBINE
31 32
PROCESS STEAM
CONDENSATE
18
SNG COMPRESSION 25
CO2 COMPRESSION
23
Note: Block Flow Diagram is not intended to represent a complete material balance. Only major process streams and equipment are shown. See H&MB diagram for more detail.
7
DRIEDCOAL
WTACOAL
DRYER5
WETCOAL
6
WATER
8
LOCK-HOPPER
TRANSPORT CO2
9
VENT
TRANSPORT CO2
PURIFICATION OFF-GAS

Cost and Performance Baseline for Coal-to-SNG and Ammonia (Volume 2)
239
Exhibit 5-25 Case 8 Stream Table, North Dakota Lignite Coal to SNG with Carbon Sequestration 1 2 3 4 5 6 7 8 9 10 11 12 13 14 15 16 17
V-L Mole FractionAr 0.0093 0.0091 0.0101 0.0101 0.0000 0.0000 0.0000 0.0001 0.0000 0.0000 0.0000 0.0021 0.0022 0.0022 0.0022 0.0000 0.0022CH4 0.0000 0.0000 0.0000 0.0000 0.0000 0.0000 0.0000 0.0000 0.0000 0.0000 0.0000 0.0000 0.0000 0.0000 0.0000 0.0000 0.0000CO 0.0000 0.0000 0.0000 0.0000 0.0000 0.0000 0.0000 0.0037 0.0005 0.0000 0.0000 0.4252 0.4406 0.4406 0.4406 0.0000 0.1549CO2 0.0003 0.0004 0.0000 0.0000 0.0000 0.0000 0.0000 0.9921 0.1371 0.0000 0.0000 0.0720 0.0746 0.0746 0.0746 0.0000 0.3708COS 0.0000 0.0000 0.0000 0.0000 0.0000 0.0000 0.0000 0.0001 0.0000 0.0000 0.0000 0.0003 0.0003 0.0003 0.0003 0.0000 0.0001H2 0.0000 0.0000 0.0000 0.0000 0.0000 0.0000 0.0000 0.0039 0.5346 0.0000 0.0000 0.1604 0.1663 0.1663 0.1663 0.0000 0.4642H2O 0.0064 0.0026 0.0000 0.0000 0.0000 1.0000 0.0000 0.0001 0.1900 0.0000 1.0000 0.3344 0.3103 0.3103 0.3103 1.0000 0.0018H2S 0.0000 0.0000 0.0000 0.0000 0.0000 0.0000 0.0000 0.0000 0.0000 0.0000 0.0000 0.0024 0.0025 0.0025 0.0025 0.0000 0.0027N2 0.7759 0.9803 0.0004 0.0004 0.0000 0.0000 0.0000 0.0000 0.0088 0.0000 0.0000 0.0032 0.0033 0.0033 0.0033 0.0000 0.0033NH3 0.0000 0.0000 0.0000 0.0000 0.0000 0.0000 0.0000 0.0000 0.0000 0.0000 0.0000 0.0000 0.0000 0.0000 0.0000 0.0000 0.0000O2 0.2081 0.0076 0.9895 0.9895 0.0000 0.0000 0.0000 0.0000 0.1289 0.0000 0.0000 0.0000 0.0000 0.0000 0.0000 0.0000 0.0000SO2 0.0000 0.0000 0.0000 0.0000 0.0000 0.0000 0.0000 0.0000 0.0000 0.0000 0.0000 0.0000 0.0000 0.0000 0.0000 0.0000 0.0000
Total 1.0000 1.0000 1.0000 1.0000 0.0000 1.0000 0.0000 1.0000 1.0000 0.0000 1.0000 1.0000 1.0000 1.0000 1.0000 1.0000 1.0000
V-L Flowrate (kgmol/hr) 52,781 41,772 75 10,706 0 10,782 0 4,996 18,078 0 12,563 51,861 50,047 5,784 44,263 14,236 49,057V-L Flowrate (kg/hr) 1,525,100 1,175,157 2,411 343,429 0 194,238 0 218,763 269,759 0 226,325 1,125,197 1,092,505 126,252 966,253 256,473 1,074,531Solids Flowrate (kg/hr) 0 0 0 0 709,841 0 515,603 0 355,226 71,414 0 0 0 0 0 0 0
Temperature (°C) 6 26 32 32 4 33 71 75 18 1,427 216 260 215 215 215 288 35Pressure (MPa, abs) 0.09 0.11 0.86 0.86 0.10 0.35 0.09 5.62 5.62 4.24 8.27 3.89 3.756 3.76 3.76 4.14 3.38Enthalpy (kJ/kg) 15.71 30.53 26.94 26.94 --- 147.56 --- 18.43 4,187.50 --- 1,017.87 1,092.18 963.754 963.75 963.75 2,937.10 40.27Density (kg/m3) 1.1 1.3 11.0 11.0 --- 986.2 --- 105.6 42.3 --- 782.0 19.3 20.5 20.5 20.5 18.2 29.5V-L Molecular Weight 28.895 28.133 32.078 32.078 --- 18.015 --- 43.785 14.922 --- 18.015 21.696 21.830 21.830 21.830 18.015 21.904
V-L Flowrate (lbmol/hr) 116,361 92,091 166 23,603 0 23,770 0 11,015 39,856 0 27,697 114,334 110,335 12,750 97,584 31,386 108,153V-L Flowrate (lb/hr) 3,362,271 2,590,777 5,316 757,131 0 428,222 0 482,290 594,716 0 498,960 2,480,636 2,408,561 278,337 2,130,224 565,427 2,368,935Solids Flowrate (lb/hr) 0 0 0 0 1,564,932 0 1,136,710 0 783,138 157,442 0 0 0 0 0 0 0
Temperature (°F) 42 78 90 90 40 91 160 166 64 2,600 420 500 418 418 418 550 95Pressure (psia) 13.0 16.4 125.0 125.0 13.8 50.3 13.5 815.0 815.0 614.7 1,200.0 564.7 544.7 544.7 544.7 600.0 489.7Enthalpy (Btu/lb) 6.8 13.1 11.6 11.6 --- 63.4 --- 7.9 1,800.3 --- 437.6 469.6 414.3 414.3 414.3 1,262.7 17.3Density (lb/ft3) 0.070 0.080 0.685 0.685 --- 61.569 --- 6.593 2.642 --- 48.817 1.204 1.282 1.282 1.282 1.135 1.842
A - Reference conditions are 32.02 F & 0.089 PSIA

Cost and Performance Baseline for Coal-to-SNG and Ammonia (Volume 2)
240
Exhibit 5-25 Case 8 Stream Table, North Dakota Lignite Coal to SNG with Carbon Sequestration (continued) 18 19 20 21 22 23 24 25 26 27 28 29 30 31 32
V-L Mole FractionAr 0.0022 0.0034 0.0034 0.0034 0.0118 0.0000 0.0138 0.0138 0.0001 0.0007 0.0000 0.0016 0.0023 0.0000 0.0000CH4 0.0000 0.0000 0.0000 0.0000 0.8138 0.0000 0.9552 0.9552 0.0000 0.0000 0.0000 0.0000 0.0000 0.0000 0.0000CO 0.1532 0.2348 0.2348 0.2348 0.0000 0.0000 0.0000 0.0000 0.0037 0.0545 0.0000 0.0832 0.0072 0.0000 0.0000CO2 0.3758 0.0444 0.0444 0.0444 0.1479 0.9845 0.0026 0.0026 0.9921 0.6020 0.0000 0.4928 0.8058 0.0000 0.0000COS 0.0001 0.0000 0.0000 0.0000 0.0000 0.0000 0.0000 0.0000 0.0001 0.0019 0.0000 0.0003 0.0000 0.0000 0.0000H2 0.4609 0.7121 0.7121 0.7121 0.0065 0.0000 0.0077 0.0077 0.0039 0.1045 0.0000 0.0519 0.1788 0.0000 0.0000H2O 0.0017 0.0001 0.0001 0.0001 0.0023 0.0155 0.0000 0.0000 0.0001 0.0393 0.0000 0.3670 0.0009 1.0000 1.0000H2S 0.0028 0.0000 0.0000 0.0000 0.0000 0.0000 0.0000 0.0000 0.0000 0.1964 0.0000 0.0015 0.0041 0.0000 0.0000N2 0.0033 0.0051 0.0051 0.0051 0.0176 0.0000 0.0207 0.0207 0.0000 0.0005 0.0000 0.0007 0.0009 0.0000 0.0000NH3 0.0000 0.0000 0.0000 0.0000 0.0000 0.0000 0.0000 0.0000 0.0000 0.0000 0.0000 0.0000 0.0000 0.0000 0.0000O2 0.0000 0.0000 0.0000 0.0000 0.0000 0.0000 0.0000 0.0000 0.0000 0.0000 0.0000 0.0000 0.0000 0.0000 0.0000SO2 0.0000 0.0000 0.0000 0.0000 0.0000 0.0000 0.0000 0.0000 0.0000 0.0000 0.0000 0.0011 0.0000 0.0000 0.0000
Total 1.0000 1.0000 1.0000 1.0000 1.0000 1.0000 1.0000 1.0000 1.0000 1.0000 0.0000 1.0000 1.0000 1.0000 1.0000
V-L Flowrate (kgmol/hr) 49,634 31,923 183 31,740 9,214 1,364 7,850 7,850 15,705 698 0 813 576 40,673 58,897V-L Flowrate (kg/hr) 1,095,450 327,218 1,874 325,344 189,670 59,465 130,205 130,205 687,644 24,974 0 25,168 20,919 732,739 1,061,040Solids Flowrate (kg/hr) 0 0 0 0 0 0 0 0 0 0 4,385 0 0 0 0
Temperature (°C) 34 31 80 31 35 35 35 35 35 48 175 232 21 566 33Pressure (MPa, abs) 3.31 3.24 5.10 3.24 2.77 0.14 2.627 6.202 15.272 0.16 0.1 0.085 3.306 12.512 0.827Enthalpy (kJ/kg) 38.97 83.90 228.55 83.90 39.77 45.02 47.726 12.794 -209.181 97.84 --- 834.709 -8.186 3,495.174 120.935Density (kg/m3) 29.2 13.0 17.4 13.0 23.6 2.4 17.8 44.6 780.4 2.2 5,286.1 0.6 56.4 34.9 995.1V-L Molecular Weight 22.071 10.250 10.250 10.250 20.586 43.607 16.587 16.587 43.785 35.794 --- 30.956 36.297 18.015 18.015
V-L Flowrate (lbmol/hr) 109,424 70,378 403 69,975 20,313 3,006 17,306 17,306 34,623 1,538 0 1,792 1,271 89,669 129,845V-L Flowrate (lb/hr) 2,415,054 721,392 4,131 717,261 418,150 131,097 287,053 287,053 1,515,996 55,059 0 55,485 46,119 1,615,412 2,339,194Solids Flowrate (lb/hr) 0 0 0 0 0 0 0 0 0 0 9,667 0 0 0 0
Temperature (°F) 94 87 177 87 95 95 95 95 95 119 347 450 69 1,050 91Pressure (psia) 479.5 469.6 740.0 469.6 401.1 20.1 381.0 899.5 2,215.0 23.7 17.3 12.3 479.5 1,814.7 120.0Enthalpy (Btu/lb) 16.8 36.1 98.3 36.1 17.1 19.4 20.5 5.5 -89.9 42.1 --- 358.9 -3.5 1,502.7 52.0Density (lb/ft3) 1.822 0.811 1.089 0.811 1.473 0.148 1.114 2.787 48.716 0.137 330 0.039 3.524 2.177 62.123

Cost and Performance Baseline for Coal-to-SNG and Ammonia (Volume 2)
241
5.2.2 System assumptions for Cases 7 and 8, Siemens gasifier using NDL coal with and without carbon sequestration, are compiled in
Key System Assumptions
Exhibit 5-26.
Exhibit 5-26 Cases 7 and 8 Plant Study Configuration Matrix
Case Case 7 Case 8 Gasifier Pressure, MPa (psia) 4.2 (615) 4.2 (615) O2:Coal Ratio, kg O2/kg dry coal 0.657 0.657 Carbon Conversion, % 99.9 99.9 Syngas HHV at Gasifier Outlet, kJ/Nm3 (Btu/scf) 9,350 (251) 9,350 (251)
Steam Cycle, MPa/°C/°C (psig/°F/°F)
12.4/566/536 (1800/1050/997)
12.4/566/536 (1800/1050/997)
Condenser Pressure, mm Hg (in Hg) 36 (1.4) 36 (1.4)
Combustion Turbine N/A N/A Gasifier Technology Siemens Siemens Oxidant 99 vol% Oxygen 99 vol% Oxygen Coal ND Lignite ND Lignite Coal Feed Moisture Content, % 36.08 36.08 COS Hydrolysis No No Water Gas Shift Yes Yes H2S Separation Selexol (1st Stage) Selexol (1st Stage) Sulfur Removal, % 98.5 99.9 CO2 Separation Selexol (2nd Stage) Selexol (2nd Stage) CO2 Sequestration, % N/A 67.2
Sulfur Recovery Claus Plant with Tail Gas
Treatment / Elemental Sulfur
Claus Plant with Tail Gas Treatment / Elemental
Sulfur
Methanation System Based on Haldor Topsoe TREMP™ Process
Based on Haldor Topsoe TREMP™ Process
Particulate Control Scrubber and AGR Absorber
Scrubber and AGR Absorber
Mercury Control Carbon Bed Carbon Bed NOx Control N/A N/A
Balance of Plant and Sparing Philosophy The balance of plant assumptions and sparing philosophy are common to all cases and are presented in Section 4.1.3.

Cost and Performance Baseline for Coal-to-SNG and Ammonia (Volume 2)
242
5.2.3 The Siemens SNG plant without and with carbon sequestration and using NDL coal produces a net output of 52 Bscf/year at 90 percent capacity. The HHV conversion efficiency of both the non-sequestration case and the sequestration case is 61.5 percent.
Cases 7 and 8 Performance Results
Overall performance for the two plants is summarized in Exhibit 5-27, which includes auxiliary power requirements and production values. The ASU accounts for approximately 58 percent of the total auxiliary load in non-sequestration case and 48 percent in the sequestration case, distributed between the main air compressor, the oxygen compressor, and ASU auxiliaries. CO2 compression accounts for about 19 percent of the auxiliary load in Case 8. The AGR process accounts for about 12 percent and 10 percent of the auxiliary load for the non-sequestration and sequestration cases, respectively. The WTA coal drying process accounts for 10 percent in the non-sequestration case and 8 percent in the sequestration case. All other individual auxiliary loads are less than 3 percent of the total.

Cost and Performance Baseline for Coal-to-SNG and Ammonia (Volume 2)
243
Exhibit 5-27 Cases 7 and 8 Plant Performance Summary
POWER SUMMARY (Gross Power at Generator Terminals, kWe) Case 7 Case 8
Steam Turbine Power 305,800 310,500 TOTAL POWER, kWe 305,800 310,500
AUXILIARY LOAD SUMMARY, kWe Coal Handling 990 990
Coal Milling 7,300 7,300 Slag Handling 1,860 1,860
WTA Coal Dryer Compressor 25,020 25,020 WTA Coal Dryer Auxiliaries 880 880
Air Separation Unit Auxiliaries 1,000 1,000 Air Separation Unit Main Air Compressor 127,710 127,650
Oxygen Compressor 21,850 21,850 CO2 Compressor 0 58,880
CO2 Solid Feed System Compressor 6,880 330 SNG Compressors 5,680 5,680
Methanation Plant Recycle Compressor 4,420 4,340 Gasifier Pilot Fuel Compressor 80 80
Boiler Feedwater Pumps 4,700 4,730 Condensate Pump 370 390
Quench Water Pump 570 570 Circulating Water Pump 4,550 5,250
Ground Water Pumps 400 460 Cooling Tower Fans 2,790 3,420
Air Cooled Condenser Fans 3,440 3,820 Scrubber Pumps 940 940
Acid Gas Removal 31,200 31,200 Steam Turbine Auxiliaries 100 100
Claus Plant/TGTU Auxiliaries 250 250 Claus Plant TG Recycle Compressor 2,130 2,150
Miscellaneous Balance of Plant2 3,000 3,000 Transformer Losses 1,630 1,790
TOTAL AUXILIARIES, kWe 259,740 313,930 NET POWER, kWe 46,060 -3,430
SNG Production Rate, MNm3/hr (Mscf/hr) 185.9 (6,568) 185.9 (6,568) Capacity Factor 90% 90%
Net Exported Power Efficiency (HHV) 1.5% -0.1% SNG Conversion Efficiency (HHVproduct/HHVcoal), % 61.5% 61.5%
Coal to SNG Product Yield, MNm3SNG/tonnecoal
(MscfSNG/toncoal) 0.25 (8.4) 0.25 (8.4)
Coal Feed Flow Rate, kg/hr (lb/hr) 709,841 (1,564,932) 709,841 (1,564,932) Thermal Input,1 kWth 3,034,796 3,034,796
Condenser Cooling Duty, GJ/hr (MMBtu/hr) 1,635 (1,550) 1,699 (1,610) Raw Water Withdrawal, m3/min (gpm) 16.7 (4,421) 19.4 (5,131)
Raw Water Consumption, m3/min (gpm) 12.7 (3,350) 14.8 (3,901) 1 - HHV of NDL coal is 15,391 kJ/kg (6,617 Btu/lb) 2 - Includes plant control systems, lighting, HVAC, and miscellaneous low voltage loads

Cost and Performance Baseline for Coal-to-SNG and Ammonia (Volume 2)
244
Environmental Performance The environmental targets for emissions of Hg, NOx, SO2, and PM were presented in Section 2.5. A summary of the plant air emissions for Cases 7 and 8 is presented in Exhibit 5-28.
Exhibit 5-28 Cases 7 and 8 Air Emissions
kg/GJ (lb/106 Btu)
Tonne/year (ton/year)
90% capacity factor Case 7 Case 8 Case 7 Case 8
SO2 0.010
(0.024) 0.000
(0.000) 886 (977) 0 (0)
NOX Negligible Negligible Negligible Negligible
Particulates 0.003 (0.0071)
0.003 (0.0071) 263 (290) 263 (290)
Hg 2.41E-7 (5.60E-7)
2.41E-7 (5.60E-7)
0.021 (0.023)
0.021 (0.023)
CO2 63.2
(147.0) 0.4 (0.9) 5,443,126 (6,000,019)
34,303 (37,813)
The low level of SO2 emissions in Case 8 is achieved by capture of the sulfur in the gas by the two-stage Selexol AGR process and co-sequestration with the CO2 product. Because the WTA coal drying process does not include combustion of SNG, there are no SO2 emissions associated with drying. The clean syngas exiting the AGR process has a sulfur concentration of approximately 2 ppmv in both cases. The H2S-rich regeneration gas from the AGR system is fed to a Claus plant, producing elemental sulfur. The tail gas is hydrogenated and recycled to the AGR system. The higher sulfur emissions in Case 7 are due to the sulfur contained in the CO2-rich stream from the Selexol process, which is vented rather than sequestered.
NOX emissions are negligible because no CT is used for power generation.
Particulate discharge to the atmosphere is limited to extremely low values by the use of a syngas scrubber and the gas washing effect of the AGR absorber. The particulate emissions represent filterable particulate only.
Ninety five percent of mercury is captured from the syngas by an activated carbon bed. CO2 emissions represent the uncontrolled (Case 7) and controlled (Case 8) discharge from the process.
The carbon balance for the two cases is shown in Exhibit 5-29. The carbon input to the plant consists of carbon in the air in addition to carbon in the coal. Carbon in the air is not used in the carbon capture equation below, but it is not neglected in the balance since Aspen accounts for air components throughout. Carbon leaves the plant as unburned carbon in the slag, CO2 in the stack gas, ASU vent gas, SNG product, and the CO2 product (either vented or sequestered).

Cost and Performance Baseline for Coal-to-SNG and Ammonia (Volume 2)
245
Exhibit 5-29 Cases 7 and 8 Carbon Balance
Carbon In, kg/hr (lb/hr) Carbon Out, kg/hr (lb/hr) Case 7 Case 8 Case 7 Case 8
Coal 280,768 (618,988)
280,768 (618,988) Slag 1,404
(3,095) 1,404
(3,095)
Air (CO2) 208 (458) 208 (458) SNG
Purification Off-Gas
16,113 (35,522) 0 (0)
ASU Vent 208 (458) 208 (458)
SNG 90,390 (199,276)
90,309 (199,098)
CO2 Vent 142,939 (315,126)
187,863 (414,167)
CO2 Feed Vent
29,923 (65,969)
1,192 (2,628)
Stack N/A 0 (0)
Total 280,976 (619,447)
280,976 (619,447) Total 280,976
(619,447) 280,976
(619,447)
The carbon capture efficiency is presented in two distinct ways. The first way defines capture as the amount of carbon in the CO2 product for sequestration relative to the amount of carbon in the coal less carbon contained in the slag, and is represented by the following fraction:
(Carbon in Product for Sequestration)/[(Carbon in the Coal)-(Carbon in Slag)] or
Non sequestration (Case 7)
(414,167)/(618,988 – 3,095)*100 = 67.2% (Case 8)
The second way does not penalize the production facility for the carbon converted to SNG product, as the end use of the SNG is unknown. In a carbon constrained scenario, the SNG may or may not be used in a scenario where CCS is implemented. For this method, the burden of carbon mitigation falls on the end-user. This method is represented by the following fraction:
[(Carbon in Product for Sequestration) + (Carbon in SNG Product)]/[(Carbon in the Coal)-(Carbon in Slag)] or
(0 + 199,276)/(618,988 – 3,095)*100 = 32.4% (Case 7)
(414,167 + 199,098)/(618,988 – 3,095)*100 = 99.6% (Case 8)
Exhibit 5-30 shows the sulfur balance for the plant. Sulfur input comes solely from the sulfur in the coal. Sulfur output includes the sulfur recovered in the Claus plant, sulfur in the SNG

Cost and Performance Baseline for Coal-to-SNG and Ammonia (Volume 2)
246
product, sulfur emitted in the stack gas, and sulfur co-sequestered with the CO2 product. Sulfur in the slag is considered negligible. The total sulfur capture is represented by the following fraction:
(Sulfur byproduct + Sulfur in CO2 product)/Sulfur in the coal or (9,660 + 0)/9,803 = 98.5 percent (Case 7)
(9,667 + 130)/9,803 = 99.9 percent (Case 8)
Exhibit 5-30 Cases 7 and 8 Sulfur Balance
Sulfur In, kg/hr (lb/hr) Sulfur Out, kg/hr (lb/hr) Case 7 Case 8 Case 7 Case 8
Coal 4,447 (9,803) 4,447 (9,803) Elemental Sulfur
4,382 (9,660)
4,385 (9,667)
SNG 2 (5) 2 (5)
CO2 Vent Streams/Stack 63 (138) 0.4 (1)
CO2 Product N/A 59 (130)
Total 4,447 (9,803) 4,447 (9,803) Total 4,447 (9,803)
4,447 (9,803)
Exhibit 5-31 shows the overall water balance for the plant. Water demand represents the total amount of water required for a particular process. Some water is recovered within the process, primarily as syngas condensate, and is re-used as internal recycle. The difference between demand and recycle is raw water withdrawal. Raw water withdrawal is defined as the water removed from the ground or diverted from a surface-water source for use in the plant and was assumed to be provided 50 percent by a POTW and 50 percent from groundwater. Raw water withdrawal can be represented by the water metered from a raw water source and used in the plant processes for any and all purposes, such as cooling tower makeup, BFW makeup, quench system makeup, and slag handling makeup. The difference between water withdrawal and process water discharge is defined as water consumption and can be represented by the portion of the raw water withdrawn that is evaporated, transpired, incorporated into products or otherwise not returned to the water source from which it was withdrawn. Water consumption represents the net impact of the plant process on the water source.

Cost and Performance Baseline for Coal-to-SNG and Ammonia (Volume 2)
247
Exhibit 5-31 Cases 7 and 8 Water Balance
Case 7 Case 8 Water Demand, m3/min (gpm)
Slag Handling 1.5 (409) 1.5 (409) Quench/Wash 3.8 (998) 3.8 (998) Condenser Makeup 4.5 (1,189) 4.5 (1,191) Gasifier Steam 0.0 (0) 0.0 (0) Shift Steam 4.3 (1,131) 4.3 (1,131) BFW Makeup 0.22 (59) 0.23 (60) Cooling Tower 17.7 (4,683) 20.4 (5,392)
Total 27.6 (7,279) 30.2 (7,990) Internal Recycle, m3/min (gpm)
Slag Handling 1.5 (409) 1.5 (409) Quench/Wash 3.8 (998) 3.8 (998) Condenser Makeup 0.0 (0) 0.0 (0) Cooling Tower 5.5 (1,451) 5.5 (1,452) Water from Coal Drying 3.2 (856) 3.2 (856) BFW Blowdown 0.22 (59) 0.23 (60) SWS Blowdown 0.67 (177) 0.67 (177) SWS Excess 1.4 (359) 1.4 (359)
Total 10.8 (2,858) 10.8 (2,859) Raw Water Withdrawal, m3/min (gpm)
Slag Handling 0.0 (0) 0.0 (0) Quench/Wash 0.0 (0) 0.0 (0) Condenser Makeup 4.5 (1,189) 4.5 (1,191) Gasifier Steam 0.0 (0) 0.0 (0) Shift Steam 4.3 (1,131) 4.3 (1,131) BFW Makeup 0.22 (59) 0.23 (60) Cooling Tower 12.2 (3,232) 14.9 (3,940)
Total 16.7 (4,421) 19.4 (5,131) Process Water Discharge, m3/min (gpm)
SWS Blowdown 0.07 (18) 0.07 (18) Cooling Tower Blowdown 4.0 (1,053) 4.6 (1,213)
Total 4.1 (1,071) 4.7 (1,230) Raw Water Consumption, m3/min (gpm)
Slag Handling 0.0 (0) 0.0 (0) Quench/Wash 0.0 (0) 0.0 (0) SWS Blowdown -0.07 (-18) -0.07 (-18) Condenser Makeup 4.5 (1,189) 4.5 (1,191) Cooling Tower 8.2 (2,179) 10.3 (2,728)
Total 12.7 (3,350) 14.8 (3,901)

Cost and Performance Baseline for Coal-to-SNG and Ammonia (Volume 2)
248
Heat and Mass Balance Diagrams Heat and mass balance diagrams are shown for the following subsystems in Exhibit 5-32 through Exhibit 5-37:
• Coal gasification and ASU
• ,Syngas cleanup (including sulfur recovery and tail gas recycle)
• Methanation, SNG purification, SNG compression and power cycle
An overall plant energy balance is provided in tabular form in Exhibit 5-38 for the two cases.

Cost and Performance Baseline for Coal-to-SNG and Ammonia (Volume 2)
249
Exhibit 5-32 Case 7 Gasification and ASU Heat and Mass Balance
Raw Syngasto Scrubber
NOTES:
1. ENTHALPY REFERENCE POINT IS NATURAL STATE AT 32 °F AND 0.08865 PSIA
DOE/NETL
LIGNITE SNG PLANTCASE 7
HEAT AND MATERIAL FLOW DIAGRAM
COST AND PERFORMANCE BASELINE VOL. 2CASE 7
ASU AND GASIFICATION
DWG. NO.
BL-HMB-CS-7-PG-1
PLANT PERFORMANCE SUMMARY
LEGEND
P ABSOLUTE PRESSURE, PSIAF TEMPERATURE, °FW FLOWRATE, LBM/HR H ENTHALPY, BTU/LBM
MWE POWER, MEGAWATTS ELECTRICAL
PAGES
1 OF 3
Ambient Air
IntercooledAir Compressor
ElevatedPressure
ASU
IntercooledOxygen Compressor
Milled Coal
ASUVent
SlagRemoval
Slag
GROSS PLANT POWER: 306 MWEAUXILIARY LOAD: 260 MWENET PLANT POWER: 46 MWESNG PRODUCTION: 6,568 MSCF/HR
Dried CoalCoal
Feeding
CO2 to Lock Hoppers
BoostCompressor
Siemens Gasifier
1,564,932 W
3,363,825 W42.0 T13.0 P6.8 H
757,185 W90.0 T
125.0 P11.6 H
757,185 W516.2 T740.0 P107.1 H
1,981,729 W2,600.0 T
604.7 P1,051.8 H
157,442 W
ENG UNITS
To Claus Plant
5,614 W90.0 T
125.0 P11.6 H
WTADryer
Vapor Compressor
Condensate to Cooling Tower
2,591,975 W78.1 T16.4 P13.1 H
428,222 W225.0 T13.8 P
1,160.0 H
428,222 W90.5 T50.3 P14.0 H
SyngasQuenchCooler
SHSteam
4
6
1
75
3
10
2
Quench Water
12
Lock HopperVent
241,145 W
482,290 W168.0 T815.0 P
9.4 H
8
482,290 W60.0 T
149.7 P1.7 H
11
499,149 W
SHSteam
SHSteam
2,480,878 W499.7 T564.7 P469.7 H
Air
Oxygen
Nitrogen
Coal/Char/Slurry/Slag
Sour Gas
Sour Water
Water
Steam
CO2
Tailgas
Pilot Fuel20
4,131 W176.6 T740.0 P98.3 H
1,377,855 W64.9 T
815.0 P1,798.7 H
1,136,710 W
9
HPBFW

Cost and Performance Baseline for Coal-to-SNG and Ammonia (Volume 2)
250
Exhibit 5-33 Case 7 Gas Cleanup Heat and Mass Balance
Mercury Removal
KnockOut
DrumRaw Syngasto Scrubber
SourDrum
To Water Treatment
Makeup Water
CatalyticReactorBeds
HighTemperature
Shift
Blowdown
FromASULP CO2
ShiftSteam
HP BFW
SyngasCoolers
SourStripper
Two-StageSelexol
Clean Gas
CO2
Acid Gas
SyngasScrubber Condensate
To DeaeratorCondensate
565,276 W550.0 T600.0 P
1,270.5 H
2,408,892 W418.3 T544.7 P414.5 H
2,480,878 W499.7 T564.7 P469.7 H
2,408,892 W362.9 T554.7 P393.7 H
2,415,550 W93.8 T
474.7 P16.8 H
721,834 W87.0 T
469.6 P36.1 H
55,324 W119.0 T23.7 P42.1 H
1,156,103 W41.7 T16.7 P3.3 H
883,166 W339.3 T115.0 P339.2 H
2,974,167 W534.6 T524.7 P419.6 H
717,703 W87.0 T
469.6 P36.1 H
9,660 W
4,769 W293.1 T65.0 P
1,032.4 H
5,614 W90.0 T
125.0 P11.6 H
NOTES:
1. ENTHALPY REFERENCE POINT IS NATURAL STATE AT 32 °F AND 0.08865 PSIA
DOE/NETL
LIGNITE SNG PLANTCASE 7
HEAT AND MATERIAL FLOW DIAGRAM
COST AND PERFORMANCE BASELINE VOL. 2CASE 7
GAS CLEANUP
DWG. NO.
BL-HMB-CS-7-PG-2
PLANT PERFORMANCE SUMMARY
LEGEND
P ABSOLUTE PRESSURE, PSIAF TEMPERATURE, °FW FLOWRATE, LBM/HR H ENTHALPY, BTU/LBM
MWE POWER, MEGAWATTS ELECTRICAL
Air
Oxygen
Nitrogen
Coal/Char/Slurry/Slag
Synthesis Gas
PAGES
2 OF 3
Sour Gas
Sour Water
Water
Steam
GROSS PLANT POWER: 306 MWEAUXILIARY LOAD: 260 MWENET PLANT POWER: 46 MWESNG PRODUCTION: 6,568 MSCF/HR
2,130,426 W418.3 T544.7 P414.5 H
278,465 W
19
17
12
29
CO2
Tailgas
13
14
15
16
2,974,167 W863.9 T534.7 P559.6 H
2,369,194 W95.0 T
484.7 P17.4 H
High TemperatureMethanation Reactor
Pre-heater
Tail Gas Cleanup Unit
3
18
CO2 to LockHoppers
VentedCO2 Product
Claus Plant
Tail Gas
Furnace
Sulfur
28
27
HP CO2
26
1,003,639 W42.0 T16.7 P3.5 H
634,754 W60.0 T
149.7 P1.7 H
482,290 W60.0 T
149.7 P1.7 H
Syngas toMethanation
BoostCompressor
4,131 W
Pilot Fuelto Gasifier
4,131 W176.6 T740.0 P98.3 H
20
21
Condensatefrom Methnation
HT ShiftPre-heater
56,047 W450.0 T12.3 P
359.7 H
30
46,356 W69.1 T
484.5 P-4.1 H
Tail GasCompressor

Cost and Performance Baseline for Coal-to-SNG and Ammonia (Volume 2)
251
Exhibit 5-34 Case 7 Methanation and Power Block Heat and Mass Balance
Steam Seal Regulator
65 PSIA HeaderSteam Injection
To Gasifier
Make-up
GlandSteam
CondenserCondensate to Preheating
CondensatePump
2,261,180 W90.0 T0.7 P
57.9 H
612,684 W
1,621,472 W1,050.0 T1,814.7 P1,510.4 H
2,261,180 W91.5 T
120.0 P59.8 H
1,400 W
1,400 W212.0 T14.7 P
179.9 H
0 W--- T--- P
0.0 H
NOTES:
1. ENTHALPY REFERENCE POINT IS NATURAL STATE AT 32 °F AND 0.08865 PSIA
DOE/NETL
LIGNITE SNG PLANTCASE 7
HEAT AND MATERIAL FLOW DIAGRAM
COST AND PERFORMANCE BASELINE VOL. 2CASE 7
METHANATION AND POWER BLOCK
DWG. NO.
BL-HMB-CS-7-PG-3
PLANT PERFORMANCE SUMMARY
LEGEND
P ABSOLUTE PRESSURE, PSIAF TEMPERATURE, °FW FLOWRATE, LBM/HR H ENTHALPY, BTU/LBM
MWE POWER, MEGAWATTS ELECTRICAL
Air
Oxygen
Nitrogen
Coal/Char/Slurry/Slag
Synthesis Gas
PAGES
3 OF 3
Sour Gas
Sour Water
Water
Steam
GROSS PLANT POWER: 306 MWEAUXILIARY LOAD: 260 MWENET PLANT POWER: 46 MWESNG PRODUCTION: 6,568 MSCF/HR
Flue Gas
Deaerator
HT Reactor
LP TURBINE GENERATORHP
TURBINEIP
TURBINE
HOT WELL
AIR-COOLED CONDENSER CONDENSER
IP Pump
To Shift SteamProduction
LP Pump
250 PSIAAttemperating Water
HP Pump
RecycleCompressor
Syngas fromSelexol Unit
KnockOut
Drum
Molecular Sieve
Purification Unit
Multistage Intercooled
SNG Compressor
Clean UpReatorHT Reactor
PurificationOff-Gas
SNGProduct
Condensate toSour Drum
ReactorPre-heater
SH Steam fromSyngas Cooler
IP BFW
SH Shift Steam
IP/LP BFW
IP/LP Steam IP Steam IP BFW
31
32
1,647,925 W
717,703 W87.0 T
469.6 P36.1 H
21
572.0 T452.5 P620.4 H
584.8 T475.0 P627.6 H
572.0 T469.6 P557.7 H
1,283.5 T462.5 P
1,077.8 H
2,026,054 W
1,028.0 T441.8 P945.4 H
392.0 T431.8 P570.0 H
639.2 T421.1 P752.2 H
335.0 T411.1 P402.9 H
418,290 W95.0 T
401.1 P17.1 H
130,998 W95.0 T20.1 P19.4 H 287,291 W
95.0 T381.0 P20.5 H
95.0 T899.5 P
5.5 H
622,454 W282.3 T450.0 P251.9 H
618,290 W
71,800 W298.0 T65.0 P
1,178.6 H
1,564,780 W504.1 T65.0 P
1,284.1 H
IP BFW
17,391 W282.1 T379.0 P251.6 H
22
23 24 25
10,917 W658.1 T18.0 P
1,362.6 H
To Syngas Cooler
Reheater(Syngas Cooler)
1,646,541 W997.4 T501.4 P
1,518.5 H

Cost and Performance Baseline for Coal-to-SNG and Ammonia (Volume 2)
252
Exhibit 5-35 Case 8 Gasification and ASU Heat and Mass Balance
Raw Syngasto Scrubber
NOTES:
1. ENTHALPY REFERENCE POINT IS NATURAL STATE AT 32 °F AND 0.08865 PSIA
DOE/NETL
LIGNITE SNG PLANTW/ CO2 CAPTURE
CASE 8
HEAT AND MATERIAL FLOW DIAGRAM
COST AND PERFORMANCE BASELINE VOL. 2CASE 8
ASU AND GASIFICATION
DWG. NO.
BL-HMB-CS-8-PG-1
PLANT PERFORMANCE SUMMARY
LEGEND
P ABSOLUTE PRESSURE, PSIAF TEMPERATURE, °FW FLOWRATE, LBM/HR H ENTHALPY, BTU/LBM
MWE POWER, MEGAWATTS ELECTRICAL
PAGES
1 OF 3
Ambient Air
IntercooledAir Compressor
ElevatedPressure
ASU
IntercooledOxygen Compressor
Milled Coal
ASUVent
SlagRemoval
Slag
GROSS PLANT POWER: 311 MWEAUXILIARY LOAD: 314 MWENET PLANT POWER: -3 MWESNG PRODUCTION: 6,567 MSCF/HR
Dried CoalCoal
Feeding
CO2 to Lock Hoppers
BoostCompressor
Siemens Gasifier
1,564,932 W
3,362,271 W42.0 T13.0 P6.8 H
757,131 W90.0 T
125.0 P11.6 H
757,131 W516.2 T740.0 P107.1 H
1,981,675 W2,600.0 T
604.7 P1,051.4 H
157,442 W
ENG UNITS
To Claus Plant
5,316 W90.0 T
125.0 P11.6 H
2,590,777 W78.1 T16.4 P13.1 H
SyngasQuenchCooler
SHSteam
4
1
75
3
10
2
Quench Water
12
9,620 W
482,290 W166.3 T815.0 P
7.9 H
8
482,290 W152.5 T750.0 P
5.7 H
11
498,960 W
SHSteam
SHSteam
2,480,636 W499.7 T564.7 P469.6 H
Air
Oxygen
Nitrogen
Coal/Char/Slurry/Slag
Sour Gas
Sour Water
Water
Steam
CO2
Tail Gas/Flue Gas
Pilot Fuel20
428,222 W90.5 T50.3 P63.4 H
1,377,855 W
WTA Coal Dryer
Synthesis Gas
1,136,710 W
9
HP Vent toCO2 Compressor
LP Vent toCO2 Compressor
192,163 W 39,362 W
Condensate toCooling Tower
4,131 W176.6 T740.0 P98.3 H
Vapor Compressor
428,222 W225.0 T13.8 P
1,209.4 H
Lock HopperAtmospheric Vent
6
HPBFW

Cost and Performance Baseline for Coal-to-SNG and Ammonia (Volume 2)
253
Exhibit 5-36 Case 8 Gas Cleanup Heat and Mass Balance
SNG PurificationOff Gas
Mercury Removal
KnockOut
DrumRaw Syngasto Scrubber
SourDrum
To Water Treatment
Makeup Water
CatalyticReactorBeds
HighTemperature
Shift
Blowdown
FromASU
ShiftSteam
HP BFW
SyngasCoolers
SourStripper
Two-StageSelexol
Clean Gas
CO2
Acid Gas
SyngasScrubber Condensate
To DeaeratorCondensate
565,427 W550.0 T600.0 P
1,270.5 H
2,408,561 W418.3 T544.7 P414.3 H
2,480,636 W499.7 T564.7 P469.6 H
2,408,561 W362.9 T554.7 P393.5 H
2,415,054 W93.8 T
479.5 P16.8 H
721,392 W87.0 T
469.6 P36.1 H
55,059 W119.0 T23.7 P42.1 H
482,290 W152.5 T750.0 P
5.7 H
882,744 W339.3 T115.0 P339.2 H
2,973,988 W494.0 T519.7 P402.7 H
717,261 W87.0 T
469.6 P36.1 H
9,667 W
4,779 W293.1 T65.0 P
1,030.0 H
5,316 W90.0 T
125.0 P11.6 H
NOTES:
1. ENTHALPY REFERENCE POINT IS NATURAL STATE AT 32 °F AND 0.08865 PSIA
DOE/NETL
LIGNITE SNG PLANTW/ CO2 CAPTURE
CASE
HEAT AND MATERIAL FLOW DIAGRAM
COST AND PERFORMANCE BASELINE VOL. 2CASE 8
GAS CLEANUP
DWG. NO.
BL-HMB-CS-8-PG-2
PLANT PERFORMANCE SUMMARY
LEGEND
P ABSOLUTE PRESSURE, PSIAF TEMPERATURE, °FW FLOWRATE, LBM/HR H ENTHALPY, BTU/LBM
MWE POWER, MEGAWATTS ELECTRICAL
Air
Oxygen
Nitrogen
Coal/Char/Slurry/Slag
Synthesis Gas
PAGES
2 OF 3
Sour Gas
Sour Water
Water
Steam
GROSS PLANT POWER: 311 MWEAUXILIARY LOAD: 314 MWENET PLANT POWER: -3 MWESNG PRODUCTION: 6,567 MSCF/HR
2,130,224 W418.3 T544.7 P414.3 H
19
17
12
29
CO2
Tail Gas/Flue Gas
13
14
16
278,337 W
2,368,935 W95.0 T
489.7 P17.3 H
High TemperatureMethanation Reactor
Pre-heater
Tail Gas Cleanup Unit
3
18
CO2 toSequestration
CO2 toLock Hoppers
Claus Plant
Tail Gas
Furnace
Sulfur
28
27
1,515,996 W
95.0 T2,215.0 P
-89.9 H
Syngas toMethanation
BoostCompressor
4,131 W
Pilot Fuelto Gasifier
4,131 W176.6 T740.0 P98.3 H
20
21
Condensatefrom Methnation
HT ShiftPre-heater
55,485 W450.0 T12.3 P
358.9 H
30 46,119 W69.3 T
479.5 P-3.5 H
23
Multistage Intercooled CO2
Compressor
26
HP CO2
LP LockHopper Vent HP Lock
Hopper Vent
LP CO2
131,097 W95.0 T20.1 P19.4 H
39,362 W
192,163 W
827,001 W67.4 T
149.7 P3.1 H
1,174,224 W49.1 T16.7 P5.4 HTail Gas
Compressor
15

Cost and Performance Baseline for Coal-to-SNG and Ammonia (Volume 2)
254
Exhibit 5-37 Case 8 Methanation and Power Block Heat and Mass Balance
Steam Seal Regulator
65 PSIA HeaderSteam Injection
Make-up
GlandSteam
CondenserCondensate to Preheating
CondensatePump
2,339,194 W90.0 T0.7 P
57.9 H
613,556 W
1,615,412 W1,050.0 T1,814.7 P1,510.4 H
2,339,194 W91.5 T
120.0 P59.8 H
1,400 W
1,400 W212.0 T14.7 P
179.9 H
NOTES:
1. ENTHALPY REFERENCE POINT IS NATURAL STATE AT 32 °F AND 0.08865 PSIA
DOE/NETL
LIGNITE SNG PLANTW/ CO2 CAPTURE
CASE 8
HEAT AND MATERIAL FLOW DIAGRAM
COST AND PERFORMANCE BASELINE VOL. 2CASE 8
METHANATION AND POWER BLOCK
DWG. NO.
BL-HMB-CS-8-PG-3
PLANT PERFORMANCE SUMMARY
LEGEND
P ABSOLUTE PRESSURE, PSIAF TEMPERATURE, °FW FLOWRATE, LBM/HR H ENTHALPY, BTU/LBM
MWE POWER, MEGAWATTS ELECTRICAL
Air
Oxygen
Nitrogen
Coal/Char/Slurry/Slag
Synthesis Gas
PAGES
3 OF 3
Sour Gas
Sour Water
Water
Steam
GROSS PLANT POWER: 311 MWEAUXILIARY LOAD: 314 MWENET PLANT POWER: -3 MWESNG PRODUCTION: 6,567 MSCF/HR
Flue Gas
Deaerator
HT Reactor
LP TURBINE GENERATORHP
TURBINEIP
TURBINE
HOT WELL
AIR-COOLED CONDENSER CONDENSER
IP Pump
To Shift SteamProduction
LP Pump
250 PSIAAttemperating Water
HP Pump
RecycleCompressor
Syngas fromSelexol Unit
KnockOut
Drum
Molecular Sieve
Purification Unit
Multistage Intercooled
SNG Compressor
Clean UpReatorHT Reactor
Purification Off-Gas(To CO2 Compressor)
SNGProduct
Condensate toSour Drum
ReactorPre-heater
SH Steam fromSyngas Cooler
IP BFW
SH Shift Steam
IP/LP BFW
IP/LP Steam IP Steam IP BFW
31
32
1,641,772 W
717,261 W87.0 T
469.6 P36.1 H
21
572.0 T452.5 P619.2 H
584.8 T475.0 P626.4 H
572.0 T469.6 P555.6 H
1,289.9 T462.5 P
1,081.3 H
1,979,439 W
1,036.0 T441.8 P949.3 H
392.0 T431.8 P568.5 H
648.7 T421.1 P757.3 H
335.0 T411.1 P402.9 H
418,150 W95.0 T
401.1 P17.1 H
131,097 W95.0 T20.1 P19.4 H 287,053 W
95.0 T381.0 P20.5 H
95.0 T899.5 P
5.5 H
700,960 W280.6 T450.0 P250.1 H
621,739 W
152,521 W298.0 T65.0 P
1,178.6 H
1,561,200 W504.1 T65.0 P
1,284.1 H
IP BFW
17,527 W280.4 T379.0 P249.9 H
22
23 24 25
10,917 W658.1 T18.0 P
1,362.6 H
To Syngas Cooler
Reheater(Syngas Cooler)
1,643,779 W997.4 T501.4 P
1,518.5 H

Cost and Performance Baseline for Coal-to-SNG and Ammonia (Volume 2)
255
Exhibit 5-38 Cases 7 and 8 Energy Balance
HHV Sensible + Latent Power Total Case 7 Case 8 Case 7 Case 8 Case 7 Case 8 Case 7 Case 8 Heat In, GJ/hr (MMBtu/hr)
Coal 10,925 (10,355)
10,925 (10,355) 6.3 (6.0) 7.9 (7.5) 0 (0) 0 (0) 10,932 (10,361) 10,933 (10,363)
ASU Air 0 (0) 0 (0) 24.0 (22.7) 24.0 (22.7) 0 (0) 0 (0) 24 (23) 24 (23) Raw Water Makeup 0 (0) 0 (0) 18.6 (17.6) 27.0 (25.6) 0 (0) 0 (0) 19 (18) 27 (26)
Auxiliary Power 0 (0) 0 (0) 0.0 (0.0) 0.0 (0.0) 935 (886) 1,130 (1,071) 935 (886) 1,130 (1,071)
Totals 10,925 (10,355)
10,925 (10,355) 48.9 (46.4) 58.9 (55.8) 935 (886) 1,130 (1,071) 11,909 (11,288) 12,114 (11,482)
Heat Out, GJ/hr (MMBtu/hr) ASU Intercoolers 0 (0) 0 (0) 334 (317) 334 (317) 0 (0) 0 (0) 334 (317) 334 (317) ASU Vent 0 (0) 0 (0) 35.9 (34.0) 35.9 (34.0) 0 (0) 0 (0) 36 (34) 36 (34) Slag 46 (44) 46 (44) 120.5 (114.2) 120.5 (114.2) 0 (0) 0 (0) 167 (158) 167 (158) Sulfur 41 (38) 41 (39) 0.5 (0.5) 0.5 (0.5) 0 (0) 0 (0) 41 (39) 41 (39) CO2 Intercoolers 0 (0) 0 (0) 0 (0) 351.7 (333.4) 0 (0) 0 (0) 0 (0) 352 (333) CO2 0 (0) 0 (0) 2.4 (2.3) -143.8 (-136.3) 0 (0) 0 (0) 2 (2) -144 (-136) Cooling Tower Blowdown 0 (0) 0 (0) 21.6 (20.5) 25.6 (24.2) 0 (0) 0 (0) 22 (20) 26 (24)
SNG 6,703 (6,353) 6,699 (6,349) 1.7 (1.6) 1.7 (1.6) 0 (0) 0 (0) 6,705 (6,355) 6,700 (6,351) SNG Purification Off-Gas 0 (0) 0 (0) 3 (3) 3 (3) 0 (0) 0 (0) 3 (3) 3 (3)
Condenser 0 (0) 0 (0) 1,631 (1,546) 1,703 (1,614) 0 (0) 0 (0) 1,631 (1,546) 1,703 (1,614) Non-Condenser Cooling Loads 0 (0) 0 (0) 879 (833) 1,194 (1,131) 0 (0) 0 (0) 879 (833) 1,194 (1,131)
Process Losses* 0 (0) 0 (0) 989 (938 586 (555) 0 (0) 0 (0) 989 (938) 586 (555) Power 0 (0) 0 (0) 0.0 (0.0) 0.0 (0.0) 1,101 (1,043) 1,118 (1,059) 1,101 (1,043) 1,118 (1,059) Totals 6,790 (6,435) 6,785 (6,431) 4,019 (3,809) 4,211 (3,991) 1,101 (1,043) 1,118 (1,059) 11,909 (11,288) 12,114 (11,482)
* Includes other energy losses not explicitly accounted for in the model.

Cost and Performance Baseline for Coal-to-SNG and Ammonia (Volume 2)
256
5.2.4 Major equipment items for the Siemens gasifier SNG plant without and with carbon sequestration using NDL coal are shown in the following tables. The accounts used in the equipment list correspond to the account numbers used in the cost estimates in Section
Cases 7 and 8 Equipment Lists
5.2.5. In general, the design conditions include a 10 percent contingency for flows and heat duties and a 21 percent contingency for heads on pumps and fans.

Cost and Performance Baseline for Coal-to-SNG and Ammonia (Volume 2)
257
ACCOUNT 1 COAL HANDLING Equipment
No. Description Type Operating Qty. Spares Case 7 Design
Condition Case 8 Design
Condition
1 Bottom Trestle Dumper and Receiving Hoppers
N/A 2 0 181 tonne (200 ton) 181 tonne (200 ton)
2 Feeder Belt 2 0 572 tonne/hr (630 tph) 572 tonne/hr (630 tph)
3 Conveyor No. 1 Belt 1 0 1,134 tonne/hr (1,250 tph)
1,134 tonne/hr (1,250 tph)
4 Transfer Tower No. 1 Enclosed 1 0 N/A N/A
5 Conveyor No. 2 Belt 1 0 1,134 tonne/hr (1,250 tph)
1,134 tonne/hr (1,250 tph)
6 As-Received Coal Sampling System Two-stage 1 0 N/A N/A
7 Stacker/Reclaimer Traveling, linear 1 0 1,134 tonne/hr
(1,250 tph) 1,134 tonne/hr
(1,250 tph) 8 Reclaim Hopper N/A 2 1 145 tonne (160 ton) 145 tonne (160 ton) 9 Feeder Vibratory 2 1 590 tonne/hr (650 tph) 590 tonne/hr (650 tph)
10 Conveyor No. 3 Belt w/ tripper 1 0 1,170 tonne/hr (1,290
tph) 1,170 tonne/hr (1,290
tph) 11 Crusher Tower N/A 1 0 N/A N/A
12 Coal Surge Bin w/ Vent Filter Dual outlet 2 0 590 tonne (650 ton) 590 tonne (650 ton)
13 Crusher Impactor reduction
2 0 8 cm x 0 - 3 cm x 0 (3" x 0 - 1-1/4" x 0)
8 cm x 0 - 3 cm x 0 (3" x 0 - 1-1/4" x 0)

Cost and Performance Baseline for Coal-to-SNG and Ammonia (Volume 2)
258
Equipment No. Description Type Operating
Qty. Spares Case 7 Design Condition
Case 8 Design Condition
14 As-Fired Coal Sampling System
Swing hammer
1 1 N/A N/A
15 Conveyor No. 4 Belt w/tripper
1 0 1,170 tonne/hr (1,290 tph)
1,170 tonne/hr (1,290 tph)
16 Transfer Tower No. 2 Enclosed 1 0 N/A N/A
17 Conveyor No. 5 Belt w/ tripper
1 0 1,170 tonne/hr (1,290 tph)
1,170 tonne/hr (1,290 tph)
18 Coal Silo w/ Vent Filter and Slide Gates
Field erected
3 0 2,631 tonne (2,900 ton) 2,631 tonne (2,900 ton)
ACCOUNT 2 COAL PREPARATION AND FEED
Equipment No. Description Type Operating
Qty. Spares Case 7 Design Condition
Case 8 Design Condition
1 Feeder Vibratory 6 0 127 tonne/hr (140 tph) 127 tonne/hr (140 tph)
2 Conveyor No. 6 Belt w/tripper 3 0 263 tonne/hr (290 tph) 263 tonne/hr (290 tph)
3 Roller Mill Feed Hopper Dual Outlet 3 0 517 tonne (570 ton) 517 tonne (570 ton)
4 Weigh Feeder Belt 6 0 127 tonne/hr (140 tph) 127 tonne/hr (140 tph) 5 Pulverizer Rotary 6 0 127 tonne/hr (140 tph) 127 tonne/hr (140 tph)

Cost and Performance Baseline for Coal-to-SNG and Ammonia (Volume 2)
259
Equipment No. Description Type Operating
Qty. Spares Case 7 Design Condition
Case 8 Design Condition
6 Coal Dryer Feed Hopper
Vertical Hopper 3 0 517 tonne (570 ton) 517 tonne (570 ton)
7 Coal Preheater Water Heated Horizontal Rotary Kiln
3 0
Coal feed: 263 tonne/hr (290 tph)
Heat duty: 32.1 GJ/hr (30.5 MMBtu/hr)
Coal feed: 263 tonne/hr (290 tph)
Heat duty: 32.1 GJ/hr (30.5 MMBtu/hr)
8 Coal Dryer Fluidized Bed with Internal Coils
3 0
Coal feed: 263 tonne/hr (290 tph)
Heat duty: 186 GJ/hr (177 MMBtu/hr)
Bed diameter: 16.5 m (54 ft)
Coal feed: 263 tonne/hr (290 tph)
Heat duty: 186 GJ/hr (177 MMBtu/hr)
Bed diameter: 16.5 m (54 ft)
9 Steam Compressor
Reciprocating, Multi-Stage 3 0
1,419 m3/min (50,110 scfm)
Suction - 0.10 MPa (13.8 psia)
Discharge - 0.52 MPa (75.3 psia)
1,419 m3/min (50,110 scfm)
Suction - 0.10 MPa (13.8 psia)
Discharge - 0.52 MPa (75.3 psia)
10 Dryer Exhaust Filter Hot Baghouse 3 0
Steam - 71,214 kg/hr (157,000 lb/hr)
Temperature - 107°C (225°F)
Steam - 71,214 kg/hr (157,000 lb/hr)
Temperature - 107°C (225°F)
11 Dry Coal Cooler
Water Cooled Horizontal Rotary Kiln
3 0 189 tonne/hr (208 tph)
Heat duty - 12 GJ/hr (11 MMBtu/hr)
189 tonne/hr (208 tph) Heat duty - 12 GJ/hr (11
MMBtu/hr)

Cost and Performance Baseline for Coal-to-SNG and Ammonia (Volume 2)
260
ACCOUNT 3 FEEDWATER AND MISCELLANEOUS SYSTEMS AND EQUIPMENT
Equipment No. Description Type Operating
Qty. Spares Case 7 Design Condition Case 8 Design Condition
1 Demineralized Water Storage Tank
Vertical, cylindrical, outdoor
3 0 575,383 liters (152,000 gal)
590,524 liters (156,000 gal)
2 Condensate Pumps
Vertical canned 2 1 9,464 lpm @ 91 m H2O
(2,500 gpm @ 300 ft H2O) 9,804 lpm @ 91 m H2O
(2,590 gpm @ 300 ft H2O)
3 Deaerator Horizontal spray type 2 0 732,098 kg/hr
(1,614,000 lb/hr) 751,603 kg/hr
(1,657,000 lb/hr)
4
Intermediate Pressure Feedwater Pump
Horizontal centrifugal, single stage
2 1 5,375 lpm @ 341 m H2O
(1,420 gpm @ 1120 ft H2O)
5,716 lpm @ 341 m H2O (1,510 gpm @ 1120 ft
H2O)
5 High Pressure Feedwater Pump
Barrel type, multi-stage, centrifugal
2 1 HP water: 7,117 lpm @
1,676 m H2O (1,880 gpm @ 5,500 ft H2O)
HP water: 7,117 lpm @ 1,676 m H2O (1,880 gpm
@ 5,500 ft H2O)
6 Auxiliary Boiler
Shop fabricated, water tube
1 0
18,144 kg/hr, 2.8 MPa, 343°C
(40,000 lb/hr, 400 psig, 650°F)
18,144 kg/hr, 2.8 MPa, 343°C
(40,000 lb/hr, 400 psig, 650°F)
7 Service Air Compressors
Flooded Screw 3 1 28 m3/min @ 0.7 MPa
(1,000 scfm @ 100 psig) 28 m3/min @ 0.7 MPa
(1,000 scfm @ 100 psig)
8 Instrument Air Dryers
Duplex, regenerative 3 1 28 m3/min (1,000 scfm) 28 m3/min (1,000 scfm)

Cost and Performance Baseline for Coal-to-SNG and Ammonia (Volume 2)
261
Equipment No. Description Type Operating
Qty. Spares Case 7 Design Condition Case 8 Design Condition
9 Closed Cycle Cooling Heat Exchangers
Plate and frame 2 0 667 GJ/hr (632 MMBtu/hr)
each 840 GJ/hr (796 MMBtu/hr)
each
10 Closed Cycle Cooling Water Pumps
Horizontal centrifugal 2 1 239,238 lpm @ 21 m H2O
(63,200 gpm @ 70 ft H2O) 301,319 lpm @ 21 m H2O (79,600 gpm @ 70 ft H2O)
11 Engine-Driven Fire Pump
Vertical turbine, diesel engine
1 1 3,785 lpm @ 107 m H2O (1,000 gpm @ 350 ft H2O)
3,785 lpm @ 107 m H2O (1,000 gpm @ 350 ft H2O)
12 Fire Service Booster Pump
Two-stage horizontal centrifugal
1 1 2,650 lpm @ 76 m H2O (700 gpm @ 250 ft H2O)
2,650 lpm @ 76 m H2O (700 gpm @ 250 ft H2O)
13 Raw Water Pumps
Stainless steel, single suction
2 1 4,656 lpm @ 18 m H2O (1,230 gpm @ 60 ft H2O)
5,413 lpm @ 18 m H2O (1,430 gpm @ 60 ft H2O)
14 Ground Water Pumps
Stainless steel, single suction
3 1 3,104 lpm @ 268 m H2O (820 gpm @ 880 ft H2O)
3,596 lpm @ 268 m H2O (950 gpm @ 880 ft H2O)
15 Filtered Water Pumps
Stainless steel, single suction
2 1 5,527 lpm @ 49 m H2O (1,460 gpm @ 160 ft H2O)
5,527 lpm @ 49 m H2O (1,460 gpm @ 160 ft H2O)
16 Filtered Water Tank
Vertical, cylindrical 2 0 2,649,788 liter (700,000
gal) 2,653,574 liter (701,000
gal)

Cost and Performance Baseline for Coal-to-SNG and Ammonia (Volume 2)
262
Equipment No. Description Type Operating
Qty. Spares Case 7 Design Condition Case 8 Design Condition
17 Makeup Water Demineralizer
Anion, cation, and mixed bed
4 0 1,287 lpm (340 gpm) 1,287 lpm (340 gpm)
18 Liquid Waste Treatment System
1 0 10 years, 24-hour storm 10 years, 24-hour storm
ACCOUNT 4 GASIFIER, ASU, AND ACCESSORIES INCLUDING LOW TEMPERATURE HEAT RECOVERY
Equipment No. Description Type Operating
Qty. Spares Case 7 Design Condition Case 8 Design Condition
1 Gasifier Pressurized dry-feed, entrained bed
6 0 3,084 tonne/day, 4.2 MPa (3,400 tpd, 615 psia)
3,084 tonne/day, 4.2 MPa (3,400 tpd, 615 psia)
2 Synthesis Gas Cooler
Convective spiral-wound tube boiler
6 0 206,385 kg/hr (455,000 lb/hr)
206,385 kg/hr (455,000 lb/hr)
3
Syngas Scrubber Including Sour Water Stripper
Vertical upflow 6 0 206,385 kg/hr (455,000
lb/hr) 206,385 kg/hr (455,000
lb/hr)
4 Raw Gas Coolers
Shell and tube with condensate drain
12 0 424,109 kg/hr (935,000 lb/hr)
424,109 kg/hr (935,000 lb/hr)

Cost and Performance Baseline for Coal-to-SNG and Ammonia (Volume 2)
263
Equipment No. Description Type Operating
Qty. Spares Case 7 Design Condition Case 8 Design Condition
5 Raw Gas Knockout Drum
Vertical with mist eliminator
3 0
394,172 kg/hr, 35°C, 3.4 MPa
(869,000 lb/hr, 95°F, 490 psia)
394,172 kg/hr, 35°C, 3.4 MPa
(869,000 lb/hr, 95°F, 495 psia)
6 Saturation Water Economizers
Shell and tube 3 0 494,869 kg/hr (1,091,000 lb/hr)
494,416 kg/hr (1,090,000 lb/hr)
7 Flare Stack
Self-supporting, carbon steel, stainless steel top, pilot ignition
3 0 412,769 kg/hr (910,000 lb/hr) syngas
412,769 kg/hr (910,000 lb/hr) syngas
8 ASU Main Air Compressor
Centrifugal, multi-stage 3 0 7,646 m3/min @ 1.3 MPa
(270,000 scfm @ 190 psia) 7,646 m3/min @ 1.3 MPa
(270,000 scfm @ 190 psia)
9 Cold Box Vendor design 3 0 3,084 tonne/day (3,400
tpd) of 99% purity oxygen 3,084 tonne/day (3,400
tpd) of 99% purity oxygen
10 Oxygen Compressor
Centrifugal, multi-stage 3 0
1,557 m3/min (55,000 scfm)
Suction - 0.9 MPa (130 psia)
Discharge - 5.1 MPa (740 psia)
1,557 m3/min (55,000 scfm)
Suction - 0.9 MPa (130 psia)
Discharge - 5.1 MPa (740 psia)

Cost and Performance Baseline for Coal-to-SNG and Ammonia (Volume 2)
264
Equipment No. Description Type Operating
Qty. Spares Case 7 Design Condition Case 8 Design Condition
11 Coal Feed System CO2 Compressor
Centrifugal, multi-stage 3 0
736 m3/min (26,000 scfm) Suction - 1.0 MPa
(150 psia) Discharge - 5.7 MPa
(820 psia)
736 m3/min (26,000 scfm) Suction - 5.2 MPa
(750 psia) Discharge - 5.7 MPa
(820 psia)
ACCOUNT 5A SYNGAS CLEANUP
Equipment No. Description Type Operating
Qty. Spares Case 7 Design Condition Case 8 Design Condition
1 Mercury Adsorber
Sulfated carbon bed 3 0
394,172 kg/hr (869,000 lb/hr)
35°C (95°F) 3.3 MPa (485 psia)
394,172 kg/hr (869,000 lb/hr)
35°C (95°F) 3.4 MPa (490 psia)
2 ZnO Guard Bed Fixed bed 1 0 418 Nm3/min (14,750 acfm)
417 Nm3/min (14,740 acfm)
3 Sulfur Plant Claus type 2 0 58 tonne/day (64 tpd) 58 tonne/day (64 tpd)
4 Water Gas Shift Reactor
Fixed bed, catalytic 3 0
448,149 kg/hr (988,000 lb/hr) 232°C (450°F)
3.7 MPa (540 psia)
448,149 kg/hr (988,000 lb/hr) 232°C (450°F)
3.7 MPa (540 psia)
5 Shift Reactor Heat Recovery Exchanger
Shell and Tube 3 each 0
Exchanger 1: 61 GJ/hr (58 MMBtu/hr)
Exchanger 2: 77 GJ/hr (73 MMBtu/hr)
Exchanger 3: 17 GJ/hr (16 MMBtu/hr)
Exchanger 1: 61 GJ/hr (58 MMBtu/hr)
Exchanger 2: 77 GJ/hr (73 MMBtu/hr)
Exchanger 3: 17 GJ/hr (16 MMBtu/hr)

Cost and Performance Baseline for Coal-to-SNG and Ammonia (Volume 2)
265
Equipment No. Description Type Operating
Qty. Spares Case 7 Design Condition Case 8 Design Condition
6 Acid Gas Removal Plant
Two-stage Selexol 3 0
401,883 kg/hr (886,000 lb/hr)
34°C (94°F) 3.3 MPa (475 psia)
401,883 kg/hr (886,000 lb/hr)
34°C (94°F) 3.3 MPa (480 psia)
7 Hydrogenation Reactor
Fixed bed, catalytic 2 0
13,982 kg/hr (30,826 lb/hr) 232°C (450°F)
0.1 MPa (12.3 psia)
13,842 kg/hr (30,517 lb/hr) 232°C (450°F)
0.1 MPa (12.3 psia)
8 Tail Gas Recycle Compressor
Centrifugal 2 0 11,601 kg/hr @ 3.3 MPa (25,575 lb/hr @ 485 psia)
11,542 kg/hr @ 3.3 MPa (25,445 lb/hr @ 485 psia)
ACCOUNT 5B CO2 COMPRESSION
Equipment No. Description Type Operating
Qty. Spares Case 7 Design Condition Case 8 Design Condition
1 CO2 Compressor
Integrally geared, multi-stage centrifugal
4 0 N/A 1,705 m3/min @ 15.3 MPa (60,200 scfm @ 2,215 psia)

Cost and Performance Baseline for Coal-to-SNG and Ammonia (Volume 2)
266
ACCOUNT 6 COMBUSTION TURBINE AND AUXILIARIES
Equipment No. Description Type Operating
Qty. Spares Case 7 Design Condition
Case 8 Design Condition
1 Combustion Turbine N/A N/A N/A N/A N/A
2 Combustion Turbine Generator
N/A N/A N/A N/A N/A
ACCOUNT 7 DUCTING & STACK
Equipment No. Description Type Operating
Qty. Spares Case 7 Design Condition
Case 8 Design Condition
1 Stack CS plate, type 409SS liner 1 0 76 m (250 ft) high x
2.2 m (7 ft) diameter 76 m (250 ft) high x 0.7
m (2 ft) diameter
ACCOUNT 8 STEAM TURBINE GENERATOR AND AUXILIARIES
Equipment No. Description Type Operating
Qty. Spares Case 7 Design Condition
Case 8 Design Condition
1 Steam Turbine
Commercially available 1 0
322 MW 12.4 MPa/ 566°C (1800 psig/
1050°F)
327 MW 12.4 MPa/ 566°C (1800 psig/
1050°F)
2 Steam Turbine Generator
Hydrogen cooled, static excitation
1 0 360 MVA @ 0.9 p.f., 24 kV, 60 Hz, 3-phase
360 MVA @ 0.9 p.f., 24 kV, 60 Hz, 3-phase

Cost and Performance Baseline for Coal-to-SNG and Ammonia (Volume 2)
267
Equipment No. Description Type Operating
Qty. Spares Case 7 Design Condition
Case 8 Design Condition
3 Surface Condenser
Single pass, divided waterbox including vacuum pumps
1 0
897 GJ/hr (850 MMBtu/hr),
Condensing temperature 32°C (90°F),
Inlet water temperature 8°C (47°F),
Water temperature rise 11°C (20°F)
939 GJ/hr (890 MMBtu/hr),
Condensing temperature 32°C (90°F),
Inlet water temperature 9°C (48°F),
Water temperature rise 11°C (20°F)
4 Air-cooled Condenser --- 1 0
897 GJ/hr (850 MMBtu/hr),
Condensing temperature 32°C (90°F),
Ambient temperature 4°C (40°F)
939 GJ/hr (890 MMBtu/hr),
Condensing temperature 32°C (90°F),
Ambient temperature 6°C (42°F)
ACCOUNT 9 COOLING WATER SYSTEM
Equipment No. Description Type Operating
Qty. Spares Case 7 Design Condition
Case 8 Design Condition
1 Circulating Water Pumps
Vertical, wet pit 2 1 458,035 lpm @ 30 m
(121,000 gpm @ 100 ft) 526,172 lpm @ 30 m
(139,000 gpm @ 100 ft)
2 Cooling Tower
Evaporative, mechanical draft, multi-cell
1 0
2°C (36°F) wet bulb / 8°C (47°F) CWT / 19°C
(67°F) HWT / 2,543 GJ/hr (2,410 MMBtu/hr)
heat duty
3°C (37°F) wet bulb / 9°C (48°F) CWT / 20°C
(68°F) HWT / 2,933 GJ/hr (2,780 MMBtu/hr)
heat duty

Cost and Performance Baseline for Coal-to-SNG and Ammonia (Volume 2)
268
ACCOUNT 10 SLAG RECOVERY AND HANDLING
Equipment No. Description Type Operating
Qty. Spares Case 7 Design Condition Case 8 Design Condition
1 Slag Quench Tank Water bath 6 0 249,837 liters (66,000 gal) 249,837 liters (66,000 gal)
2 Slag Crusher Roll 6 0 13 tonne/hr (14 tph) 13 tonne/hr (14 tph)
3 Slag Depressurizer Proprietary 6 0 13 tonne/hr (14 tph) 13 tonne/hr (14 tph)
4 Slag Receiving Tank
Horizontal, weir 6 0 151,416 liters (40,000 gal) 151,416 liters (40,000 gal)
5 Black Water Overflow Tank
Shop fabricated 6 0 68,137 liters (18,000 gal) 68,137 liters (18,000 gal)
6 Slag Conveyor Drag chain 6 0 13 tonne/hr (14 tph) 13 tonne/hr (14 tph)
7 Slag Separation Screen
Vibrating 6 0 13 tonne/hr (14 tph) 13 tonne/hr (14 tph)
8 Coarse Slag Conveyor Belt/bucket 6 0 13 tonne/hr (14 tph) 13 tonne/hr (14 tph)
9 Fine Ash Settling Tank
Vertical, gravity 6 0 211,983 liters (56,000 gal) 211,983 liters (56,000 gal)
10 Fine Ash Recycle Pumps
Horizontal centrifugal 6 3 38 lpm @ 14 m H2O
(10 gpm @ 46 ft H2O) 38 lpm @ 14 m H2O
(10 gpm @ 46 ft H2O)
11 Grey Water Storage Tank Field erected 6 0 68,137 liters (18,000 gal) 68,137 liters (18,000 gal)
12 Grey Water Pumps Centrifugal 6 3 227 lpm @ 433 m H2O
(60 gpm @ 1,420 ft H2O) 227 lpm @ 433 m H2O
(60 gpm @ 1,420 ft H2O)

Cost and Performance Baseline for Coal-to-SNG and Ammonia (Volume 2)
269
Equipment No. Description Type Operating
Qty. Spares Case 7 Design Condition Case 8 Design Condition
13 Slag Storage Bin
Vertical, field erected 6 0 907 tonne (1,000 tons) 907 tonne (1,000 tons)
14 Unloading Equipment
Telescoping chute 2 0 163 tonne/hr (180 tph) 163 tonne/hr (180 tph)
ACCOUNT 11 SNG PRODUCTION/METHANATION SYSTEM
Equipment No. Description Type Operating
Qty. Spares Case 7 Design Condition Case 8 Design Condition
1 Methanation Reactor Preheater
Shell and Tube 3 0 90 GJ/hr (85 MMBtu/hr) 90 GJ/hr (85 MMBtu/hr)
2 Methanation Reactor 1
Fixed Bed, catalytic 3 0
456,314 kg/hr (1,006,000 lb/hr) 693°C (1,280°F)
3.2 MPa (470 psia)
448,603 kg/hr (989,000 lb/hr)
699°C (1,290°F) 3.2 MPa (470 psia)
3 Methanation Reactor Intercooler 1
Shell and Tube 3 0 381 GJ/hr (362 MMBtu/hr) 380 GJ/hr (360 MMBtu/hr)
4 Methanation Reactor Intercooler 2
Shell and Tube 3 0 104 GJ/hr (99 MMBtu/hr) 102 GJ/hr (97 MMBtu/hr)
5 Methanation Reactor 2
Fixed Bed, catalytic 3 0
119,295 kg/hr (263,000 lb/hr) 554°C (1030°F)
3.1 MPa (450 psia)
119,295 kg/hr (263,000 lb/hr) 560°C (1040°F)
3.1 MPa (450 psia)

Cost and Performance Baseline for Coal-to-SNG and Ammonia (Volume 2)
270
Equipment No. Description Type Operating
Qty. Spares Case 7 Design Condition Case 8 Design Condition
6 Methanation Reactor Intercooler 3
Shell and Tube 3 0 27 GJ/hr (26 MMBtu/hr) 27 GJ/hr (26 MMBtu/hr)
7 Methanation Reactor 3
Fixed Bed, catalytic 3 0
119,295 kg/hr (263,000 lb/hr) 338°C (640°F)
3.0 MPa (440 psia)
119,295 kg/hr (263,000 lb/hr) 343°C (650°F)
3.0 MPa (440 psia)
8 Methanation Reactor Intercooler 4
Shell and Tube 3 0 36 GJ/hr (34 MMBtu/hr) 38 GJ/hr (36 MMBtu/hr)
9 Methanation Reactor Intercooler 5
Shell and Tube 3 0 61 GJ/hr (58 MMBtu/hr) 61 GJ/hr (58 MMBtu/hr)
10 SNG Purification Condenser 1
Shell and Tube 3 0 51 GJ/hr (49 MMBtu/hr) 51 GJ/hr (49 MMBtu/hr)
11 SNG Purification Condenser 2
Shell and Tube 3 0 31 GJ/hr (30 MMBtu/hr) 31 GJ/hr (30 MMBtu/hr)
12 Methanation Recycle Compressor
Centrifugal 3 1
8,084 m3/min (285,500 scfm)
Suction - 3.1 MPa (453 psia)
Discharge - 3.3 MPa (475 psia)
7,926 m3/min (279,900 scfm)
Suction - 3.1 MPa (453 psia)
Discharge - 3.3 MPa (475 psia)

Cost and Performance Baseline for Coal-to-SNG and Ammonia (Volume 2)
271
Equipment No. Description Type Operating
Qty. Spares Case 7 Design Condition Case 8 Design Condition
13
Molecular Sieve Purification Reactor
Fixed bed 6 0 34,927 kg/hr (77,000 lb/hr)
35°C (95°F) 2.8 MPa (401 psia)
34,927 kg/hr (77,000 lb/hr) 35°C (95°F)
2.8 MPa (401 psia)
14 SNG Product Compressor
Centrifugal, Multi-staged 3 1
1,136 m3/min (40,100 scfm)
2.6 MPa (381 psia) 6.2 MPa (900 psia)
1,136 m3/min (40,100 scfm)
2.6 MPa (381 psia) 6.2 MPa (900 psia)
ACCOUNT 12 ACCESSORY ELECTRIC PLANT
Equipment No. Description Type Operating
Qty. Spares Case 7 Design Condition
Case 8 Design Condition
1 STG Step-up Transformer Oil-filled 1 0 24 kV/345 kV, 360
MVA, 3-ph, 60 Hz 345 kV/24 kV, 360 MVA, 3-ph, 60 Hz
2 Auxiliary Transformer Oil-filled 1 1 24 kV/4.16 kV, 287
MVA, 3-ph, 60 Hz 24 kV/4.16 kV, 347 MVA, 3-ph, 60 Hz
3 Low Voltage Transformer
Dry ventilated 1 1 4.16 kV/480 V, 43
MVA, 3-ph, 60 Hz 4.16 kV/480 V, 52 MVA, 3-ph, 60 Hz
4
STG Isolated Phase Bus Duct and Tap Bus
Aluminum, self-cooled 1 0 24 kV, 3-ph, 60 Hz 24 kV, 3-ph, 60 Hz
5 Medium Voltage Switchgear
Metal clad 1 1 4.16 kV, 3-ph, 60 Hz 4.16 kV, 3-ph, 60 Hz

Cost and Performance Baseline for Coal-to-SNG and Ammonia (Volume 2)
272
Equipment No. Description Type Operating
Qty. Spares Case 7 Design Condition
Case 8 Design Condition
6 Low Voltage Switchgear
Metal enclosed 1 1 480 V, 3-ph, 60 Hz 480 V, 3-ph, 60 Hz
7 Emergency Diesel Generator
Sized for emergency shutdown
1 0 750 kW, 480 V, 3-ph, 60 Hz
750 kW, 480 V, 3-ph, 60 Hz
ACCOUNT 13 INSTRUMENTATION AND CONTROLS
Equipment No. Description Type Operating
Qty. Spares Case 7 Design Condition
Case 8 Design Condition
1 DCS - Main Control
Monitor/keyboard; Operator printer (laser color); Engineering printer (laser B&W)
1 0
Operator stations/printers and
engineering stations/printers
Operator stations/printers and
engineering stations/printers
2 DCS - Processor
Microprocessor with redundant input/output
1 0 N/A N/A
3 DCS - Data Highway Fiber optic 1 0 Fully redundant,
25% spare Fully redundant,
25% spare

Cost and Performance Baseline for Coal-to-SNG and Ammonia (Volume 2)
273
5.2.5 The cost estimating methodology was described previously in Section
Cases 7 and 8 Cost Estimating 2.8.
The TPC organized by cost account; owner’s costs; TOC; and initial and annual O&M costs for the SNG plant without sequestration using NDL coal (Case 7) are shown in Exhibit 5-39 and Exhibit 5-40, respectively. The same data for the SNG plant with sequestration using NDL coal (Case 8) are shown in Exhibit 5-41 and Exhibit 5-42.
The estimated TOC of the SNG plant without carbon sequestration using NDL coal is 3.50 billion dollars and with carbon sequestration is 3.60 billion dollars. Project and process contingencies represent 12.0 and 3.6 percent for both cases. The FYCOP is $21.27/MMBtu for the non-sequestration case and $23.24/MMBtu for the sequestration case as shown in Exhibit ES-6.

Cost and Performance Baseline for Coal-to-SNG and Ammonia (Volume 2)
274
Exhibit 5-39 Case 7 Total Plant Cost Details Client: USDOE/NETL R e port Da te : 2010-Feb-18
Project: Cost & Performance Baseline for Fossil Energy Plants Vol.2
Case: Case 7 - Siemens Quench SNG Production w/o CO2Plant Size: 46.06 MW,net Est imate Type: Conceptual Cost Base (Jun) 2007 ($x1000)
Acct Equipment Material Labor Sales Bare Erected Eng'g CM Contingencies Total Plant CostNo. I tem/Descript ion Cost Cost Direct Indirect Tax Cost $ H.O.& Fee Process Project $
1 COAL & SORBENT HANDLING1.1 Coal Receive & Unload $7,733 $0 $3,779 $0 $0 $11,512 $1,031 $0 $2,509 $15,0521.2 Coal Stackout & Reclaim $9,993 $0 $2,423 $0 $0 $12,415 $1,088 $0 $2,701 $16,2041.3 Coal Conveyors & Yd Crush $9,291 $0 $2,397 $0 $0 $11,688 $1,026 $0 $2,543 $15,2561.4 Other Coal Handling $2,431 $0 $555 $0 $0 $2,985 $261 $0 $649 $3,8961.5 Sorbent Receive & Unload $0 $0 $0 $0 $0 $0 $0 $0 $0 $01.6 Sorbent Stackout & Reclaim $0 $0 $0 $0 $0 $0 $0 $0 $0 $01.7 Sorbent Conveyors $0 $0 $0 $0 $0 $0 $0 $0 $0 $01.8 Other Sorbent Handling $0 $0 $0 $0 $0 $0 $0 $0 $0 $01.9 Coal & Sorbent Hnd.Foundations $0 $5,472 $13,683 $0 $0 $19,155 $1,836 $0 $4,198 $25,189
SUBTOTAL 1 . $29,447 $5,472 $22,836 $0 $0 $57,755 $5,243 $0 $12,600 $75,598 2 COAL & SORBENT PREP & FEED
2.1 Coal Crushing & Drying $127,899 $0 $18,636 $0 $0 $146,535 $13,308 $0 $31,969 $191,8112.2 Prepared Coal Storage & Feed $6,058 $1,450 $950 $0 $0 $8,457 $723 $0 $1,836 $11,0172.3 Dry Coal Injection System $199,367 $2,314 $18,515 $0 $0 $220,197 $18,965 $0 $47,832 $286,9942.4 Misc.Coal Prep & Feed $3,331 $2,424 $7,268 $0 $0 $13,024 $1,197 $0 $2,844 $17,0652.5 Sorbent Prep Equipment $0 $0 $0 $0 $0 $0 $0 $0 $0 $02.6 Sorbent Storage & Feed $0 $0 $0 $0 $0 $0 $0 $0 $0 $02.7 Sorbent Injection System $0 $0 $0 $0 $0 $0 $0 $0 $0 $02.8 Booster Air Supply System $0 $0 $0 $0 $0 $0 $0 $0 $0 $02.9 Coal & Sorbent Feed Foundation $0 $12,948 $10,631 $0 $0 $23,579 $2,184 $0 $5,153 $30,916
SUBTOTAL 2. $336,655 $19,136 $56,001 $0 $0 $411 ,792 $36,377 $0 $89,634 $537,802 3 FEEDWATER & MISC. BOP SYSTEMS
3.1 Feedwater System $3,463 $1,610 $1,952 $0 $0 $7,025 $635 $0 $1,532 $9,1923.2 Water Makeup & Pretreating $591 $62 $330 $0 $0 $982 $94 $0 $323 $1,3993.3 Other Feedwater Subsystems $3,760 $1,137 $1,860 $0 $0 $6,757 $613 $0 $1,474 $8,8453.4 Service Water Systems $338 $696 $2,415 $0 $0 $3,449 $337 $0 $1,136 $4,9213.5 Other Boiler Plant Systems $1,814 $703 $1,742 $0 $0 $4,258 $404 $0 $932 $5,5943.6 FO Supply Sys & Nat Gas $102 $210 $188 $0 $0 $500 $48 $0 $110 $6583.7 Waste Treatment Equipment $826 $0 $504 $0 $0 $1,329 $129 $0 $438 $1,8963.8 Misc. Power Plant Equipment $1,639 $219 $841 $0 $0 $2,700 $261 $0 $888 $3,848
SUBTOTAL 3. $12,532 $4,636 $9,832 $0 $0 $27,001 $2,521 $0 $6,832 $36,353 4 GASIFIER & ACCESSORIES
4.1 Gasifier, Syngas Cooler & Auxiliaries $325,384 $0 $150,649 $0 $0 $476,033 $42,281 $71,405 $88,458 $678,1764.2 Syngas Cooling w/4.1 w/4.1 w/ 4.1 $0 $0 $0 $0 $0 $0 $04.3 ASU/Oxidant Compression $246,271 $0 w/equip. $0 $0 $246,271 $23,871 $0 $27,014 $297,1564.4 LT Heat Recovery & FG Saturation $51,285 $0 $19,002 $0 $0 $70,288 $6,733 $0 $15,404 $92,4254.5 Misc. Gasification Equipment w/4.1&4.2 $0 w/4.1&4.2 $0 $0 $0 $0 $0 $0 $04.6 Flare Stack System $0 $2,261 $920 $0 $0 $3,182 $305 $0 $697 $4,1844.7 CO2 Solid Feed System Compressors $13,665 $3,280 $4,919 $0 $0 $21,863 $2,186 $0 $4,810 $28,8604.8 Major Component Rigging w/4.1&4.2 $0 w/4.1&4.2 $0 $0 $0 $0 $0 $0 $04.9 Gasification Foundations $0 $26,928 $15,365 $0 $0 $42,293 $3,872 $0 $11,541 $57,706
SUBTOTAL 4. $636,605 $32,469 $190,856 $0 $0 $859,930 $79,248 $71 ,405 $147,925 $1 ,158,507
TOTAL PLANT COST SUMMARY

Cost and Performance Baseline for Coal-to-SNG and Ammonia (Volume 2)
275
Exhibit 5-39 Case 7 Total Plant Cost Details (continued) Acct Equipment Material Labor Sales Bare Erected Eng'g CM Contingencies Total Plant CostNo. I tem/Descript ion Cost Cost Direct Indirect Tax Cost $ H.O.& Fee Process Project $
5A GAS CLEANUP & PIPING5A.1 Double Stage Selexol $130,462 $0 $110,700 $0 $0 $241,162 $23,323 $48,232 $62,543 $375,2605A.2 Elemental Sulfur Plant $8,844 $1,763 $11,410 $0 $0 $22,017 $2,139 $0 $4,831 $28,9865A.3 Mercury Removal $2,366 $0 $1,800 $0 $0 $4,166 $402 $208 $955 $5,7325A.4 Shift Reactors $10,266 $0 $4,132 $0 $0 $14,398 $1,380 $0 $3,156 $18,9345A.5 Methanation $26,500 $10,600 $15,900 $0 $0 $53,000 $5,300 $5,300 $12,720 $76,3205A.6 SNG Purification & Compression $18,600 $7,440 $11,160 $0 $0 $37,200 $3,720 $0 $8,184 $49,1045A.7 Fuel Gas Piping $0 $1,631 $1,142 $0 $0 $2,773 $257 $0 $606 $3,6365A.9 Process Interconnects $0 $12,000 $18,000 $0 $0 $30,000 $3,000 $0 $6,600 $39,600
5A.10 HGCU Foundations $0 $1,651 $1,065 $0 $0 $2,716 $250 $0 $890 $3,8565A.11 Zinc Oxide Guard Bed $758 $0 $140 $0 $0 $898 $90 $0 $198 $1,185
SUBTOTAL 5A. $197,795 $35,085 $175,449 $0 $0 $408,330 $39,861 $53,741 $100,683 $602,614 5B CO2 COMPRESSION
5B.1 CO2 Removal System $0 $0 $0 $0 $0 $0 $0 $0 $0 $05B.2 CO2 Compression & Drying $0 $0 $0 $0 $0 $0 $0 $0 $0 $0
SUBTOTAL 5B. $0 $0 $0 $0 $0 $0 $0 $0 $0 $0 6 COMBUSTION TURBINE/ACCESSORIES
6.1 Combustion Turbine Generator $0 $0 $0 $0 $0 $0 $0 $0 $0 $06.2 Syngas Expander $0 $0 $0 $0 $0 $0 $0 $0 $0 $06.3 Compressed Air Piping $0 $0 $0 $0 $0 $0 $0 $0 $0 $06.9 Combustion Turbine Foundations $0 $0 $0 $0 $0 $0 $0 $0 $0 $0
SUBTOTAL 6. $0 $0 $0 $0 $0 $0 $0 $0 $0 $0 7 HRSG, DUCTING & STACK
7.1 Heat Recovery Steam Generator $0 $0 $0 $0 $0 $0 $0 $0 $0 $07.2 HRSG Accessories $0 $0 $0 $0 $0 $0 $0 $0 $0 $07.3 Ductwork $0 $335 $239 $0 $0 $573 $50 $0 $125 $7487.4 Stack $1,465 $0 $550 $0 $0 $2,015 $193 $0 $221 $2,4297.9 HRSG,Duct & Stack Foundations $0 $293 $282 $0 $0 $575 $54 $0 $189 $818
SUBTOTAL 7. $1 ,465 $628 $1 ,071 $0 $0 $3,164 $297 $0 $534 $3,995 8 STEAM TURBINE GENERATOR
8.1 Steam TG & Accessories $31,248 $0 $5,416 $0 $0 $36,664 $3,518 $0 $4,018 $44,2008.2 Turbine Plant Auxiliaries $169 $0 $498 $0 $0 $668 $66 $0 $73 $8078.3a Condenser & Auxiliaries $3,246 $0 $1,521 $0 $0 $4,767 $458 $0 $522 $5,7478.3b Air Cooled Condenser $29,744 $0 $5,963 $0 $0 $35,707 $3,571 $0 $7,855 $47,1338.4 Steam Piping $5,463 $0 $3,843 $0 $0 $9,306 $799 $0 $2,526 $12,6328.9 TG Foundations $0 $1,078 $1,823 $0 $0 $2,901 $275 $0 $953 $4,129
SUBTOTAL 8. $69,869 $1 ,078 $19,065 $0 $0 $90,013 $8,687 $0 $15,949 $114,648

Cost and Performance Baseline for Coal-to-SNG and Ammonia (Volume 2)
276
Exhibit 5-39 Case 7 Total Plant Cost Details (continued) Acct Equipment Material Labor Sales Bare Erected Eng'g CM Contingencies Total Plant CostNo. I tem/Descript ion Cost Cost Direct Indirect Tax Cost $ H.O.& Fee Process Project $
9 COOLING WATER SYSTEM9.1 Cooling Towers $7,073 $0 $1,287 $0 $0 $8,360 $796 $0 $1,373 $10,5309.2 Circulating Water Pumps $1,885 $0 $87 $0 $0 $1,973 $166 $0 $321 $2,4609.3 Circ.Water System Auxiliaries $155 $0 $22 $0 $0 $177 $17 $0 $29 $2229.4 Circ.Water Piping $0 $6,449 $1,672 $0 $0 $8,121 $734 $0 $1,771 $10,6269.5 Make-up Water System $329 $0 $471 $0 $0 $800 $77 $0 $175 $1,0529.6 Component Cooling Water Sys $761 $911 $648 $0 $0 $2,320 $217 $0 $507 $3,0449.9 Circ.Water System Foundations $0 $2,356 $4,005 $0 $0 $6,360 $603 $0 $2,089 $9,052
SUBTOTAL 9. $10,204 $9,715 $8,191 $0 $0 $28,111 $2,610 $0 $6,266 $36,98710 ASH/SPENT SORBENT HANDLING SYS
10.1 Slag Dewatering & Cooling $49,571 $0 $48,892 $0 $0 $98,463 $9,540 $0 $10,800 $118,80410.2 Gasifier Ash Depressurization w/10.1 w/10.1 w/10.1 $0 $0 $0 $0 $0 $0 $010.3 Cleanup Ash Depressurization w/10.1 w/10.1 w/10.1 $0 $0 $0 $0 $0 $0 $010.4 High Temperature Ash Piping $0 $0 $0 $0 $0 $0 $0 $0 $0 $010.5 Other Ash Rrecovery Equipment $0 $0 $0 $0 $0 $0 $0 $0 $0 $010.6 Ash Storage Silos $1,072 $0 $1,167 $0 $0 $2,239 $217 $0 $368 $2,82510.7 Ash Transport & Feed Equipment $1,438 $0 $347 $0 $0 $1,785 $167 $0 $293 $2,24510.8 Misc. Ash Handling Equipment $2,221 $2,722 $813 $0 $0 $5,756 $548 $0 $946 $7,25010.9 Ash/Spent Sorbent Foundation $0 $95 $119 $0 $0 $214 $20 $0 $70 $304
SUBTOTAL 10. $54,303 $2,817 $51 ,338 $0 $0 $108,458 $10,492 $0 $12,477 $131 ,42711 ACCESSORY ELECTRIC PLANT
11.1 Generator Equipment $431 $0 $427 $0 $0 $858 $82 $0 $94 $1,03411.2 Station Service Equipment $5,673 $0 $511 $0 $0 $6,184 $570 $0 $675 $7,42911.3 Switchgear & Motor Control $10,487 $0 $1,907 $0 $0 $12,394 $1,150 $0 $2,032 $15,57611.4 Conduit & Cable Tray $0 $4,872 $16,071 $0 $0 $20,943 $2,026 $0 $5,742 $28,71111.5 Wire & Cable $0 $9,308 $6,116 $0 $0 $15,424 $1,120 $0 $4,136 $20,68111.6 Protective Equipment $0 $826 $3,006 $0 $0 $3,832 $374 $0 $631 $4,83711.7 Standby Equipment $317 $0 $309 $0 $0 $626 $60 $0 $103 $78911.8 Main Power Transformers $9,424 $0 $172 $0 $0 $9,596 $728 $0 $1,549 $11,87211.9 Electrical Foundations $0 $186 $489 $0 $0 $675 $65 $0 $222 $962
SUBTOTAL 11 . $26,332 $15,192 $29,008 $0 $0 $70,533 $6,174 $0 $15,184 $91 ,89012 INSTRUMENTATION & CONTROL
12.1 IGCC Control Equipment w/4.1 $0 w/4.1 $0 $0 $0 $0 $0 $0 $012.2 Combustion Turbine Control w/6.1 $0 w/6.1 $0 $0 $0 $0 $0 $0 $012.3 Steam Turbine Control w/8.1 $0 w/8.1 $0 $0 $0 $0 $0 $0 $012.4 Other Major Component Control $520 $0 $347 $0 $0 $867 $82 $43 $149 $1,14112.5 Signal Processing Equipment w/12.7 $0 w/12.7 $0 $0 $0 $0 $0 $0 $012.6 Control Boards,Panels & Racks $345 $0 $221 $0 $0 $566 $54 $28 $130 $77812.7 Computer & Accessories $5,524 $0 $177 $0 $0 $5,701 $523 $285 $651 $7,16012.8 Instrument Wiring & Tubing $0 $2,798 $5,720 $0 $0 $8,518 $722 $426 $2,417 $12,08312.9 Other I & C Equipment $4,118 $0 $2,000 $0 $0 $6,118 $576 $306 $1,050 $8,050
SUBTOTAL 12. $10,507 $2,798 $8,465 $0 $0 $21 ,770 $1 ,957 $1 ,088 $4,396 $29,211

Cost and Performance Baseline for Coal-to-SNG and Ammonia (Volume 2)
277
Exhibit 5-39 Case 7 Total Plant Cost Details (continued) Acct Equipment Material Labor Sales Bare Erected Eng'g CM Contingencies Total Plant CostNo. I tem/Descript ion Cost Cost Direct Indirect Tax Cost $ H.O.& Fee Process Project $
13 IMPROVEMENTS TO SITE13.1 Site Preparation $0 $141 $3,021 $0 $0 $3,162 $314 $0 $1,043 $4,51913.2 Site Improvements $0 $2,514 $3,341 $0 $0 $5,855 $578 $0 $1,930 $8,36213.3 Site Facilities $4,505 $0 $4,754 $0 $0 $9,259 $913 $0 $3,051 $13,223
SUBTOTAL 13. $4,505 $2,655 $11 ,115 $0 $0 $18,276 $1 ,804 $0 $6,024 $26,10414 BUILDINGS & STRUCTURES
14.1 Combustion Turbine Area $0 $0 $0 $0 $0 $0 $0 $0 $0 $014.2 Steam Turbine Building $0 $2,599 $3,703 $0 $0 $6,302 $580 $0 $1,032 $7,91414.3 Administration Building $0 $870 $630 $0 $0 $1,500 $134 $0 $245 $1,87914.4 Circulation Water Pumphouse $0 $160 $90 $0 $0 $250 $22 $0 $41 $31214.5 Water Treatment Buildings $0 $494 $482 $0 $0 $975 $88 $0 $160 $1,22314.6 Machine Shop $0 $445 $305 $0 $0 $750 $67 $0 $123 $93914.7 Warehouse $0 $726 $464 $0 $0 $1,190 $105 $0 $194 $1,48914.8 Other Buildings & Structures $0 $514 $400 $0 $0 $914 $82 $0 $199 $1,19514.9 Waste Treating Building & Str. $0 $1,149 $2,196 $0 $0 $3,346 $312 $0 $732 $4,389
SUBTOTAL 14. $0 $6,957 $8,270 $0 $0 $15,227 $1 ,389 $0 $2,725 $19,341
TOTAL COST $1,390,220 $138,640 $591 ,498 $0 $0 $2,120,358 $196,659 $126,234 $421 ,228 $2,864,478
Owner's CostsPreproduction Costs
6 Months All Labor $22,1731 Month Maintenance Materials $3,941
1 Month Non-fuel Consumables $6151 Month Waste Disposal $937
25% of 1 Months Fuel Cost at 100% CF $1,5592% of TPC $57,290
Total $86,515Inventory Capital
60 day supply of fuel and consumables at 100% CF $13,4950.5% of TPC (spare parts) $14,322
Total $27,817
Initial Cost for Catalyst and Chemicals $17,540Land $900
Other Owner's Costs $429,672Financing Costs $77,341Total Overnight Costs (TOC) $3,504,262
TASC Multiplier 1.201Total As-Spent Cost (TASC) $4,208,619

Cost and Performance Baseline for Coal-to-SNG and Ammonia (Volume 2)
278
Exhibit 5-40 Case 7 Initial and Annual O&M Costs INITIAL & ANNUAL O&M EXPENSES Cost Base (Jun): 2007
Case 7 - Siemens Quench SNG Production w/o CO2 MWe-net: 46SNG (MMbtu/hr): 6353 Capacity Factor (%): 90
OPERATING & MAINTENANCE LABOROperating Labor
Operating Labor Rate(base): 34.65 $/hour Operating Labor Burden: 30.00 % of base Labor O-H Charge Rate: 25.00 % of labor
Total Operating Labor Requirements(O.J.)per Shift: 1 unit/mod. Plant Skilled Operator 2.0 2.0 Operator 12.0 12.0 Foreman 1.0 1.0 Lab Tech's, etc. 3.0 3.0 TOTAL-O.J.'s 18.0 18.0
Annual Cost Annual Unit Cost$ $/MMBtu
Annual Operating Labor Cost $7,102,696 $0.142Maintenance Labor Cost $28,373,931 $0.566Administrative & Support Labor $8,869,157 $0.177Property Taxes and Insurance $57,289,567 $1.144TOTAL FIXED OPERATING COSTS $101,635,351 $2.029VARIABLE OPERATING COSTS
$/MMBtuMaintenance Material Cost $42,560,897 $0.84968
Consumables Consumption Unit Initial Fill Initial Fill /Day Cost Cost
Water(/1000 gallons) 0 3,183 1.08 $0 $1 ,131 ,059 $0.02258
ChemicalsMU & WT Chem. (lb) 0 18,964 0.17 $0 $1,078,164 $0.02152Carbon (Mercury Removal) (lb) 216,740 371 1.05 $227,614 $128,033 $0.00256COS Catalyst (m3) 0 0 2,397.36 $0 $0 $0.00000Water Gas Shift Catalyst (ft3) 10,021 8.58 498.83 $4,998,731 $1,405,893 $0.02807ZnO Sorbent (ton) 63 0.22 12,574.00 $792,321 $891,361 $0.01779Methanation Catalyst (ft3) 11,443 8.71 440.00 $5,035,097 $1,258,774 $0.02513Selexol Solution (gal) 484,076 154 13.40 $6,485,766 $676,901 $0.01351SCR Catalyst (m3) 0 0 0.00 $0 $0 $0.00000Aqueous Ammonia (ton) 0 0 0.00 $0 $0 $0.00000Claus Catalyst (ft3) w/equip 1.63 131.27 $0 $70,246 $0.00140
Subtotal Chemicals $17,539,529 $5,509,373 $0.10999
OtherSupplemental Fuel (MBtu) 0 0 0.00 $0 $0 $0.00000Supplemental Electricity (for consumption) (MW 0 0 61.60 $0 $0 $0.00000Gases,N2 etc. (/100scf) 0 0 0.00 $0 $0 $0.00000L.P. Steam (/1000 pounds) 0 0 0.00 $0 $0 $0.00000
Subtotal Other $0 $0 $0.00000
Waste DisposalSpent Mercury Catalyst (lb.) 0 371 0.42 $0 $50,848 $0.00102Spent ZnO Sorbent (ton) 0 0.22 16.23 $0 $1,150 $0.00002Flyash (ton) 0 0 0.00 $0 $0 $0.00000Slag (ton) 0 1,889 16.23 $0 $10,069,904 $0.20103
Subtotal-Waste Disposal $0 $10,121 ,902 $0.20207
By-products & Emissions Sulfur (tons) 0 116 0.00 $0 $0 $0.00000Supplemental Electricity (for sale) (MWh) 0 1,105 58.00 $0 -$21,061,948 -$0.42048
Subtotal By-Products $0 -$21 ,061 ,948 -$0.42048
TOTAL VARIABLE OPERATING COSTS $17,539,529 $38,261 ,284 $0.76384
Fuel (ton) 0 18,779 10.92 $0 $67,361 ,980 $1 .34480

Cost and Performance Baseline for Coal-to-SNG and Ammonia (Volume 2)
279
Exhibit 5-41 Case 8 Total Plant Cost Details Client: USDOE/NETL R e port Da te : 2010-Feb-18
Project: Cost & Performance Baseline for Fossil Energy Plants Vol.2
Case: Case 8 - Siemens Quench SNG Production w/ CO2Plant Size: -3.43 MW,net Est imate Type: Conceptual Cost Base (Jun) 2007 ($x1000)
Acct Equipment Material Labor Sales Bare Erected Eng'g CM Contingencies Total Plant CostNo. I tem/Descript ion Cost Cost Direct Indirect Tax Cost $ H.O.& Fee Process Project $
1 COAL & SORBENT HANDLING1.1 Coal Receive & Unload $7,733 $0 $3,779 $0 $0 $11,512 $1,031 $0 $2,509 $15,0521.2 Coal Stackout & Reclaim $9,993 $0 $2,423 $0 $0 $12,415 $1,088 $0 $2,701 $16,2041.3 Coal Conveyors & Yd Crush $9,291 $0 $2,397 $0 $0 $11,688 $1,026 $0 $2,543 $15,2561.4 Other Coal Handling $2,431 $0 $555 $0 $0 $2,985 $261 $0 $649 $3,8961.5 Sorbent Receive & Unload $0 $0 $0 $0 $0 $0 $0 $0 $0 $01.6 Sorbent Stackout & Reclaim $0 $0 $0 $0 $0 $0 $0 $0 $0 $01.7 Sorbent Conveyors $0 $0 $0 $0 $0 $0 $0 $0 $0 $01.8 Other Sorbent Handling $0 $0 $0 $0 $0 $0 $0 $0 $0 $01.9 Coal & Sorbent Hnd.Foundations $0 $5,472 $13,683 $0 $0 $19,155 $1,836 $0 $4,198 $25,189
SUBTOTAL 1 . $29,447 $5,472 $22,836 $0 $0 $57,755 $5,243 $0 $12,600 $75,598 2 COAL & SORBENT PREP & FEED
2.1 Coal Crushing & Drying $127,899 $0 $18,636 $0 $0 $146,535 $13,308 $0 $31,969 $191,8112.2 Prepared Coal Storage & Feed $6,058 $1,450 $950 $0 $0 $8,457 $723 $0 $1,836 $11,0172.3 Dry Coal Injection System $199,367 $2,314 $18,515 $0 $0 $220,197 $18,965 $0 $47,832 $286,9942.4 Misc.Coal Prep & Feed $3,331 $2,424 $7,268 $0 $0 $13,024 $1,197 $0 $2,844 $17,0652.5 Sorbent Prep Equipment $0 $0 $0 $0 $0 $0 $0 $0 $0 $02.6 Sorbent Storage & Feed $0 $0 $0 $0 $0 $0 $0 $0 $0 $02.7 Sorbent Injection System $0 $0 $0 $0 $0 $0 $0 $0 $0 $02.8 Booster Air Supply System $0 $0 $0 $0 $0 $0 $0 $0 $0 $02.9 Coal & Sorbent Feed Foundation $0 $12,948 $10,631 $0 $0 $23,579 $2,184 $0 $5,153 $30,916
SUBTOTAL 2. $336,655 $19,136 $56,001 $0 $0 $411 ,792 $36,377 $0 $89,634 $537,802 3 FEEDWATER & MISC. BOP SYSTEMS
3.1 Feedwater System $3,454 $1,605 $1,947 $0 $0 $7,006 $633 $0 $1,528 $9,1683.2 Water Makeup & Pretreating $656 $69 $367 $0 $0 $1,092 $104 $0 $359 $1,5553.3 Other Feedwater Subsystems $3,750 $1,134 $1,855 $0 $0 $6,739 $612 $0 $1,470 $8,8213.4 Service Water Systems $376 $774 $2,685 $0 $0 $3,834 $374 $0 $1,262 $5,4703.5 Other Boiler Plant Systems $2,016 $781 $1,936 $0 $0 $4,733 $449 $0 $1,036 $6,2183.6 FO Supply Sys & Nat Gas $102 $210 $188 $0 $0 $500 $48 $0 $110 $6583.7 Waste Treatment Equipment $918 $0 $560 $0 $0 $1,477 $144 $0 $486 $2,1083.8 Misc. Power Plant Equipment $1,639 $219 $841 $0 $0 $2,700 $261 $0 $888 $3,848
SUBTOTAL 3. $12,911 $4,792 $10,379 $0 $0 $28,081 $2,625 $0 $7,140 $37,845 4 GASIFIER & ACCESSORIES
4.1 Gasifier, Syngas Cooler & Auxiliaries $325,357 $0 $150,637 $0 $0 $475,994 $42,277 $71,399 $88,451 $678,1214.2 Syngas Cooling w/4.1 $0 w/ 4.1 $0 $0 $0 $0 $0 $0 $04.3 ASU/Oxidant Compression $246,271 $0 w/equip. $0 $0 $246,271 $23,871 $0 $27,014 $297,1564.4 LT Heat Recovery & FG Saturation $51,285 $0 $19,002 $0 $0 $70,287 $6,733 $0 $15,404 $92,4244.5 Misc. Gasification Equipment w/4.1&4.2 $0 w/4.1&4.2 $0 $0 $0 $0 $0 $0 $04.6 Flare Stack System $0 $2,260 $920 $0 $0 $3,180 $305 $0 $697 $4,1824.7 CO2 Solid Feed System Compressors $8,698 $2,087 $3,131 $0 $0 $13,916 $1,392 $0 $3,062 $18,3694.8 Major Component Rigging w/4.1&4.2 $0 w/4.1&4.2 $0 $0 $0 $0 $0 $0 $04.9 Gasification Foundations $0 $26,928 $15,365 $0 $0 $42,293 $3,872 $0 $11,541 $57,706
SUBTOTAL 4. $631 ,611 $31 ,276 $189,055 $0 $0 $851 ,942 $78,449 $71 ,399 $146,169 $1 ,147,958
TOTAL PLANT COST SUMMARY

Cost and Performance Baseline for Coal-to-SNG and Ammonia (Volume 2)
280
Exhibit 5-41 Case 8 Total Plant Cost Details (continued) Acct Equipment Material Labor Sales Bare Erected Eng'g CM Contingencies Total Plant CostNo. Item/Description Cost Cost Direct Indirect Tax Cost $ H.O.& Fee Process Project $
5A GAS CLEANUP & PIPING5A.1 Double Stage Selexol $130,462 $0 $110,700 $0 $0 $241,162 $23,323 $48,232 $62,543 $375,2615A.2 Elemental Sulfur Plant $8,848 $1,764 $11,416 $0 $0 $22,028 $2,140 $0 $4,834 $29,0015A.3 Mercury Removal $2,347 $0 $1,786 $0 $0 $4,134 $399 $207 $948 $5,6875A.4 Shift Reactors $10,263 $0 $4,131 $0 $0 $14,393 $1,380 $0 $3,155 $18,9285A.5 Methanation $26,350 $10,540 $15,810 $0 $0 $52,700 $5,270 $5,270 $12,648 $75,8885A.6 SNG Purification & Compression $18,600 $7,440 $11,160 $0 $0 $37,200 $3,720 $0 $8,184 $49,1045A.7 Fuel Gas Piping $0 $1,630 $1,141 $0 $0 $2,772 $257 $0 $606 $3,6345A.9 Process Interconnects $0 $12,000 $18,000 $0 $0 $30,000 $3,000 $0 $6,600 $39,600
5A.10 HGCU Foundations $0 $1,651 $1,064 $0 $0 $2,715 $249 $0 $889 $3,8545A.11 Zinc Oxide Guard Bed $758 $0 $140 $0 $0 $897 $90 $0 $197 $1,185
SUBTOTAL 5A. $197,628 $35,024 $175,348 $0 $0 $408,000 $39,828 $53,709 $100,604 $602,141 5B CO2 COMPRESSION
5B.1 CO2 Removal System $0 $0 $0 $0 $0 $0 $0 $0 $0 $05B.2 CO2 Compression & Drying $37,246 $0 $21,934 $0 $0 $59,180 $5,698 $0 $12,976 $77,853
SUBTOTAL 5B. $37,246 $0 $21 ,934 $0 $0 $59,180 $5,698 $0 $12,976 $77,853 6 COMBUSTION TURBINE/ACCESSORIES
6.1 Combustion Turbine Generator $0 $0 $0 $0 $0 $0 $0 $0 $0 $06.2 Syngas Expander $0 $0 $0 $0 $0 $0 $0 $0 $0 $06.3 Compressed Air Piping $0 $0 $0 $0 $0 $0 $0 $0 $0 $06.9 Combustion Turbine Foundations $0 $0 $0 $0 $0 $0 $0 $0 $0 $0
SUBTOTAL 6. $0 $0 $0 $0 $0 $0 $0 $0 $0 $0 7 HRSG, DUCTING & STACK
7.1 Heat Recovery Steam Generator $0 $0 $0 $0 $0 $0 $0 $0 $0 $07.2 HRSG Accessories $0 $0 $0 $0 $0 $0 $0 $0 $0 $07.3 Ductwork $0 $0 $0 $0 $0 $0 $0 $0 $0 $07.4 Stack $0 $0 $0 $0 $0 $0 $0 $0 $0 $07.9 HRSG,Duct & Stack Foundations $0 $0 $0 $0 $0 $0 $0 $0 $0 $0
SUBTOTAL 7. $0 $0 $0 $0 $0 $0 $0 $0 $0 $0 8 STEAM TURBINE GENERATOR
8.1 Steam TG & Accessories $31,587 $0 $5,482 $0 $0 $37,069 $3,557 $0 $4,063 $44,6898.2 Turbine Plant Auxiliaries $171 $0 $504 $0 $0 $675 $66 $0 $74 $8158.3a Condenser & Auxiliaries $3,352 $0 $1,548 $0 $0 $4,899 $470 $0 $537 $5,9078.3b Air Cooled Condenser $30,717 $0 $6,158 $0 $0 $36,875 $3,687 $0 $8,112 $48,6758.4 Steam Piping $5,449 $0 $3,833 $0 $0 $9,283 $797 $0 $2,520 $12,6008.9 TG Foundations $0 $1,090 $1,843 $0 $0 $2,934 $278 $0 $964 $4,175
SUBTOTAL 8. $71 ,275 $1 ,090 $19,369 $0 $0 $91 ,735 $8,857 $0 $16,270 $116,862

Cost and Performance Baseline for Coal-to-SNG and Ammonia (Volume 2)
281
Exhibit 5-41 Case 8 Total Plant Cost Details (continued) Acct Equipment Material Labor Sales Bare Erected Eng'g CM Contingencies Total Plant CostNo. Item/Description Cost Cost Direct Indirect Tax Cost $ H.O.& Fee Process Project $
9 COOLING WATER SYSTEM9.1 Cooling Towers $7,817 $0 $1,422 $0 $0 $9,239 $880 $0 $1,518 $11,6379.2 Circulating Water Pumps $2,078 $0 $88 $0 $0 $2,166 $182 $0 $352 $2,7009.3 Circ.Water System Auxiliaries $168 $0 $24 $0 $0 $192 $18 $0 $32 $2429.4 Circ.Water Piping $0 $7,009 $1,817 $0 $0 $8,826 $798 $0 $1,925 $11,5489.5 Make-up Water System $360 $0 $515 $0 $0 $875 $84 $0 $192 $1,1509.6 Component Cooling Water Sys $827 $990 $704 $0 $0 $2,521 $236 $0 $551 $3,3099.9 Circ.Water System Foundations $0 $2,566 $4,363 $0 $0 $6,929 $657 $0 $2,276 $9,862
SUBTOTAL 9. $11 ,250 $10,565 $8,933 $0 $0 $30,748 $2,855 $0 $6,845 $40,44810 ASH/SPENT SORBENT HANDLING SYS
10.1 Slag Dewatering & Cooling $49,571 $0 $48,892 $0 $0 $98,463 $9,540 $0 $10,800 $118,80410.2 Gasifier Ash Depressurization w/10.1 w/10.1 w/10.1 $0 $0 $0 $0 $0 $0 $010.3 Cleanup Ash Depressurization w/10.1 w/10.1 w/10.1 $0 $0 $0 $0 $0 $0 $010.4 High Temperature Ash Piping $0 $0 $0 $0 $0 $0 $0 $0 $0 $010.5 Other Ash Recovery Equipment $0 $0 $0 $0 $0 $0 $0 $0 $0 $010.6 Ash Storage Silos $1,072 $0 $1,167 $0 $0 $2,239 $217 $0 $368 $2,82510.7 Ash Transport & Feed Equipment $1,438 $0 $347 $0 $0 $1,785 $167 $0 $293 $2,24510.8 Misc. Ash Handling Equipment $2,221 $2,722 $813 $0 $0 $5,756 $548 $0 $946 $7,25010.9 Ash/Spent Sorbent Foundation $0 $95 $119 $0 $0 $214 $20 $0 $70 $304
SUBTOTAL 10. $54,303 $2,817 $51 ,338 $0 $0 $108,458 $10,492 $0 $12,477 $131 ,42711 ACCESSORY ELECTRIC PLANT
11.1 Generator Equipment $435 $0 $430 $0 $0 $866 $83 $0 $95 $1,04311.2 Station Service Equipment $6,156 $0 $555 $0 $0 $6,711 $619 $0 $733 $8,06211.3 Switchgear & Motor Control $11,381 $0 $2,070 $0 $0 $13,451 $1,248 $0 $2,205 $16,90311.4 Conduit & Cable Tray $0 $5,287 $17,441 $0 $0 $22,728 $2,198 $0 $6,231 $31,15711.5 Wire & Cable $0 $10,101 $6,637 $0 $0 $16,738 $1,216 $0 $4,489 $22,44311.6 Protective Equipment $0 $807 $2,936 $0 $0 $3,743 $366 $0 $616 $4,72411.7 Standby Equipment $317 $0 $309 $0 $0 $626 $60 $0 $103 $78911.8 Main Power Transformers $10,063 $0 $172 $0 $0 $10,234 $776 $0 $1,652 $12,66211.9 Electrical Foundations $0 $186 $489 $0 $0 $675 $65 $0 $222 $962
SUBTOTAL 11 . $28,352 $16,381 $31 ,039 $0 $0 $75,772 $6,629 $0 $16,345 $98,74712 INSTRUMENTATION & CONTROL
12.1 IGCC Control Equipment w/4.1 $0 w/4.1 $0 $0 $0 $0 $0 $0 $012.2 Combustion Turbine Control w/6.1 $0 w/6.1 $0 $0 $0 $0 $0 $0 $012.3 Steam Turbine Control w/8.1 $0 w/8.1 $0 $0 $0 $0 $0 $0 $012.4 Other Major Component Control $516 $0 $345 $0 $0 $860 $81 $43 $148 $1,13312.5 Signal Processing Equipment w/12.7 $0 w/12.7 $0 $0 $0 $0 $0 $0 $012.6 Control Boards,Panels & Racks $343 $0 $220 $0 $0 $562 $53 $28 $129 $77212.7 Computer & Accessories $5,483 $0 $176 $0 $0 $5,659 $519 $283 $646 $7,10712.8 Instrument Wiring & Tubing $0 $2,778 $5,678 $0 $0 $8,456 $717 $423 $2,399 $11,99512.9 Other I & C Equipment $4,088 $0 $1,985 $0 $0 $6,074 $571 $304 $1,042 $7,991
SUBTOTAL 12. $10,430 $2,778 $8,403 $0 $0 $21 ,611 $1 ,943 $1 ,081 $4,364 $28,998

Cost and Performance Baseline for Coal-to-SNG and Ammonia (Volume 2)
282
Exhibit 5-41 Case 8 Total Plant Cost Details (continued) Acct Equipment Material Labor Sales Bare Erected Eng'g CM Contingencies Total Plant CostNo. Item/Description Cost Cost Direct Indirect Tax Cost $ H.O.& Fee Process Project $
13 IMPROVEMENTS TO SITE13.1 Site Preparation $0 $141 $3,021 $0 $0 $3,162 $314 $0 $1,043 $4,51913.2 Site Improvements $0 $2,514 $3,341 $0 $0 $5,855 $578 $0 $1,930 $8,36213.3 Site Facilities $4,505 $0 $4,754 $0 $0 $9,259 $913 $0 $3,051 $13,223
SUBTOTAL 13. $4,505 $2,655 $11 ,115 $0 $0 $18,276 $1 ,804 $0 $6,024 $26,10414 BUILDINGS & STRUCTURES
14.1 Combustion Turbine Area $0 $0 $0 $0 $0 $0 $0 $0 $0 $014.2 Steam Turbine Building $0 $2,623 $3,737 $0 $0 $6,360 $585 $0 $1,042 $7,98714.3 Administration Building $0 $870 $630 $0 $0 $1,500 $134 $0 $245 $1,87914.4 Circulation Water Pumphouse $0 $160 $90 $0 $0 $250 $22 $0 $41 $31214.5 Water Treatment Buildings $0 $549 $535 $0 $0 $1,084 $98 $0 $177 $1,35914.6 Machine Shop $0 $445 $305 $0 $0 $750 $67 $0 $123 $93914.7 Warehouse $0 $726 $464 $0 $0 $1,190 $105 $0 $194 $1,48914.8 Other Buildings & Structures $0 $514 $400 $0 $0 $914 $82 $0 $199 $1,19514.9 Waste Treating Building & Str. $0 $1,149 $2,196 $0 $0 $3,346 $312 $0 $732 $4,389
SUBTOTAL 14. $0 $7,036 $8,358 $0 $0 $15,394 $1 ,404 $0 $2,752 $19,550
TOTAL COST $1,425,614 $139,022 $614,108 $0 $0 $2,178,744 $202,203 $126,189 $434,199 $2,941 ,335
Owner's CostsPreproduction Costs
6 Months All Labor $22,1661 Month Maintenance Materials $3,939
1 Month Non-fuel Consumables $7671 Month Waste Disposal $937
25% of 1 Months Fuel Cost at 100% CF $1,5592% of TPC $58,827
Total $88,196Inventory Capital
60 day supply of fuel and consumables at 100% CF $13,4570.5% of TPC (spare parts) $14,707
Total $28,164
Initial Cost for Catalyst and Chemicals $16,258Land $900
Other Owner's Costs $441,200Financing Costs $79,416
Total Overnight Costs (TOC) $3,595,468TASC Multiplier 1.201
Total As-Spent Cost (TASC) $4,318,158

Cost and Performance Baseline for Coal-to-SNG and Ammonia (Volume 2)
283
Exhibit 5-42 Case 8 Initial and Annual O&M Costs INITIAL & ANNUAL O&M EXPENSES Cost Base (Jun): 2007
Case 8 - Siemens Quench SNG Production w/ CO2 MWe-net: -3SNG (MMbtu/hr): 6349 Capacity Factor (%): 90
OPERATING & MAINTENANCE LABOROperating Labor
Operating Labor Rate(base): 34.65 $/hour Operating Labor Burden: 30.00 % of base Labor O-H Charge Rate: 25.00 % of labor
Total Operating Labor Requirements(O.J.)per Shift: 1 unit/mod. Plant Skilled Operator 2.0 2.0 Operator 12.0 12.0 Foreman 1.0 1.0 Lab Tech's, etc. 3.0 3.0 TOTAL-O.J.'s 18.0 18.0
Annual Cost Annual Unit Cost$ $/MMBtu
Annual Operating Labor Cost $7,102,696 $0.142Maintenance Labor Cost $28,362,952 $0.567Administrative & Support Labor $8,866,412 $0.177Property Taxes and Insurance $58,826,693 $1.175TOTAL FIXED OPERATING COSTS $103,158,753 $2.061VARIABLE OPERATING COSTS
$/MMBtuMaintenance Material Cost $42,544,428 $0.84994
Consumables Consumption Unit Initial Fill Initial Fill /Day Cost Cost
Water(/1000 gallons) 0 3,694 1.08 $0 $1 ,312,704 $0.02622
ChemicalsMU & WT Chem.(lb) 0 22,010 0.17 $0 $1,251,314 $0.02500Carbon (Mercury Removal) (lb) 214,355 367 1.05 $225,110 $126,624 $0.00253COS Catalyst (m3) 0 0 2,397.36 $0 $0 $0.00000Water Gas Shift Catalyst (ft3) 7,580 6.49 498.83 $3,780,914 $1,063,382 $0.02124ZnO Sorbent (ton) 61 0.21 12,574.00 $772,815 $869,417 $0.01737Methanation Catalyst (ft3) 11,347 8.64 440.00 $4,992,625 $1,248,156 $0.02494Selexol Solution (gal) 484,145 154 13.40 $6,486,691 $676,998 $0.01352SCR Catalyst (m3) 0 0 0.00 $0 $0 $0.00000Aqueous Ammonia (ton) 0 0 0.00 $0 $0 $0.00000Claus Catalyst (ft3) w/equip 1.63 131.27 $0 $70,295 $0.00140
Subtotal Chemicals $16,258,155 $5,306,187 $0.10601
OtherSupplemental Fuel (MBtu) 0 0 0.00 $0 $0 $0.00000Supplemental Electricity (for consumption) (M 0 82 61.60 $0 $1,665,795 $0.03328Gases,N2 etc.(/100scf) 0 0 0.00 $0 $0 $0.00000L.P. Steam(/1000 pounds) 0 0 0.00 $0 $0 $0.00000
Subtotal Other $0 $1 ,665,795 $0.03328
Waste DisposalSpent Mercury Catalyst (lb.) 0 367 0.42 $0 $50,289 $0.00100Spent ZnO Sorbent (ton) 0 0.21 16.23 $0 $1,122 $0.00002Flyash (ton) 0 0 0.00 $0 $0 $0.00000Slag (ton) 0 1,889 16.23 $0 $10,069,904 $0.20117
Subtotal-Waste Disposal $0 $10,121 ,315 $0.20220
By-products & Emissions Sulfur (tons) 0 116 0.00 $0 $0 $0.00000Supplemental Electricity (for sale) (MWh) 0 0 58.00 $0 $0 $0.00000
Subtotal By-Products $0 $0 $0.00000
TOTAL VARIABLE OPERATING COSTS $16,258,155 $60,950,429 $1 .21765
Fuel (ton) 0 18,779 10.92 $0 $67,361 ,980 $1 .34574

Cost and Performance Baseline for Coal-to-SNG and Ammonia (Volume 2)
284
This page intentionally left blank

Cost and Performance Baseline for Coal-to-SNG and Ammonia (Volume 2)
285
6.
6.1 PERFORMANCE
SUMMARY
The nominal thermal input for the Siemens gasifier used for all cases in this study is 500 MW, but actual input varies with coal type. The bituminous coal cases in this study had a thermal input of 549 MW per gasifier, the PRB cases 527 MW and the lignite cases 506 MW. For the co-production cases, a portion of the syngas was used to produce 2,000 tonnes/day (2,204 tons/day) of ammonia with the remaining syngas producing approximately 1.2 BNm3/year (42 Bscf/year) of SNG at 90 percent CF.
The performance summaries for all cases are shown in Exhibit 6-1. The HHV efficiencies are shown in Exhibit 6-2. The higher and lower heating values (LHVs) of the SNG production are shown in Exhibit 6-3.
• The cases using PRB coal have the highest net conversion efficiency at 63.1 percent and the highest SNG product heating value at 973 Btu/scf (HHV) and 876 Btu/scf (LHV). The lower nitrogen content of the lower rank PRB and lignite coals aids in boosting the HHV of the SNG end-product, and consequently the net conversion efficiency.
• The remaining six cases have essentially constant conversion efficiency (61.3 to 61.5 percent). The addition of carbon sequestration has only a minimal impact on conversion efficiency. The sequestration impact is seen in the reduced available export power relative to the non-sequestration case.

Cost and Performance Baseline for Coal-to-SNG and Ammonia (Volume 2)
286
Exhibit 6-1 Performance, Emissions, and Cost Results
PERFORMANCE Case 1 Case 2 Case 3 Case 4 Case 5 Case 6 Case 7 Case 8CO2 Sequestration No Yes No Yes No Yes No YesSNG Production (Bscf/year)1 57 56 42 42 55 55 52 52Ammonia Production (TPD)1 N/A N/A 2,204 2,204 N/A N/A N/A N/AHHV Conversion Efficiency, % 61.4% 61.3% 61.5% 61.4% 63.1% 63.1% 61.5% 61.5%Gross Power Output (kWe) 308,000 310,600 292,300 292,300 302,000 302,000 305,800 310,500Auxiliary Power Requirement (kWe) 216,350 262,090 263,600 316,030 247,570 300,190 259,740 313,930Net Power Output (kWe) 91,650 48,510 28,700 -23,730 54,430 1,810 46,060 -3,430Coal Flowrate (lb/hr) 964,752 964,752 964,000 964,000 1,259,331 1,259,331 1,564,932 1,564,932HHV Thermal Input (kWth) 3,298,455 3,298,455 3,295,885 3,295,885 3,160,745 3,160,745 3,034,796 3,034,796Raw Water Withdrawal (gpm) 7,169 7,123 7,434 7,458 4,853 5,509 4,421 5,131Process Water Discharge (gpm) 1,462 1,451 1,455 1,461 1,071 1,218 1,071 1,230Raw Water Consumption (gpm) 5,708 5,672 5,979 5,997 3,783 4,291 3,350 3,901CO2 Emissions (lb/MMBtu)2 128 5 147 10 140 0.7 147 0.9SO2 Emissions (lb/MMBtu)2 0.0274 0.0003 0.0229 0.0006 0.0218 0.0000 0.0239 0.0000NOx Emissions (lb/MMBtu)2 Negligible Negligible Negligible Negligible Negligible Negligible Negligible NegligiblePM Emissions (lb/MMBtu)2 0.007 0.007 0.007 0.007 0.007 0.007 0.007 0.007Hg Emissions (lb/MMBtu)2 5.71E-07 5.71E-07 5.71E-07 5.71E-07 3.51E-07 3.51E-07 5.60E-07 5.60E-07COSTTotal Plant Cost ($ x 1,000) 2,628,754 2,692,997 3,048,463 3,119,611 2,741,044 2,813,258 2,864,478 2,941,335Total Overnight Cost ($ x 1,000) 3,235,262 3,312,740 3,742,411 3,829,817 3,354,442 3,442,310 3,504,262 3,595,468Total As-spent Capital ($ x 1,000) 3,885,549 3,978,601 4,494,636 4,599,610 4,028,684 4,134,215 4,208,619 4,318,158SNG FYCOP ($/MMBtu)1 19.27 20.95 15.82 17.85 19.15 21.01 21.27 23.24 CO 2 TS&M Costs 0.00 0.91 0.00 1.29 0.00 0.96 0.00 1.03 Fuel Costs 2.67 2.67 1.89 1.89 1.41 1.41 1.34 1.35 Variable Costs 1.03 1.04 0.79 0.82 1.02 1.03 1.18 1.18 Fixed Costs 1.76 1.79 1.41 1.45 1.84 1.86 2.03 2.06 Electricity Costs -0.77 -0.41 -0.17 0.15 -0.46 -0.02 -0.42 0.03 Capital Costs 14.58 14.94 11.90 12.25 15.34 15.76 17.13 17.59Ammonia FYCOP3 ($/ton) - - 799 828 - - - -1 Based on a capacity factor of 90 percent for all cases2 Based on coal thermal input3 Ammonia price is correlated to historic natural gas costs
SNG OnlyRosebud PRB North Dakota LigniteIllinois No. 6 Coal
SNG Only SNG and Ammonia SNG Only

Cost and Performance Baseline for Coal-to-SNG and Ammonia (Volume 2)
287
Exhibit 6-2 Net Plant Conversion Efficiency (HHV)
Exhibit 6-3 SNG Heating Values
61.4% 61.3% 61.5% 61.4%63.1% 63.1%
61.5% 61.5%
0%
10%
20%
30%
40%
50%
60%
70%
SNG Illinois 6 SNG Illinois 6 w/ Capture
SNG/NH3Illinois 6
SNG/NH3 Illinois 6 w/
Capture
SNG PRB SNG PRB w/ Capture
SNG Lignite SNG Lignite w/ Capture
% C
onve
rsio
n Ef
ficie
ncy
(HH
V B
asis
)
964 964 964 964 973 973 970 969
867 867 867 867 876 876 873 872
0
200
400
600
800
1,000
1,200
SNG Illinois 6 SNG Illinois 6 w/ Capture
SNG/NH3Illinois 6
SNG/NH3 Illinois 6 w/ Capture
SNG PRB SNG PRB w/ Capture
SNG Lignite SNG Lignite w/ Capture
SNG
Hea
ting
Valu
e (B
tu/s
cf)
HHV
LHV

Cost and Performance Baseline for Coal-to-SNG and Ammonia (Volume 2)
288
6.2 ECONOMICS The TOCs are shown in Exhibit 6-4. For reference, Total As-spent Capital (TASC) is also shown. TASC is the sum of TOC, escalation during the capital expenditure period, and interest on debt during the capital expenditure period. Observations related to TOC include:
• In the SNG only cases, the TOC is lowest for the Illinois No. 6 cases followed by the PRB cases, and then by the lignite cases.
• The TOC increase to add carbon sequestration is approximately 2.4 percent for the Illinois No. 6 SNG only case, 2.4 percent for the co-production case, 2.6 percent for the PRB coal SNG only case, and 2.6 percent for the SNG only lignite case.
• The TOC is increased by 16 percent with the addition of ammonia co-production for both the Illinois No. 6 coal non-sequestration and sequestration cases.
• The lignite cases have 4 percent higher TOC compared to the PRB cases.
The FYCOPs are shown in Exhibit 6-5. The FYCOP components and SNG/ammonia product revenues are shown in tabular form in Exhibit 6-6. The following observations can be made:
• The FYCOP is dominated by capital charges in all cases. For the SNG only cases, the capital charges (which include owner’s costs) range from 71 to 81 percent of the total. For the co-production cases, the capital costs are 75 and 69 percent of the FYCOP for the non-sequestration and sequestration cases, respectively.
• The fuel cost component is highest for the Illinois No. 6 coal cases. For the SNG only cases the fuel represents 13 percent of the total cost for Illinois No. 6 coal, 7 percent for PRB coal, and 6 percent for lignite coal.
• The TS&M component is relatively minor for all cases, ranging from 4 percent to 7 percent.

Cost and Performance Baseline for Coal-to-SNG and Ammonia (Volume 2)
289
Exhibit 6-4 Total Overnight Cost and Total As-spent Capital
1,939 1,9882,271 2,325
2,024 2,079 2,120 2,179
180 185
213 218
188 193 197 202385 396
440 452
403 415 421 434125 125
125 125
126 126 126 126607 620
694 710
613 629 640 6543,235 3,313
3,742 3,830
3,354 3,442 3,504 3,5953,886 3,979
4,495 4,600
4,029 4,134 4,209 4,318
0
1,000
2,000
3,000
4,000
5,000
6,000
7,000
TOC TASC TOC TASC TOC TASC TOC TASC TOC TASC TOC TASC TOC TASC TOC TASC
SNG Illinois 6 SNG Illinois 6 w/ Capture
SNG/NH3Illinois 6
SNG/NH3 Illinois 6 w/ Capture
SNG PRB SNG PRB w/ Capture
SNG Lignite SNG Lignite w/ Capture
Capi
tal C
ost,
$1,
000,
000
TASC
Owner's Cost
Process Contingency
Project Contingency
Home Office Expense
Bare Erected Cost

Cost and Performance Baseline for Coal-to-SNG and Ammonia (Volume 2)
290
Exhibit 6-5 First Year Cost of Production
Exhibit 6-6 First Year Cost of Production Components
14.58 14.9411.90 12.25
15.34 15.76 17.13 17.59
1.76 1.79
1.41 1.45
1.84 1.862.03 2.06
1.03 1.04
0.79 0.82
1.02 1.031.18 1.18
2.67 2.67
1.89 1.89
1.41 1.411.34 1.35
0.91
1.29
0.96
1.0319.27
20.95
15.82
17.8519.15
21.01 21.2723.24
-5
0
5
10
15
20
25
30
35
40
SNG Illinois 6 SNG Illinois 6 w/ Capture
SNG/NH3Illinois 6
SNG/NH3 Illinois 6 w/ Capture
SNG PRB SNG PRB w/ Capture
SNG Lignite SNG Lignite w/ Capture
FYCO
P, $
/MM
Btu
CO2 TS&M Costs
Fuel Costs
Variable Costs
Fixed Costs
Capital Costs
Electricity Revenue/Cost
FYCOP Component1
SNG Bituminous No Capture
(Case 1)
SNG Bituminous w/ Capture (Case 2)
SNG and Ammonia
Bituminous No Capture
(Case 3)
SNG and Ammonia
Bituminous w/ Capture (Case 4)
SNG PRB
No Capture (Case 5)
SNG PRB
w/ Capture (Case 6)
SNG Lignite
No Capture (Case 7)
SNG Lignite
w/ Capture (Case 8)
Capital, $/MMBtu 14.58 14.94 11.90 12.25 15.34 15.76 17.13 17.59
Fixed O&M, $/MMBtu 1.76 1.79 1.41 1.45 1.84 1.86 2.03 2.06
Variable O&M, $/MMBtu
1.03 1.04 0.79 0.82 1.02 1.03 1.18 1.18
Fuel, $/MMBtu 2.67 2.67 1.89 1.89 1.41 1.41 1.34 1.35
Electricity, $/MMBtu -0.77 -0.41 -0.17 0.15 -0.46 -0.02 -0.42 0.03
CO2 TS&M, $/MMBtu 0.00 0.91 0.00 1.29 0.00 0.96 0.00 1.03
Total, $/MMBtu 19.27 20.95 15.82 17.85 19.15 21.01 21.27 23.24
SNG First Year Revenues, MM$
1,047 1,137 639 721 1,025 1,124 1,065 1,163
Ammonia First Year Revenues, MM$ - - 578 599 - - - -
1 Based on heating value of SNG

Cost and Performance Baseline for Coal-to-SNG and Ammonia (Volume 2)
291
The impact of various levels of CO2 tax on the FYCOP of SNG as well as the FYCOP of ammonia in the co-production cases is shown in Exhibit 6-7. In the co-production cases the cost of ammonia varies with the cost of SNG according to the following relationship:
Cases without sequestration are shown as solid lines while those with sequestration are shown as dashed lines. Taxation of plant CO2 emissions causes a significant increase in FYCOP in the non-sequestration cases while the increase is greatly diminished in the sequestration cases. It should be noted that end-use CO2 emissions from the SNG product are not accounted for.
Exhibit 6-7 shows that a carbon tax of $15-20/ton of CO2 is required to make SNG produced in a sequestration case less expensive than that produced in the corresponding non-sequestration case for SNG only cases. The carbon cost must increase to about $25/ton before the same is true in the co-production case.
Exhibit 6-7 Impact of CO2 Tax on FYCOP
6.3 CARBON DIOXIDE EMISSIONS/MITIGATION Carbon dioxide emissions are not currently regulated nationwide; however, there is increasing momentum for establishing carbon limits. CO2 emissions are presented in Exhibit 6-8 for each case, normalized by coal thermal input to enable comparison between the technology types (SNG only versus co-production). The following conclusions can be drawn:
0
5
10
15
20
25
30
35
40
45
50
0 10 20 30 40 50 60 70 80 90 100
SNG
FY
COP
($/M
MBt
u)
CO2 Tax ($/ton)
Case 7 SNG
Case 1 SNG
Case 5 SNG
Case 3 SNG
Case 8 SNG
Case 2 SNG
Case 6 SNG
Case 4 SNG
Non-capture cases
Capture cases

Cost and Performance Baseline for Coal-to-SNG and Ammonia (Volume 2)
292
• In cases with no carbon sequestration, the SNG only case using bituminous coal emits 12 percent less CO2 than the co-production case, 13 percent less than the lignite case, and 8 percent less than the PRB case.
• The CO2 emissions for the SNG only non-sequestration cases are proportional to the carbon intensity of the design coal. Based on fuel compositions used in this study, bituminous coal contains 55 pounds of carbon per million Btu, PRB and lignite coal contain 58 and 60 pounds per million Btu, respectively.
• The normalized CO2 emissions in the sequestration cases are lower for the low rank coal cases largely because the coal drying method utilized does not require the burning of syngas. The normalized CO2 emissions for the Illinois No. 6 co-production cases (both non-sequestration and sequestration) are higher than the equivalent SNG only cases because more CO2 is produced in the shift section of the ammonia plant due to the hydrogen requirements for ammonia production that is not subsequently captured.
Exhibit 6-8 CO2 Emissions Normalized by Thermal Input
6.4 RAW WATER WITHDRAWAL AND CONSUMPTION Water withdrawal, process discharge, and water consumption are shown in Exhibit 6-9 for each case. The primary conclusions that can be drawn are:
• In all cases, the primary water consumer is cooling tower makeup, which ranges from 60 to 80 percent of the total raw water withdrawal.
128.4
4.9
146.5
9.5
140.3
0.7
147.0
0.90
100
200
SNG Illinois 6 SNG Illinois 6 w/ Capture
SNG/NH3Illinois 6
SNG/NH3 Illinois 6 w/ Capture
SNG PRB SNG PRB w/ Capture
SNG Lignite SNG Lignite w/ Capture
CO2
Emis
sion
s (lb
/MM
Btu)

Cost and Performance Baseline for Coal-to-SNG and Ammonia (Volume 2)
293
• The SNG and ammonia co-production cases (Cases 3 and 4) consume approximately 5 percent more water than the SNG only cases using bituminous coal (Cases 1 and 2). This is largely due to the excess shift steam required to produce the hydrogen necessary for ammonia production.
• For the SNG only non-sequestration cases, the case using lignite coal requires the least amount of water withdrawal followed by the cases using PRB coal and bituminous coal. The relative raw water withdrawal for the SNG only cases is 1.6:1.1:1.0 (bituminous:PRB:lignite). The trend for the SNG only cases with carbon sequestration is 1.4:1.1:1.0 (bituminous:PRB:lignite).
Exhibit 6-9 Raw Water Withdrawal and Consumption
7.2 7.1 7.4 7.5
4.9
5.5
4.4
5.1
5.7 5.7 6.0 6.0
3.84.3
3.43.9
0
2
4
6
8
10
12
SNG Illinois 6 SNG Illinois 6 w/ Capture
SNG/NH3Illinois 6
SNG/NH3 Illinois 6 w/
Capture
SNG PRB SNG PRB w/ Capture
SNG Lignite SNG Lignite w/ Capture
Wat
er, g
pm x
1,0
00
Water Withdrawal
Process Discharge
Water Consumption

Cost and Performance Baseline for Coal-to-SNG and Ammonia (Volume 2)
294
This page intentionally left blank

Cost and Performance Baseline for Coal-to-SNG and Ammonia (Volume 2)
295
7.
1 Cost Estimation Methodology for NETL Assessments of Power Plant Performance, April 2011,
REFERENCES
http://www.netl.doe.gov/energy-analyses/refshelf/PubDetails.aspx?Action=View&PubId=355.
2 Dakota Gasification Company, http://www.dakotagas.com
3 Modified from Steigel, Gary J. “U.S. Gasification Experience Yesterday, Today, and Tomorrow.” IGCC Workshop India. February 20, 2008.
4 Udesen, Henrik, Haldor Topsoe A/S. An Integrated Approach to Ammonia Production. 19th AFA International Technical Conference, April 18-20, 2006, Doha, Qatar.
5 Christensen, P.V. Haldor Topsoe A/S. Design and Operation of Large Capacity Ammonia Plants. Presented at the 4th Conference for the Development and Integration of Petrochemical Industries in the Arab States. May 7-8, 2001. Bahrain.
6 Coal Specifications for Quality Guidelines, Revision 0, May 31, 2005
7 2004 Keystone Coal Industry Manual, A Mining Media Publication
8 1999 Environmental Protection Agency Information Collection Request Database with Coal Compositions for Over 37,000 Samples
9 NETL Power Systems Financial Model Version 5.0, December 2008 User Guide available at: http://www.netl.doe.gov/business/solicitations/ssc2008/references/PSFM%20User%20Guide.pdf
10 Gross Domestic Product: Chain-type Price Index, Seasonally Adjusted, http://research.stlouisfed.org/fred2/series/GDPCTPI
11 Personal Communication between John Wimer (NETL) and Diane Kearney (EIA), AEO 2007 Reference Case NEMS model forecasted average costs of delivering (transport cost only) to electric utilities in 2010, as shown in the AEO 2007 data provided by the EIA to NETL on March 30, 2007. (Source: aeo2007.d112106a)
12 “Pipeline Rules of Thumb Handbook,” p. 437, Ed. E.W. McAllister, 2002.
13 Dweck, Jacob et al., “Florida’s Gas Composition Decision Offers Preliminary Guidelines for US LNG Imports,” LNG Journal, May 2006
14 Appl, Max. Ammonia: principles and industrial practice. WIELY-VCH. Weinheim, Germany. 1999.
15 Telephone communication with David Denton, Eastman Chemical Co. 16 “Evaluation of Alternative IGCC Plant Designs for High Availability and Near
Zero Emissions: RAM Analysis and Impact of SCR,” EPRI, Palo Alto, CA, 2005, 1010461

Cost and Performance Baseline for Coal-to-SNG and Ammonia (Volume 2)
296
17 Higman, Christopher, DellaVilla, Sal, and Steele, Bob, “The Reliability of
Integrated Gasification Combined Cycle (IGCC) Power Generation Units,” Achema 2006, May 2006
18 Personal correspondence with Siemens Energy, Inc. on December 9, 2009
19 Cooling Tower Fundamentals, ed. John C. Hensley, 2nd Edition, The Marley Cooling Tower Company, Mission, Kansas, 1985
20 “Cost Estimate Classification System – As Applied in Engineering, Procurement, and Construction for the Process Industries; TCM Framework 7.3 – Cost Estimating and Budgeting,” AACE International Recommended Practice No. 18R-97, 2005
21 “Conducting Technical and Economic Evaluations – As Applied for the Process and Utility Industries; TCM Framework: 3.2 – Asset Planning, 3.3 Investment Decision Making, AACE International Recommended Practice 16R-90, 2003
22 Smith, Lawrence A., Gupta, Neeraj, Sass, Bruce M. and Bubenik, Thomas A., “Engineering and Economic Assessment of Carbon Dioxide Sequestration in Saline Formations,” Battelle Memorial Institute, 2001
23 Ciferno, Jared P. and McIlvried, Howard, “CO2 Flow Modeling and Pipe Diameter Determination,” February, 2003
24 Economic Evaluation of CO2 Storage and Sink Enhancement Options, Tennessee Valley Authority, NETL and EPRI, December 2002
25 Parker, N., “Using Natural Gas Transmission Pipeline Costs to Estimate Hydrogen Pipeline Costs,” Institute of Transportation Studies, University of California, Davis, CA, 2004.
26 Gresham, R. L., Apt, J., et. al, “Implications of Compensating Property-Owners for Geologic Sequestration of CO2,” Department of Engineering and Public Policy, Carnegie Mellon University, Pittsburgh, PA, 1999.
27 Klass, A.B., Wilson, E.J., “Climate Change and Carbon Sequestration: Assessing a Liability Regime for Long-Term Storage of Carbon Dioxide,” 58 Emory Law Journal 103, 2008
28 Senate Bill No. 2095, 61st Legislative Assembly of North Dakota, January 6th, 2009
29 House Bill No. 661, Louisiana House of Representatives Regular Session, 2009 30 Enrolled Act No. 20 (Original House Bill No. 58), 60th Legislature of the State of
Wyoming, General Session, 2009 31 Overview of Monitoring Requirements for Geologic Storage Projects. IEA
Greenhouse Gas R&D Programme, Report Number PH4/29, November 2004
32 Wen-yuan Huang, “Impact of Rising Natural Gas Prices on U.S. Ammonia Supply,” USDA Economic Research Service, August 2007, http://www.ers.usda.gov/publications/WRS0702/wrs0702.pdf

Cost and Performance Baseline for Coal-to-SNG and Ammonia (Volume 2)
297
33 Historic Natural Gas Prices, Energy Information Administration (EIA),
http://tonto.eia.doe.gov/dnav/ng/ng_pri_sum_dcu_nus_m.htm
34 Average U.S. Farm Prices of Selected Fertilizers, 1960-2008, Economic Research Service, USDA, Ammonia statistics, http://www.ers.usda.gov/Data/FertilizerUse/Tables/Table7.xls
35 Abram, Aleksander and Forster, Lynn, “A Primer on Ammonia, Nitrogen Fertilizers, and Natural Gas Markets,” September 30, 2005, Department of AED Economics, The Ohio State University
36 Zuideveld, P.L., “Shell Coal Gasification Process Using Low Rank Coal,” Gasification Technologies Conference, San Francisco, CA, October 2005
37 Eurlings, J. Th. G. M. and Ploeg, J.E.G., “Process Performance of the SCGP at Buggenum IGCC, Gasification Technologies Conference, San Francisco, CA, October 1999
38 IGCC Puertollano: A Clean Coal Gasification Plant, ELCOGAS, 2001
39 Maurstad, Ola et al., “Impact of Coal Quality and Gasifier Technology on IGCC Performance”
40 “Lignite-Fired Power Plant with Optimized Plant Technology (BoA),” RWE Power
41 Australia’s HRL Ltd. and China’s Harbin Power Sign Global Clean Coal Power Generation Agreement, HRL Limited Press Release, February 21, 2006
42 “Clean Coal Technology for Brown Coal Power Generation: Construction of a 10 MW Demonstration Facility,” The Australian Coal Review, October 1996
43 Kakaras, E. et al., “Concept study for a 700°C power plant: using poor quality brown coal with ultra supercritical PF boiler,” October 2006
44 Universal Industrial Gases, Inc., http://www.uigi.com/cryodist.html 45 Jenkins, Steve, “Real-World Experience with IGCC – Lessons Learned in Design,
Permitting, Operations and Maintenance,” URS Corporation, August 17, 2005 46 Personal communication, Ray Drnevich, Praxair, Inc.,
[email protected], November 2002 47 Larson, Eric D., et al, “Synthetic Fuel Production by Indirect Coal Liquefaction,”
Energy for Sustainable Development, Volume VII, No. 4, December 2003 48 http://www.calgoncarbon.com/bulletins/Mercury_Removal_Gas_Streams.htmn 49 http://www.calgoncarbon.com/bulletins/HGR-P.htm 50 http://www.calgoncarbon.com/bulletins/TYPE_HGR.htm
51 Meyer, Howard S., et al, “Direct Methanation - A New Method of Converting Synthesis Gas to Substitute Natural Gas”
52 “Methanation Catalysts,” International Energy Agency Coal Research, London, England, 1980

Cost and Performance Baseline for Coal-to-SNG and Ammonia (Volume 2)
298
53 Breckenridge, William, et al, “Use of Selexol Process in Coke Gasification to
Ammonia Project, Laurance Reid Conditioning Conference, February 27 – March 1, 2000, University of Oklahoma
54 Wix, C., et al, “Haldor Topsoe: Coal to SNG – The Methanation Process,” Twenty-fourth Annual International Pittsburgh Coal Conference, September 10-14, 2007, Johannesburg, South Africa.
55 Mitrariten, M.J., “Eliminating Carbon Dioxide from Coalbed Methane Using the Molecular Gate Adsorption Process,” Third Annual Coalbed and Coal Mine Methane Conference, Denver, March 2002.
56 Keeler, C. “ConocoPhillips: Substitute Natural Gas (SNG) Scrubbing the Carbon in Coal and Petcoke,” Gasification Technologies Conference, October 2, 2006, Washington, D.C.
57 Synthesis Gas Purification in Gasification to Ammonia/Urea Complex. Flour/UOP. Gasification Technologies Conference 2004.
58 Appl, M. Ammonia: Principles and Industrial Practice. Weinheim, Germany, Wiley, VCH, 1998.
59 Ammonia Synthesis Catalysts. KM1/KM1R: The Heart of the Ammonia Plant. Haldor Topsoe A/S. http://www.topsoe.com/Business_areas/Ammonia /~/media/ PDF%20files/Ammonia/Topsoe_ammonia_km1.ashx.
60 “Process Screening Analysis of Alternative Gas Treating and Sulfur Removal for Gasification,” Revised Final Report, December 2002, SFA Pacific for NETL