Embed Size (px)
Citation preview

CORROSION PERFORMANCE OF EPOXY-COATED REINFORCEMENT–BEAM TESTS
by
Khaled Z. Kahhaleh, Enrique Vaca-Cortés, James O. Jirsa, Harovel G. Wheat, and Ramón L. Carrasquillo
Research Report No. 1265-4
Research Project 1265
STRUCTURAL INTEGRITY OF EPOXY-COATED BARS
conducted for the
Texas Department of Transportation
by the
CENTER FOR TRANSPORTATION RESEARCH
BUREAU OF ENGINEERING RESEARCH
THE UNIVERSITY OF TEXAS AT AUSTIN
November 1998

iv

v
DISCLAIMERS
The contents of this report reflect the views of the authors, who are responsible for the facts and the accuracy of the data presented herein. The contents do not necessarily reflect the official views or policies of the Federal Highway Administration or the Texas Department of Transportation. This report does not constitute a standard, specification, or regulation.
There was no invention or discovery conceived or first actually reduced to practice in the course of or under this contract, including any art, method, process, machine, manufacture, design or composition of matter, or any new and useful improvement thereof, or any variety of plant, which is or may be patentable under the patent laws of the United States of America or any foreign country.
NOT INTENDED FOR CONSTRUCTION, BIDDING, OR PERMIT PURPOSES
James O. Jirsa, Texas P.E. #31360
Harovel G. Wheat, Texas P.E. #78364
Ramón L. Carrasquillo, Texas P.E. #63881
Research Supervisors
ABSTRACT
The performance of coated reinforcement under conditions which simulate a highly corrosive environment and under loading conditions producing concrete cracking was evaluated in a beam exposure test. Duplicate concrete beams were reinforced with unlinked coated and uncoated bars. Various arrangements of longitudinal bars, stirrups, and splices were considered. Coating condition was a variable to assess effects of damage and patching on performance. Some beams were uncracked while others were cracked and either unloaded or kept under load to maintain cracks at a specified maximum allowable crack width. Salt water flowed over the middle portions of beams in a cyclic wet and dry regime over a period of 112 14-day cycles (4.3 years). Loads were cycled on the cracked beams during wet and dry periods. The selection of the exposure procedure, test parameters, and specimen characteristics was intended to produce a very aggressive environment and to accelerate corrosion of the specimens. The state of corrosion activity on steel was monitored by corrosion potential measurements. Beam condition and changes in crack width were observed during exposure. Forensic examinations were conducted on each duplicate after 1 and 4.3 years to relate corrosion state findings to actual bar condition. Based on the findings, recommendations are provided for improving coating quality, fabrication and patching procedures. In addition, recommendations are given to minimize damage to coating and to control cracks in concrete.
PREFACE
This report is one of a series of reports on a project to evaluate the integrity and performance of epoxy-coated reinforcing bars used in transportation structures in the state of Texas. The report describes an investigation of the corrosion performance of straight and fabricated-coated bars embedded in concrete beams and subjected to chlorides. A number of beams were cracked prior to exposure. Few corrosion tests of cracked members under loads have been performed elsewhere. Some replicate specimens were maintained in a corrosive environment for about 4.3 years-some of the longest running tests of epoxy-coated reinforcement to date. Companion specimens have been autopsied at different times. In this manner, findings have been transmitted to TxDOT throughout the project to permit implementation of practices that will extend the service life of transportation structures.
vi
SUMMARY
Both coated longitudinal bars and stirrups underwent less severe corrosion than uncoated bars within the same specimen.∗ No deep pits, significant reduction of cross section, nor substantial metallurgical degradation were observed in the steel surface of epoxy-coated bars. In contrast, uncoated bars experienced severe pitting with substantial loss of cross-sectional area at crack locations. The coating condition was the most influential factor for corrosion performance. Greater coating damage led to more corrosion. In straight bars, epoxy coating with no visible damage provided excellent protection, while bars with 3% damage to coating underwent moderate underfilm corrosion. Patching damaged coating slightly improved performance but did not completely prevent corrosion. Patching bar cut ends was particularly ineffective because of the small thickness of patching and lack of surface anchor profile. Underfilm corrosion spread from patched ends and from patched or unpatched damaged areas.
Compared to coating condition, loading condition and presence of cracks had a lesser effect in performance of coated bars after 4.3 years of exposure. The main influence of concrete cracking and the loading producing cracks was on the time to corrosion initiation. Coated bars in cracked specimens corroded much earlier than those in uncracked beams, but in the long term, corrosion among coated bars from cracked and uncracked beams was similar. The absence of cracks delayed but did not prevent the accumulation of significant amounts of chlorides at bar locations. The effect of concrete cracking was particularly detrimental to uncoated bars. Severe pitting corrosion was observed in several uncoated bars at crack locations.∗∗ Loaded and unloaded beams showed similar behavior regardless of coating condition.
The practice of mixing coated and uncoated bars in the same concrete member may lead to undesirable performance. Any incidental continuity between coated and uncoated bars could establish large macrocells that would be conducive to extensive corrosion. An additional risk of mixing coated and uncoated reinforcement is the possibility of corrosion of uncoated bars, which was very severe in this study. Quality and consolidation of the surrounding concrete had an important influence on the corrosion of epoxy-coated bars. Coated bars tended to corrode slightly more when surrounded by less dense, more porous concrete. Measured corrosion potentials did not correlate with rate and severity of corrosion.
IMPLEMENTATION
The study revealed that damage to coating and concrete cracking were dominant factors to performance. Means to improve the quality of coating and minimize damage during production, fabrication, and placement were proposed. Coating bars after fabrication, and avoiding concrete cracking were recommended. Macrocell action between different types of reinforcement and between exposed areas of steel on the same bar could be eliminated in practice by avoiding mixing coated and uncoated bars and improving concrete quality. Patching all visible damage with thick coating is advisable to improve performance. The reliability and practical aspects of using half-cell potential measurements for determining the state of corrosion on coated bars in concrete should be investigated further. Recommendations based on findings from this study were incorporated in guidelines for epoxy-coated reinforcement (Research Report 1265-S). Some of the findings raised concerns that were addressed in complementary studies conducted in Project 1265. An investigation of materials and methods of patching is reported in Research Report 1265-5, and a study of concrete consolidation with epoxy-coated bars is included in Report 1265-2.
∗ There were no control beam specimens completely reinforced with black bars for a direct comparison of the performance of coated vs. uncoated bars. The comparison presented herein should be cautiously interpreted.
∗∗ Uncoated bars were in the compression side of the beams, away from the wet portion. The effect of cracks on the performance of black bars located within the wetted region of the beams could have been worse.
vii
Table of Contents
CHAPTER 1: INTRODUCTION............................................................................................... 1
1.1 GENERAL.........................................................................................................................................1
1.2 OBJECTIVES AND TEST CONCEPT ................................................................................................4
1.3 TEST VARIABLES ...........................................................................................................................6
1.3.1 General .................................................................................................................................6
1.3.2 Reinforcement Usage............................................................................................................6
1.3.3 Loading Conditions...............................................................................................................7
1.3.4 Epoxy Coating Damage Level ..............................................................................................7
1.3.5 Repair of Damage.................................................................................................................8
1.4 TEST SETUP AND PROCEDURE .....................................................................................................8
1.5 MEASUREMENTS AND OBSERVATIONS ....................................................................................10
CHAPTER 2: TEST RESULTS ............................................................................................... 13
2.1 CORROSION POTENTIALS............................................................................................................13
2.1.1 General ...............................................................................................................................13
2.1.2 Group I Specimens (Longitudinal Bars) .............................................................................26
2.1.3 Group II Specimens (Stirrups) ............................................................................................35
2.1.4 Group III Specimens (Longitudinal Bars, Spliced Bars, and Stirrups with no Electrical
Isolation).............................................................................................................................40
2.2 SPECIMEN SURFACE CONDITION ...............................................................................................43
2.2.1 Group I Specimens..............................................................................................................44
2.2.2 Group II Specimens ............................................................................................................46
2.2.3 Group III Specimens ...........................................................................................................50
2.3 CRACK WIDTHS............................................................................................................................52
2.3.1 General ...............................................................................................................................52
2.3.2 Crack Width Change with Time..........................................................................................53
2.4 FORENSIC EXAMINATION ...........................................................................................................54
2.4.1 General ...............................................................................................................................54
2.4.2 Concrete Delamination.......................................................................................................54
2.4.3 Chloride Content at Steel Level ..........................................................................................55
2.4.4 Appearance at Removal from Concrete..............................................................................58
2.4.5 Coating Removal.................................................................................................................72
2.4.6 Underfilm Corrosion...........................................................................................................76
viii
2.4.7 Appearance of Concrete Fragments and Bar Trace in Concrete .......................................85
CHAPTER 3: ANALYSIS AND DISCUSSION OF TEST RESULTS................................. 91
3.1 GENERAL.......................................................................................................................................91
3.2 TIME-TO-CORROSION ..................................................................................................................92
3.2.1 General ...............................................................................................................................92
3.2.2 Longitudinal Bars ...............................................................................................................92
3.2.3 Stirrups ...............................................................................................................................92
3.3 CORROSION ACTIVITY ................................................................................................................93
3.3.1 General ...............................................................................................................................93
3.3.2 Corrosion Potential Readings ............................................................................................94
3.3.3 Corrosion Potential Differences.......................................................................................101
3.3.4 Effects of Concrete Cracking............................................................................................105
3.3.5 Effects of Chloride Concentrations...................................................................................111
3.4 CONDITION OF REINFORCING STEEL ......................................................................................112
3.4.1 Bar Surface Corrosion......................................................................................................112
3.4.2 Coating Adhesion to Steel.................................................................................................117
3.4.3 Undercutting .....................................................................................................................120
3.4.4 Black Corrosion Products ................................................................................................123
3.4.5 Coating Blistering.............................................................................................................124
3.5 CONCRETE CONSOLIDATION AROUND REINFORCING BARS ...............................................124
3.5.1 General .............................................................................................................................124
3.5.2 Differences in Concrete Consolidation.............................................................................124
3.5.3 Influence of Concrete Consolidation on Corrosion..........................................................125
3.6 CORROSION MECHANISM .........................................................................................................127
3.6.1 Corrosion Performance of Longitudinal Coated Bars .....................................................127
3.6.2 Corrosion Performance of Coated Stirrups......................................................................133
3.6.3 Macrocell Corrosion of Uncoated Bars ...........................................................................137
3.6.4 Concrete Deterioration.....................................................................................................138
CHAPTER 4: SUMMARY, CONCLUSIONS AND RECOMMENDATIONS................. 141
4.1 SUMMARY ...................................................................................................................................141
4.2 CONCLUSIONS ............................................................................................................................141
4.2.1 Onset of Corrosion............................................................................................................141
4.2.2 Uncoated vs. Coated Steel ................................................................................................141
4.2.3 Field and Laboratory Conditions .....................................................................................142

ix
4.2.4 Effect of Coating Damage.................................................................................................142
4.2.5 Repair of Coating Damage...............................................................................................143
4.2.6 Effect of Loading and Cracking........................................................................................144
4.2.7 Longitudinal vs. Transverse Reinforcement .....................................................................145
4.2.8 Corrosion Potentials.........................................................................................................145
4.2.9 Mixing Uncoated and Coated Steel ..................................................................................146
4.2.10 Effects of Concrete Environment ......................................................................................146
4.2.11 Corrosion Mechanism.......................................................................................................147
4.3 RECOMMENDATIONS.................................................................................................................147
4.3.1 Quality of Coating ............................................................................................................147
4.3.2 Specifications....................................................................................................................147
4.3.3 Design Recommendations.................................................................................................148
4.3.4 Field Recommendations....................................................................................................148
APPENDIX A: DETAILS OF BEAM EXPOSURE TEST.................................................. 149
A.1 SPECIMEN DESIGN ......................................................................................................................149
A.1.1 General ..............................................................................................................................149
A.2 EPOXY-COATED REINFORCING STEEL .....................................................................................151
A.2.1 Steel Procurement..............................................................................................................151
A.2.2 Bar Identification...............................................................................................................151
A.2.3 Steel Tensile Strength.........................................................................................................152
A.2.4 Epoxy-Coating Thickness ..................................................................................................153
A.2.5 Coating Defects and Introduced Damage..........................................................................155
A.3 UNCOATED REINFORCING STEEL .............................................................................................157
A.4 FORMWORK AND STEEL INSTALLATION .................................................................................157
A.4.1 Formwork...........................................................................................................................157
A.4.2 Steel Installation ................................................................................................................157
A.5 CONCRETE....................................................................................................................................159
A.5.1 Mixture Design ..................................................................................................................159
A.5.2 Casting...............................................................................................................................160
A.5.3 Curing ................................................................................................................................161
A.5.4 Compressive Strength ........................................................................................................161
A.5.5 Permeability.......................................................................................................................162
A.6 TEST SETUP ..................................................................................................................................162
A.6.1 Specimen and Test Preparation.........................................................................................162
A.6.2 Cracking of Beams.............................................................................................................165

x
A.6.3 Exposure Conditions..........................................................................................................165
A.7 ROUTINE MONITORING ..............................................................................................................166
A.7.1 Visual Examination............................................................................................................166
A.7.2 Corrosion Potential Measurement.....................................................................................166
A.7.3 Temperature Measurement ................................................................................................167
A.7.4 Crack Width Measurement ................................................................................................167
A.8 POSTMORTEM EXAMINATION ...................................................................................................188
A.8.1 General ..............................................................................................................................188
A.8.2 Concrete Condition............................................................................................................188
A.8.3 Chloride Content................................................................................................................188
A.8.4 Specimen Destruction ........................................................................................................193
A.8.5 Visual Inspection................................................................................................................194
REFERENCES.......................................................................................................................... 205

xi
List of Figures
Figure 1.1 Exposure of concrete pier to marine environment. ..................................................................2
Figure 1.2 Concept of beam exposure test. ...............................................................................................5
Figure 1.3 Model of beam exposure test specimens..................................................................................8
Figure 1.4 Overview of test setup..............................................................................................................9
Figure 1.5 Loading process of beams........................................................................................................9
Figure 1.6 Corrosion potentials measurement. ........................................................................................11
Figure 1.7 Grid points for corrosion potential measurement...................................................................11
Figure 2.1 Corrosion potentials for beam B1 upper bar. .........................................................................15
Figure 2.2 Corrosion potentials for beam B3 upper bar. .........................................................................16
Figure 2.3 Corrosion potentials for beam B6 upper bar ..........................................................................17
Figure 2.4 Corrosion potentials for beam B27 stirrup.............................................................................18
Figure 2.5 Corrosion potentials for beam B17 stirrup.............................................................................19
Figure 2.6 Corrosion potentials for beam B15 stirrup.............................................................................20
Figure 2.7 Corrosion potentials for beam B32 lower short bar. ..............................................................21
Figure 2.8 Comparison of average corrosion potentials (wetted region) of longitudinal bars in cracked, unloaded beams with different levels of damage.....................................................28
Figure 2.9 Comparison of average corrosion potentials (wetted region) of longitudinal bars in cracked, loaded beams with different levels of damage.........................................................29
Figure 2.10 Comparison of average corrosion potentials (wetted region) of longitudinal bars in uncracked, unloaded beams with different levels of damage.................................................30
Figure 2.11 Comparison of average corrosion potentials (wetted region) of longitudinal bars with as-received condition with different loading conditions.............................................................31
Figure 2.12 Comparison of average corrosion potentials (wetted region) of longitudinal bars with 3% damage to coating and different loading conditions. .............................................................32
Figure 2.13 Corrosion potentials at different regions along upper, uncoated bar in beam B6. .................33
Figure 2.14 Corrosion potentials for upper, uncoated bars in cracked beams with different loading conditions. ..............................................................................................................................34
Figure 2.15 Corrosion potentials for upper, coated and uncoated bars, in uncracked beam B1................34
Figure 2.16 Corrosion potentials for lower, coated and uncoated bars, in uncracked beam B8................35
Figure 2.17 Comparison of potentials of stirrups in uncracked beams with different coating conditions. ..............................................................................................................................36
Figure 2.18 Comparison of potentials of stirrups in cracked, unloaded beams with different coating conditions. ..............................................................................................................................37
Figure 2.19 Comparison of potentials of stirrups in cracked, loaded beams with different coating conditions. ..............................................................................................................................37
xii
Figure 2.20 Comparison of potentials of stirrups in as-received condition and different loading conditions. ..............................................................................................................................38
Figure 2.21 Comparison of potentials of stirrups with as-received and patched bars and different loading conditions. .................................................................................................................38
Figure 2.22 Corrosion potentials for upper, uncoated bar in beam B17....................................................39
Figure 2.23 Corrosion potentials for lower, uncoated bar and epoxy-coated stirrup, in uncracked beam B15. ..............................................................................................................................39
Figure 2.24 Corrosion potentials for lower, uncoated bar and epoxy-coated stirrup, in cracked beam B17. ........................................................................................................................................40
Figure 2.25 Corrosion potentials for upper, uncoated bar and epoxy-coated stirrup, in cracked beam B25. ........................................................................................................................................40
Figure 2.26 Corrosion potentials for lower, coated bars, with and without electrical isolation from stirrup. ....................................................................................................................................41
Figure 2.27 Comparison of potentials of continuous and spliced coated bars. .........................................42
Figure 2.28 Comparison of potentials of long and short coated splice bars..............................................42
Figure 2.29 Surface cracking on previously uncracked beam B15 (front and bottom surfaces as in exposure)................................................................................................................................44
Figure 2.30 Concrete scaling and deterioration outside wetted region (front surface as in exposure)......44
Figure 2.31 Cracking on initially uncracked, unloaded beam B1 (front and bottom surfaces as in exposure)................................................................................................................................45
Figure 2.32 Cracking on non-precracked beam B8. ..................................................................................45
Figure 2.33 Rust spot just outside wetted region on beam B12. ...............................................................46
Figure 2.34 Crack with rust exudation on top surface of beam B15. ........................................................47
Figure 2.35 Random cracking on front surface of beam B15....................................................................48
Figure 2.36 Random cracking on non-precracked beam B22. ..................................................................48
Figure 2.37 Rust spot on top surface of beam B17 at black bar location at midspan................................49
Figure 2.38 Large rust spot on bottom surface of beam B27 at black bar location at midspan. ...............50
Figure 2.39 Horizontal cracking on front surface of beam B32. ...............................................................51
Figure 2.40 Rust exuding through cracks on front surface of beam B32. .................................................51
Figure 2.41 Surface condition of beam B29 (Group III) after one year of exposure showing monitored cracks. ...................................................................................................................52
Figure 2.42 Chloride concentration at crack locations near beam upper bars after one year. ...................55
Figure 2.43 Chloride concentration at crack locations near beam lower bars after one year. ...................56
Figure 2.44 Corrosion spots coincident with voids in concrete (specimen removed after one year). .......58
Figure 2.45 Difference of corrosion performance between upper and lower sides of bar at the same crack location after one year. .................................................................................................59
Figure 2.46 Corrosion of longitudinal coated bars after 4.3 years of exposure.........................................60
Figure 2.47 Longitudinal coated bars of beam B1 after 4.3 years of exposure. ........................................60
Figure 2.48 Corrosion on lower side of bars removed from beams after one year of exposure................61

xiii
Figure 2.49 Corrosion on lower side of patched bar removed after one year of exposure........................61
Figure 2.50 Build up of rust products at damaged spot on bar from beam B10 after 4.3 years. ...............62
Figure 2.51 Uncorroded damaged areas near crack locations after 4.3 years. ..........................................62
Figure 2.52 Aspect of uncorroded patched area on upper bar in beam B14, near crack location within the wetted zone after 4.3 years...............................................................................................63
Figure 2.53 Corrosion at areas of contact between stirrup and uncoated bars at one year........................63
Figure 2.54 Corrosion on hook end of stirrup removed from cracked loaded beam after one year of exposure. ................................................................................................................................64
Figure 2.55 Corrosion at areas of contact between patched stirrup and uncoated bars at one year. .........64
Figure 2.56 Rust staining of stirrup from beam B17 (portion within the wet zone) after 4.3 years..........65
Figure 2.57 Patch at bar end of a stirrup hook that broke during autopsy (beam B23) after 4.3 years. Metallic surface beneath the patch was uncorroded...............................................................65
Figure 2.58 Corrosion on patched damaged areas of stirrup after one year of exposure. .........................66
Figure 2.59 Rust staining on a stirrup leg near the front beam surface (beam B32) after 4.3 years. ........66
Figure 2.60 Corrosion on patched cut ends of splice bars after one year of exposure. .............................67
Figure 2.61 Patched ends of splice bars from beam B32 after 4.3 years of exposure. ..............................68
Figure 2.62 Corrosion of uncoated compression bars at crack location after one year. ............................69
Figure 2.63 Dark corrosion with widespread pitting on uncoated bars from beam B14 after 4.3 years. ..69
Figure 2.64 Severe pitting and loss of cross section on uncoated bars near crack locations after 4.3 years. ......................................................................................................................................70
Figure 2.65 Dark-greenish rust staining around black bars at pitted areas after 4.3 years. .......................71
Figure 2.66 Very severe pitting and loss of cross section on uncoated bars at crack locations (beam group II) after 4.3 years..........................................................................................................72
Figure 2.67 Upper black bar in beam B25 fractured during autopsy at severely pitted location after 4.3 years. ................................................................................................................................72
Figure 2.68 Coating debonding after one year of beam exposure.............................................................74
Figure 2.69 Coating debonding of splice bar within the wetted region (beam B32) after 4.3 years. ........74
Figure 2.70 Coating adhered well throughout most portions of bars from beam B1 after 4.3 years of exposure. ................................................................................................................................75
Figure 2.71 Coating extensively debonded on stirrups after 4.3 years......................................................75
Figure 2.72 Minor surface corrosion of undamaged bar removed from uncracked beam after one year of exposure. ....................................................................................................................76
Figure 2.73 Substrate corrosion on bars with introduced damage and variable beam loading condition after one year..........................................................................................................77
Figure 2.74 Pitting on exposed steel areas of bars removed from cracked loaded beam B11 after one year of exposure. ....................................................................................................................78
Figure 2.75 White residue of dried solution trapped beneath coating. ......................................................79
Figure 2.76 Example of undercutting on stirrup with 3% patched damage after one year of exposure....79
Figure 2.77 Undercutting along splice bar at patched cut end after one year of exposure........................80
xiv
Figure 2.78 Mottled surface at lower bar of beam B8 within the wetted region. ......................................81
Figure 2.79 Dark corroded surface on longitudinal upper bar of beam B8 within the wetted region (zone at midspan). ..................................................................................................................81
Figure 2.80 Pitting on stirrup leg near the bottom beam surface (beam B17)...........................................81
Figure 2.81 Reddish-brown rust products on lower bar of beam B8 (Zone just outside of wetted region). ...................................................................................................................................82
Figure 2.82 Corroded portion on lower bar of beam B10. ........................................................................83
Figure 2.83 Pitting on stirrup leg near the bottom beam surface (beam B17)...........................................83
Figure 2.84 Pitting along stirrup leg near the bottom beam surface (beam B27)......................................84
Figure 2.85 Corrosion on stirrup leg (top in photo) and mottled surface on stirrup hook (bottom in photo). Portion near the front beam surface (beam B32).......................................................84
Figure 2.86 Dark corrosion on steel surface beneath the patch at lower splice bar end of beam B32. .....85
Figure 2.87 Appearance of steel surface of lower splice bar after 4.3 years of exposure (beam B32). ....85
Figure 2.88 Bar trace in concrete above and below epoxy-coated bars (as in casting position). ..............87
Figure 2.89 Stirrup trace in concrete. ........................................................................................................87
Figure 2.90 Patching material observed on stirrup imprint in concrete. ...................................................88
Figure 2.91 Extensive dark or dark-greenish rust staining was observed on concrete around uncoated bars at severely pitted locations. ............................................................................................89
Figure 3.1 Relation between corrosion activity and steel potential after one year of exposure. .............99
Figure 3.2 Relation between corrosion activity and steel potential from tests in this study (beams autopsied after one and 4.3 years of exposure). ...................................................................100
Figure 3.3 Equipotential contours and current flow for corroded bar.16 ................................................104
Figure 3.4 Uncoated bars exhibited severe corrosion at crack locations...............................................106
Figure 3.5 Anode-cathode development on longitudinal bar with variable chloride contamination in cracked beam........................................................................................................................107
Figure 3.6 Uncorroded damaged spots on longitudinal bars of beam B10. ..........................................108
Figure 3.7 Concrete surrounding uncorroded damaged spots (Upper bar of beam B10)......................109
Figure 3.8 Severe pitting corrosion of uncoated bars at crack location (beam B27).............................110
Figure 3.9 Pitting corrosion of uncoated bars at crack location (beam B25). .......................................111
Figure 3.10 Stirrup trace in concrete adjacent to crack after one year. ...................................................113
Figure 3.11 Pitting corrosion on coated and uncoated bars in beams with opened cracks (at one year). ....................................................................................................................................114
Figure 3.12 Cracking of coating along stirrup leg...................................................................................115
Figure 3.13 Variation of debonded area with bar damage level and loading condition after one year. ..118
Figure 3.14 Roughness on contact surface of coating after one year. .....................................................119
Figure 3.15 Variation of corroded area (undercutting) with bar damage level and loading condition....122
Figure 3.16 Variation of concrete quality in beam cross section. ...........................................................125
Figure 3.17 Chloride penetration in uncracked beam cross section. .......................................................126

xv
Figure 3.18 Pitting corrosion on coated bar at crack location. ................................................................129
Figure 3.19 Mechanism of corrosion on longitudinal coated bar............................................................129
Figure 3.20 Electrode kinetics for corrosion cell. ...................................................................................130
Figure 3.21 Macro-corrosion cell representation on longitudinal bar. ....................................................130
Figure 3.22 Voltage drop in concrete. .....................................................................................................131
Figure 3.23 Mechanism of corrosion of coated longitudinal bar.............................................................132
Figure 3.24 Stirrup leg near the beam front surface (top in photo) is corroded while stirrup hook is mottled (bottom in photo) (Beam B32)................................................................................135
Figure 3.25 Damage of coating of stirrup at contact with uncoated bar..................................................135
Figure 3.26 Corrosion at location of contact of coated stirrup and uncoated bar....................................135
Figure 3.27 Mechanism of corrosion of coated stirrup............................................................................136
Figure 3.28 Macrocell corrosion of uncoated bars. .................................................................................137
Figure 3.29 Concrete scaling inside and outside wetted regions. Scaling was more severe outside (but near) wetted regions......................................................................................................139
Figure 3.30 Random cracking at and around wetted region of beam B27. .............................................140
Figure A.1 Dimensions of beam cross section. ......................................................................................149
Figure A.2 Details of group I beam specimen........................................................................................150
Figure A.3 Details of group II beam specimen. .....................................................................................150
Figure A.4 Details of group III beam specimen. ....................................................................................151
Figure A.5 Stress-strain curve for the 19mm bars...................................................................................152
Figure A.6 Damage spots on 19mm longitudinal bar..............................................................................156
Figure A.7 Stirrup condition without introduced damage......................................................................156
Figure A.8 Stirrup condition with introduced damage. ..........................................................................157
Figure A.9 Formwork for beam specimens............................................................................................158
Figure A.10 Steel detailing of Group I beam specimen. ..........................................................................158
Figure A.11 Internal stirrup connection for Group II beam specimen. ....................................................159
Figure A.12 Steel detailing of Group III beam specimen. .......................................................................159
Figure A.13 Casting beam specimens. .....................................................................................................161
Figure A.14 Compressive strength gain of concrete for beam groups. ....................................................161
Figure A.15 Laying out beams in testing room........................................................................................162
Figure A.16 Beam loading system. ..........................................................................................................163
Figure A.17 Dimensions of wetted region of beams. ...............................................................................163
Figure A.18 External bar connection for corrosion potential measurement.............................................164
Figure A.19 Grid points for corrosion potential measurement.................................................................164
Figure A.20 Exposure cycle for beam test. ..............................................................................................165
Figure A.21 View of beams in exposure room.........................................................................................166
xvi
Figure A.22 Schematic diagram of half-cell measuring circuit................................................................167
Figure A.23 Surface condition of beam B2-L-UU-AR after one year of exposure. ................................168
Figure A.24 Surface condition of beam B7-L-UU-D after one year of exposure. ...................................168
Figure A.25 Surface condition of beam B4-L-CU-AR after one year of exposure..................................169
Figure A.26 Surface condition of beam B5-L-CL-AR after one year of exposure. .................................169
Figure A.27 Surface condition of beam B11-L-CL-D after one year of exposure...................................169
Figure A.28 Surface condition of beam B9-L-CU-D after one year of exposure. ...................................170
Figure A.29 Surface condition of beam B13-L-CU-D(P) after one year of exposure. ............................171
Figure A.30 Surface condition of beam B16-ST-UU-AR after one year of exposure. ............................171
Figure A.31 Surface condition of beam B21-ST-UU-AR(P) after one year of exposure. .......................171
Figure A.32 Surface condition of beam B18-ST-CU-AR after one year of exposure. ............................172
Figure A.33 Surface condition of beam B20-ST-CL-AR after one year of exposure..............................172
Figure A.34 Surface condition of beam B26-ST-CL-AR(P) after one year of exposure. ........................173
Figure A.35 Surface condition of beam B24-ST-CU-AR(P) after one year of exposure.........................173
Figure A.36 Surface condition of beam B28-ST-CU-D(P) after one year of exposure. ..........................174
Figure A.37 Surface condition of beam B29-L/ST-CU-D(P) after one year of exposure........................175
Figure A.38 Surface condition of beam B31-SP-CU-D(P) after one year of exposure. ..........................175
Figure A.39 Surface condition of beam B33-SP-CU-D(P) after one year of exposure. ..........................175
Figure A.40 Surface condition of beam B1-L-UU-AR after 4.3 years of exposure.................................176
Figure A.41 Surface condition of beam B3-L-CU-AR after 4.3 years of exposure.................................176
Figure A.42 Surface condition of beam B6-L-CL-AR after 4.3 years of exposure. ................................177
Figure A.43 Surface condition of beam B8-L-UU-D after 4.3 years of exposure. ..................................178
Figure A.44 Surface condition of beam B10-L-CU-D after 4.3 years of exposure..................................178
Figure A.45 Surface condition of beam B12-L-CL-D after 4.3 years of exposure. .................................179
Figure A.46 Surface condition of beam B14-L-CU-D(P) after 4.3 years of exposure.............................179
Figure A.47 Surface condition of beam B15-ST-UU-AR after 4.3 years of exposure. ...........................180
Figure A.48 Surface condition of beam B17-ST-CU-AR after 4.3 years of exposure.............................181
Figure A.49 Surface condition of beam B19-ST-CL-AR after 4.3 years of exposure. ............................182
Figure A.50 Surface condition of beam B22-ST-UU-AR(P) after 4.3 years of exposure........................182
Figure A.51 Surface condition of beam B23-ST-CU-AR(P) after 4.3 years of exposure........................183
Figure A.52 Surface condition of beam B25-ST-CL-AR(P) after 4.3 years of exposure. .......................184
Figure A.53 Surface condition of beam B27-ST-CU-D(P) after 4.3 years of exposure. .........................184
Figure A.54 Surface condition of beam B30-L/ST-CU-D(P) after 4.3 years of exposure.......................185
Figure A.55 Surface condition of beam B32-SP-CU-D(P) after 4.3 years of exposure...........................186
Figure A.56 Surface condition of beam B34-SP-CL-D(P) after 4.3 years of exposure. ..........................187
xvii
Figure A.57 Sampling chloride from beams before autopsy....................................................................188
Figure A.58 Saw used to crosscut beams. ................................................................................................193
Figure A.59 Beam demolition for bar retrieval. .......................................................................................193

xviii
xix
List of Tables
Table 1.1 Summary of beam exposure study specimens..........................................................................6
Table 2.1 Interpretation of half-cell potentials based on ASTM C876-87.............................................13
Table 2.2 Corrosion potential values for beam bar specimens of Group I, longitudinal bars................22
Table 2.3 Corrosion potential values for beam bar specimens of Group II, stirrups. ............................23
Table 2.4 Corrosion potential values for beam bar specimens of Group III, longitudinal/splice bars and stirrups.............................................................................................................................24
Table 2.5 Corrosion potential values for black bar specimens of Group I.............................................25
Table 2.6 Corrosion potential values for black bar specimens of Group II. ..........................................25
Table 2.7 Corrosion potential values for black bar specimens of Group III. .........................................26
Table 2.8 Average crack width measurement across beam tension side for beam B29-L/ST-CU-D(P), Group III. .............................................................................................53
Table 2.9 Maximum crack width of cracked unloaded beams after 4.3 years. ......................................54
Table 2.10 Chloride concentrations (percentage by weight of concrete) in autopsied beams after 4.3 years of exposure at several beam locations and depths from the top surface. ................57
Table 2.11 Average chloride concentration (percentage by weight of concrete) in the wet zone at two depths from the top surface, after 1 and 4.3 years of exposure.......................................57
Table 3.1 Relation of corrosion to potential measurements on beams of Group I, longitudinal bars. ...94
Table 3.2 Relation of corrosion to potential measurements on beams of Group II, stirrups..................95
Table 3.3 Relation of corrosion to potential measurements on beams of Group III, longitudinal/splice bars and stirrups.......................................................................................96
Table 3.4 Relation of corrosion to potential measurements on beams of Group I, black bars (only specimens exposed for 4.3 years).........................................................................................102
Table 3.5 Relation of corrosion to potential measurements on beams of Group II, black bars (only specimens exposed for 4.3 years).........................................................................................103
Table 3.6 Relation of corrosion to potential measurements on beams of Group III, black bars (only specimens exposed for 4.3 years).........................................................................................103
Table 3.7 Distribution of uncoated bars with severe pitting corrosion. ...............................................104
Table 3.8 Stirrup performance ranked by amount of pitted surface.....................................................116
Table A.1 Summary of beam exposure study variables........................................................................152
Table A.2 Coating thickness measurements of beam steel specimens, longitudinal bars-Group I
(130 µm = 5 mils, 300 µm = 12 mils)..................................................................................154
Table A.3 Coating thickness measurements of beam steel specimens, stirrups-Group II (130 µm =
5 mils, 300 µm = 12 mils)....................................................................................................155
Table A.4 Coating thickness measurements of beam steel specimens, longitudinal bars and
stirrups-Group III (130 µm = 5 mils, 300 µm = 12 mils). ...................................................155
Table A.5 Concrete mixture details for the beam exposure study. .......................................................160
Table A.6 Average crack width measurement for beam B4-L-CU-AR................................................168
xx
Table A.7 Average crack width measurement for beam B9-L-CU-D. .................................................170
Table A.8 Average crack width measurement for beam B13-L-CU-D(P). ..........................................170
Table A.9 Average crack width measurement for beam B18-ST-CU-AR. ..........................................172
Table A.10 Average crack width measurement for beam B24-ST-CU-AR(P).......................................173
Table A.11 Average crack width measurement for beam B28-ST-CU-D(P). ........................................174
Table A.12 Average crack width measurement for beam B29-L/ST-CU-D(P)......................................174
Table A.13 Average crack width measurement for beam B31-SP-CU-D(P). ........................................175
Table A.14 Average crack width measurement for beam B3-L-CU-AR................................................177
Table A.15 Average crack width measurement for beam B10-L-CU-D. ...............................................179
Table A.16 Average crack width measurement for beam B14-L-CU-D(P). ..........................................180
Table A.17 Average crack width measurement for beam B17-ST-CU-AR. ..........................................181
Table A.18 Average crack width measurement for beam B23-ST-CU-AR(P).......................................183
Table A.19 Average crack width measurement for beam B27-ST-CU-D(P). ........................................185
Table A.20 Average crack width measurement for beam B30-L/ST-CU-D(P)......................................186
Table A.21 Average crack width measurement for beam B32-SP-CU-D(P). ........................................187
Table A.22 Acid-soluble chloride concentrations in autopsied Group I beams after one year of exposure (percentage by weight of concrete).......................................................................189
Table A.23 Acid-soluble chloride concentrations in autopsied Group II beams after one year of exposure (percentage by weight of concrete).......................................................................190
Table A.24 Acid-soluble chloride concentrations in autopsied Group III beams after one year of exposure (percentage by weight of concrete).......................................................................190
Table A.25 Acid-soluble chloride concentrations in autopsied Group I beams after 4.3 years of exposure (percentage by weight of concrete).......................................................................191
Table A.26 Acid-soluble chloride concentrations in autopsied Group II beams after 4.3 years of exposure (percentage by weight of concrete).......................................................................192
Table A.27 Acid-soluble chloride concentrations in autopsied Group III beams after 4.3 years of exposure (percentage by weight of concrete).......................................................................192
Table A.28 Observations of longitudinal bars in Group I beams, one year exposure.............................195
Table A.29 Observations of stirrups in Group II beams, one year exposure. .........................................196
Table A.30 Observations of longitudinal bars and stirrups in Group III beams, one year exposure. .....197
Table A.31 Observations of longitudinal bars in Group I beams, 4.3-year exposure. ............................198
Table A.32 Observations of stirrups in Group II beams, 4.3-year exposure...........................................199
Table A.33 Observations of longitudinal bars and stirrups in Group III beams, 4.3-year exposure.......200
Table A.34 Approximate amount of corroded damaged spots (percentage of spots), rust stained coating surface, debonded coating, mottled surface, and corroded metallic surface beneath the coating (percentage of bar surface along 0.9m in midspan),* and severity of pitting. Longitudinal bars, 4.3-year exposure. .....................................................................200
xxi
Table A.35 Approximate amount of rust stained coating surface, debonded coating, mottled surface, and corroded metallic surface beneath the coating (percentage of stirrup surface); and severity of pitting. Stirrups, 4.3-year exposure. ...................................................................201
Table A.36 Approximate amount of rust stained coating surface, debonded coating, mottled surface, and corroded metallic surface beneath the coating [percentage of bar surface along 0.9m in midspan (0.45m for short bars)];* and severity of pitting. Spliced bars of beam B32, 4.3-year exposure. ................................................................................................................201
Table A.37 Observations of uncoated bars from beam groups I, II, and III, 4.3-year exposure.............202
Table A.38 Approximate amount of corroded surface (percentage of bar surface along 0.9m in midspan),* pitting, and maximum loss of cross section (percentage of bar cross-sectional area) of uncoated bars. Beam group I, 4.3-year exposure....................................................203
Table A.39 Approximate amount of corroded surface (percentage of bar surface along 0.9m in midspan),* pitting, and maximum loss of cross section (percentage of bar cross-sectional area) of uncoated bars. Beam group II, 4.3-year exposure...................................................203
Table A.40 Approximate amount of corroded surface (percentage of bar surface along 0.9m midspan),* pitting, and maximum loss of cross section (percentage of bar cross-sectional area) of uncoated bars. Beam group III, 4.3-year exposure. ................................................204
1
CHAPTER 1
INTRODUCTION
1.1 GENERAL
Epoxy coated reinforcement has been used in concrete structures exposed to marine environments.
Marine environments are particularly aggressive. Structures in such environments are exposed to water
rich in salts, with sodium chloride as the main component. Seawater attacks concrete structures in several
ways. Chlorides that penetrate the concrete may cause corrosion of the steel reinforcement, and
subsequent spalling, delamination, and cracking. In warm climates, the high temperatures accelerate the
corrosion process, and in cold climates, the combined action of freezing and corrosion are detrimental to
the durability of the structures.
Corrosion of reinforcement is not the only mechanism of deterioration. Salts that penetrate capillary voids
inside the concrete crystallize when water evaporates during prolonged dry cycles. Crystallized salts
expand and exert large pressures that may lead to concrete scaling and cracking. This phenomenon occurs
particularly at surfaces exposed to evaporation while other sides are wetted. Other forms of seawater
attack occur in the form of chemical action of seawater constituents on cement hydration products, alkali-
aggregate reaction, frost action in cold weather, and physical erosion due to wave action and floating
objects.1
Marine and offshore structures are more vulnerable to corrosion at the tidal zone. Structural components
(piles, foundations) submerged at deeper layers inside the ocean are much less susceptible to corrosion
attack. The reason for this phenomenon is that oxygen is very scarce at greater depths inside the water.
The tidal zone, however, is a critical area of the structure in terms of durability. Such a zone, which may
be a few meters in length, is wet during high tides and dry during low tides. In a typical marine splash
zone exposure, concrete within the tidal zone undergoes cyclic wetting and drying and significant
localized chloride accumulation. Figure 1.1 shows a concrete pier in such a hostile environment. The
configuration of the reinforced concrete member directly influences the chloride transport mechanism to
the steel surface. The presence of cracks facilitates chloride penetration, which eventually precipitates
corrosion. Concrete members exposed to such adverse service conditions, even with epoxy-coated bars,
may exhibit severe corrosion and rapid deterioration. An example is the corrosion-induced damage to
some bridge substructures in the Florida Keys in only a few years following their completion.
The basic components of the corrosion system mentioned above are: the wet-dry region; the relatively dry
region; and the continuous steel network passing through both regions as shown in Figure 1.1. The wet-
dry region allows salt accumulation as a result of direct intrusion and capillary action followed by water
evaporation. The dry region provides an adequate medium for oxygen passage to reinforcing steel.

2
Finally, steel continuity between the frequently wetted zone and the permanently dry zone encourages the
development of a corrosion cell stretching over the two regions. Macrocell action of concrete column
specimens in a simulated marine environment has been monitored in corrosion studies.2
Figure 1.1 Exposure of concrete pier to marine environment.
Another corrosion deterioration process is that of bridge substructures and parking structures in northern
environments. Deicing salts that are applied on the top surface of bridge decks may run off and leak
trough joints or cracks and cause corrosion of substructure members (beams, caps, and piers). A similar
process may occur in parking structures, where water or snow containing deicing salts is carried in on the
undersides of vehicles. In addition, the edges of an open parking structure may be subject to ambient
weather conditions. Runoff from the roof and floors may leak trough joints or cracks to contaminate and
corrode structural members (slabs, beams, columns, walls, ramps, etc.). Macro corrosion cells of bridge
substructure or parking structure members may be produced by differences in chloride concentrations
and/or moisture content at several portions of the member.
Corrosion behavior of the depicted systems is influenced by several factors. Among these factors, the
following may have pronounced effects on the level of corrosion activity on the epoxy-coated
reinforcement:
• Concrete permeability.
• Concrete cover and surface cracking.
• Loading condition.

3
• Level of coating damage and amount of damage patched.
• Level of salinity of chloride solution.
• Degree of electrical continuity of steel.
In previous studies, Swamy3,4
and Poston5
showed that epoxy coating greatly reduced the incidence and
extent of corrosion in cracked structural members. Poston also reported that subjecting test members to
cycles of loading and unloading during exposure to salt solution resulted in minor chipping and flaking of
the epoxy coating on the ribs of bars. Two aspects needed further research: the effects of previous
mechanical coating damage during handling on performance; and the effects of structural loading on
inducing further damage to the coating.
If cyclic loading affects the condition of a coated reinforcing bar in concrete, then the long-term
performance of the bar may be seriously impaired. One concern is that the coating may flow away from
high stress locations, such as the base of a transverse lug on a ribbed bar.6
Chloride ions can penetrate
easily through the weak coating zone, where epoxy has “squeezed out”, thus resulting in localized spots
of high concentrations. Large chloride accumulations increase the probability of corrosion initiation. In
addition, localized stresses in steel promote an anodic behavior and, in fact, stressed areas generally
become the anodes.7
The critical aspect of corrosion of highly stressed steel is that metal degeneration
occurs where the strength is needed most.
Performance of a structure in a corrosive environment may be affected by the presence of cracks. Most
field reinforced concrete structures are designed to function in a cracked condition. Therefore, testing
uncracked concrete in the laboratory satisfies what is called “laboratory curiosity.” 8
Cracking is part of
the actual service conditions and should be considered in laboratory corrosion studies. Cracks may
aggravate corrosion because chlorides, water, and oxygen may penetrate inside the concrete through
cracks. Two important aspects of cracking that deserve attention are crack width and crack propagation.
Controversy exists as to the width of a crack necessary to lead to significant corrosion.9
Some researchers
found that corrosion increased with the increase in crack width.10
However, there has been a continuing
debate about the effects of cracks on corrosion of reinforcement. Some researchers assert that corrosion is
localized at cracks and that the presence of narrow cracks (less than 0.3mm wide) has little effect on the
long-term corrosion performance of the structure.11
In another research, uncoated bars in cracked concrete
started to corrode soon after application of deicers, and crack width did not significantly change the rate
of corrosion damage.12
Others worry that designing for crack control leads to members with reduced
concrete cover, making them more vulnerable to chloride diffusion. Whether corrosion leads to cracking,
or cracking proceeds corrosion has also been controversial.13
4
It has been argued that cracks in unloaded beams in a laboratory test may heal and produce misleading
results.8
Field observations of bridge deck construction have revealed that deep cracks form in association
with the use of epoxy-coated reinforcement.6
Members with epoxy-coated reinforcement are particularly
prone to crack at locations of coated transverse reinforcement, and cracks are usually wider than those
occurring on structures with uncoated bars.14
In addition, experience with corrosion of coated bars has
shown that corrosion concentrates at crack locations. Therefore, it was prudent to investigate the
corrosion performance of coated reinforcing steel under laboratory exposure conditions involving
cracked, loaded specimens. With relatively wide cracks, the coated reinforcement may be exposed to
large amounts of salt within a very short period.
In the beam exposure study, the beams were designed to simulate cracked, loaded concrete components
exposed to high corrosive environments. All details of the test, such as steel preparation, material
characteristics, specimen design and preparation, test setup, routine monitoring, and postmortem
examination procedure are included in Appendix A.
1.2 OBJECTIVES AND TEST CONCEPT
An experimental program was set up with the following objectives:
• Study the corrosion behavior of epoxy-coated bars with different degrees of damage in an
exposure resembling a marine environment or runoff of deicing chemicals.
• Analyze the effect of flexural cracks and loading on the performance of epoxy coated bars.
• Determine if periodic application of cyclic loads effects corrosion performance.
To achieve these objectives, beams with separate arrangements of straight, bent, and spliced-coated bars
were tested. The beams were designed to simulate cracked, loaded concrete members exposed to very
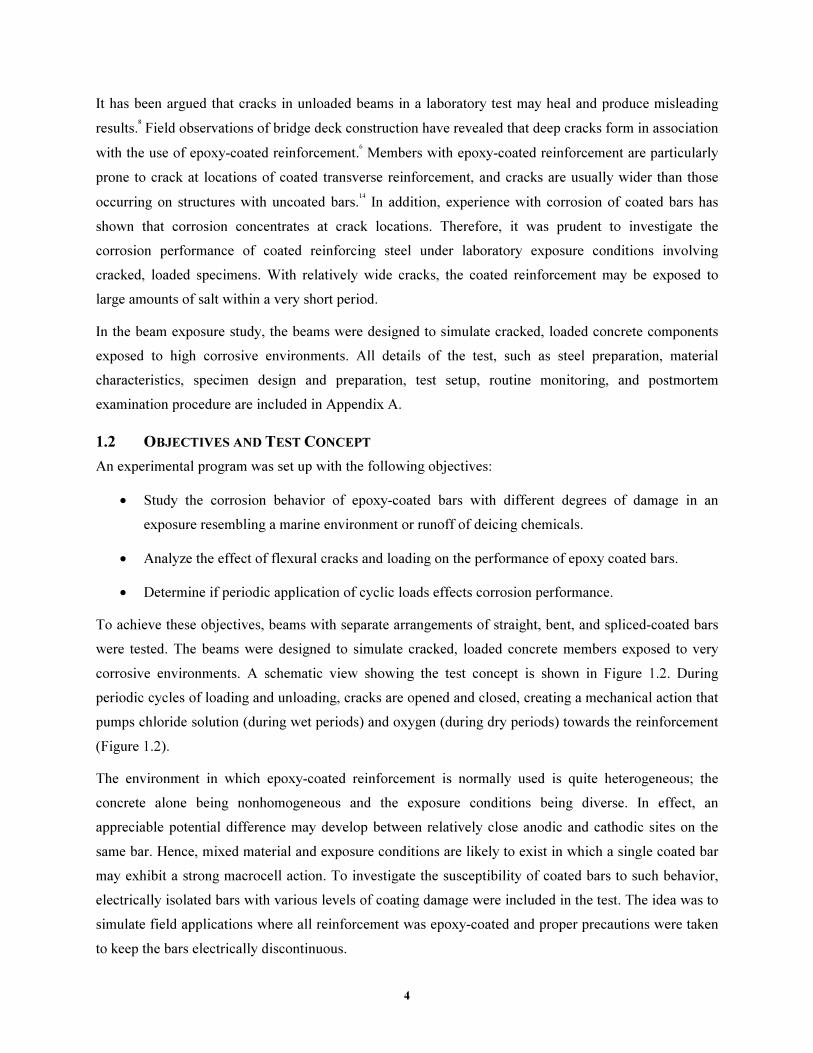
corrosive environments. A schematic view showing the test concept is shown in Figure 1.2. During
periodic cycles of loading and unloading, cracks are opened and closed, creating a mechanical action that
pumps chloride solution (during wet periods) and oxygen (during dry periods) towards the reinforcement
(Figure 1.2).
The environment in which epoxy-coated reinforcement is normally used is quite heterogeneous; the
concrete alone being nonhomogeneous and the exposure conditions being diverse. In effect, an
appreciable potential difference may develop between relatively close anodic and cathodic sites on the
same bar. Hence, mixed material and exposure conditions are likely to exist in which a single coated bar
may exhibit a strong macrocell action. To investigate the susceptibility of coated bars to such behavior,
electrically isolated bars with various levels of coating damage were included in the test. The idea was to
simulate field applications where all reinforcement was epoxy-coated and proper precautions were taken
to keep the bars electrically discontinuous.
5
Stressed Epoxy-Coated BarLoaded Cracked Beam
Cycles of loading and Unloading:
Friction Against Bar
Deformations
H2O, O
2, Cl
-
H2O, O2, Cl-
Figure 1.2 Concept of beam exposure test.
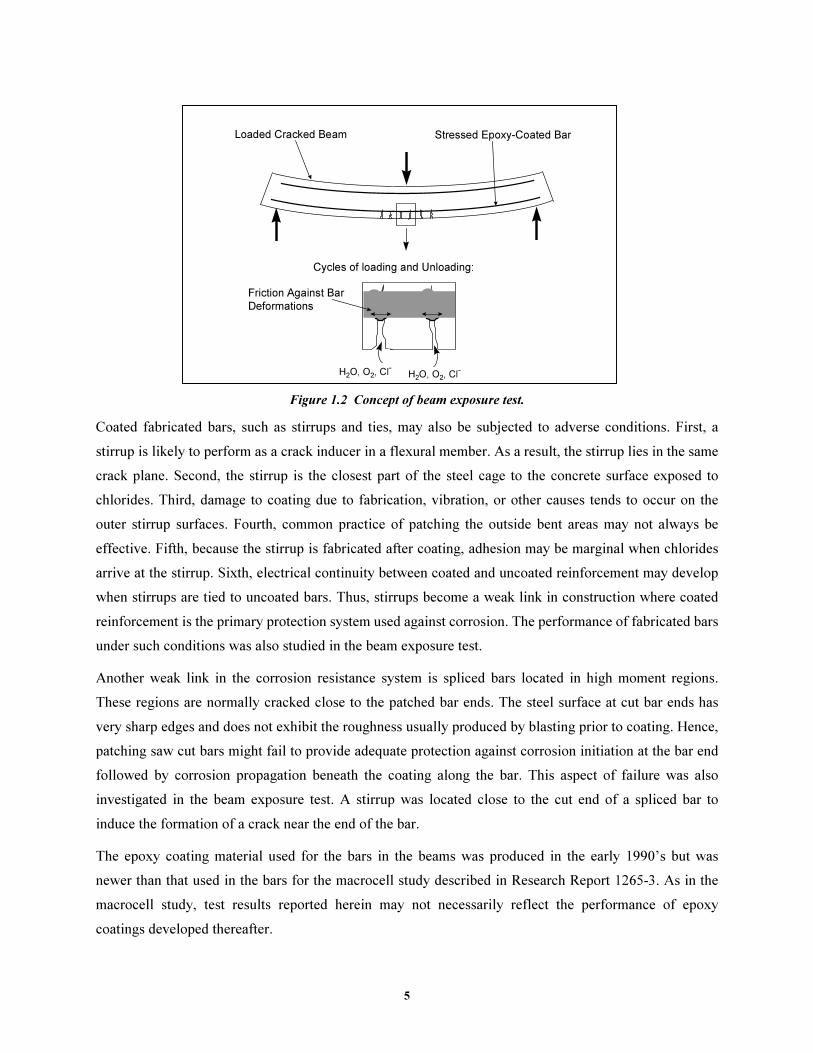
Coated fabricated bars, such as stirrups and ties, may also be subjected to adverse conditions. First, a
stirrup is likely to perform as a crack inducer in a flexural member. As a result, the stirrup lies in the same
crack plane. Second, the stirrup is the closest part of the steel cage to the concrete surface exposed to
chlorides. Third, damage to coating due to fabrication, vibration, or other causes tends to occur on the
outer stirrup surfaces. Fourth, common practice of patching the outside bent areas may not always be
effective. Fifth, because the stirrup is fabricated after coating, adhesion may be marginal when chlorides
arrive at the stirrup. Sixth, electrical continuity between coated and uncoated reinforcement may develop
when stirrups are tied to uncoated bars. Thus, stirrups become a weak link in construction where coated
reinforcement is the primary protection system used against corrosion. The performance of fabricated bars
under such conditions was also studied in the beam exposure test.
Another weak link in the corrosion resistance system is spliced bars located in high moment regions.
These regions are normally cracked close to the patched bar ends. The steel surface at cut bar ends has
very sharp edges and does not exhibit the roughness usually produced by blasting prior to coating. Hence,
patching saw cut bars might fail to provide adequate protection against corrosion initiation at the bar end
followed by corrosion propagation beneath the coating along the bar. This aspect of failure was also
investigated in the beam exposure test. A stirrup was located close to the cut end of a spliced bar to
induce the formation of a crack near the end of the bar.
The epoxy coating material used for the bars in the beams was produced in the early 1990’s but was
newer than that used in the bars for the macrocell study described in Research Report 1265-3. As in the
macrocell study, test results reported herein may not necessarily reflect the performance of epoxy
coatings developed thereafter.

6
1.3 TEST VARIABLES
1.3.1 General
The variables selected for this test cover different usages of coated reinforcement, different loading
conditions, different damage levels to epoxy coating, and different conditions of damage. These variables
enable an assessment of the durability of coated bars under conditions simulating loaded structural
elements. The limits selected for coating damage and repair relate to allowable levels proposed in several
specifications that were current at the time of testing.
Thirty-four beam specimens were included in the test program. The beams were divided into three groups
according to the corrosion systems monitored. Table 1.1 summarizes the variables included in each beam
group. The test variables are described below:
Table 1.1 Summary of beam exposure study specimens.
Loading Conditiona
Bar Condition
(Damage Level and Condition) Uncracked Unloaded
Cracked Unloaded
Cracked Loaded
b
Group I Beams, Monitoring Longitudinal Bars (Stirrups were Covered)c
As-Receivedd B1, B2 B3, B4 B5, B6
3% Damaged B7, B8 B9, B10 B11, B12
3% Damaged, Patched B13, B14
Group II Beams, Monitoring Stirrups (Longitudinal Bars were Covered)c
As-Receivede B15, B16 B17, B18 B19, B20
As-Received, Patched B21, B22 B23, B24 B25, B26
3% Damaged, Patched B27, B28
Group III Beams, Monitoring Longitudinal Bars and Stirrups
Mixed Longitudinal Bars and Stirrups
Both 3% Damaged, Patched B29, B30
Mixed Splice Bars and Stirrups
Stirrup 3% Damaged, Stirrup and Splice Bar End Patched
B31, B32 B33, B34
a: Loading condition refers to imposed loads causing bending about strong axis. All beams supported their own weight in the weak axis.
b: Loads were imposed to open cracks to 0.33mm. c: Cover was provided by a heat shrink tube. d: No visible damage. e: No patch on bends.
1.3.2 Reinforcement Usage
Corrosion performance of straight bars and bent stirrups or ties may depend on bar geometry, concrete
cover, and location in the structural element. Additionally, cut bar ends at splice regions may be a weak
spot at which corrosion starts and propagates. In order to study all these concerns, three sets of beams
were designed for testing: beams with longitudinal bars monitored; beams with stirrups monitored; and
beams with mixed longitudinal bars and stirrups (some with spliced bars). The intent was to examine the

7
different performance of these bars and to identify the factors that promote corrosion or improve
resistance to corrosion.
1.3.3 Loading Conditions
The beams were positioned in such a manner that their own weight was causing bending about the weak
axis. Loading as a test variable refers to imposed loads causing bending about strong axis. In some cases,
cracks were introduced on the outer concrete surfaces closest to the coated bars. The three loading
conditions selected for the test were as follows:
• Uncracked Unloaded: At rest condition (no cracks or imposed loads) during exposure.
• Cracked Unloaded: A load was applied to produce a crack of 0.33mm (0.013in.) width then the load was removed during exposure.
• Cracked Loaded: A load was applied to produce a crack of 0.33mm (0.013in.) width then the load was held during exposure.
The crack width used in the test conforms to ACI 318-8915
crack limit for exterior exposure. Cycles of
loading and unloading to the same crack width specified were performed during exposure. Loading and
unloading may promote physical damage to coating and to concrete at crack locations and increase
exposure to corrosive substances.
1.3.4 Epoxy Coating Damage Level
Coating damage was an important variable for evaluating the corrosion performance of epoxy-coated
reinforcement. Damage level up to or exceeding current specification limits may occur in field
applications; therefore, the following damage conditions were selected:
• Longitudinal bars with no visible damage or “as-received” condition.
• Longitudinal bars severely damaged (3% of bar surface area), with or without patching. The introduced coating damage was limited to the middle 0.91 m (3ft.) length of the bar.
• Stirrups in as-received condition with or without patching the ends.
• Stirrups severely damaged (3% of stirrup surface area) and patched. The introduced coating damage was limited to the outer bends at one side of the stirrup.
• Splice bars with cut and patched ends.
The 3% limit of coating damage was introduced based on proposed modifications to specifications
(current at the time of testing) governing use of epoxy-coated reinforcing bars. This limit was proposed as
the maximum allowable limit of patched surface area of bar. Accordingly, a damage level of 3% was
selected for testing to include the worst damage that can be patched.

8
1.3.5 Repair of Damage
The damaged coating areas introduced on the test bars, and stirrup bends were either repaired or left
unrepaired as another variable to examine the effectiveness of patching. Repairs were done according to
manufacturer's instructions using a liquid epoxy patching material and following recommended touch-up
techniques.
1.4 TEST SETUP AND PROCEDURE
Reinforced concrete beams were designed and prepared for assessment of the durability of coated bars in
concrete under conditions simulating loaded structural elements. There were two replicates for each test
condition. The two replicates were stressed back to back with the beams laying on one of their lateral
sides, as shown in Figure 1.3. A view of the beam specimens under test and the loading process are
shown in Figures 1.4 and 1.5. Only two of the four longitudinal bars were epoxy coated. One coated
stirrup was placed at midspan. The beams were loaded so that the two longitudinal coated bars were on
the tension side and the two uncoated bars were on the compression side of the beams.
Middle Steel
Support
Dike
Induced
Cracks
Loading
Rod
Ground Clamp
Connection
φ19 Epoxy-Coated
"Top" Barφ19 Epoxy-Coated
"Bottom" Bar
Area Exposed
to Wetting and
Drying
Top Surface
Front
Surface
Bottom
Surface Figure 1.3 Model of beam exposure test specimens.

9
Figure 1.4 Overview of test setup.
Figure 1.5 Loading process of beams.
The exposure conditions consisted of 3.5% NaCl solution flowing over the beam surfaces (within a
defined exposure area) continuously for 3 days followed by air drying for 11 days, to complete a 14-day
wet-dry cycle. Periodic wetting and drying ensures continuous transport of corrosive substances to steel
surfaces to promote corrosion. To further accelerate corrosion initiation, concrete with high permeability
(water-cement ratio of 0.57) was used. The cracked beams were subjected to cycles of loading and
unloading every seven days during days 2 and 9 of the 14-day cycle: In this manner, cyclic loads were
applied one time during wetting and one time during drying. Five load cycles were imposed each time up

10
to a level producing the selected maximum crack width. Figure 1.5 shows the process of loading the
beams.
Unless otherwise noted, the convention for identifying location of bars and beam surfaces was based on
the position of the beams during the exposure (Figure 1.3). Top or upper refers to the beam lateral surface
facing upwards, where solution was directly irrigated onto. Bottom or lower refers to the opposite lateral
surface facing downwards, where solution dripped down. Front surfaces were those on the tension side of
the beam, where solution flowed down from the top surface. Back surfaces were the opposite surfaces on
the compression side of the beams. Similarly, top or upper bars are closer to the top surface, and bottom
or lower bars are closer to the bottom surface.
The notation used to identify each beam was as follows: B(beam number)-(type of monitored bar)-(crack
and loading condition)-(coating condition). Each test variable was labeled as follows:
• Beam number: From 1 through 34
• Type of monitored bar: L (longitudinal bar), ST (stirrup), and SP (splice bar). [Note: In beams with spliced bars, stirrups were monitored too]
• Crack and loading condition: UU (uncracked, unloaded), CU (cracked, unloaded), and CL (cracked, loaded).
• Coating condition: AR (as-received), AR(P) [as-received and patched], D (3% damaged), and D(P) [3% damaged and patched].
For instance, B1-L-UU-AR represents beam 1 where the longitudinal coated bars were monitored, the
beam was uncracked and unloaded, and the coating was in its as-received condition; and
B27-ST-CU-D(P) represents beam 27 where the coated stirrup was monitored, the beam was cracked and
unloaded, and the coating had 3% damage but was patched.
1.5 MEASUREMENTS AND OBSERVATIONS
For corrosion monitoring, periodic visual inspection and corrosion potential measurements were made.
Corrosion potential measurements usually provide a means of monitoring corrosion activity on
reinforcing bars. Generally, steel exhibits a potential that falls in a range that indicates passive, active, or
unstable active-passive conditions. The potentials may be particularly useful in indicating time-to-
corrosion initiation which is marked by a significant drop in the potential value. After corrosion has
started, the activity may progress to a point causing distress to concrete. Therefore, observing changes in
the potential readings can provide valuable information on the change of state of steel. Since this
technique has also been used with epoxy-coated reinforcement, it may be useful to evaluate the
effectiveness of epoxy coating.
Corrosion potentials of longitudinal bars and stirrups embedded in beams were measured periodically (at
the end of every two wet cycles) against a saturated calomel reference electrode (SCE). Figure 1.6 shows
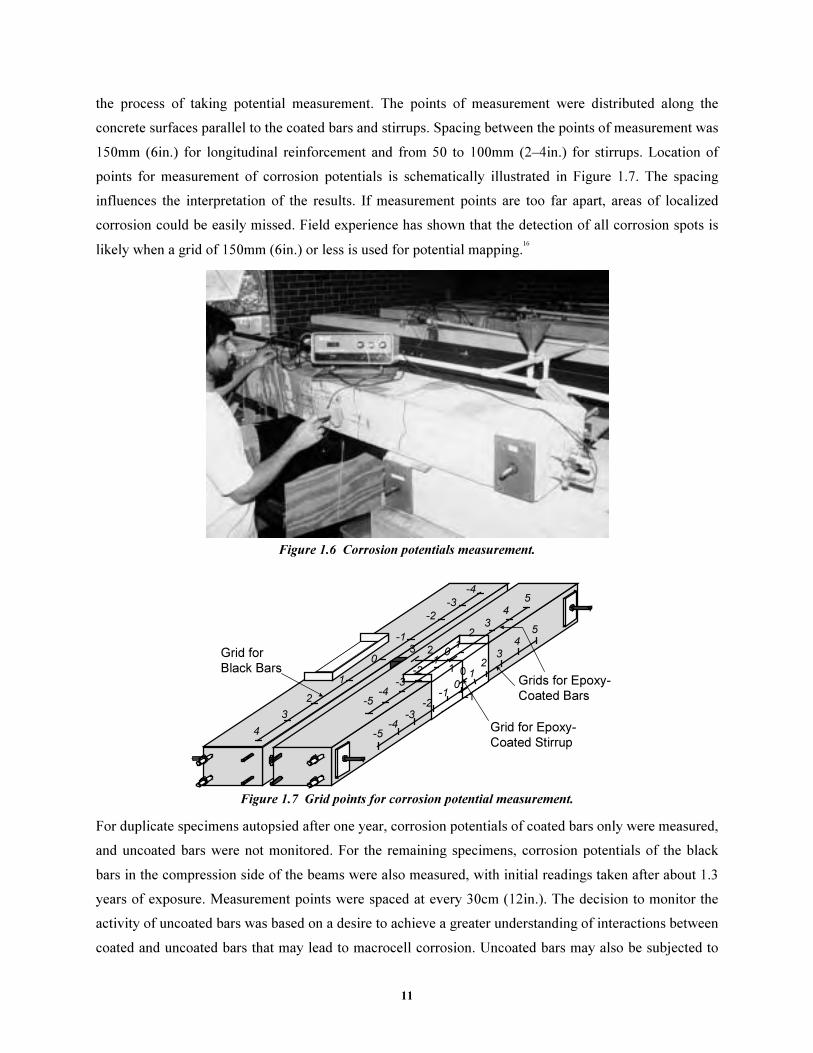
11
the process of taking potential measurement. The points of measurement were distributed along the
concrete surfaces parallel to the coated bars and stirrups. Spacing between the points of measurement was
150mm (6in.) for longitudinal reinforcement and from 50 to 100mm (2–4in.) for stirrups. Location of
points for measurement of corrosion potentials is schematically illustrated in Figure 1.7. The spacing
influences the interpretation of the results. If measurement points are too far apart, areas of localized
corrosion could be easily missed. Field experience has shown that the detection of all corrosion spots is
likely when a grid of 150mm (6in.) or less is used for potential mapping.16
Figure 1.6 Corrosion potentials measurement.
5
4
32
10
-1
-2
-3-4
-5
3 2
1 0
-1
5
4
32
1
0-1
-2
-3-4
-54
3
2
1
0
-1
-2
-3
-4
Grid for
Black BarsGrids for Epoxy-
Coated Bars
Grid for Epoxy-
Coated Stirrup
Figure 1.7 Grid points for corrosion potential measurement.
For duplicate specimens autopsied after one year, corrosion potentials of coated bars only were measured,
and uncoated bars were not monitored. For the remaining specimens, corrosion potentials of the black
bars in the compression side of the beams were also measured, with initial readings taken after about 1.3
years of exposure. Measurement points were spaced at every 30cm (12in.). The decision to monitor the
activity of uncoated bars was based on a desire to achieve a greater understanding of interactions between
coated and uncoated bars that may lead to macrocell corrosion. Uncoated bars may also be subjected to

12
corrosion and their potential readings may shed some light on the behavior of concrete members with
mixed epoxy-coated and uncoated reinforcement.
Beam specimens were inspected visually at the beginning of the test and periodically thereafter, about
every 2 to 4 months (every 6 months in the last 1.5 years). The objective of the examination was to
observe any development of rust stains, corrosion-induced cracking, and progression of flexural cracking.
In addition, crack maps and crack widths were documented and updated during the exposure period.
Crack widths of a few selected cracks were measured periodically. Beam specimens were opened after 1,
and 4.3 years to examine the condition of the test bars.
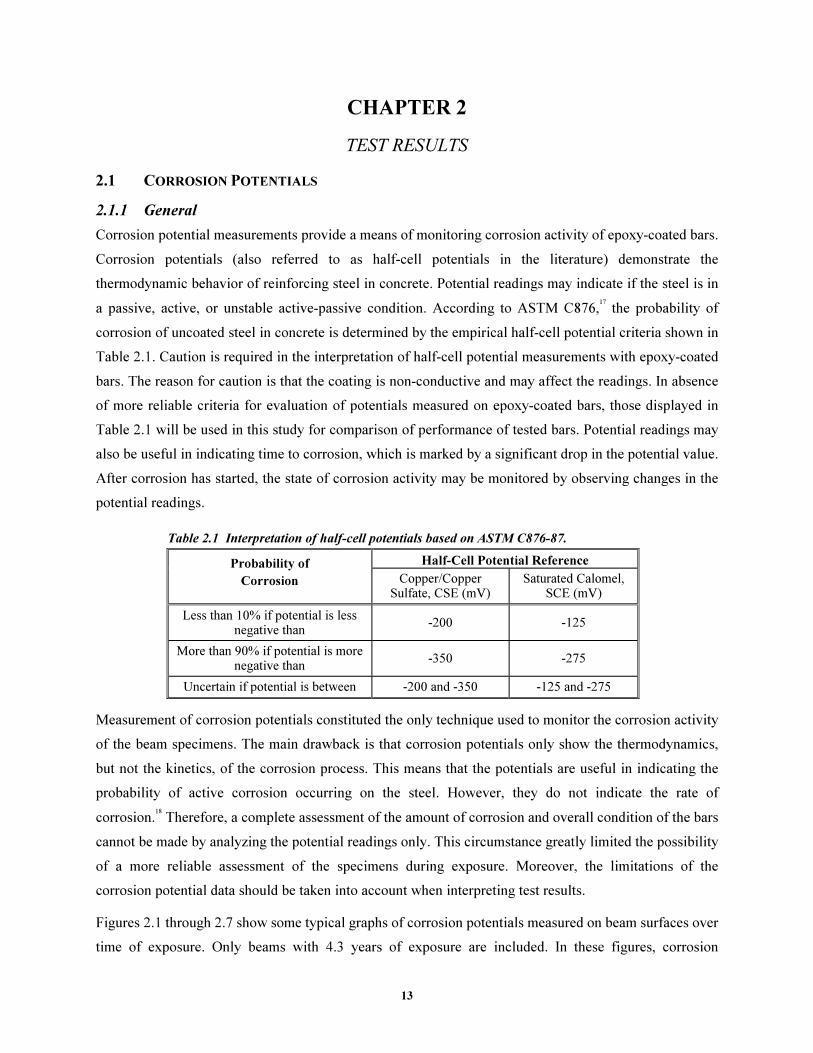
13
CHAPTER 2
TEST RESULTS
2.1 CORROSION POTENTIALS
2.1.1 General
Corrosion potential measurements provide a means of monitoring corrosion activity of epoxy-coated bars.
Corrosion potentials (also referred to as half-cell potentials in the literature) demonstrate the
thermodynamic behavior of reinforcing steel in concrete. Potential readings may indicate if the steel is in
a passive, active, or unstable active-passive condition. According to ASTM C876,17
the probability of
corrosion of uncoated steel in concrete is determined by the empirical half-cell potential criteria shown in
Table 2.1. Caution is required in the interpretation of half-cell potential measurements with epoxy-coated
bars. The reason for caution is that the coating is non-conductive and may affect the readings. In absence
of more reliable criteria for evaluation of potentials measured on epoxy-coated bars, those displayed in
Table 2.1 will be used in this study for comparison of performance of tested bars. Potential readings may
also be useful in indicating time to corrosion, which is marked by a significant drop in the potential value.
After corrosion has started, the state of corrosion activity may be monitored by observing changes in the
potential readings.
Table 2.1 Interpretation of half-cell potentials based on ASTM C876-87.
Half-Cell Potential Reference Probability of
Corrosion Copper/Copper Sulfate, CSE (mV)
Saturated Calomel, SCE (mV)
Less than 10% if potential is less negative than
-200 -125
More than 90% if potential is more negative than
-350 -275
Uncertain if potential is between -200 and -350 -125 and -275
Measurement of corrosion potentials constituted the only technique used to monitor the corrosion activity
of the beam specimens. The main drawback is that corrosion potentials only show the thermodynamics,
but not the kinetics, of the corrosion process. This means that the potentials are useful in indicating the
probability of active corrosion occurring on the steel. However, they do not indicate the rate of
corrosion.18
Therefore, a complete assessment of the amount of corrosion and overall condition of the bars
cannot be made by analyzing the potential readings only. This circumstance greatly limited the possibility
of a more reliable assessment of the specimens during exposure. Moreover, the limitations of the
corrosion potential data should be taken into account when interpreting test results.
Figures 2.1 through 2.7 show some typical graphs of corrosion potentials measured on beam surfaces over
time of exposure. Only beams with 4.3 years of exposure are included. In these figures, corrosion
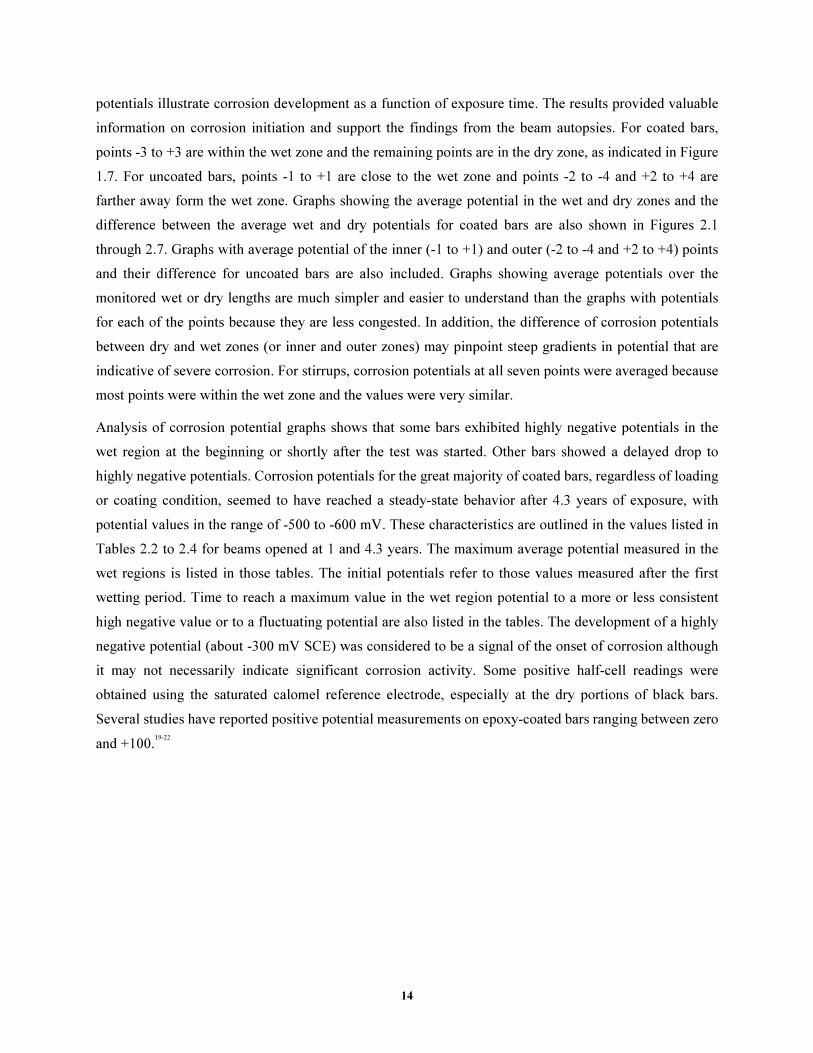
14
potentials illustrate corrosion development as a function of exposure time. The results provided valuable
information on corrosion initiation and support the findings from the beam autopsies. For coated bars,
points -3 to +3 are within the wet zone and the remaining points are in the dry zone, as indicated in Figure
1.7. For uncoated bars, points -1 to +1 are close to the wet zone and points -2 to -4 and +2 to +4 are
farther away form the wet zone. Graphs showing the average potential in the wet and dry zones and the
difference between the average wet and dry potentials for coated bars are also shown in Figures 2.1
through 2.7. Graphs with average potential of the inner (-1 to +1) and outer (-2 to -4 and +2 to +4) points
and their difference for uncoated bars are also included. Graphs showing average potentials over the
monitored wet or dry lengths are much simpler and easier to understand than the graphs with potentials
for each of the points because they are less congested. In addition, the difference of corrosion potentials
between dry and wet zones (or inner and outer zones) may pinpoint steep gradients in potential that are
indicative of severe corrosion. For stirrups, corrosion potentials at all seven points were averaged because
most points were within the wet zone and the values were very similar.
Analysis of corrosion potential graphs shows that some bars exhibited highly negative potentials in the
wet region at the beginning or shortly after the test was started. Other bars showed a delayed drop to
highly negative potentials. Corrosion potentials for the great majority of coated bars, regardless of loading
or coating condition, seemed to have reached a steady-state behavior after 4.3 years of exposure, with
potential values in the range of -500 to -600 mV. These characteristics are outlined in the values listed in
Tables 2.2 to 2.4 for beams opened at 1 and 4.3 years. The maximum average potential measured in the
wet regions is listed in those tables. The initial potentials refer to those values measured after the first
wetting period. Time to reach a maximum value in the wet region potential to a more or less consistent
high negative value or to a fluctuating potential are also listed in the tables. The development of a highly
negative potential (about -300 mV SCE) was considered to be a signal of the onset of corrosion although
it may not necessarily indicate significant corrosion activity. Some positive half-cell readings were
obtained using the saturated calomel reference electrode, especially at the dry portions of black bars.
Several studies have reported positive potential measurements on epoxy-coated bars ranging between zero
and +100.19-22

15
-700
-600
-500
-400
-300
-200
-100
0
100
200
300
0 1 2 3 4 5
Years of Exposure
mV
. v
s
SC
E
-5
-4
-3
-2
-1
0
1
2
3
4
5
B1-L-UU-AR (Upper Bar)
(a) Corrosion potentials along test bar (wet and dry regions)
-700
-600
-500
-400
-300
-200
-100
0
100
200
0 1 2 3 4 5Years of Exposure
mV
. vs S
CE
B1-L-UU-AR (Upper Bar)Avg. Potential
(Wetted Region)
Avg. Potential
(Dry Region)
Difference of Avg. Potentials
(b) Average potentials in dry and wet regions
Figure 2.1 Corrosion potentials for beam B1 upper bar.
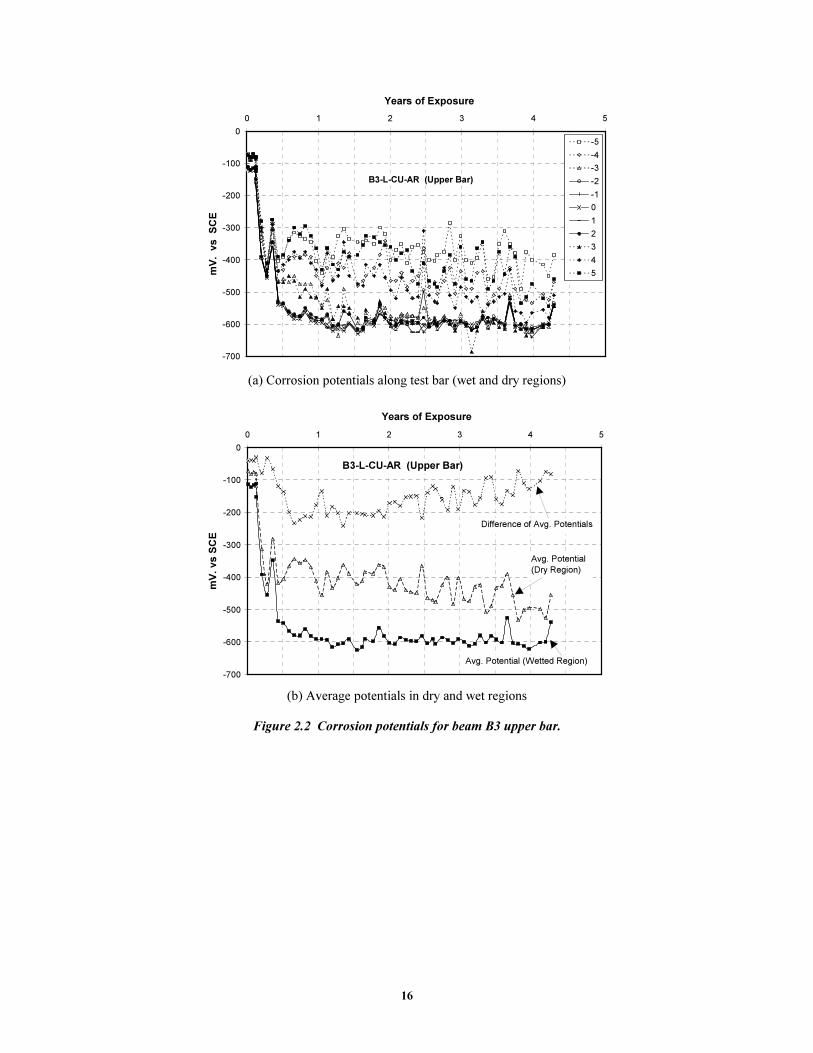
16
-700
-600
-500
-400
-300
-200
-100
0
0 1 2 3 4 5
Years of Exposure
mV
. v
s S
CE
-5
-4
-3
-2
-1
0
1
2
3
4
5
B3-L-CU-AR (Upper Bar)
(a) Corrosion potentials along test bar (wet and dry regions)
-700
-600
-500
-400
-300
-200
-100
0
0 1 2 3 4 5
Years of Exposure
mV
. vs S
CE
B3-L-CU-AR (Upper Bar)
Avg. Potential (Wetted Region)
Avg. Potential
(Dry Region)
Difference of Avg. Potentials
(b) Average potentials in dry and wet regions
Figure 2.2 Corrosion potentials for beam B3 upper bar.

17
-700
-600
-500
-400
-300
-200
-100
0
0 1 2 3 4 5
Years of Exposure
mV
. v
s S
CE
-5
-4
-3
-2
-1
0
1
2
3
4
5
B6-L-CL-AR (Upper Bar)
(a) Corrosion potentials along test bar (wet and dry regions)
-700
-600
-500
-400
-300
-200
-100
0
0 1 2 3 4 5
Years of Exposure
mV
. v
s S
CE
B6-L-CL-AR (Upper Bar)
Avg. Potential (Wetted Region)
Avg. Potential (Dry Region)
Difference of Avg. Potentials
(b) Average potentials in dry and wet regions
Figure 2.3 Corrosion potentials for beam B6 upper bar

18
-700
-600
-500
-400
-300
-200
-100
0
0 1 2 3 4 5
Years of Exposure
mV
. v
s
SC
E
-3
-2
-1
0
1
2
3
B27-ST-CU-D(P) (Stirrup)
(a) Corrosion potentials along test bar (wet and dry regions)
-700
-600
-500
-400
-300
-200
-100
0
0 1 2 3 4 5
Years of Exposure
mV
. v
s S
CE
B27-ST-CU-D(P) (Stirrup)
(b) Average corrosion potentials
Figure 2.4 Corrosion potentials for beam B27 stirrup.

19
-700
-600
-500
-400
-300
-200
-100
0
0 1 2 3 4 5
Years of Exposure
mV
. v
s
SC
E
-3
-2
-1
0
1
2
3
B17-ST-CU-AR (Stirrup)
(a) Corrosion potentials along test bar (wet and dry regions)
-700
-600
-500
-400
-300
-200
-100
0
0 1 2 3 4 5
Years of Exposure
mV
. v
s S
CE B17-ST-CU-AR (Stirrup)
(b) Average corrosion potentials
Figure 2.5 Corrosion potentials for beam B17 stirrup.
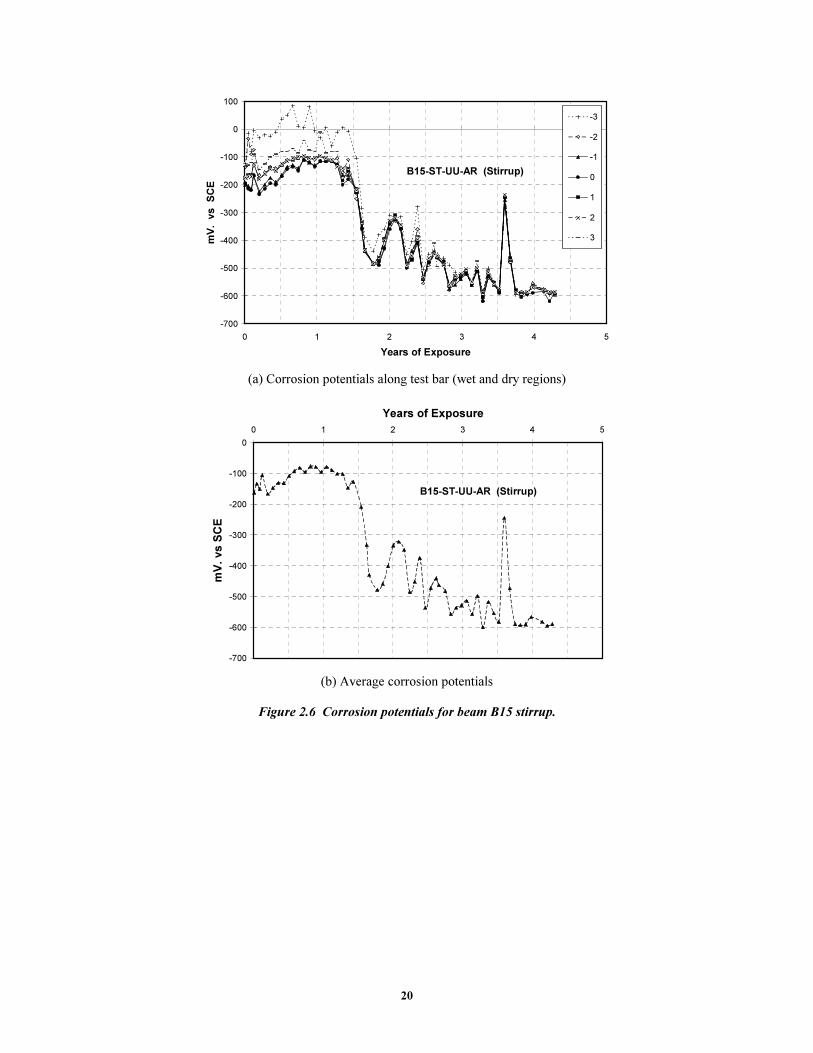
20
-700
-600
-500
-400
-300
-200
-100
0
100
0 1 2 3 4 5
Years of Exposure
mV
. v
s
SC
E
-3
-2
-1
0
1
2
3
B15-ST-UU-AR (Stirrup)
(a) Corrosion potentials along test bar (wet and dry regions)
-700
-600
-500
-400
-300
-200
-100
0
0 1 2 3 4 5
Years of Exposure
mV
. vs S
CE
B15-ST-UU-AR (Stirrup)
(b) Average corrosion potentials
Figure 2.6 Corrosion potentials for beam B15 stirrup.

21
-800
-700
-600
-500
-400
-300
-200
-100
0
100
0 1 2 3 4 5
Years of Exposure
mV
. v
s S
CE
-5
-4
-3
-2
-1
0
1
2
3
4
5
B32-SP-CU-D(P)
(Lower Short Bar)
(a) Corrosion potentials along test bar (wet and dry regions)
-800
-700
-600
-500
-400
-300
-200
-100
0
0 1 2 3 4 5
Years of Exposure
mV
. v
s S
CE
B32-SP-CU-D(P) (Lower Short Bar)
Avg. Potential (Wetted Region)
Avg. Potential
(Dry Region)
Difference of Avg.
Potentials
(b) Average potentials in dry and wet regions
Figure 2.7 Corrosion potentials for beam B32 lower short bar.

22
Table 2.2 Corrosion potential values for beam bar specimens of Group I, longitudinal bars.
Beam No.
Initial Average
Potential after 4 Days of Exposure
(mV)
Maximum
Average Potential in Wet Zone
(mV)
Final
Average Potential in Wet Zone
(mV)
Exposure Time
to Maximum Drop of Average
Potential (Days)
Time-to-
Corrosion Initiation
(Days)
Beams exposed for one year:
B2-U B2-L
-80 -95
-100 -230
46 270
Unsuspected Uncertain
B4-U B4-L
-65 -100
-620 -615
74 18
74 18
B5-U B5-L
-190 -280
-380 -685
102 130
102 130
B7-U B7-L
-125 -120
-415 -465
242 186
242 186
B9-U B9-L
-410 -470
-555 -565
130 32
4 4
B11-U B11-L
-475 -425
-585 -605
18 46
4 4
B13-U B13-L
-385 -500
-600 -615
32 46
4 4
Beams exposed for 4.3 years:
B1-U B1-L
-60 -65
-595 -620*
-535 -465
1061 606
970 606
B3-U -115 -625 -540 74 74 B3-L -105 -725* -615 102 102
B6-U -430 -620 -555 18 4 B6-L -105 -635 -535 410 46
B8-U -115 -585 -515 326 326 B8-L -95 -635 -535 270 270
B10-U -170 -610 -600 18 18 B10-L -395 -620 -600 18 4
B12-U -250 -570 -555 18 18 B12-L -440 -605 -605 18 4
B14-U -205 -1135* -475 18 18 B14-L -125 -800* -600 18 18
a The underlined potentials in the table indicate probable corrosion initiation.
*Suspect value U: Upper bar L: Lower bar

23
Table 2.3 Corrosion potential values for beam bar specimens of Group II, stirrups.
Beam No.
Initial
Average Potential
after 4 Days
of Exposure (mV)
Maximum
Average Potential in Wet Zone
(mV)
Final
Average Potential in Wet Zone
(mV)
Exposure
Time to Maximum
Drop of
Average Potential
(Days)
Time-to-
Corrosion Initiation
(Days)
Beams exposed for one year:
B16 -165 -415a 214 214
B18 -220 -465 74 74
B20 -240 -570 46 46
B21 -135 -280 242 Uncertain
B24 -245 -510 46 46
B26 -335 -550 46 4
B28 -285 -590 46 46
Beams exposed for 4.3 years:
B15 -165 -600 -590 592 592
B17 -245 -680 -595 74 to 158 74
B19 -190 -655 -570 46 46
B22 -190 -570 -535 494, 817 522
B23 -215 -515 -510 130 130
B25 -205 -520 -335 46, 522 46
B27 -185 -610 -550 298 to 817 326
a The underlined potentials in the table indicate probable corrosion initiation.
24
Table 2.4 Corrosion potential values for beam bar specimens of Group III, longitudinal/splice bars and stirrups.
Beam
No.
Initial Average
Potential after 4 Days of
Exposure (mV)
Maximum
Average Potential in Wet
Zone (mV)
Final Average
Potential in Wet Zone
(mV)
Exposure Time
to Maximum Drop of Average Potential (Days)
Time-to-
Corrosion Initiation
(Days)
Beams exposed for one year:
Longitudinal bars including splice bars
B29-U
B29-L
-350a
-180
-600
-605
18
18
4
18
B31-U
B31-L
-230
-390
-740
-650
18
18
18
4
B33-U
B33-L
-465
-140
-720
-695
46
46
4
46
Stirrups
B29 -460 -635 46 4
B31 -400 -545 32 4
B33 -440 -630 46 4
Beams exposed for 4.3 years:
Longitudinal bars including splice bars
B30-U -135 -910* -605 18 18
B30-L -80 -1085* -595 18 18
B32-U -340 -1400* -620 32 4
B32-L -180 -750 -625 18 18
B34-U -280 -835 -575 18 18
B34-L -500 -660 -585 46 4
Stirrups
B30 -145 -665 -530 46 18
B32 -120 -820* -600 102 102
B34 -220 -630 -485 46 32
*Suspect value U: Upper bar L: Lower bar
A summary of black bar potentials for all beams is shown in Tables 2.5 through 2.7. In most cases, the
time to maximum potential drop and time to corrosion are unknown because the black bars were not
monitored during the first year of exposure.
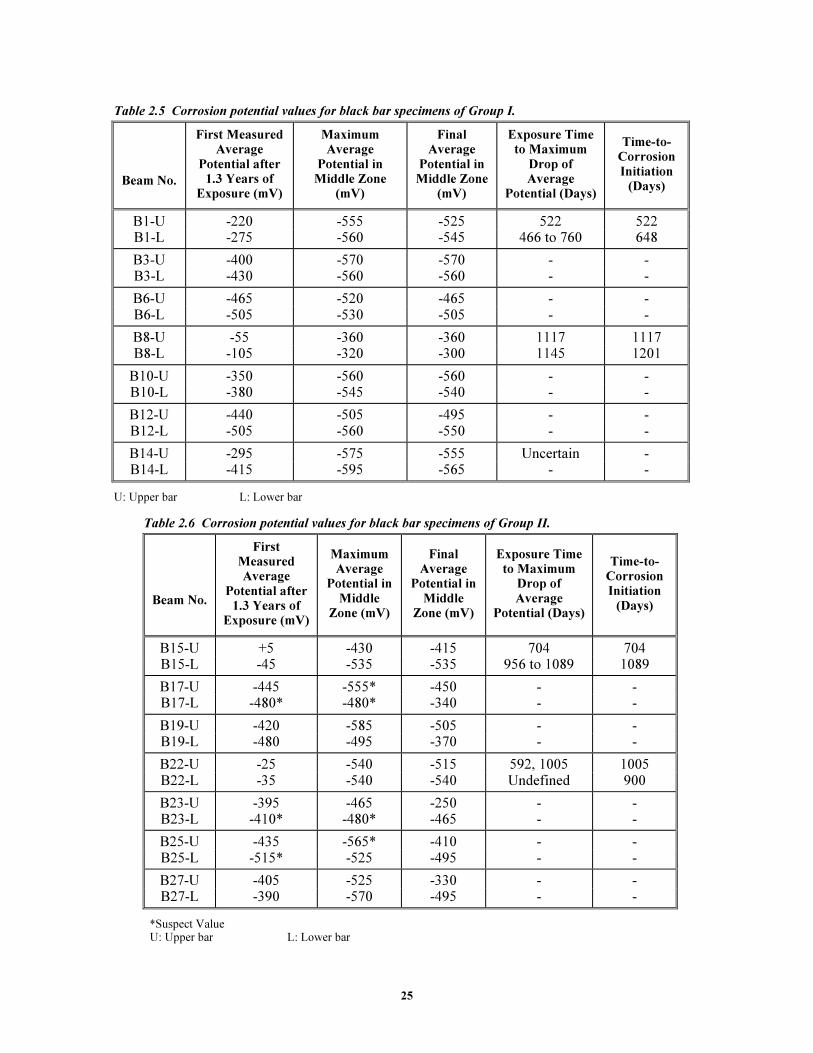
25
Table 2.5 Corrosion potential values for black bar specimens of Group I.
Beam No.
First Measured Average
Potential after 1.3 Years of
Exposure (mV)
Maximum Average
Potential in Middle Zone
(mV)
Final Average
Potential in Middle Zone
(mV)
Exposure Time to Maximum
Drop of Average
Potential (Days)
Time-to-Corrosion
Initiation (Days)
B1-U -220 -555 -525 522 522 B1-L -275 -560 -545 466 to 760 648
B3-U -400 -570 -570 - - B3-L -430 -560 -560 - -
B6-U -465 -520 -465 - - B6-L -505 -530 -505 - -
B8-U -55 -360 -360 1117 1117 B8-L -105 -320 -300 1145 1201
B10-U -350 -560 -560 - - B10-L -380 -545 -540 - -
B12-U -440 -505 -495 - - B12-L -505 -560 -550 - -
B14-U -295 -575 -555 Uncertain - B14-L -415 -595 -565 - -
U: Upper bar L: Lower bar
Table 2.6 Corrosion potential values for black bar specimens of Group II.
Beam No.
First Measured Average
Potential after 1.3 Years of
Exposure (mV)
Maximum Average
Potential in
Middle Zone (mV)
Final Average
Potential in
Middle Zone (mV)
Exposure Time to Maximum
Drop of
Average Potential (Days)
Time-to-Corrosion Initiation
(Days)
B15-U +5 -430 -415 704 704 B15-L -45 -535 -535 956 to 1089 1089
B17-U -445 -555* -450 - - B17-L -480* -480* -340 - -
B19-U -420 -585 -505 - - B19-L -480 -495 -370 - -
B22-U -25 -540 -515 592, 1005 1005 B22-L -35 -540 -540 Undefined 900
B23-U -395 -465 -250 - - B23-L -410* -480* -465 - -
B25-U -435 -565* -410 - - B25-L -515* -525 -495 - -
B27-U -405 -525 -330 - - B27-L -390 -570 -495 - -
*Suspect Value U: Upper bar L: Lower bar
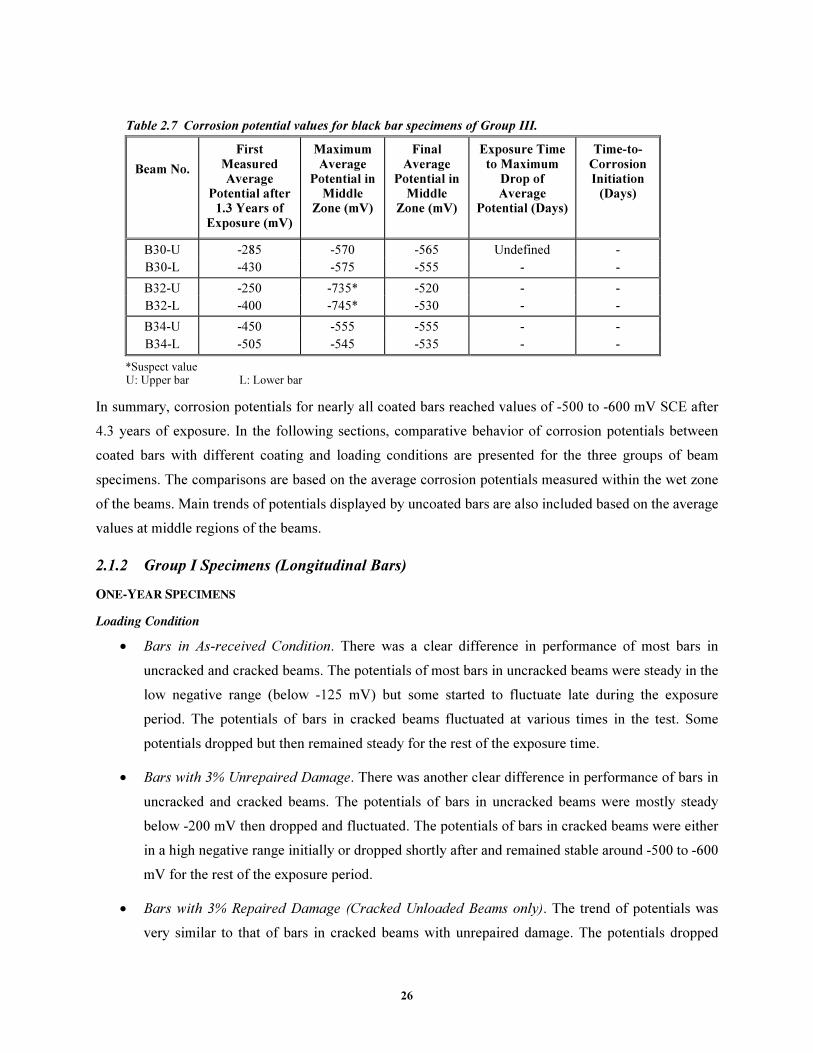
26
Table 2.7 Corrosion potential values for black bar specimens of Group III.
Beam No.
First
Measured Average
Potential after 1.3 Years of
Exposure (mV)
Maximum
Average Potential in
Middle Zone (mV)
Final
Average Potential in
Middle Zone (mV)
Exposure Time
to Maximum Drop of Average
Potential (Days)
Time-to-
Corrosion Initiation
(Days)
B30-U -285 -570 -565 Undefined -
B30-L -430 -575 -555 - -
B32-U -250 -735* -520 - -
B32-L -400 -745* -530 - -
B34-U -450 -555 -555 - -
B34-L -505 -545 -535 - -
*Suspect value U: Upper bar L: Lower bar
In summary, corrosion potentials for nearly all coated bars reached values of -500 to -600 mV SCE after
4.3 years of exposure. In the following sections, comparative behavior of corrosion potentials between
coated bars with different coating and loading conditions are presented for the three groups of beam
specimens. The comparisons are based on the average corrosion potentials measured within the wet zone
of the beams. Main trends of potentials displayed by uncoated bars are also included based on the average
values at middle regions of the beams.
2.1.2 Group I Specimens (Longitudinal Bars)
�����������������
����������������
• Bars in As-received Condition. There was a clear difference in performance of most bars in
uncracked and cracked beams. The potentials of most bars in uncracked beams were steady in the
low negative range (below -125 mV) but some started to fluctuate late during the exposure
period. The potentials of bars in cracked beams fluctuated at various times in the test. Some
potentials dropped but then remained steady for the rest of the exposure time.
• Bars with 3% Unrepaired Damage. There was another clear difference in performance of bars in
uncracked and cracked beams. The potentials of bars in uncracked beams were mostly steady
below -200 mV then dropped and fluctuated. The potentials of bars in cracked beams were either
in a high negative range initially or dropped shortly after and remained stable around -500 to -600
mV for the rest of the exposure period.
• Bars with 3% Repaired Damage (Cracked Unloaded Beams only). The trend of potentials was
very similar to that of bars in cracked beams with unrepaired damage. The potentials dropped

27
early in the test and remained steady in the high negative range for the rest of the exposure
period.
• No appreciable difference in performance existed between bars in cracked unloaded and cracked
loaded beams, except that bars in cracked loaded beams exhibited the highest drops in potentials
(maximum potentials reached -835 mV).
�����������������
����� ����������
• There was little difference in behavior of cracked beams with different damaged conditions. The
corrosion potentials were different during the first three to six months of exposure, but thereafter,
the potentials for different coating conditions evened out and became similar (Figure 2.8).
• Overall, coated bars with different damage conditions experienced very similar corrosion
potentials over the long term. Differences in coating condition were evident for uncracked beams
from 1 to 3 years of exposure; thereafter, corrosion potentials became similar. Bars in an as-
received condition generally had lower negative potentials than bars with 3% damage, both
patched and unpatched [Figures 2.9(b), 2.10].
• There was no clear difference in the corrosion potentials between unpatched and patched
damaged bars (cracked beams). In one case (cracked unloaded beams), potentials for the upper
bar with patched 3% damage (beam B14) decreased faster to the -600 mV SCE region and stayed
slightly more negative than potentials for the upper bar with 3% damage without repair (beam
B10). See Figure 2.8(b).
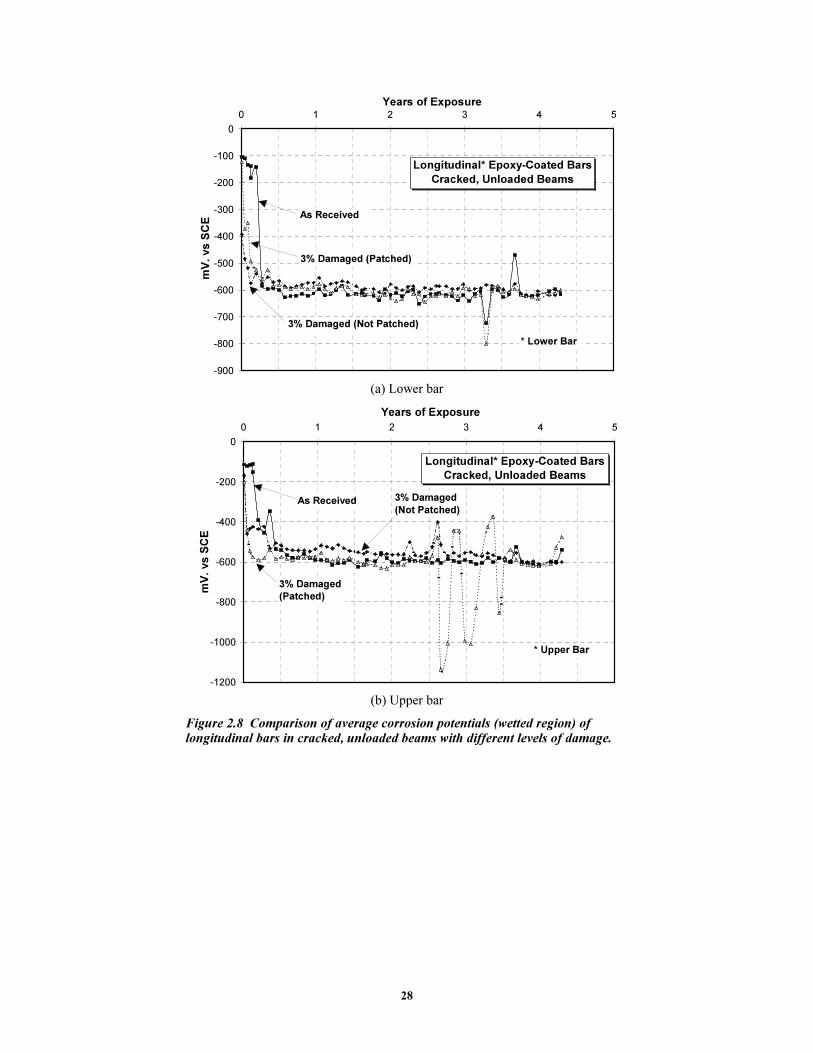
28
-900
-800
-700
-600
-500
-400
-300
-200
-100
0
0 1 2 3 4 5
Years of Exposure
mV
. vs S
CE
As Received
3% Damaged (Not Patched)
3% Damaged (Patched)
Longitudinal* Epoxy-Coated Bars
Cracked, Unloaded Beams
* Lower Bar
(a) Lower bar
-1200
-1000
-800
-600
-400
-200
0
0 1 2 3 4 5
Years of Exposure
mV
. vs S
CE
As Received 3% Damaged
(Not Patched)
3% Damaged
(Patched)
Longitudinal* Epoxy-Coated Bars
Cracked, Unloaded Beams
* Upper Bar
(b) Upper bar
Figure 2.8 Comparison of average corrosion potentials (wetted region) of longitudinal bars in cracked, unloaded beams with different levels of damage.

29
-900
-800
-700
-600
-500
-400
-300
-200
-100
0
0 1 2 3 4 5
Years of Exposure
mV
. vs S
CE
As Received
3% Damaged (Not
Longitudinal* Epoxy-Coated Bars
Cracked, Loaded Beams
* Upper Bar
(a) Upper bar
-900
-800
-700
-600
-500
-400
-300
-200
-100
0
0 1 2 3 4 5
Years of Exposure
mV
. vs S
CE
As Received
3% Damaged (Not
Longitudinal* Epoxy-Coated Bars
Cracked, Loaded Beams
* Lower Bar
(b) Lower bar
Figure 2.9 Comparison of average corrosion potentials (wetted region) of longitudinal bars in cracked, loaded beams with different levels of damage.
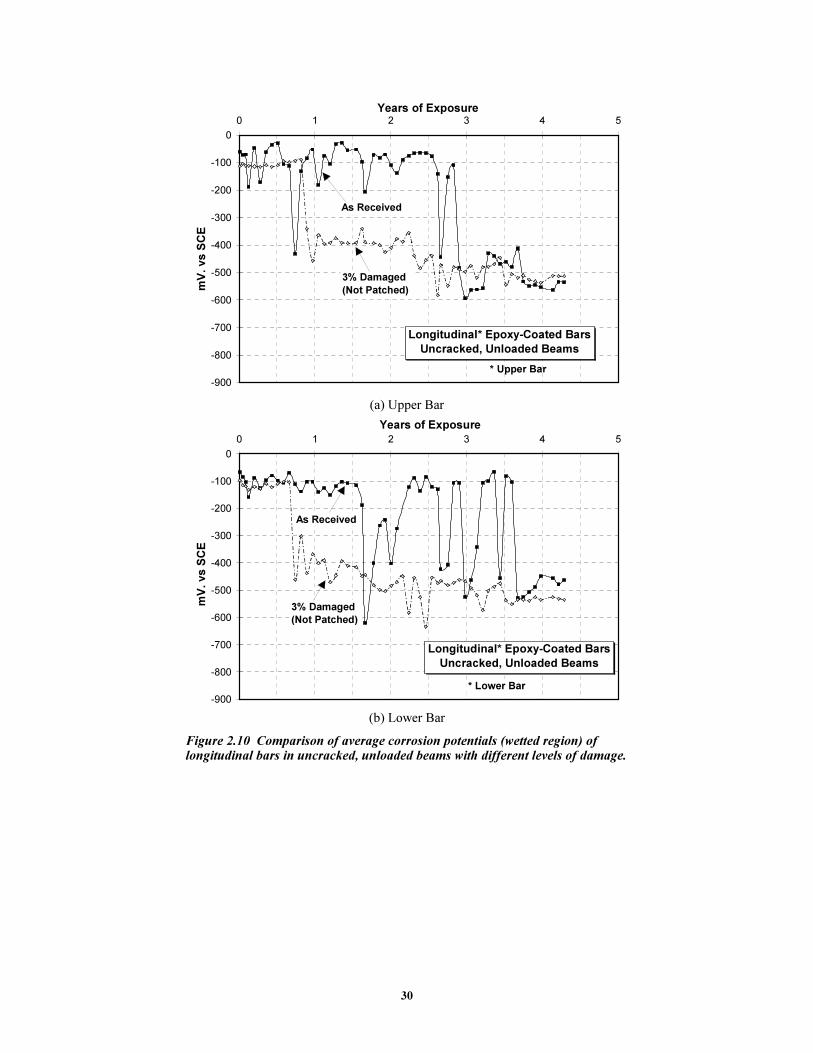
30
-900
-800
-700
-600
-500
-400
-300
-200
-100
0
0 1 2 3 4 5
Years of Exposure
mV
. vs S
CE
As Received
3% Damaged
(Not Patched)
Longitudinal* Epoxy-Coated Bars
Uncracked, Unloaded Beams
* Upper Bar
(a) Upper Bar
-900
-800
-700
-600
-500
-400
-300
-200
-100
0
0 1 2 3 4 5
Years of Exposure
mV
. vs S
CE
As Received
3% Damaged
(Not Patched)
Longitudinal* Epoxy-Coated Bars
Uncracked, Unloaded Beams
* Lower Bar
(b) Lower Bar
Figure 2.10 Comparison of average corrosion potentials (wetted region) of longitudinal bars in uncracked, unloaded beams with different levels of damage.
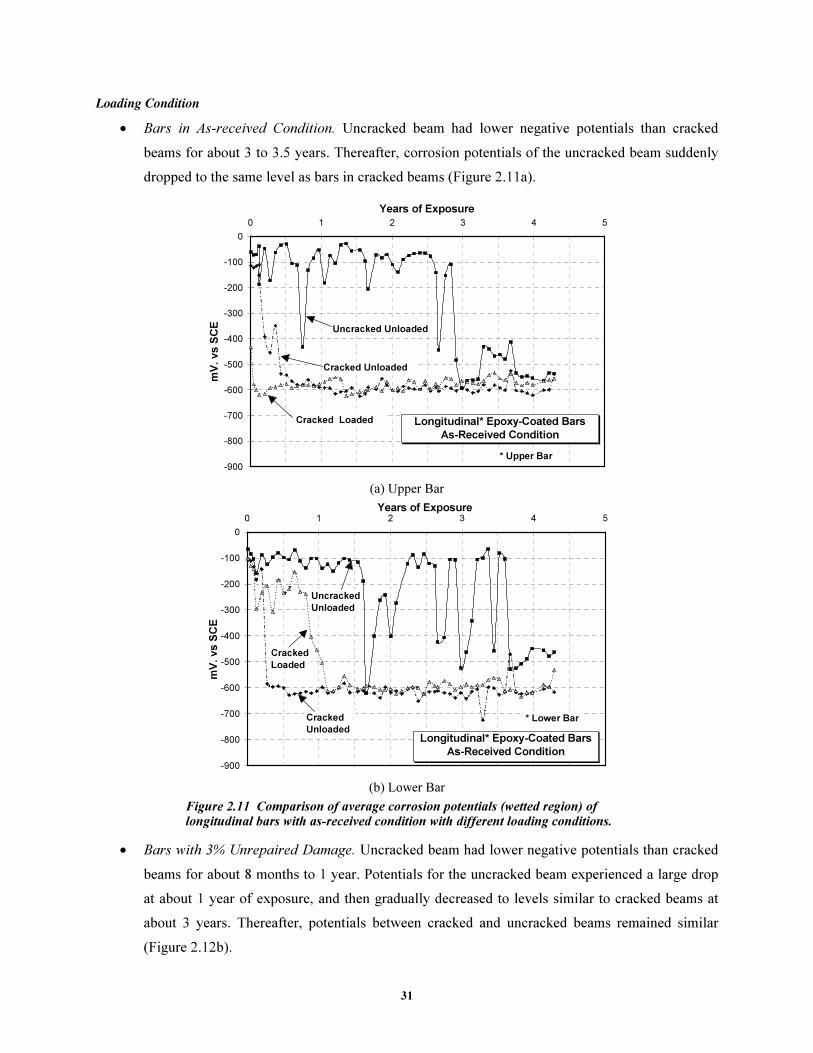
31
����������������
• Bars in As-received Condition. Uncracked beam had lower negative potentials than cracked
beams for about 3 to 3.5 years. Thereafter, corrosion potentials of the uncracked beam suddenly
dropped to the same level as bars in cracked beams (Figure 2.11a).
-900
-800
-700
-600
-500
-400
-300
-200
-100
0
0 1 2 3 4 5
Years of Exposurem
V.
vs S
CE Uncracked Unloaded
Cracked Unloaded
Cracked Loaded Longitudinal* Epoxy-Coated Bars
As-Received Condition
* Upper Bar
(a) Upper Bar
-900
-800
-700
-600
-500
-400
-300
-200
-100
0
0 1 2 3 4 5
Years of Exposure
mV
. vs S
CE
Uncracked
Unloaded
Cracked
Unloaded
Cracked
Loaded
Longitudinal* Epoxy-Coated Bars
As-Received Condition
* Lower Bar
(b) Lower Bar
Figure 2.11 Comparison of average corrosion potentials (wetted region) of longitudinal bars with as-received condition with different loading conditions.
• Bars with 3% Unrepaired Damage. Uncracked beam had lower negative potentials than cracked
beams for about 8 months to 1 year. Potentials for the uncracked beam experienced a large drop
at about 1 year of exposure, and then gradually decreased to levels similar to cracked beams at
about 3 years. Thereafter, potentials between cracked and uncracked beams remained similar
(Figure 2.12b).

32
-900
-800
-700
-600
-500
-400
-300
-200
-100
0
0 1 2 3 4 5
Years of Exposure
mV
. v
s S
CE
Uncracked Unloaded
Cracked
Unloaded
Cracked
Loaded
Longitudinal* Epoxy-Coated Bars
3% Damaged Condition
* Upper Bar
(a) Upper Bar
-900
-800
-700
-600
-500
-400
-300
-200
-100
0
0 1 2 3 4 5
Years of Exposure
mV
. v
s S
CE
Uncracked Unloaded
Cracked UnloadedCracked Loaded
Longitudinal* Epoxy-Coated Bars
3% Damage Condition
* Lower Bar
(b) Lower Bar
Figure 2.12 Comparison of average corrosion potentials (wetted region) of longitudinal bars with 3% damage to coating and different loading conditions.
• Loaded and unloaded beams showed only minor differences regardless of coating condition
(Figures 2.11, 2.12). In general, bar potentials for cracked, unloaded beams decreased to
-500 to -600 mV SCE within 6 or less months, and potentials for cracked loaded beams dropped
to the same level within 3 months.
The lower bar with coating in the as-received condition and in an uncracked, unloaded beam experienced
an erratic behavior after 1.5 years of exposure with continuous jumps up and down between the -400 to
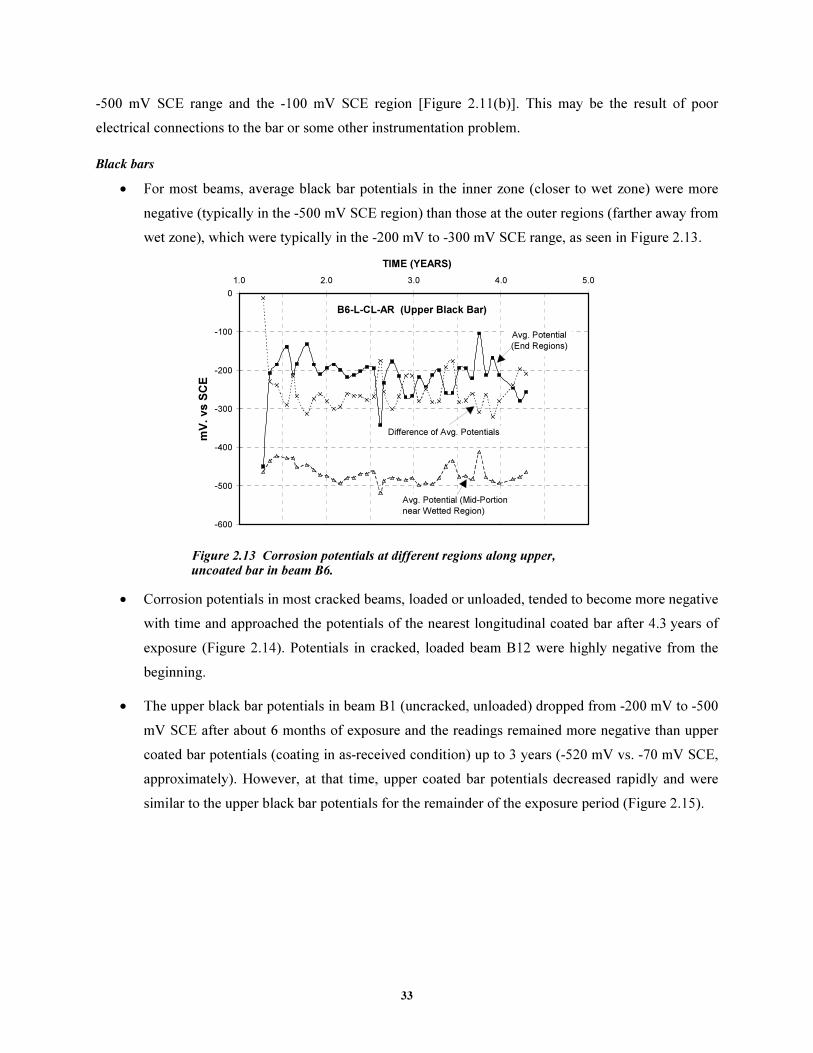
33
-500 mV SCE range and the -100 mV SCE region [Figure 2.11(b)]. This may be the result of poor
electrical connections to the bar or some other instrumentation problem.
����������
• For most beams, average black bar potentials in the inner zone (closer to wet zone) were more
negative (typically in the -500 mV SCE region) than those at the outer regions (farther away from
wet zone), which were typically in the -200 mV to -300 mV SCE range, as seen in Figure 2.13.
-600
-500
-400
-300
-200
-100
0
1.0 2.0 3.0 4.0 5.0
TIME (YEARS)
mV
. vs S
CE
B6-L-CL-AR (Upper Black Bar)
Avg. Potential (Mid-Portion
near Wetted Region)
Avg. Potential
(End Regions)
Difference of Avg. Potentials
Figure 2.13 Corrosion potentials at different regions along upper, uncoated bar in beam B6.
• Corrosion potentials in most cracked beams, loaded or unloaded, tended to become more negative
with time and approached the potentials of the nearest longitudinal coated bar after 4.3 years of
exposure (Figure 2.14). Potentials in cracked, loaded beam B12 were highly negative from the
beginning.
• The upper black bar potentials in beam B1 (uncracked, unloaded) dropped from -200 mV to -500
mV SCE after about 6 months of exposure and the readings remained more negative than upper
coated bar potentials (coating in as-received condition) up to 3 years (-520 mV vs. -70 mV SCE,
approximately). However, at that time, upper coated bar potentials decreased rapidly and were
similar to the upper black bar potentials for the remainder of the exposure period (Figure 2.15).

34
-800
-700
-600
-500
-400
-300
-200
-100
0
1 2 3 4 5
TIME (YEARS)
mV
vs S
CE
Upper Black Bars
Avg. Potentials at Mid-Portion
Near Wetted Region
L: Loaded
U: Unloaded
B12 (L)
B3 (U)
B6 (L)
B14 (U)
B10 (U)
Figure 2.14 Corrosion potentials for upper, uncoated bars in cracked beams with different loading conditions.
-700
-600
-500
-400
-300
-200
-100
0
1 2 3 4 5
TIME (YEARS)
mV
. v
s S
CE
B1-L-UU-AR (Upper
Bars)
Uncoated Bar
Epoxy-Coated Bar
Avg. Potentials at Mid-Portion
Figure 2.15 Corrosion potentials for upper, coated and uncoated bars, in uncracked beam B1.
• For beam B8 (uncracked, unloaded with 3% damage to coating), black bar potentials were less
negative than coated bar potentials throughout the exposure period (Figure 2.16).

35
-700
-600
-500
-400
-300
-200
-100
0
100
1 2 3 4 5
TIME (YEARS)
mV
. v
s S
CE
B8-L-UU-D
(Lower Bars)
Uncoated Bar
Epoxy-Coated Bar
Avg. Potentials at Mid-Portion
Figure 2.16 Corrosion potentials for lower, coated and uncoated bars, in uncracked beam B8.
2.1.3 Group II Specimens (Stirrups)
�����������������
����������������
• Stirrups in As-received Condition. The potentials for stirrups in uncracked beams were steady in
the low negative range except for one stirrup which exhibited a drop in potential around the
middle of the exposure period. The performance of stirrups in all cracked beams (loaded and
unloaded) was not significantly different. The potentials for stirrups in cracked beams either
fluctuated for a considerable period of time or dropped steadily then remained stable between
-400 and -600 mV.
• Stirrups in As-received-Patched Condition. Stirrups in this category exhibited similar
performance to that of stirrups with as-received condition. The potentials for stirrups in uncracked
beams were steady in the low negative range except for one stirrup that exhibited a sudden drop
in potential after the middle of the exposure period. The potentials for stirrups in cracked beams
fluctuated gradually for a considerable period of time before they reached a steady state between -
200 and -600 mV.
• Stirrups with 3% Repaired Damage (Cracked Unloaded Beams only). The performance of
stirrups in replicate beams was different. The initial potentials were -185 and -285 mV, while the
final potentials were -325 and -535 mV. The potential for the stirrup that exhibited less negative
initial potential remained steady for a long time before gradually declining. The potential for the
other stirrup dropped early in the test and fluctuated gradually for a considerable period of time
before reaching a steady state.
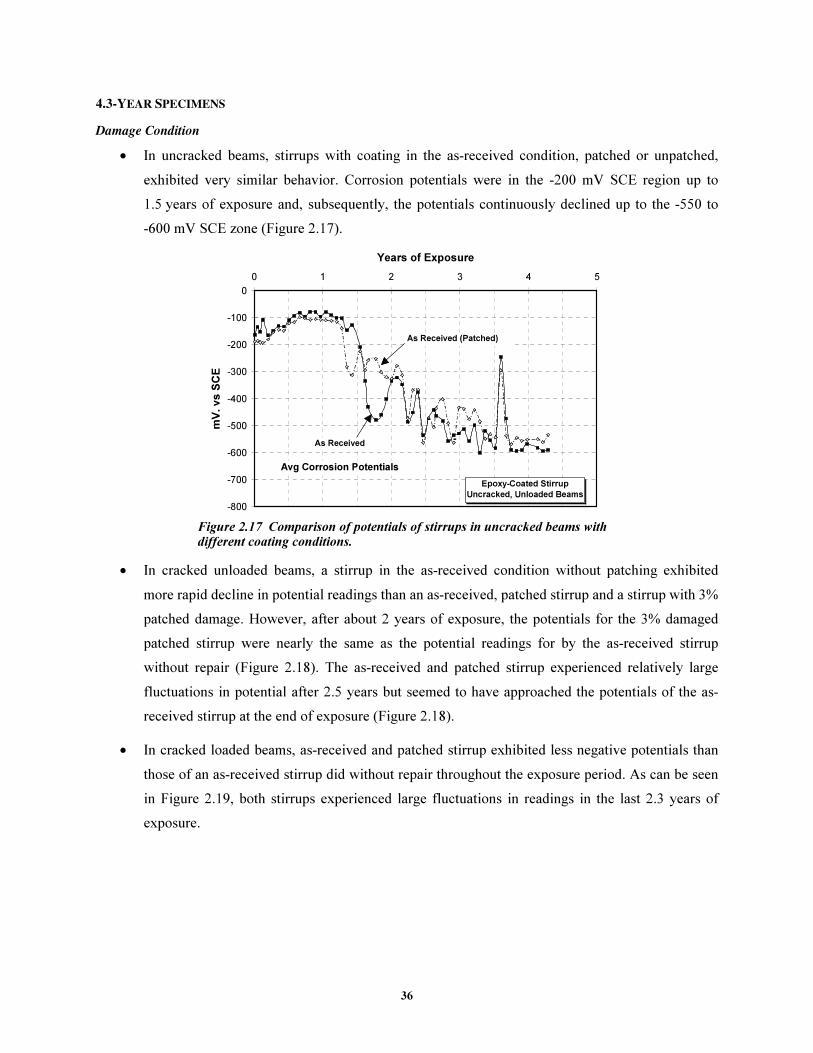
36
�����������������
����� ���������
• In uncracked beams, stirrups with coating in the as-received condition, patched or unpatched,
exhibited very similar behavior. Corrosion potentials were in the -200 mV SCE region up to
1.5 years of exposure and, subsequently, the potentials continuously declined up to the -550 to
-600 mV SCE zone (Figure 2.17).
-800
-700
-600
-500
-400
-300
-200
-100
0
0 1 2 3 4 5
Years of Exposure
mV
. v
s S
CE
As Received
As Received (Patched)
Epoxy-Coated Stirrup
Uncracked, Unloaded Beams
Avg Corrosion Potentials
Figure 2.17 Comparison of potentials of stirrups in uncracked beams with different coating conditions.
• In cracked unloaded beams, a stirrup in the as-received condition without patching exhibited
more rapid decline in potential readings than an as-received, patched stirrup and a stirrup with 3%
patched damage. However, after about 2 years of exposure, the potentials for the 3% damaged
patched stirrup were nearly the same as the potential readings for by the as-received stirrup
without repair (Figure 2.18). The as-received and patched stirrup experienced relatively large
fluctuations in potential after 2.5 years but seemed to have approached the potentials of the as-
received stirrup at the end of exposure (Figure 2.18).
• In cracked loaded beams, as-received and patched stirrup exhibited less negative potentials than
those of an as-received stirrup did without repair throughout the exposure period. As can be seen
in Figure 2.19, both stirrups experienced large fluctuations in readings in the last 2.3 years of
exposure.

37
-800
-700
-600
-500
-400
-300
-200
-100
0
0 1 2 3 4 5
Years of Exposure
mV
. vs S
CE
As Received
As Received (Patched)
3% Damaged (Patched)
Epoxy-Coated Stirrup
Cracked, Unloaded BeamsAvg Corrosion Potentials
Figure 2.18 Comparison of potentials of stirrups in cracked, unloaded beams with different coating conditions.
-800
-700
-600
-500
-400
-300
-200
-100
0
0 1 2 3 4 5
Years of Exposure
mV
. vs S
CE
As Received
As Received (Patched)
Epoxy-Coated Stirrup
Cracked, Loaded Beams
Avg Corrosion Potentials
Figure 2.19 Comparison of potentials of stirrups in cracked, loaded beams with different coating conditions.
����������������
• Uncracked beams stayed in the low negative potential region for about 1 to 1.5 years of exposure.
Thereafter, corrosion potentials declined continuously to values around -600 mV SCE. The
behavior between cracked and uncracked beams was similar after about 2.5 years of exposure
(Figure 2.20). In one case (beams with as-received and patched coated bars), potentials for
uncracked beams became more negative than those of cracked beams after 2.5 years of exposure
(Figure 2.21).
• There was no distinctive performance between cracked loaded and cracked unloaded beams
regardless of coating condition (Figure 2.20).

38
-800
-700
-600
-500
-400
-300
-200
-100
0
0 1 2 3 4 5
Years of Exposure
mV
. vs S
CE
Uncracked Unloaded
Cracked Unloaded
Cracked
Loaded
Epoxy-Coated Stirrup
As-Received Condition
Avg Corrosion Potentials
Figure 2.20 Comparison of potentials of stirrups in as-received condition and different loading conditions.
-800
-700
-600
-500
-400
-300
-200
-100
0
0 1 2 3 4 5
Years of Exposure
mV
. vs S
CE
Uncracked
Unloaded
Cracked Unloaded
Cracked
Loaded
Epoxy-Coated Stirrup
As-Received & Patched
CL
UU
CU
Avg Corrosion Potentials
Figure 2.21 Comparison of potentials of stirrups with as-received and patched bars and different loading conditions.
��� �������������������������������������
• For most beams, average black bar potentials in the inner zone (closer to wet zone and to stirrup)
were more negative (typically in the -400 mV SCE region) than those at the outer regions (farther
away from wet zone), which were typically in the -100 mV SCE range, as seen in Figure 2.22.
• Average black bar potentials at the inner zone in uncracked unloaded beams were in the very low
negative range (close to zero or positive) when monitoring of the black bars began at about
1.3 years of exposure. Subsequently, corrosion potentials tended to gradually decline and
approached the highly negative values of the stirrups (Figure 2.23).
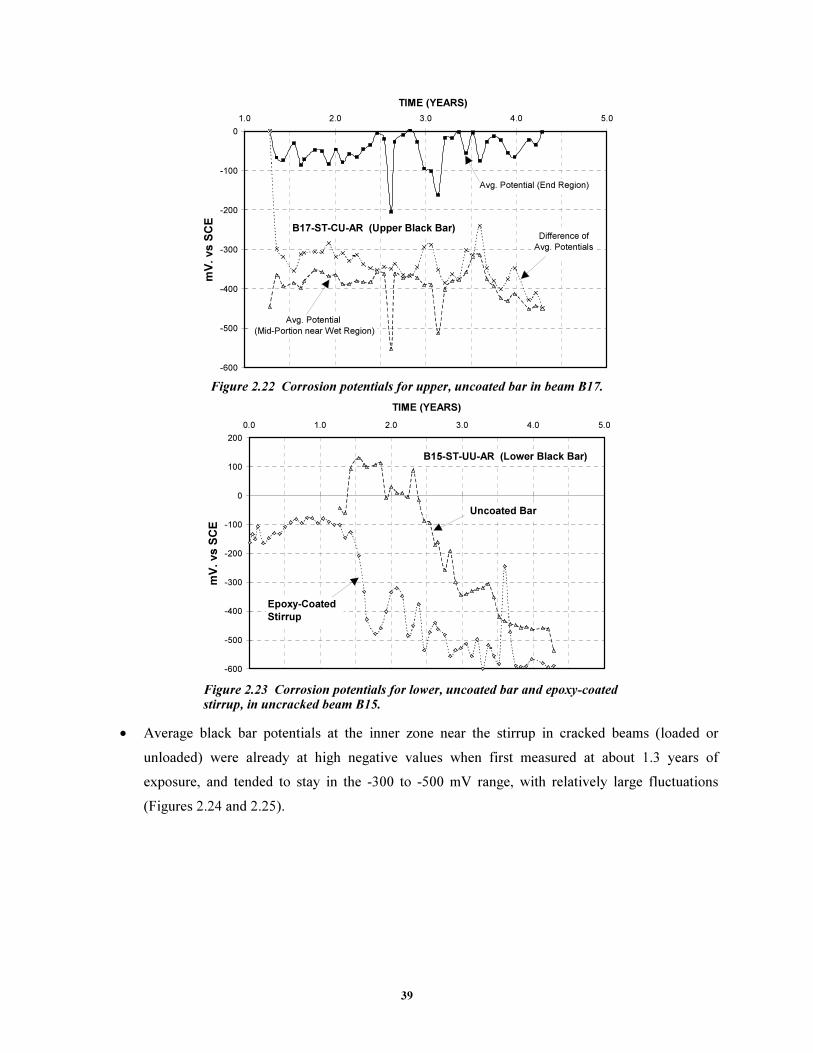
39
-600
-500
-400
-300
-200
-100
0
1.0 2.0 3.0 4.0 5.0
TIME (YEARS)
mV
. v
s S
CE
B17-ST-CU-AR (Upper Black Bar)
Avg. Potential
(Mid-Portion near Wet Region)
Avg. Potential (End Region)
Difference of
Avg. Potentials
Figure 2.22 Corrosion potentials for upper, uncoated bar in beam B17.
-600
-500
-400
-300
-200
-100
0
100
200
0.0 1.0 2.0 3.0 4.0 5.0
TIME (YEARS)
mV
. vs S
CE
B15-ST-UU-AR (Lower Black Bar)
Uncoated Bar
Epoxy-Coated
Stirrup
Figure 2.23 Corrosion potentials for lower, uncoated bar and epoxy-coated stirrup, in uncracked beam B15.
• Average black bar potentials at the inner zone near the stirrup in cracked beams (loaded or
unloaded) were already at high negative values when first measured at about 1.3 years of
exposure, and tended to stay in the -300 to -500 mV range, with relatively large fluctuations
(Figures 2.24 and 2.25).
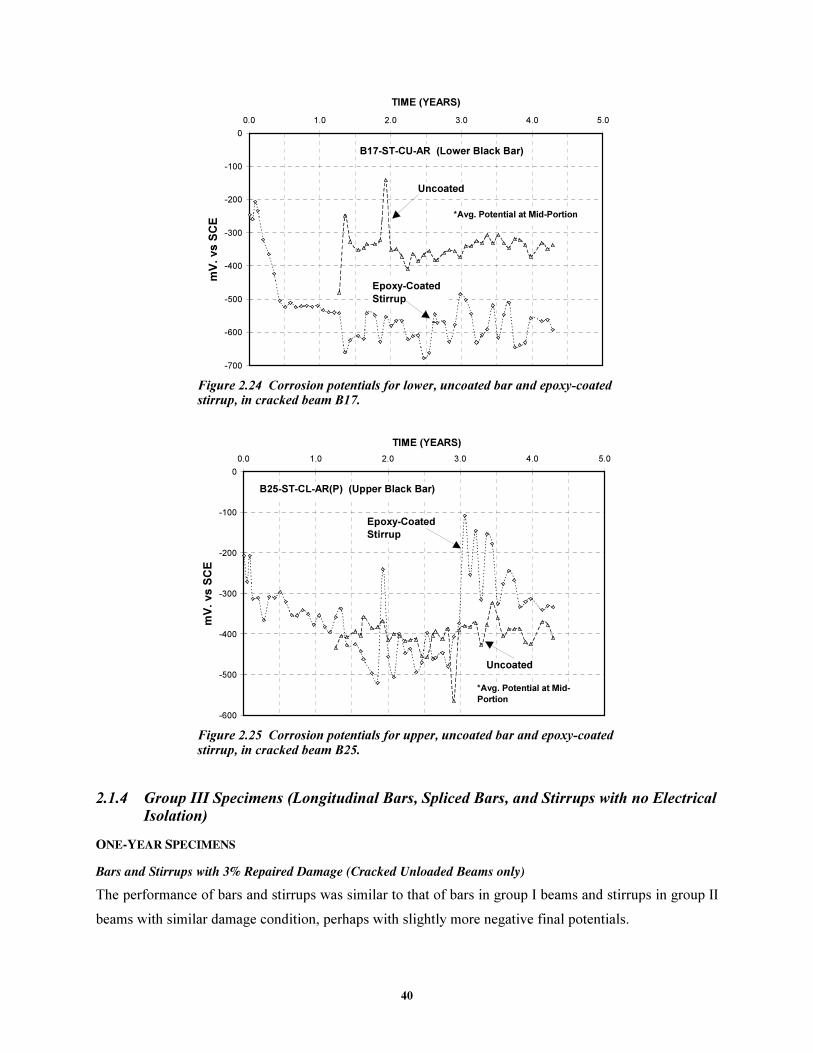
40
-700
-600
-500
-400
-300
-200
-100
0
0.0 1.0 2.0 3.0 4.0 5.0
TIME (YEARS)
mV
. vs S
CE
B17-ST-CU-AR (Lower Black Bar)
Uncoated
Epoxy-Coated
Stirrup
*Avg. Potential at Mid-Portion
Figure 2.24 Corrosion potentials for lower, uncoated bar and epoxy-coated stirrup, in cracked beam B17.
-600
-500
-400
-300
-200
-100
0
0.0 1.0 2.0 3.0 4.0 5.0
TIME (YEARS)
mV
. v
s S
CE
B25-ST-CL-AR(P) (Upper Black Bar)
Uncoated
Epoxy-Coated
Stirrup
*Avg. Potential at Mid-
Portion
Figure 2.25 Corrosion potentials for upper, uncoated bar and epoxy-coated stirrup, in cracked beam B25.
2.1.4 Group III Specimens (Longitudinal Bars, Spliced Bars, and Stirrups with no Electrical Isolation)
�����������������
���������������� ��������������������������������������������������
The performance of bars and stirrups was similar to that of bars in group I beams and stirrups in group II
beams with similar damage condition, perhaps with slightly more negative final potentials.

41
����������������������������� ��������������������
The change of potential with time for the bars with and end in the wet zone (shorter of the spliced bars)
was characterized by an early drop, followed by large fluctuation, and then stability. In contrast, the
change of potential with time for the bars with an end outside the wet zone (longer of the spliced bars)
was characterized by a delayed drop, followed by slight fluctuation, and then stability.
�����������������
������ ����
• There was no difference in behavior in longitudinal bar readings for beams with stirrups
electrically isolated or without isolation (Figure 2.26).
-1200
-1000
-800
-600
-400
-200
0
0 1 2 3 4 5
Years of Exposure
mV
. v
s S
CE
* Lower Bar
Non-Isolated from Stirrup
Isolated from
Stirrup
Longitudinal* Epoxy-Coated Bars
Damaged (Patched) Condition
Avg Potentials in wet region
Figure 2.26 Corrosion potentials for lower, coated bars, with and without electrical isolation from stirrup.
• Continuous coated bars exhibited behavior similar to that of spliced-coated bars
(Figure 2.27).
• In a spliced lower bar (beam B34), corrosion potentials of the longer bar stayed less negative than
did those of the short bar for about one year. Thereafter, the potential sharply dropped to the same
level as that of the shorter bar which remained highly negative throughout exposure. See
Figure 2.28.

42
-900
-800
-700
-600
-500
-400
-300
-200
-100
0
0 1 2 3 4 5
Years of Exposure
mV
. vs S
CE
Continous Bar (Cracked, Unloaded)
Spliced Bar (Cracked, Unloaded) **
Spliced Bar (Cracked, Loaded) **
Longitudinal* Epoxy-Coated Bars
Damaged (Patched) Condition
* Lower Bar
** Short Bar
Figure 2.27 Comparison of potentials of continuous and spliced coated bars.
-900
-800
-700
-600
-500
-400
-300
-200
-100
0
0 1 2 3 4 5
Years of Exposure
mV
. v
s S
CE
Spliced Epoxy-Coated Bars
Damaged (Patched) Condition
Avg Potentials in Wet Region
B34-SP-CL-D(P) (Lower Bar)
Short Bar
Long Bar
Figure 2.28 Comparison of potentials of long and short coated splice bars.
����������
• Except in beam B30, average black bar potentials in the inner zone (closer to wet zone) were
more negative (typically in the -500 mV SCE region) than those at the outer regions (farther away
from wet zone), which were typically in the -100 mV to -300 mV SCE range.
• After experiencing a rather gradual decline of corrosion potentials from 1 to 4.3 years of
exposure, average black bar potentials in the inner regions (in the -500 mV SCE range) were only
slightly less negative than average coated bar potentials in the wet zone (about
-600 mV SCE).
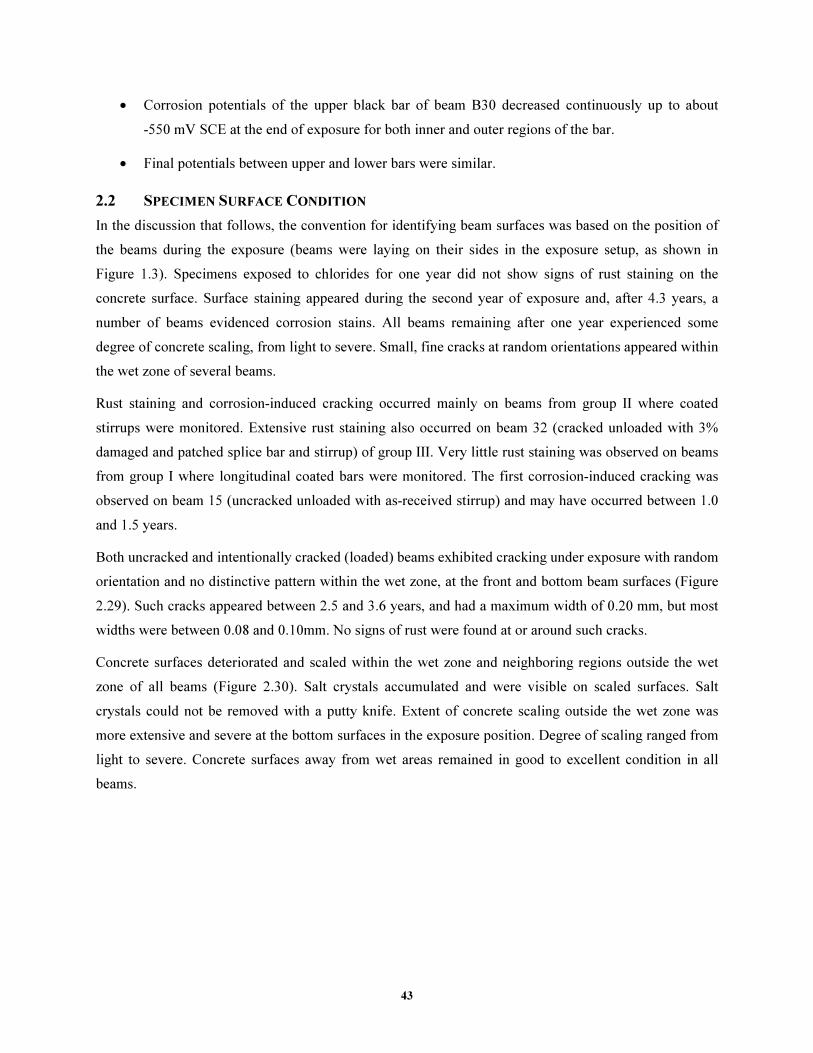
43
• Corrosion potentials of the upper black bar of beam B30 decreased continuously up to about
-550 mV SCE at the end of exposure for both inner and outer regions of the bar.
• Final potentials between upper and lower bars were similar.
2.2 SPECIMEN SURFACE CONDITION
In the discussion that follows, the convention for identifying beam surfaces was based on the position of
the beams during the exposure (beams were laying on their sides in the exposure setup, as shown in
Figure 1.3). Specimens exposed to chlorides for one year did not show signs of rust staining on the
concrete surface. Surface staining appeared during the second year of exposure and, after 4.3 years, a
number of beams evidenced corrosion stains. All beams remaining after one year experienced some
degree of concrete scaling, from light to severe. Small, fine cracks at random orientations appeared within
the wet zone of several beams.
Rust staining and corrosion-induced cracking occurred mainly on beams from group II where coated
stirrups were monitored. Extensive rust staining also occurred on beam 32 (cracked unloaded with 3%
damaged and patched splice bar and stirrup) of group III. Very little rust staining was observed on beams
from group I where longitudinal coated bars were monitored. The first corrosion-induced cracking was
observed on beam 15 (uncracked unloaded with as-received stirrup) and may have occurred between 1.0
and 1.5 years.
Both uncracked and intentionally cracked (loaded) beams exhibited cracking under exposure with random
orientation and no distinctive pattern within the wet zone, at the front and bottom beam surfaces (Figure
2.29). Such cracks appeared between 2.5 and 3.6 years, and had a maximum width of 0.20 mm, but most
widths were between 0.08 and 0.10mm. No signs of rust were found at or around such cracks.
Concrete surfaces deteriorated and scaled within the wet zone and neighboring regions outside the wet
zone of all beams (Figure 2.30). Salt crystals accumulated and were visible on scaled surfaces. Salt
crystals could not be removed with a putty knife. Extent of concrete scaling outside the wet zone was
more extensive and severe at the bottom surfaces in the exposure position. Degree of scaling ranged from
light to severe. Concrete surfaces away from wet areas remained in good to excellent condition in all
beams.

44
Figure 2.29 Surface cracking on previously uncracked beam B15 (front and bottom surfaces as in exposure).
Figure 2.30 Concrete scaling and deterioration outside wetted region (front surface as in exposure).
Corrosion staining and cracking due to corrosion is described briefly in the following sections.
2.2.1 Group I Specimens
Beam No.1 (Uncracked unloaded with as-received bar)
A series of fine cracks at random orientations was detected at the front and bottom beam surfaces within
the wet zone at about 2.8 years of exposure.
A crack perpendicular to the beam axis was first observed at the bottom surface of the beam at about
1.8 years. The crack extended across the face of the beam at midspan section, as shown in Figure 2.31.
The crack width was between 0.10 and 0.15mm. The crack length increased on the front beam surface at
FRONT
BOTTOM

45
about 2.4 years. No evidence of rust was found around the crack. The crack was characteristic of a
flexural crack but the beam was intended to be uncracked and no permanent load was applied. It may be
that during handling, a load was accidentally applied.
Figure 2.31 Cracking on initially uncracked, unloaded beam B1 (front and bottom surfaces as in exposure).
Beam No. 8 (Uncracked unloaded with 3% damaged bar)
A few small brown stains were first observed at about 1.9 years of exposure on the top surface of the
beam within the wet zone.
A series of short cracks developed on the bottom surface within the wet zone (Figure 2.32). Such cracks
were detected at about 3.6 years of exposure and their orientation was parallel to the longitudinal beam
axis. The cracks were narrow (0.10 to 0.15mm wide).
Figure 2.32 Cracking on non-precracked beam B8.
FRONT
BOTTOM

46
Beam No. 12 (Cracked loaded with 3% damaged bar)
A spot with rust deposits formed on the front surface just outside the wet zone, close to the location of the
lower coated bar (Figure 2.33). The rust spot was first observed at about 2.4 years of exposure. The rust
spot grew from about 12mm2 up to 50mm2 at the end of 4.3 years. A small reddish-brown spot close to the
upper black bar was observed at midspan on the top surface at about 2.4 years. The spot gradually faded
and was not visible at the end of exposure.
Figure 2.33 Rust spot just outside wetted region on beam B12.
2.2.2 Group II Specimens
Beam No. 15 (Uncracked, unloaded beam, stirrup with as-received coating)
An apparent corrosion-induced crack was detected on the top surface of the beam, within the wet zone, to
the left of midspan (Figure 2.34). The crack was detected at 1.5 years of exposure and ran parallel to the
beam longitudinal axis and close (2cm) to the beam edge. The crack had a width of 0.15mm. Brownish
staining was observed around the crack. At 1.9 years, a build-up of rust was observed along the crack. A
crack perpendicular to the first one extended towards and around the edge of the beam (crack width was
0.15mm). At 2.1 years, additional rust was evident and the initial crack widened to 0.4mm. At 2.2 years,
the crack extended and rust staining increased. More rust products and staining accumulated on the top
surface after 2.5 years (Figure 2.34). Overall, the size of the rust spot increased from about 7cm2 at
1.5 years to 11cm2 at 2.8 years. Rust staining around cracking on the top surface stabilized at the end of
3 years and was less prominent at the end of 4.3 years.
A series of long and short cracks (0.1mm or less in width) with random orientation was detected on the
front surface within the wet zone after 2.8 years of exposure (Figure 2.35). Thereafter, additional short

47
and long cracks with random orientation formed at the front and bottom surfaces, inside the wet zone.
Crack widths ranged from 0.08 to 0.20mm.
A rust spot formed at the front surface, within the wet zone, close to the top surface and the left boundary
of the wet zone, after about 2.2 years of exposure. The size of rust spot was about 28mm2. However, the
rust spot started to fade away at about 2.7 years. Another dark-brown spot formed after 2.4 years on the
front surface, within the wet zone, close to the lower bar location, adjacent to right boundary of wet zone.
The spot started to fade at 2.8 years of exposure.
(a) Aspect after 2.8 years
(b) Close up. Aspect after 4.3 years
Figure 2.34 Crack with rust exudation on top surface of beam B15.

48
Figure 2.35 Random cracking on front surface of beam B15.
Beam No. 22 (Uncracked, unloaded beam, stirrup with as-received, patched coating)
After 2.7 years of exposure, a crack developed on the front surface, inside the wet zone, extending from
top to bottom, perpendicular to the beam axis and adjacent to the left boundary (Figure 2.36). Maximum
crack width measured was 0.15mm. The crack continued to grow and an extension on the front surface
was observed at 3.6 years. The crack extended from the vertical crack further into the wet zone, parallel to
the beam axis at the mid-height of the front surface. Additional crack extensions were observed.
Maximum crack widths were 0.10mm.
Figure 2.36 Random cracking on non-precracked beam B22.

49
Beam No. 17 (Cracked, unloaded beam, stirrup with as-received coating)
At 1.8 years, a rust spot of approximately circular shape formed on the top surface of the beam, outside
the wet zone, located exactly at the end of the flexural crack induced by the stirrup at midspan and close
to the upper black bar location (Figure 2.37). After that, the size of the rust stain gradually increased with
time. When first detected, the rust stain measured 1.44cm2 at 1.8 years and enlarged to 22.5cm2 after
2.8 years. After 2.8 years until the end of exposure at 4.3 years, the rust spot did not significantly increase
in size.
A small dark-brown spot was observed on the top surface, outside the wet zone (just to the left of wet
zone, near the front surface), at about 2.7 years of exposure. Another small dark stain was detected on the
bottom surface, outside the wet zone (8.5cm to the left of midspan), at about 2.2 years.
Figure 2.37 Rust spot on top surface of beam B17 at black bar location at midspan.
Beam No. 23 (Cracked, unloaded beam, stirrup with as-received, patched coating)
A medium size rust spot and staining formed at the bottom surface, outside the wet zone, at the end of the
flexural crack induced by the stirrup. The spot was first seen at about 1.8 years of exposure and measured
0.5cm2. It gradually increased to 4cm2 at the end of 3.6 years, with no significant increases thereafter.
Beam No. 27 (Cracked, unloaded beam, stirrup with 3% damage to coating and patched)
A rust spot of circular shape formed on the bottom surface of the beam, outside the wet zone, at the end of
the flexural crack induced by the stirrup, close to the black bar location (Figure 2.38). The rust stain was
first spotted at about 1.8 years of exposure and measured 7cm2. Its size gradually increased with time up
to 2.4cm2 at 2.5 years, with no significant increases in size thereafter.
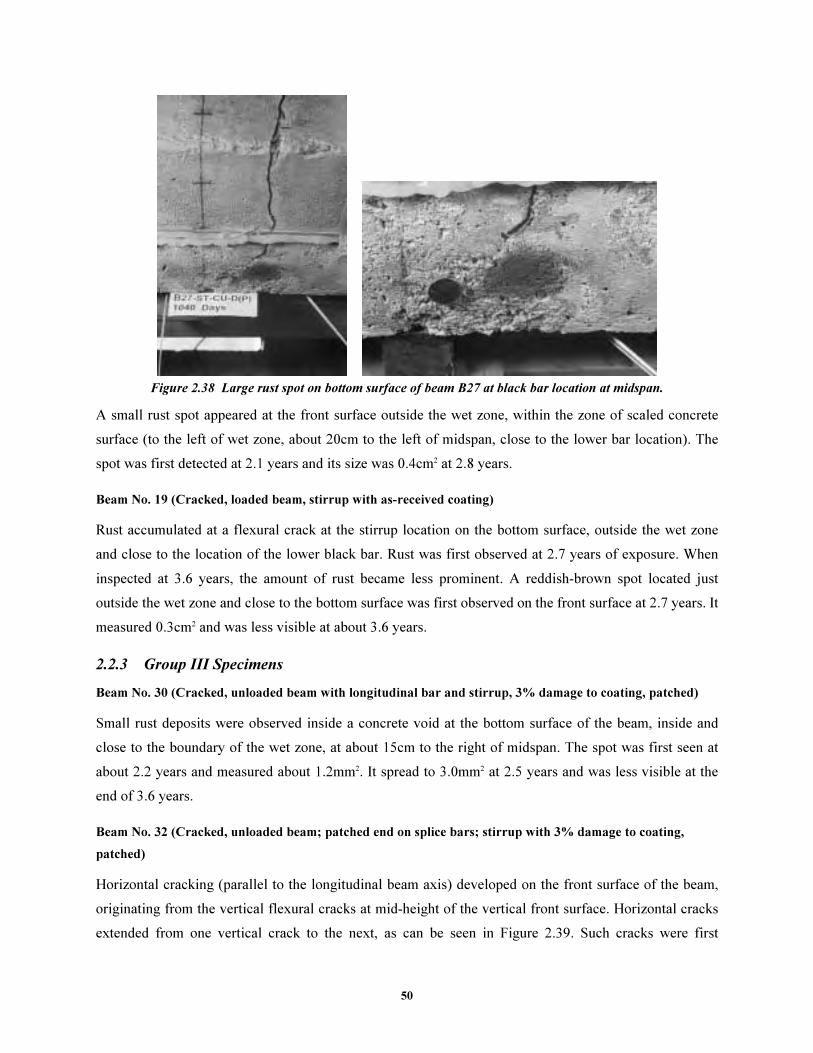
50
Figure 2.38 Large rust spot on bottom surface of beam B27 at black bar location at midspan.
A small rust spot appeared at the front surface outside the wet zone, within the zone of scaled concrete
surface (to the left of wet zone, about 20cm to the left of midspan, close to the lower bar location). The
spot was first detected at 2.1 years and its size was 0.4cm2 at 2.8 years.
Beam No. 19 (Cracked, loaded beam, stirrup with as-received coating)
Rust accumulated at a flexural crack at the stirrup location on the bottom surface, outside the wet zone
and close to the location of the lower black bar. Rust was first observed at 2.7 years of exposure. When
inspected at 3.6 years, the amount of rust became less prominent. A reddish-brown spot located just
outside the wet zone and close to the bottom surface was first observed on the front surface at 2.7 years. It
measured 0.3cm2 and was less visible at about 3.6 years.
2.2.3 Group III Specimens
Beam No. 30 (Cracked, unloaded beam with longitudinal bar and stirrup, 3% damage to coating, patched)
Small rust deposits were observed inside a concrete void at the bottom surface of the beam, inside and
close to the boundary of the wet zone, at about 15cm to the right of midspan. The spot was first seen at
about 2.2 years and measured about 1.2mm2. It spread to 3.0mm2 at 2.5 years and was less visible at the
end of 3.6 years.
Beam No. 32 (Cracked, unloaded beam; patched end on splice bars; stirrup with 3% damage to coating,
patched)
Horizontal cracking (parallel to the longitudinal beam axis) developed on the front surface of the beam,
originating from the vertical flexural cracks at mid-height of the vertical front surface. Horizontal cracks
extended from one vertical crack to the next, as can be seen in Figure 2.39. Such cracks were first
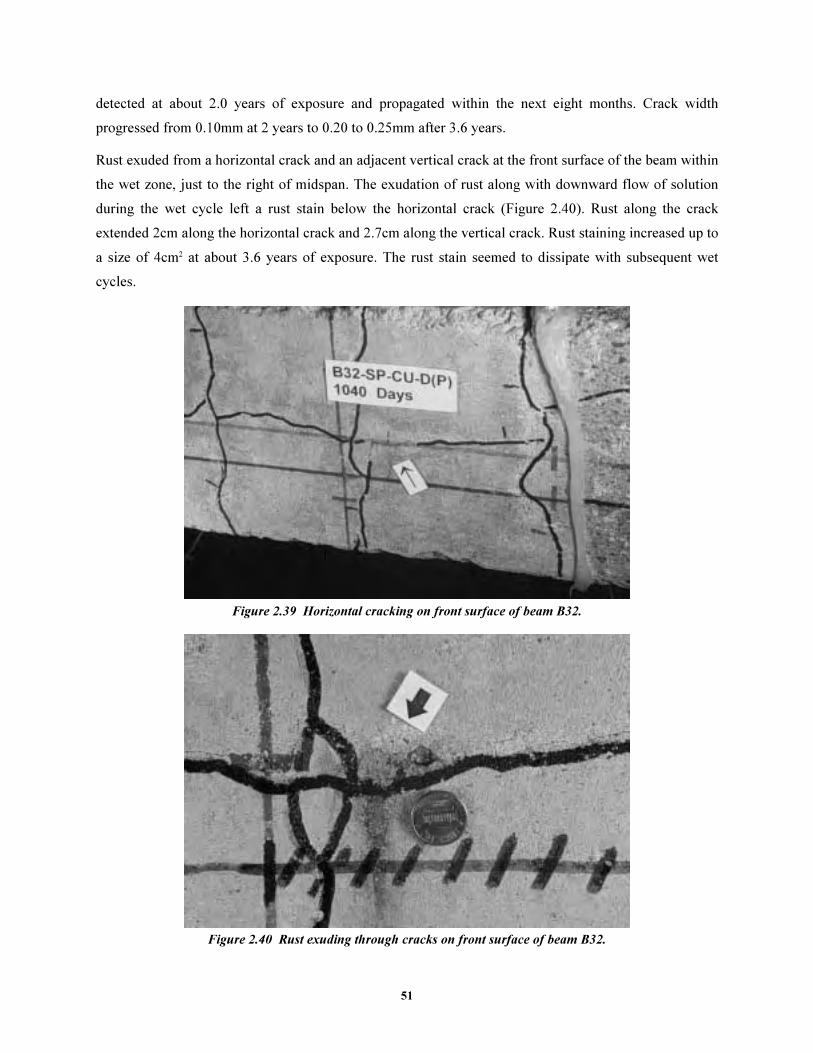
51
detected at about 2.0 years of exposure and propagated within the next eight months. Crack width
progressed from 0.10mm at 2 years to 0.20 to 0.25mm after 3.6 years.
Rust exuded from a horizontal crack and an adjacent vertical crack at the front surface of the beam within
the wet zone, just to the right of midspan. The exudation of rust along with downward flow of solution
during the wet cycle left a rust stain below the horizontal crack (Figure 2.40). Rust along the crack
extended 2cm along the horizontal crack and 2.7cm along the vertical crack. Rust staining increased up to
a size of 4cm2 at about 3.6 years of exposure. The rust stain seemed to dissipate with subsequent wet
cycles.
Figure 2.39 Horizontal cracking on front surface of beam B32.
Figure 2.40 Rust exuding through cracks on front surface of beam B32.

52
Beam No. 34 (Cracked loaded beam; patched end on splice bars; stirrup with 3% damage to coating, patched)
Rust accumulated inside a flexural crack at the bottom surface of the beam, inside the wet zone, just to the
right of midspan section. The rust was observed at about 2.2 years and extended 2cm along the crack and
to the boundary of the wet zone.
In summary, 2 out of 7 beams of group I experienced minor rust stains only. Four out of 7 group II beams
exhibited major rust staining. One of three beams in group III experienced major rust staining, and all
beams in group III exhibited staining. Considering all beams, 11 out of 17 experienced rust staining.
These numbers correspond to the remaining duplicates subjected to 4.3 years of exposure.
2.3 CRACK WIDTHS
2.3.1 General
Widths of flexural cracks were measured periodically to monitor any changes produced by corrosion,
concrete deterioration, and cyclic loading. An example of crack mapping is shown in Figure 2.41 for one
of the beams removed for forensic examination after about 400 days of exposure. Average crack width
measurements for selected cracks identified on the map are listed in Table 2.8. Beams were initially
loaded to produce a maximum crack width of 0.33mm (0.013in.). The magnitude of the cyclic loading
was adjusted during the exposure to maintain the maximum crack width. In several cases, maximum
crack width was in excess of 0.33mm even with a very small cyclic load after several years of exposure.
0
Salt Accumulation
on Surface
Plan
Side View
0.30.60.91.2 0.3 0.6 0.9 1.2
1 2 3 4
Figure 2.41 Surface condition of beam B29 (Group III) after one year of exposure showing monitored cracks.
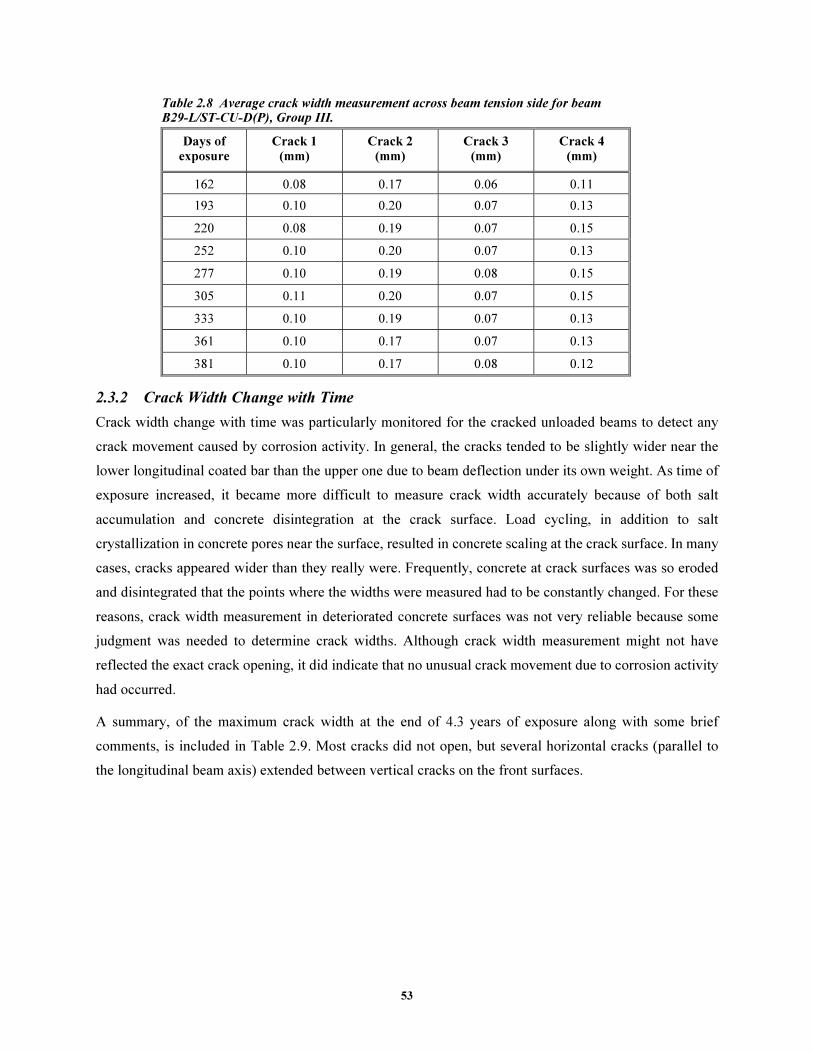
53
Table 2.8 Average crack width measurement across beam tension side for beam B29-L/ST-CU-D(P), Group III.
Days of exposure
Crack 1 (mm)
Crack 2 (mm)
Crack 3 (mm)
Crack 4 (mm)
162 0.08 0.17 0.06 0.11
193 0.10 0.20 0.07 0.13
220 0.08 0.19 0.07 0.15
252 0.10 0.20 0.07 0.13
277 0.10 0.19 0.08 0.15
305 0.11 0.20 0.07 0.15
333 0.10 0.19 0.07 0.13
361 0.10 0.17 0.07 0.13
381 0.10 0.17 0.08 0.12
2.3.2 Crack Width Change with Time
Crack width change with time was particularly monitored for the cracked unloaded beams to detect any
crack movement caused by corrosion activity. In general, the cracks tended to be slightly wider near the
lower longitudinal coated bar than the upper one due to beam deflection under its own weight. As time of
exposure increased, it became more difficult to measure crack width accurately because of both salt
accumulation and concrete disintegration at the crack surface. Load cycling, in addition to salt
crystallization in concrete pores near the surface, resulted in concrete scaling at the crack surface. In many
cases, cracks appeared wider than they really were. Frequently, concrete at crack surfaces was so eroded
and disintegrated that the points where the widths were measured had to be constantly changed. For these
reasons, crack width measurement in deteriorated concrete surfaces was not very reliable because some
judgment was needed to determine crack widths. Although crack width measurement might not have
reflected the exact crack opening, it did indicate that no unusual crack movement due to corrosion activity
had occurred.
A summary, of the maximum crack width at the end of 4.3 years of exposure along with some brief
comments, is included in Table 2.9. Most cracks did not open, but several horizontal cracks (parallel to
the longitudinal beam axis) extended between vertical cracks on the front surfaces.
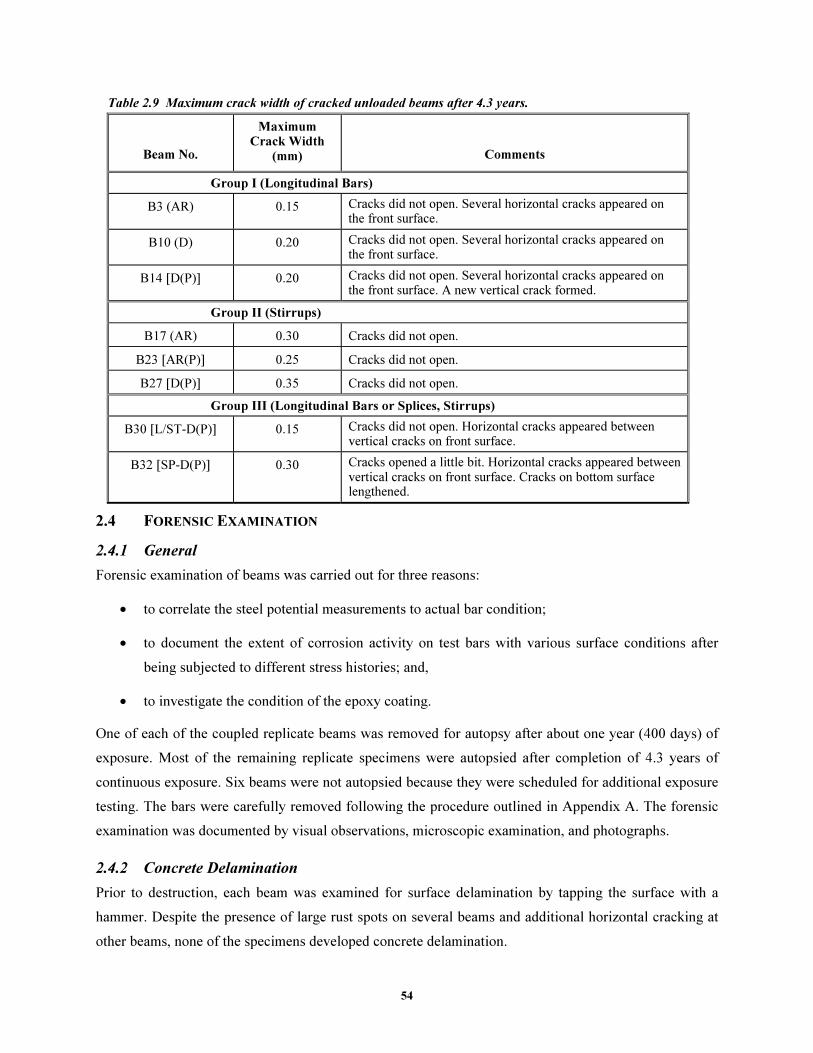
54
Table 2.9 Maximum crack width of cracked unloaded beams after 4.3 years.
Beam No.
Maximum Crack Width
(mm) Comments
Group I (Longitudinal Bars)
B3 (AR) 0.15 Cracks did not open. Several horizontal cracks appeared on the front surface.
B10 (D) 0.20 Cracks did not open. Several horizontal cracks appeared on the front surface.
B14 [D(P)] 0.20 Cracks did not open. Several horizontal cracks appeared on the front surface. A new vertical crack formed.
Group II (Stirrups)
B17 (AR) 0.30 Cracks did not open.
B23 [AR(P)] 0.25 Cracks did not open.
B27 [D(P)] 0.35 Cracks did not open.
Group III (Longitudinal Bars or Splices, Stirrups)
B30 [L/ST-D(P)] 0.15 Cracks did not open. Horizontal cracks appeared between vertical cracks on front surface.
B32 [SP-D(P)] 0.30 Cracks opened a little bit. Horizontal cracks appeared between vertical cracks on front surface. Cracks on bottom surface lengthened.
2.4 FORENSIC EXAMINATION
2.4.1 General
Forensic examination of beams was carried out for three reasons:
• to correlate the steel potential measurements to actual bar condition;
• to document the extent of corrosion activity on test bars with various surface conditions after
being subjected to different stress histories; and,
• to investigate the condition of the epoxy coating.
One of each of the coupled replicate beams was removed for autopsy after about one year (400 days) of
exposure. Most of the remaining replicate specimens were autopsied after completion of 4.3 years of
continuous exposure. Six beams were not autopsied because they were scheduled for additional exposure
testing. The bars were carefully removed following the procedure outlined in Appendix A. The forensic
examination was documented by visual observations, microscopic examination, and photographs.
2.4.2 Concrete Delamination
Prior to destruction, each beam was examined for surface delamination by tapping the surface with a
hammer. Despite the presence of large rust spots on several beams and additional horizontal cracking at
other beams, none of the specimens developed concrete delamination.

55
2.4.3 Chloride Content at Steel Level
The chloride content per unit weight of concrete was measured at different depths. Concrete powder
samples were obtained by drilling at several selected points along the beam surface after testing. The
concrete surfaces at the drilled locations were either cracked or uncracked to determine the relative
amounts of chlorides in each case. The measured acid-soluble chloride concentrations are tabulated in
Appendix A.
�����������������
Chloride contents at different depths are shown in Figures 2.42 and 2.43. These chloride contents were
determined at crack locations in the exposure area and are plotted as a function of crack width and loading
condition. The average chloride contents near the upper longitudinal bar or stirrup bend for the cases of
cracked unloaded and cracked loaded beams were 12.00 kg/m3 (20.2 lb./yd3) and 15.3 kg/m3 (25.7
lb./yd3), respectively. The respective values for the lower longitudinal bar or stirrup bend were 11.0 kg/m3
(18.5 lb./yd3) and 14.0 kg/m3 (23.5 lb./yd3).
Chloride contents determined at uncracked surfaces in the exposure area did not correlate with the loading
condition. The average chloride contents near the upper and lower longitudinal bar or stirrup bend were
5.2 kg/m3 (8.7 lb./yd3) and 5.9 kg/m3 (9.9 lb./yd3), respectively. At other locations (cracked or uncracked),
within approximately 0.3 m (12in.) outside the exposure area, chloride contents at the upper and lower
steel were 2.0 and 3.9 kg/m3 (8.7 lb./yd3), respectively. No chlorides were detected at locations more than
0.3 m (12in.) from the exposure area.
Figure 2.42 Chloride concentration at crack locations near beam upper bars after one year.

56
Figure 2.43 Chloride concentration at crack locations near beam lower bars after one year.
�����������������
Table 2.10 contains chloride contents by percent of concrete weight at several beam locations and depths
from the top surface (corresponding to upper and lower bar locations). As expected, chloride
concentration was greater at the wet zone and dissipated as the distance from the wet zone increased.
However, chloride concentration was similar or slightly greater at the dry zone of the beam next to the
wet zone (compression side of the beam at midspan portion) than at the wet zone. Chlorides effectively
penetrated the concrete through a relatively large portion of the beam beyond the wet zone. Generally,
chloride contents were low in regions farther than 60cm (24 in) from the midspan section.
This finding was important because it indicated the presence of a high chloride content at the location of
uncoated bars. The use of black bars in the compression zone was based on the premise that the bars
would be outside the wet regions of the beams. However, after 4.3 years of exposure, chlorides penetrated
and diffused through the concrete to the black bars. Uncoated bars subjected to high chloride contents are
vulnerable to corrosion. The autopsies showed that uncoated bars underwent severe and extensive
corrosion.
Table 2.11 shows that average chloride contents were higher after 4.3 years than after one year of
exposure. As with specimens examined at the end of one year, chloride contents tended to be higher at
crack locations. However, as can be seen in Table 2.11, the difference in chloride concentrations between
crack and non-crack locations within the wet zone decreased after 4.3 years, especially in groups I and II.
Clearly, chloride diffused and penetrated within the concrete so extensively that chloride distribution was
more uniform after more than four years of exposure.
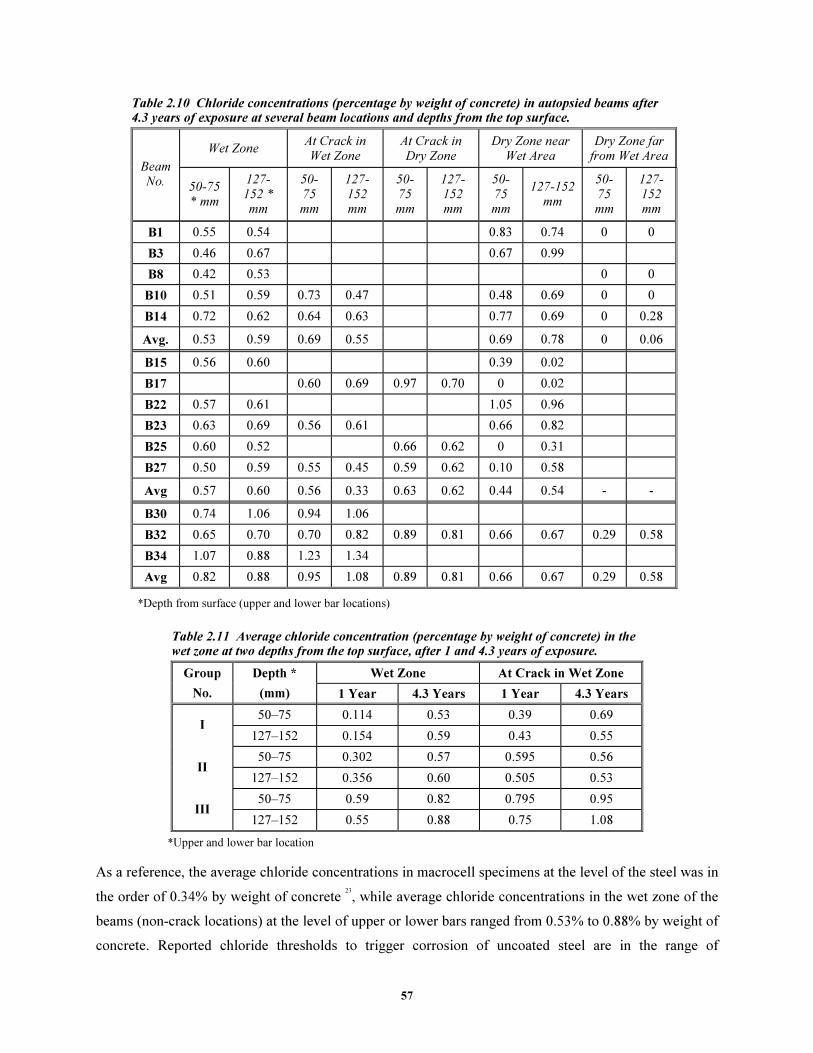
57
Table 2.10 Chloride concentrations (percentage by weight of concrete) in autopsied beams after 4.3 years of exposure at several beam locations and depths from the top surface.
Wet Zone At Crack in Wet Zone
At Crack in Dry Zone
Dry Zone near Wet Area
Dry Zone far from Wet Area
Beam No. 50-75
* mm
127-152 * mm
50-75 mm
127-152 mm
50-75 mm
127-152 mm
50-75 mm
127-152 mm
50-75 mm
127-152 mm
B1 0.55 0.54 0.83 0.74 0 0
B3 0.46 0.67 0.67 0.99
B8 0.42 0.53 0 0
B10 0.51 0.59 0.73 0.47 0.48 0.69 0 0
B14 0.72 0.62 0.64 0.63 0.77 0.69 0 0.28
Avg. 0.53 0.59 0.69 0.55 0.69 0.78 0 0.06
B15 0.56 0.60 0.39 0.02
B17 0.60 0.69 0.97 0.70 0 0.02
B22 0.57 0.61 1.05 0.96
B23 0.63 0.69 0.56 0.61 0.66 0.82
B25 0.60 0.52 0.66 0.62 0 0.31
B27 0.50 0.59 0.55 0.45 0.59 0.62 0.10 0.58
Avg 0.57 0.60 0.56 0.33 0.63 0.62 0.44 0.54 - -
B30 0.74 1.06 0.94 1.06
B32 0.65 0.70 0.70 0.82 0.89 0.81 0.66 0.67 0.29 0.58
B34 1.07 0.88 1.23 1.34
Avg 0.82 0.88 0.95 1.08 0.89 0.81 0.66 0.67 0.29 0.58
*Depth from surface (upper and lower bar locations)
Table 2.11 Average chloride concentration (percentage by weight of concrete) in the wet zone at two depths from the top surface, after 1 and 4.3 years of exposure.
Wet Zone At Crack in Wet Zone Group
No.
Depth *
(mm) 1 Year 4.3 Years 1 Year 4.3 Years
50–75 0.114 0.53 0.39 0.69 I
127–152 0.154 0.59 0.43 0.55
50–75 0.302 0.57 0.595 0.56 II
127–152 0.356 0.60 0.505 0.53
50–75 0.59 0.82 0.795 0.95 III
127–152 0.55 0.88 0.75 1.08
*Upper and lower bar location
As a reference, the average chloride concentrations in macrocell specimens at the level of the steel was in
the order of 0.34% by weight of concrete 23
, while average chloride concentrations in the wet zone of the
beams (non-crack locations) at the level of upper or lower bars ranged from 0.53% to 0.88% by weight of
concrete. Reported chloride thresholds to trigger corrosion of uncoated steel are in the range of
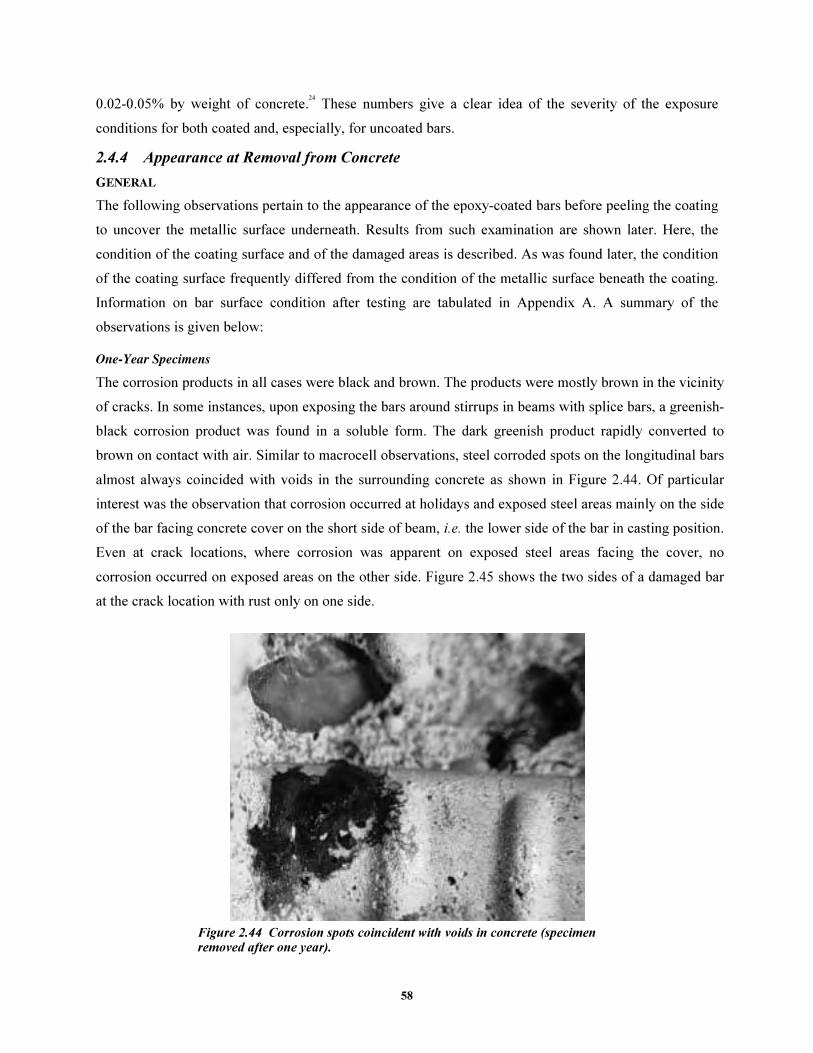
58
0.02-0.05% by weight of concrete.24
These numbers give a clear idea of the severity of the exposure
conditions for both coated and, especially, for uncoated bars.
2.4.4 Appearance at Removal from Concrete
�������
The following observations pertain to the appearance of the epoxy-coated bars before peeling the coating
to uncover the metallic surface underneath. Results from such examination are shown later. Here, the
condition of the coating surface and of the damaged areas is described. As was found later, the condition
of the coating surface frequently differed from the condition of the metallic surface beneath the coating.
Information on bar surface condition after testing are tabulated in Appendix A. A summary of the
observations is given below:
������������ ����
The corrosion products in all cases were black and brown. The products were mostly brown in the vicinity
of cracks. In some instances, upon exposing the bars around stirrups in beams with splice bars, a greenish-
black corrosion product was found in a soluble form. The dark greenish product rapidly converted to
brown on contact with air. Similar to macrocell observations, steel corroded spots on the longitudinal bars
almost always coincided with voids in the surrounding concrete as shown in Figure 2.44. Of particular
interest was the observation that corrosion occurred at holidays and exposed steel areas mainly on the side
of the bar facing concrete cover on the short side of beam, i.e. the lower side of the bar in casting position.
Even at crack locations, where corrosion was apparent on exposed steel areas facing the cover, no
corrosion occurred on exposed areas on the other side. Figure 2.45 shows the two sides of a damaged bar
at the crack location with rust only on one side.
Figure 2.44 Corrosion spots coincident with voids in concrete (specimen removed after one year).
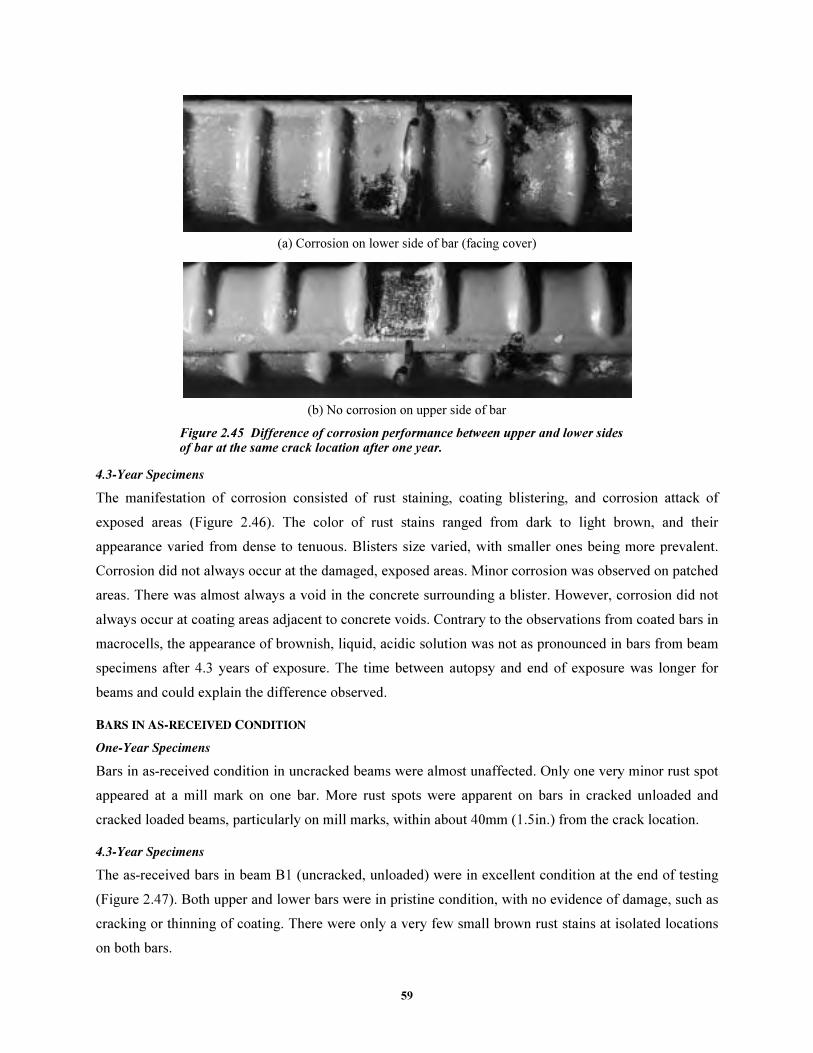
59
(a) Corrosion on lower side of bar (facing cover)
(b) No corrosion on upper side of bar
Figure 2.45 Difference of corrosion performance between upper and lower sides of bar at the same crack location after one year.
������������ ����
The manifestation of corrosion consisted of rust staining, coating blistering, and corrosion attack of
exposed areas (Figure 2.46). The color of rust stains ranged from dark to light brown, and their
appearance varied from dense to tenuous. Blisters size varied, with smaller ones being more prevalent.
Corrosion did not always occur at the damaged, exposed areas. Minor corrosion was observed on patched
areas. There was almost always a void in the concrete surrounding a blister. However, corrosion did not
always occur at coating areas adjacent to concrete voids. Contrary to the observations from coated bars in
macrocells, the appearance of brownish, liquid, acidic solution was not as pronounced in bars from beam
specimens after 4.3 years of exposure. The time between autopsy and end of exposure was longer for
beams and could explain the difference observed.
��������������� ���� ������
������������ ����
Bars in as-received condition in uncracked beams were almost unaffected. Only one very minor rust spot
appeared at a mill mark on one bar. More rust spots were apparent on bars in cracked unloaded and
cracked loaded beams, particularly on mill marks, within about 40mm (1.5in.) from the crack location.
������������ ����
The as-received bars in beam B1 (uncracked, unloaded) were in excellent condition at the end of testing
(Figure 2.47). Both upper and lower bars were in pristine condition, with no evidence of damage, such as
cracking or thinning of coating. There were only a very few small brown rust stains at isolated locations
on both bars.
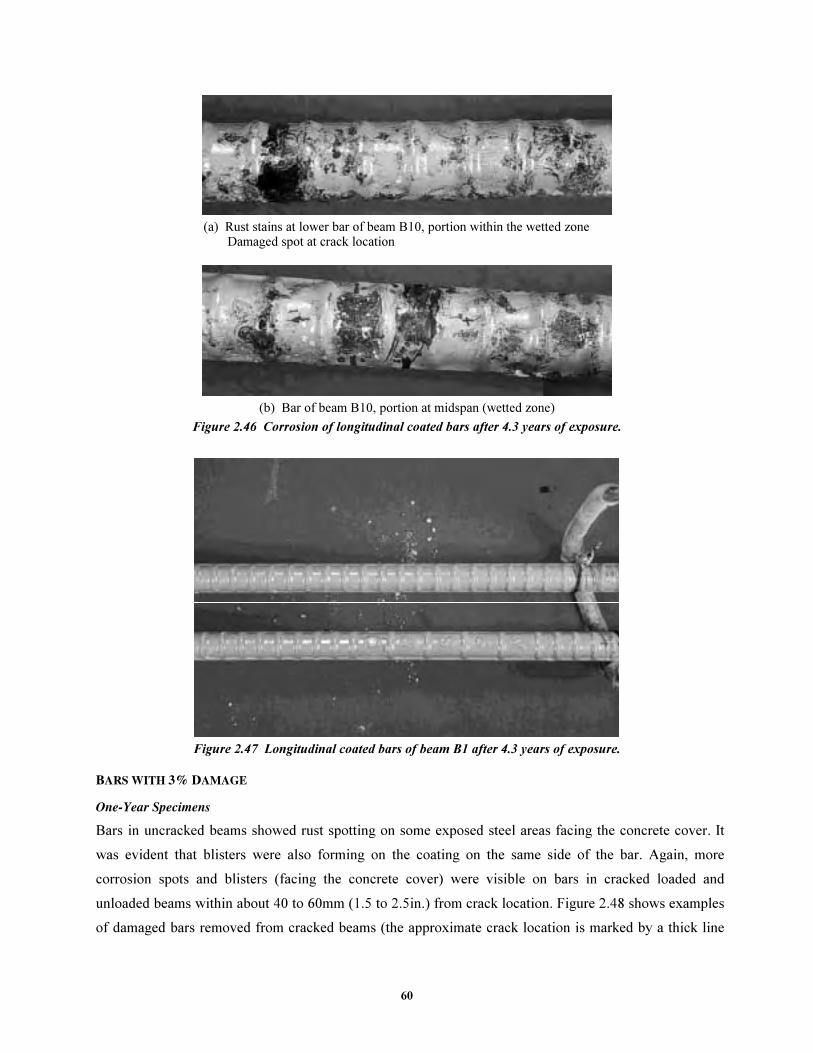
60
(a) Rust stains at lower bar of beam B10, portion within the wetted zone
Damaged spot at crack location
(b) Bar of beam B10, portion at midspan (wetted zone)
Figure 2.46 Corrosion of longitudinal coated bars after 4.3 years of exposure.
Figure 2.47 Longitudinal coated bars of beam B1 after 4.3 years of exposure.
��������� �������
������������ ����
Bars in uncracked beams showed rust spotting on some exposed steel areas facing the concrete cover. It
was evident that blisters were also forming on the coating on the same side of the bar. Again, more
corrosion spots and blisters (facing the concrete cover) were visible on bars in cracked loaded and
unloaded beams within about 40 to 60mm (1.5 to 2.5in.) from crack location. Figure 2.48 shows examples
of damaged bars removed from cracked beams (the approximate crack location is marked by a thick line

61
around the bar and an arrow in the figures). Bars with patched damage showed minor rust spotting on the
patched areas with evidence of coating cracking and blistering as shown in Figure 2.49.
Crack location
(a) Damaged upper bar from cracked unloaded beam B9
Crack location
(b) Damaged upper bar from cracked loaded beam B11
Crack location
(c) Damaged lower bar from cracked loaded beam B11
Figure 2.48 Corrosion on lower side of bars removed from beams after one year of exposure.
Crack location
Figure 2.49 Corrosion on lower side of patched bar removed after one year of exposure.

62
������������ ����
All bars with 3% damage underwent some degree of corrosion and rust staining on the coating surface,
regardless of loading condition and presence of cracks. Damaged areas had uniformly dark brown rust, in
some cases with buildup of rust products (Figure 2.50). No deep pits were noticed. Interestingly, not all
damaged areas corroded, and there were several exposed areas with a clean metallic surface, even in
proximity with cracks! (Figure 2.51). There was no specific pattern regarding location of corroded areas.
Frequently, concrete adjacent to uncorroded exposed sites had only a few small voids.
Figure 2.50 Build up of rust products at damaged spot on bar from beam B10 after 4.3 years.
(a) Outside the wet zone of beam B10, (b) Damaged spot located near stirrup and crack about 43cm to the left of midspan inside wetted region (Beam B10)
Figure 2.51 Uncorroded damaged areas near crack locations after 4.3 years.
Away from damaged, exposed areas, the epoxy-coating surface was stained in different ways. Typical
stains were light-brown, brownish, dark-brown, and black. Shape and size of stains ranged from a series
of very small stains grouped together to more isolated large stains (Figure 2.46). A series of small blisters

63
were usually observed at areas with more rust staining. Blister surfaces were typically dark or brown. At
some locations, a series of short, fine cracks formed on the coating. Overall, the epoxy surface condition
was relatively good considering the severity of the exposure for 4.3 years.
Bars with 3% patched damage (beam B14, cracked, unloaded) showed less extensive corrosion than bars
with unrepaired damage. Several patched areas showed brown rust staining, from tiny freckles to larger
stains. Several other patched spots had no rust spotting (Figure 2.52).
Figure 2.52 Aspect of uncorroded patched area on upper bar in beam B14, near crack location within the wetted zone after 4.3 years.
In general, lower bars tended to have more corrosion than upper bars. Corrosion spread more at the
bottom side (as in casting position) of the bars than on their topside.
�������������������� ���� ������
������������ ����
Stirrups in uncracked beams showed corrosion spots, blisters and coating cracking at the hook end closest
to the lower concrete surface. In addition to blistering, stirrups in beams with unopened cracks exhibited
corrosion spots at areas of contact with uncoated bars as shown in Figure 2.53. Similar but worse
corrosion appeared along the continuous ribs, hook end, and bends of stirrups in beams with opened
cracks as shown in Figure 2.54.
Stirrups with patched bends in uncracked beams were free of visible corrosion. Other patched stirrups in
cracked beams had a similar condition to that described above for stirrups without patching. Figure 2.55
shows corrosion spots on the inside surface of patched bends in contact with uncoated bars.
Figure 2.53 Corrosion at areas of contact between stirrup and uncoated bars at one year.

64
Figure 2.54 Corrosion on hook end of stirrup removed from cracked loaded beam after one year of exposure.
Figure 2.55 Corrosion at areas of contact between patched stirrup and uncoated bars at one year.
������������ ����
Rust staining was much more extensive on the side of the stirrup facing the concrete cover. The patch at
the hook ends was accidentally chipped off during autopsy; exposed areas at patched ends showed dark
rusting. Several dark lines, evidence of coating distress and incipient cracking, were visible at the most
corroded portions, especially alongside longitudinal ribs. Overall, few blisters developed.
The stirrup from an uncracked, unloaded beam (B15) underwent extensive staining on two legs and on
two bends. One leg was practically stain free. At the time of autopsy, there were four greenish or dark-
greenish rust spots on one leg; after one or two days, their appearance changed to reddish-brown or
orange-brown. The stirrup from a cracked, unloaded beam (B17) had rust staining that was denser on the
portion of the stirrup within the wetted zone (Figure 2.56).
On repaired stirrups, the patch at hook ends usually broke off during autopsy, but exposed areas were not
always corroded (Figure 2.57). More rust staining was observed on the outside than on the inside of the
stirrups. Few blisters developed on the coating surface. Lines of coating distress or incipient cracking
were observed at some of the more corroded portions.
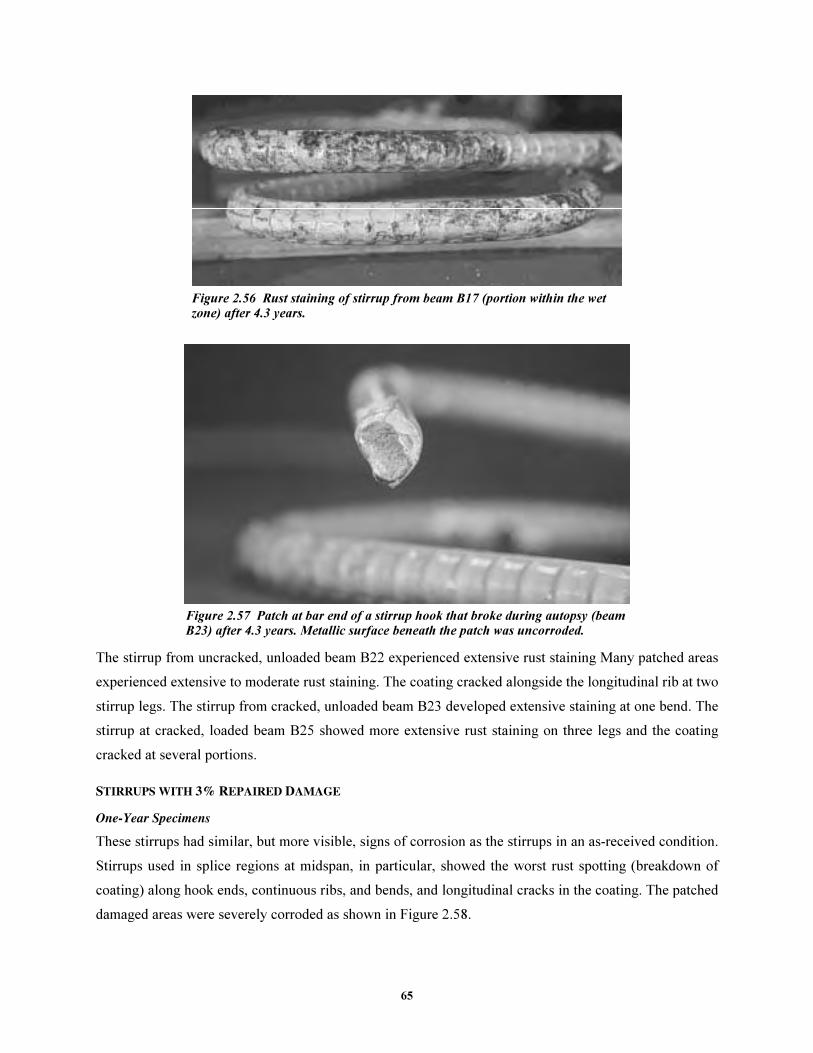
65
Figure 2.56 Rust staining of stirrup from beam B17 (portion within the wet zone) after 4.3 years.
Figure 2.57 Patch at bar end of a stirrup hook that broke during autopsy (beam B23) after 4.3 years. Metallic surface beneath the patch was uncorroded.
The stirrup from uncracked, unloaded beam B22 experienced extensive rust staining Many patched areas
experienced extensive to moderate rust staining. The coating cracked alongside the longitudinal rib at two
stirrup legs. The stirrup from cracked, unloaded beam B23 developed extensive staining at one bend. The
stirrup at cracked, loaded beam B25 showed more extensive rust staining on three legs and the coating
cracked at several portions.
�������������� �������� �������
������������ ����
These stirrups had similar, but more visible, signs of corrosion as the stirrups in an as-received condition.
Stirrups used in splice regions at midspan, in particular, showed the worst rust spotting (breakdown of
coating) along hook ends, continuous ribs, and bends, and longitudinal cracks in the coating. The patched
damaged areas were severely corroded as shown in Figure 2.58.

66
Figure 2.58 Corrosion on patched damaged areas of stirrup after one year of exposure.
������������ ����
Stirrups developed more extensive rust staining on the side of the stirrup facing the concrete cover.
Corrosion was not concentrated at patched areas with respect to other bar portions. Several blisters were
observed on coating surfaces. Cracks developed in the epoxy several weeks after autopsy. Extensive
coating cracking developed several weeks after autopsy at longitudinal ribs.
The stirrup from cracked, unloaded beam B27 experienced extensive rust staining at three legs and one
bend. Several blisters and coating breaks were observed on one leg. The stirrup in cracked, unloaded
beam B32 (with splice bars) developed widespread rust staining at two legs and two bends (Figure 2.59).
The coating was in good condition at two legs. Patched areas at one bend and on one cut end did not
develop corrosion and showed a clean steel surface. Remaining patched areas experienced tearing of the
patch with visible dark corrosion of the exposed steel areas.
Figure 2.59 Rust staining on a stirrup leg near the front beam surface (beam B32) after 4.3 years.
������������������
������������ ����
As shown in Figure 2.60, rust covered about 10 to 60% of the patched cut ends of bars. Additionally,
coating cracking and blistering were visible up to about 140mm (5.5in.) from the bar end.
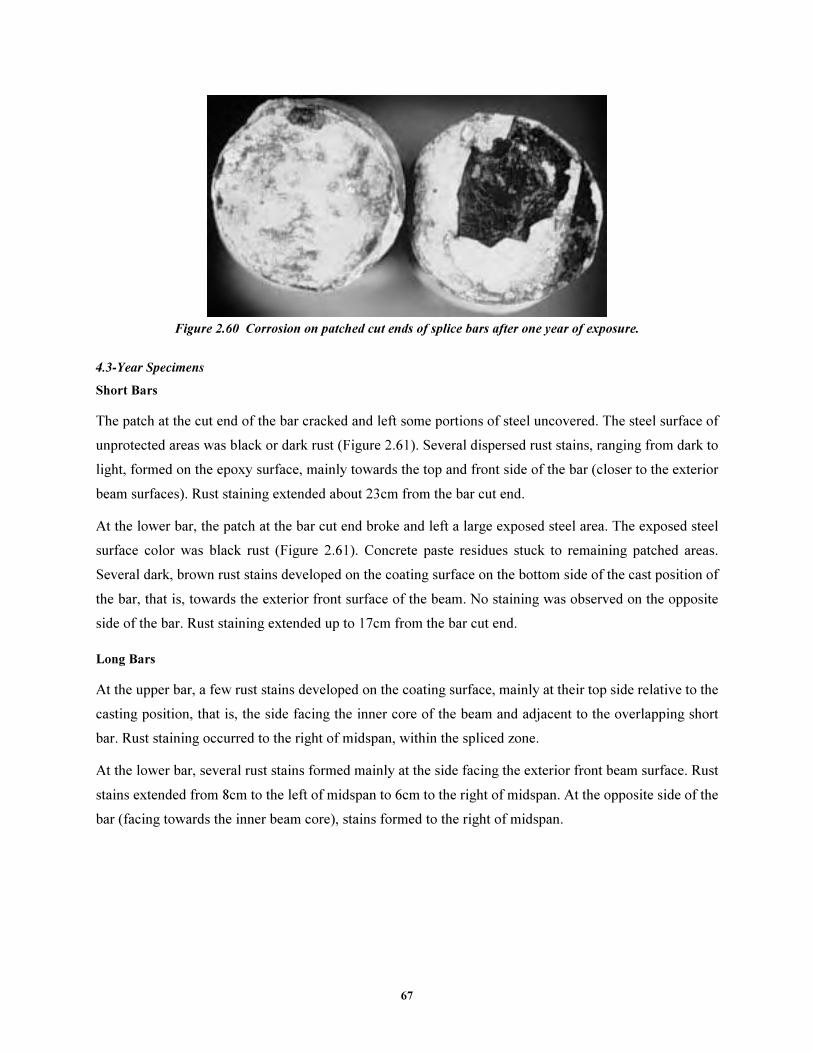
67
Figure 2.60 Corrosion on patched cut ends of splice bars after one year of exposure.
������������ ����
Short Bars
The patch at the cut end of the bar cracked and left some portions of steel uncovered. The steel surface of
unprotected areas was black or dark rust (Figure 2.61). Several dispersed rust stains, ranging from dark to
light, formed on the epoxy surface, mainly towards the top and front side of the bar (closer to the exterior
beam surfaces). Rust staining extended about 23cm from the bar cut end.
At the lower bar, the patch at the bar cut end broke and left a large exposed steel area. The exposed steel
surface color was black rust (Figure 2.61). Concrete paste residues stuck to remaining patched areas.
Several dark, brown rust stains developed on the coating surface on the bottom side of the cast position of
the bar, that is, towards the exterior front surface of the beam. No staining was observed on the opposite
side of the bar. Rust staining extended up to 17cm from the bar cut end.
Long Bars
At the upper bar, a few rust stains developed on the coating surface, mainly at their top side relative to the
casting position, that is, the side facing the inner core of the beam and adjacent to the overlapping short
bar. Rust staining occurred to the right of midspan, within the spliced zone.
At the lower bar, several rust stains formed mainly at the side facing the exterior front beam surface. Rust
stains extended from 8cm to the left of midspan to 6cm to the right of midspan. At the opposite side of the
bar (facing towards the inner beam core), stains formed to the right of midspan.

68
(a) Patch at bar ends of splice bars broke during autopsy, showing a dark corroded surface underneath
(b) Lower splice bar, appearance of bar end at time of autopsy
Figure 2.61 Patched ends of splice bars from beam B32 after 4.3 years of exposure.
������� ���������������������
������������ ����
During removal of stirrups, short lengths of the uncoated bars in the compression zone were uncovered. In
many cases, the uncoated bars were severely corroded with extensive surface degradation and loss of
metal around contact points with the stirrup. Corrosion spread along the bar about 75mm (3in.) and was
associated with chloride solution transport through the wide transverse cracks near beam midspan as
shown in Figure 2.62.
������������ ����
Black bars were moderately to extensively corroded and several moderate to severe pits were observed.
Corrosion typically consisted of uniform black or dark rust with widespread shallow pitting (Figure 2.63).
Several moderate to severe pits were observed in more corroded bars, as shown in Figure 2.64. Dark-
green rust was frequently observed at severe pits at the time of autopsy (Figure 2.65). Severe pitting with
Upper Bar Lower Bar
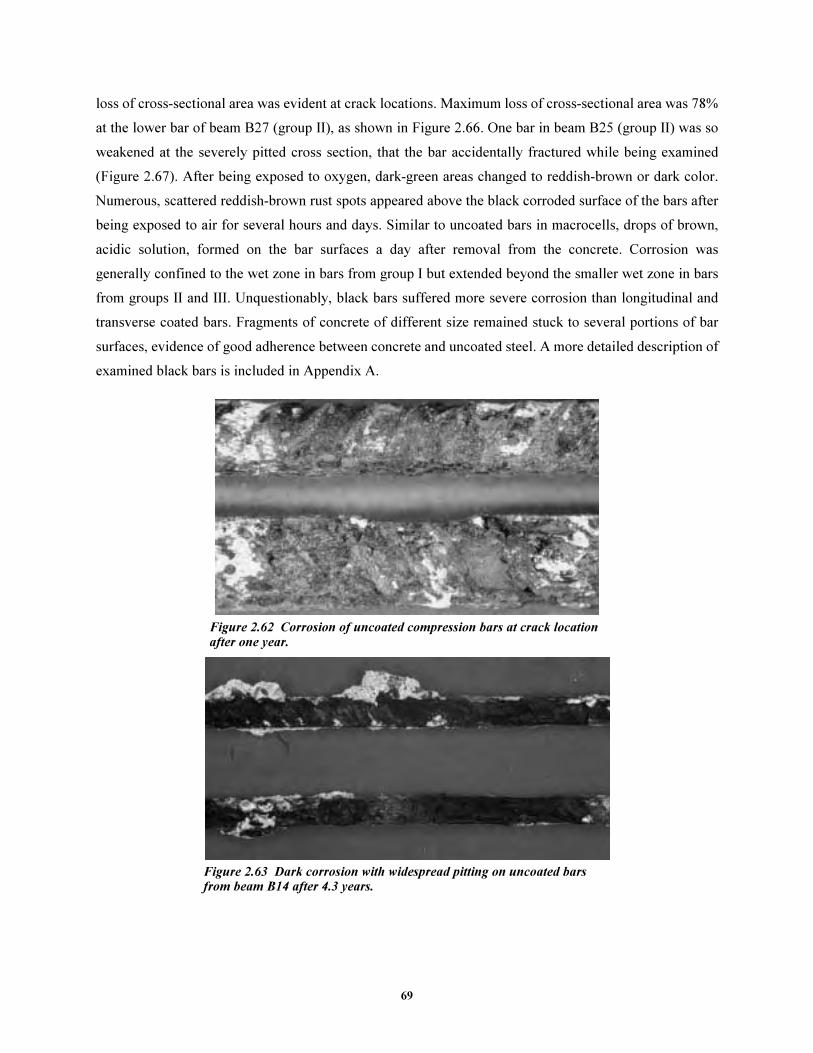
69
loss of cross-sectional area was evident at crack locations. Maximum loss of cross-sectional area was 78%
at the lower bar of beam B27 (group II), as shown in Figure 2.66. One bar in beam B25 (group II) was so
weakened at the severely pitted cross section, that the bar accidentally fractured while being examined
(Figure 2.67). After being exposed to oxygen, dark-green areas changed to reddish-brown or dark color.
Numerous, scattered reddish-brown rust spots appeared above the black corroded surface of the bars after
being exposed to air for several hours and days. Similar to uncoated bars in macrocells, drops of brown,
acidic solution, formed on the bar surfaces a day after removal from the concrete. Corrosion was
generally confined to the wet zone in bars from group I but extended beyond the smaller wet zone in bars
from groups II and III. Unquestionably, black bars suffered more severe corrosion than longitudinal and
transverse coated bars. Fragments of concrete of different size remained stuck to several portions of bar
surfaces, evidence of good adherence between concrete and uncoated steel. A more detailed description of
examined black bars is included in Appendix A.
Figure 2.62 Corrosion of uncoated compression bars at crack location after one year.
Figure 2.63 Dark corrosion with widespread pitting on uncoated bars from beam B14 after 4.3 years.

70
(a) Severe pitting on lower black bar near coated stirrup (beam B23).
(b) Severe pitting on black bars near coated stirrup (beam B23)
Figure 2.64 Severe pitting and loss of cross section on uncoated bars near crack locations after 4.3 years.
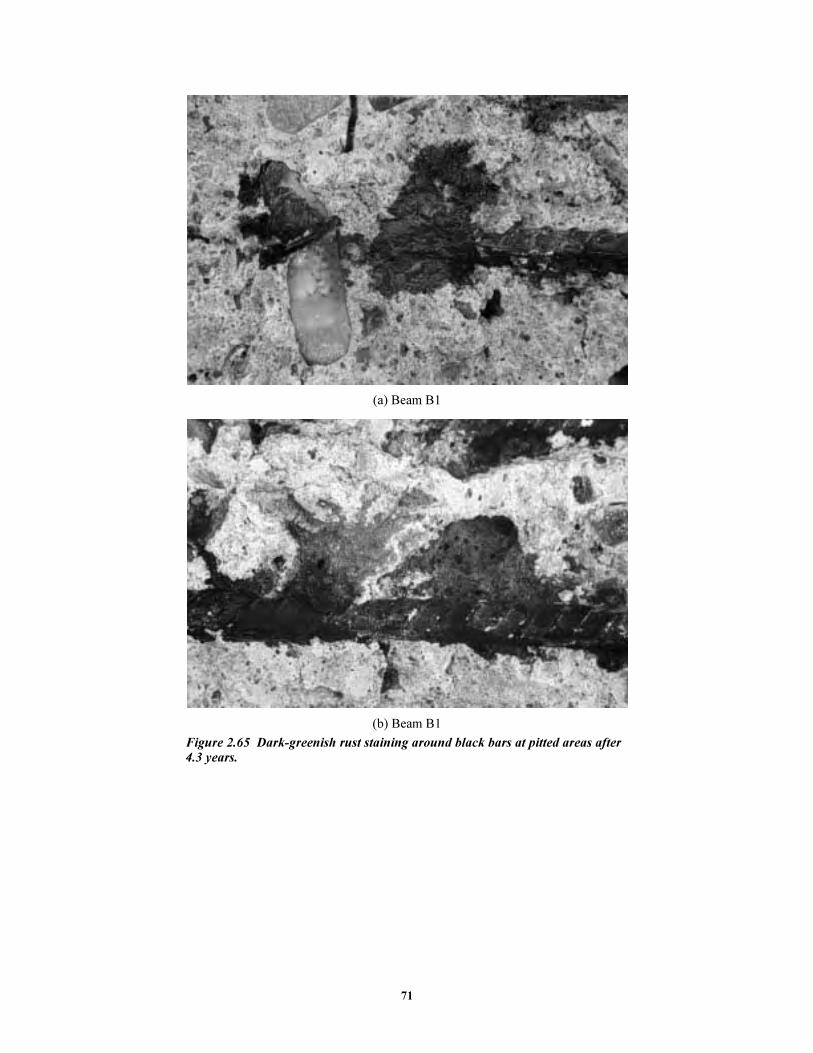
71
(a) Beam B1
(b) Beam B1
Figure 2.65 Dark-greenish rust staining around black bars at pitted areas after 4.3 years.

72
(a) Lower black bar of beam B27
(b) Lower black bar of beam B23
Figure 2.66 Very severe pitting and loss of cross section on uncoated bars at crack locations (beam group II) after 4.3 years.
Figure 2.67 Upper black bar in beam B25 fractured during autopsy at severely pitted location after 4.3 years.
2.4.5 Coating Removal
A sharp blade was used to remove the debonded coating and to inspect areas of intact coating. A cut was
made with a utility knife along one longitudinal rib (generally the rib located on the more corroded side).
The coating was then lifted by inserting the blade tip of an X-acto knife under the coating at the precut
sections and prying the coating away from the bar. This gave an opportunity for assessing the adhesion of
the coating to the steel substrate. The debonded areas were relatively easy to pry and were characterized
by noticeable separation from the metal. In contrast, cutting through the well-bonded coating was difficult

73
and caused cohesive separation of the coating material itself. In areas of the bars where adhesion was
preserved, the steel surface beneath the coating remained in its original condition (bright, shiny surface)
without corrosion. The steel surface beneath the coating at debonded areas changed in appearance and
degree of corrosion, as will be discussed in section 2.4.6.
������������ ����
In general, loss of adhesion on the longitudinal bars was limited to about 10mm (3/8in.) around all
exposed steel areas, and to some length along the corroded sites. Even where damage was repaired,
debonding reached about 15mm (1/2in.) around the patched areas. Debonding was proportional to
apparent corrosion along the bar: the more surface corrosion, the larger the debonded area.
For stirrups, coating debonding was much more prevalent on stirrups in cracked beams than in uncracked
beams. The areas of stirrup most vulnerable to coating debonding were the bent portions and the patched
ends. In addition, the coating was debonded to some extent along the rust areas. Debonding was
particularly extensive (over 60% of stirrup surface) in those specimens where stirrups were used with
longitudinal or splice bars. For cut bar ends, debonding took place along the cracked coating extending
from the cut end. Figure 2.68 illustrates the extent of debonding of the epoxy coating on a longitudinal
bar and a stirrup.
������������ ����
Coating debonded more extensively after 4.3 years of exposure. The coating was usually easy to peel on
the portion of the bars within the exposure (wet) zone of the beams and gave an indication of nearly
complete loss of coating adhesion (Figure 2.69). Coating debonding progressed from the wet areas at
midspan towards the outer, dryer zones and was more extensive in cracked beams than in uncracked
beams. Coating adhesion was preserved outside the wet zones of the beams, usually about 0.50 m beyond
midspan in beams with larger exposed areas (Group I). At splices (cracked, unloaded beam B32), coating
debonded from the cut ends up to a distance of about 20 to 24cm. In the uncracked beams, bars with 3%
damage to coating showed much more adhesion loss than bars in an as-received condition. It was
observed that adhesion was always lost around damaged, exposed areas, and the regions with good
adhesion were located away from the damaged spots. The as-received bars in uncracked beam B1 had
good adhesion within the wet zone, with only limited, isolated areas losing adhesion. The coating could
be removed only in small chips (Figure 2.70).
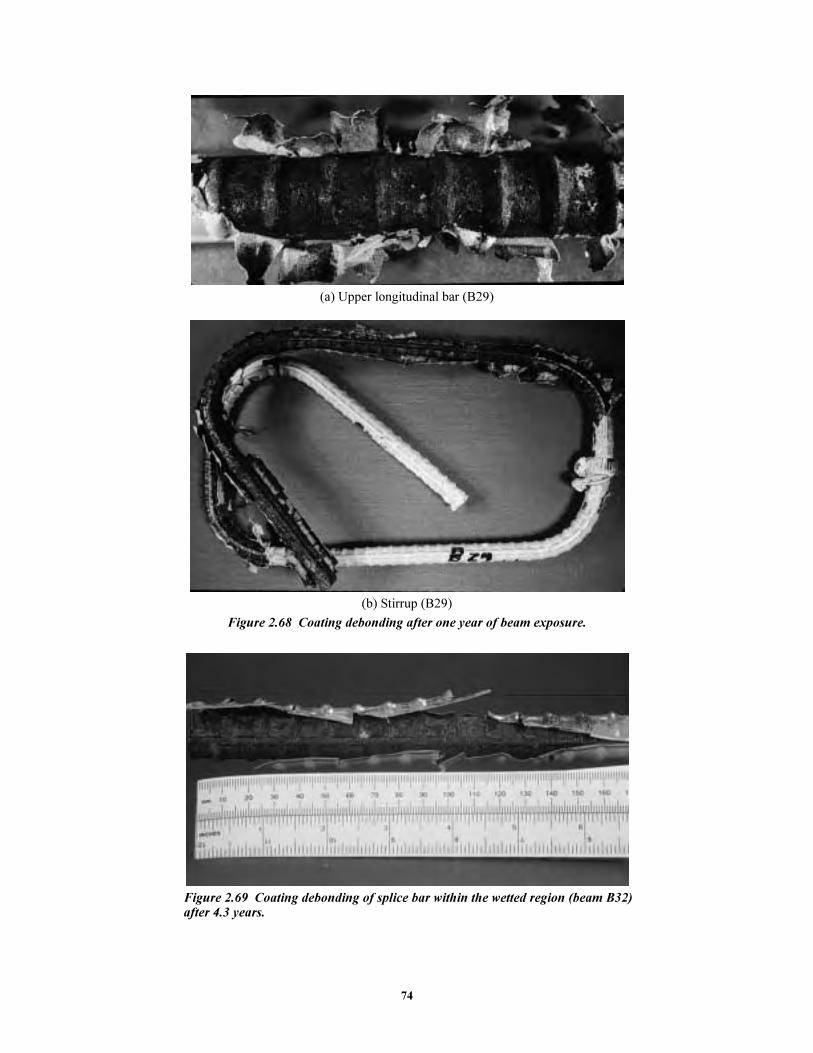
74
(a) Upper longitudinal bar (B29)
(b) Stirrup (B29)
Figure 2.68 Coating debonding after one year of beam exposure.
Figure 2.69 Coating debonding of splice bar within the wetted region (beam B32) after 4.3 years.

75
Figure 2.70 Coating adhered well throughout most portions of bars from beam B1 after 4.3 years of exposure.
Coating debonded extensively at stirrups, as can be seen in Figure 2.71. Coating was very easy to remove
at the least corroded portions of the stirrups. It could be lifted up integrally, without breaking or falling
apart in small pieces. Coating was less easily removed at the most corroded portions of the stirrups, where
it came off in smaller pieces due to its very thin and deteriorated condition. Adherence of rust products to
the coating also contributed to the higher degree of difficulty. Because of these factors, coating removal at
stirrups was generally time-consuming.
Figure 2.71 Coating extensively debonded on stirrups after 4.3 years.
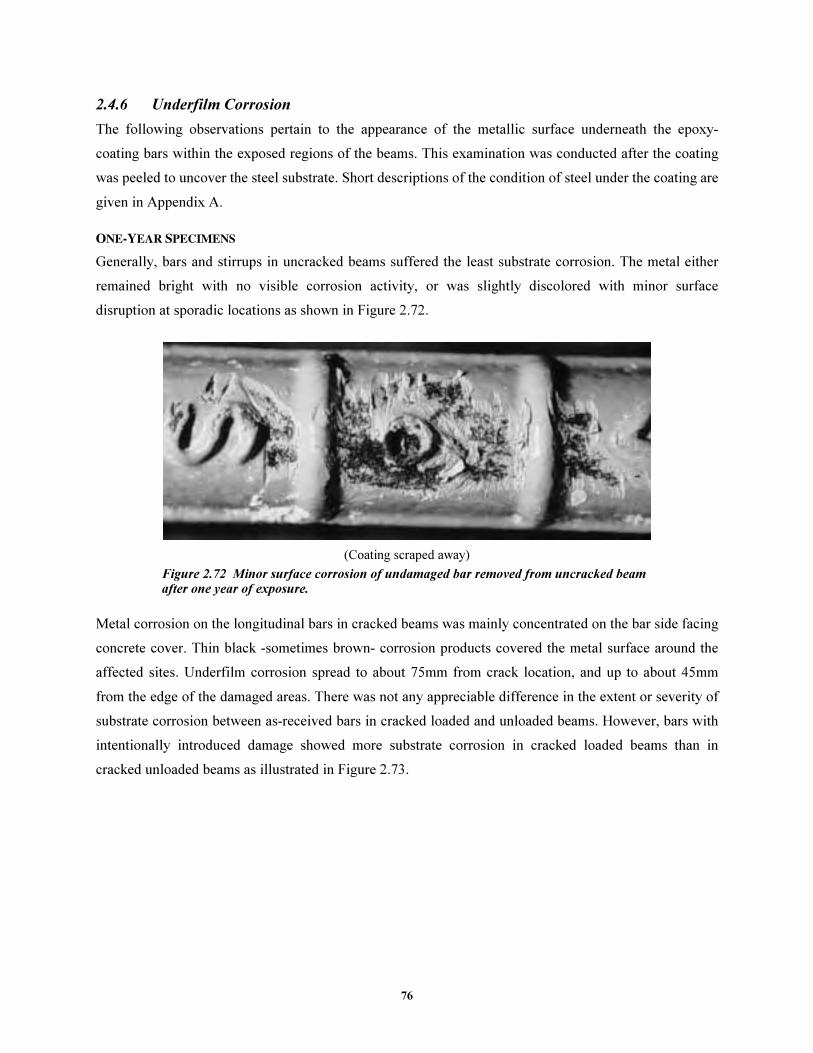
76
2.4.6 Underfilm Corrosion
The following observations pertain to the appearance of the metallic surface underneath the epoxy-
coating bars within the exposed regions of the beams. This examination was conducted after the coating
was peeled to uncover the steel substrate. Short descriptions of the condition of steel under the coating are
given in Appendix A.
�����������������
Generally, bars and stirrups in uncracked beams suffered the least substrate corrosion. The metal either
remained bright with no visible corrosion activity, or was slightly discolored with minor surface
disruption at sporadic locations as shown in Figure 2.72.
(Coating scraped away)
Figure 2.72 Minor surface corrosion of undamaged bar removed from uncracked beam after one year of exposure.
Metal corrosion on the longitudinal bars in cracked beams was mainly concentrated on the bar side facing
concrete cover. Thin black -sometimes brown- corrosion products covered the metal surface around the
affected sites. Underfilm corrosion spread to about 75mm from crack location, and up to about 45mm
from the edge of the damaged areas. There was not any appreciable difference in the extent or severity of
substrate corrosion between as-received bars in cracked loaded and unloaded beams. However, bars with
intentionally introduced damage showed more substrate corrosion in cracked loaded beams than in
cracked unloaded beams as illustrated in Figure 2.73.

77
(a) Corrosion on bar from uncracked beam B7
(b) Corrosion on bar from cracked unloaded beam B9
(c) Corrosion on bar from cracked loaded beam B11
Figure 2.73 Substrate corrosion on bars with introduced damage and variable beam loading condition after one year.
Indeed, the most severe metal corrosion was found on the damaged bars retrieved from the cracked
loaded beam. Significant pitting occurred at the edges of the exposed steel areas intercepting wide cracks.
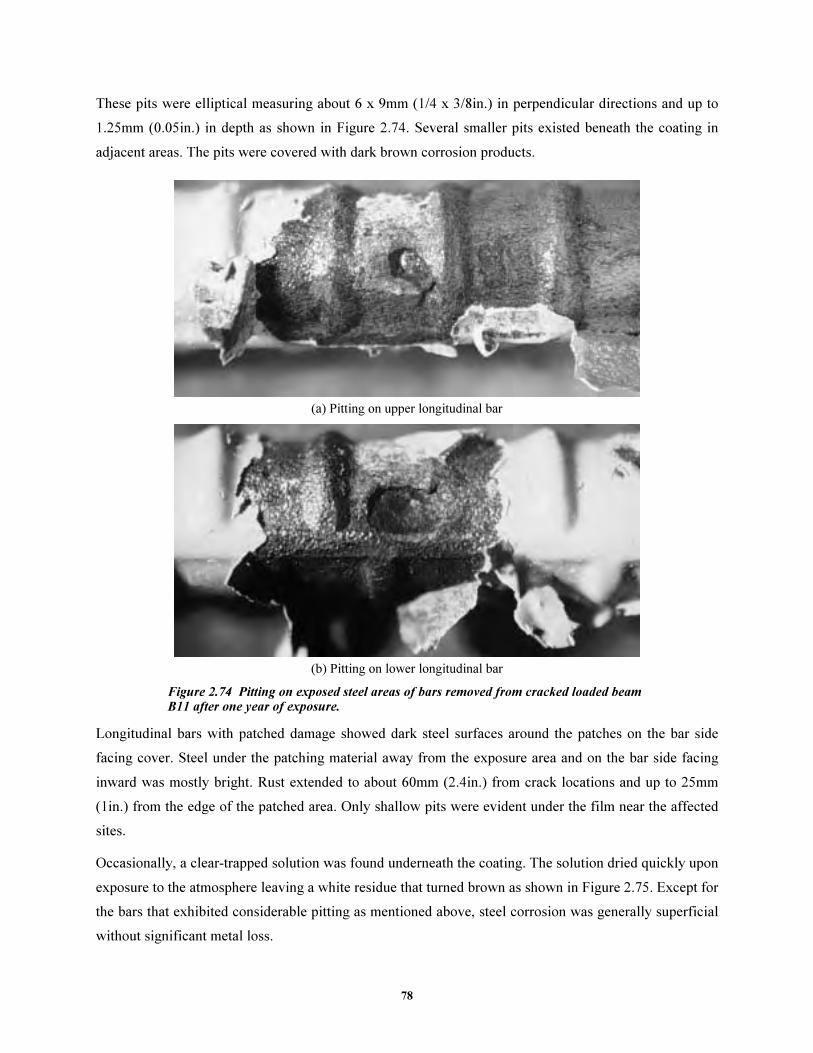
78
These pits were elliptical measuring about 6 x 9mm (1/4 x 3/8in.) in perpendicular directions and up to
1.25mm (0.05in.) in depth as shown in Figure 2.74. Several smaller pits existed beneath the coating in
adjacent areas. The pits were covered with dark brown corrosion products.
(a) Pitting on upper longitudinal bar
(b) Pitting on lower longitudinal bar
Figure 2.74 Pitting on exposed steel areas of bars removed from cracked loaded beam B11 after one year of exposure.
Longitudinal bars with patched damage showed dark steel surfaces around the patches on the bar side
facing cover. Steel under the patching material away from the exposure area and on the bar side facing
inward was mostly bright. Rust extended to about 60mm (2.4in.) from crack locations and up to 25mm
(1in.) from the edge of the patched area. Only shallow pits were evident under the film near the affected
sites.
Occasionally, a clear-trapped solution was found underneath the coating. The solution dried quickly upon
exposure to the atmosphere leaving a white residue that turned brown as shown in Figure 2.75. Except for
the bars that exhibited considerable pitting as mentioned above, steel corrosion was generally superficial
without significant metal loss.
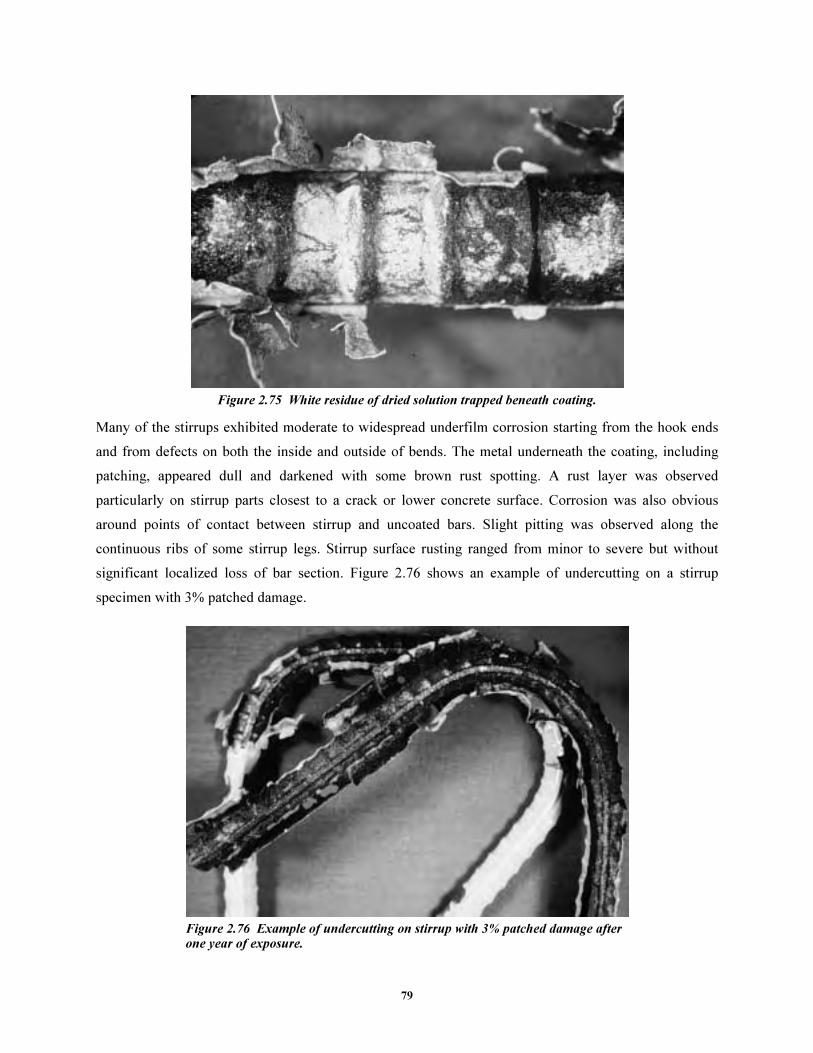
79
Figure 2.75 White residue of dried solution trapped beneath coating.
Many of the stirrups exhibited moderate to widespread underfilm corrosion starting from the hook ends
and from defects on both the inside and outside of bends. The metal underneath the coating, including
patching, appeared dull and darkened with some brown rust spotting. A rust layer was observed
particularly on stirrup parts closest to a crack or lower concrete surface. Corrosion was also obvious
around points of contact between stirrup and uncoated bars. Slight pitting was observed along the
continuous ribs of some stirrup legs. Stirrup surface rusting ranged from minor to severe but without
significant localized loss of bar section. Figure 2.76 shows an example of undercutting on a stirrup
specimen with 3% patched damage.
Figure 2.76 Example of undercutting on stirrup with 3% patched damage after one year of exposure.

80
For bar ends at splice zones, a black corrosion product covered up to about 70% of bar surface area at the
lower side. The maximum undercutting length was about 165mm (6.5in.) from the cut end as shown in
Figure 2.77. Again, corrosion was light without significant metal loss.
Figure 2.77 Undercutting along splice bar at patched cut end after one year of exposure.
������������ ����
Examination of the bar under the coating was facilitated by the extensive loss of adhesion experienced by
the epoxy coating within the wet regions after 4.3 years of exposure. The greater the amount of rust
staining on the epoxy coating, the greater the degree of corrosion on the steel surface beneath the coating.
However, the amount of staining on the coating surface was not always indicative of the severity of
corrosion of the metal substrate. Corrosion of the steel surface was generally more severe and extensive
than the amount of corrosion that was apparent on the coating surface. Underfilm corrosion was more
extensive after 4.3 years than after 1 year of exposure.
As in the macrocell study (Report 1265-323
), two types of surface appearance were found beneath areas
with debonded coating: 1) Surfaces with a mottled, glittery golden-brown or bronze appearance, with no
corrosion products, as shown in Figure 2.78; and 2) Dark or black corroded surfaces with accumulation of
rust products (Figure 2.79). Mottled surfaces were thought to be areas where cathodic disbondment took
place, as was discussed in Research Report 1265-3.23
There was not a specific pattern for location and
distribution of mottled surfaces: At some bars mottled surfaces predominated in the middle 30-cm portion
of the beams, while at other bars, most mottled surfaces were closer to outer portions of wet areas.
Mottled surfaces were found more frequently on longitudinal bars than at stirrups.

81
Uncorroded damaged spot
Figure 2.78 Mottled surface at lower bar of beam B8 within the wetted region.
Figure 2.79 Dark corroded surface on longitudinal upper bar of beam B8 within the wetted region (zone at midspan).
A uniformly black or dark rusted surface developed at corroded portions of the bar. Depending on the
severity of corrosion, shallow pitting and metal depletion, rust volume increase, and blistering developed
to varying degrees (Figure 2.79). No severe, localized, deep pits were found in longitudinal bars.
Moderate pits were observed in some stirrups. The largest pits were less than 0.5mm deep in longitudinal
bars and 1.0mm in stirrups. Figure 2.80 shows the worst pit observed in a stirrup. No drastic reduction of
cross-sectional area was found in any longitudinal coated bar. Moderate reductions in cross-sectional area
were observed in worst corroded stirrups. Variable amounts of dark rust powder came off during removal
of the coating. Blisters were of different sizes and smaller blisters were more abundant than larger
blisters. Blistered areas had a very hard, solid consistency.
Figure 2.80 Pitting on stirrup leg near the bottom beam surface (beam B17).
Areas with mostly reddish-brown rust deposits or pockets of varying size, shape, appearance, and amount
were usually present above the dark corroded surface (Figure 2.81). The size of such rust spots ranged
from very large to small flecks. Appearance of rust spots was dependent on rust concentration, varying
from a light film of rust to thicker layers of rust deposits. In a few instances, spots with whitish, pasty
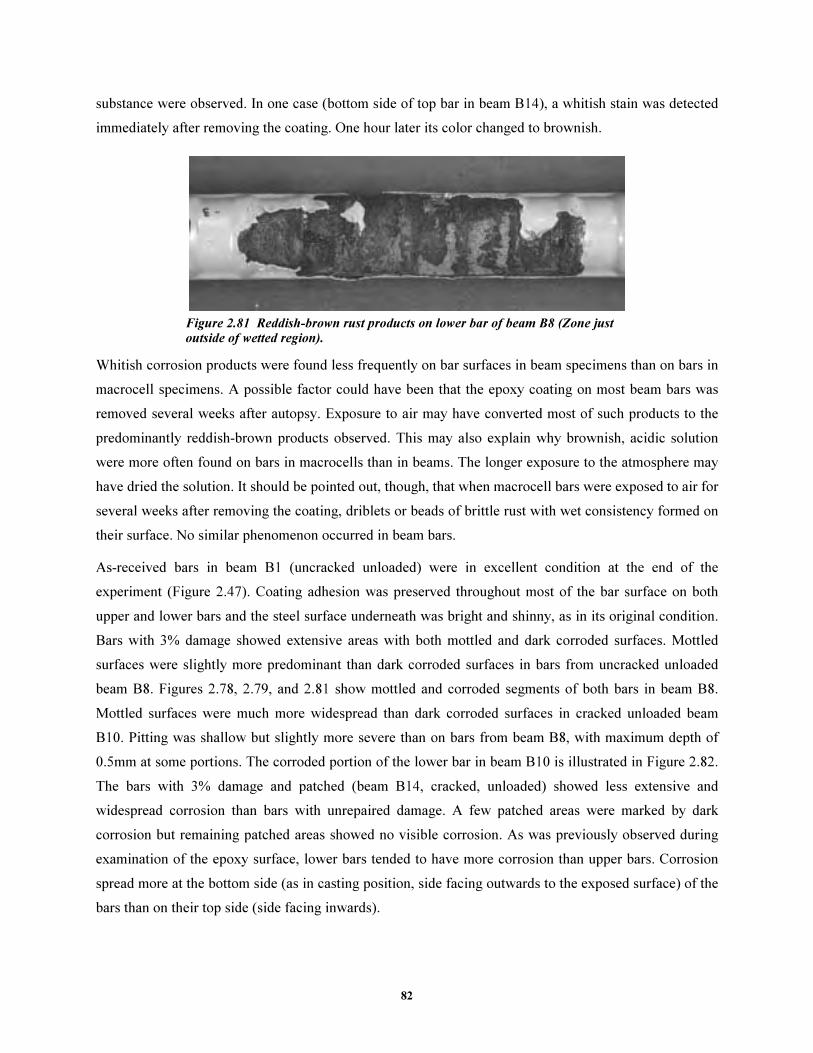
82
substance were observed. In one case (bottom side of top bar in beam B14), a whitish stain was detected
immediately after removing the coating. One hour later its color changed to brownish.
Figure 2.81 Reddish-brown rust products on lower bar of beam B8 (Zone just outside of wetted region).
Whitish corrosion products were found less frequently on bar surfaces in beam specimens than on bars in
macrocell specimens. A possible factor could have been that the epoxy coating on most beam bars was
removed several weeks after autopsy. Exposure to air may have converted most of such products to the
predominantly reddish-brown products observed. This may also explain why brownish, acidic solution
were more often found on bars in macrocells than in beams. The longer exposure to the atmosphere may
have dried the solution. It should be pointed out, though, that when macrocell bars were exposed to air for
several weeks after removing the coating, driblets or beads of brittle rust with wet consistency formed on
their surface. No similar phenomenon occurred in beam bars.
As-received bars in beam B1 (uncracked unloaded) were in excellent condition at the end of the
experiment (Figure 2.47). Coating adhesion was preserved throughout most of the bar surface on both
upper and lower bars and the steel surface underneath was bright and shinny, as in its original condition.
Bars with 3% damage showed extensive areas with both mottled and dark corroded surfaces. Mottled
surfaces were slightly more predominant than dark corroded surfaces in bars from uncracked unloaded
beam B8. Figures 2.78, 2.79, and 2.81 show mottled and corroded segments of both bars in beam B8.
Mottled surfaces were much more widespread than dark corroded surfaces in cracked unloaded beam
B10. Pitting was shallow but slightly more severe than on bars from beam B8, with maximum depth of
0.5mm at some portions. The corroded portion of the lower bar in beam B10 is illustrated in Figure 2.82.
The bars with 3% damage and patched (beam B14, cracked, unloaded) showed less extensive and
widespread corrosion than bars with unrepaired damage. A few patched areas were marked by dark
corrosion but remaining patched areas showed no visible corrosion. As was previously observed during
examination of the epoxy surface, lower bars tended to have more corrosion than upper bars. Corrosion
spread more at the bottom side (as in casting position, side facing outwards to the exposed surface) of the
bars than on their top side (side facing inwards).
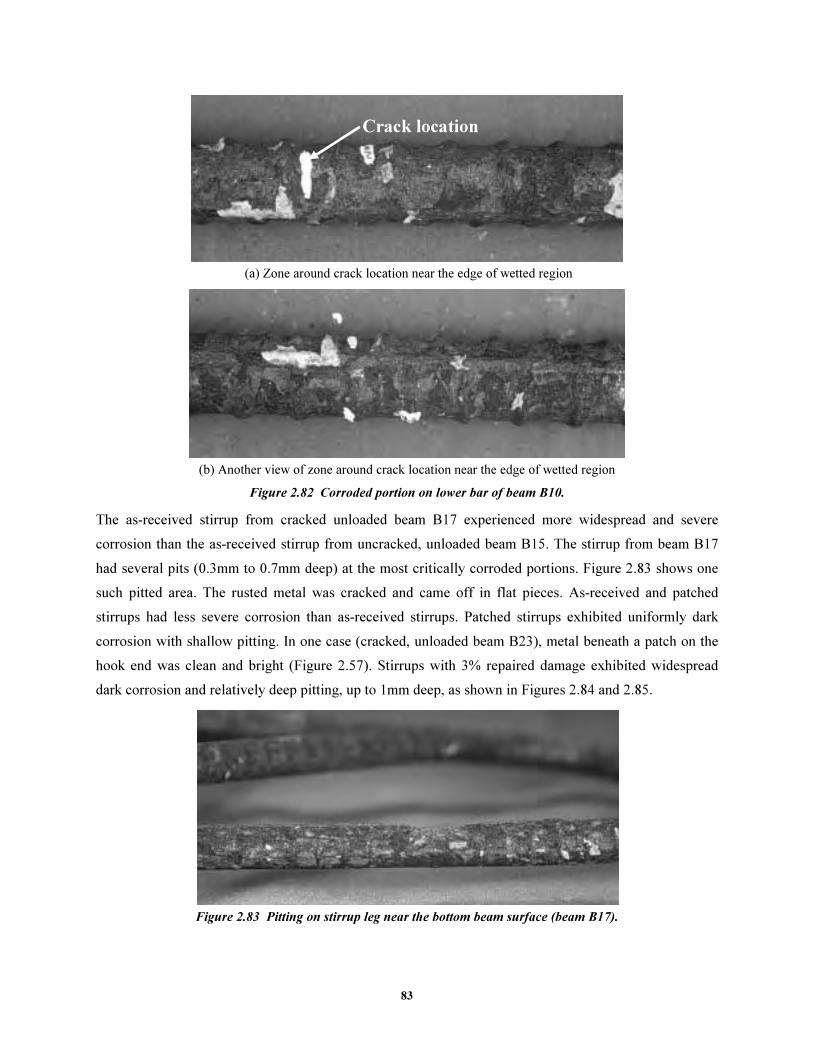
83
Crack location
(a) Zone around crack location near the edge of wetted region
(b) Another view of zone around crack location near the edge of wetted region
Figure 2.82 Corroded portion on lower bar of beam B10.
The as-received stirrup from cracked unloaded beam B17 experienced more widespread and severe
corrosion than the as-received stirrup from uncracked, unloaded beam B15. The stirrup from beam B17
had several pits (0.3mm to 0.7mm deep) at the most critically corroded portions. Figure 2.83 shows one
such pitted area. The rusted metal was cracked and came off in flat pieces. As-received and patched
stirrups had less severe corrosion than as-received stirrups. Patched stirrups exhibited uniformly dark
corrosion with shallow pitting. In one case (cracked, unloaded beam B23), metal beneath a patch on the
hook end was clean and bright (Figure 2.57). Stirrups with 3% repaired damage exhibited widespread
dark corrosion and relatively deep pitting, up to 1mm deep, as shown in Figures 2.84 and 2.85.
Figure 2.83 Pitting on stirrup leg near the bottom beam surface (beam B17).

84
(a) Portion within the wetted region
(b) Portion outside the wetted region
Figure 2.84 Pitting along stirrup leg near the bottom beam surface (beam B27).
Figure 2.85 Corrosion on stirrup leg (top in photo) and mottled surface on stirrup hook (bottom in photo). Portion near the front beam surface (beam B32).
Cut ends of spliced bars showed a uniformly dark or black corroded metal surface with shallow pitting
(Figure 2.86). A dark corroded surface with shallow pitting extended from the patched ends of the bars on
one side of the bars. The steel exhibited a mostly mottled surface on the side opposite to the corroded
surface (Figure 2.87). Undercutting extended 20cm to 24cm from patched bar ends.
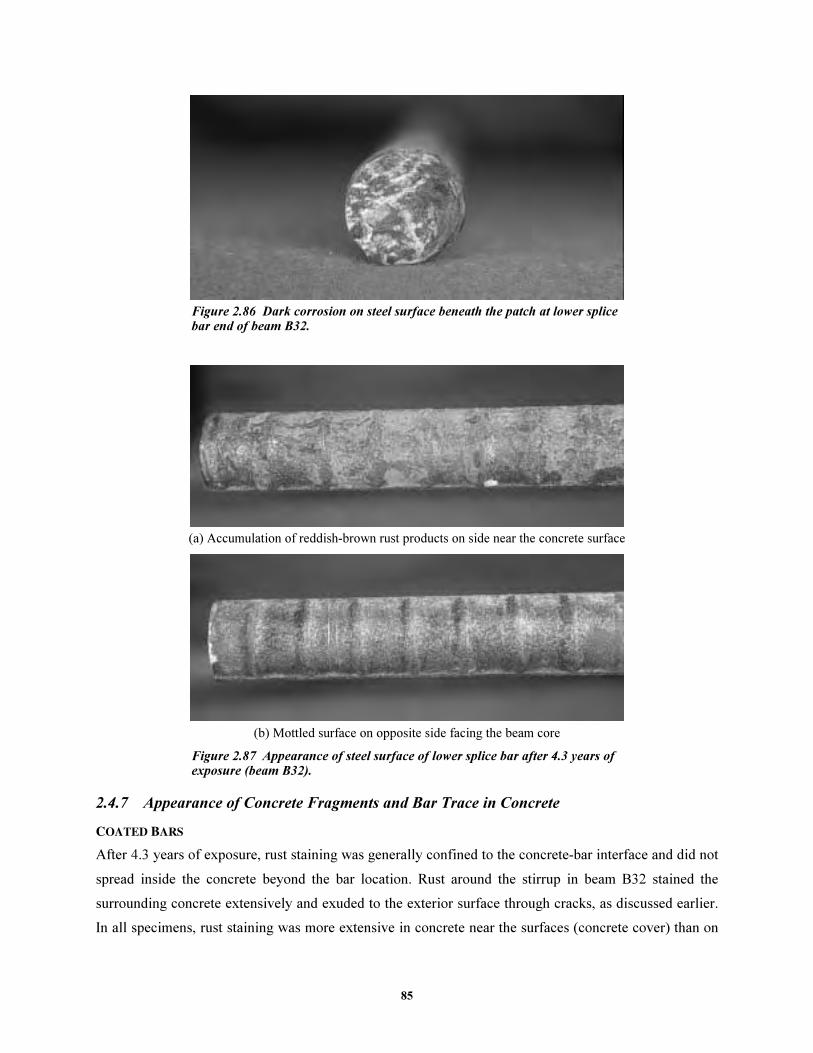
85
Figure 2.86 Dark corrosion on steel surface beneath the patch at lower splice bar end of beam B32.
(a) Accumulation of reddish-brown rust products on side near the concrete surface
(b) Mottled surface on opposite side facing the beam core
Figure 2.87 Appearance of steel surface of lower splice bar after 4.3 years of exposure (beam B32).
2.4.7 Appearance of Concrete Fragments and Bar Trace in Concrete
����� ����
After 4.3 years of exposure, rust staining was generally confined to the concrete-bar interface and did not
spread inside the concrete beyond the bar location. Rust around the stirrup in beam B32 stained the
surrounding concrete extensively and exuded to the exterior surface through cracks, as discussed earlier.
In all specimens, rust staining was more extensive in concrete near the surfaces (concrete cover) than on

86
concrete at the interior of the beams. The size of rust stains ranged from large to very small and was dark
greenish, dark or black, reddish-brown (bright to dark intensity), brownish, dark-brown, light-brown,
yellowish-brown, and orange-brown. The appearance of dark-greenish stains changed within minutes or
hours after the concrete was removed and exposed to the atmosphere. Dark greenish stains changed to one
of the following colors: Reddish-brown, brown, reddish-brown combined with dark or black, and light-
brown.
Rust stains in the concrete were located at and near concrete voids, next to coating imperfections and
discontinuities (intentionally damaged spots, patched areas, as-received damage, cracks in the coating,
pinholes, and mandrel-induced nicks), and alongside the path of the longitudinal lug below the bar. There
was almost always a blister in the coating next to a rust-stained void in the concrete. However, there were
many concrete voids, large and small, which were free of any rust products or staining.
Bar traces of coated steel confirmed the previously mentioned findings from the macrocell study.23
Concrete on top of the coated steel (in casting position) appeared glossy, smooth with a grayish-like
appearance, the rib imprints were clearly defined, and was generally free of voids [Figure 2.88(a)].
Concrete on the underside of the coated steel appeared whitish, dusty, and porous with laitence and had
many voids of different sizes [Figure 2.88(b)]. In general, more rust products were visible in and around
the voids at the bottom trace than at the top. Chemical adhesion to concrete was lost, as evidenced by the
ease in removing the bar from the concrete and lack of concrete adhering to the bar. Only a film of white
dust from the concrete paste adhered to the bottom of the bars.
The stirrup trace did not have a similar distinct pattern. There were some voids distributed along the
stirrup legs and concrete was not as glossy as it appeared on top of the longitudinal bars. Figure 2.89
shows an example of a stirrup trace in concrete. An interesting observation was that the patching material
used at the coating plant to repair stirrup ends remained on the stirrup imprint in concrete as shown in
Figure 2.90.
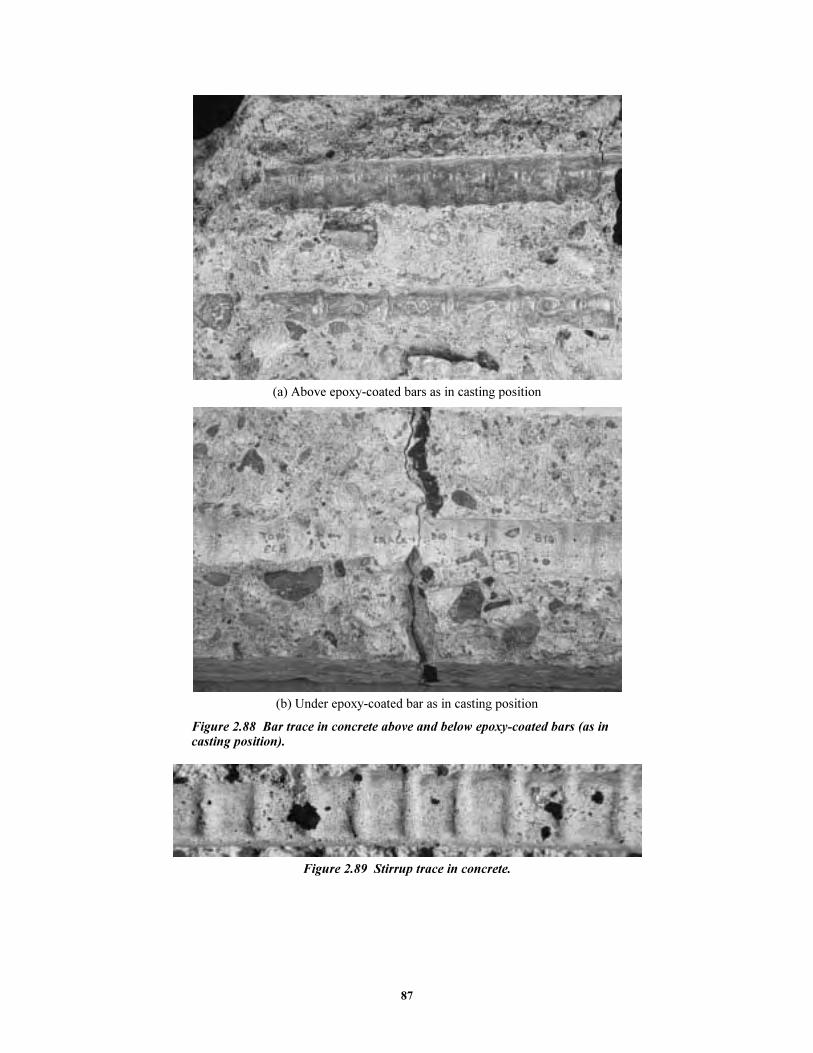
87
(a) Above epoxy-coated bars as in casting position
(b) Under epoxy-coated bar as in casting position
Figure 2.88 Bar trace in concrete above and below epoxy-coated bars (as in casting position).
Figure 2.89 Stirrup trace in concrete.

88
Figure 2.90 Patching material observed on stirrup imprint in concrete.
������� �����������������������������
Concrete surrounding heavily corroded uncoated bars was extensively rust stained after 4.3 years of
exposure (Figure 2.91). Rust stains were very large, mostly black or dark and reddish-brown colored.
Other observed stains were dark-green, bright orange, brownish, and yellowish-brown. Typically, dark-
greenish stains would turn orange-brown, reddish-brown, or dark a few hours after exposure to the
atmosphere. In general, rust stains penetrated the concrete far beyond the bar location at most areas where
the bar was pitted. Stains penetrated cracks and expanded towards the exterior surface. Rust staining was
mostly reddish-brown and orange-brown at areas closer to the exterior surface while it tended to be dark
or black at the rebar level. Reddish-brown and dark rust was also observed inside large concrete voids
above and below the bar.
In non-stained areas, the bar trace in concrete above (in the casting position) the bar was porous with a
grayish-like appearance, the rib imprints were not clearly defined, and there were few voids. The bar trace
in concrete below (in the casting position) the bar had also a grayish-like appearance, but looked more
porous because of laitance and had more voids of different sizes. Concrete adhered well to black bars as
evidenced by the concrete that stuck to the bar surface after removal.

89
(a) Black bars in beam B14
(b) Black bars in beam B25
Figure 2.91 Extensive dark or dark-greenish rust staining was observed on concrete around uncoated bars at severely pitted locations.

90
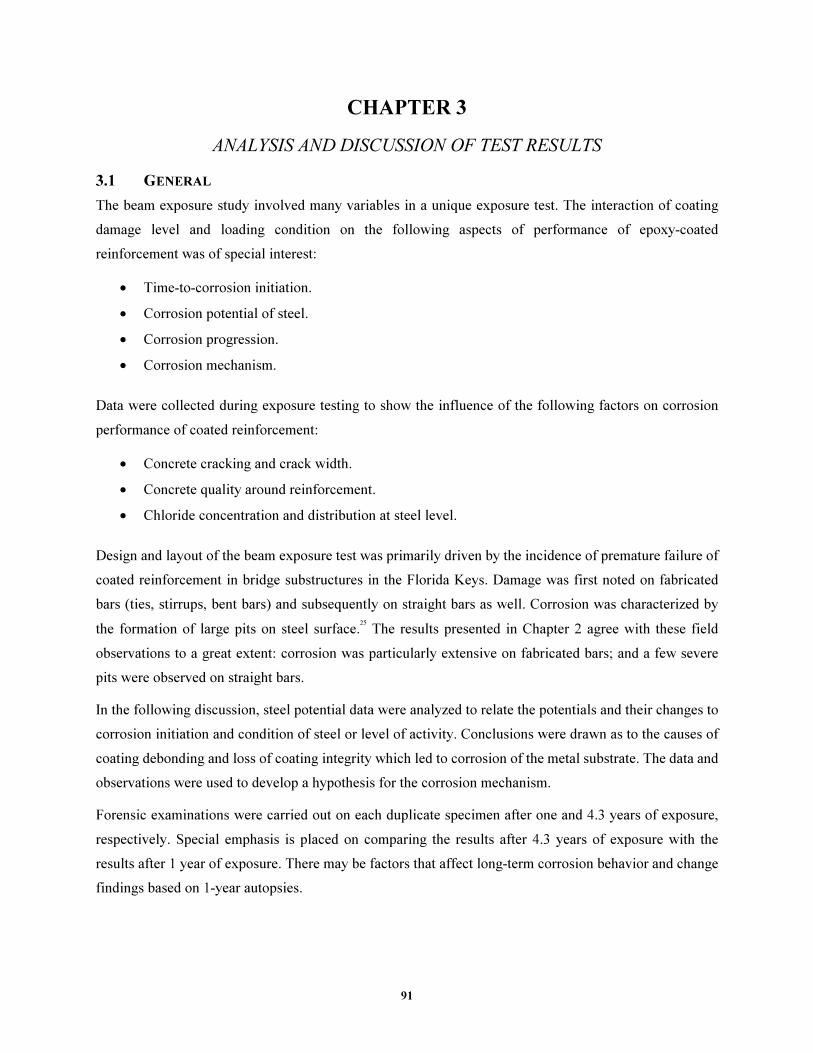
91
CHAPTER 3
ANALYSIS AND DISCUSSION OF TEST RESULTS
3.1 GENERAL
The beam exposure study involved many variables in a unique exposure test. The interaction of coating
damage level and loading condition on the following aspects of performance of epoxy-coated
reinforcement was of special interest:
• Time-to-corrosion initiation.
• Corrosion potential of steel.
• Corrosion progression.
• Corrosion mechanism.
Data were collected during exposure testing to show the influence of the following factors on corrosion
performance of coated reinforcement:
• Concrete cracking and crack width.
• Concrete quality around reinforcement.
• Chloride concentration and distribution at steel level.
Design and layout of the beam exposure test was primarily driven by the incidence of premature failure of
coated reinforcement in bridge substructures in the Florida Keys. Damage was first noted on fabricated
bars (ties, stirrups, bent bars) and subsequently on straight bars as well. Corrosion was characterized by
the formation of large pits on steel surface.25
The results presented in Chapter 2 agree with these field
observations to a great extent: corrosion was particularly extensive on fabricated bars; and a few severe
pits were observed on straight bars.
In the following discussion, steel potential data were analyzed to relate the potentials and their changes to
corrosion initiation and condition of steel or level of activity. Conclusions were drawn as to the causes of
coating debonding and loss of coating integrity which led to corrosion of the metal substrate. The data and
observations were used to develop a hypothesis for the corrosion mechanism.
Forensic examinations were carried out on each duplicate specimen after one and 4.3 years of exposure,
respectively. Special emphasis is placed on comparing the results after 4.3 years of exposure with the
results after 1 year of exposure. There may be factors that affect long-term corrosion behavior and change
findings based on 1-year autopsies.
92
3.2 TIME-TO-CORROSION
3.2.1 General
Although highly negative potentials were considered to be an indicator of corrosion initiation, it must be
remembered that they may also result from progressive restriction in oxygen supply. For example, a
potential of -900 mV was reached in a totally saturated structure without corrosion.26
It must be kept in
mind that corrosion potentials may not accurately reflect corrosion activity, especially rate of corrosion.
For this reason, the following discussion refers to suspected corrosion indicated by measured half-cell
potentials.
3.2.2 Longitudinal Bars
Time-to-onset of suspected corrosion as indicated by half-cell measurements varied among beams with
different coating damage and loading condition. Table 2.2 in Chapter 2 indicates that as-received bars
delayed corrosion more than bars with 3% damage to coating. In other words, the more steel area that was
exposed, the earlier was the shift of potential to more negative values. From Table 2.2, bars with 3%
damage to coating in cracked beams, loaded or unloaded, started to corrode very early, oftentimes after
the first wet cycle (4 to 18 days). Meanwhile, for most bars with as-received coating in cracked beams,
loaded or unloaded, corrosion was somewhat delayed (from 1.5 to 3.4 months). Bars with patched
damage showed comparable time-to-corrosion as bars with unrepaired damage suggesting that patching
was not effective. Spliced bars with patched ends in cracked beams began to corrode as early as 4 to
18 days. Interestingly, corrosion of bars in cracked beams was suspected to initiate after the first wetting
period; i.e. after the first salt application. Bars in uncracked unloaded beams had times to corrosion from
9 months to 1.6 years. The absence of cracks significantly delayed the onset of corrosion but did not stop
corrosion, especially if the coating was damaged.
In general, similar periods to suspected corrosion initiation were listed for bars in beams with opened and
unopened cracks. The similarity means that crack width did not affect the time to active conditions for
corrosion. Rostam,27
on the other hand, revealed that the larger the crack width, the shorter the time to
steel depassivation.
3.2.3 Stirrups
The most significant factors for time to corrosion of coated stirrups were the presence of cracks and the
loading condition. Corrosion of stirrups in uncracked beams was delayed while stirrups in cracked beams
may have started to corrode as early as the first wetting period. From Table 2.3, stirrups in uncracked
beams started to corrode at about 1.5 years of exposure. Stirrups in cracked, unloaded beams showed
times to corrosion from 2.5 months to 4.3 months. Stirrups in cracked loaded beams had times to
corrosion of about 1.5 months. Stirrups located at cracks in loaded beams seemed to be the first to corrode

93
regardless of the coating condition. The potentials tended to drop at a slightly later date for as-received
stirrups with patched bends compared to those as-received without patching or 3% damage and patching.
No significant difference was observed for stirrups with as-received condition. However, corrosion at a
stirrup with 3% coating damage and patched in a cracked, unloaded beam was significantly delayed,
initiating at about 11 months.
3.3 CORROSION ACTIVITY
3.3.1 General
Corrosion potentials were always measured while concrete was still wet. It was suspected that measuring
potentials after drying would lead to unreliable measurements since concrete conductivity would be
reduced.
Highly negative potentials generally indicate corrosion but not the rate of corrosion. Half-cell potentials
are directly related to changes in steel condition or corrosion state, whereas the corrosion rate is directly
proportional to corrosion current. Furthermore, measured potentials do not demonstrate whether macro-
galvanic or micro-galvanic corrosion cells exist on a bar. Coupling of corroding and non corroding
portions of the same bar will develop a potential difference regardless of the electrode size, i.e. macro-
electrode or micro-electrode.28
Since corrosion activity will generally vary with time of exposure, the
cathodic and anodic areas, and the cathode to anode ratio, will also change with time. Therefore, the same
potential is likely to develop in different arrangements of the participating electrodes.
In the beam exposure study, the layout of the longitudinal bar with respect to exposure area influenced the
development of the steel potential. Measured potentials at middle regions of the beams, subjected to
wetting and drying, were highly negative, while potentials at regions outside the exposure zone were less
negative. Highly negative potentials indicate that corrosion is very likely to be occurring, while low
negative potentials indicate that corrosion is unlikely. As expected, a predominantly anodic behavior
prevailed at the middle region of the beam subjected to wetting and drying. Exposed metal on the bar
surface became anodic upon contact with chlorides penetrating through concrete and cracks. Other steel
areas in regions outside the exposure zone were predominantly cathodic in relatively less contaminated
concrete. The farther the distance from the anodic zone, the more steel passivity was maintained. In
addition, the low moisture content of concrete surrounding cathodic spots promoted oxygen transport to
the metal surface, thereby facilitating the cathodic reactions. The autopsies confirmed that bars corroded
within and near the exposed regions and were uncorroded farther from the wetted regions. Potential
variation between duplicate beams reflected mainly the degree of polarization of these cathodic reactions.
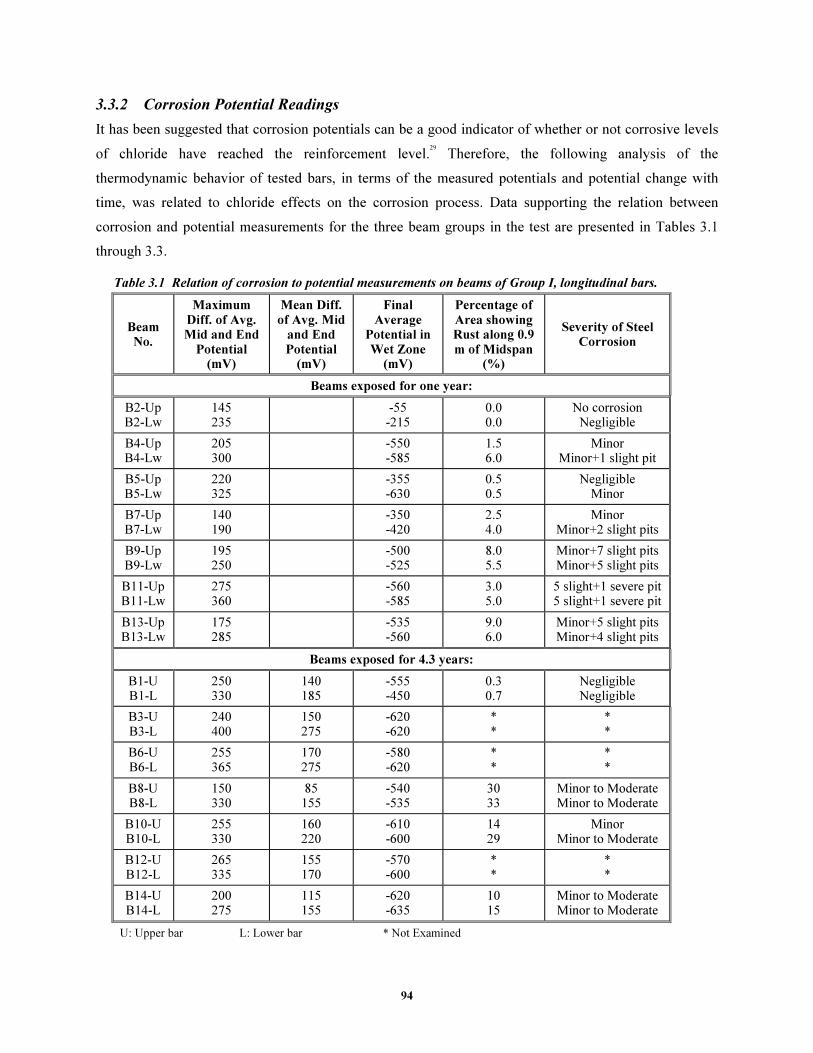
94
3.3.2 Corrosion Potential Readings
It has been suggested that corrosion potentials can be a good indicator of whether or not corrosive levels
of chloride have reached the reinforcement level.29
Therefore, the following analysis of the
thermodynamic behavior of tested bars, in terms of the measured potentials and potential change with
time, was related to chloride effects on the corrosion process. Data supporting the relation between
corrosion and potential measurements for the three beam groups in the test are presented in Tables 3.1
through 3.3.
Table 3.1 Relation of corrosion to potential measurements on beams of Group I, longitudinal bars.
Beam No.
Maximum Diff. of Avg. Mid and End
Potential (mV)
Mean Diff. of Avg. Mid
and End Potential
(mV)
Final Average
Potential in Wet Zone
(mV)
Percentage of Area showing Rust along 0.9 m of Midspan
(%)
Severity of Steel Corrosion
Beams exposed for one year:
B2-Up B2-Lw
145 235
-55 -215
0.0 0.0
No corrosion Negligible
B4-Up B4-Lw
205 300
-550 -585
1.5 6.0
Minor Minor+1 slight pit
B5-Up B5-Lw
220 325
-355 -630
0.5 0.5
Negligible Minor
B7-Up B7-Lw
140 190
-350 -420
2.5 4.0
Minor Minor+2 slight pits
B9-Up B9-Lw
195 250
-500 -525
8.0 5.5
Minor+7 slight pits Minor+5 slight pits
B11-Up B11-Lw
275 360
-560 -585
3.0 5.0
5 slight+1 severe pit 5 slight+1 severe pit
B13-Up B13-Lw
175 285
-535 -560
9.0 6.0
Minor+5 slight pits Minor+4 slight pits
Beams exposed for 4.3 years:
B1-U B1-L
250 330
140 185
-555 -450
0.3 0.7
Negligible Negligible
B3-U B3-L
240 400
150 275
-620 -620
* *
* *
B6-U B6-L
255 365
170 275
-580 -620
* *
* *
B8-U B8-L
150 330
85 155
-540 -535
30 33
Minor to Moderate Minor to Moderate
B10-U B10-L
255 330
160 220
-610 -600
14 29
Minor Minor to Moderate
B12-U B12-L
265 335
155 170
-570 -600
* *
* *
B14-U B14-L
200 275
115 155
-620 -635
10 15
Minor to Moderate Minor to Moderate
U: Upper bar L: Lower bar * Not Examined

95
Table 3.2 Relation of corrosion to potential measurements on beams of Group II, stirrups.
Beam No.
Final Average Potential in Wet Zone
(mV)
Percentage of Area showing Rust of stirrup
surface (%)
Severity of Steel Corrosion
(Pitting in % of bar surface)
Beams exposed for one year:
B16 -415 6.5 Minor rust
B18 -430 22.0 Minor rust
B20 -570 22.0 Moderate
B21 -225 0.0 Negligible
B24 -460 20.5 Moderate
B26 -485 23.0 Severe, pitting
B28 -535 28.0 Severe, pitting
Beams exposed for 4.3 years:
B15 -565 67 26% pitted
B17 -555 93 27% pitted
B19 -580 * *
B22 -550 89 14% pitted
B23 -505 48 4% pitted
B25 -315 86 20% pitted
B27 -580 83 15% pitted
* Not Examined
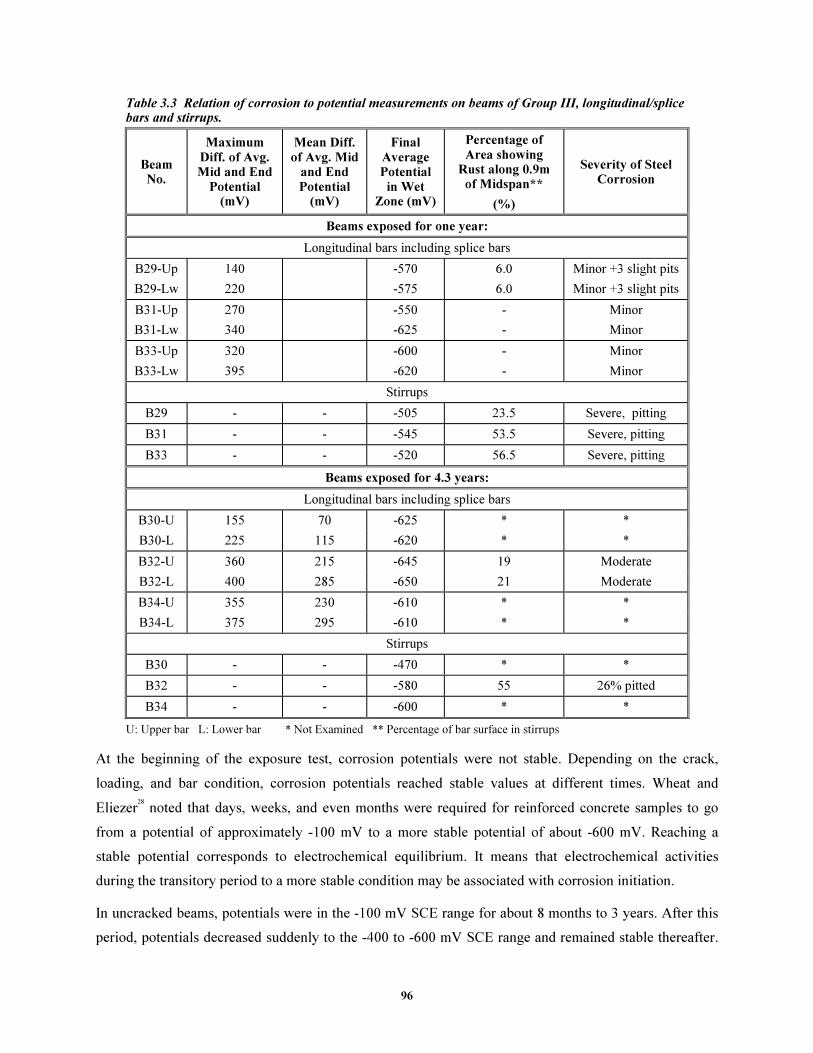
96
Table 3.3 Relation of corrosion to potential measurements on beams of Group III, longitudinal/splice bars and stirrups.
Beam No.
Maximum Diff. of Avg. Mid and End
Potential (mV)
Mean Diff. of Avg. Mid
and End Potential
(mV)
Final Average Potential in Wet
Zone (mV)
Percentage of Area showing
Rust along 0.9m of Midspan**
(%)
Severity of Steel Corrosion
Beams exposed for one year:
Longitudinal bars including splice bars
B29-Up
B29-Lw
140
220
-570
-575
6.0
6.0
Minor +3 slight pits
Minor +3 slight pits
B31-Up
B31-Lw
270
340
-550
-625
-
-
Minor
Minor
B33-Up
B33-Lw
320
395
-600
-620
-
-
Minor
Minor
Stirrups
B29 - - -505 23.5 Severe, pitting
B31 - - -545 53.5 Severe, pitting
B33 - - -520 56.5 Severe, pitting
Beams exposed for 4.3 years:
Longitudinal bars including splice bars
B30-U 155 70 -625 * *
B30-L 225 115 -620 * *
B32-U 360 215 -645 19 Moderate
B32-L 400 285 -650 21 Moderate
B34-U 355 230 -610 * *
B34-L 375 295 -610 * *
Stirrups
B30 - - -470 * *
B32 - - -580 55 26% pitted
B34 - - -600 * *
U: Upper bar L: Lower bar * Not Examined ** Percentage of bar surface in stirrups
At the beginning of the exposure test, corrosion potentials were not stable. Depending on the crack,
loading, and bar condition, corrosion potentials reached stable values at different times. Wheat and
Eliezer28
noted that days, weeks, and even months were required for reinforced concrete samples to go
from a potential of approximately -100 mV to a more stable potential of about -600 mV. Reaching a
stable potential corresponds to electrochemical equilibrium. It means that electrochemical activities
during the transitory period to a more stable condition may be associated with corrosion initiation.
In uncracked beams, potentials were in the -100 mV SCE range for about 8 months to 3 years. After this
period, potentials decreased suddenly to the -400 to -600 mV SCE range and remained stable thereafter.

97
Low negative potentials reflect steel passivity. According to Aguilar et al,30
passive steel bars acquire
open-circuit potentials typically between +100 and -100 mV SCE. Wheat and Eliezer,28
and Arup31
suggested that the range for steel passivity in aerated concrete lies between +100 and
-200 mV SCE. Therefore, bars in uncracked beams had passive behavior for an initial period (8 months to
3 years) before becoming anodic. The large, sudden drop in potential indicated the arrival of chloride ions
at the steel surface. The absence of cracks delayed corrosion initiation because chlorides had to diffuse
through the concrete and build up in sufficient amounts at exposed metal on the bar surface. Once high
enough chloride contents were reached, the steel depassivated and corrosion started. As more chlorides
accumulated at the bar surface, metal dissociation was enhanced. Examination of bar surface conditions
from uncracked beams after one year and 4.3 years of exposure confirmed this hypothesis.
The initial potentials for all cracked beams ranged between approximately -50 and -500 mV SCE. The
cause of the different initial potential values is usually attributed to early contact of steel with chlorides
penetrating through the cracks. Corrosion potentials for cracked unloaded beams decreased to -500 to
-600 mV SCE within 6 months or less, and potentials for cracked, loaded beams dropped to the same
level within 3 months. The presence of cracks made large amounts of chloride readily available to
depassivate the steel in a short time. The potentials also tended to be slightly more negative at crack
locations relative to adjacent uncracked concrete even away from the exposure area, i.e. chloride zone.
This variation in steel potential may be caused by concrete carbonation which can easily reach the steel
surface at crack locations causing a potential shift. Lehmann32
suggested that when carbonation of
concrete is prevalent, the potential of corroded and noncorroded sites may shift electronegatively as much
as 100 mV. Direct contact of steel with chlorides at crack locations in the exposure area caused an
immediate shift of potential to more negative values. Beams including patched bar ends in splice zones
exhibited large, early drops indicating quick breakdown of the patching material.
The mechanism by which the half-cell potential of iron/ferrous ion Fe/Fe+2 shifts to a more negative value
is related to chloride reaction with ferrous ions produced by corrosion.33
When ferrous ion concentration is
lowered, further iron oxidation commences. Hence, potential shifts to more negative values are indicative
of operational corrosion cells and not necessarily of more rust or ferrous ion accumulation. Consequently,
the same potential may have been reached whether corrosion was confined to a minute holiday or spread
over a large surface area. Therefore, highly negative potentials should not be construed as definite
indicators of significant corrosion.
Potential drops were sometimes followed by fluctuations in the potential, which could be related to
unsteady conditions associated with the transition of steel from a passive to an active state
(depassivation). During the period of potential fluctuation, the corrosion process was controlled by the
amount of chloride ions available and the rate of oxygen reduction. Lack of both oxygen and available

98
surfaces for oxygen reduction limited the cathodic reaction and slowed down the dissociation process,
particularly for as-received bars. If measurements of corrosion potentials were taken in the field on
structures undergoing similar potential fluctuations, the results would be highly inconsistent: Corrosion
may or may not be found! That is why single potential measurements may not be useful. Potential
monitoring needs to be carried out over some time to establish a clear trend.
After an initial or delayed potential drop, or fluctuations, the potential stabilized and remained steady with
time. The potential varied consistently within a narrow range of highly negative values which indicated
that active conditions persisted for the remainder of the test. Corrosion progression in this situation was
almost certain. Sufficient chloride ions were available to maintain activity. The final potentials for the
majority of beams ranged from -500 to -600 mV SCE.
The range of final potentials agrees very well with that presented by Wheat and Eliezer,28
for general
corrosion due to loss of passivity which is -450 to -600 mV. Sagüés2
also measured potentials in the range
of -350 to -475 mV SCE after almost 300 days of exposure of uncracked columns containing coated bars.
Furthermore, the measured half-cell potentials generally agree with previous observations by Hededahl
and Manning,34
that the vast majority of readings were more negative than -200 mV SCE, and a
significant number of readings were more negative than -350 mV.
Zayed and Sagüés21
reported a similar trend of measured open-circuit potentials on damaged epoxy-coated
bars embedded in concrete and subjected to salt solution. For uncracked concrete specimens, the
potentials dropped suddenly over 150 to 250 mV after some time of exposure. The potentials then tended
to fluctuate before stabilizing near a low value of -400 mV. The initial potentials were typically between
-100 and -250 mV. For cracked concrete specimens, the initial potentials were more negative than for
uncracked specimens ranging between -150 and -450 mV. Some potentials, after moderate fluctuations,
stabilized in the -350 to -400 mV range.
Erdogdu and Bremner19
also obtained similar thermodynamic behavior after measuring open-circuit
potentials of coated and uncoated bars in uncracked concrete for two years. The first potential drop for
coated bars occurred at times equal to or larger than those encountered for uncoated bar specimens. After
that, potentials fluctuated and reached a more steady value till the end of the test. Initially undamaged
bars exhibited potentials in the low negative range as they remained passive. Some initial potential
readings were highly negative. The most notable conclusion of the above test was that practically no
difference existed between the behavior of coated bars with 1% or 2% damaged surface area.
Due to hydrolysis, the localized lower pH of solution within an active pit encourages further corrosion at
the available potential level.35
This phenomenon explains why corrosion progression and pitting continued
on some bars at a stable half-cell potential between -315 and -650 mV SCE. Wheat and Eliezer,28
and
Arup31
also indicated that pitting condition resulting from chlorides is associated with -200 to -500 mV
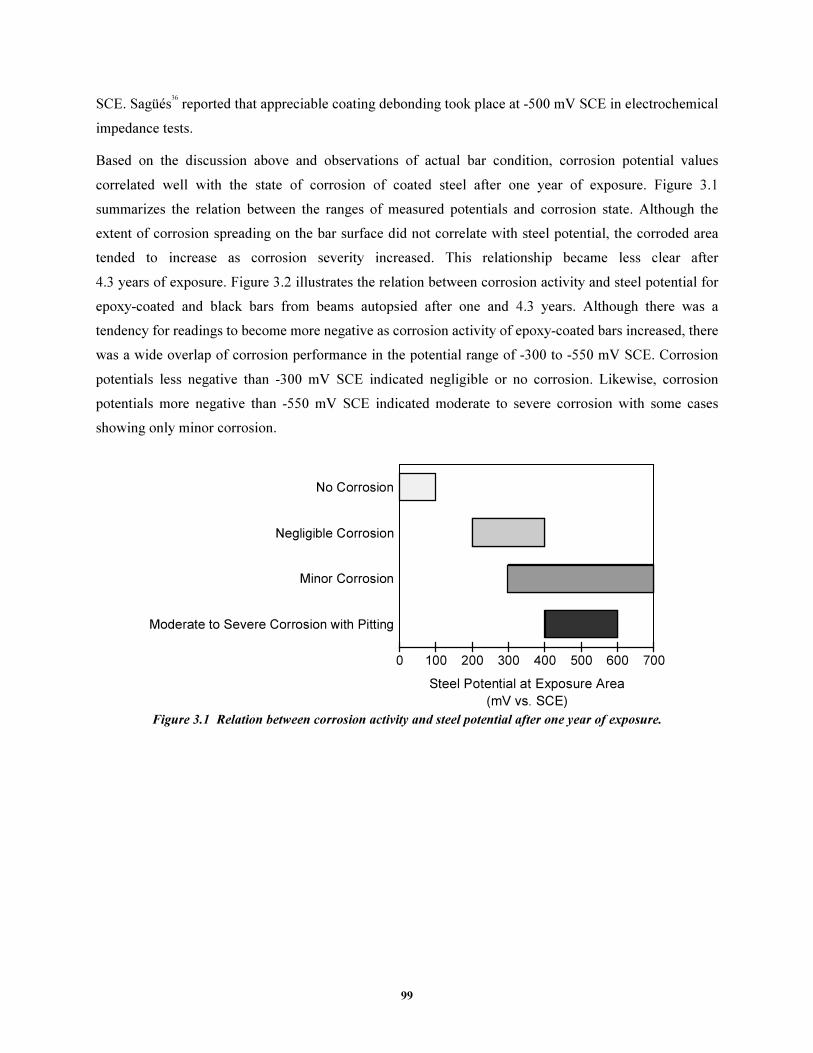
99
SCE. Sagüés36
reported that appreciable coating debonding took place at -500 mV SCE in electrochemical
impedance tests.
Based on the discussion above and observations of actual bar condition, corrosion potential values
correlated well with the state of corrosion of coated steel after one year of exposure. Figure 3.1
summarizes the relation between the ranges of measured potentials and corrosion state. Although the
extent of corrosion spreading on the bar surface did not correlate with steel potential, the corroded area
tended to increase as corrosion severity increased. This relationship became less clear after
4.3 years of exposure. Figure 3.2 illustrates the relation between corrosion activity and steel potential for
epoxy-coated and black bars from beams autopsied after one and 4.3 years. Although there was a
tendency for readings to become more negative as corrosion activity of epoxy-coated bars increased, there
was a wide overlap of corrosion performance in the potential range of -300 to -550 mV SCE. Corrosion
potentials less negative than -300 mV SCE indicated negligible or no corrosion. Likewise, corrosion
potentials more negative than -550 mV SCE indicated moderate to severe corrosion with some cases
showing only minor corrosion.
No Corrosion
Negligible Corrosion
Minor Corrosion
Moderate to Severe Corrosion with Pitting
0 100 200 300 400 500 600 700
Steel Potential at Exposure Area
(mV vs. SCE) Figure 3.1 Relation between corrosion activity and steel potential after one year of exposure.

100
-700-600-500-400-300-200-1000
Corrosion Potential (mV SCE)
NO CORROSION
MINOR CORROSION
MODERATE TO SEVERE CORROSION
WITH PITTING
NEGLIGIBLE CORROSION
(a) Epoxy-Coated Bars
-700-600-500-400-300-200-1000
Corrosion Potential (mV SCE)
NO CORROSION
MINOR CORROSION
MODERATE TO SEVERE
CORROSION WITH PITTING
NO CORROSION* *Excluding 2 bars with
most negative
t ti l
(b) Black bars
Figure 3.2 Relation between corrosion activity and steel potential from tests in this study (beams autopsied after one and 4.3 years of exposure).
For black bars, the overlap of bars with varying corrosion performance was in the potential range of
-255 to -535 mV SCE. However, if the two bars showing the most negative potentials in uncorroded
zones are excluded, the overlap drastically reduces [see Figure 3.2(b)]. In this case, corrosion potentials
less negative than -300 mV SCE correlated with either minor or no corrosion. Corrosion potentials in the
range of -370 to -575 mV SCE were associated with moderate to severe corrosion.
As a reference, the ASTM C876 criterion for interpreting corrosion potentials of uncoated steel in
concrete is as follows: Potentials more negative than -273 mV SCE (-350 mV CSE) indicate a high
probability of corrosion. Potentials more positive than -123 mV SCE (-200 mV CSE) indicate a high
probability of no corrosion. Potentials in the range of -123 mV to -273 mV SCE indicate uncertainty of
corrosion.

101
While corrosion potentials may be helpful in detecting state of corrosion, they need to be measured using
a closely spaced grid on the concrete surface to detect the exact location of corrosion activity. Notice that
some potentials outside the exposure area where corrosion primarily took place were in the high negative
range of around -400 mV for example and yet no corrosion was found on the steel at these measurement
points. Therefore, highly negative potentials may indicate corrosion activity close to measurement sites,
say within 0.5 to 1.0 m (around 2 to 3ft.).
3.3.3 Corrosion Potential Differences
Since a drop in potential marks a site of possible localized corrosion activity in the vicinity, other
parameters were sought to better identify the corrosion state. Experience with uncoated reinforcing bars
has shown that dependence on half-cell potentials alone to locate corroded areas was not always reliable
when following the ASTM C87617
assessment criteria. In addition, previous studies have indicated that
the electrical potential of an anode cannot be used to indicate rate of corrosion.
Elsener and Böhni16
found that the local potential gradient was a better way to identify the type of
corrosion and to locate corroding sites. Likewise, Clear and Virmani37
suggested that the difference in
anode and cathode potentials was the more important indicator of corrosion activity. Therefore, it is the
potential difference between the anode and the cathode, not the magnitude of the anode potential, that
relates to corrosion rate. It follows that corrosion severity can be assessed in relation to the difference in
potentials. ACI 222-9638
agrees and states that the larger the potential difference, the higher the corrosion
rate.
A change in potential along a bar creates galvanic cells, with the corrosion occurring at the sites
exhibiting higher negative potentials. In effect, a potential drop protects the adjacent noncorroded steel
surface which predominantly behaves as a cathode. Large differences of potentials along a concrete
member may, then, be used as indicators of macrocell formations.29
Lehmann32
suggested that a difference of 200 mV or more between sites in proximity, within 0.15 to
0.3 m (6 to 12in.), could be indicative of corrosion activity. However, in the field, the potential
differences between anodes and cathodes usually vary between 20 and 500 mV, depending on chloride
content, oxygen concentration, and concrete chemistry. Arup31
suggested that high potential gradients on
potential maps are indicative of pitting corrosion of uncoated steel. High negative potentials typically
-450 to -600 mV SCE without steep gradients are more indicative of general corrosion. Studies have
shown that potential differences rarely exceed 100 mV when corrosion was not active or at extremely low
activity.38
On the other hand, significant corrosion was commonly associated with potential differences
over 200 mV.
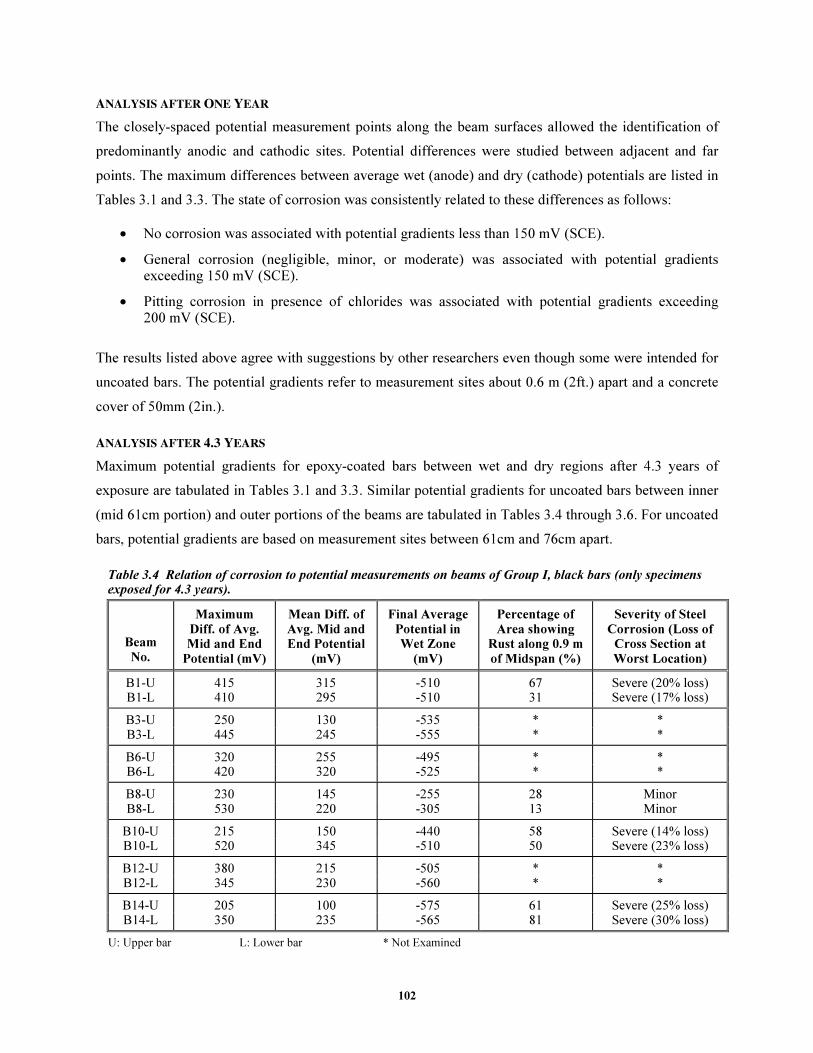
102
��������������������
The closely-spaced potential measurement points along the beam surfaces allowed the identification of
predominantly anodic and cathodic sites. Potential differences were studied between adjacent and far
points. The maximum differences between average wet (anode) and dry (cathode) potentials are listed in
Tables 3.1 and 3.3. The state of corrosion was consistently related to these differences as follows:
• No corrosion was associated with potential gradients less than 150 mV (SCE).
• General corrosion (negligible, minor, or moderate) was associated with potential gradients exceeding 150 mV (SCE).
• Pitting corrosion in presence of chlorides was associated with potential gradients exceeding 200 mV (SCE).
The results listed above agree with suggestions by other researchers even though some were intended for
uncoated bars. The potential gradients refer to measurement sites about 0.6 m (2ft.) apart and a concrete
cover of 50mm (2in.).
����������������������
Maximum potential gradients for epoxy-coated bars between wet and dry regions after 4.3 years of
exposure are tabulated in Tables 3.1 and 3.3. Similar potential gradients for uncoated bars between inner
(mid 61cm portion) and outer portions of the beams are tabulated in Tables 3.4 through 3.6. For uncoated
bars, potential gradients are based on measurement sites between 61cm and 76cm apart.
Table 3.4 Relation of corrosion to potential measurements on beams of Group I, black bars (only specimens exposed for 4.3 years).
Beam
No.
Maximum
Diff. of Avg. Mid and End
Potential (mV)
Mean Diff. of
Avg. Mid and End Potential
(mV)
Final Average
Potential in Wet Zone
(mV)
Percentage of
Area showing Rust along 0.9 m
of Midspan (%)
Severity of Steel
Corrosion (Loss of Cross Section at
Worst Location)
B1-U 415 315 -510 67 Severe (20% loss) B1-L 410 295 -510 31 Severe (17% loss)
B3-U 250 130 -535 * * B3-L 445 245 -555 * *
B6-U 320 255 -495 * * B6-L 420 320 -525 * *
B8-U 230 145 -255 28 Minor B8-L 530 220 -305 13 Minor
B10-U 215 150 -440 58 Severe (14% loss) B10-L 520 345 -510 50 Severe (23% loss)
B12-U 380 215 -505 * * B12-L 345 230 -560 * *
B14-U 205 100 -575 61 Severe (25% loss) B14-L 350 235 -565 81 Severe (30% loss)
U: Upper bar L: Lower bar * Not Examined

103
Table 3.5 Relation of corrosion to potential measurements on beams of Group II, black bars (only specimens exposed for 4.3 years).
Beam
No.
Maximum
Diff. of Avg. Mid and End
Potential (mV)
Mean Diff. of
Avg. Mid and End Potential
(mV)
Final Average
Potential in Wet Zone
(mV)
Percentage of
Area showing Rust along 0.9m of Midspan (%)
Severity of Steel
Corrosion (Loss of Cross Section at Worst
Location)
B15-U 325 180 -355 39 Severe (11% loss) B15-L 435 270 -465 42 Severe (11% loss)
B17-U 400 335 -415 50 Very severe (40% loss) B17-L 335 180 -370 56 Severe (21% loss)
B19-U 425 310 -540 * *
B19-L 405 255 -390 * *
B22-U 455 290 -435 56 Severe (19% loss)
B22-L 510 295 -540 72 Severe (14% loss)
B23-U 300 195 -245 22 Severe (30% loss)
B23-L 380 280 -410 36 Very Severe (55% loss)
B25-U 350 215 -425 47 Very Severe (63% loss)
B25-L 455 345 -500 28 Severe (38% loss)
B27-U 340 280 -450 25 Very Severe (65% loss)
B27-L 485 360 -505 50 Very Severe (78% loss)
U: Upper bar L: Lower bar * Not examined
Table 3.6 Relation of corrosion to potential measurements on beams of Group III, black bars (only specimens exposed for 4.3 years).
Beam No.
Maximum Diff. of Avg. Mid and End
Potential (mV)
Mean Diff. of Avg. Mid and End Potential
(mV)
Final Average Potential in Wet Zone
(mV)
Percentage of Area showing
Rust along 0.9m of Midspan (%)
Severity of Steel Corrosion
B30-U 175 60 -570 * * B30-L 310 190 -565 * *
B32-U 480 360 -545 61 Severe (32% loss) B32-L 655 420 -560 61 Severe (32% loss)
B34-U 345 290 -550 * * B34-L 490 405 -545 * *
U: Upper bar L: Lower bar * Not Examined
From Tables 3.1 and 3.3, the degree of corrosion activity of epoxy-coated bars can not be clearly
correlated with ranges of maximum or average potential differences. Longitudinal bars with negligible
corrosion activity had a range of maximum potential differences between 250 to 330 mV SCE. Bars with
minor to moderate corrosion had a range of maximum potential differences of 150 to 400 mV SCE.
A similar situation occurs with uncoated bars. The only two bars with minor corrosion had maximum
potential gradients of 230 and 530 mV SCE. The rest of the uncoated bars (20) experienced severe
corrosion with deep pits and areas with appreciable loss of cross section. The range of maximum potential
gradient for bars with severe corrosion was 205 to 655 mV SCE.
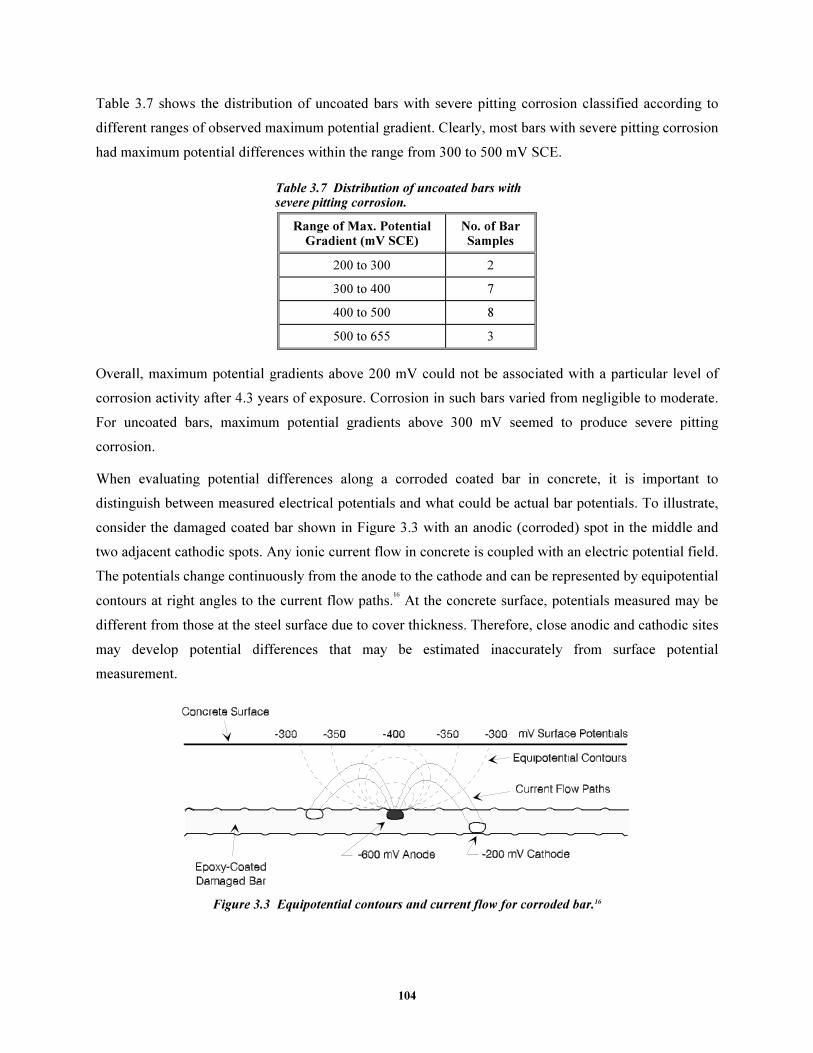
104
Table 3.7 shows the distribution of uncoated bars with severe pitting corrosion classified according to
different ranges of observed maximum potential gradient. Clearly, most bars with severe pitting corrosion
had maximum potential differences within the range from 300 to 500 mV SCE.
Table 3.7 Distribution of uncoated bars with severe pitting corrosion.
Range of Max. Potential Gradient (mV SCE)
No. of Bar Samples
200 to 300 2
300 to 400 7
400 to 500 8
500 to 655 3
Overall, maximum potential gradients above 200 mV could not be associated with a particular level of
corrosion activity after 4.3 years of exposure. Corrosion in such bars varied from negligible to moderate.
For uncoated bars, maximum potential gradients above 300 mV seemed to produce severe pitting
corrosion.
When evaluating potential differences along a corroded coated bar in concrete, it is important to
distinguish between measured electrical potentials and what could be actual bar potentials. To illustrate,
consider the damaged coated bar shown in Figure 3.3 with an anodic (corroded) spot in the middle and
two adjacent cathodic spots. Any ionic current flow in concrete is coupled with an electric potential field.
The potentials change continuously from the anode to the cathode and can be represented by equipotential
contours at right angles to the current flow paths.16
At the concrete surface, potentials measured may be
different from those at the steel surface due to cover thickness. Therefore, close anodic and cathodic sites
may develop potential differences that may be estimated inaccurately from surface potential
measurement.
Figure 3.3 Equipotential contours and current flow for corroded bar.16
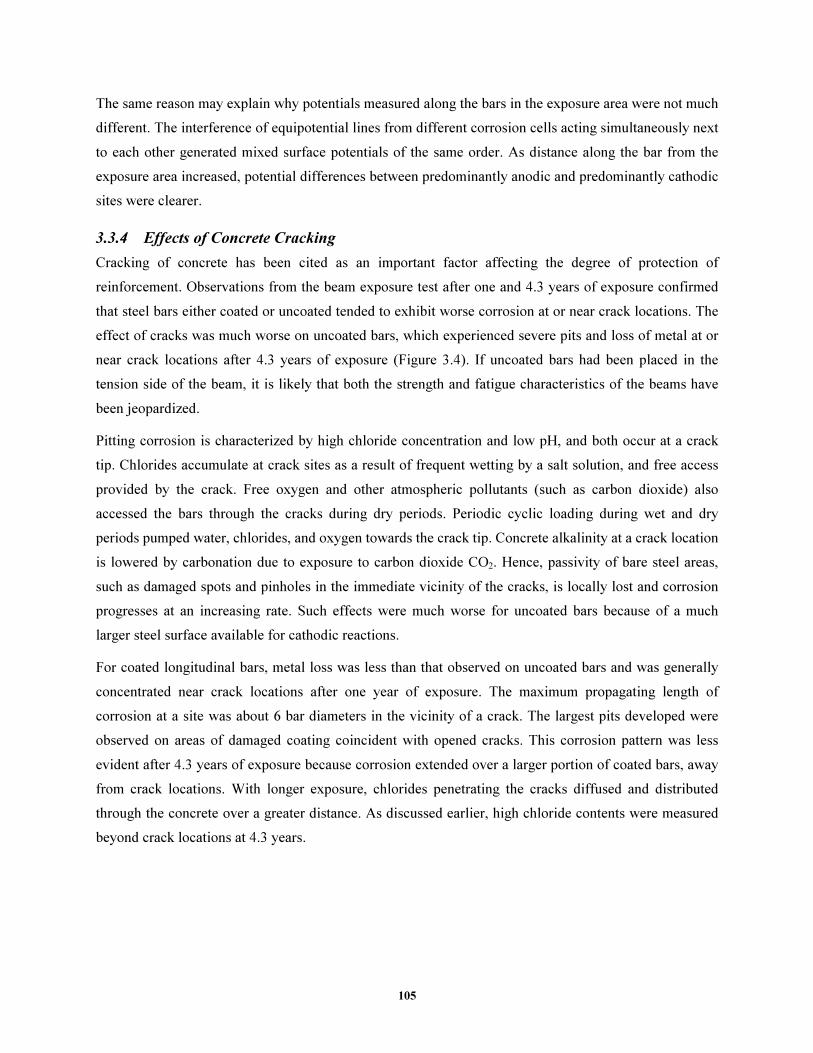
105
The same reason may explain why potentials measured along the bars in the exposure area were not much
different. The interference of equipotential lines from different corrosion cells acting simultaneously next
to each other generated mixed surface potentials of the same order. As distance along the bar from the
exposure area increased, potential differences between predominantly anodic and predominantly cathodic
sites were clearer.
3.3.4 Effects of Concrete Cracking
Cracking of concrete has been cited as an important factor affecting the degree of protection of
reinforcement. Observations from the beam exposure test after one and 4.3 years of exposure confirmed
that steel bars either coated or uncoated tended to exhibit worse corrosion at or near crack locations. The
effect of cracks was much worse on uncoated bars, which experienced severe pits and loss of metal at or
near crack locations after 4.3 years of exposure (Figure 3.4). If uncoated bars had been placed in the
tension side of the beam, it is likely that both the strength and fatigue characteristics of the beams have
been jeopardized.
Pitting corrosion is characterized by high chloride concentration and low pH, and both occur at a crack
tip. Chlorides accumulate at crack sites as a result of frequent wetting by a salt solution, and free access
provided by the crack. Free oxygen and other atmospheric pollutants (such as carbon dioxide) also
accessed the bars through the cracks during dry periods. Periodic cyclic loading during wet and dry
periods pumped water, chlorides, and oxygen towards the crack tip. Concrete alkalinity at a crack location
is lowered by carbonation due to exposure to carbon dioxide CO2. Hence, passivity of bare steel areas,
such as damaged spots and pinholes in the immediate vicinity of the cracks, is locally lost and corrosion
progresses at an increasing rate. Such effects were much worse for uncoated bars because of a much
larger steel surface available for cathodic reactions.
For coated longitudinal bars, metal loss was less than that observed on uncoated bars and was generally
concentrated near crack locations after one year of exposure. The maximum propagating length of
corrosion at a site was about 6 bar diameters in the vicinity of a crack. The largest pits developed were
observed on areas of damaged coating coincident with opened cracks. This corrosion pattern was less
evident after 4.3 years of exposure because corrosion extended over a larger portion of coated bars, away
from crack locations. With longer exposure, chlorides penetrating the cracks diffused and distributed
through the concrete over a greater distance. As discussed earlier, high chloride contents were measured
beyond crack locations at 4.3 years.
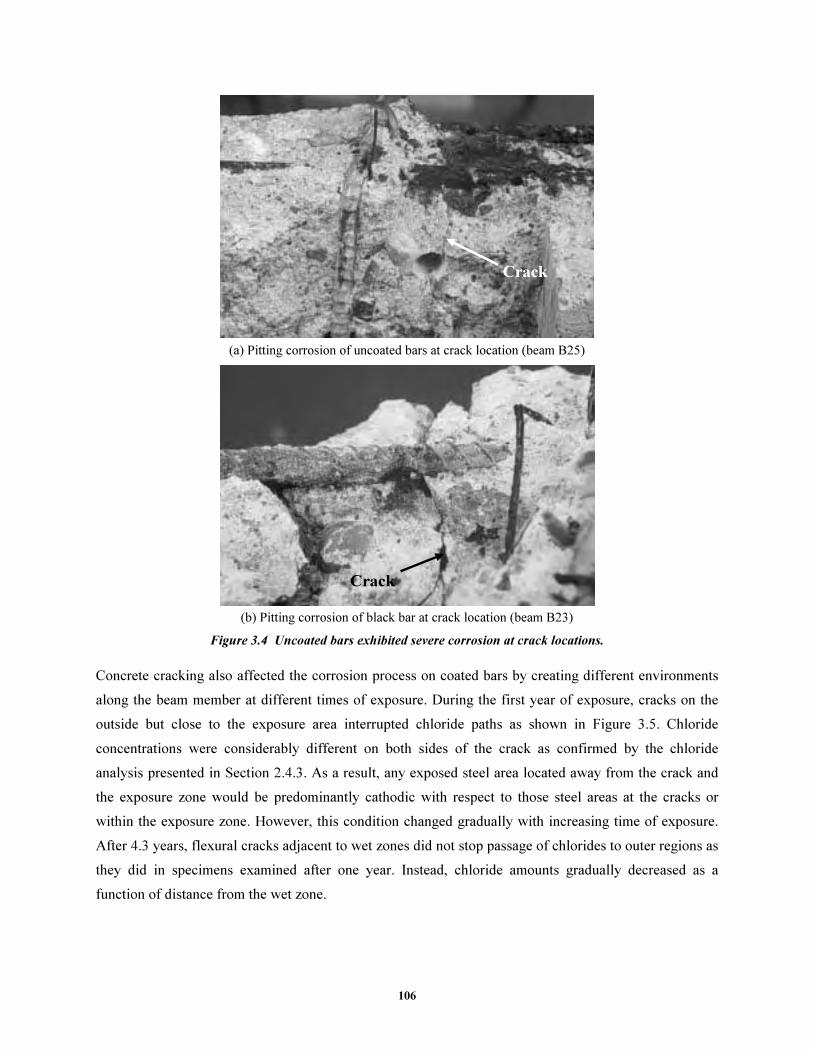
106
Crack
(a) Pitting corrosion of uncoated bars at crack location (beam B25)
Crack
(b) Pitting corrosion of black bar at crack location (beam B23)
Figure 3.4 Uncoated bars exhibited severe corrosion at crack locations.
Concrete cracking also affected the corrosion process on coated bars by creating different environments
along the beam member at different times of exposure. During the first year of exposure, cracks on the
outside but close to the exposure area interrupted chloride paths as shown in Figure 3.5. Chloride
concentrations were considerably different on both sides of the crack as confirmed by the chloride
analysis presented in Section 2.4.3. As a result, any exposed steel area located away from the crack and
the exposure zone would be predominantly cathodic with respect to those steel areas at the cracks or
within the exposure zone. However, this condition changed gradually with increasing time of exposure.
After 4.3 years, flexural cracks adjacent to wet zones did not stop passage of chlorides to outer regions as
they did in specimens examined after one year. Instead, chloride amounts gradually decreased as a
function of distance from the wet zone.
107
CL
Chloride SolutionChlorides
Corroded Steel AreasExposed Steel Areas
Damaged Coated Bar
Exposure Area
Cracked Beam
Interruption of
Chloride Path
Figure 3.5 Anode-cathode development on longitudinal bar with variable chloride contamination in cracked beam.
Several longitudinal coated bars did not experience corrosion on some damaged sites (patched or
unpatched), even when located near crack locations within the wetted zone (Figure 3.6). The steel surface
beneath the coating around such locations was mottled. It seemed that some damage sites near crack
locations remained passive while other damaged sites tended to become anodically polarized. Cathodic
polarization may have protected damaged sites near cracks from active corrosion. Strangely enough,
surrounding concrete at such spots was often porous and with many voids (Figure 3.7).
The crack width may have had some influence on the phenomenon described above. For instance, in
beam B14, corrosion occurred primarily around the widest crack (average width of 0.175mm). However,
the situation in beam B10 was less clear. At one crack near the left edge of the wet region, the damaged
spot on top bar did not corrode but corrosion occurred on the bottom bar. The opposite was true for the
crack at midspan. Both cracks seemed to be wider near the bottom surface of the beam.
The worst corrosive conditions in the test among coated bars were those associated with coated stirrups
lying in the plane of transverse cracks. Corrosion progression and coating debonding were extensive. It is
believed that exposure to excessive amounts of chlorides for extended periods and macrocell formation on
the stirrups eventually led to corrosion initiation and breakdown of coating.
The uncoated compression bars recovered from tested beams exhibited significant pitting and substantial
metal loss at or near transverse crack locations, frequently around contact points with coated stirrups,
after one and 4.3 years of exposure. Chloride ions were transported through the cracks to the uncoated
reinforcement. Corrosion initiated and spread along the bar to a length equivalent to about 8 bar diameters
after one year of exposure. Poston5
also reported corrosion spreading over a distance as much as 6 to 10
bar diameters on uncoated reinforcement. Data cited in the literature show that, for cracks perpendicular
to the reinforcing bars, the corroded length of intercepted bars is likely to be more than 3 bar diameters.38
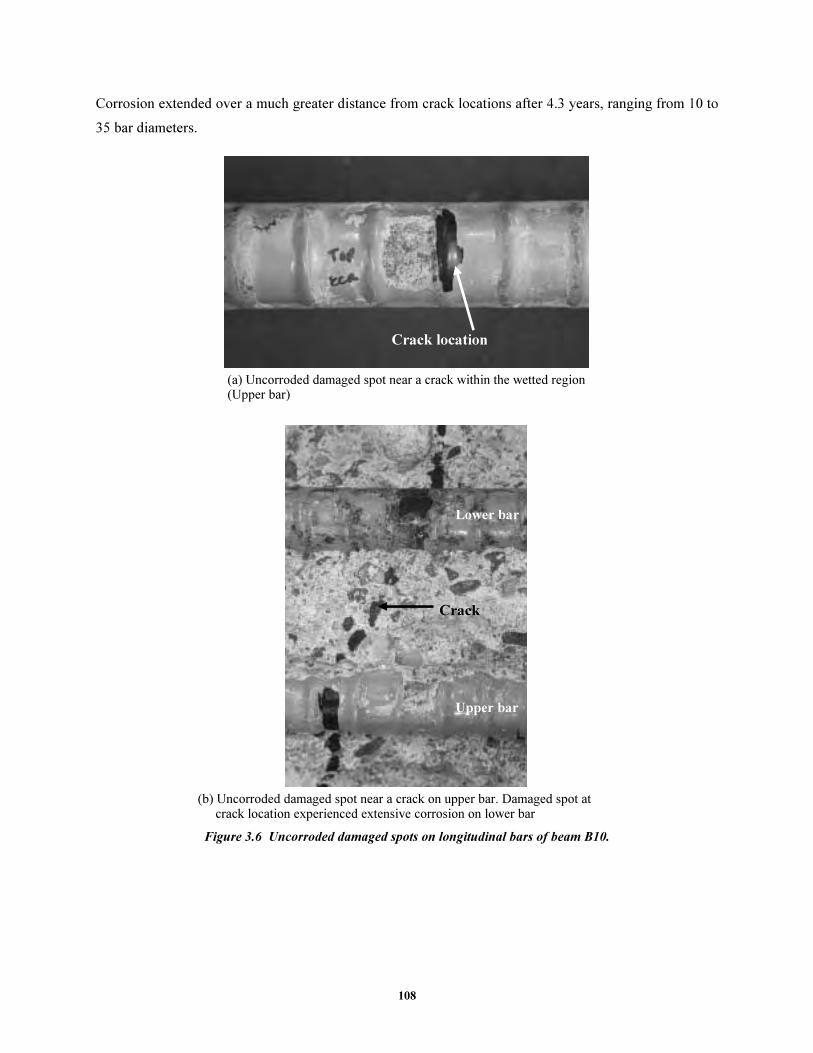
108
Corrosion extended over a much greater distance from crack locations after 4.3 years, ranging from 10 to
35 bar diameters.
Crack location
(a) Uncorroded damaged spot near a crack within the wetted region (Upper bar)
Lower bar
Upper bar
Crack
(b) Uncorroded damaged spot near a crack on upper bar. Damaged spot at
crack location experienced extensive corrosion on lower bar
Figure 3.6 Uncorroded damaged spots on longitudinal bars of beam B10.

109
Damaged spot location
(a) Concrete surrounding uncorroded damaged spot outside the wetted region
Damaged spot location
(b) Concrete surrounding uncorroded damaged spot within the wetted region
Figure 3.7 Concrete surrounding uncorroded damaged spots (Upper bar of beam B10).
Interestingly, uncoated bars in beams from group I (longitudinal bars) underwent less severe pitting than
uncoated bars in beams from groups II and III (stirrups and splice bars) after 4.3 years. Pits in uncoated
bars from groups II and III were very deep and produced significant loss of cross-sectional area
(Figures 3.8 and 3.9). Several factors may have contributed to this phenomenon. First, a larger area on the
beam surface (twice as large) was exposed to chloride solution in beams from group I. Second, several
cracks (from two to four) were enclosed within the wetted, exposed surface of beams in group I, while
one crack only (sometimes two) was enclosed within the exposed areas of beams in groups II and III. In
addition, cracks in group II beams were wider (0.15 to 0.35mm) than those in group I beams (0.08 to
0.20mm). Therefore, uncoated bars from beams in group I were exposed to chlorides and moisture over a
larger portion compared to uncoated bars from groups II and III. A smaller surface area of bar tended to

110
be polarized and to become anodic in black bars from beam in groups II and III. Portions of the bar
adjacent to anodic areas became cathodic. In consequence, uncoated bars from beam groups II and III
tended to have a smaller anode and larger cathode, that is, a more unfavorable (smaller) anode/cathode
ratio compared with bars from beam group I. The resulting driving force for corrosion was larger for
uncoated bars from beam groups II and III.
(a) View immediately after autopsy
(b) Another view after autopsy
Figure 3.8 Severe pitting corrosion of uncoated bars at crack location (beam B27).

111
Figure 3.9 Pitting corrosion of uncoated bars at crack location (beam B25).
A secondary phenomenon also may have accounted for the more severe corrosion of black bars from
beams in groups II and III. As was described at the beginning of this chapter, group I included beams
where the stirrups were shielded inside plastic tubes. Any incidental continuity with uncoated bars was
thus prevented. In group II beams, the stirrup was monitored and was not shielded. Unlike longitudinal
coated bars, uncoated bars were not shielded at their middle portion, so any incidental continuity with the
stirrup was not prevented. In addition, epoxy coating was damaged at the ribs on the inside of stirrup
corners near uncoated bars. A similar situation occurred in beam group III, where no bar was shielded.
Although it is not certain that electrical continuity between stirrups and uncoated bars was established, it
may have contributed to the macrocell corrosion of uncoated bars. Examination of the inside corners of
stirrups near uncoated bars showed rust staining on the coating surface that originated from the uncoated
bars. Such rust products could have bridged the metallic surfaces of the uncoated bars and stirrups
through nicks in the coating. Examination of the metallic surface beneath the coating at the inside corners
of the stirrups revealed a mottled surface with almost no corrosion. Any point of contact with corroding
uncoated bars tended to become cathodic with respect to the anodic uncoated bars. The surface at the
outside corners of a stirrup showed dark corrosion with shallow pitting in some cases, indicating that a
local corrosion cell between the inside and outside stirrup surfaces was triggered as well.
3.3.5 Effects of Chloride Concentrations
Satake et al.3
suggested that when a crack is produced in a concrete element, the amounts of water, air,
and other corrosive elements going into the element are proportional to the width of the crack. The
progress of corrosion was related to wide cracks in the order of 0.15 to 0.5mm (0.06 to 0.02in.). In the
beam exposure study, the difference in chloride concentration at crack locations between unloaded and
loaded beams was not significant at the end of one and 4.3 years of exposure. In both cases, however, the

112
chloride content was more than an order of magnitude higher than the level usually associated with
corrosion initiation of uncoated bars.
Uneven chloride distribution along the coated bar was probably the most significant factor affecting the
development of corrosion cells. Initially and after one year of exposure, it was clear that chloride
concentrations around longitudinal bars were substantially different between cracked and uncracked
locations and where cracks interrupted the paths as described in the previous section. Similarly, different
chloride concentrations were noted between the top and the lower part of the stirrup, and between the
front part (within the exposure area in the tension zone) and back part (in the compression zone). These
uneven distributions of chloride ions were expected to cause potential differences between the various
parts of reinforcement. However, differences in chloride concentration decreased significantly after
4.3 years of exposure, and chloride distribution inside the beam became more evenly distributed. Since
corrosion cells were well established at later stages, the more even distribution of chlorides along the bars
contributed to the propagation of corrosion over a larger surface area of the bar.
At crack locations within the exposure area, chloride concentration at the upper longitudinal bar level was
slightly higher than that at the lower bar level after one year of exposure. The short chloride path between
the top concrete surface exposed to salt solution and the upper bar may have been one contributing factor.
However, chloride concentrations determined at uncracked locations within the exposure area were
opposite to those described above. It is possible that chlorides were accumulating at the lower bar level by
capillary action as the chloride solution was running along the bottom concrete surface before dripping
down into the draining system. In contrast to what was observed at one year, more chloride was
concentrated at the lower bar level than at the higher bar level at both cracked and uncracked locations
after 4.3 years. This situation was similar at uncracked locations, but the opposite at cracked locations
after one year. Besides penetration of chloride solution from the bottom concrete surface by capillary
action, additional chloride solution flowed from the top and front surfaces through the cracks and may
have accumulated at the bottom bars over time. These findings were consistent with observed corrosion
on rebars, where lower longitudinal bars tended to corrode more than upper bars. Likewise, front and
bottom legs of stirrups corroded more than top and back legs.
3.4 CONDITION OF REINFORCING STEEL
3.4.1 Bar Surface Corrosion
Forensic examination of bar specimens, in general, agreed with the analysis of corrosion potential
measurements. No corrosion was observed where potentials were less negative than -100 or -200 mV
SCE, whereas corrosion of variable intensity was found on bars with potentials consistently more
negative than -300 mV SCE.

113
������������� ���������������
Based on visible surface corrosion of steel, coated bars and stirrups exhibited more corrosion in cracked
beams than uncracked beams. The effects of cracks on corrosion spreading along longitudinal bars was
generally limited to 40-60mm (about 1.5–2.5in.) on either side of the crack. For stirrups, the worst
corrosion damage occurred closest to the crack. For illustration, Figure 3.10 shows traces of two legs of a
stirrup in a cracked beam; the stained trace was closer to the crack parallel to the stirrup leg. These
findings suggest that performance of coated bars may be affected significantly by concrete cracking in a
severely corrosive environment.
Figure 3.10 Stirrup trace in concrete adjacent to crack after one year.
In general, corrosion was not much different on bars and stirrups in beams with opened and unopened
cracks. In some cases, there was a slight tendency for bars and stirrups in beams with opened cracks to
exhibit more corrosion. Thus, whether cracks were wide or narrow had less impact on corrosion
performance than whether concrete was cracked or not. It is possible that wider cracks could lead to
worse corrosion than narrow cracks; however, even narrow cracks could cause significant corrosion and
coating debonding. Rostam27
recently indicated that after depassivation, crack widths have little influence
on the corrosion rate.
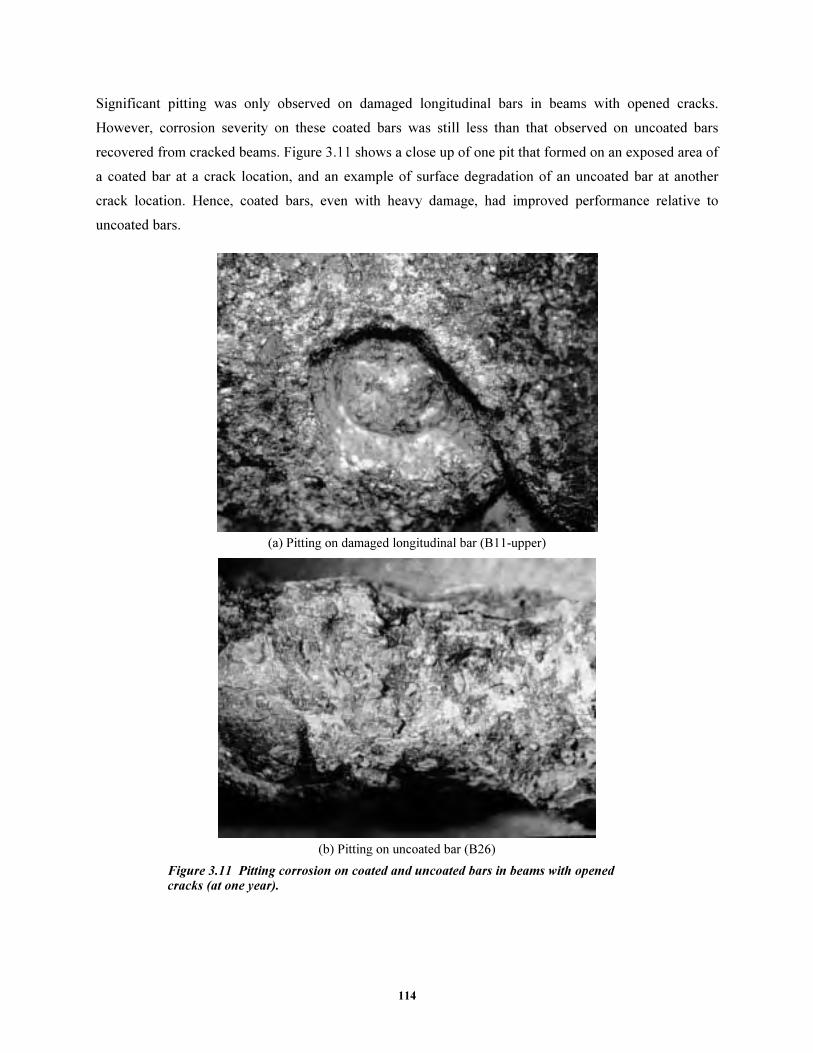
114
Significant pitting was only observed on damaged longitudinal bars in beams with opened cracks.
However, corrosion severity on these coated bars was still less than that observed on uncoated bars
recovered from cracked beams. Figure 3.11 shows a close up of one pit that formed on an exposed area of
a coated bar at a crack location, and an example of surface degradation of an uncoated bar at another
crack location. Hence, coated bars, even with heavy damage, had improved performance relative to
uncoated bars.
(a) Pitting on damaged longitudinal bar (B11-upper)
(b) Pitting on uncoated bar (B26)
Figure 3.11 Pitting corrosion on coated and uncoated bars in beams with opened cracks (at one year).

115
Generally, the coating of stirrups tended to break down along the longitudinal rib as observed on a
number of corroded stirrups. A typical crack in the coating extending along a stirrup leg is shown in
Figure 3.12. The coating on the bar rib is particularly weak.
Figure 3.12 Cracking of coating along stirrup leg.
The undamaged epoxy-coated bars and stirrups in uncracked beams retained their original appearance
with negligible or no corrosion or blistering despite the high chloride content. For these bars, there was no
or very limited loss in coating adhesion to substrate steel. These results indicate that originally intact
epoxy coating can provide adequate protection to reinforcing steel from chloride-induced corrosion.
However, the results were valid for bars embedded in uncracked concrete exposed to chloride
concentrations of about 5-6 kg/m3 (about 8.5-10 lb./yd3) after one year of testing. Corrosion was also
apparent on repaired areas indicating that patching was not effective. Current materials and techniques for
patching require more thorough evaluation.
������������� ����������������
The extent and severity of corrosion of coated bars on and below the epoxy coating is summarized in
Tables A.34 through A.36 of Appendix A. The discussion that follows is based on interpretation of results
from those tables.
The damage condition of the epoxy coating was the most influential factor in the corrosion performance
of the longitudinal bars. Little effect was produced by loading condition and presence of cracks. Patching
coating damage seemed to improve performance by lessening the amount of corrosion. The percentage of
corroded spots decreased with patching. Still, bars in good, as-received condition performed better than
bars with patched damage. Overall, the amount of rust staining on the coating surface of spliced bars was
minimal. Underfilm corrosion in short spliced bars was more extensive than was initially apparent on the

116
coating surface. Evidently, the patched cut end located at a crack location at midspan of the beam
constituted a weak spot where corrosion started and progressed underneath the coating.
Interestingly, bars with 3% damage in uncracked, unloaded beam B8 experienced slightly more corrosion
than bars with similar damage in cracked unloaded beam B10. This was contrary to what was found after
one year of exposure, where corrosion in uncracked, unloaded beams was limited primarily to the
exposed areas and did not spread beneath the coating. The presence of cracks made chlorides readily
available to the bar surface in the early stages of exposure. In uncracked beams, chlorides penetrated by
diffusion through the concrete, and levels sufficient to cause corrosion were eventually reached as
evidenced by the significantly greater amounts of chloride after 4.3 years compared to those after 1 year.
Chloride content at the location of the upper bar in the wet zone was 0.09% by weight of concrete after
one year of exposure (beam B7), and about 0.52% by weight of concrete after 4.3 years of exposure
(beam B8).
As-received stirrups underwent the most extensive rust staining among coated bars. Underfilm corrosion
spread throughout most stirrup legs and ranged from 48% to 93% of the stirrup surface. Damaged and
patched stirrups experienced slightly more surface staining than as-received and patched stirrups. The
stirrup in the uncracked beam underwent more extensive staining than stirrups in cracked beams. If the
percentage of pitted surface is considered as the most important indicator to evaluate corrosion
performance, stirrups can be classified from best to worst as indicated in Table 3.8.
Table 3.8 Stirrup performance ranked by amount of pitted surface.
Beam No. Pitted
Surface*
B23-ST-CU-AR(P) 4%
B22-ST-UU-AR(P) 14%
B27-ST-CU-D(P) 15%
B25-ST-CL-AR(P) 20%
B15-ST-UU-AR: 26%
B32-SP-CU-D(P) 26%
B17-ST-CU-AR: 27%
*Pit depth ≥ 0.3mm
From Table 3.8, patched stirrups performed better than as-received stirrups. After 4.3 years of exposure,
the concrete crack condition was not the most significant factor influencing the corrosion performance of
coated stirrups, although loading seemed to have some effect.
117
The trends described above contrasted with those observed after one year of exposure. Stirrups in cracked
beams experienced more widespread coating debonding and underfilm corrosion than stirrups in
uncracked beams after one year. Clearly, a longer period of chloride exposure allowed for the diffusion
and build up of chlorides to initiate corrosion at coated stirrups in uncracked beams. The absence of
cracks, therefore, delayed but did not prevent the accumulation of significant amounts of chlorides at bar
locations. Chloride contents at bar locations in cracked and uncracked beams were very similar after
4.3 years of exposure, as was discussed in Section 2.4.3 (see Table 2.10).
3.4.2 Coating Adhesion to Steel
������������� ���������������
The severe testing conditions for both coated bars and stirrups resulted in significant loss of coating
adhesion to steel. Coating debonding occurred around all corroded sites and damaged spots even those
remote from the exposure area. The extent of debonding around the damaged spots was larger in cracked
beams than uncracked beams.
Several factors may have contributed to coating debonding: a) The presence of moisture may have caused
adhesion loss due to water penetration, b) cathodic disbondment at portions contiguous to corroded areas,
and/or c) adhesion loss due to progression of underfilm corrosion, also termed oxide lifting or anodic
debonding. These mechanisms of adhesion loss are discussed in greater detail in Research Reports
1265-323
and 1265-6.39
Loss of adhesion associated with bright steel substrate around damaged spots indicated conditions of
cathodic debonding. The increased area of debonding with cracking further signified this type of
debonding because oxygen had greater access to steel through the cracks.
As expected, coating debonding around corroded sites was more apparent on the bar side facing the
concrete surface on the short side of beam. This type of debonding associated with underfilm corrosion
indicated conditions of anodic debonding. Hence, both anodic and cathodic conditions prevailed along the
damaged longitudinal bars.
The straight portions of stirrups initially had stronger coating adhesion than the bent portions. However,
all portions exhibited significant debonding after one year of exposure, particularly in cracked beams. The
underlying steel sometimes remained bright, sometimes darkened, and sometimes corroded. These
observations again indicate mixed conditions of anodic and cathodic debonding.
Figure 3.13 shows the average amounts of debonding on longitudinal bars and stirrups with different
damage levels and under various loading conditions. Coating debonding on longitudinal bars increased
when beams were cracked and coating was significantly damaged prior to testing. The results were not
much different between cracked unloaded and cracked loaded beams. Coating debonding on stirrups,
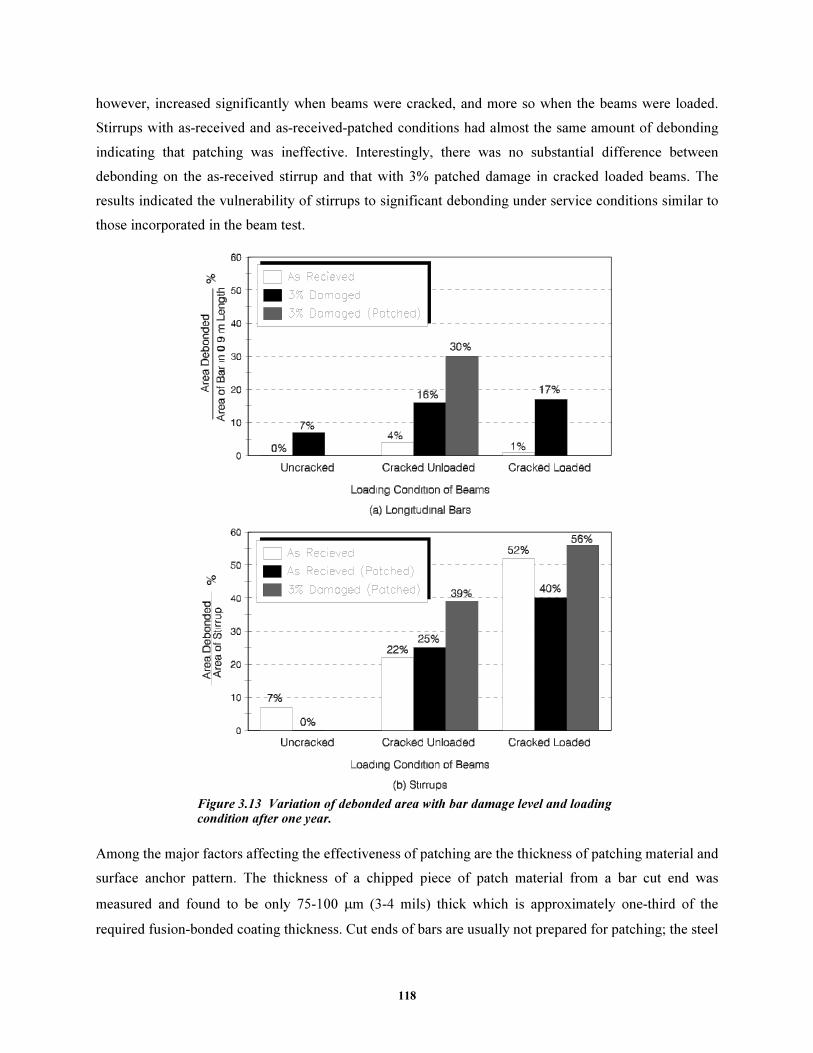
118
however, increased significantly when beams were cracked, and more so when the beams were loaded.
Stirrups with as-received and as-received-patched conditions had almost the same amount of debonding
indicating that patching was ineffective. Interestingly, there was no substantial difference between
debonding on the as-received stirrup and that with 3% patched damage in cracked loaded beams. The
results indicated the vulnerability of stirrups to significant debonding under service conditions similar to
those incorporated in the beam test.
Figure 3.13 Variation of debonded area with bar damage level and loading condition after one year.
Among the major factors affecting the effectiveness of patching are the thickness of patching material and
surface anchor pattern. The thickness of a chipped piece of patch material from a bar cut end was
measured and found to be only 75-100 µm (3-4 mils) thick which is approximately one-third of the
required fusion-bonded coating thickness. Cut ends of bars are usually not prepared for patching; the steel
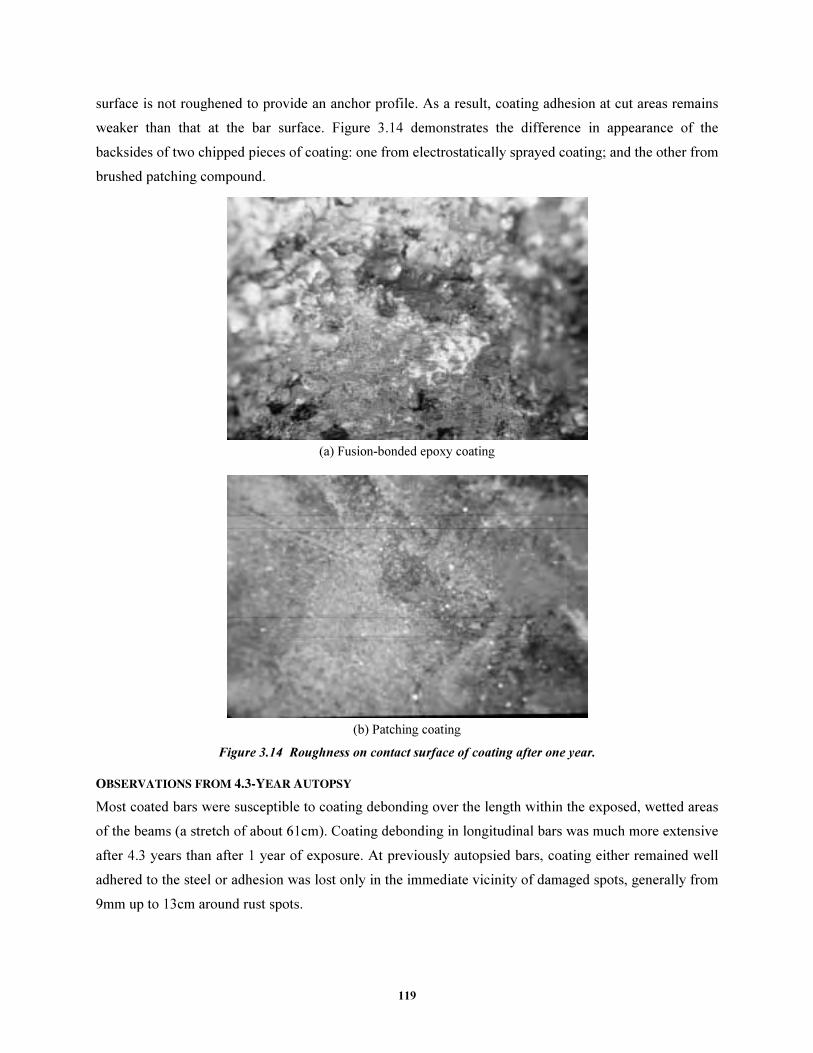
119
surface is not roughened to provide an anchor profile. As a result, coating adhesion at cut areas remains
weaker than that at the bar surface. Figure 3.14 demonstrates the difference in appearance of the
backsides of two chipped pieces of coating: one from electrostatically sprayed coating; and the other from
brushed patching compound.
(a) Fusion-bonded epoxy coating
(b) Patching coating
Figure 3.14 Roughness on contact surface of coating after one year.
������������� ����������������
Most coated bars were susceptible to coating debonding over the length within the exposed, wetted areas
of the beams (a stretch of about 61cm). Coating debonding in longitudinal bars was much more extensive
after 4.3 years than after 1 year of exposure. At previously autopsied bars, coating either remained well
adhered to the steel or adhesion was lost only in the immediate vicinity of damaged spots, generally from
9mm up to 13cm around rust spots.

120
Coating debonding of longitudinal bars tended to be somewhat less extensive in uncracked beams than in
cracked beams, but the difference was less pronounced than in 1-year specimens. The most significant
factor affecting coating debonding was the coating condition (see Table A.34 in Appendix A). As was
noted in preceding paragraphs, as-received bars from uncracked beam B1 maintained good coating
adhesion after 4.3 years of exposure. It seemed that with absence of damaged areas, the solution no longer
had an easy passage through and beneath the coating as was the case for bars with damaged areas. The
presence of isolated portions of adhesion loss indicated that solution had to work its way through the
coating at weak or defective areas. Likewise, the absence of large exposed sites for corrosion initiation
prevented cathodic reactions and subsequent cathodic disbondment.
At spliced short bars (cracked, unloaded beam B32), coating debonded from the patched cut ends up to a
distance of about 20 to 24cm. Undoubtedly, patched cut ends presented a weak spot where corrosion
started and solution penetrated and propagated under the coating. Coating adhesion was preserved at a
distance of about 25cm beyond the patched cut end of the splice bars. Spliced long bars experienced
adhesion loss at their central portion at midspan, over a length of 14cm to 19cm.
Coating adhesion was lost in all stirrups after 4.3 years of exposure, regardless of the absence or presence
of cracks, or the coating condition (see Table A.35 in Appendix A). Several factors may have contributed
to the extensive adhesion loss of stirrups. The stirrups were at the same plane of the cracks they induced
and when the solution penetrated, the whole surface of the stirrup was exposed to saline water. In
addition, the stirrups presented zones of weakened adhesion caused by fabrication or bending. Pinholes,
tears, or cracks also developed in the coating during fabrication. Damage in the coating, or even thinning
of the coating, may have allowed oxygen and salt solution to cross the film. Stirrups were more
vulnerable at the bent zones where debonding started and propagated to the adjacent straight legs.
Another contributing factor may have been cathodic disbondment at zones adjacent to damaged areas
because of the cell process occurring between the anodic and cathodic sites on the steel.18
3.4.3 Undercutting
Undercutting occurred in the following forms: a) A change of appearance of the steel surface to a mottled,
glittering golden-brown aspect with no significant pitting or loss of metal (Figure 2.78), and b) Uniform
black or dark surface rusting with random reddish-brown (or other tones of brown) rust spots and some
activity , such as slight pitting, rust buildup, and loss of metal at several locations (Figures 2.79 through
2.82).
At portions of bars where coating adhesion remained (generally outside the exposed or wetted areas), the
steel surface maintained its originally shiny, bright aspect. On bars with little corrosion activity, large
portions with debonded coating and a mottled, glittering golden-brown surface underneath with very

121
little, almost negligible corrosion attack were noted. Bars with the greatest corrosion had large areas with
debonded coating and with a uniformly black or dark rusted surface.
Mottled surfaces with a glittery golden-brown or bronze appearance were thought to be cathodically
disbonded, that is, areas where cathodic reactions took place. The particular appearance of such areas may
have been produced by the alkalinity generated in such reactions. At the dark corroded areas, the
mechanisms of crevice corrosion and oxide lifting may have taken place. Such mechanisms were
described in Research Report 1265-3.23
������������� ����������������
For longitudinal bars, after the first year of testing, undercutting was confined to some mill marks and
exposed steel areas in uncracked beams. Undercutting increased slightly in cracked beams and spread
around the crack locations and areas of no previous damage. The largest pits found in the immediate
vicinity of opened cracks were covered with black and brown corrosion products.
The steel substrate away from exposure area was, generally, dull or slightly dark around damaged areas
and bright a little further away. These darkened areas could have resulted from some activity that took
place immediately after damage was introduced and the steel was exposed to the atmosphere, or upon
contact with pore solution when concrete was fresh, or because of cathodic reactions.
For stirrups, undercutting increased noticeably in cracked beams and mostly covered the bends and hook
ends. Corrosion spread widely under the film although the coating material itself appeared unaffected
over most of the corroded surfaces. This observation was consistent with findings reported in a previous
research.40
The severity of undercutting on stirrups relative to straight bars may be attributed to several
factors some of which will be discussed later. These factors are:
• Coating weakness due to fabrication.
• Lesser coating thickness and smaller concrete cover compared to longitudinal bars.
• Exposure to high concentrations of chlorides and oxygen in the same crack plane.
• Crevice effects at points of contact with other bars.
• Intensive macrocell action along stirrup and between stirrup and other bars.
The tendency of coated transverse stirrups or hoops to exhibit widespread corrosion was also observed in
field studies. During autopsy of a test pile in Oregon, small corrosion areas were found on only two of the
longitudinal bars but on several of the hoop bars.29
Figure 3.15 shows the variation of undercutting with bar damage level and loading condition for both
longitudinal bars and stirrups. Comparing the results in this figure with those in Figure 3.13, it was clear
that larger crack widths lead to larger debonded areas as a result of greater cathodic activity and not

122
necessarily greater corroded surfaces. In other words, cracks permitted excessive amounts of oxygen to
reach the steel surface and to support the cathodic reactions thus resulting in larger debonded areas.
Cycling the imposed loads, particularly during drying periods, may then be viewed as an oxygen pump
that promoted corrosion activity. This observation explains why severe pitting occurred on bars with a
relatively high proportion of debonded area to corroded area.
Figure 3.15 Variation of corroded area (undercutting) with bar damage level and loading condition.
������������� ����������������
At portions of bars where coating adhesion remained (generally outside the exposed or wetted areas), the
steel surface maintained its originally shiny, bright aspect. On bars with little corrosion activity (some
longitudinal bars), large portions with debonded coating and a mottled, glittering golden-brown surface
underneath with very little, almost negligible corrosion attack were noted. Bars with the greatest corrosion
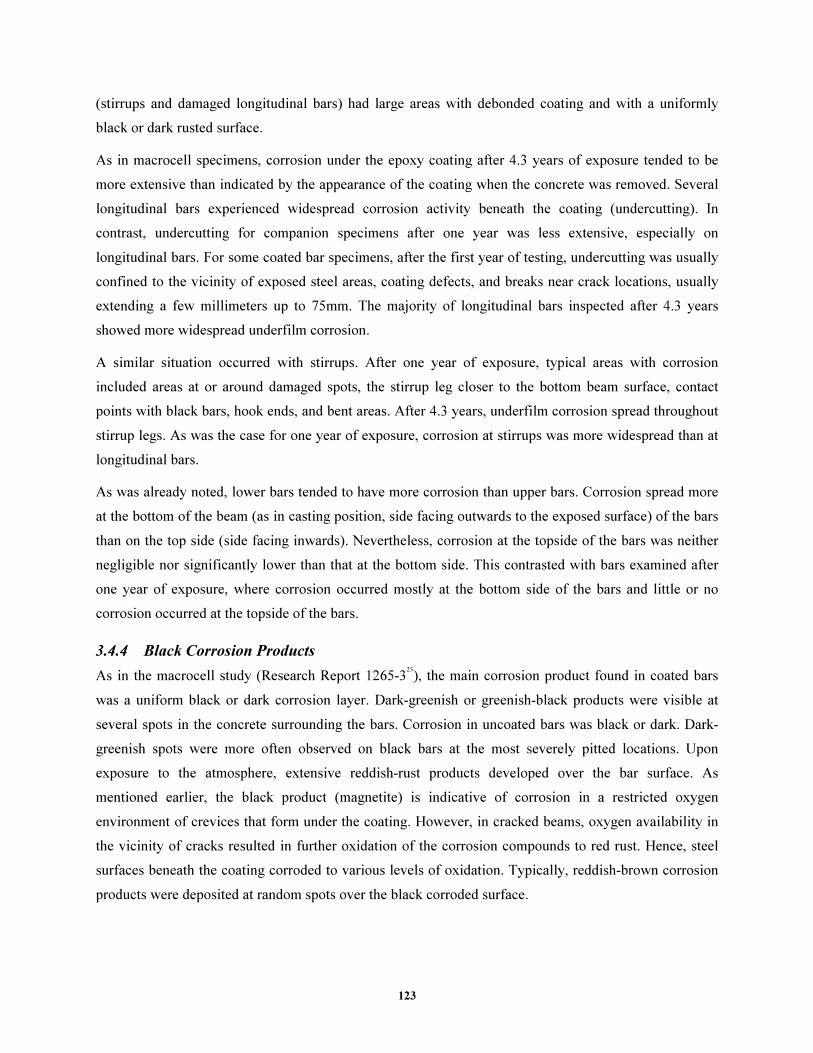
123
(stirrups and damaged longitudinal bars) had large areas with debonded coating and with a uniformly
black or dark rusted surface.
As in macrocell specimens, corrosion under the epoxy coating after 4.3 years of exposure tended to be
more extensive than indicated by the appearance of the coating when the concrete was removed. Several
longitudinal bars experienced widespread corrosion activity beneath the coating (undercutting). In
contrast, undercutting for companion specimens after one year was less extensive, especially on
longitudinal bars. For some coated bar specimens, after the first year of testing, undercutting was usually
confined to the vicinity of exposed steel areas, coating defects, and breaks near crack locations, usually
extending a few millimeters up to 75mm. The majority of longitudinal bars inspected after 4.3 years
showed more widespread underfilm corrosion.
A similar situation occurred with stirrups. After one year of exposure, typical areas with corrosion
included areas at or around damaged spots, the stirrup leg closer to the bottom beam surface, contact
points with black bars, hook ends, and bent areas. After 4.3 years, underfilm corrosion spread throughout
stirrup legs. As was the case for one year of exposure, corrosion at stirrups was more widespread than at
longitudinal bars.
As was already noted, lower bars tended to have more corrosion than upper bars. Corrosion spread more
at the bottom of the beam (as in casting position, side facing outwards to the exposed surface) of the bars
than on the top side (side facing inwards). Nevertheless, corrosion at the topside of the bars was neither
negligible nor significantly lower than that at the bottom side. This contrasted with bars examined after
one year of exposure, where corrosion occurred mostly at the bottom side of the bars and little or no
corrosion occurred at the topside of the bars.
3.4.4 Black Corrosion Products
As in the macrocell study (Research Report 1265-323
), the main corrosion product found in coated bars
was a uniform black or dark corrosion layer. Dark-greenish or greenish-black products were visible at
several spots in the concrete surrounding the bars. Corrosion in uncoated bars was black or dark. Dark-
greenish spots were more often observed on black bars at the most severely pitted locations. Upon
exposure to the atmosphere, extensive reddish-rust products developed over the bar surface. As
mentioned earlier, the black product (magnetite) is indicative of corrosion in a restricted oxygen
environment of crevices that form under the coating. However, in cracked beams, oxygen availability in
the vicinity of cracks resulted in further oxidation of the corrosion compounds to red rust. Hence, steel
surfaces beneath the coating corroded to various levels of oxidation. Typically, reddish-brown corrosion
products were deposited at random spots over the black corroded surface.

124
Another factor may have contributed to the presence of reddish products in 4.3-year specimens. The
coating on the bars was not peeled immediately after removal from the concrete, but about a few weeks
later. The thinner coating at corroded locations was possibly more permeable to air and the bars may have
been exposed to larger quantities of oxygen as compared to a more restricted oxygen environment inside
the concrete.
Despite the presence of corrosion products on epoxy-coated bars, most beams experienced limited surface
staining. The thick concrete cover of 50mm (2in.) was the main reason for delayed staining of concrete
surfaces.
3.4.5 Coating Blistering
Blisters spread on the coating surface. Blisters had different sizes and smaller blisters were more abundant
than larger blisters. After one year, pits associated with blister formation were generally very slight and
shallow and were covered with black and brown brittle corrosion products. However, most blistered areas
had a very hard, solid consistency after 4.3 years of exposure. Blisters formed mainly on the lower half of
the bar surface facing concrete cover. As expected, blisters were located at voids in the concrete interface
at the underside of the bars. The greater quantity of concrete voids at the lower half of the bar surfaces
accounted for the greater quantity of blisters at those regions.
3.5 CONCRETE CONSOLIDATION AROUND REINFORCING BARS
3.5.1 General
Observations confirmed that the condition of the concrete in the region surrounding the coated bar played
a significant role in the corrosion process. Differences in concrete consolidation above and below the
coated bars affected corrosion cell development and the tendency of one side of the bar to degrade more
than the other side. The following discussion was based on the main observation that, after one year of
exposure, rust spotting and blistering was concentrated on the bar side facing the concrete cover, i.e. the
bottom side of the bar in the casting position.
3.5.2 Differences in Concrete Consolidation
Small gaps and air pockets may form under the coated bar during concrete consolidation. By contrast, a
smooth and continuous interface layer may form on top of the bar. Such variation in the concrete density
was more noticeable for longitudinal bars than for stirrups. Figure 3.16 shows two cross sections of a
beam specimen in the casting position to demonstrate the variation in concrete quality at different regions.

125
Figure 3.16 Variation of concrete quality in beam cross section.
3.5.3 Influence of Concrete Consolidation on Corrosion
Variation in the concrete density surrounding the reinforcing bar creates concentration cells which, in
turn, produce differences in potential and lead to macrocell action. Non-uniform chloride concentrations
around the bar were probably the most significant contributor to corrosion initiation and acceleration in
the beam test. Differences in chloride concentration at the top and bottom of the bar result from variations
in chloride penetration as illustrated in Figure 3.17. In addition, the amount of chloride ions that can
accumulate in the zone immediately above the bar may be limited by concrete density. However, the less
dense zone beneath the bar can retain more chlorides. Moreover, the surface below the coated bars (in the
cast position) was closer to the exterior, irrigated surfaces. Consequently, slightly more corrosion and
blistering were observed on the lower half of the longitudinal bars than on the top half. Concrete surfaces
below the bars had more extensive rust staining than concrete surfaces above the bars. Nevertheless,
corrosion was observed on the upper half of the bars and was more extensive after 4.3 years than after one
year.

126
Arrows Inside Show Chloride
Penetration in Uncracked Section
Chloride Solution Running
on Exposure Area
Figure 3.17 Chloride penetration in uncracked beam cross section.
Large macrocell corrosion currents can be produced by the formation of chloride concentration cells. The
anodic site is usually associated with the location of higher chloride concentration. One example is that
reported in a corrosion test of prestressed pile segments where a single strand was exposed to excessive
chlorides through a crack and became anodic with respect to the reinforcement away from the
contaminated area.41
In the beam test, voids at the interface between the concrete and the lower side of the bar in the casting
position allowed large amounts of salt water to accumulate and nucleate anodes. The chloride solution
served as a strong electrolyte through which ions were transported and corrosion was accelerated. The
rate of corrosion was controlled by chloride differential concentration, distance between anodic and
cathodic sites, moisture and temperature variations, and concrete resistivity. Buslov42
estimated that the
corrosion rate of a 25mm (1in.) diameter bar with 25mm (1in.) cover is 6 times faster at the front nearest
to the surface (where chlorides concentrated) than at the rear surface.
Corrosion of stirrups was probably influenced by variation in concrete consolidation between the bottom
and topsides of the beam. The less dense concrete at the top encouraged chloride diffusion towards the
backside of the stirrup away from the exposure area. Cracks in the concrete also accelerated chloride
migration to those parts of the stirrup not directly influenced by the exposure area. As a result, corrosion
was initiated, sometimes exclusively, at the backside of the stirrup in the vicinity of the contact points
with the uncoated bars.
The high complexity of the concrete environment may help to explain why corrosion did not occur at
some large exposed areas of some longitudinal bars, even in the presence of nearby cracks! In addition to
some possible cathodic protection, perhaps the concrete voids facing such areas were not interconnected
with the concrete void structure. Although chlorides may have penetrated nearby cracks, there may be

127
localized, isolated voids with little or no chloride. Also, the alkalinity of the cement paste could have
maintained the protective oxide layer stable.
3.6 CORROSION MECHANISM
The following sections will describe a hypothesis of the corrosion process observed on the bars in the
beam exposure test. The scenario of the hypothesis reconstructs the most likely sequence of steps that
lead to the observed behavior. The beam exposure test added valuable information regarding the
performance of coated bars in corrosive environments.
3.6.1 Corrosion Performance of Longitudinal Coated Bars
���������������
The midspan region of the beam was subjected to periodic wetting by a salt solution, while those regions
near beam ends were continuously dry. Thus, a moisture gradient was created within the beam and the
longitudinal bars extended through these different regions. Even within the wet zone, conditions were not
uniform: In cracked beams, most cracks were located within the exposed, wetted regions of the beams.
Chloride, moisture, and oxygen were more concentrated at crack locations, especially during the first year
of exposure.
During wetting, the salt solution ran across the top, front, and bottom surfaces, and the chloride ions
penetrated through the concrete either by gravity or by capillary action. During drying, water evaporated
from the middle region causing a greater diffusion and accumulation of dissolved chlorides in the
concrete pores. The resulting moisture gradient also promoted oxygen transportation to the reinforcing
steel surface. The less the concrete pore network was filled with water, the greater the oxygen diffusion.
Again, cracks provided direct paths for oxygen; load cycling further pumped oxygen along the steel
surface.
Chloride ions reached the coated bar surface in variable amounts even in uncracked beams due to the
heterogeneous distribution of chlorides and variation of concrete consolidation around the bar. Larger
amounts of chlorides accumulated in the less dense zone immediately below the bar than in the dense
zone above it. The hygroscopic property of salt caused moisture to be retained at the bar surface for an
extended time between drying periods. As a result, a strong electrolyte was formed and corrosion
microcells were nucleated at the lower half of the bar facing the concrete surface.
Finally, the epoxy coating and bars had non-uniform properties, characterized by the random location of
damaged areas and holidays, uneven coating thickness, and non-uniform steel metallurgy.
All of the above factors produced non-uniform conditions along the bar surface that led to the formation
of corrosion cells. A concentration cell was developed between the two sides of the bar characterized by
different chloride concentrations in different concrete mediums. A second concentration cell was
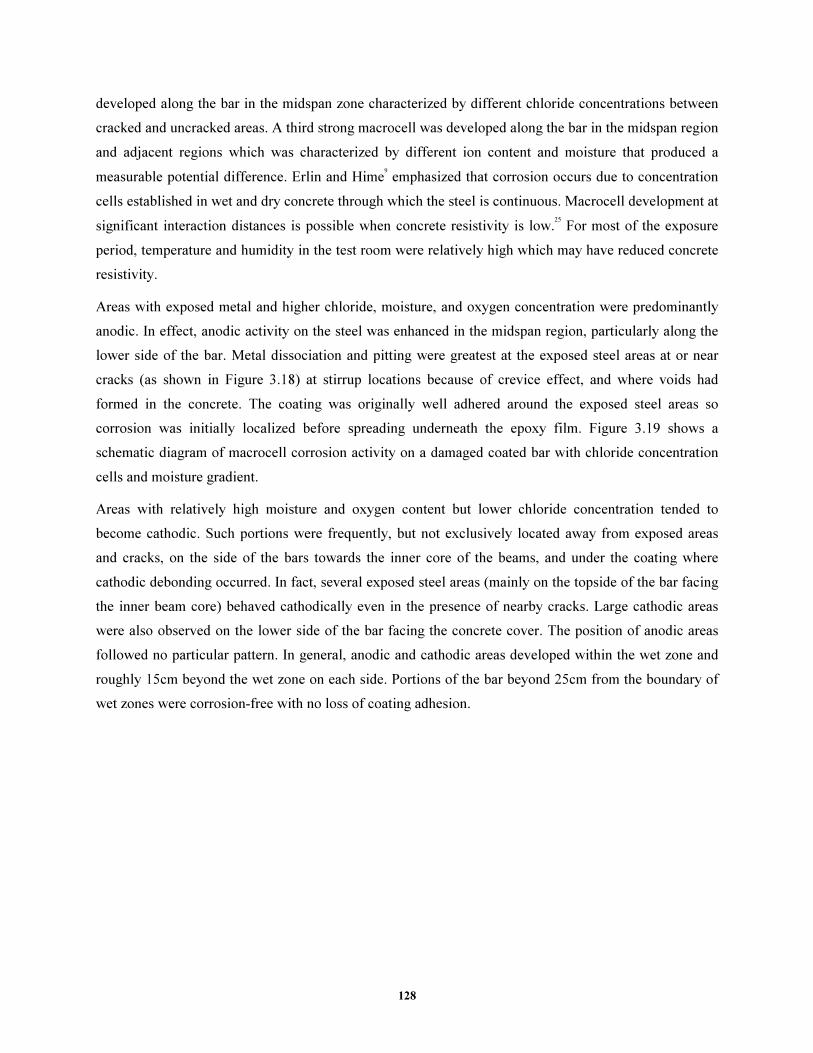
128
developed along the bar in the midspan zone characterized by different chloride concentrations between
cracked and uncracked areas. A third strong macrocell was developed along the bar in the midspan region
and adjacent regions which was characterized by different ion content and moisture that produced a
measurable potential difference. Erlin and Hime9
emphasized that corrosion occurs due to concentration
cells established in wet and dry concrete through which the steel is continuous. Macrocell development at
significant interaction distances is possible when concrete resistivity is low.25
For most of the exposure
period, temperature and humidity in the test room were relatively high which may have reduced concrete
resistivity.
Areas with exposed metal and higher chloride, moisture, and oxygen concentration were predominantly
anodic. In effect, anodic activity on the steel was enhanced in the midspan region, particularly along the
lower side of the bar. Metal dissociation and pitting were greatest at the exposed steel areas at or near
cracks (as shown in Figure 3.18) at stirrup locations because of crevice effect, and where voids had
formed in the concrete. The coating was originally well adhered around the exposed steel areas so
corrosion was initially localized before spreading underneath the epoxy film. Figure 3.19 shows a
schematic diagram of macrocell corrosion activity on a damaged coated bar with chloride concentration
cells and moisture gradient.
Areas with relatively high moisture and oxygen content but lower chloride concentration tended to
become cathodic. Such portions were frequently, but not exclusively located away from exposed areas
and cracks, on the side of the bars towards the inner core of the beams, and under the coating where
cathodic debonding occurred. In fact, several exposed steel areas (mainly on the topside of the bar facing
the inner beam core) behaved cathodically even in the presence of nearby cracks. Large cathodic areas
were also observed on the lower side of the bar facing the concrete cover. The position of anodic areas
followed no particular pattern. In general, anodic and cathodic areas developed within the wet zone and
roughly 15cm beyond the wet zone on each side. Portions of the bar beyond 25cm from the boundary of
wet zones were corrosion-free with no loss of coating adhesion.

129
OH-
Anodic Site
at Exposed
Area
Cathodic Site
at Damaged
Area
CrackEpoxy-Coated Bar
O , H O, Cl-
2 2
Lower Side of Bar
Tension Side of Concrete
Possible Migration
Beneath Coating
Fe++
OH-
Figure 3.18 Pitting corrosion on coated bar at crack location.
Anode
Cathodee-
Cathode
Rust
OH-
2O H O
Concrete
Cl2
OH-
2O H O
2
e-
-Cl
-
Damaged Epoxy-Coated BarEpoxy Coating
Figure 3.19 Mechanism of corrosion on longitudinal coated bar.
The electrode kinetics for a corrosion cell are represented in Figure 3.20. The graph shows how corrosion
potential became more negative and corrosion current increases where chloride concentration and oxygen
availability are increased. For macrocells, however, the resistance of the electrolyte affects corrosion
current as illustrated in Figure 3.21. The resistance of the electrolyte caused a drop in potential in the
corrosion process in the beams as shown in Figure 3.22.

130
Figure 3.20 Electrode kinetics for corrosion cell.
(a) Macro-corrosion cell
(b) equivalent electrical circuit
Figure 3.21 Macro-corrosion cell representation on longitudinal bar.
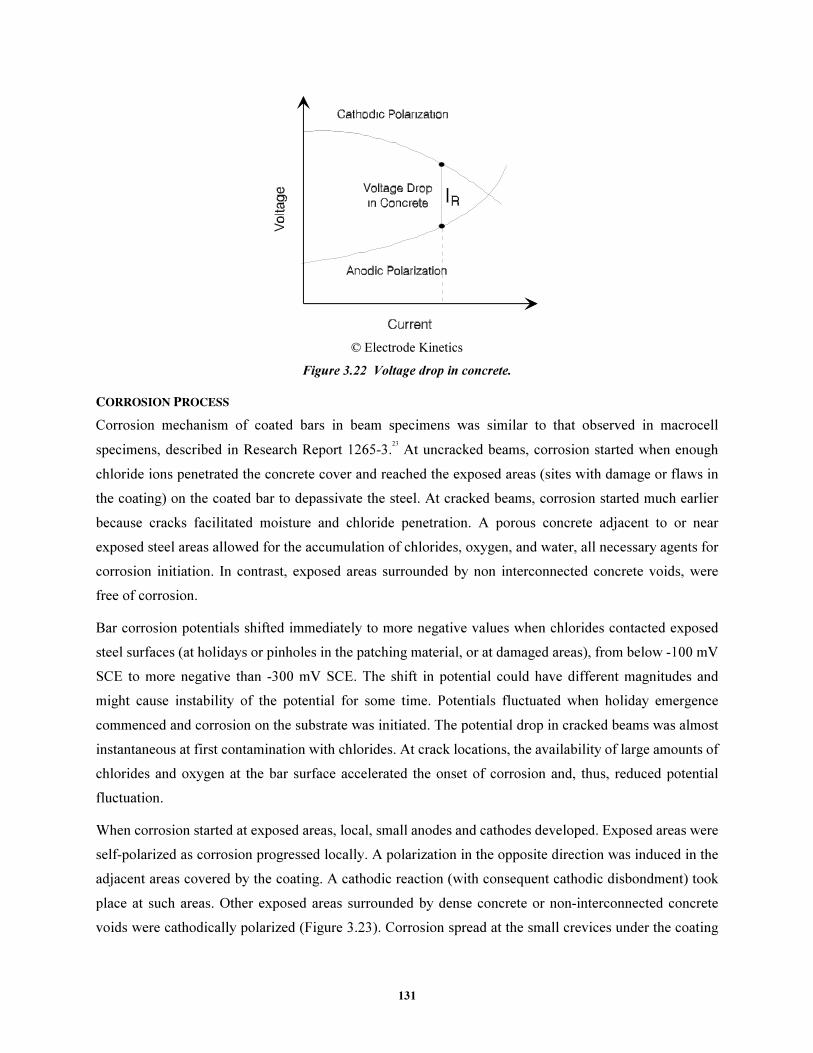
131
© Electrode Kinetics
Figure 3.22 Voltage drop in concrete.
������ ������
Corrosion mechanism of coated bars in beam specimens was similar to that observed in macrocell
specimens, described in Research Report 1265-3.23
At uncracked beams, corrosion started when enough
chloride ions penetrated the concrete cover and reached the exposed areas (sites with damage or flaws in
the coating) on the coated bar to depassivate the steel. At cracked beams, corrosion started much earlier
because cracks facilitated moisture and chloride penetration. A porous concrete adjacent to or near
exposed steel areas allowed for the accumulation of chlorides, oxygen, and water, all necessary agents for
corrosion initiation. In contrast, exposed areas surrounded by non interconnected concrete voids, were
free of corrosion.
Bar corrosion potentials shifted immediately to more negative values when chlorides contacted exposed
steel surfaces (at holidays or pinholes in the patching material, or at damaged areas), from below -100 mV
SCE to more negative than -300 mV SCE. The shift in potential could have different magnitudes and
might cause instability of the potential for some time. Potentials fluctuated when holiday emergence
commenced and corrosion on the substrate was initiated. The potential drop in cracked beams was almost
instantaneous at first contamination with chlorides. At crack locations, the availability of large amounts of
chlorides and oxygen at the bar surface accelerated the onset of corrosion and, thus, reduced potential
fluctuation.
When corrosion started at exposed areas, local, small anodes and cathodes developed. Exposed areas were
self-polarized as corrosion progressed locally. A polarization in the opposite direction was induced in the
adjacent areas covered by the coating. A cathodic reaction (with consequent cathodic disbondment) took
place at such areas. Other exposed areas surrounded by dense concrete or non-interconnected concrete
voids were cathodically polarized (Figure 3.23). Corrosion spread at the small crevices under the coating

132
at the edges of exposed areas or discontinuities. Adjacent debonded coating (by cathodic disbondment,
water action, or a combination of both) formed very thin crevices and corrosion propagated under the
coating in a mechanism similar to that of crevice corrosion.
O2, H
2O, Cl
-
Epoxy-Coated Bar
Anodic Site at
Exposed Area
Crack
Tension Side of BeamO2, H
2O, Cl
-
Fe++OH-
Cathodic Site at
Exposed Area
Cathodic
Reactions
Underfilm
Corrosion
Crack
e-
CoatingDisbondment
Figure 3.23 Mechanism of corrosion of coated longitudinal bar.
With time, underfilm corrosion progressed on the coated bar and oxide lifting took place. As explained in
Research Report 1265-3,23
oxide lifting occurs when anodic corrosion products accumulate under the
coating during alternate wet and dry cycles. Undercutting initially progressed more extensively on the
portion of the bars nearest the concrete surface. Undercutting was facilitated by easier distribution and
accumulation of chlorides through the gap between bar and concrete and through the void structure in the
concrete. Concrete voids provided the physical space for the expansion of corrosion products to form
blisters.
The almost complete lack of debonded coating and corrosion of as-received bars reinforced the
hypothesis that corrosion spread from damaged, exposed areas. The coating in as-received bars was in
very good initial condition, with very few and small damaged areas. Although chloride levels were very
high after 4.3 years of exposure, the coating provided a very effective barrier to the passage of chloride
solution. The few, isolated areas where adhesion was lost were probably spots where the coating was
most defective and chloride solution migrated through the coating.
Assuming that the original coating adhesion was roughly the same for all bars, it was clear that chlorides
and moisture penetrated the coating rapidly and easily through damaged areas of the coating. Exposed
areas were always surrounded by debonded coating, while the isolated portions where coating adhesion
was preserved were located farthest away from the exposed areas. This observation provided further
evidence that solution penetrated mainly through exposed areas of the bar, and was in agreement with
findings by others.2, 43, 44

133
Macrocell effects on coated longitudinal bars were greatly limited by the coating itself and the effective
isolation of the bars with other portions of the reinforcement. The epoxy coating shielded the steel surface
from becoming continuously exposed to large amounts of moisture, chlorides, and oxygen. Although
moisture and chlorides eventually penetrated the coating and reached the steel surface, underfilm
corrosion progressed slowly because of the limited availability of oxygen under the coating. Underfilm
corrosion was under cathodic control due to limited oxygen diffusion. Undercutting progressed under
mainly stable potentials in the high negative range. Potential differences between predominantly anodic
and predominantly cathodic sites were more than 150 to 200 mV in order to sustain corrosion activity.
After 4.3 years of exposure, bars from cracked and uncracked beams with similar coating damage did not
show much difference in the amount of corrosion, despite earlier corrosion initiation and progression on
bars inside cracked beams. The epoxy coating significantly slowed the corrosion activity of bars in
cracked beams by limiting oxygen diffusion. This protecting capability was greatly aided by the lack of
significant macrocell action. In addition, chloride contents in uncracked beams eventually reached levels
similar to those in cracked beams after 4.3 years. Apparently, the time of exposure was long enough for
chlorides to accumulate inside uncracked beams and to corrode the bars. Deterioration levels similar to
bars in cracked beams were reached.
Corrosion morphology was very similar to that described in other studies performed on epoxy-coated
bars. Limited availability of oxygen beneath the coating caused most corrosion products to be in a low
oxidation state. Under repeated wetting periods, the debonded coating retained an aqueous solution which
became acidic. Underfilm corrosion caused minor surface degradation. Corrosion products formed in
relatively small quantities without large increase in volume. No signs of corrosion-induced cracking were
observed on exterior concrete surfaces. A few small brown stains were first observed on the top surface of
beam B8 within the wet zone at about 1.9 years of exposure.
3.6.2 Corrosion Performance of Coated Stirrups
���������������
Several factors adversely influenced the corrosion performance of coated stirrups: Due to the cyclic
exposure to salt solution in the beam midspan, the concrete medium around stirrups was always moist. As
crack inducers, they were located in the plane of cracks (except at uncracked sections). Large amounts of
chlorides, oxygen, and moisture surrounded the stirrups in cracked beams. Load cycling further increased
the amounts of corrosive substances at the stirrup level. In uncracked beams, chloride ions reached the
upper leg of the stirrup primarily by gravity and the lower leg by capillary action. Stirrups were closer to
the concrete surface than longitudinal bars. During fabrication, adhesion of the coating was weakened and
the coating was damaged on the outside and inside of the bend.

134
������ ������
Because of its similarities with that of longitudinal bars, the process leading to corrosion initiation and
progression of coated stirrups will not be discussed in detail. Corrosion of stirrups was aggravated by the
factors mentioned above. There were more similarities between the corrosion of stirrups and macrocell
bars than between longitudinal bars and macrocell bars.
Chloride ion distribution around the stirrup was non-uniform due to both variations in concrete
consolidation and chloride transport mechanisms. As a result, a concentration cell was developed between
the parts of the stirrup in different concrete mediums. During the investigation of corrosion of coated bars
in Florida bridge substructures, it was stated that enough environmental heterogeneity along the perimeter
of the hoop bars can create efficient macrocells.25
The potential of the steel shifted to more negative
values in similar conditions described above for longitudinal bars. Again, the potential drop in cracked
beams was almost instantaneous at first contamination with chlorides. Corrosion initiated at holidays and
breaks in the coating and in patches at bends and hook ends and progressed towards the rest of straight
legs. Weakened adhesion during fabrication greatly facilitated coating disbondment and underfilm
corrosion. Corrosion was generally more extensive at the bottom and front legs, which implies that
chlorides penetrated from the bottom surfaces by capillary action, in addition to the chlorides that diffused
from the top.
Concrete environment around the bars was an important factor. There were several cases where the front
leg of the stirrup was corroded while the nearby front hook end was mottled and its patched end exhibited
a clean steel surface (Figure 3.24). The corroding front leg was in the plane of the crack, while the
overlapping front hook end was a few centimeters away from the crack plane.
Electrical continuity between the stirrup and uncoated bars was possibly present through damage at
contact points and may have affected corrosion performance. Damage on the inside of the bend of stirrup
was introduced either during fabrication (in the form of mashed spots) or by cutting through the coating
during cage assembly. An example of the later is shown in Figure 3.25. Sometimes, the protected tie wire
was stripped under the action of twisting causing the metal to be uncovered. Another possible source of
continuity could be semiconducting corrosion products that accumulated around the contact points,
bridging the gap between uncoated bars and exposed areas in stirrups, as shown in Figure 3.26.

135
Figure 3.24 Stirrup leg near the beam front surface (top in photo) is corroded while stirrup hook is mottled (bottom in photo) (Beam B32).
Figure 3.25 Damage of coating of stirrup at contact with uncoated bar.
Figure 3.26 Corrosion at location of contact of coated stirrup and uncoated bar.

136
During the first year of exposure, a strong macrocell action was developed between the stirrup in a highly
contaminated region and uncoated bars stretching along uncontaminated concrete. In many cases, cracks
facilitated the ingress of chlorides and oxygen to the contact points and promoted corrosion initiation. The
uncoated bars, for the most part, were initially cathodic with respect to the stirrup and corrosion activity
occurred near the contact points because of the distance effect (anodes tend to locate closest to cathodes).
Figure 3.27 demonstrates the macrocell formation for stirrups in cracked beams. Due to availability of a
large cathode in the form of the intersecting longitudinal bar, corrosion on stirrups was extensive and
anodically controlled.
O2, H
2O, Cl-
Compression Side of Beam
Anodic Region
(Outside Bend)
Damage at Connection
(Incidental Continuity)
Severe Pitting
Epoxy-Coated Bar Covered
with Heat Shrink Tube
Epoxy-Coated
Stirrup
Cathode Cathode
Crack
Tension Side of Beam
Underfilm Corrosion
Figure 3.27 Mechanism of corrosion of coated stirrup.
This situation gradually changed as chloride contamination spread over a larger portion of the beams and
corrosion of uncoated bars progressed. Uncoated bars became very anodic over a large surface near the
wetted regions as more chloride accumulated on the bar surface, especially at crack locations. Meanwhile,
in all stirrups, the portion of steel surface closest to the uncoated bars (inside of the back leg and adjacent
bends) remained mottled, with no visible pitting. Parts of the stirrup became cathodic with respect to the
anodic black bars and other anodic legs of the stirrup. The reduced availability of cathodic surfaces
provided by black bars may have slowed the corrosion rate of stirrups.
After 4.3 years of exposure, stirrups from cracked and uncracked beams with similar coating damage did
not show much difference in the amount of corrosion, despite earlier corrosion initiation and progression
on stirrups inside cracked beams. After an initially fast rate of corrosion, the epoxy coating significantly
slowed further corrosion activity of stirrups in cracked beams by limiting oxygen diffusion. This
protecting capability was subsequently aided by the gradual reduction of macrocell action provided by the
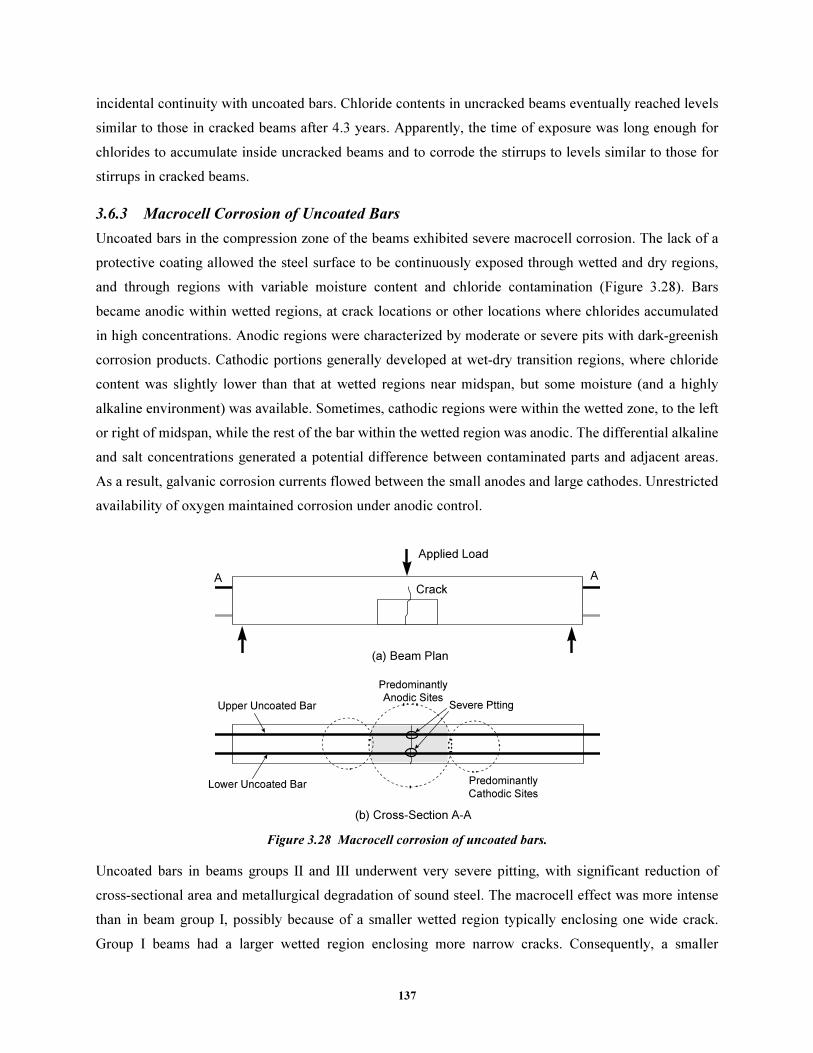
137
incidental continuity with uncoated bars. Chloride contents in uncracked beams eventually reached levels
similar to those in cracked beams after 4.3 years. Apparently, the time of exposure was long enough for
chlorides to accumulate inside uncracked beams and to corrode the stirrups to levels similar to those for
stirrups in cracked beams.
3.6.3 Macrocell Corrosion of Uncoated Bars
Uncoated bars in the compression zone of the beams exhibited severe macrocell corrosion. The lack of a
protective coating allowed the steel surface to be continuously exposed through wetted and dry regions,
and through regions with variable moisture content and chloride contamination (Figure 3.28). Bars
became anodic within wetted regions, at crack locations or other locations where chlorides accumulated
in high concentrations. Anodic regions were characterized by moderate or severe pits with dark-greenish
corrosion products. Cathodic portions generally developed at wet-dry transition regions, where chloride
content was slightly lower than that at wetted regions near midspan, but some moisture (and a highly
alkaline environment) was available. Sometimes, cathodic regions were within the wetted zone, to the left
or right of midspan, while the rest of the bar within the wetted region was anodic. The differential alkaline
and salt concentrations generated a potential difference between contaminated parts and adjacent areas.
As a result, galvanic corrosion currents flowed between the small anodes and large cathodes. Unrestricted
availability of oxygen maintained corrosion under anodic control.
A A
Applied Load
Crack
PredominantlyAnodic Sites
Predominantly
Cathodic Sites
Upper Uncoated Bar
Lower Uncoated Bar
(a) Beam Plan
(b) Cross-Section A-A
Severe Ptting
Figure 3.28 Macrocell corrosion of uncoated bars.
Uncoated bars in beams groups II and III underwent very severe pitting, with significant reduction of
cross-sectional area and metallurgical degradation of sound steel. The macrocell effect was more intense
than in beam group I, possibly because of a smaller wetted region typically enclosing one wide crack.
Group I beams had a larger wetted region enclosing more narrow cracks. Consequently, a smaller

138
anode/cathode ratio developed in bars from groups II and III, resulting in severe pitting at the crack
location. Although corrosion spread from the active area at the crack, intensive macrocell action was
sufficient to cause severe localized metal consumption in a very small portion.
Uncoated bars in uncracked, unloaded beams experienced the least severe corrosion. The lack of cracks
delayed the onset of corrosion and prevented the accumulation of chlorides in excessively high
concentrations at crack locations. Corrosion tended to be more uniform and pitting was less severe.
Large rust stains developed on the exterior concrete surface at the locations of severely pitted bars. No
corrosion-induced cracking or spalling was detected after 4.3 years of exposure.
3.6.4 Concrete Deterioration
A mechanism of concrete deterioration, similar to that of macrocell specimens with uncoated bars, took
place in all beams. As was mentioned in Chapter 2, the concrete surface deteriorated and scaled within the
wet zone and in regions outside the wet zone (Figure 3.29). Concrete scaling outside the wet zone was
more extensive and severe at the bottom surfaces, and the degree of scaling ranged from light to severe.
Scaling was usually worse outside the wetted regions. Scaling extended up to 76cm to each side of
midspan in beams group I and up to 51cm to each side of midspan in beam groups II and III.
In addition to concrete scaling, loaded and unloaded beams experienced cracking with random
orientation, mainly longitudinal, at and around the wet zone (Figure 3.30). Such cracks appeared between
2.5 and 3.6 years, and had a maximum width of 0.20mm, with most between 0.08 and 0.10mm. No signs
of rust were found inside or around such cracks.
Concrete scaling and non-structural cracks were caused by forces from expansive hydrated salt crystals
that were driven through concrete pores after periodic cycles of wetting and drying. When water
evaporated during dry cycles, salts in the form of crystals were left in the capillary pores. Upon
subsequent wetting, the crystals re-hydrated and grew, exerting an expanding force on the surrounding
cement paste. The crystallization of salt in a zone having a free evaporation surface or one that the
solution reaches by capillary forces, such as the regions adjacent to the wetted zone in the beams, results
in destructive internal pressures that may crack and deteriorate the concrete.1, 45, 46
Such surfaces are
vulnerable because free evaporation results in an increase of salt concentration. At scaled areas, the
hardened cement paste and embedded fine aggregate particles were removed, leaving behind protruding
coarse aggregate particles (Figure 3.29). Large deposits of salt crystals were visible at scaled surfaces.

139
Wetted region
Dry region
Dike
(a) Beam B1, top surface (plan view)
(b) Bottom surface of beam B1, close up of
crack at midspan
Figure 3.29 Concrete scaling inside and outside wetted regions. Scaling was more severe outside (but near) wetted regions.
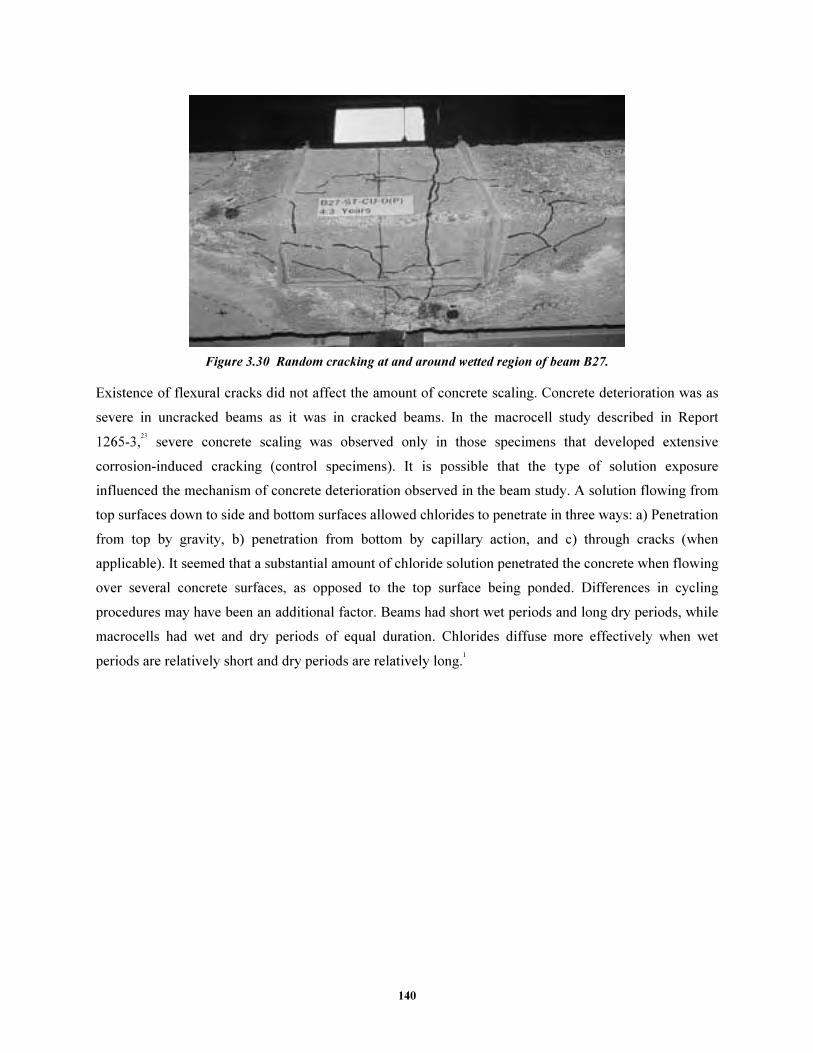
140
Figure 3.30 Random cracking at and around wetted region of beam B27.
Existence of flexural cracks did not affect the amount of concrete scaling. Concrete deterioration was as
severe in uncracked beams as it was in cracked beams. In the macrocell study described in Report
1265-3,23
severe concrete scaling was observed only in those specimens that developed extensive
corrosion-induced cracking (control specimens). It is possible that the type of solution exposure
influenced the mechanism of concrete deterioration observed in the beam study. A solution flowing from
top surfaces down to side and bottom surfaces allowed chlorides to penetrate in three ways: a) Penetration
from top by gravity, b) penetration from bottom by capillary action, and c) through cracks (when
applicable). It seemed that a substantial amount of chloride solution penetrated the concrete when flowing
over several concrete surfaces, as opposed to the top surface being ponded. Differences in cycling
procedures may have been an additional factor. Beams had short wet periods and long dry periods, while
macrocells had wet and dry periods of equal duration. Chlorides diffuse more effectively when wet
periods are relatively short and dry periods are relatively long.1
141
CHAPTER 4
SUMMARY, CONCLUSIONS AND RECOMMENDATIONS
4.1 SUMMARY
A beam exposure experimental program was conducted to study the performance of longitudinal and
fabricated (transverse stirrups) epoxy-coated reinforcement. The coated bars were tested in separate or
mixed arrangements of straight bars, stirrups, and spliced bars. Duplicate specimens containing coated
bars on the tension side of the beams, uncoated bars on the compression side, and a coated stirrup at
midspan were prepared. The coating condition was varied to study effects of damage and patching on
corrosion performance. A few specimens included splice bars with patched ends within the wetted region
of the beams. Some beams were uncracked while others were cracked and either unloaded so that the
cracks closed or kept under load to maintain the cracks width. The middle portion of beams was irrigated
with a chloride solution in alternating wet and dry periods for 4.3 years. Loads were cycled on the cracked
beams during wetting and drying. Development of corrosion and corrosion potentials were monitored and
specimens were opened for examination of the bar condition after 1 and 4.3 years of exposure. The main
conclusions of this study pertaining to straight bars, stirrups, and cut bar ends are given in the following
sections.
4.2 CONCLUSIONS
The main conclusions of this study are summarized and grouped in the following categories:
4.2.1 Onset of Corrosion
Corrosion of epoxy-coated steel in concrete started much earlier in cracked members than in uncracked
members. The impact of crack width on corrosion initiation and later progression was not significant.
Corrosion initiation on damaged bars was faster than on those as-received. Coated bars tended to resist
corrosion at chloride concentration levels exceeding levels normally associated with the onset of
corrosion of uncoated steel.
4.2.2 Uncoated vs. Coated Steel
Both coated longitudinal bars and stirrups exhibited less severe corrosion than uncoated bars. No deep
pits, significant reduction of cross section, nor substantial metallurgical degradation were observed on the
steel surface of epoxy-coated bars. Corrosion generally consisted of a uniformly dark surface with
shallow pitting beneath the coating. Despite the presence of cracks, only limited staining of the concrete
surface was observed. The amount of rust produced on coated steel was small enough to disperse in the
concrete pores. In the worst cases, extensive, shallow pitting was observed on stirrups, with relatively
deep pitting (0.3mm ≤ pit depth ≥ 1.0mm) occurring on 4 to 27% of the stirrup surface area.
142
In contrast, uncoated bars experienced moderate to extensive corrosion with the formation of moderate to
severe pits. Substantial loss of cross-sectional area was evident at crack locations within the wet zone.
The strength of such bars was weakened by both reduction of cross section and metallurgical degradation
of sound steel. Large rust stains developed on the exterior concrete surface near the locations of severely
pitted bars. The benefits of using epoxy coating became more evident in cracked beams.
A comparison of the performances of coated and uncoated bars was not one of the initial objectives of the
beam corrosion study. Uncoated bars were used to reinforce the beams in the compression zone, with the
premise that the bars would be outside of the exposed, wetted area. In many structures, epoxy-coated bars
were used on parts of the structure exposed to chlorides and uncoated bars at other portions. However, the
relatively long exposure to chlorides in this study resulted in corrosion of the uncoated bars. It was
deemed important to document the condition of uncoated bars and compare their performance with that of
coated bars. It is important to keep in mind that uncoated and longitudinal coated bars had different
diameters (10mm–#3—for uncoated bars, 19mm–#6—for coated bars). Coated stirrups had the same
diameter as uncoated bars.
4.2.3 Field and Laboratory Conditions
Beam specimens resembled field concrete members more realistically than the specimens for the
macrocell study did (Research Report 1265-3)23
. The beams were relatively large, many of them were
loaded and cracked, salt solution flowed over the surface instead of being ponded, concrete cover was
larger, and a mix of coated and uncoated bars more closely resembling field reinforcement was used
(some artificial elements remained, such as a highly concentrated salt solution applied in a particularly
aggressive cyclic regime, and concrete with high water/cement ratio). Within this context, it was
encouraging to see the improvement obtained in durability by using epoxy-coated reinforcement.
Unfortunately, the lack of real control specimens reinforced with uncoated bars only made it impossible
to perform a more meaningful comparison. As in the macrocell study, differences between test and field
conditions should be kept in mind when analyzing and interpreting test results.
Finally, the performance reported herein corresponds to a coating formulation produced in the early
1990’s (newer than that for epoxy-coated bars in the macrocell study) and may not necessarily reflect the
performance of coatings produced in the mid and late 1990’s. Coatings developed more recently may
perform differently than earlier formulations under similar exposure conditions.
4.2.4 Effect of Coating Damage
The damage condition of the epoxy coating was the most influential factor in the corrosion performance
of longitudinal bars and stirrups. In a heterogeneous environment, bars and stirrups with excessive
damage (many large exposed steel areas), even if patched, were susceptible to moderate macrocell
formation. Bars with 3% damage to coating in both cracked and uncracked beams corroded more
143
extensively than bars in a good as-received condition, that is, no visible coating damage. As-received
longitudinal bars were practically corrosion-free. Only a few spots had a very thin film of reddish rust at
mill marks. Coating adhesion was preserved throughout most of the bar surface and the steel surface
underneath was bright and shinny, as in its original condition. Stirrups with added intentional damage
experienced slightly worse corrosion than as-received stirrups (in both cases stirrups were patched).
Analysis of corrosion potentials in uncracked beams showed that bars with 3% damage corroded much
earlier than bars in as-received condition, but at about 3 to 3.5 years, some incipient corrosion activity
was noted on bars with coating in as-received condition. Differences in corrosion initiation between 3%
damaged and as-received bars in cracked beams were evident in the first three to six months only. The
implication of these trends was that bars with larger damaged areas experienced corrosion earlier and for
a longer time than bars with as-received condition.
Interestingly, several damaged, exposed sites in longitudinal bars experienced no corrosion, even when
located near cracks within the wetted zone. Cathodic polarization and a complex concrete environment
may have protected such spots from corrosion.
4.2.5 Repair of Coating Damage
Patching of damaged coating reduced the severity of corrosion, but did not provide full protection to the
bare areas. Both anodic undercutting and cathodic debonding progressed from patched areas.
Longitudinal bars with 3% coating damage and patching showed less extensive and widespread corrosion
than bars with unrepaired damage. A few patched areas on each bar exhibited dark corrosion. Most
patched areas showed no signs of corrosion. Although patching coating damage seemed to improve
performance, bars with a good as-received condition still performed better than bars with patched
damage. Despite the slight improvement in corrosion performance of patched bars, there was no clear
difference in the corrosion potentials between unpatched and patched damaged bars (cracked beams).
Although corrosion potentials indicated that both unpatched and patched, damaged bars underwent
corrosion, the potentials could not be used to pinpoint differences in rate and severity of corrosion.
Stirrups with as-received coating, which was not in good condition, did not perform as well and corroded
more extensively than stirrups on which the as-received coating damage was patched. Despite earlier
potential drops experienced by as-received stirrups, potentials of patched stirrups (both with 3% damaged
coating and with as-received condition) eventually reached potentials similar to those in unrepaired, as-
received condition as exposure time increased. Again, the final potential range was not useful in assessing
the relative performance of coated stirrups.
Patching bar cut ends was ineffective because of the small thickness of patching and lack of surface
anchor profile. Patched ends at splice bars experienced uniform dark corrosion beneath the patch, and
144
corrosion progressed under the coating up to a distance of about 20 to 24cm from the patched ends.
Evidently, patched ends located at a crack location became a weak spot in epoxy-coated bars.
4.2.6 Effect of Loading and Cracking
Compared to coating condition, loading condition and presence of cracks had a lesser effect on
performance of coated bars after 4.3 years of exposure. The effect of cracks was much worse on uncoated
bars than on coated bars.
����������� ����
No significant differences in corrosion severity and extent were observed among bars from cracked or
uncracked beams, provided the coating was damaged. The main influence of cracking was in time to
corrosion initiation. Corrosion potentials evidenced early corrosion initiation of bars in cracked beams,
within 1.5 to 6 months. Bars in uncracked beams started to corrode after about one year when the coating
had 3% damage, and after about 3 to 3.5 years when the coating was in as-received condition. Beams with
opened and unopened cracks showed very similar potential trends regardless of coating condition.
Similar to longitudinal bars, performance of stirrups was not significantly effected by presence of cracks
or the loading condition. For similar coating and loading condition, performance of stirrups in cracked
beams was sometimes better than that of stirrups in uncracked beams. No clear effect between opened or
unopened cracks was observed. Potential readings indicated that stirrups in cracked beams corroded
earlier than stirrups in uncracked beams. Corrosion potentials between cracked and uncracked beams
became similar after about 2.5 years of exposure.
In contrast to what was observed after 4.3 years, autopsies performed after one year of exposure revealed
that longitudinal bars and stirrups in cracked beams experienced more widespread coating debonding and
underfilm corrosion than those bars in uncracked beams. The difference in performance between 1-year
and 4.3-year specimens indicated that the absence of cracks delayed but did not prevent the accumulation
of significant amounts of chlorides at bar locations. Chloride contents at bar locations in cracked and
uncracked beams were similar after 4.3 years of exposure.
Loaded and unloaded beams showed similar behavior regardless of coating condition. The loading
condition seemed to have some effect on the performance of stirrups. For similar coating and cracking
condition, the stirrup inside the loaded beam did not perform as well as one inside an unloaded beam.
It should be kept in mind that the concrete used in the beam study was highly permeable and of poor
quality, which could explain the similarities in bar corrosion between cracked and uncracked beams after
more than four years of exposure. The overwhelming evidence found in field structures, though, indicates
that coated bars corrode more at crack locations.5, 10, 11, 43, 47
Undoubtedly, a concrete of medium to good
quality slows chloride penetration, while cracks provide a direct path to the reinforcement, regardless of
145
concrete quality. The accelerated nature of the beam study does not simulate field conditions accurately.
For this reason, the adverse effect of concrete cracks on the corrosion of coated bars should not be
assessed solely on the findings from the beam study.
������� ����
Uncoated bars experienced severe pits and loss of metal at or near crack locations after 4.3 years of
exposure, reducing their strength and load-carrying capacity, especially in bars from beam groups II and
III. The smaller exposed, wetted surfaces enclosing fewer but wider cracks in beam groups II and III may
have produced a smaller anode/cathode ratio that was conducive to severe pitting corrosion. Corrosion
may have been worsened at any incidental contact between exposed areas at inside of stirrup corners and
uncoated bars, producing electrical continuity between bars and aggravating the macrocell effect.
4.2.7 Longitudinal vs. Transverse Reinforcement
Among coated bars, stirrups underwent more extensive corrosion than longitudinal bars. The coating
debonded practically around the entire surface of stirrups. Steel surface beneath the coating was
uniformly dark corroded and presented relatively shallow pits on most of the stirrup legs. Deeper pitting
(0.3mm ≤ pit depth ≥ 1.0mm) was observed over surfaces extending from 4% to 27% of the stirrup
surface area.
Longitudinal bars developed less extensive and severe corrosion than stirrups. Except for bars from beam
B1 where adhesion was preserved, bars experienced coating debonding throughout and a little beyond the
wetted zone. Extent of corrosion ranged from 0.3% to 33% of surface along the 0.9 m portion in midspan.
Pitting was less extensive and shallower than that in stirrups.
Factors conducive to higher corrosion of stirrups included the presence of a crack in the same plane of the
stirrup, their closer proximity to the exterior surface, weakening of adhesion and damage of coating
caused by fabrication, and possible incidental continuity with uncoated bars in the compression zone.
4.2.8 Corrosion Potentials
Measured potentials did not correlate with rate and severity of corrosion. Corrosion was negligible when
potentials remained below -300 mV SCE without significant potential gradients along the monitored bar.
Corrosion potentials more negative than -550 mV SCE indicated moderate to severe corrosion in most
cases but minor corrosion was observed in others. A wide overlap of corrosion performance was observed
in the potential range of -300 to -550 mV SCE. Potentials in all beams remained nearly the same towards
the end of exposure, within the range of -500 to -600 mV SCE, indicating that in most beams active
corrosion conditions existed for the remainder of the test. For uncoated bars, corrosion potentials less
negative than -300 mV SCE correlated with minor or no corrosion, while potentials in the range of -370
to -575 mV SCE were associated with moderate to severe corrosion.

146
After one year of exposure, Kahhaleh reported that [shallow] pitting corrosion in coated bars was
associated with potential gradients greater than 200 mV SCE after one year.24
However, this trend was not
maintained with time. Potential differences between wet and dry regions did not accurately reflect
corrosion severity. Potential gradients greater than 200 mV did not seem to be associated with any well-
defined level of corrosion activity in epoxy-coated bars after 4.3 years of exposure. Corrosion in such bars
varied from negligible to moderate. For uncoated bars, maximum potential gradients above 300 mV were
conducive to severe pitting corrosion.
Systematic, periodic measurement of corrosion potentials was valuable in monitoring the corrosion
activity and in assessing time to corrosion of embedded epoxy-coated bars. It was necessary to monitor
potentials periodically and over an extended period to avoid misinterpretations of results. Measuring
potentials on a short-term basis could be misleading. With time, the potentials dropped and fluctuated.
Both the potential value and the changes in potential were important for establishing corrosion initiation.
A shift in potential towards more negative values occurred as chlorides reached the bar surface and
initiated corrosion in damaged areas.
4.2.9 Mixing Uncoated and Coated Steel
The practice of mixing coated and uncoated bars in the same concrete member may lead to undesirable
performance. Any incidental continuity between coated and uncoated bars could establish large
macrocells that would be conducive to extensive corrosion. Damage to the coating during fabrication and
tying of stirrups to uncoated bars was believed to produce macrocell action in beam specimens. An
additional risk of mixing coated and uncoated reinforcement is the possibility of corrosion of uncoated
bars, which as was seen in this study, can be very severe. The findings discourage mixing coated and
uncoated bars in proximity or in contact.
4.2.10 Effects of Concrete Environment
The quality of concrete at the bar interface affected the location where corrosion initiated and progressed.
Longitudinal coated bars consistently showed high propensity for corrosion initiation and spreading along
the side facing the concrete surface, where more voids in the concrete were likely. Rusting of coated
stirrups was frequently observed where the concrete was less dense. There was a tendency for the epoxy
coating to develop blisters and to break down at voids in contact with bar surface. Although concrete
quality and consolidation were important, the complexity of the concrete environment also influenced the
occurrence of corrosion along the bars. Corrosion was not observed at areas with exposed metal that were
probably surrounded by isolated concrete pores, even when cracks were nearby.
147
4.2.11 Corrosion Mechanism
Corrosion in uncracked beams started when enough chlorides penetrated the concrete cover and reached
exposed areas on the coated bar to depassivate the steel. Corrosion started much earlier in cracked beams
because cracks facilitated moisture and chloride penetration. Differential chloride distributions and
moisture gradients, coupled with damaged coating, generated large potential differences and established
corrosion cells. Corrosion spread at the small crevices under the coating at the edges of exposed areas or
discontinuities. Adjacent coating debonded by cathodic disbondment, water action, or a combination of
both, forming very thin crevices. Corrosion propagated under the coating in a mechanism similar to that
of crevice corrosion. The corrosion initiation process was characterized by self-polarization. Other
exposed areas, when surrounded by dense concrete or non-interconnected concrete voids, were
cathodically polarized. In longitudinal bars, the epoxy coating shielded the bars from and prevented
significant macrocell effects, while in coated stirrups, macrocell action could have been established by
incidental continuity at contact points with uncoated bars. Anodic and cathodic debonding, underfilm
corrosion, and blister formation progressed in a manner similar to that described in other studies on
macrocell action.
Uncoated bars suffered severe macrocell corrosion. The lack of a protective coating resulted in the steel
surface being continuously exposed all along wet and dry regions, and through regions with variable
moisture content and chloride contamination. Oxygen availability, mostly due to cracking, aggravated
corrosion severity. Large rust stains developed on the exterior concrete surface at the locations of severely
pitted bars.
4.3 RECOMMENDATIONS
To improve the long-term performance of coated bars and stirrups, damage to coating needs to be
minimized, patching requirements need to be modified, better coating adhesion to steel substrate may be
beneficial, and the effect of cracked concrete surfaces needs to be considered.
4.3.1 Quality of Coating
Damage to coating due to bending and other operations should be minimized. Stirrups should be
fabricated by using protective materials, such as high-density plastic sleeves, at contact points between
the coated bar and bending equipment. Use of fluidized beds or conveyor belts carrying fabricated items
to be coated through the spray chamber should be considered.
4.3.2 Specifications
A better repair system (material and procedure) should be specified. Bar cut ends should be treated
carefully. For ease of construction and identification of previously repaired areas, it is recommended that
the color of the patching material be different from the original coating. The thickness of the coating at

148
the repaired areas should be comparable with the original coating. A procedure for determining the
adequacy of repair should be developed. Research Report 1265-5 includes recommendations for patching
epoxy-coated bars.48
4.3.3 Design Recommendations
To reduce both chloride penetration to coated steel and development of plastic settlement cracking, a
thicker concrete cover is required. A proper design strategy should include elimination of unnecessary
joints, and prevention or reduction of cracking instead of crack width control. A viable option to control
cracking in bridge decks is to use transverse prestressing. In addition, mixing coated and uncoated bars
should be avoided.
4.3.4 Field Recommendations
Tying of coated reinforcement should be done with care not to damage coating even when using protected
tie wires. Modified tools and materials for tying and separating bar grids to eliminate metal contact would
be useful. A check of electrical continuity before casting may give an indication of corrosion
characteristics of an assembled cage. In addition, treatment of cracks on concrete surfaces using
waterproofing materials and sealants available for this purpose should be considered.
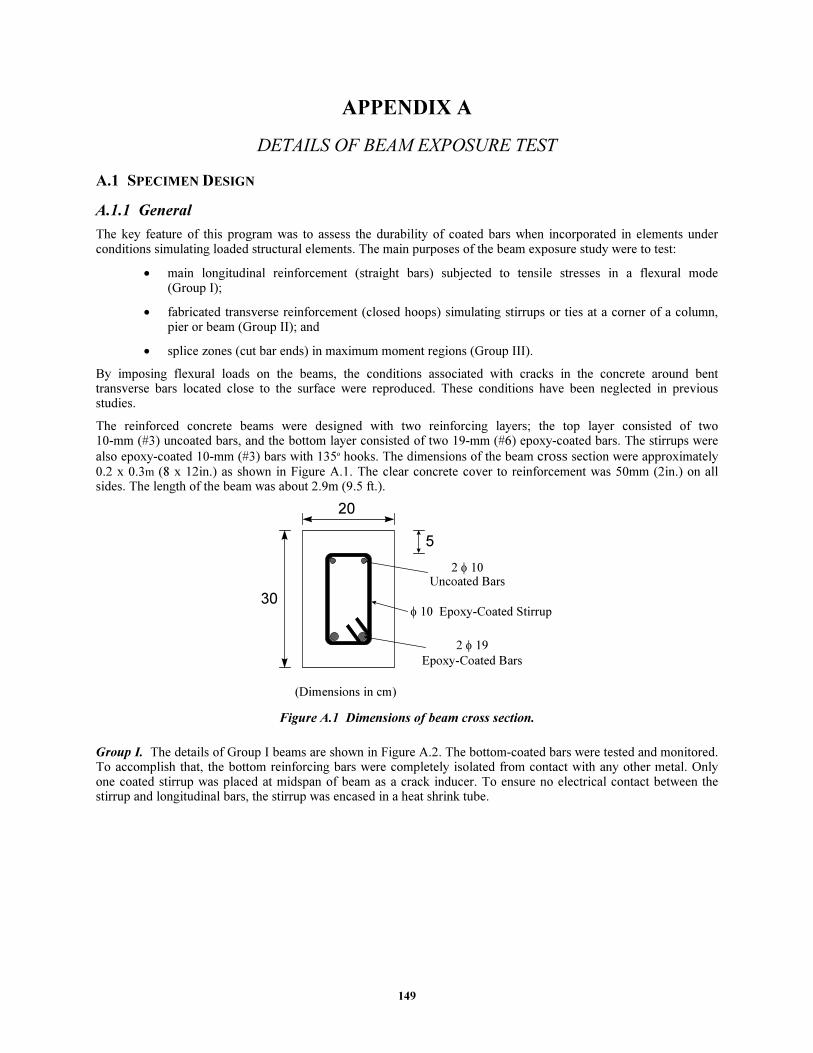
149
APPENDIX A
DETAILS OF BEAM EXPOSURE TEST
A.1 SPECIMEN DESIGN
A.1.1 General
The key feature of this program was to assess the durability of coated bars when incorporated in elements under conditions simulating loaded structural elements. The main purposes of the beam exposure study were to test:
• main longitudinal reinforcement (straight bars) subjected to tensile stresses in a flexural mode (Group I);
• fabricated transverse reinforcement (closed hoops) simulating stirrups or ties at a corner of a column, pier or beam (Group II); and
• splice zones (cut bar ends) in maximum moment regions (Group III).
By imposing flexural loads on the beams, the conditions associated with cracks in the concrete around bent transverse bars located close to the surface were reproduced. These conditions have been neglected in previous studies.
The reinforced concrete beams were designed with two reinforcing layers; the top layer consisted of two 10-mm (#3) uncoated bars, and the bottom layer consisted of two 19-mm (#6) epoxy-coated bars. The stirrups were
also epoxy-coated 10-mm (#3) bars with 135o hooks. The dimensions of the beam cross section were approximately 0.2 x 0.3m (8 x 12in.) as shown in Figure A.1. The clear concrete cover to reinforcement was 50mm (2in.) on all sides. The length of the beam was about 2.9m (9.5 ft.).
20
30
5
2 φ 10Uncoated Bars
2 φ 19
Epoxy-Coated Bars
φ 10 Epoxy-Coated Stirrup
(Dimensions in cm)
Figure A.1 Dimensions of beam cross section.
Group I. The details of Group I beams are shown in Figure A.2. The bottom-coated bars were tested and monitored. To accomplish that, the bottom reinforcing bars were completely isolated from contact with any other metal. Only one coated stirrup was placed at midspan of beam as a crack inducer. To ensure no electrical contact between the stirrup and longitudinal bars, the stirrup was encased in a heat shrink tube.

150
2.90 m (9'-6")
2.75 m (9')
Heat Shrink Shield to
Isolate Stirrup from
Long. Bar
φ19 Epoxy-Coated Reinforcement
AS RECEIVEDb
3 % DAMAGE PATCHED
CRACKED LOADEDa
LONGITUDINAL BARS
3 % DAMAGE NOT
PATCHED
UNCRACKED UNLOADED CRACKED UNLOADED
B1, B2 B3, B4 B5, B6
B7, B8 B9, B10 B11, B12
B13, B14
Underlined specimens exposed for 4.3 years a Imposed loads causing bending about strong axis and to open cracks to 0.33mm
b No visible damage
Figure A.2 Details of group I beam specimen.
Group II. The details of Group II beams are shown in Figure A.3. The coated stirrups were tested and monitored. The bottom longitudinal bars were encased in heat shrink tubes to isolate them from the single stirrup at midspan of the beam. No similar precaution was introduced for the top reinforcement at the location of the stirrup. A plastic-covered wire was used to tie the coated stirrup to all longitudinal bars. This arrangement is similar to that at curbs of bridge decks where uncoated bent bars rise up and are tied to coated bars using a protected wire.
2.90 m (9'-6")
2.75 m (9')
Heat Shrink Shield to IsolateLongitudinal Bars from Stirrups
3 % DAMAGE (PATCHED)
CRACKED LOADEDa
STIRRUPS
AS RECEIVED (PATCHED)
φ10 Epoxy-Coated Stirrup
1.50 m (5')
AS RECEIVED (NOT
PATCHED)c
UNCRACKED UNLOADED CRACKED UNLOADED
B15, B16 B17, B18 B19, B20
B21, B22 B23, B24 B25, B26
B27, B28
Underlined specimens exposed for 4.3 years a Imposed loads causing bending about strong axis and to open cracks to 0.33mm
c No patch on bends
Figure A.3 Details of group II beam specimen.
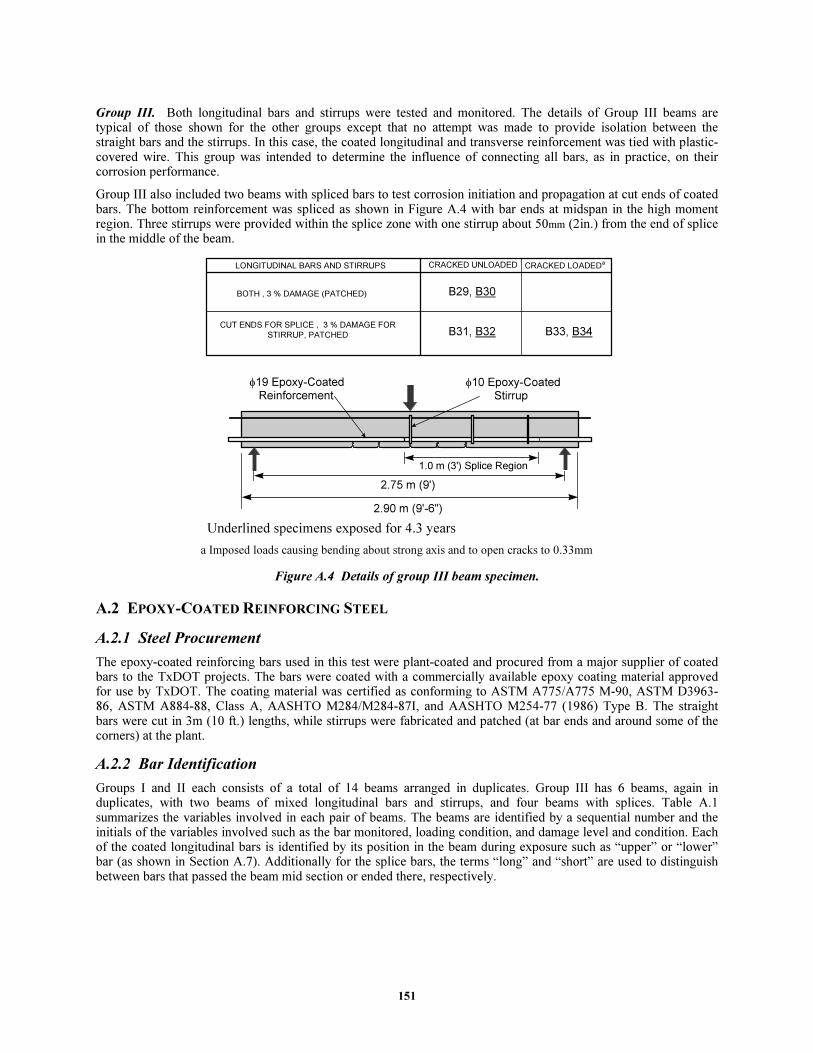
151
Group III. Both longitudinal bars and stirrups were tested and monitored. The details of Group III beams are typical of those shown for the other groups except that no attempt was made to provide isolation between the straight bars and the stirrups. In this case, the coated longitudinal and transverse reinforcement was tied with plastic-covered wire. This group was intended to determine the influence of connecting all bars, as in practice, on their corrosion performance.
Group III also included two beams with spliced bars to test corrosion initiation and propagation at cut ends of coated bars. The bottom reinforcement was spliced as shown in Figure A.4 with bar ends at midspan in the high moment region. Three stirrups were provided within the splice zone with one stirrup about 50mm (2in.) from the end of splice in the middle of the beam.
CUT ENDS FOR SPLICE , 3 % DAMAGE FOR
STIRRUP, PATCHED
2.90 m (9'-6")
2.75 m (9')
φ19 Epoxy-Coated Reinforcement
CRACKED LOADEDa
φ10 Epoxy-Coated Stirrup
LONGITUDINAL BARS AND STIRRUPS
BOTH , 3 % DAMAGE (PATCHED)
CRACKED UNLOADED
1.0 m (3') Splice Region
B29, B30
B31, B32 B33, B34
Underlined specimens exposed for 4.3 years
a Imposed loads causing bending about strong axis and to open cracks to 0.33mm
Figure A.4 Details of group III beam specimen.
A.2 EPOXY-COATED REINFORCING STEEL
A.2.1 Steel Procurement
The epoxy-coated reinforcing bars used in this test were plant-coated and procured from a major supplier of coated bars to the TxDOT projects. The bars were coated with a commercially available epoxy coating material approved for use by TxDOT. The coating material was certified as conforming to ASTM A775/A775 M-90, ASTM D3963-86, ASTM A884-88, Class A, AASHTO M284/M284-87I, and AASHTO M254-77 (1986) Type B. The straight bars were cut in 3m (10 ft.) lengths, while stirrups were fabricated and patched (at bar ends and around some of the corners) at the plant.
A.2.2 Bar Identification
Groups I and II each consists of a total of 14 beams arranged in duplicates. Group III has 6 beams, again in duplicates, with two beams of mixed longitudinal bars and stirrups, and four beams with splices. Table A.1 summarizes the variables involved in each pair of beams. The beams are identified by a sequential number and the initials of the variables involved such as the bar monitored, loading condition, and damage level and condition. Each of the coated longitudinal bars is identified by its position in the beam during exposure such as “upper” or “lower” bar (as shown in Section A.7). Additionally for the splice bars, the terms “long” and “short” are used to distinguish between bars that passed the beam mid section or ended there, respectively.

152
Table A.1 Summary of beam exposure study variables.
Beam No. Bar Monitored
Loading Conditiona Damage Level and Condition
B1, B2 Longit. Uncracked, Unloaded As-Receivedb
B3, B4 Longit. Cracked, Unloaded As-Received
B5, B6 Longit. Cracked, Loaded As-Received
B7, B8 Longit. Uncracked, Unloaded 3% Damaged
B9, B10 Longit. Cracked, Unloaded 3% Damaged
B11, B12 Longit. Cracked, Loaded 3% Damaged
B13, B14 Longit. Cracked, Unloaded 3% Damaged (Patched)
B15, B16 Stirrup Uncracked, Unloaded As-Receivedc
B17, B18 Stirrup Cracked, Unloaded As-Received
B19, B20 Stirrup Cracked, Loaded As-Received
B21, B22 Stirrup Uncracked, Unloaded As-Received (Patched)
B23, B24 Stirrup Cracked, Unloaded As-Received (Patched)
B25, B26 Stirrup Cracked, Loaded As-Received (Patched)
B27, B28 Stirrup Cracked, Unloaded 3% Damaged (Patched)
B29, B30 L / St Cracked, Unloaded Both 3% Damaged (Patched)
B31, B32 Splice Cracked, Unloaded Stirrup 3% Damaged (Stirrup & Bar End Patched)
B33, B34 Splice Cracked, Loaded Stirrup 3% Damaged (Stirrup & Bar End Patched)
a Loading and Unloading refer to imposed loads causing bending about the strong axis b No visible damage c No patch on bends
A.2.3 Steel Tensile Strength
Two coated steel samples of the longitudinal bars were tested to obtain the tensile yield strength, yield strain, and ultimate strength. No significant differences existed between the results of the replicate test samples. Therefore, the average test values were used to construct the stress-strain curve shown in Figure A.5. The measured strengths
conformed to the requirements of ASTM A615-87a.49
The average yield strength was 437 MPa (63 ksi) exceeding 414 MPa (60 ksi) and the average ultimate strength was 701 MPa (102 ksi) exceeding 621 MPa (90 ksi).
Figure A.5 Stress-strain curve for the 19mm bars.

153
A.2.4 Epoxy-Coating Thickness
A thumbwheel pull-off magnetic gage was used to measure the coating thickness on straight lengths of the epoxy-
coated bars and stirrups. The procedure described in ASTM G12-8350
was followed. For each bar specimen, the average coating thickness of six measurements and the maximum deviation in thickness from the average are reported in Tables A.2 to A.4.
Both ASTM A775 and ASTM D3963 require that at least 90% of all recorded film thickness measurements must be
between 130 and 300 µm (5-12 mils). ASTM A775 further requires that the deviation in coating thickness not
exceed ±50 µm (±2 mils) or deviate ±30% from the average thickness, whichever is less. All coating thickness measurements on longitudinal bars and stirrups were within the specified range. However, 13 readings, or 31% of all longitudinal bar measurements and 15% of all stirrup measurements, did not satisfy the deviation requirements. Thus, there was lack of uniformity in the coating thickness and not all bars met the specification requirements.
In general, the 19-mm (#6) bar specimens had thicker coatings than the 10-mm (#3) stirrups. The average coating
thickness of the larger and smaller size bars were 240 and 190 µm (9.4 and 7.4 mils), respectively. However, the uniformity of coating thickness of the smaller bars was better than that of the larger bars.
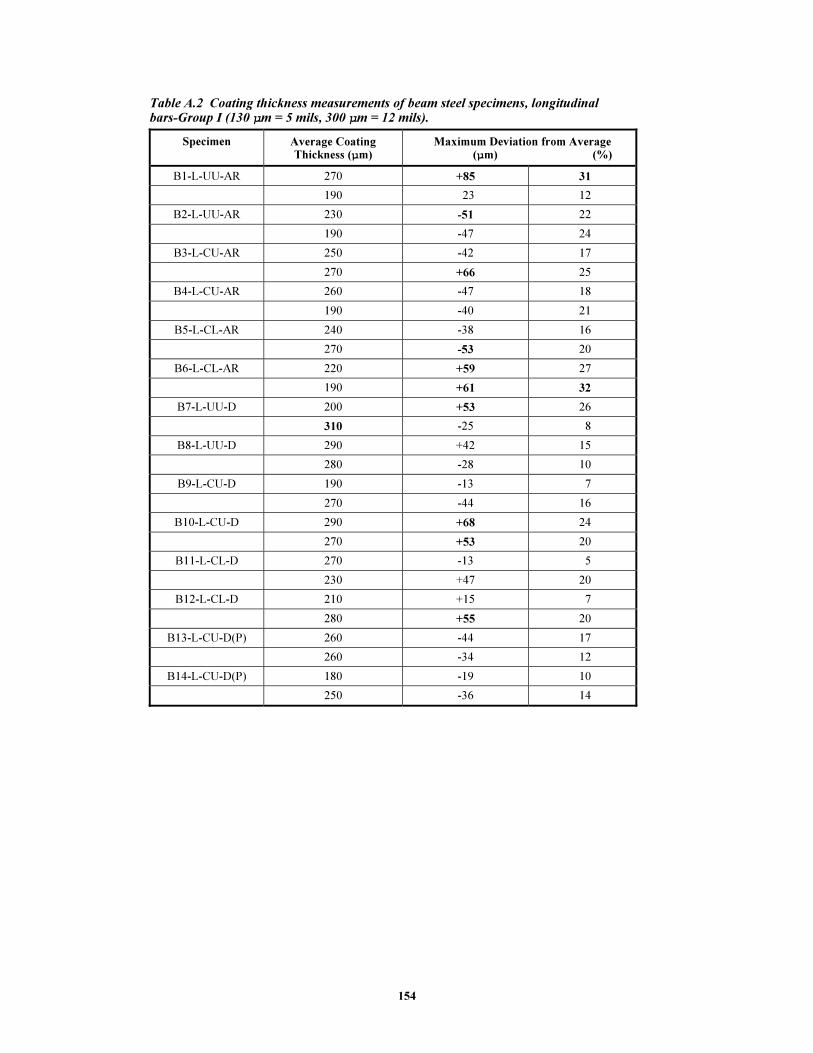
154
Table A.2 Coating thickness measurements of beam steel specimens, longitudinal bars-Group I (130 µm = 5 mils, 300 µm = 12 mils).
Specimen Average Coating Thickness (µm)
Maximum Deviation from Average (µm) (%)
B1-L-UU-AR 270 +85 31
190 23 12
B2-L-UU-AR 230 -51 22
190 -47 24
B3-L-CU-AR 250 -42 17
270 +66 25
B4-L-CU-AR 260 -47 18
190 -40 21
B5-L-CL-AR 240 -38 16
270 -53 20
B6-L-CL-AR 220 +59 27
190 +61 32
B7-L-UU-D 200 +53 26
310 -25 8
B8-L-UU-D 290 +42 15
280 -28 10
B9-L-CU-D 190 -13 7
270 -44 16
B10-L-CU-D 290 +68 24
270 +53 20
B11-L-CL-D 270 -13 5
230 +47 20
B12-L-CL-D 210 +15 7
280 +55 20
B13-L-CU-D(P) 260 -44 17
260 -34 12
B14-L-CU-D(P) 180 -19 10
250 -36 14

155
Table A.3 Coating thickness measurements of beam steel specimens, stirrups-Group II (130 µm = 5 mils, 300 µm = 12 mils).
Specimen Average Coating Thickness (µm)
Maximum Deviation from Average (µm) (%)
B15-L-UU-AR 230 -51 22
B16-ST-UU-AR 170 -19 11
B17-ST-CU-AR 180 -25 14
B18-ST-CU-AR 180 +22 12
B19-ST-CL-AR 190 -41 21
B20-ST-CL-AR 180 -25 14
B21-ST-UU-AR(P) 160 -60 37
B22-ST-UU-AR(P) 210 +29 13
B23-ST-CU-AR(P) 200 -76 38
B24-ST-CU-AR(P) 190 +35 18
B25-ST-CL-AR(P) 210 +22 11
B26-ST-CL-AR(P) 200 -25 13
B27-ST-CU-D(P) 180 -25 14
B28-ST-CU-D(P) 200 +29 14
Table A.4 Coating thickness measurements of beam steel specimens, longitudinal bars and stirrups-Group III (130 µm = 5 mils, 300 µm = 12 mils).
Specimen Average Coating Thickness (µm)
Maximum Deviation from Average (µm) (%)
Longitudinal Bars
B29-L/ST-CU-D(P) 190 +38 20
200 +30 15
B30-L/ST-CU-D(P) 240 -19 8
200 -19 10
Stirrups
B29-L/ST-CU-D(P) 200 -19 10
B30-L/ST-CU-D(P) 190 +16 8
B31-SP-CU-D(P) 170 -19 11
B32-SP-CU-D(P) 170 +32 19
B33-SP-CL-D(P) 170 0 0
B34-SP-CL-D(P) 160 -44 27
A.2.5 Coating Defects and Introduced Damage
The condition of the bars was carefully inspected and documented before deliberately introducing any damage. The documentation included the coating appearance, and the number and location of existing damage. All bars had the same uniform, glossy appearance, with fair coating coverage and well-defined deformations. Fabrication of stirrups resulted in only minor damage to coating concentrated inside the bends.
A predetermined amount of damage was introduced in the coating on some bars using a sharp blade. Damage was in the form of small rectangles that exposed approximately 3% of the bar surface area at a specific location. For the longitudinal reinforcement, damage was estimated and distributed along the middle 0.91m (3 ft.) of the bar. Damage spots were located between transverse lugs and at the lugs themselves. Some of the spots were offset from the center to include some of the longitudinal continuous ribs.

156
The number and size of damage spots were approximately as follows: 11- 13 x 10mm (1/2 x 3/8in.); 7- 6 x 6mm (1/4 x 1/4in.); and 3- 3 x 3 (1/8 x 1/8in.). For the stirrups, damage was estimated for roughly half the length of the stirrup, and was distributed along the outer surfaces of the bends at one side of the stirrup. A total of 10 damage spots with an approximate size of 6 x 6mm (1/4 x 1/4in.) was introduced.
The introduced damage was also documented and each bar was photographed to keep a record of the initial condition. A two-part liquid epoxy, compatible with the coating material, was used for repair where desired. The exposed steel areas were not given any special treatment before applying the patching material by brush. The cut bar ends in the splice zone were also patched in a similar manner. Stirrups which were previously patched at the plant were patched again around the bends were damage was not adequately repaired. Figures A.6 to A.8 show examples of the bars included in the beam exposure study.
(a) 3% damage in middle segment of bar
(b) Close up of the damaged area
Figure A.6 Damage spots on 19mm longitudinal bar.
(a) As-received condition of bends
(b) As-received, patched condition of bends
Figure A.7 Stirrup condition without introduced damage.
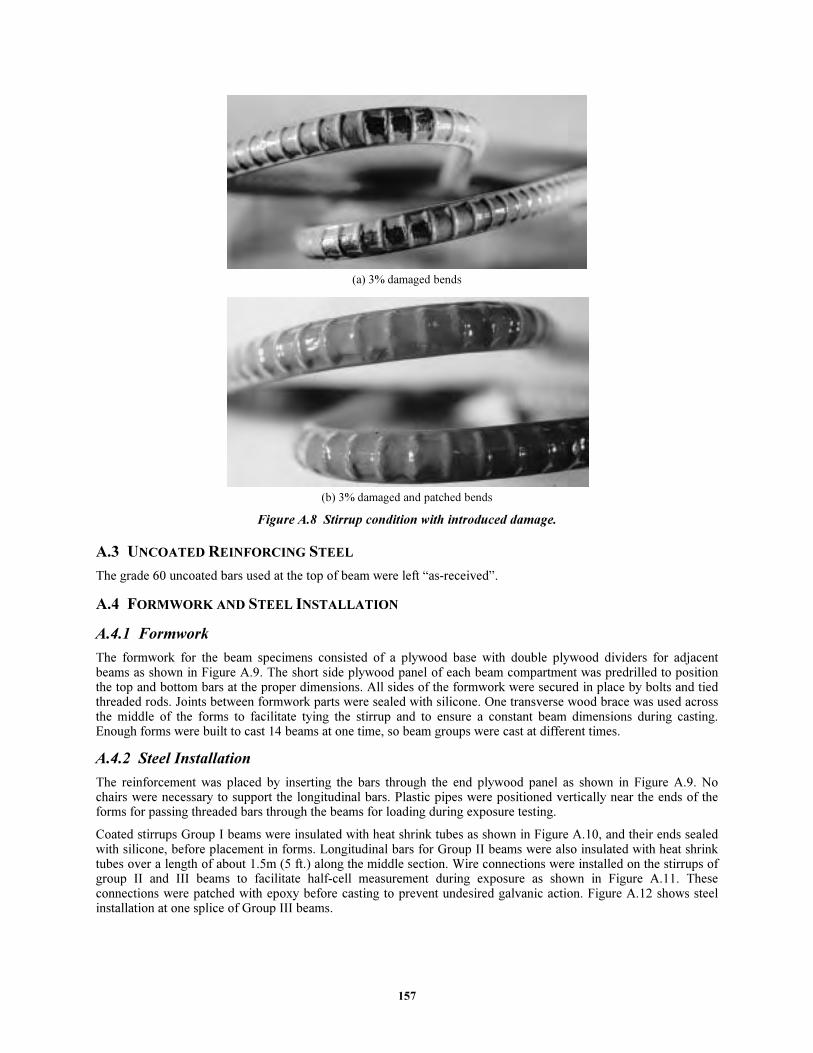
157
(a) 3% damaged bends
(b) 3% damaged and patched bends
Figure A.8 Stirrup condition with introduced damage.
A.3 UNCOATED REINFORCING STEEL
The grade 60 uncoated bars used at the top of beam were left “as-received”.
A.4 FORMWORK AND STEEL INSTALLATION
A.4.1 Formwork
The formwork for the beam specimens consisted of a plywood base with double plywood dividers for adjacent beams as shown in Figure A.9. The short side plywood panel of each beam compartment was predrilled to position the top and bottom bars at the proper dimensions. All sides of the formwork were secured in place by bolts and tied threaded rods. Joints between formwork parts were sealed with silicone. One transverse wood brace was used across the middle of the forms to facilitate tying the stirrup and to ensure a constant beam dimensions during casting. Enough forms were built to cast 14 beams at one time, so beam groups were cast at different times.
A.4.2 Steel Installation
The reinforcement was placed by inserting the bars through the end plywood panel as shown in Figure A.9. No chairs were necessary to support the longitudinal bars. Plastic pipes were positioned vertically near the ends of the forms for passing threaded bars through the beams for loading during exposure testing.
Coated stirrups Group I beams were insulated with heat shrink tubes as shown in Figure A.10, and their ends sealed with silicone, before placement in forms. Longitudinal bars for Group II beams were also insulated with heat shrink tubes over a length of about 1.5m (5 ft.) along the middle section. Wire connections were installed on the stirrups of group II and III beams to facilitate half-cell measurement during exposure as shown in Figure A.11. These connections were patched with epoxy before casting to prevent undesired galvanic action. Figure A.12 shows steel installation at one splice of Group III beams.

158
Figure A.9 Formwork for beam specimens.
Figure A.10 Steel detailing of Group I beam specimen.

159
Figure A.11 Internal stirrup connection for Group II beam specimen.
Figure A.12 Steel detailing of Group III beam specimen.
A.5 CONCRETE
A.5.1 Mixture Design
Concrete of reduced strength and increased permeability was used to construct the test beams. Three similar concrete batches were ordered at different times to cast the three groups of beams. The details of the concrete mixtures are shown in Table A.5.

160
Table A.5 Concrete mixture details for the beam exposure study.
Material Quantity Unit
Group I
20mm Rock, SSD 1120 kg/m3
Sand, SSD 828 kg/m3
Type I Portland Cement 222 kg/m3
Pozzolana R 10 kg/m3
Water 145 kg/m3
W/C Ratio, by weight 0.62
Unit Weight 2217 kg/m3
Slump 150-175 mm
Group II
20mm Rock, SSD 1088 kg/m3
Sand, SSD 833 kg/m3
Type I Portland Cement 222 kg/m3
Pozzolana R 10 kg/m3
Water 144 kg/m3
W/C Ratio, by weight 0.62
Unit Weight 2268 kg/m3
Slump 150-175 mm
Group III
20mm Rock, SSD 1090 kg/m3
Sand, SSD 840 kg/m3
Type I Portland Cement 221 kg/m3
Pozzolana R 10 kg/m3
Water 145 kg/m3
W/C Ratio, by weight 0.63
Unit Weight 2197 kg/m3
Slump 175 mm
A.5.2 Casting
Concrete was batched and supplied by a commercial ready mix supplier. Casting was done indoors directly from the
truck into the forms. The concrete was placed in one lift and consolidated using 50-mm (2in.) φ head internal vibrators as shown in Figure A.13. The vibrators were inserted mainly along the middle of the beam to avoid shifting or damaging the steel bars.
During each casting, the same concrete was used to cast all beams within a group and a large number of standard cylinders. The specimens were screeded immediately after placing concrete and trowelled shortly after. The specimens were then covered with plastic sheets for a short time to reduce water evaporation.
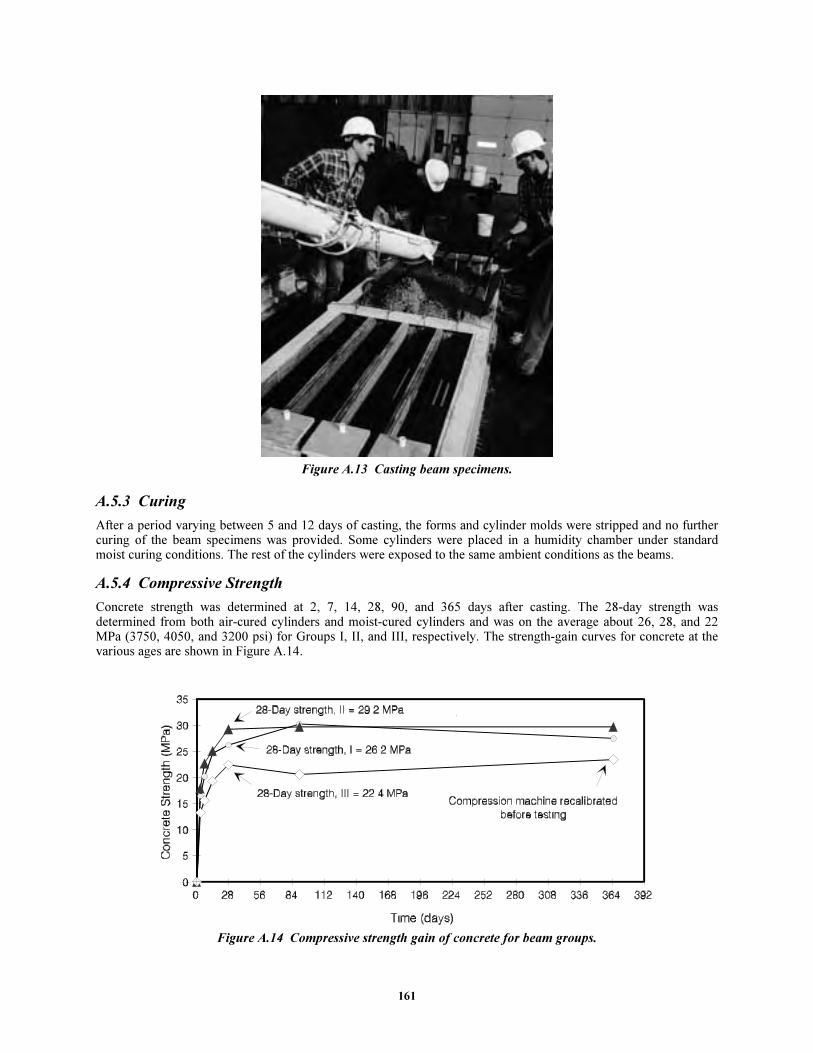
161
Figure A.13 Casting beam specimens.
A.5.3 Curing
After a period varying between 5 and 12 days of casting, the forms and cylinder molds were stripped and no further curing of the beam specimens was provided. Some cylinders were placed in a humidity chamber under standard moist curing conditions. The rest of the cylinders were exposed to the same ambient conditions as the beams.
A.5.4 Compressive Strength
Concrete strength was determined at 2, 7, 14, 28, 90, and 365 days after casting. The 28-day strength was determined from both air-cured cylinders and moist-cured cylinders and was on the average about 26, 28, and 22 MPa (3750, 4050, and 3200 psi) for Groups I, II, and III, respectively. The strength-gain curves for concrete at the various ages are shown in Figure A.14.
Figure A.14 Compressive strength gain of concrete for beam groups.

162
A.5.5 Permeability
Concrete permeability was determined from 100 x 200mm (4 x 8in.) cylinders using a standard test procedure for
Rapid Determination of the Chloride Permeability of Concrete (AASHTO T277-83).51
Some cylinders were kept air dry and some were soaked in water whenever the beams were undergoing a wet period during the exposure cycle.
Cylinders from the three groups were tested for permeability at four different ages within 15 months from casting. The average permeability measurements for the air-dried cylinders for all tests were approximately 8200, 5700, and 11500 coulombs for the three groups in order. Similarly, the average permeability measurements for the wetted cylinders were approximately 6500, 5600, and 7200 coulombs in the same order. Although the results of the wetted cylinders were, as expected, less than those of the air-dried cylinders, all values fell under the standard classification of “high” permeability.
A.6 TEST SETUP
A.6.1 Specimen and Test Preparation
The beams were moved carefully to a large testing room on the second floor of a different building. Wood supports were built and arranged in a manner to hold the beams in pairs placed back to back resting on their 300mm (12in.) long sides. The bottom of the beams as cast faced out as shown in Figure A.15. Solid steel bars, 50 x 50mm (2in.) in section, separated the beams at mid span.
Due to space limitations, the 34 beams were laid out in three rows over four parallel lines of supports. The two middle lines of supports were loaded first. These supports were lower than the outer ones so that the ends of the beams resting on them served as supports for the higher level beams on either side.
In order to crack the beams and open cracks to the desired width, loads were applied with threaded rods which extended through the beams at the ends. A center-hole hydraulic ram and a pump were used to load the beams as shown in Figure A.16. A pressure transducer was attached to the pump to monitor the load. This system permitted loading a pair of beams by applying a tension force to the rod at one end and causing reactions at the other end and at the middle through the separator bar.
Figure A.15 Laying out beams in testing room.
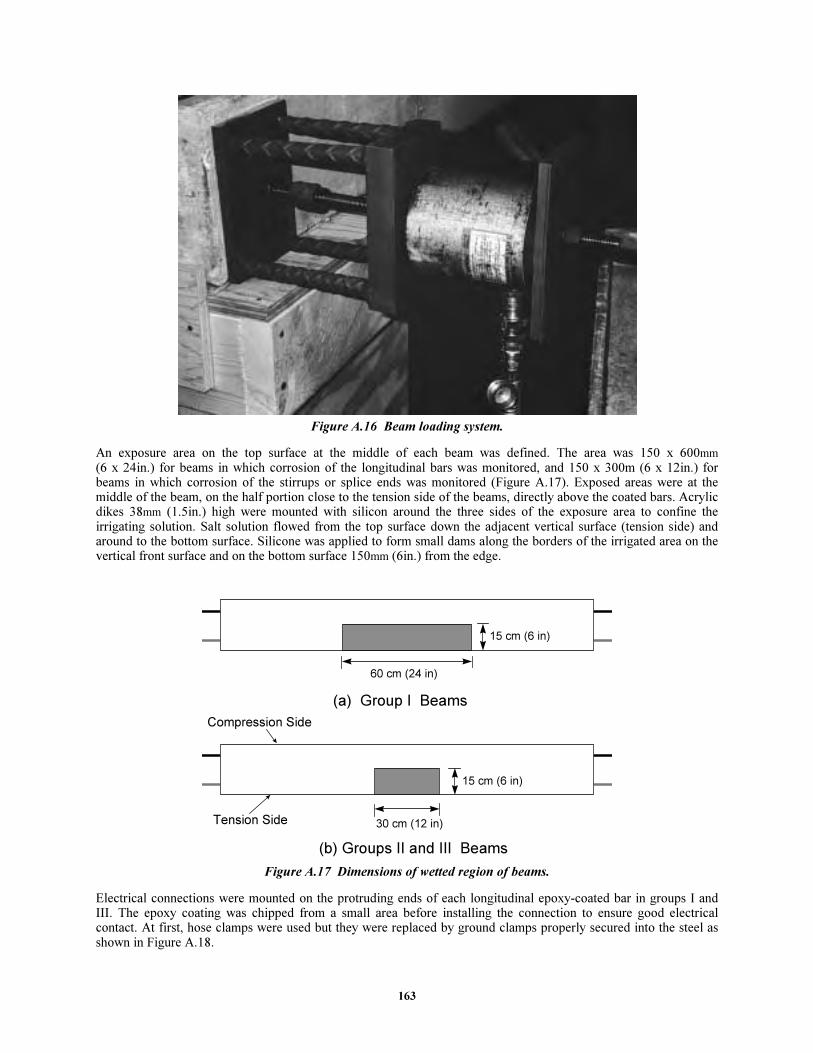
163
Figure A.16 Beam loading system.
An exposure area on the top surface at the middle of each beam was defined. The area was 150 x 600mm (6 x 24in.) for beams in which corrosion of the longitudinal bars was monitored, and 150 x 300m (6 x 12in.) for beams in which corrosion of the stirrups or splice ends was monitored (Figure A.17). Exposed areas were at the middle of the beam, on the half portion close to the tension side of the beams, directly above the coated bars. Acrylic dikes 38mm (1.5in.) high were mounted with silicon around the three sides of the exposure area to confine the irrigating solution. Salt solution flowed from the top surface down the adjacent vertical surface (tension side) and around to the bottom surface. Silicone was applied to form small dams along the borders of the irrigated area on the vertical front surface and on the bottom surface 150mm (6in.) from the edge.
60 cm (24 in)
15 cm (6 in)
15 cm (6 in)
30 cm (12 in)
(a) Group I Beams
(b) Groups II and III Beams
Tension Side
Compression Side
Figure A.17 Dimensions of wetted region of beams.
Electrical connections were mounted on the protruding ends of each longitudinal epoxy-coated bar in groups I and III. The epoxy coating was chipped from a small area before installing the connection to ensure good electrical contact. At first, hose clamps were used but they were replaced by ground clamps properly secured into the steel as shown in Figure A.18.

164
Figure A.18 External bar connection for corrosion potential measurement.
Reference grid lines with measurement points for corrosion potentials were drawn on the beam surfaces to show the bar location. Points of corrosion potential measurement were spaced at every 15cm (6in.), over a 1.50m (5 ft.) region along the middle of the beam. The points (a total of 11) were numbered 0 at the middle, positively to the right, and negatively to the left. The spacing along the stirrup sides ranged from 5 to 10cm (2 to 4in.). Seven points were marked along the stirrup, with 0 at the middle of the vertical surface, positively upward, and negatively downward. The points in each direction coincided with the near corner of the stirrup, the middle point along the leg, and the far corner. Figure A.19 shows an isometric drawing of the coupled beams with the reference grid lines and points of measurement. The longitudinal bar which faces up in this arrangement was labeled “upper” and the bar below “lower”.
5
4
32
10
-1
-2
-3-4
-5
3 2
1 0
-1
5
4
32
1
0-1
-2
-3-4
-54
3
2
1
0
-1
-2
-3
-4
Grid for
Black BarsGrids for Epoxy-
Coated Bars
Grid for Epoxy-
Coated Stirrup
Figure A.19 Grid points for corrosion potential measurement.
A salt-water distribution network made of PVC pipes was installed above and between the coupled beams. At the starting point near the center, an open plastic tank was placed on the floor below the beams and a stainless steel, end suction, single stage centrifugal pump was mounted. A flow control system was provided to distribute the salt solution at the exposure area of each beam. The system consisted of bubblers (flow control devices operating under pressure) and small diameter flexible tubing. The tubes were clamped to the Plexiglas dikes to direct the flow over the exposure area.
Finally, a collecting system was prepared and installed beneath the beams to transfer the solution back to the tank by gravity. Wooden collectors covered with plastic sheets were assembled with tilting bases to drain the solution from
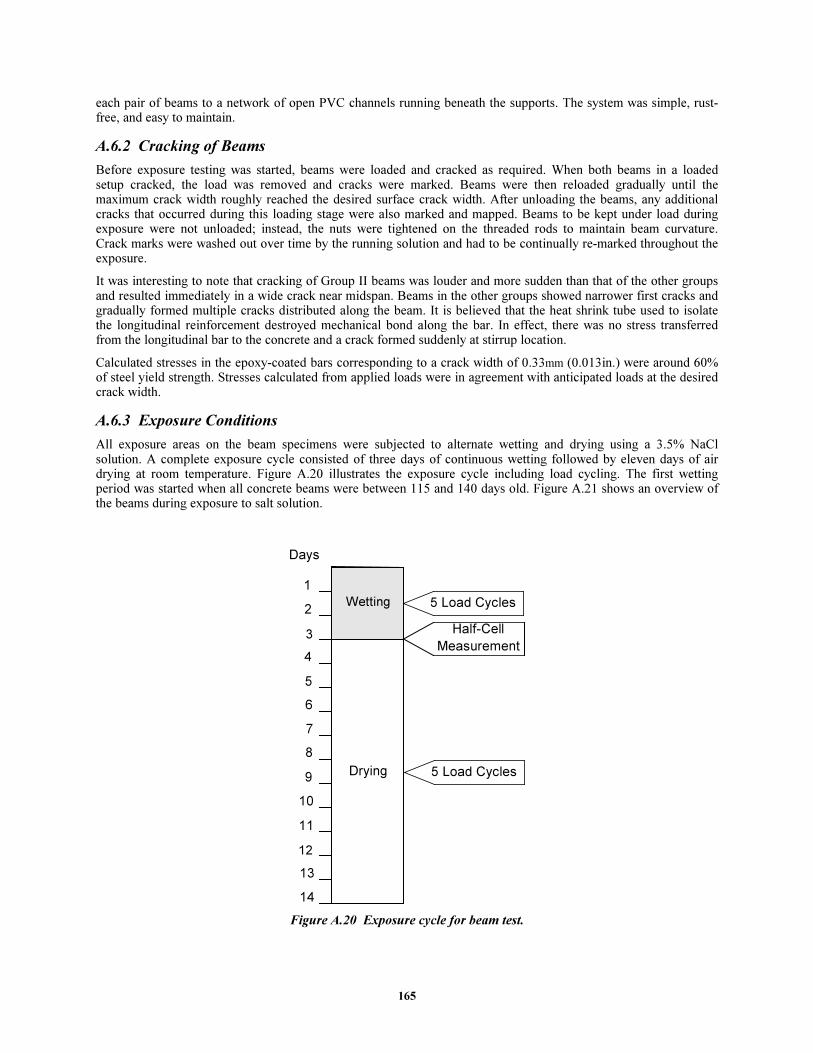
165
each pair of beams to a network of open PVC channels running beneath the supports. The system was simple, rust-free, and easy to maintain.
A.6.2 Cracking of Beams
Before exposure testing was started, beams were loaded and cracked as required. When both beams in a loaded setup cracked, the load was removed and cracks were marked. Beams were then reloaded gradually until the maximum crack width roughly reached the desired surface crack width. After unloading the beams, any additional cracks that occurred during this loading stage were also marked and mapped. Beams to be kept under load during exposure were not unloaded; instead, the nuts were tightened on the threaded rods to maintain beam curvature. Crack marks were washed out over time by the running solution and had to be continually re-marked throughout the exposure.
It was interesting to note that cracking of Group II beams was louder and more sudden than that of the other groups and resulted immediately in a wide crack near midspan. Beams in the other groups showed narrower first cracks and gradually formed multiple cracks distributed along the beam. It is believed that the heat shrink tube used to isolate the longitudinal reinforcement destroyed mechanical bond along the bar. In effect, there was no stress transferred from the longitudinal bar to the concrete and a crack formed suddenly at stirrup location.
Calculated stresses in the epoxy-coated bars corresponding to a crack width of 0.33mm (0.013in.) were around 60% of steel yield strength. Stresses calculated from applied loads were in agreement with anticipated loads at the desired crack width.
A.6.3 Exposure Conditions
All exposure areas on the beam specimens were subjected to alternate wetting and drying using a 3.5% NaCl solution. A complete exposure cycle consisted of three days of continuous wetting followed by eleven days of air drying at room temperature. Figure A.20 illustrates the exposure cycle including load cycling. The first wetting period was started when all concrete beams were between 115 and 140 days old. Figure A.21 shows an overview of the beams during exposure to salt solution.
3
Wetting
14
Drying
5 Load Cycles
5 Load Cycles
1
13
12
11
10
9
8
7
6
5
4
2
Days
Half-Cell
Measurement
Figure A.20 Exposure cycle for beam test.

166
Figure A.21 View of beams in exposure room.
To compensate for evaporation and for solution permeating into concrete, the level of solution in the tank was monitored and adjusted during each wetting period. The solution was replaced every few cycles to maintain a constant salt concentration. Concrete surfaces at the exposed areas were washed periodically (every 2-3 cycles) with clean water to dissolve any salt buildup or crystallization in the concrete cover.
To promote corrosion during exposure to salt solution and drying, the cracked beams were subjected to cycles of
loading and unloading following a sequence used previously by Poston.5
On the second day of wetting, beams were subjected to five repeated loading cycles up to a load equal to that producing the desired crack width as determined during the initial cracking stage. During each load cycle, the maximum applied load was held constant for approximately five seconds before release. These load cycles pumped salt solution into the cracks to aggravate chloride accumulation at the reinforcement surface. On the same day of the following week (ninth day of exposure cycle) during drying, five additional load cycles were applied to each cracked beam. These load cycles increased oxygen supply to the reinforcement to enhance oxygen reduction and corrosion product oxidation.
A.7 ROUTINE MONITORING
A.7.1 Visual Examination
Beam specimens were visually inspected at the beginning of the test and periodically thereafter. The purpose of the examination was to observe any development of surface stains and corrosion-induced cracking.
A.7.2 Corrosion Potential Measurement
Corrosion potentials of the coated bars were measured against a saturated calomel electrode (SCE). The calomel electrode is a mercury/mercury chloride half-cell reference electrode. Measurements were made by connecting the reinforcing bar to the positive terminal of a high impedance DC voltmeter and the reference electrode to the negative terminal. The voltmeter displays potentials in the range 0-1000 mV with 1 mV precision. However, the values were recorded to the nearest multiple of 5 mV. A schematic diagram of the measuring circuit is shown in Figure A.22. A damp sponge was secured around the tip of the electrode to improve conductivity. Measurement procedure was in
accordance with ASTM C876.17
At first, measurements were made at the end of each wetting period. After the fourth cycle, however, measurements were made at the completion of every two wetting periods. Measuring potentials right after wetting was helpful because the beams were already damp and good concrete conductivity was achieved. However, to improve concrete conductivity in parts not exposed to NaCl, a wetting solution (water and detergent) was used to pre-wet all points of measurement before taking the readings. The potential records were transferred to an electronic spreadsheet for further analysis.

167
High Impedance Voltmeter
Connection to Base Steel
Reference
Electrode
Figure A.22 Schematic diagram of half-cell measuring circuit.
Samples of the diagrams of steel potential versus time of exposure after 4.3 years of exposure are shown in Chapter 2. No major differences of performance existed between the replicate beams during the first year of exposure.
The potentials at points ±4, and ±5 along the longitudinal bars were roughly similar but distinctly different from those at points near the beam midspan. The potentials at points within the exposure area were also very similar to each other. Therefore, the average potentials of the four end “dry” points and the five mid “wet” points were calculated and displayed in the corrosion potential plots of Chapter 2. In order to monitor any abrupt changes in potentials with time, the step or successive change of average potentials was calculated and plotted as well. The same procedure was followed for stirrups except that all points were grouped together as their potentials were not considerably different.
For duplicate specimens autopsied after one year, corrosion potentials of coated bars only were measured, and uncoated bars were not monitored. For the remaining specimens, corrosion potentials of the black bars in the compression side of the beams were also measured, with initial readings taken after about 1.3 years of exposure. Figure A.19 shows the location of measurement points along the black bar location. Measurement points were spaced at every 30cm (12in.), with one point at midspan and successive points to the right and left. The zone of measurements typically extended up to 2.4m (8 ft.), but in some cases it extended up to 1.2m (4 ft.) only because of limited access to the surfaces.
A.7.3 Temperature Measurement
The temperature in the test room was measured every time potentials were obtained. Although the temperatures varied between 19o C (66o F) and 32o C (90o F) over a period of 4.3 years, the effects of such variation on measured potentials are not significant. Potentials are ideally determined at a temperature of 22.2o C (72o F), and are corrected by a factor of -0.66 mV/Co. Thus, the maximum deviation of potential due to extreme temperature changes is only -6.5 mV. ASTM C876 requires that potentials be reported to the nearest 10 mV because of uncertainty inherent in the procedure. Hence, correcting the measured potentials to a base temperature was unnecessary.
A.7.4 Crack Width Measurement
Crack maps and crack widths were documented and updated during the exposure period. It was desired to detect any crack development or movement due to corrosion activity. For practical purposes, only selected cracks were monitored and measured every two cycles to detect changes in crack width. Three or four cracks at the midspan region were usually monitored. The crack width was measured using a graduated magnifying lens but most often using a crack comparator. Crack widths were initially measured at two points on the vertical surface: one point near the top and the other near the bottom surface. However, such points had to be changed as concrete deteriorated and made crack widths very difficult to measure. Figures A.23 to A.56 show the surface condition and crack maps of all beams removed after one and 4.3 years of testing. Tables A.6 to A.21 list the average crack widths of those cracks marked on the maps.
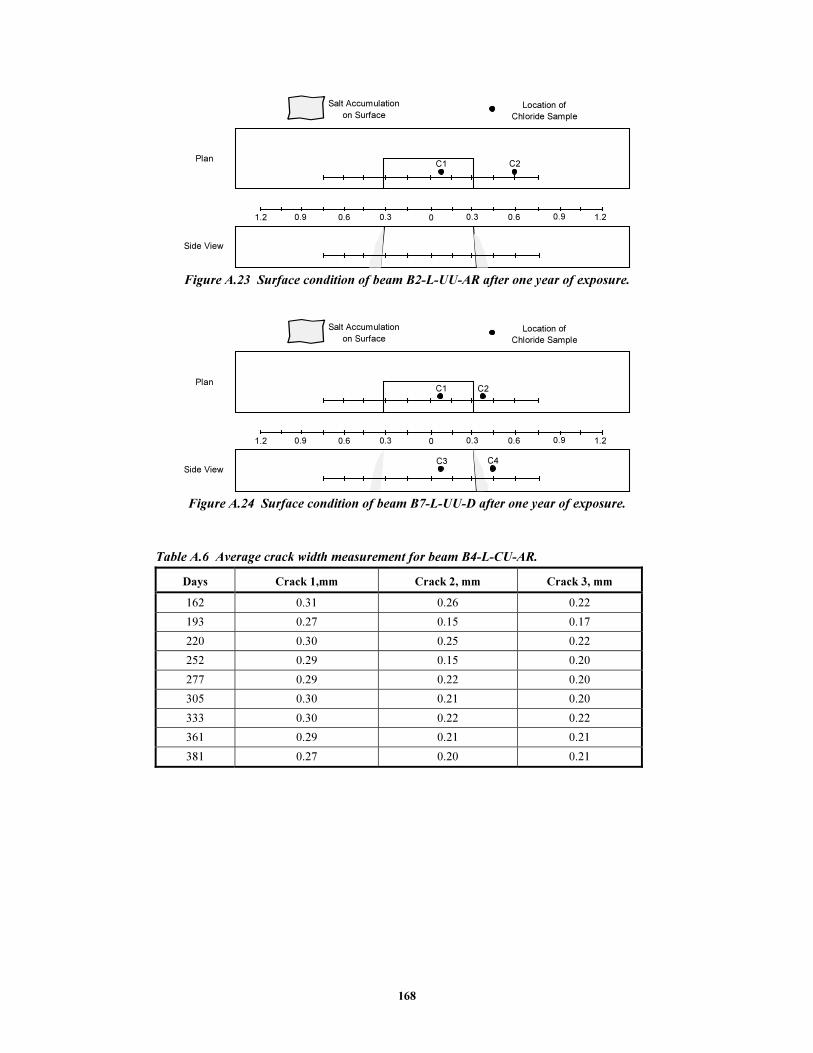
168
0
Salt Accumulation
on SurfaceLocation of
Chloride Sample
Plan
Side View
C1 C2
0.30.60.91.2 0.3 0.6 0.9 1.2
Figure A.23 Surface condition of beam B2-L-UU-AR after one year of exposure.
0
Salt Accumulation
on SurfaceLocation of
Chloride Sample
Plan
Side View
0.30.60.91.2 0.3 0.6 0.9 1.2
C1 C2
C3 C4
Figure A.24 Surface condition of beam B7-L-UU-D after one year of exposure.
Table A.6 Average crack width measurement for beam B4-L-CU-AR.
Days Crack 1,mm Crack 2, mm Crack 3, mm
162 0.31 0.26 0.22
193 0.27 0.15 0.17
220 0.30 0.25 0.22
252 0.29 0.15 0.20
277 0.29 0.22 0.20
305 0.30 0.21 0.20
333 0.30 0.22 0.22
361 0.29 0.21 0.21
381 0.27 0.20 0.21

169
0
Salt Accumulation
on Surface
Location of
Chloride Sample
Plan
Side View
0.30.60.91.2 0.3 0.6 0.9 1.2
C1 C2
1 2 3
Figure A.25 Surface condition of beam B4-L-CU-AR after one year of exposure.
0
Salt Accumulation
on Surface
Location of
Chloride Sample
Plan
Side View
0.30.60.91.2 0.3 0.6 0.9 1.2
C1 C2 C3
321
Figure A.26 Surface condition of beam B5-L-CL-AR after one year of exposure.
0
Salt Accumulation
on SurfaceLocation of
Chloride Sample
Plan
Side View
0.30.60.91.2 0.3 0.6 0.9 1.2
C1 C2
C3 C41 2 3
Figure A.27 Surface condition of beam B11-L-CL-D after one year of exposure.

170
Table A.7 Average crack width measurement for beam B9-L-CU-D.
Days Crack 1, mm Crack 2, mm Crack 3, mm
162 0.24 0.29 0.33
193 0.24 0.25 0.19
220 0.22 0.22 0.22
252 0.19 0.20 0.16
277 0.24 0.21 0.17
305 0.22 0.24 0.19
333 0.25 0.24 0.17
361 0.22 0.22 0.17
381 0.22 0.20 0.16
0
Salt Accumulation
on SurfaceLocation of
Chloride Sample
Plan
Side View
0.30.60.91.2 0.3 0.6 0.9 1.2
C5C1 C2 C3 C4
C7C61 2 3 4
Figure A.28 Surface condition of beam B9-L-CU-D after one year of exposure.
Table A.8 Average crack width measurement for beam B13-L-CU-D(P).
Days Crack 1, mm Crack 2, mm Crack 3, mm Crack 4, mm
162 0.16 0.16 0.20 0.16
193 0.12 0.12 0.17 0.12
220 0.15 0.20 0.17 0.15
252 0.12 0.17 0.17 0.12
277 0.12 0.16 0.16 0.12
305 0.13 0.17 0.16 0.15
333 0.13 0.17 0.16 0.12
361 0.12 0.15 0.15 0.11
381 0.12 0.16 0.13 0.11

171
0
Salt Accumulation
on SurfaceLocation of
Chloride Sample
Plan
Side View
0.30.60.91.2 0.3 0.6 0.9 1.2
C1
1 2 3 4
Figure A.29 Surface condition of beam B13-L-CU-D(P) after one year of exposure.
0
Salt Accumulation
on SurfaceLocation of
Chloride Sample
Plan
Side View
0.30.60.91.2 0.3 0.6 0.9 1.2
C1
C2
Figure A.30 Surface condition of beam B16-ST-UU-AR after one year of exposure.
0
Salt Accumulation
on SurfaceLocation of
Chloride Sample
Plan
Side View
0.30.60.91.2 0.3 0.6 0.9 1.2
C1
Figure A.31 Surface condition of beam B21-ST-UU-AR(P) after one year of exposure.

172
Table A.9 Average crack width measurement for beam B18-ST-CU-AR.
Days Crack 1, mm
162 0.41
193 0.54
220 0.44
252 0.45
277 0.44
305 0.45
333 0.44
361 0.44
381 0.43
0
Salt Accumulation
on Surface
Location of
Chloride Sample
Plan
Side View
0.30.60.91.2 0.3 0.6 0.9 1.2
C1
1
C2
C3
Figure A.32 Surface condition of beam B18-ST-CU-AR after one year of exposure.
0
Salt Accumulation
on SurfaceLocation of
Chloride Sample
Plan
Side View
0.30.60.91.2 0.3 0.6 0.9 1.2
C1
C2
1
Figure A.33 Surface condition of beam B20-ST-CL-AR after one year of exposure.
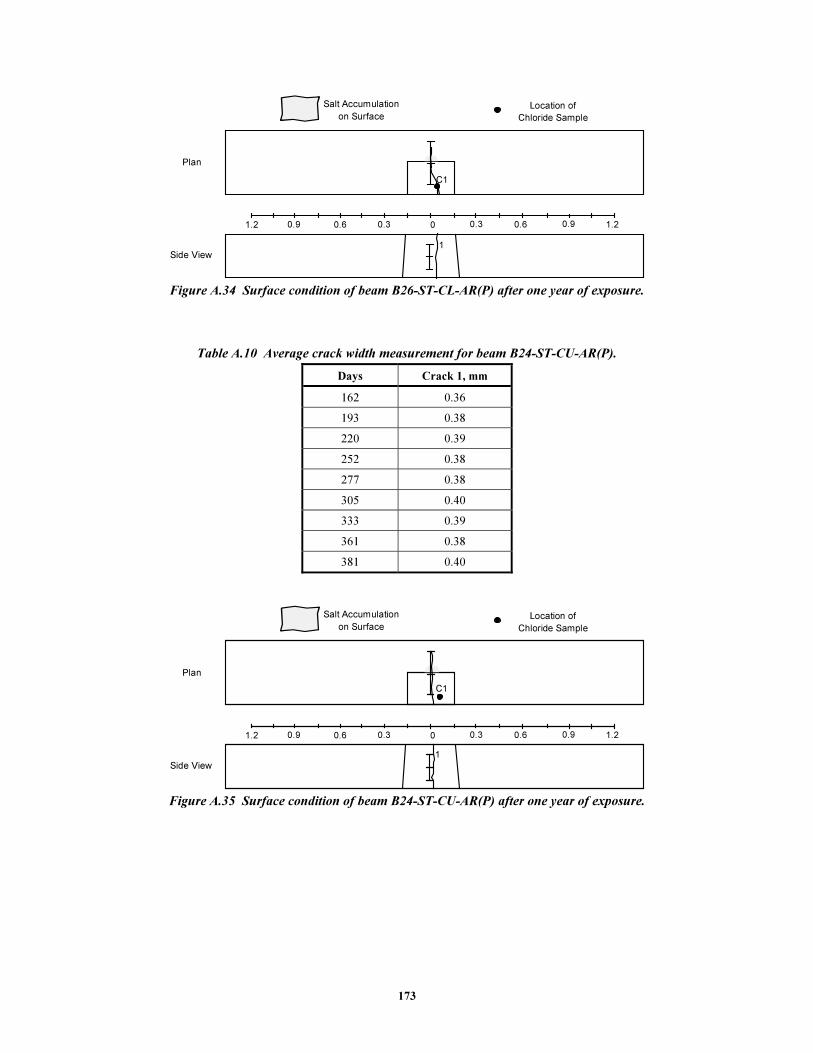
173
0
Salt Accumulation
on SurfaceLocation of
Chloride Sample
Plan
Side View
0.30.60.91.2 0.3 0.6 0.9 1.2
C1
1
Figure A.34 Surface condition of beam B26-ST-CL-AR(P) after one year of exposure.
Table A.10 Average crack width measurement for beam B24-ST-CU-AR(P).
Days Crack 1, mm
162 0.36
193 0.38
220 0.39
252 0.38
277 0.38
305 0.40
333 0.39
361 0.38
381 0.40
0
Salt Accumulation
on SurfaceLocation of
Chloride Sample
Plan
Side View
0.30.60.91.2 0.3 0.6 0.9 1.2
1
C1
Figure A.35 Surface condition of beam B24-ST-CU-AR(P) after one year of exposure.

174
Table A.11 Average crack width measurement for beam B28-ST-CU-D(P).
Days Crack 1, mm
162 0.39
193 0.38
220 0.36
252 0.38
277 0.39
305 0.39
333 0.40
361 0.39
381 0.38
0
Salt Accumulation
on SurfaceLocation of
Chloride Sample
Plan
Side View
0.30.60.91.2 0.3 0.6 0.9 1.2
1
C1 C2
Figure A.36 Surface condition of beam B28-ST-CU-D(P) after one year of exposure.
Table A.12 Average crack width measurement for beam B29-L/ST-CU-D(P).
Days Crack 1, mm Crack 2, mm Crack 3, mm Crack 4, mm
162 0.08 0.17 0.06 0.11
193 0.10 0.20 0.07 0.13
220 0.08 0.19 0.07 0.15
252 0.10 0.20 0.07 0.13
277 0.10 0.19 0.08 0.15
305 0.11 0.20 0.07 0.15
333 0.10 0.19 0.07 0.13
361 0.10 0.17 0.07 0.13
381 0.10 0.17 0.08 0.12
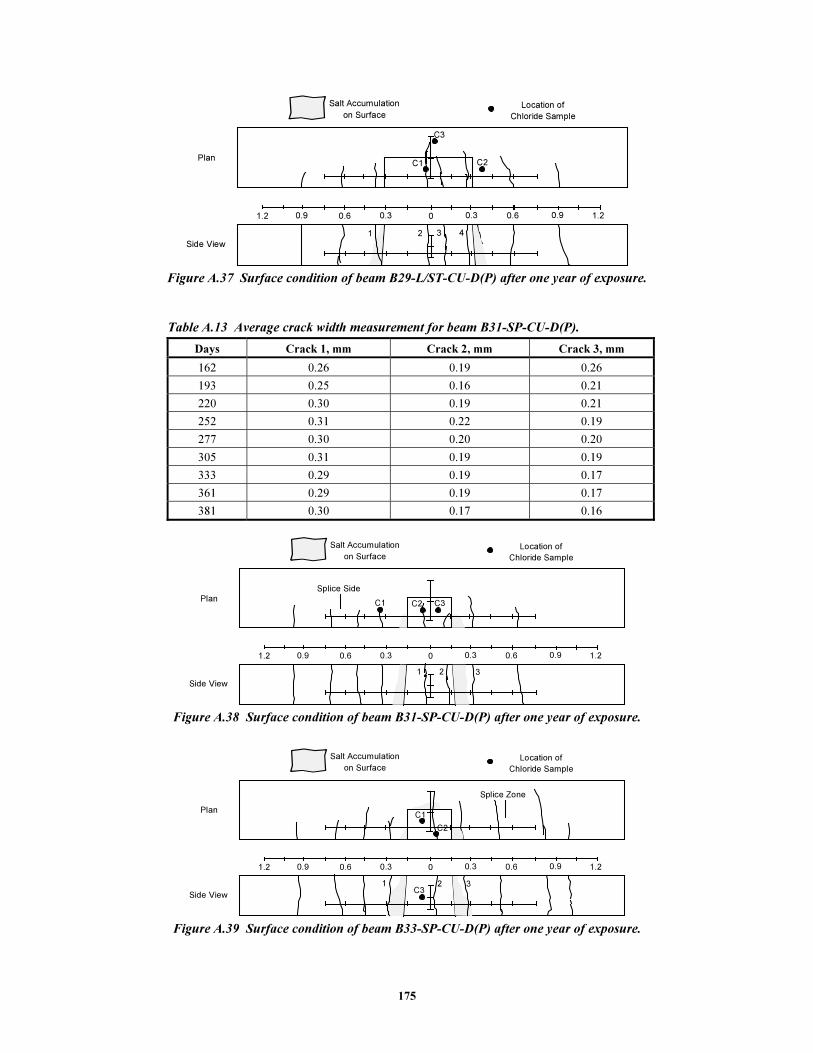
175
0
Salt Accumulation
on SurfaceLocation of
Chloride Sample
Plan
Side View
0.30.60.91.2 0.3 0.6 0.9 1.2
C2C1
C3
1 2 3 4
Figure A.37 Surface condition of beam B29-L/ST-CU-D(P) after one year of exposure.
Table A.13 Average crack width measurement for beam B31-SP-CU-D(P).
Days Crack 1, mm Crack 2, mm Crack 3, mm
162 0.26 0.19 0.26
193 0.25 0.16 0.21
220 0.30 0.19 0.21
252 0.31 0.22 0.19
277 0.30 0.20 0.20
305 0.31 0.19 0.19
333 0.29 0.19 0.17
361 0.29 0.19 0.17
381 0.30 0.17 0.16
0
Salt Accumulation
on Surface
Location of
Chloride Sample
Plan
Side View
0.30.60.91.2 0.3 0.6 0.9 1.2
C1 C2 C3
Splice Side
1 2 3
Figure A.38 Surface condition of beam B31-SP-CU-D(P) after one year of exposure.
0
Salt Accumulation
on Surface
Location of
Chloride Sample
Plan
Side View
0.30.60.91.2 0.3 0.6 0.9 1.2
Splice Zone
C1
C2
C31 2 3
Figure A.39 Surface condition of beam B33-SP-CU-D(P) after one year of exposure.

176
Rust stainingLocation of
chloride sample
Top
Scaling
C1 C2 C3
C4
0 0.3 0.6 0.9 1.20.30.60.91.2
Side view
Bottom
Figure A.40 Surface condition of beam B1-L-UU-AR after 4.3 years of exposure.
Rust staining
Location of
chloride sample
Top
Scaling
C1 C2
0 0.3 0.6 0.9 1.20.30.60.91.2
Side view1 2
3
4
Bottom
Figure A.41 Surface condition of beam B3-L-CU-AR after 4.3 years of exposure.

177
Table A.14 Average crack width measurement for beam B3-L-CU-AR.
Days Crack 1, mm Crack 2, mm Crack 3, mm Crack 4, mm
162 0.1 0.15 0.18 0.08
192 0.05 0.14 0.19 0.11
220 0.06 0.10 0.17 0.2
248 0.05 0.11 0.2 0.22
277 0.06 0.14 0.19 0.2
305 0.06 0.14 0.18 0.22
333 0.06 0.13 0.19 0.2
361 0.06 0.11 0.18 0.22
391 0.08 0.14 0.18 0.24
444 0.06 0.13 0.2 0.23
480 0.06 0.10 0.2 0.18
543 - 0.14 0.2 0.18
568 - 0.13 0.2 0.18
641 0.1 0.15 0.18 0.18
680 0.08 0.1 0.13 0.15
735 0.1 0.13 0.18 0.13
766 0.1 0.13 0.18 0.13
792 0.1 0.13 0.15 0.05
864 0.1 0.1 0.15 0.05
919 - 0.1 0.15 0.05
970 0.1 0.1 0.13 0.1
1,026 0.1 0.1 0.13 0.1
1,093 0.1 0.1 0.13 0.1
1,305 0.1 0.09 0.13 0.1
1,598 0.09 0.08 0.12 0.09
Rust stainingLocation of
chloride sample
0 0.3 0.6 0.9 1.20.30.60.91.2
Top
Side view
Scaling
C1 C2
Figure A.42 Surface condition of beam B6-L-CL-AR after 4.3 years of exposure.
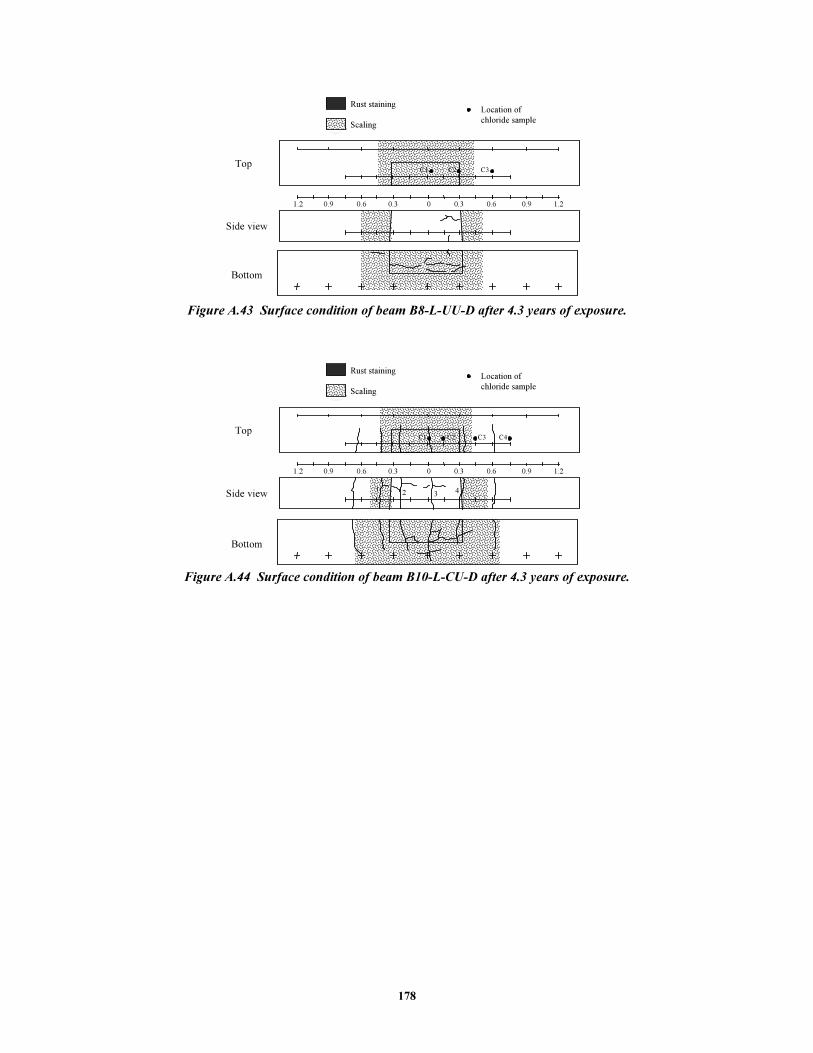
178
Rust stainingLocation of
chloride sample
Top
Scaling
C1 C2 C3
0 0.3 0.6 0.9 1.20.30.60.91.2
Side view
Bottom
Figure A.43 Surface condition of beam B8-L-UU-D after 4.3 years of exposure.
Rust stainingLocation of
chloride sample
Top
Scaling
C1 C2 C3 C4
0 0.3 0.6 0.9 1.20.30.60.91.2
Side view1
2 34
Bottom
Figure A.44 Surface condition of beam B10-L-CU-D after 4.3 years of exposure.

179
Table A.15 Average crack width measurement for beam B10-L-CU-D.
Days Crack 1, mm Crack 2, mm Crack 3, mm Crack 4, mm
162 0.05 0.09 0.10 0.10
192 0.04 0.09 0.10 0.08
220 0.05 0.10 0.11 0.11
248 0.04 0.10 0.13 0.10
277 0.04 0.11 0.11 0.10
305 0.04 0.14 0.15 0.10
333 0.04 0.13 0.13 0.10
361 0.04 0.11 0.13 0.10
391 0.04 0.11 0.14 -
444 0.05 0.10 0.15 -
480 0.08 0.15 0.15 -
543 0.1 0.17 0.18 0.18
568 0.11 0.17 0.18 0.18
641 0.1 0.13 0.18 0.18
680 0.09 0.1 0.15 0.15
735 0.1 0.18 0.18 0.13
766 0.13 0.15 0.20 0.15
792 0.1 0.15 0.20 0.13
864 0.1 0.15 0.18 0.20
919 0.08 0.12 0.18 0.15
970 0.09 0.12 0.18 0.13
1,026 0.1 0.13 0.15 0.13
1,093 0.09 0.12 0.13 0.13
1,305 0.08 0.09 0.13 0.13
1,598 0.08 0.09 0.15 0.15
Rust stainingLocation of
chloride sample
0 0.3 0.6 0.9 1.20.30.60.91.2
Top
Side view
Scaling
C1 C2 C3
Figure A.45 Surface condition of beam B12-L-CL-D after 4.3 years of exposure.
Rust stainingLocation of
chloride sample
Top
Scaling
C1 C2 C3
C4
C5
0 0.3 0.6 0.9 1.20.30.60.91.2
Side view 1 2 34
Bottom
Figure A.46 Surface condition of beam B14-L-CU-D(P) after 4.3 years of exposure.

180
Table A.16 Average crack width measurement for beam B14-L-CU-D(P).
Days Crack 1, mm Crack 2, mm Crack 3, mm Crack 4, mm
162 0.37 0.36 0.37 -
193 0.33 0.27 0.30 -
220 0.28 0.27 0.30 -
252 0.28 0.27 0.27 -
277 0.32 0.27 0.32 -
305 0.30 0.27 0.30 -
333 0.32 0.27 0.29 -
361 0.30 0.27 0.29 -
391 0.20 0.27 0.24 -
444 0.20 0.24 0.24 -
480 0.23 0.20 0.23 0.08
543 0.23 0.18 0.20 0.13
568 0.23 0.18 0.2 0.13
641 0.25 0.15 0.18 0.10
680 0.15 0.09 0.18 0.10
735 0.23 0.15 0.23 0.10
766 0.2 0.13 0.23 0.10
792 0.18 0.1 0.20 0.10
864 0.15 0.1 0.18 0.08
919 0.18 0.09 0.15 0.08
970 0.13 0.09 0.18 0.08
1,026 0.12 0.1 0.18 0.08
1,093 0.13 0.09 0.15 0.08
1,305 0.09 0.09 0.13 0.08
1,598 0.12 0.09 0.18 0.08
Rust stainingLocation of
chloride sampleScaling
TopC1
C2
C3
0 0.3 0.6 0.9 1.20.30.60.91.2
Side view
Bottom
Figure A.47 Surface condition of beam B15-ST-UU-AR after 4.3 years of exposure.

181
Rust stainingLocation of
chloride sampleScaling
Top
C1
C2 C3
0 0.3 0.6 0.9 1.20.30.60.91.2
Side view 1
Bottom
Figure A.48 Surface condition of beam B17-ST-CU-AR after 4.3 years of exposure.
Table A.17 Average crack width measurement for beam B17-ST-CU-AR.
Days Crack 1, mm
161 0.20
192 0.30
220 0.33
248 0.36
277 0.38
305 0.38
333 0.39
361 0.39
391 0.36
444 0.43
480 0.37
543 0.32
568 0.32
641 0.3
680 0.28
735 0.35
766 0.3
792 0.3
864 0.33
919 0.3
970 0.33
1,026 0.27
1,093 0.25
1,305 0.25
1,598 0.25
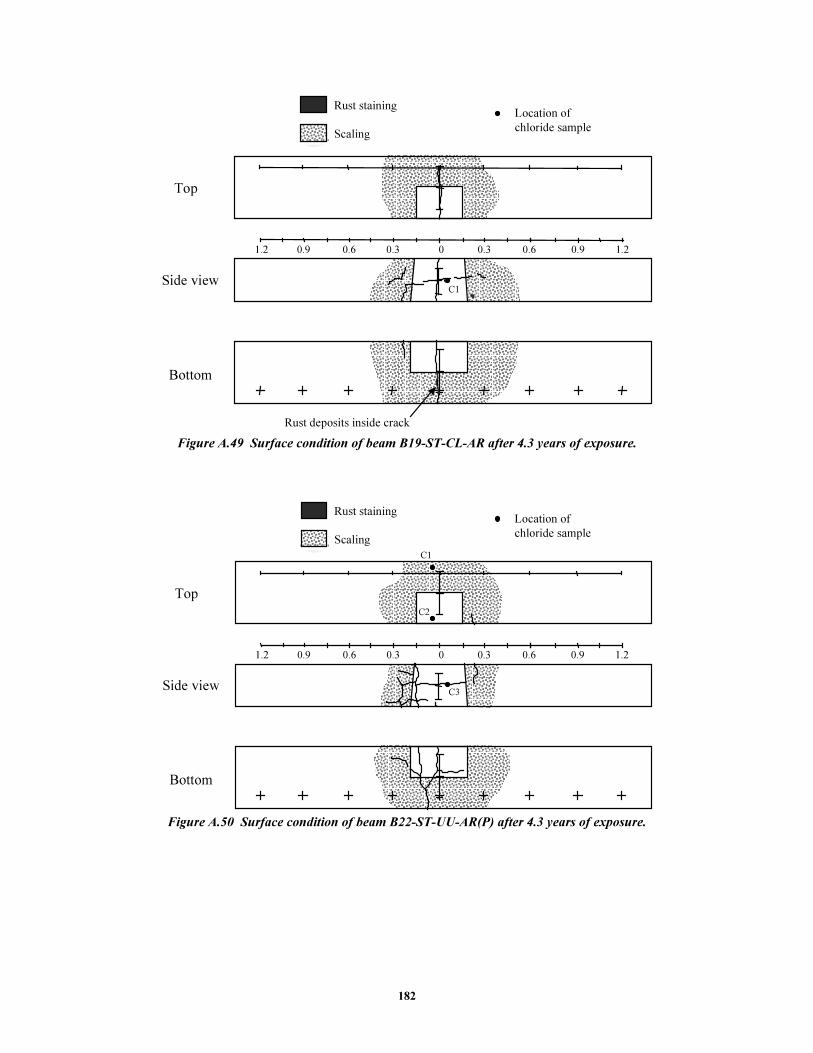
182
0 0.3 0.6 0.9 1.20.30.60.91.2
Rust stainingLocation of
chloride sampleScaling
Top
Side view
Bottom
C1
Rust deposits inside crack
Figure A.49 Surface condition of beam B19-ST-CL-AR after 4.3 years of exposure.
0 0.3 0.6 0.9 1.20.30.60.91.2
Rust stainingLocation of
chloride sampleScaling
Top
Side view
Bottom
C1
C2
C3
Figure A.50 Surface condition of beam B22-ST-UU-AR(P) after 4.3 years of exposure.

183
Rust stainingLocation of
chloride sampleScaling
Top
C1
C2
C3
0 0.3 0.6 0.9 1.20.30.60.91.2
Side view1
2
Bottom
Figure A.51 Surface condition of beam B23-ST-CU-AR(P) after 4.3 years of exposure.
Table A.18 Average crack width measurement for beam B23-ST-CU-AR(P).
Days Crack 1, mm Crack 2, mm
161 0.36 0.23
192 0.29 0.24
220 0.32 0.28
248 0.30 0.28
277 0.28 0.25
305 0.29 0.28
333 0.29 0.25
361 0.29 0.25
391 0.27 0.23
444 0.29 0.28
480 0.22 0.29
543 0.2 0.18
568 0.2 0.18
641 0.2 0.2
680 0.18 0.2
735 0.2 0.35
766 0.18 0.35
792 0.18 0.33
864 0.18 0.33
919 0.18 0.25
970 0.2 0.28
1,026 0.18 0.23
1,093 0.15 0.28
1,305 0.13 0.23
1,598 0.12 0.23
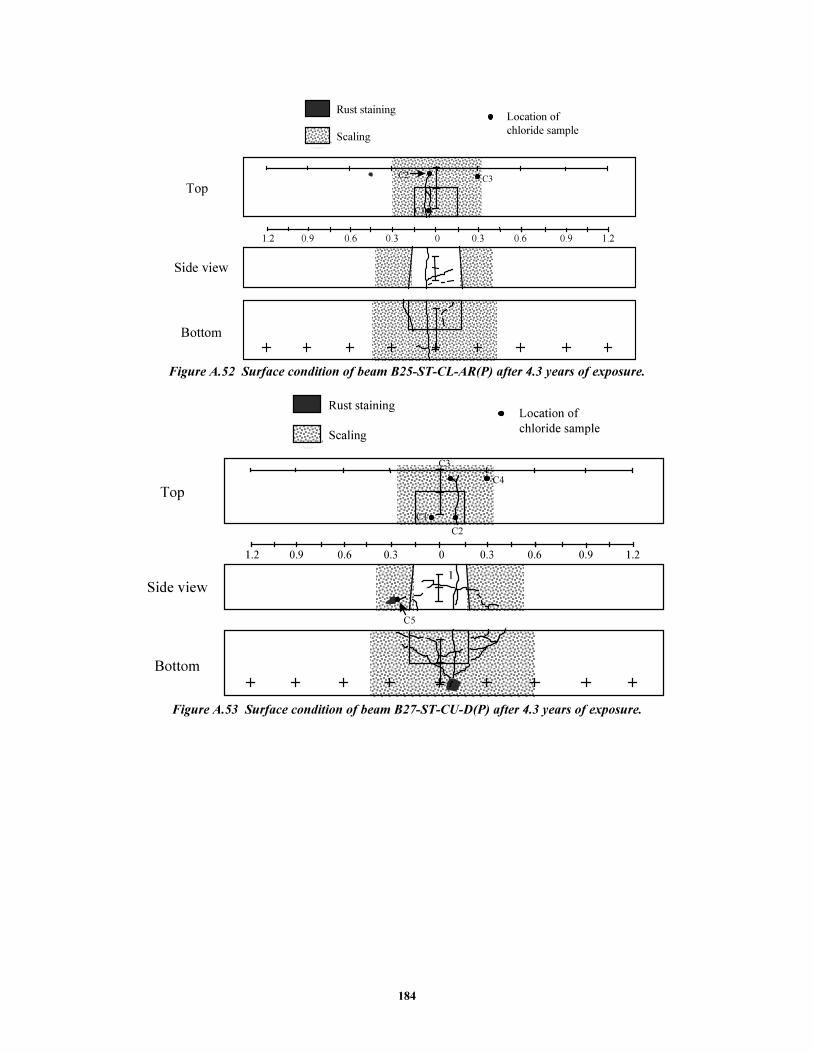
184
Rust stainingLocation of
chloride sampleScaling
Top
C1
C2C3
0 0.3 0.6 0.9 1.20.30.60.91.2
Side view
Bottom
Figure A.52 Surface condition of beam B25-ST-CL-AR(P) after 4.3 years of exposure.
Rust stainingLocation of
chloride sampleScaling
Top
C1
C2
C3
C4
0 0.3 0.6 0.9 1.20.30.60.91.2
Side view
C5
1
Bottom
Figure A.53 Surface condition of beam B27-ST-CU-D(P) after 4.3 years of exposure.
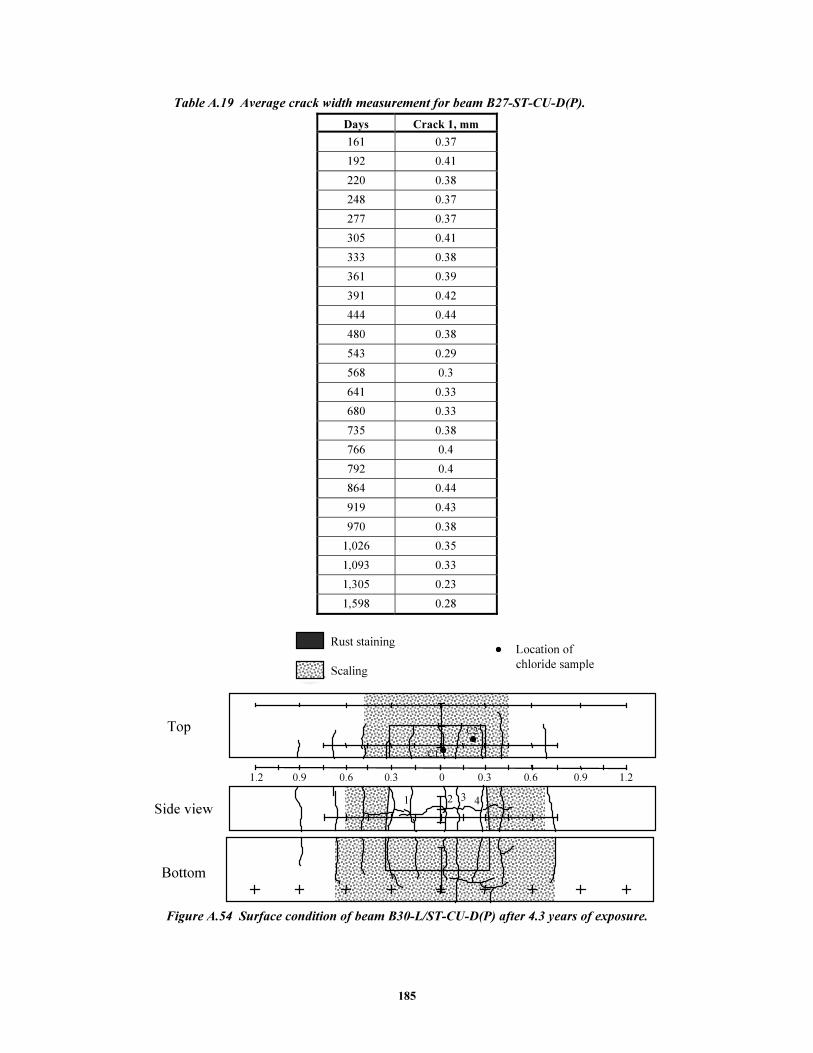
185
Table A.19 Average crack width measurement for beam B27-ST-CU-D(P).
Days Crack 1, mm
161 0.37
192 0.41
220 0.38
248 0.37
277 0.37
305 0.41
333 0.38
361 0.39
391 0.42
444 0.44
480 0.38
543 0.29
568 0.3
641 0.33
680 0.33
735 0.38
766 0.4
792 0.4
864 0.44
919 0.43
970 0.38
1,026 0.35
1,093 0.33
1,305 0.23
1,598 0.28
Rust stainingLocation of
chloride sample
Top
Scaling
C1
C2
0 0.3 0.6 0.9 1.20.30.60.91.2
Side view1 2 3 4
Bottom
Figure A.54 Surface condition of beam B30-L/ST-CU-D(P) after 4.3 years of exposure.
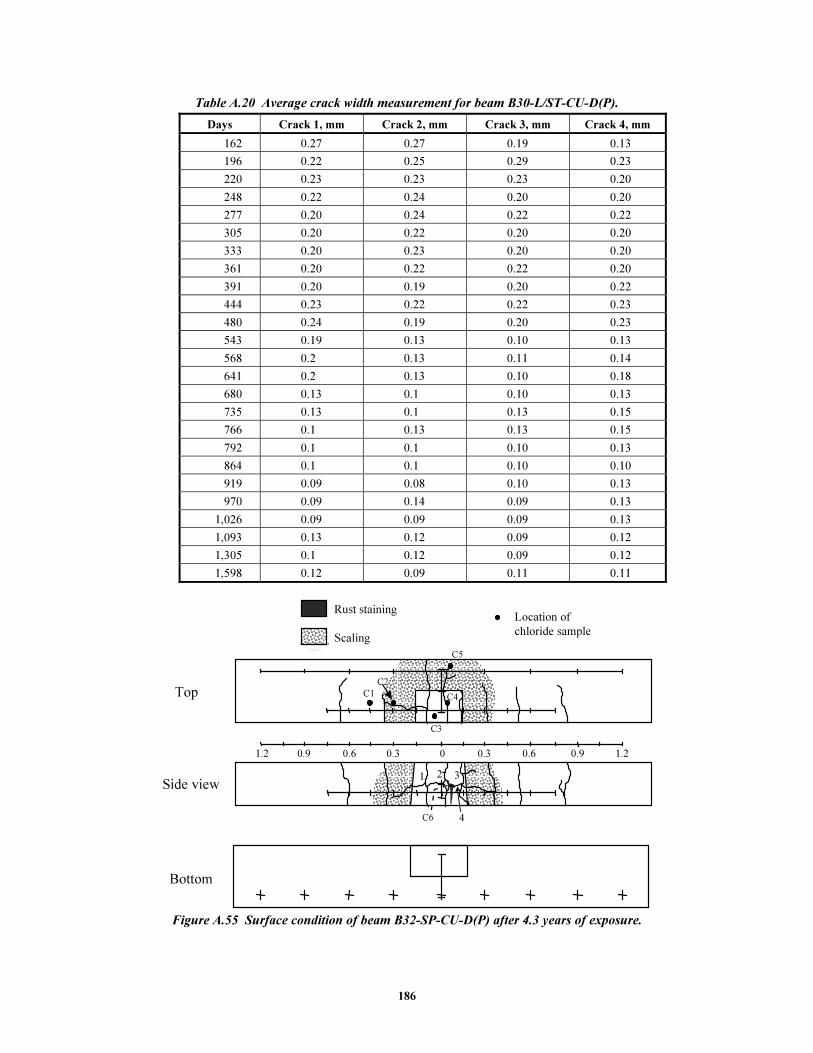
186
Table A.20 Average crack width measurement for beam B30-L/ST-CU-D(P).
Days Crack 1, mm Crack 2, mm Crack 3, mm Crack 4, mm
162 0.27 0.27 0.19 0.13
196 0.22 0.25 0.29 0.23
220 0.23 0.23 0.23 0.20
248 0.22 0.24 0.20 0.20
277 0.20 0.24 0.22 0.22
305 0.20 0.22 0.20 0.20
333 0.20 0.23 0.20 0.20
361 0.20 0.22 0.22 0.20
391 0.20 0.19 0.20 0.22
444 0.23 0.22 0.22 0.23
480 0.24 0.19 0.20 0.23
543 0.19 0.13 0.10 0.13
568 0.2 0.13 0.11 0.14
641 0.2 0.13 0.10 0.18
680 0.13 0.1 0.10 0.13
735 0.13 0.1 0.13 0.15
766 0.1 0.13 0.13 0.15
792 0.1 0.1 0.10 0.13
864 0.1 0.1 0.10 0.10
919 0.09 0.08 0.10 0.13
970 0.09 0.14 0.09 0.13
1,026 0.09 0.09 0.09 0.13
1,093 0.13 0.12 0.09 0.12
1,305 0.1 0.12 0.09 0.12
1,598 0.12 0.09 0.11 0.11
Rust stainingLocation of
chloride sample
0 0.3 0.6 0.9 1.20.30.60.91.2
Top
Side view
Bottom
Scaling
C1
C2
C3
C4
C5
C6
1 2 3
4
Figure A.55 Surface condition of beam B32-SP-CU-D(P) after 4.3 years of exposure.

187
Table A.21 Average crack width measurement for beam B32-SP-CU-D(P).
Days Crack 1, mm Crack 2, mm Crack 3, mm Crack 4, mm
161 0.10 0.06 0.10 -
192 0.13 0.06 0.08 -
220 0.17 0.05 0.09 -
248 0.15 0.06 0.09 -
277 0.15 0.06 0.09 -
305 0.15 0.06 0.09 -
333 0.14 0.05 0.08 -
361 0.13 0.05 0.06 -
391 0.14 0.06 0.08 -
444 0.14 0.05 0.08 -
480 0.13 0.08 0.13 -
543 0.15 0.09 0.15 -
568 0.16 0.09 0.16 -
641 0.15 0.09 0.15 -
680 0.17 0.1 0.15 -
735 0.23 0.1 0.13 0.10
766 0.2 0.1 0.15 0.09
792 0.2 0.09 0.10 0.09
864 0.18 0.09 0.10 0.10
919 0.18 0.09 0.10 0.15
970 0.18 0.09 0.10 0.20
1,025 0.2 0.1 0.10 0.20
1,093 0.2 0.09 0.09 0.20
1,305 0.18 0.08 0.09 0.25
1,596 0.18 0.09 0.09 0.28
Rust stainingLocation of
chloride sample
0 0.3 0.6 0.9 1.20.30.60.91.2
Top
Side view
Bottom
Scaling
Rust deposits inside crack
C1C2
Figure A.56 Surface condition of beam B34-SP-CL-D(P) after 4.3 years of exposure.

188
A.8 POSTMORTEM EXAMINATION
A.8.1 General
One of each pair of beams from the 34 beams was removed for demolition after 392 days of exposure (roughly one year). Generally, the selected beam was the one showing the most negative potentials although differences between the replicate beams were minimal. The remaining duplicate beams were removed for autopsy after about 4.3 years of exposure.
A.8.2 Concrete Condition
Prior to destruction, delamination of concrete was checked by hammer sounding. Concrete surfaces were struck with a ball-peen hammer at several locations to detect any delaminated areas. The results of this inspection are given in Chapter 2. No corrosion-induced cracks or stains were observed on any of the test beams during the first year of exposure. Several beams showed rust stains and one beam developed corrosion-induced cracking after 4.3 years of exposure.
A.8.3 Chloride Content
Chloride samples from each beam were extracted and analyzed to determine the acid-soluble chloride content at various depths including reinforcement levels. Two samples for each representative depth were obtained. The samples were obtained from a number of holes drilled at cracks and in uncracked concrete along and across the beam. The locations of the holes were very close to the embedded reinforcement to determine the chloride concentration most representative of that at the bar level. These locations are shown in Figures A.23 to A.56. Drilling concrete surfaces for chloride sampling is shown in Figure A.57. The chloride contents of all beams are shown in Tables A.22 to A.27.
Figure A.57 Sampling chloride from beams before autopsy.
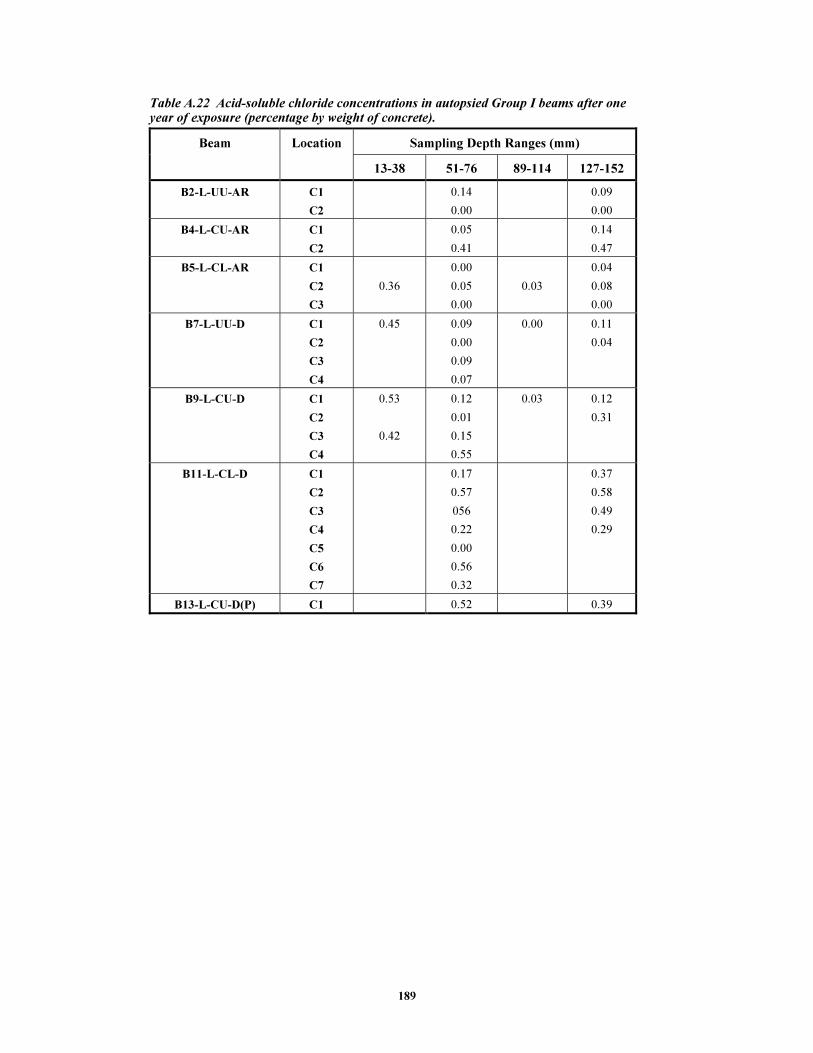
189
Table A.22 Acid-soluble chloride concentrations in autopsied Group I beams after one year of exposure (percentage by weight of concrete).
Beam Location Sampling Depth Ranges (mm)
13-38 51-76 89-114 127-152
B2-L-UU-AR C1
C2
0.14
0.00
0.09
0.00
B4-L-CU-AR C1
C2
0.05
0.41
0.14
0.47
B5-L-CL-AR C1
C2
C3
0.36
0.00
0.05
0.00
0.03
0.04
0.08
0.00
B7-L-UU-D C1
C2
C3
C4
0.45
0.09
0.00
0.09
0.07
0.00
0.11
0.04
B9-L-CU-D C1
C2
C3
C4
0.53
0.42
0.12
0.01
0.15
0.55
0.03
0.12
0.31
B11-L-CL-D C1
C2
C3
C4
C5
C6
C7
0.17
0.57
056
0.22
0.00
0.56
0.32
0.37
0.58
0.49
0.29
B13-L-CU-D(P) C1 0.52 0.39

190
Table A.23 Acid-soluble chloride concentrations in autopsied Group II beams after one year of exposure (percentage by weight of concrete).
Beam Location Sampling Depth Ranges (mm)
13-38 51-76 89-114 127-152
B16-ST-UU-AR C1
C2
0.52 0.23
0.01
0.19
0.24
0.00
B18-ST-CU-AR C1
C2
C3
0.50
0.27
0.49
0.53
0.32
0.43
B20-ST-CL-AR C1
C2
0.29
0.34
0.40
0.30
B21-ST-UU-AR(P) C1 0.34 0.33
B24-ST-CU-AR(P) C1 0.69 0.50
B26-ST-CL-AR(P) C1 0.68 0.60
B28-ST-CU-D(P) C1
C2
0.38
0.51
0.49
0.39
Table A.24 Acid-soluble chloride concentrations in autopsied Group III beams after one year of exposure (percentage by weight of concrete).
Beam Location Sampling Depth Ranges (mm)
13-38 51-76 89-114 127-152
B29-L/ST-CU-D(P) C1
C2
C3
0.47
0.31
0.00
0.51
0.48
B31-SP-CU-D(P) C1
C2
C3
0.06
0.66
0.47
0.65
0.33
B33-SP-CL-D(P) C1
C2
C3
0.77
0.71
0.93
0.58
0.58
0.77
0.85
0.58

191
Table A.25 Acid-soluble chloride concentrations in autopsied Group I beams after 4.3 years of exposure (percentage by weight of concrete).
Beam Location Sampling Depth Ranges (mm)
51-76 127-152 140-165 229-254
B1-L-UU-AR C1
C2
C3
C4
0.01
0.55
0.56
0.83
0.01
0.64
0.43
0.74
B3-L-CU-AR C1
C2
0.67
0.46
0.99
0.67
B6-L-CL-AR C1
C2
0.77
0.01
0.88
0.01
B8-L-UU-D C1
C2
C3
0.52
0.31
0.01
0.46
0.61
0.00
B10-L-CU-D C1
C2
C3
C4
0.73
0.51
0.48
0.01
0.47
0.59
0.69
0.01
B12-L-CL-D C1
C2
C3
0.51
0.84
0.73
0.61
0.83
0.00
B14-L-CU-D(P) C1
C2
C3�
���
���
0.72
0.62
0.66
0.77
0.00
0.62
0.71
0.55
0.69
0.28

192
Table A.26 Acid-soluble chloride concentrations in autopsied Group II beams after 4.3 years of exposure (percentage by weight of concrete).
Beam Location Sampling Depth Ranges (mm)
13-38 51-76 89-114 127-152 140-165 229-254
B15-ST-UU-AR C1
C2
C3
0.70
0.56
0.56
0.39
0.48
0.08
0.60
0.02
B17-ST-CU-AR C1
C2
C3
0.60
0.97
0.00
0.69
0.51
0.69
0.70
0.02
B19-ST-CL-AR C1 0.72 0.65 0.55
B22-ST-UU-AR(P) C1
C2
C3
0.70
1.05
0.57
0.70
0.96
0.69
0.96
0.61
0.51
0.78
B23-ST-CU-AR(P) C1
C2
C3
0.63
0.56
0.66
0.58
0.62
0.69
0.61
0.82
B25-ST-CL-AR(P) C1
C2
C3
0.83 0.60
0.66
0.00
0.66
0.53
0.52
0.62
0.31
B27-ST-CU-D(p) C1
C2
C3
C4
C5
0.50
0.55
0.59
0.10
0.61
0.52
0.48
0.54
0.59
0.45
0.62
0.58
Table A.27 Acid-soluble chloride concentrations in autopsied Group III beams after 4.3 years of exposure (percentage by weight of concrete).
Beam Location Sampling Depth Ranges (mm)
13-38 51-76 89-114 127-152
B30-L/ST-CU-D(P) C1
C2
0.94
0.74
1.06
1.06
B32-SP-CU-D(P) C1
C2
C3
C4
C5
C6
1.01
0.29
0.66
0.65
0.70
0.89
0.60
0.66
0.81
0.58
0.67
0.70
0.82
0.81
B34-SP-CL-D(P) C1
C2
1.07
1.23
0.88
1.34

193
A.8.4 Specimen Destruction
In order to visually examine the reinforcement at the midspan region, partial and complete saw cuts were made to recover a length of 1.25m (4 ft.) of the longitudinal bars and the full stirrups. Prior to cutting, lines were drawn to mark the cuts made to facilitate bar removal. Several beams were cut as a group using the concrete saw as shown in Figure A.58.
Figure A.58 Saw used to crosscut beams.
The mechanical removal of concrete between the cut lines was done carefully to avoid damaging the epoxy-coated bars. Concrete was forced to break in the longitudinal bar plane or stirrup plane by use of a jackhammer along the grooves as shown in Figure A.59. Additional minor chipping allowed complete removal of the bar from the concrete. Lack of adhesion between the coated bar and concrete greatly facilitated bar retrieval.
Figure A.59 Beam demolition for bar retrieval.

194
The method used to open the specimens exposed during 4.3 years was similar to that used to open specimens after one year. The main difference was that the use of a jackhammer was minimized. To remove longitudinal bars, deep slots were saw-cut along the two surfaces next to the bar location at a depth slightly less than cover on the bar. Concrete cover was removed by chiseling with a hammer. In this way, the integrity of removed concrete segments was better preserved and damage to the epoxy coating was minimized.
The procedure to remove the stirrups was more involved and complicated. Unlike specimens opened at one year, the beams were not sliced in half. Instead, slots perpendicular to the beam axis were saw-cut around the beam at two cross sections, about 4in. to the left and right of midspan. Concrete cover around the stirrup was then removed by chiseling. Concrete inside the stirrup was chipped with the jackhammer. Additional concrete around the longitudinal bars (epoxy coated and black) was chipped to remove the entire coated stirrup/longitudinal bars assembly.
A few uncoated bars were removed from the 1-year beams and all uncoated bars were removed from the 4.3-year beams for examination. The procedure was similar to that for longitudinal coated bars but became more difficult because of bond between the bars and concrete.
Six beams were not autopsied because they were scheduled for additional exposure testing. The beams that were not opened were the following:
• Group I: B3-L-CU-AR, B6-L-CL-AR, B12-L-CL-D
• Group II: B19-ST-CL-AR
• Group III: B30-L/ST-CU-D(P), B34-SP-CL-D(P)
A.8.5 Visual Inspection
The bars were visually inspected for any evidence of corrosion and blistering. During removal of the coating to examine underfilm corrosion, the ease or difficulty of peeling was reported as an indicator of the degree of debonding. The extent of corrosion propagation on the steel substrate was documented, particularly with respect to crack locations. All observations of the retrieved bars are summarized in Tables A.28 to A.33. The extent of corrosion on the coating surface and at damaged spots, extent of coating debonding, mottled surfaces, and dark corroded surfaces (underfilm corrosion) for each bar after 4.3 years of exposure is summarized in Tables A.34 through A.36. In addition, some of the uncoated reinforcing bars at the compression side of the beam were exposed to examine their condition. Observations of the bar condition after 4.3 years of exposure are condensed in Table A.37. The extent of corrosion for each uncoated bar in terms of percentage of surface area and number and size of pits after 4.3 years of exposure is summarized in Tables A.38 through A.40. Finally, the bar trace in the concrete was carefully inspected for the presence of voids, dried solution deposits, and corrosion products. These observations are given in Chapter 2.

195
Table A.28 Observations of longitudinal bars in Group I beams, one year exposure.
Beam No. Bar Surface Condition Coating Adhesion Undercutting
B2-Upper No apparent corrosion. Very good adhesion. Bright steel, as new.
B2-Lower No apparent corrosion except at one mill mark.
Very good adhesion except at rust spot.
Bright steel, one 3 x 6mm black rust spot.
B4-Upper As B2-Lower, rust 13mm from crack near stirrup.
Very good adhesion except at rust spot.
Black over 25mm from crack -side facing cover.
B4-Lower Rust spots at mill marks within 25mm from cracks.
Debonding along 130mm around rust spots.
As B4-Upper, but about 50-75mm from crack.
B5-Upper No apparent corrosion. Very good adhesion except at a mill mark.
Bright steel, one 13 x 13mm black rust spot.
B5-Lower Rust at one damaged spot 37mm from crack.
Very good adhesion except at rust spot.
Bright steel, one 22 x 13mm black rust spot.
B7-Upper Rust spotting only on steel areas facing cover.
Debonding up to 25mm around rust areas.
Dark (or black) around damaged (or rust) spots
B7-Lower As B7-Upper, with 12 blisters. As B7-Upper. As B7-Upper, clear fluid in some blisters.
B9-Upper As B7-Upper, spots 40mm or less from cracks, 5-6 blisters of variable size.
Debonding up to 9mm around steel spots, up to 100mm along rust.
Rust up to 60mm from crack, (25mm from steel edge)
B9-Lower As B9-Upper As B9-Upper, but up to 75mm along rust spots.
As B9-Upper, but up to 45mm from steel edges
B11-Upper As B7-Upper, 5 blisters of variable size.
As B9-Lower.
As B9-Upper, pits 1.25, 1.05, 0.2mm deep.
B11-Lower Rust on areas up to 60mm from cracks, 5 blisters
As B9-Lower.
As B9-Upper, one pit 6 x 9 x 1.15 (deep)mm.
B13-Upper As B11-Lower but patched areas, cracking and blistering of coating.
Extensive debonding mostly on side facing cover.
Darker around than under patches, rust up to 50mm from crack.
B13-Lower As B13-Upper. As B13-Upper. As B13-Upper.

196
Table A.29 Observations of stirrups in Group II beams, one year exposure.
Beam No. Bar Surface Condition Coating Adhesion Undercutting
B16 Corrosion spots, blisters and coating cracking of hook end near bottom concrete surface.
Poor bond at bent portions (more on outside) and some straight portions.
Mostly bright steel inside and dark outside of stirrup, rust along 90mm of hook end.
B18 Corrosion spots at areas of contact with uncoated bars, 10 small blisters.
Poor bond as B16 and to about 13mm from patched ends and along rust areas.
Rust along 0.22m near contact points with black bars, mostly dark steel elsewhere.
B20 Corrosion along continuous ribs at bend, longitudinal cracking of coating along hook end and inside bends.
As B16 and along rust areas, almost half length of stirrup.
As B16, corrosion concentrated along hook and leg closest to crack.
B21 No apparent corrosion, bright steel at damaged spots in contact with black bars.
No debonding of coating. Mostly bright steel inside and dark outside of stirrup, minor rust spots at bent areas.
B24 Corrosion and blisters at part close to bottom concrete surface and points of contact with black bars.
As B16 and to about 50mm from patched ends and along rust areas.
Mostly dark steel except at parts of straight legs, rust concentrated at lower side of stirrup.
B26 As B24 and along hook and inside bends close to upper concrete surface with coating cracking.
As B24. As B24, black rust inside one bend, slight pits along continuous rib of lower leg (0.2-0.4mm deep).
B28 As B26, 4 blisters up to 3 x 3mm.
As B16 and to about 90mm from patched ends and along rust areas.
As B24, dark steel under patches, rust along hook ends and some bends.
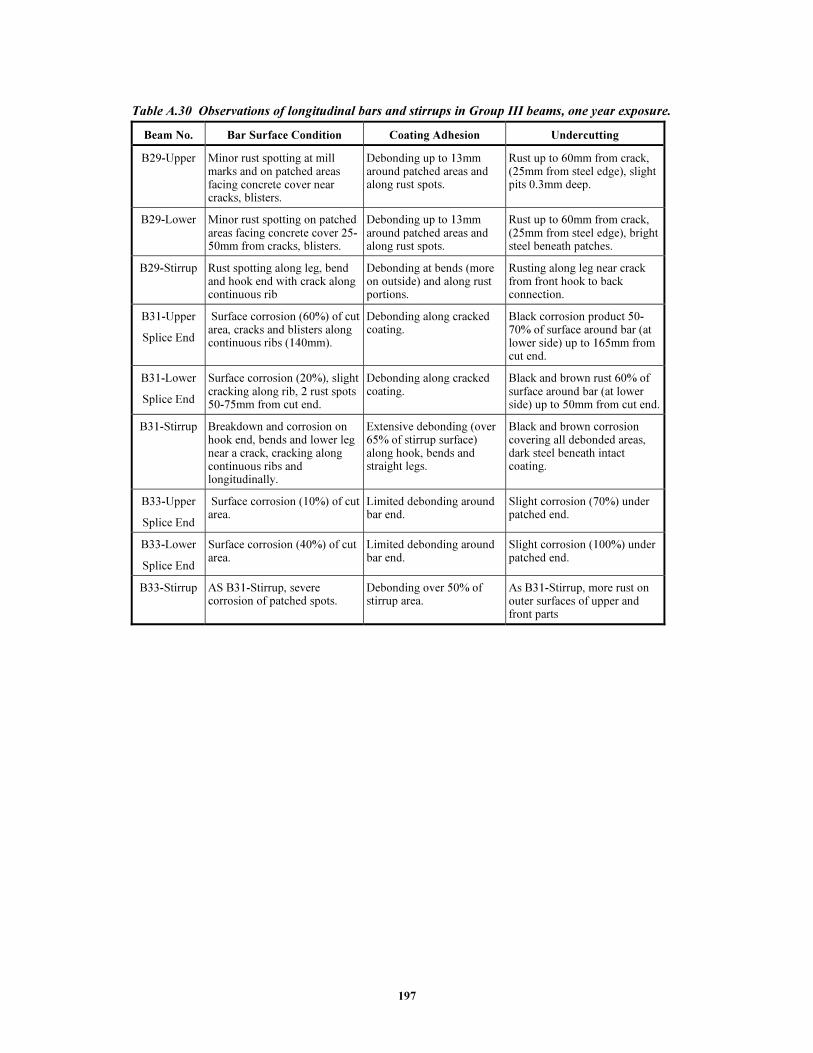
197
Table A.30 Observations of longitudinal bars and stirrups in Group III beams, one year exposure.
Beam No. Bar Surface Condition Coating Adhesion Undercutting
B29-Upper Minor rust spotting at mill marks and on patched areas facing concrete cover near cracks, blisters.
Debonding up to 13mm around patched areas and along rust spots.
Rust up to 60mm from crack, (25mm from steel edge), slight pits 0.3mm deep.
B29-Lower Minor rust spotting on patched areas facing concrete cover 25-50mm from cracks, blisters.
Debonding up to 13mm around patched areas and along rust spots.
Rust up to 60mm from crack, (25mm from steel edge), bright steel beneath patches.
B29-Stirrup Rust spotting along leg, bend and hook end with crack along continuous rib
Debonding at bends (more on outside) and along rust portions.
Rusting along leg near crack from front hook to back connection.
B31-Upper
Splice End
Surface corrosion (60%) of cut area, cracks and blisters along continuous ribs (140mm).
Debonding along cracked coating.
Black corrosion product 50-70% of surface around bar (at lower side) up to 165mm from cut end.
B31-Lower
Splice End
Surface corrosion (20%), slight cracking along rib, 2 rust spots 50-75mm from cut end.
Debonding along cracked coating.
Black and brown rust 60% of surface around bar (at lower side) up to 50mm from cut end.
B31-Stirrup Breakdown and corrosion on hook end, bends and lower leg near a crack, cracking along continuous ribs and longitudinally.
Extensive debonding (over 65% of stirrup surface) along hook, bends and straight legs.
Black and brown corrosion covering all debonded areas, dark steel beneath intact coating.
B33-Upper
Splice End
Surface corrosion (10%) of cut area.
Limited debonding around bar end.
Slight corrosion (70%) under patched end.
B33-Lower
Splice End
Surface corrosion (40%) of cut area.
Limited debonding around bar end.
Slight corrosion (100%) under patched end.
B33-Stirrup AS B31-Stirrup, severe corrosion of patched spots.
Debonding over 50% of stirrup area.
As B31-Stirrup, more rust on outer surfaces of upper and front parts

198
Table A.31 Observations of longitudinal bars in Group I beams, 4.3-year exposure.
Beam No. Coating Surface Condition Coating Adhesion Undercutting
B1-Upper No apparent corrosion. Very good adhesion (small debonded areas).
Bright, shinny steel, as new. A few small areas with mottled, glittery surface beneath debonded portions. A few spots with a very thin film of reddish rust at mill marks.
B1-Lower No apparent corrosion (very few, small stains).
Very good adhesion (very few debonded areas).
As B1-upper. A 50mm2 dark and brown rusted area near a mill mark.
B8-Upper Dark rust on a number of damaged spots. Scattered staining between corroded, exposed areas. Extensive blistering. Cracks in coating.
Debonding along wet portion, very few spots with well adhered coating.
Very few zones with appreciable solidified rust. Very shallow pitting, no deeper than 0.1 or 0.2mm. Few blisters. Reddish rust products accumulated near longitudinal ribs. The remaining bar surface was mottled.
B8-Lower Dark rust on a number of damaged spots. Scattered staining between corroded, exposed areas. A number of small blisters.
Debonding along wet portion, very few spots with well adhered coating.
As B8-Upper
B10-Upper Dark rust on a few damaged spots. Most exposed areas uncorroded. Scattered staining mainly between corroded, exposed areas.
Debonding along wet portion.
Pitting shallow but slightly more severe than on B8-upper and lower, with maximum depth of 0.5mm. Brittle, thin flakes of rust came off during coating removal. Accumulation of reddish rust near longitudinal ribs. The remaining bar surface was mottled.
B10-Lower Dark rust on several damaged spots. Most exposed areas uncorroded. Scattered staining mainly around corroded, exposed areas. Cracks in coating.
Debonding along wet portion.
As B10-Upper
B14-Upper Rust staining on several patched areas. Scattered stains on a small portion of the bar. Very few blisters.
Debonding along wet portion.
As B14-Lower. Dark corrosion on three patched areas and one patched area with reddish rust accumulation beneath the patch.
B14-Lower Rust staining on several patched areas. Scattered stains on a small portion of the bar. A few small cracks in the coating.
Debonding along wet portion.
Pitting generally slight, most pits not deeper than 0.2 or 0.3mm. A few deeper pits (0.5mm) at or near patches. Dark corrosion on three patched areas. No visible corrosion on remaining patched areas. Scattered areas with reddish rust accumulation. The remaining bar surface was mottled.
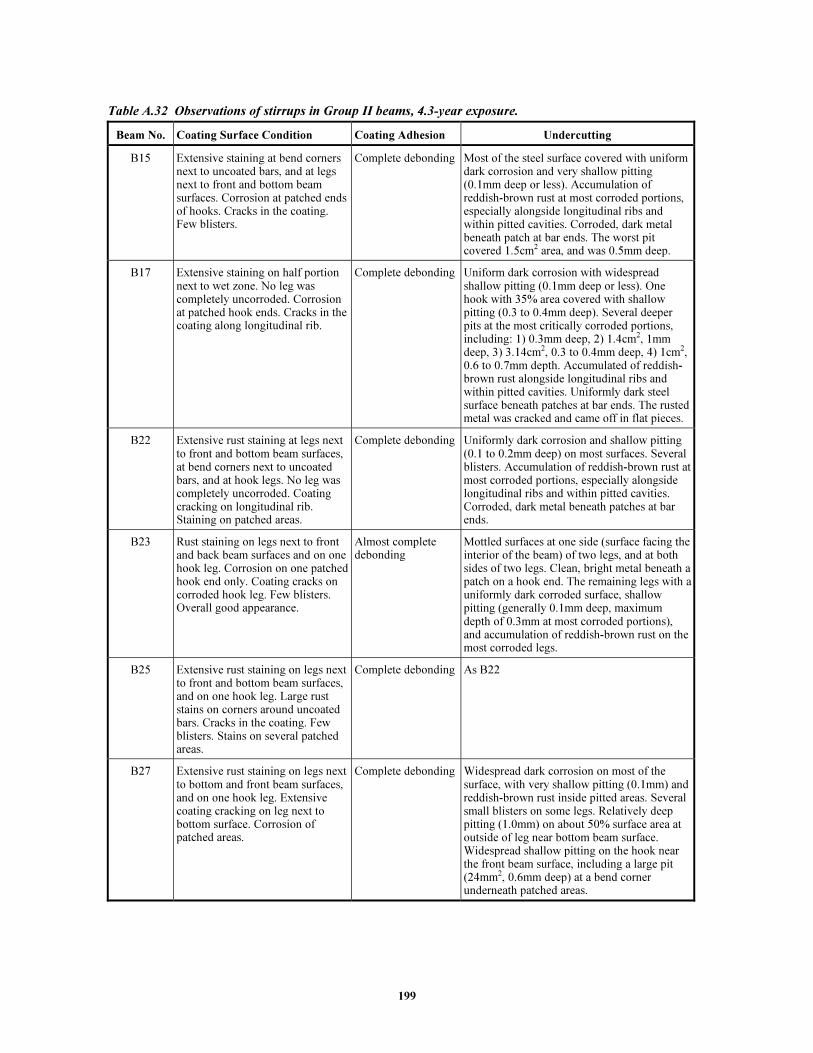
199
Table A.32 Observations of stirrups in Group II beams, 4.3-year exposure.
Beam No. Coating Surface Condition Coating Adhesion Undercutting
B15 Extensive staining at bend corners next to uncoated bars, and at legs next to front and bottom beam surfaces. Corrosion at patched ends of hooks. Cracks in the coating. Few blisters.
Complete debonding Most of the steel surface covered with uniform dark corrosion and very shallow pitting (0.1mm deep or less). Accumulation of reddish-brown rust at most corroded portions, especially alongside longitudinal ribs and within pitted cavities. Corroded, dark metal beneath patch at bar ends. The worst pit covered 1.5cm2 area, and was 0.5mm deep.
B17 Extensive staining on half portion next to wet zone. No leg was completely uncorroded. Corrosion at patched hook ends. Cracks in the coating along longitudinal rib.
Complete debonding Uniform dark corrosion with widespread shallow pitting (0.1mm deep or less). One hook with 35% area covered with shallow pitting (0.3 to 0.4mm deep). Several deeper pits at the most critically corroded portions, including: 1) 0.3mm deep, 2) 1.4cm2, 1mm deep, 3) 3.14cm2, 0.3 to 0.4mm deep, 4) 1cm2, 0.6 to 0.7mm depth. Accumulated of reddish-brown rust alongside longitudinal ribs and within pitted cavities. Uniformly dark steel surface beneath patches at bar ends. The rusted metal was cracked and came off in flat pieces.
B22 Extensive rust staining at legs next to front and bottom beam surfaces, at bend corners next to uncoated bars, and at hook legs. No leg was completely uncorroded. Coating cracking on longitudinal rib. Staining on patched areas.
Complete debonding Uniformly dark corrosion and shallow pitting (0.1 to 0.2mm deep) on most surfaces. Several blisters. Accumulation of reddish-brown rust at most corroded portions, especially alongside longitudinal ribs and within pitted cavities. Corroded, dark metal beneath patches at bar ends.
B23 Rust staining on legs next to front and back beam surfaces and on one hook leg. Corrosion on one patched hook end only. Coating cracks on corroded hook leg. Few blisters. Overall good appearance.
Almost complete debonding
Mottled surfaces at one side (surface facing the interior of the beam) of two legs, and at both sides of two legs. Clean, bright metal beneath a patch on a hook end. The remaining legs with a uniformly dark corroded surface, shallow pitting (generally 0.1mm deep, maximum depth of 0.3mm at most corroded portions), and accumulation of reddish-brown rust on the most corroded legs.
B25 Extensive rust staining on legs next to front and bottom beam surfaces, and on one hook leg. Large rust stains on corners around uncoated bars. Cracks in the coating. Few blisters. Stains on several patched areas.
Complete debonding As B22
B27 Extensive rust staining on legs next to bottom and front beam surfaces, and on one hook leg. Extensive coating cracking on leg next to bottom surface. Corrosion of patched areas.
Complete debonding Widespread dark corrosion on most of the surface, with very shallow pitting (0.1mm) and reddish-brown rust inside pitted areas. Several small blisters on some legs. Relatively deep pitting (1.0mm) on about 50% surface area at outside of leg near bottom beam surface. Widespread shallow pitting on the hook near the front beam surface, including a large pit (24mm2, 0.6mm deep) at a bend corner underneath patched areas.

200
Table A.33 Observations of longitudinal bars and stirrups in Group III beams, 4.3-year exposure.
Beam No. Coating Surface Condition Coating Adhesion Undercutting
B32-Upper Splice End
Broken patch at portions of bar end, revealing a black, rusted surface. Light-brown stains at edge of bar end. Small, scattered rust stains spread up to about 22.5cm from bar end.
Complete debonding up to about 24cm from bar end.
Uniformly dark or black corroded metal surface with shallow pitting at bar ends. Dark corroded surface with shallow pitting (less than 0.5mm deep) extending from the patched end along one side of the bar. Accumulation of reddish-brown and orange-brown rust products at more densely pitted areas. Mottled surface on the side opposite to the corroded surface. Undercutting extending 20 to 24cm from patched bar ends.
B32-Lower Splice End
Broken patch at large portions of bar end, revealing a black, rusted surface. Moderate, scattered staining mainly on bar side near front beam surface, extending up to about 17cm from bar end.
Complete debonding up to about 20cm from bar end.
As B32-upper splice end
B32-Stirrup Moderate to extensive rust staining on legs near front and bottom beam surfaces, on one hook leg, and on one bend corner next to upper uncoated bar. Corrosion at some patched areas and one patched hook end. Some patched areas with no corrosion. Cracks in the coating. Few blisters.
Complete debonding Widespread dark corrosion with moderate pitting. Accumulation of reddish-brown rust inside pitted areas. Pits ranging from 1mm2 to 185mm2 of area, and from 0.3mm to 0.6mm of depth. Pits with maximum depth of 0.4mm beneath the patched areas at two bend corners. Uncorroded steel surface beneath patched areas at one bend corner.
Table A.34 Approximate amount of corroded damaged spots (percentage of spots), rust stained coating surface, debonded coating, mottled surface, and corroded metallic surface beneath the coating (percentage of bar surface along 0.9m in midspan),* and severity of pitting. Longitudinal bars, 4.3-year exposure.
Beam No. Bar Corroded
Damaged Spots
Corroded
Coating Surface
Debonded Coating
Mottled Surface
Corroded
Steel Surface
Max. Pit
Depth (mm)
B1-L-UU-AR: Upper N/A 3% 9% 8.7% 0.3% 0
Lower N/A 2% 3.5% 2.8% 0.7% 0
B8-L-UU-D Upper 40% 19% 77% 47% 30% 0.1-0.2
Lower 43% 25% 74% 41% 33% 0.1
B10-L-CU-D Upper 32% 15% 95% 82% 14% 0.2-0.3
Lower 57% 25% 98% 69% 29% 0.5
B14-L-CU-D(P) Upper 20% 13% 97% 87% 10% 0.5
Lower 22% 13% 95% 81% 15% 0.5
*Since the wetted zone was 0.6 m. long, percentages of corroded surface greater than 67% indicate that corrosion spread beyond the limits of the exposed, wetted zone of the beams

201
Table A.35 Approximate amount of rust stained coating surface, debonded coating, mottled surface, and corroded metallic surface beneath the coating (percentage of stirrup surface); and severity of pitting. Stirrups, 4.3-year exposure.
Beam No. Corroded Coating Surface
Debonded Coating
Mottled Surface
Corroded Steel Surface
Pitted Surface*
Max. Pit Depth (mm)
B15-ST-UU-AR: 40% 98% 31% 67% 26% 0.5
B17-ST-CU-AR: 65% 100% 7% 93% 27% 1
B22-ST-UU-AR(P) 37% 100% 11% 89% 14% 0.5
B23-ST-CU-AR(P) 30% 97% 49% 48% 4% 0.3
B25-ST-CL-AR(P) 30% 100% 14% 86% 20% 0.3
B27-ST-CU-D(P) 38% 100% 17% 83% 15% 1
B32-SP-CU-D(P) 33% 100% 45% 55% 26% 0.6
*Pit depth ≥ 0.3mm
Table A.36 Approximate amount of rust stained coating surface, debonded coating, mottled surface, and corroded metallic surface beneath the coating [percentage of bar surface along 0.9m in midspan (0.45m for short bars)];* and severity of pitting. Spliced bars of beam B32, 4.3-year exposure.
Bar Corroded Coating Surface
Debonded Coating
Mottled Surface
Corroded Steel Surface
Max. Pit Depth (mm)
Upper Short 4% 53% 33% 19% 0.4
Upper Long 2% 13% 11% 2% 0
Lower Short 8% 45% 24% 21% 0.5
Lower Long 3% 19% 16% 3% 0.3
*Since the wetted zone was 0.3m long, percentages greater than 33% indicated that the coating on bars debonded beyond the wetted zone of the beams

202
Table A.37 Observations of uncoated bars from beam groups I, II, and III, 4.3-year exposure.
Group No. Bar Surface Condition
I Black bars in three beams [two cracked, unloaded beams (B14 and B10) and one uncracked, unloaded beam (B1)] were moderately to extensively corroded. Several moderate to severe pits were observed in six bars with more corrosion (B1, B10, and B14). Black bars in the remaining uncracked, unloaded beam (B8) did not show much corrosion. Severe pitting was observed in some bars, with maximum localized loss of metal up to 30%. Maximum pit depths of 2.5mm and 2.4mm were observed. Bars tended to corrode more on the low side with respect to casting position.
II Black bars in cracked beams, loaded or unloaded, experienced severe pitting corrosion. There was generally one very large, deep pit at the location of a crack. Extensive, dark greenish rust staining was observed around the largest, deeply pitted areas during the autopsy. Maximum pit depths ranged from 2mm to 5.2mm. Maximum loss of cross-sectional area was 78% of the lower bar of beam B27. One
bar in beam 25 was so weakened at the severely pitted cross section, that the bar accidentally fractured
while being examined. Overall, corrosion extended from 20cm to 51cm along the bars, with most bars experiencing corrosion beyond the limits of the exposed, wetted areas (30cm long).
III The only beam autopsied in this group was beam B32, which was cracked and unloaded. Black bars in this beam experienced the appearance of one large, deep pit at a crack location, where the bars showed a discernible loss of cross-sectional area. Maximum pit depth was 2.6mm for the upper bar and 2.0mm for the lower bar. Both bars experienced a loss of cross-sectional area of 32%. Several other deep pits and shallower pits of smaller area were also observed. Corrosion extended 56cm along the bars, well beyond the 30-cm stretch of the exposed, wetted zone.
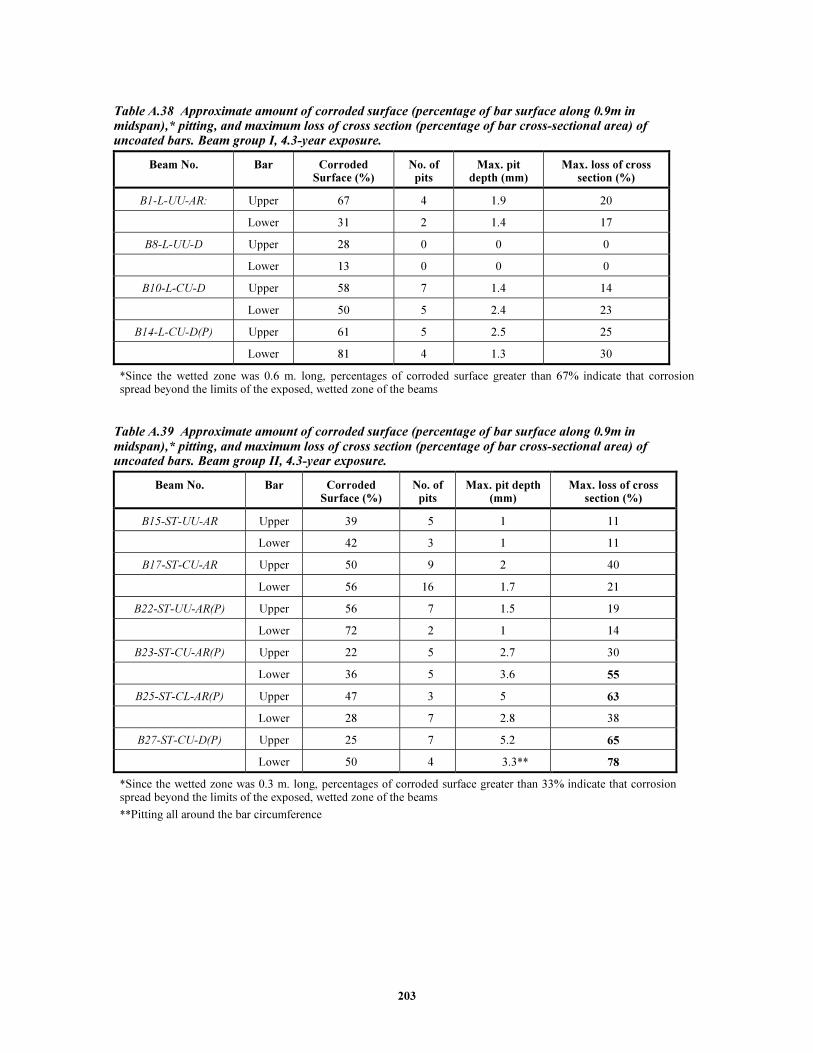
203
Table A.38 Approximate amount of corroded surface (percentage of bar surface along 0.9m in midspan),* pitting, and maximum loss of cross section (percentage of bar cross-sectional area) of uncoated bars. Beam group I, 4.3-year exposure.
Beam No. Bar Corroded Surface (%)
No. of pits
Max. pit depth (mm)
Max. loss of cross section (%)
B1-L-UU-AR: Upper 67 4 1.9 20
Lower 31 2 1.4 17
B8-L-UU-D Upper 28 0 0 0
Lower 13 0 0 0
B10-L-CU-D Upper 58 7 1.4 14
Lower 50 5 2.4 23
B14-L-CU-D(P) Upper 61 5 2.5 25
Lower 81 4 1.3 30
*Since the wetted zone was 0.6 m. long, percentages of corroded surface greater than 67% indicate that corrosion spread beyond the limits of the exposed, wetted zone of the beams
Table A.39 Approximate amount of corroded surface (percentage of bar surface along 0.9m in midspan),* pitting, and maximum loss of cross section (percentage of bar cross-sectional area) of uncoated bars. Beam group II, 4.3-year exposure.
Beam No. Bar Corroded Surface (%)
No. of pits
Max. pit depth (mm)
Max. loss of cross section (%)
B15-ST-UU-AR Upper 39 5 1 11
Lower 42 3 1 11
B17-ST-CU-AR Upper 50 9 2 40
Lower 56 16 1.7 21
B22-ST-UU-AR(P) Upper 56 7 1.5 19
Lower 72 2 1 14
B23-ST-CU-AR(P) Upper 22 5 2.7 30
Lower 36 5 3.6 55
B25-ST-CL-AR(P) Upper 47 3 5 63
Lower 28 7 2.8 38
B27-ST-CU-D(P) Upper 25 7 5.2 65
Lower 50 4 3.3** 78
*Since the wetted zone was 0.3 m. long, percentages of corroded surface greater than 33% indicate that corrosion spread beyond the limits of the exposed, wetted zone of the beams
**Pitting all around the bar circumference
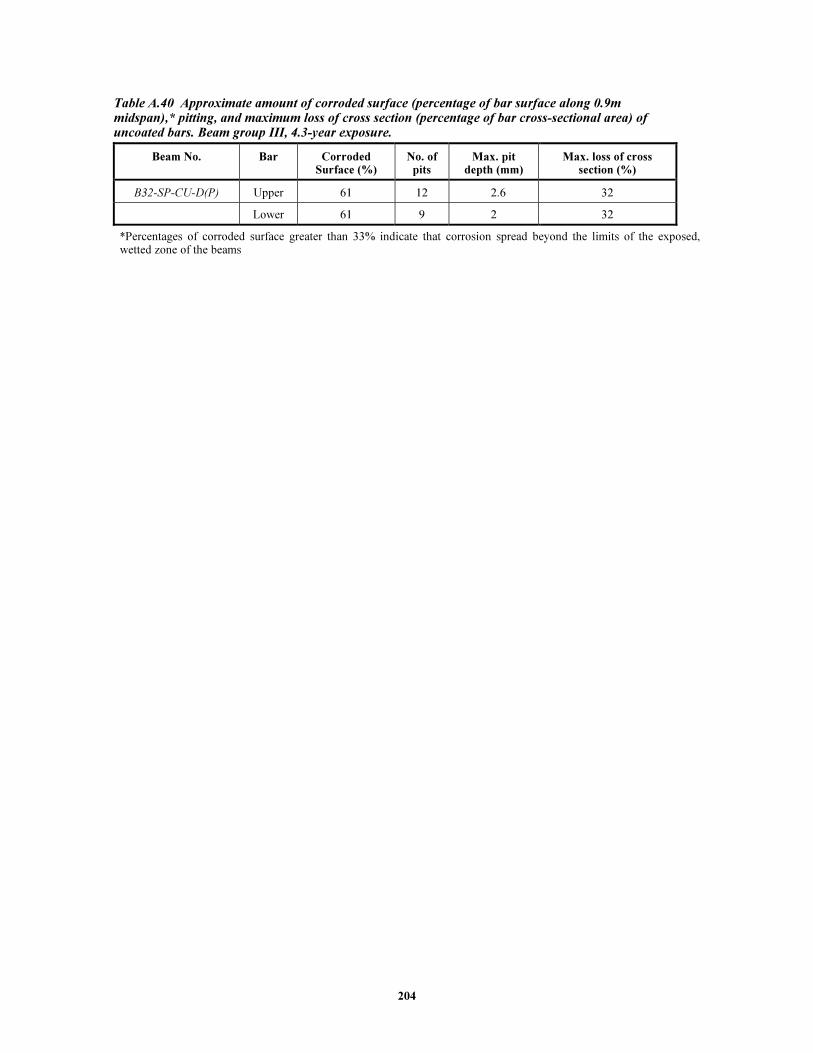
204
Table A.40 Approximate amount of corroded surface (percentage of bar surface along 0.9m midspan),* pitting, and maximum loss of cross section (percentage of bar cross-sectional area) of uncoated bars. Beam group III, 4.3-year exposure.
Beam No. Bar Corroded Surface (%)
No. of pits
Max. pit depth (mm)
Max. loss of cross section (%)
B32-SP-CU-D(P) Upper 61 12 2.6 32
Lower 61 9 2 32
*Percentages of corroded surface greater than 33% indicate that corrosion spread beyond the limits of the exposed, wetted zone of the beams

205
REFERENCES
1. Mehta, P. Kumar, and Paulo J.M. Monteiro. Concrete. Structure, Properties, and Materials. 2nd ed. Englewood Cliffs: Pretince, 1993.
2. Sagüés, A.A. Mechanism of Corrosion of Epoxy-Coated Reinforcing Steel in Concrete -- Final Report. University of South Florida. Report No. FL/DOT/RMC/0543-3296. Tampa, 1991.
3. Satake, J., M. Kamakura, K Shirakawa, N. Mikami, and N. Swamy. “Long-Term Corrosion Resistance of Epoxy-Coated Reinforcing Bars.” Corrosion of Reinforcement in Concrete Construction. Ed. A.P. Crane. Great Britain: Ellis, 1983: 357-378.
4. Swamy, R.N., S. Koyama, T. Arai, and N. Mikami. “Durability of Steel Reinforcement in Marine Environment.” Concrete in Marine Environment. Ed. V.M. Malhotra. American Concrete Institute. Proceedings, 2nd International Conference, St. Andrews by-the-Sea, Canada. ACI SP-109. Detroit: ACI, 1988: 147-161.
5. Poston, R.W. Improving Durability of Bridge Decks by Transverse Prestressing. Ph.D. Diss., The University of Texas at Austin, 1984.
6. Andrade, C., J.D. Holst, U. Nürnberger, J.D. Whiteley, and N. Woodman. Protection Systems for Reinforcement. CEB Bulletin D’Information no. 211. Switzerland, 1992.
7. Collacott, R.A. Structural Integrity Monitoring. London-New York: Chapman and Hall, 1985.
8. Borgard, B., C. Warren, S. Somayaji, and R. Heidersbach. “Mechanisms of Corrosion of Steel in Concrete.” Corrosion Rates of Steel in Concrete. Eds. N.S. Berke, V. Chaker, and D. Whiting. American Society for Testing and Materials. ASTM STP 1065. Philadelphia: ASTM, 1990: 174-188.
9. Erlin, B., and W. Hime. “Chloride-Induced Corrosion.” Corrosion, Concrete, and Chlorides. Steel Corrosion in Concrete: Causes and Restraints. American Concrete Institute. Special Publication SP-102-9. Detroit: ACI, 1987: 155-159.
10. Kobayashi, K., and K. Takewaka. “Experimental Studies of Epoxy-Coated Reinforcing Steel for Corrosion Protection.” The International Journal of Cement Composites and Lightweight Concrete. 6, no. 2 (May 1984): 99-116. Quoted in Kahhaleh, Khaled Z. Corrosion Performance of Epoxy-Coated Reinforcement. 3 vols. Ph.D. Diss., The University of Texas at Austin, 1994.
11. Houston, J., E. Atimay, and P.M. Ferguson. Corrosion of Reinforcing Steel Embedded in Structural Concrete. The University of Texas at Austin, Center for Highway Research. Research Report No. 112-1-F. Austin, 1972.
12. Thornton, H.T. Tensile Crack Exposure Tests, Report 4 of a Series. U.S. Army Engineer Waterways Experiment Station. 1984. Quoted in Corley, W. Gene. “Designing Corrosion Resistance into Reinforced Concrete.” Materials Performance. 34, no. 9 (Sept. 1995): 54-58.
13. ACI Committees 222 and 224. “Debate: Crack Width, Cover, and Corrosion.” In Back to the Basics. Repair of Concrete. ACI Seminar Course Manual, SCM-13 (86). Detroit: American Concrete Institute, 1986: 1-16.
14. Hamad, B.S., J.O. Jirsa, and N.J. D’Abreu D’Paolo. Effect of Epoxy Coating on Bond and Anchorage of Reinforcement in Concrete Structures. The University of Texas at Austin. Center for Transportation Research. Research Report No. 1181-1F. Austin, 1990.
15. ACI Committee 318. Building Code Requirements for Reinforced Concrete (ACI 318-89) and Commentary (ACI 318R-89). Detroit: American Concrete Institute, 1989.
16. Elsener, B., and H. Böhni. “Potential Mapping and Corrosion of Steel in Concrete.” Corrosion Rates of Steel in Concrete. Eds. N.S. Berke, V. Chaker, and D. Whiting. American Society for Testing and Materials. ASTM STP 1065. Philadelphia: ASTM, 1990: 143-156.
17. American Society for Testing and Materials. Half-Cell Potentials of Uncoated Reinforcing Steel in Concrete. ASTM C876-87. Philadelphia: ASTM, 1987.

206
18. Jones, Denny A. Principles and Prevention of Corrosion. New York: Macmillan, 1992.
19. Erdogdu, S., and T.W. Bremner. “Field and Laboratory Testing of Epoxy-Coated Reinforcing Bars in Concrete.” Transportation Research Circular: Epoxy-Coated Reinforcement in Highway Structures. No. 403. National Research Council. Transportation Research Board. Washington, 1993: 5-16.
20. Virmani, Y.P., K.C. Clear, and T.J. Pasko. Time-to-Corrosion of Reinforcing Steel in Concrete Slabs, V.5: Calcium Nitrite Admixture or Epoxy-Coated Reinforcing Bars as Corrosion Protection Systems. Vol. 5. U.S. Federal Highway Administration. Report No. FHWA/RD-83/012. Washington, 1983. 5 vols.
21. Zayed, A., A. Sagüés, and R. Powers. “Corrosion of Epoxy-Coated Reinforcing Steel in Concrete.” Corrosion 89. National Association of Corrosion Engineers. Paper No. 379. Houston: NACE, 1989.
22. McKenzie, M. “The Effect of Defects on the Durability of Epoxy-Coated Reinforcement,” Transportation Research Circular: Epoxy-Coated Reinforcement in Highway Structures. No. 403. National Research Council. Transportation Research Board. Washington, 1993: 17-28.
23. Kahhaleh, Khaled Z., Enrique Vaca-Cortes, James O. Jirsa, Harovel G. Wheat, and Ramon L. Carrasquillo. Corrosion Performance of Epoxy-Coated Reinforcement–Macrocell Tests. The University of Texas at Austin. Bureau of Engineering Research. Center for Transportation Research. Unpublished Research Report No. 1265-3. Austin, 1998.
24. Kahhaleh, Khaled Z. Corrosion Performance of Epoxy-Coated Reinforcement. 3 vols. Ph.D. Diss., The University of Texas at Austin, 1994.
25. Sagüés, A., R. Powers, and A. Zayed. “Marine Environment Corrosion of Epoxy-Coated Reinforcing Steel.” In Corrosion of Reinforcement in Concrete. eds. C.L. Page, K.W.J. Treadaway, and P.B. Bamforth. New York: Elsevier, 1990: 539-549.
26. Broomfield, J.P., J. Rodríguez, L.M. Ortega, and A.M. García. “Corrosion Rate Measurement and Life Prediction for Reinforced Concrete Structures.” Proceedings of 5th International Conference on Structural Faults and Repair. V.2. University of Edinburgh, 1993: 155-163.
27. Rostam, S. “Service Life Design- The European Approach.” Concrete International. 15, no. 7 (July 1993): 24-32.
28. Wheat, H.G., and Z. Eliezer. “Some Electrochemical Aspects of Corrosion of Steel in Concrete.” Corrosion. 41, no. 11 (Nov. 1985): 640-645.
29. Clear, K.C. Effectiveness of Epoxy-Coated Reinforcing Steel–Interim Report. Canadian Strategic Highway Research Program. Ottawa: C-SHRP, 1992.
30. Aguilar, A., A.A. Sagüés, and R.G. Powers. “Corrosion Measurements of Reinforcing Steel in Partially Submerged Concrete Slabs.” Corrosion Rates of Steel in Concrete. Eds. N.S. Berke, V. Chaker, and D. Whiting. American Society for Testing and Materials. ASTM STP 1065. Philadelphia: ASTM, 1990: 66–85.
31. Arup, H. “The Mechanisms of the Protection of Steel by Concrete.” Corrosion of Reinforcement in Concrete Construction. Ed. A.P. Crane. Great Britain: Ellis, 1983: 151–158.
32. Lehmann, J. “Cathodic Protection (Corrosion Control) of Reinforced Concrete Structures Using Conductive Coatings.” Corrosion, Concrete and Chlorides. Steel Corrosion in Concrete: Causes and Restraints. American Concrete Institute. Special Publication ACI SP-102. Ed. F.W. Gibson. Detroit: ACI, 1987: 127–141.
33. Hime, W., and B. Erlin. “Some Chemical and Physical Aspects of Phenomena Associated with Chloride-Induced Corrosion.” Corrosion, Concrete, and Chlorides. Steel Corrosion in Concrete: Causes and Restraints. Ed. F.W. Gibson. American Concrete Institute. Special Publication SP-102-9. Detroit: ACI, 1987: 1–12.
34. Hededahl, P., and D.G. Manning. Field Investigation of Epoxy-Coated Reinforcing Steel. Report No. MAT-89-02. Ontario Ministry of Transportation. Research and Development Branch. Ottawa: MTO, 1989.
35. Fraczek, John. “A Review of Electrochemical Principles as Applied to Corrosion of Steel in a Concrete or Grout Environment.” Corrosion, Concrete, and Chlorides. Steel Corrosion in Concrete: Causes and

207
Restraints. Ed. F.W. Gibson. American Concrete Institute. Special Publication SP-102-9. Detroit: ACI, 1987: 13–24.
36. Sagüés, Alberto A. Corrosion of Epoxy Coated Rebar in Florida Bridges. University of South Florida. Interim Summary Report to Florida DOT. Tampa, 1992.
37. Clear, K.C., and Y.P. Virmani. “Solving Rebar Corrosion Problems in Concrete. Research Update: Methods and Materials.” Solving Rebar Corrosion Problems in Concrete. National Association of Corrosion Engineers. Paper no. 4. Seminar Reprints. Houston, 1983.
38. ACI Committee 222. “Corrosion of Metals in Concrete.” In ACI Manual of Concrete Practice. Part I. Detroit: American Concrete Institute, 1996. 5 vols.
39. Vaca-Cortes, Enrique, Miguel A. Lorenzo, James O. Jirsa, Harovel G. Wheat, and Ramon L. Carrasquillo. Adhesion Testing of Epoxy Coating. The University of Texas at Austin. Bureau of Engineering Research. Center for Transportation Research. Unpublished Research Report No. 1265-6. Austin, 1998.
40. Sagüés, A.A., H.M. Perez-Duran, and R.G. Powers. “Corrosion Performance of Epoxy-Coated Reinforcing Steel in Marine Substructure Service.” Paper. University of South Florida, Department of Civil Engineering and Mechanics. Florida Department of Transportation, Materials Office. Tampa.
41. Pfeifer, D.W., and J.R. Landgren. “Protective Systems for New Prestressed and Substructure Concrete.” Proceedings of 5th International Bridge Conference. Paper No. IBC-88-29. Pittsburgh, 1988: 146–153.
42. Buslov, V.M. “Marine Concrete- When to Repair, What to Repair.” Concrete International. (May 1992): 36–40.
43. Reis, Robert A. In Service Performance of Epoxy Coated Steel Reinforcement in Bridge Decks. California Department of Transportation. Report No. FHWA/CA/TL-96/01-MINOR. Sacramento, 1995.
44. Pfeifer, D.W., R. Landgren, and P. Krauss. “Performance of Epoxy-Coated Rebars: A Review of CRSI Research Studies.” Transportation Research Circular: Epoxy-Coated Reinforcement in Highway Structures, No. 403. National Research Council. Transportation Research Board. Washington, 1993: 57–65.
45. Neville, A.M. Properties of Concrete. New York: Wiley, 1996.
46. Biczók, Imre. Concrete Corrosion and Concrete Protection. 5th ed. New York: Chemical Publishing, 1967.
47. Krauss, Paul D., David B. McDonald, and Matthew R. Sherman. Corrosion Investigation of Four Bridges Built Between 1973 and 1978 Containing Epoxy-Coated Reinforcing Steel. Minnesota Department of Transportation. Report No. MN/RC-96/25. St. Paul, 1996.
48. Vaca-Cortes, Enrique, Hengching Chen, James O. Jirsa, Harovel G. Wheat, and Ramon L. Carrasquillo. Repair of Epoxy-Coated Reinforcement. The University of Texas at Austin. Bureau of Engineering Research. Center for Transportation Research. Unpublished Research Report No. 1265-5. Austin, 1998.
49. American Society for Testing and Materials. Standard Specification for Deformed and Plain Billet-Steel Bars for Concrete Reinforcement. ASTM A615-87a. Philadelphia: ASTM, 1987.
50. American Society for Testing and Materials. Standard Method for Nondestructive Measurement of Film Thickness of Pipeline Coatings on Steel. ASTM G12-83. Philadelphia: ASTM, 1983.
51. American Association of State Highway Transportation Officials. Rapid Determination of the Chloride Permeability of Concrete. AASHTO T277-83. Washington: AASHTO, 1983.


![SUPPLEMENTARY CORROSION PROTECTION ... - mpa.uni … · 2. EPOXY-COATINGS [1-5] 2.1 Application of coated reinforcement Epoxy coating is one of the most widely used techniques for](https://img.dokumen.tips/doc/110x75/5f9d80620b9a0e5ae728af4a/supplementary-corrosion-protection-mpauni-2-epoxy-coatings-1-5-21-application.jpg)