Embed Size (px)
Citation preview

University of South FloridaScholar Commons
Graduate Theses and Dissertations Graduate School
7-14-2005
Corrosion Performance of Concrete Cylinder PilesKingsley LauUniversity of South Florida
Follow this and additional works at: https://scholarcommons.usf.edu/etd
Part of the American Studies Commons
This Thesis is brought to you for free and open access by the Graduate School at Scholar Commons. It has been accepted for inclusion in GraduateTheses and Dissertations by an authorized administrator of Scholar Commons. For more information, please contact [email protected].
Scholar Commons CitationLau, Kingsley, "Corrosion Performance of Concrete Cylinder Piles" (2005). Graduate Theses and Dissertations.https://scholarcommons.usf.edu/etd/735

Corrosion Performance of Concrete Cylinder Piles
by
Kingsley Lau
A thesis submitted in partial fulfillment of the requirements for the degree of
Master of Science in Civil Engineering Department of Civil and Environmental Engineering
College of Engineering University of South Florida
Major Professor: Alberto Sagüés, Ph.D. Rajan Sen, Ph.D.
Peter Stroot, Ph.D.
Date of Approval: July 14, 2005
Keywords: Chloride Penetration, Diffusion, Crack, Cover, Durability
© Copyright 2005, Kingsley Lau

Acknowledgments
The author is indebted for the support in completion of research pertaining to this thesis. First, thanks to the researchers at the Corrosion Engineering Laboratory at the University of South Florida. Thanks to Dr. Francisco Presuel-Moreno, Dr. Hongbin Wang, Dr. Fushuang Cui, Leonardo Caseres, and Vikas Balakrishna. Special acknowledgement is made to Ms. Lan Yao for her contributions to this research. The author would also like to acknowledge the contributions made by Mr. Jaime Lopez-Sabando, Mr. Jason Melancon, Mr. Rick McCall, Ms. Maria Costanza Suarez, and Mr. Adam Verdon. Thanks to the USF College of Engineering Shop. Thanks to the researchers and engineers at the Florida Department of Transportation Corrosion Laboratory for their assistance. Thank you to Dr. Rajan Sen and Dr. Peter Stroot for serving as committee members. Finally, thank you to Dr. Alberto Sagüés for the encouragement as a professor and mentor.

i
Table of Contents List of Tables iii List of Figures iv Abstract viii 1 Introduction 1
1.1 Project Scope 1
1.2 Performance of Cylinder Piles 6 2 Investigation Methodology 14
2.1 Bridges Investigated 14
2.2 Methodology 15 2.2.1 Field investigation methods 16 2.2.2 Laboratory experimental methods 19
3 Field Investigation Results 24
3.1 Hathaway Bridge 24 3.1.1 Concrete Observations 24 3.1.2 Steel Condition Observations 25 3.1.3 Field Measurements of Steel Potential and Concrete
Moisture 28
3.2 Pensacola Bay Bridge 30 3.2.1 Concrete Observations 31 3.2.2 Steel Condition Observations 33 3.2.3 Field Measurements of Steel Potential and Concrete
Moisture 36
3.3 Brooks Bridge 38 3.3.1 Concrete Observations 39 3.3.2 Steel Condition Observations 39 3.3.3 Field Measurements of Steel Potential and Concrete
Moisture 40
ii
3.4 St. George Island Bridge 41 4 Laboratory Experiment Findings 44
4.1 Electrical Resistivity 44
4.2 Porosity 56
4.3 Chloride Ion Penetration Profiles Observations and Diffusion Parameters 58
4.4 Concrete Pore Water pH 71
4.5 Magnetic Susceptibility Measurements 73
4.6 Laboratory IRH Measurements 74
5 Durability and Pile Design 76
5.1 Performance of Cylinder Piles from Older Bridges 76 5.1.1 Chloride penetration 78 5.1.2 Critical chloride threshold 79 5.1.3 Corrosion propagation rates 82 5.1.4 Corrosion-related durability prognosis 84
5.2 Performance of Cylinder Piles Built Under Current FDOT
Guidelines 85
5.3 Concrete Cover and Cylinder Pile Corrosion Performance 87 6 Deterioration Forecast Model 90 7 Conclusions 101 References 104 Appendices 109 Appendix I Bridge Survey 110 Appendix II Bridge Survey Diagrams 123 Appendix III Data Tables 131
iii
List of Tables Table 1.1 Sampling of Bridges Built with Circular Piles and
Performance Notes 9 Table 2.1 Surveyed Bridges 15 Table 6.1 Forecast Model Inputs 92 Table A1b Pensacola Bay Bridge Survey 111 Table A1c Brooks Bridge Survey 121 Table A1d St George Island Survey 122 Table A2 Direct Clear Cover Measurements. 128 Table A3 Core Properties, Chloride Diffusion Parameters, Projected
Chloride Concentration, and Steel Condition 131 Table A4 Chloride Concentration Profile Data and Analysis Results 134 Table A5 Field Potential Mapping 140 Table A6 Field IRH Measurements 147

iv
List of Figures Figure 1.1 Cylinder Pile Cross-Section 7 Figure 2.1 Schematic of Concrete Internal Relative Humidity Set-up 18 Figure 2.2 Schematic of ISL Concrete Samples 22 Figure 3.1 Hathaway Bridge Half-cell Potential Measurements 29 Figure 3.2 Hathaway Bridge Concrete Internal Relative Humidity 30 Figure 3.3 Observation of Surface Rusting on Strand, Pensacola Bay
Bridge 34 Figure 3.4 Pressurized Grout Consolidation, Pensacola Bay Bridge 35 Figure 3.5 Pensacola Bay Bridge Half Cell Potential Measurements 37 Figure 3.6 Pensacola Bay Bridge Concrete Internal Relative Humidity
as Function of Time Since Probe Insertion, 22 hrs after Test Fitting Installation 38
Figure 3.7 Brooks Bridge Half-cell Potential Measurements as Function
of Elevation 40 Figure 3.8 St. George Island Bridge Half-cell Potential Measurements 43 Figure 4.1 Hathaway Bridge Core Mass Change as Function of
Exposure Time to 100% RH 46 Figure 4.2 Hathaway Bridge Core Resistivity Measurements as
Function of Exposure Time to 100%RH 46 Figure 4.3 Hathaway Bridge Core Apparent Wet Resistivity as Function
of Mass Increase Due to Water Absorption 47 Figure 4.4 Pensacola Bay Bridge Core Mass Change as Function to
Exposure Time to 100% RH 48

v
Figure 4.5 Pensacola Bay Bridge Core Wet Resistivity Measurements as Function to Exposure Time to 100% RH 48
Figure 4.6 Pensacola Bay Bridge Core Apparent Wet Resistivity as
Function of Mass Increase Due to Water Absorption 49 Figure 4.7 St. George Island Bridge (Pile 162) Core Mass Change as
Function of Exposure Time to 100% RH 51 Figure 4.8 St. George Island Bridge (Pile 162) Core Wet Resistivity
Measurements as Function of Exposure Time to 100% RH 51 Figure 4.9 St. George Island Bridge (Pile 163) Core Mass Change as
Function of Exposure Time to 100% RH 52 Figure 4.10 St.George Island Bridge (Pile 163) Core Wet Resistivity
Measurements as Function of Exposure Time to 100% RH 52 Figure 4.11 St. George Island Bridge Core Apparent Wet Resistivity as
Function of Mass Increase Due to Water Absorption 53 Figure 4.12 St. George Island Concrete Resistivity Measurements on As-
extracted Cores 53 Figure 4.13 St. George Island Bridge Pile Cutoff Mass Change as
Function of Exposure Time to 100%RH 55 Figure 4.14 St. George Island Bridge Pile Cutoff Wet Resistivity
Measurements as Function of Exposure Time to 100%RH 55 Figure 4.15 St. George Island Bridge Pile Cutoff Concrete Porosity 57 Figure 4.16 Pensacola Bay Bridge and Hathaway Bridge Concrete
Porosity 57 Figure 4.17 Hathaway Bridge Chloride Ion Penetration Profile 59 Figure 4.18 Pensacola Bay Bridge Chloride Ion Penetration Profile 60 Figure 4.19 Brooks Bridge Chloride Ion Penetration Profile 61 Figure 4.20 St. George Island Bridge Chloride Ion Penetration Profile 61 Figure 4.21 Salt-solution Ponded Concrete Chloride Ion Penetration
Profile 62

vi
Figure 4.22 Cumulative Fraction of Deff Values for Cylinder Piles in Study and Escambia Bay Bridge Study 63
Figure 4.23 Cumulative Fraction of Cs Values for Cylinder Piles in Study
and Escambia Bay Bridge Study 63 Figure 4.24 Apparent Chloride Ion Diffusivity as Function of Pile
Elevation 66 Figure 4.25 Chloride Surface Concentration as Function of Pile
Elevation. 66 Figure 4.26 Comparison of Water Chloride Content and Concrete
Chloride Surface Concentration Cs. 68 Figure 4.27 Pore Water pH of St. George Island Bridge Pile Cutoffs by
ISL Technique 72 Figure 4.28 Pore Water pH by ISL Technique 72 Figure 4.29 Magnetic Susceptibility Indication of Fly Ash Presence and
Apparent Chloride Ion Diffusivity 74 Figure 4.30 Concrete IRH and Temperature as Function of Time
Conditioned in Ambient Conditions and 100% RH 75 Figure 5.1 Cumulative Fraction of Estimated Chloride Concentration at
Steel Depth Determined for Locations where Spiral or Spacing Bar Steel was Exposed by Coring in the Hathaway, Pensacola, and Brooks bridges 81
Figure 6.1 Older Bridges Forecast Deterioration Model Output 94 Figure 6.2 St. George Island Bridge Forecast Deterioration Model
Output, Xc=3.2 in (8.1 cm) 98 Figure 6.3 St. George Island Bridge Forecast Deterioration Model
Output, Xc=2 in (5.1cm) 99

vii
Figure A1 Core Extraction Diagrams 123 Figure A2 Cumulative Fraction of Clear Cover 128 Figure A3 Pensacola Bay Bridge Cumulative Count of Concrete
Deterioration Features 129 Figure A4 Examples of Corrosion Ratings. 130
viii
Corrosion Performance of Concrete Cylinder Piles
Kingsley Lau
ABSTRACT
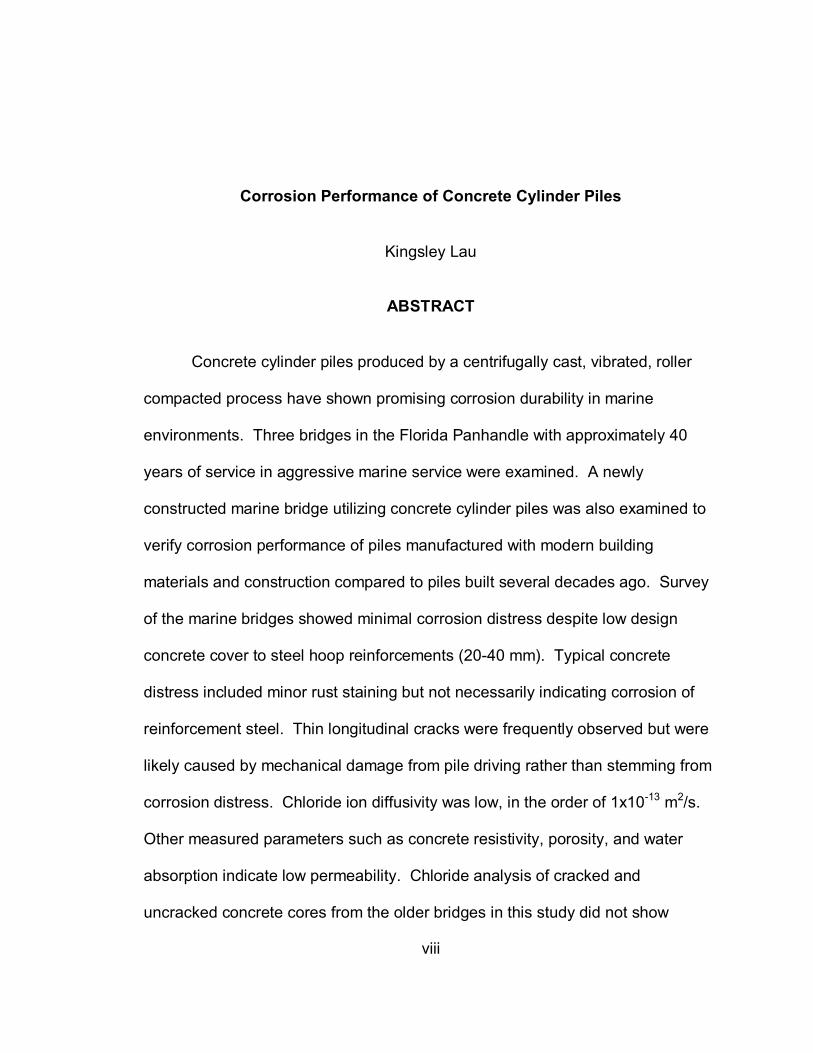
Concrete cylinder piles produced by a centrifugally cast, vibrated, roller
compacted process have shown promising corrosion durability in marine
environments. Three bridges in the Florida Panhandle with approximately 40
years of service in aggressive marine service were examined. A newly
constructed marine bridge utilizing concrete cylinder piles was also examined to
verify corrosion performance of piles manufactured with modern building
materials and construction compared to piles built several decades ago. Survey
of the marine bridges showed minimal corrosion distress despite low design
concrete cover to steel hoop reinforcements (20-40 mm). Typical concrete
distress included minor rust staining but not necessarily indicating corrosion of
reinforcement steel. Thin longitudinal cracks were frequently observed but were
likely caused by mechanical damage from pile driving rather than stemming from
corrosion distress. Chloride ion diffusivity was low, in the order of 1x10-13 m2/s.
Other measured parameters such as concrete resistivity, porosity, and water
absorption indicate low permeability. Chloride analysis of cracked and
uncracked concrete cores from the older bridges in this study did not show

ix
pronounced preferential chloride penetration. Chloride analysis from the
contemporary marine bridge did show some preferential transport of chloride ions
at shallow depths through cracks with further evidence of lower electrical
resistivity indicating enhanced electrolyte transport. The pore water pH of
concrete samples from the contemporary bridge was high despite the presence
of pozzolanic materials suggesting that normal chloride threshold values may be
valid. Simplified corrosion durability modeling projections indicate that a
moderate relaxation of current FDOT concrete cover requirements may be valid
without severely compromising the corrosion durability of concrete cylinder piles.

1
1 Introduction
1.1 Project Scope
The corrosion damage mechanism of steel in concrete induced by chloride
ions is viewed as a two step process of initiation and propagation. In the
initiation stage, chloride ions penetrate through the concrete cover by bulk
diffusion, capillary suction, and permeation. The build up of chloride ions at the
steel surface upon reaching a critical threshold value CT causes depassivation of
the reinforcing steel and initiates active corrosion. In the propagation stage,
active corrosion of the steel continues where expansive corrosion products may
damage the surrounding concrete until concrete distress is manifested as cracks,
spalls, and concrete delamination. The durability of the structure is reduced by
the effects of steel cross-section loss and concrete distresses. The corrosion
service life of a concrete structure can be viewed as the time to concrete distress
(time elapsed during corrosion initiation (ti) and propagation (tp).
Durability design strategies seek to extend ti as much as possible, since
control of corrosion after initiation is comparatively difficult. The time ti becomes
longer with greater concrete cover, and less permeable concrete. Increased CT,
and lower chloride levels at the concrete surface also extend ti but are less

2
amenable to control during design. As a result, design guidelines including those
adopted by the Florida Department of Transportation (FDOT) address minimum
concrete cover and concrete quality as the principal means to obtain durability
expectations of many decades. Concrete cover is particularly important since
corrosion forecasting models indicate that, all else being equal, ti is proportional
to the square of the concrete cover thickness (for example, reduction of the cover
from 3 to 1.5 inches (7.5 to 3.8 cm) would shorten the initiation stage by 75%).
Consequently, there is reluctance to reduce clear cover requirements unless
exceptional circumstances arise.
Other durability factors than have been noted in the literature including
improper quality control and construction difficulties of cylinder piles [1];
longitudinal cracking may result from differential shrinkage during fabrication,
improper construction and pile driving. The presence of cracks may result in
faster chloride ion penetration.
Indications of apparently exceptional corrosion resistance have been
obtained in a 1997-8 assessment [2] of the substructure of the Escambia Bay
Bridges, No. 580071 and 580058, located in highly aggressive estuary water
with chloride concentrations at times exceeding 10,000 ppm. The substructure of
these bridges was built in 1966 using circular Centrifugally Cast, Vibrated, Roller
Compacted (CEN-VI-RO process) Raymond piles. There are 268 54-inch (1.4 m)

3
diameter and 1,218 36-inch (0.9 m) diameter cylinder piles in water. The nominal
clear concrete cover for the spiral hoop reinforcement of either size of pile is only
1.375 inch (3.5 cm), and actual cover values as small as 0.75 inch (1.9 cm) were
recorded. Despite the low cover, aggressive environment, and 30-year long
exposure, no indication of significant corrosion damage was observed. Detailed
examination of chloride penetration was performed in 17 cores extracted from the
piles. Analysis of chloride concentration profiles yields the apparent chloride
diffusion coefficient of the concrete D, which is an indication of its permeability to
chlorides. The analyses indicated diffusivity values that in most cases were less
than 0.01 in2/y (2x10-13 m2/s)—among the lowest values ever determined for
conventional FDOT concrete bridge substructures examined to date [3].
Although D was small, the concrete cover was thin which allowed
appreciable chloride buildup at the hoop reinforcement depth. In the tidal zone,
the chloride concentration (0.188% by concrete weight or 4.5 kg/m3 assuming a
concrete unit weight 2400 kg/m3) [2] had already exceeded commonly accepted
CT values for plain steel bars. The absence of corrosion damage indicated that
either corrosion was already in progress but at a very slow rate (a large value of
tp) or that the value of CT for the spiral steel/concrete combination was higher
than encountered in conventional reinforced concrete. Chloride concentrations
close to commonly accepted CT values were observed in the splash-evaporation
zone, suggesting that corrosion may begin in the near future.

4
A corrosion degradation forecast model was developed for the Escambia
Bay bridges [2] based on the corrosion assessment data and information on the
performance of structures elsewhere. The model parameters included estimated
values for CT and tp that reflected the present condition of the structure. The
forecast functions projected significant but still moderate corrosion damage
development over the next 60 years of service. The damage projections were
used together with cost data for repair procedures to estimate life-cycle costs
over that period. The life cycle cost estimates for the next 60 years indicated that
keeping the present substructure in service even beyond the 75 year design goal
was preferable to demolition and erection of a new bridge.
Cylinder pile construction is optimized for relatively low concrete covers.
There is considerable interest in establishing whether normal cover requirements
(presently 3 in (7.6 cm) adopted by FDOT [4]) could be relaxed for that type of
pile to thicknesses comparable to those used in the Escambia Bay bridges. The
feasibility of reliably constructing 36-in (0.9 m) or 66-in (1.7 m) diameter cylinder
piles with 3 in (7.6 cm) covers has been questioned [5], and there is also concern
that cracks may develop more easily when the cover is thick. Unfortunately the
information available from the 1997-8 survey is too limited to fully substantiate
the use of concrete covers much thinner than present FDOT specifications for a
75-year design service life goal. Only a limited number of cylinder piles were

5
examined in detail; as presented earlier, the deterioration models had to estimate
critical parameter values in lieu of limited or absent information.
The present investigation is intended to expand the knowledge on the
present and future performance of cylinder piles in marine service. The
investigation examined whether other bridges built with cylinder piles showed
corrosion resistance comparable to that encountered in the Escambia Bay
bridges. The investigation also sought to identify any factors responsible for that
performance, with a view to considering redefining cover guidelines for cylinder
pile construction.
Cylinder piles of three approximately 40 year old FDOT bridges, and
another one newly built, were examined to establish corrosion performance.
Activities performed included visual surveys, coring to assess chloride
penetration and steel condition, and other electrochemical and physicochemical
concrete property measurements in the field and laboratory.
Much of the research described in this thesis was conducted in a
collaborative effort by the author and Lan Yao at the University of South Florida
Corrosion Engineering Laboratory and researchers at the Materials Office of the
Florida Department of Transportation. Results from early experimentation and
preliminary data analysis contributed by Ms. Yao are acknowledged when

6
introduced in the corresponding sections. Thorough evaluation of all data was
conducted by the author under the direction of Dr. Alberto Sagüés1. A brief
review of documented cylinder pile performance, compiled by Ms. Yao, is
presented in Table 1.1. Methodology and findings of the field and laboratory
investigations are detailed in the subsequent sections.
1.2 Performance of Cylinder Piles Cylinder pile manufacturing has been reviewed in detail elsewhere [6- 10].
The cylinder piles are made of segments typically 16 ft (4.9 m) in length. A spiral
wire cage with welded longitudinal spacing bars is placed in an assembly
consisting of the cylinder pile form and end rings that maintain the placement
rods that form the strand ducts typically 1.375 in (3.5 cm) in diameter. Concrete
is placed into the form that is being rotated in the Cen-Vi-Ro process where the
concrete is centrifugally cast into the form, vibrated, and roller compacted. After
concrete curing and form stripping, the segments are aligned by the duct
openings for pile assembly. Long piles are made by assembling several cylinder
pile segments together by post-tensioning prestressing strands through the duct
openings. The strands are tensioned and pressure grouted. The pile segment
joints are covered with epoxy. During bridge construction, the piles are cut to
1This thesis was the basis of the Final Report to the Florida Deparrtment of Transportation “Corrosion Performance of Concrete Cylinder Piles” BC353 RPWO#10 (2005) -605 Suwannee St. MS30 Tallahassee, FL 32399- by K. Lau, A.A. Sagüés, and L. Yao. The author of this thesis was the senior contributing author to that report under the direction of the Principal Investigator, A.A Sagüés, Ph.D, P.E. Much of the research described here is also in the report to FDOT.

7
length. The diameter of the cylinder piles typically range from 36 – 66 in (0.9 –
1.7 m). Design information from the Hathaway Bridge construction drawings,
archived in the FDOT Structures Office, indicate cylinder pile wall thickness 5 in
(12.7 cm) with a clear cover approximately 1.75 in (4.4 cm); however, these
design values have been enlarged in newer FDOT specifications. An example of
a cylinder pile cross section from the FDOT Structures Manual is shown in Figure
1.1.
Figure 1.1 Cylinder Pile Cross-section. From FDOT Structures Manual 2004.
Based on the available records reported in literature [9,11-15], personal
communication with FDOT personnel and Bayshore Concrete Products
Corporation (BCP), it is conservatively estimated that at least 75 bridges have
been built as of 2002 with Raymond Piles in the United States. Concrete cylinder

8
piles typically have high cement factors, 650 - 800 pcy (385 - 474 kg/m3) [9]; the
water to cement ratio has been reported to be 0.35 - 0.45 [2]. Records from the
St. George Island Bridge cylinder pile mix design from Gulf Coast Prestress, Inc.
also indicate high cement factors, 840 pcy (~500 kg/m3) and low water to cement
ratio (0.31).
A number of investigations have documented cracks in Raymond Piles
[12-14]; however, most of the cracks were found to be minor or moderate without
severe chloride buildup in adjacent areas [12-13]. The cracks were not likely
caused by the expansion of corrosion products but rather by elastic rebound of
prestress ducts, differential shrinkage, frost damage, or damage from hammering
[13]. In a 1995 inspection of the twin bridges over Lake Ponchartrain, LA cracks
appeared to extend to strand depth but without corrosion rust staining [1]. In the
same inspection, localized damage to the transverse joint epoxy seal was
observed. A brief survey of Raymond Pile bridges as of 2002 was prepared and
a sampling of findings is listed in Table 1.1. As shown in Table 1.1, Raymond
piles are used in coastal states such as Florida, Georgia, Alabama, Mississippi,
Louisiana, South Carolina, North Carolina, Virginia, Maryland, New York, New
Jersey, and Rhode Island. The results of the survey indicated generally good
corrosion performance, with the caveat that thin cracking, usually longitudinal
and normally neither a cause nor a consequence of corrosion, has been reported
in many instances.

9
Tabl
e 1.
1. S
ampl
ing
of B
ridge
s B
uilt
with
Circ
ular
Pile
s an
d P
erfo
rman
ce N
otes
- 200
2 su
mm
ary
(com
pile
d by
Lan
Yao
).
Sta
te/
No.
B
ridge
Nam
e
Loca
tion
Yea
r B
uilt
App
x.
Leng
th
Pile
D
iam
.(in)
P
erfo
rman
ce
F
lorid
a 1
Esc
ambi
a B
ay (E
B)
Esc
ambi
a B
ay
1966
13
597'
54
& 3
6 N
o si
gnifi
cant
cor
rosi
on d
amag
e fo
und
on p
iles
in 1
997(
1)
2 E
scam
bia
Bay
(WB
) E
scam
bia
Bay
19
66
1359
7'
54 &
36
No
sign
ifica
nt c
orro
sion
dam
age
foun
d on
pile
s in
199
7(1)
3 B
rook
s O
kalo
osa
1964
13
18'
36
Sub
stru
ctur
e w
as in
sat
isfa
ctor
y co
nditi
on in
Jun
e, 2
001(
2)
4 P
ensa
cola
Bay
P
ensa
cola
Bay
19
60
1564
0'
54
Sub
stru
ctur
e w
as in
sat
isfa
ctor
y co
nditi
on in
Jun
e, 2
001(
2)
5 H
atha
way
P
anam
a C
ity
1960
33
58'
54
Sub
stru
ctur
e w
as in
fair
cond
ition
in F
ebru
ary,
200
1(2)
6 La
ke U
nder
hill
Orla
ndo
1974
N
/A
36
N/A
7 S
t.Geo
rge
Isla
nd
St. G
eorg
e Is
land
20
03
3.1m
ile
54
Und
er c
onst
ruct
ion
in 2
002
Loui
sian
a
1 La
ke P
ontc
hartr
ain
Cau
sew
ay
New
Orle
ans
~195
5 24
mile
54
V
ertic
al h
airli
ne c
rack
s w
ere
foun
d on
som
e pi
les
in 1
995
(3)
som
e lo
caliz
ed d
amag
e to
tran
sver
se jo
int e
poxy
sea
l (4)
2 La
ke P
ontc
hartr
ain
Cau
sew
ay
New
Orle
ans
~196
5 24
mile
54
V
ertic
al c
rack
s w
ere
foun
d on
som
e pi
les
in 1
995
(3)
3 45
0070
0651
(EB
) B
aton
Rou
ge
N/A
N
/A
54
4 45
0070
0652
(WB
) B
aton
Rou
ge
N/A
N
/A
54
Mod
erat
e da
mag
e an
d ha
irlin
e cr
acks
wer
e fo
und
on
som
e pi
les
in 1
998
(5)
5 45
0061
4951
(EB
) B
aton
Rou
ge
N/A
N
/A
54
N/A
6 45
0061
4952
(WB
) B
aton
Rou
ge
N/A
N
/A
54
Hai
rline
cra
cks
on s
ome
pile
s 19
98 (5
)
7 45
0140
0001
(EB
) N
ew O
rlean
s N
/A
N/A
54
H
airli
ne c
rack
s on
som
e pi
les
1998
(5)
8 45
0140
0002
(WB
) N
ew O
rlean
s
N/A
N
/A
54
Hai
rline
cra
cks
on s
ome
pile
s 19
98 (5
)
9 U
S 1
1 br
idge
N
ew O
rlean
s N
/A
4.76
mile
54
N
/A
10
wes
t pea
rl br
idge
N
/A
N/A
N
/A
N/A
H
airli
ne c
rack
ove
r pos
t-ten
sion
ing
duct
(4)
11
Wax
Lak
e O
utle
t brid
ge
New
Orle
ans
N/A
N
/A
N/A
H
airli
ne c
rack
ove
r pos
t-ten
sion
ing
duct
(4)
Geo
rgia
1
Elb
a Is
land
E
lba
Isla
nd
N/A
17
80'
54
N/A
2 S
tate
Roa
d 30
3 Tu
rtle
Riv
er
Gly
mm
Co.
19
63~1
965
2968
' 54
& 3
6 N
/A
3 S
outh
Bro
nsw
ick
Riv
er
Gly
mm
Co.
19
63~1
964
1160
' 54
& 3
6 N
/A

10
Tabl
e 1.
1 (C
ontin
ued)
Sta
te/
No.
B
ridge
Nam
e Lo
catio
n Y
ear
Bui
lt A
ppx.
Le
ngth
Pile
D
iam
.(in)
P
erfo
rman
ce
New
Yor
k 1
Loop
Par
kway
N
assa
u C
o.
~199
9 N
/A
66
N/A
2 P
econ
ic R
iver
Brid
ge
N/A
N
/A
N/A
54
N
/A
3 La
ke C
haut
auqu
a B
ridge
C
haut
auqu
a C
o.
N/A
N
/A
36 &
54
N/A
4 C
oope
r & W
ando
Riv
ers
Brid
ge
N/A
N
/A
N/A
36
N
/A
5 P
onqu
ogue
Ave
. Brid
ge
Long
Isla
nd
N/A
N
/A
54
N/A
6 S
ag H
arbo
r B
ridge
N
/A
N/A
N
/A
36
N/A
7 W
anta
gh P
arkw
ay o
ver
Goo
se C
reek
N
/A
N/A
N
/A
54
N/A
8 N
YDO
T P
edes
trian
N
/A
N/A
N
/A
36
N/A
9 C
ross
Bay
Bou
leva
rd
N/A
N
/A
N/A
54
N
/A
Virg
inia
1
Jam
es R
iver
N
ewpo
rt N
ews
1980
23
200'
54
In
goo
d or
fair
cond
ition
(7)
2 M
onito
r –M
errim
ac B
ridge
Tu
nnel
(#22
36)
New
port
New
s 19
90
1668
5'
54
In g
ood
or fa
ir co
nditi
on (7
)
3 M
onito
r –M
errim
ac B
ridge
Tu
nnel
(#22
37)
New
port
New
s 19
90
1663
6'
54
In g
ood
or fa
ir co
nditi
on (7
)
4 H
ampt
on R
oads
Brid
ge
Tunn
el (E
B)
Nor
folk
19
74
5925
' 54
In
goo
d or
fair
cond
ition
(7)
5 H
ampt
on R
oads
Brid
ge
Tunn
el (W
B)
Nor
folk
19
57
6151
' 54
In
goo
d or
fair
cond
ition
(7)
6 C
ity o
f Nor
folk
(#18
65)
Lafa
yette
R
iver
19
94
1755
' 36
In
goo
d or
fair
cond
ition
(7)
7 C
ity o
f Nor
folk
(#18
66)
Lafa
yette
R
iver
19
70
1755
' 36
In
goo
d or
fair
cond
ition
(7)
8 C
olem
an B
ridge
Y
orkt
own
1952
37
50'
54
N/A
9 C
hesa
peak
e B
ay B
ridge
Tu
nnel
C
hesa
peak
e B
ay
1960
~196
4 17
.6
mile
54
V
ertic
al c
rack
s fo
und
on s
ome
pile
s (1
988)
(5,6
)

11
Tabl
e 1.
1 (C
ontin
ued)
S
tate
/ N
o.
Brid
ge N
ame
Loca
tion
Yea
r B
uilt
App
x.
Leng
th
Pile
D
iam
.(in)
P
erfo
rman
ce
Mar
ylan
d
1 W
illiam
Pre
ston
Lan
e M
emor
ial (
WB
) A
nnap
olis
~
1973
4.
3 m
ile
54
Sev
ere
crac
ks fo
und
on p
iles;
cra
cks
wer
e re
paire
d w
ith
epox
y (5
)
2 P
atux
ent R
iver
Brid
ge
N/A
N
/A
N/A
54
N
/A
3 S
ever
n R
iver
Brid
ge
Ann
e A
rund
el
N/A
N
/A
54
N/A
4 B
ridge
ove
r Bea
r Cre
ek
N/A
N
/A
N/A
36
N
/A
5 M
iles
Riv
er B
ridge
R
t. 37
0 N
/A
N/A
54
N
/A
6 C
hopt
ank
Riv
er B
ridge
D
orch
este
r C
o.
N/A
N
/A
54
N/A
7 S
assa
fras
Riv
er B
ridge
N
/A
N/A
N
/A
42
N/A
8 N
antic
oke
Riv
er B
ridge
D
orch
este
r C
o.
N/A
N
/A
66
N/A
9 B
ack
Riv
er B
ridge
N
/A
N/A
N
/A
54
N/A
10
Dea
l Isl
and
Brid
ge
Som
erse
t Co.
N
/A
N/A
54
N
/A
11
Boh
emia
Riv
er
Cec
il C
o.
N/A
N
/A
N/A
N
/A
Nor
th C
arol
ina
1 N
elso
n’s
Bay
C
arte
ret C
o.
1982
14
80’
54
Pile
s w
ere
in s
atis
fact
ory
cond
ition
in 1
999
(8)
2 La
ke D
rum
mon
d C
anal
(B
ridge
s #4
3 )
Cam
den
Co.
19
82
2132
’ 54
P
iles
wer
e in
sat
isfa
ctor
y co
nditi
on in
199
9 (8
)
3 La
ke D
rum
mon
d C
anal
(B
ridge
s #4
4 )
Cam
den
Co.
19
82
2132
’ 54
P
iles
wer
e in
sat
isfa
ctor
y co
nditi
on in
199
9 (8
)
4 B
onne
r Brid
ge
Dar
e C
o.
1962
12
,865
’ 66
P
iles
wer
e in
acc
epta
ble
cond
ition
in 1
999
(8)
5 S
nead
s Fe
rry
Ons
low
Co.
19
93
2781
’ 54
P
iles
wer
e in
poo
r con
ditio
n an
d re
paire
d in
200
0 (8
)
6 O
rego
n In
let B
ridge
N
C 1
2 N
/A
N/A
66
P
iles
wer
e in
goo
d co
nditi
on in
200
0 (8
)
7 C
how
an R
iver
Brid
ge
Ber
tie C
o.
1996
~200
0 95
00’
66
N/A

12
Tabl
e 1.
1 (C
ontin
ued)
S
tate
/ N
o.
Brid
ge N
ame
Loca
tion
Yea
r B
uilt
App
x.
Leng
th
Pile
D
iam
.(in)
P
erfo
rman
ce
New
Jer
sey
1 G
reat
Egg
Har
bor I
nlet
O
cean
City
20
01
3450
’ 54
U
nder
con
stru
ctio
n (9
)
2 W
atso
n’s
Cre
ek
Rt.
29, 1
0B
1990
15
00’
36
Acc
epta
ble
(9)
3 W
atso
n’s
Cre
ek
Rt.
29, 1
0B
1991
10
00’
54
Acc
epta
ble
(9)
4 R
isle
y’s
Cha
nnel
R
t. 15
2, 1
B
1989
14
25’
54
Acc
epta
ble
(9)
5 C
ross
wic
k’s
Cre
ek
Rt.2
95
1994
14
00’
54
Acc
epta
ble
(9)
6 W
atso
n’s
Cre
ek
Rt.
295,
17H
19
91
700’
36
A
ccep
tabl
e (9
)
7 W
atso
n’s
Cre
ek
Rt.
295,
17H
19
91
700’
54
A
ccep
tabl
e (9
)
8 N
avas
ink
Riv
er
Rt.3
5 20
00
1000
’ 54
A
ccep
tabl
e (9
)
9 B
arne
gat B
ay (W
B)
Rt.3
7 19
74
4750
’ N
/A
Acc
epta
ble
(9)
10
Abs
econ
Inle
t Brid
ge
N/A
N
/A
N/A
36
& 5
4 N
/A
11
Mid
dle
Thor
ofar
e B
ridge
C
ape
May
Co.
N
/A
N/A
36
N
/A
Sou
th C
arol
ina
1 C
oope
r Riv
er B
ridge
C
harle
ston
~
1992
5.
1 m
ile
54
N/A
Rho
de Is
land
1 Ja
mes
tow
n-V
erra
zzan
o B
ridge
N
/A
N/A
73
50’
36
N/A
Cal
iforn
ia
1 S
an D
iego
-Cor
onad
o B
ridge
S
an D
iego
19
67~1
969
11,1
79’
54
Cra
cks
appe
ared
on
pile
s du
ring
cons
truct
ion
and
deliv
ery
in 1
969
(5)
Mis
siss
ippi
1 B
ayou
Ber
nard
H
arris
on C
o.
2000
13
78’
66
N/A
2 w
est p
earl
brid
ge
N/A
N
/A
N/A
54
N
/A
Ala
bam
a
1 M
obile
Bay
Cau
sew
ay B
ridge
N
/A
N/A
N
/A
54
Ver
tical
hai
rline
cra
cks
rand
omly
dis
tribu
ted
on th
e pi
les
(5)

13
Tabl
e 1.
1 (C
ontin
ued)
Lo
catio
n/
No.
B
ridge
Nam
e
Loca
tion
Yea
r B
uilt
App
x.
Leng
th
Pile
D
iam
.(in)
P
erfo
rman
ce
Pue
rto R
ico
1 A
reci
bo R
iver
Brid
ge
N/A
N
/A
N/A
36
N
/A
2 R
io L
aPla
ta B
ridge
T
oa B
aja
~
1984
25
41'
54
N/A
3 V
icto
r Roj
as (R
ehab
ilitat
ion)
N
/A
N/A
N
/A
54
N/A
4 S
anto
Dom
ingo
N
/A
N/A
N
/A
54
N/A
5 D
eigo
Exp
ress
way
N
/A
N/A
N
/A
36
N/A
6 R
io G
rand
e D
e Lo
iza
N
/A
N/A
N
/A
54
N/A
Sau
di A
rabi
a
1 Ju
’Aym
ah T
rest
les
Sau
di A
rab
1977
~197
9 6
mile
54
& 6
6 M
arin
e m
ollu
sk b
orer
s at
tack
ed th
e pi
les
1982
(10)
; ver
tical
cr
acks
wer
e fo
und
on th
e pi
les
(11)
Tabl
e 1.
1 N
otes
1.
Sag
üés,
A.A
. et a
l. “A
sses
smen
t of R
ehab
ilitat
ion
Alte
rnat
ives
for B
ridge
Sub
stru
ctur
e C
ompo
nent
s.” D
raft
Rep
ort,
Jan.
199
8. S
PN
58
002-
1445
. WPI
314
8533
2.
FDO
T B
ridge
Man
agem
ent S
yste
m. C
ompr
ehen
sive
Inve
ntor
y D
ata
Rep
ort.
3.
Le
Mie
ux, G
uy “
Und
erw
ater
Insp
ectio
n of
the
Wor
ld’s
Lon
gest
Ove
rall
Brid
ges
Par
t I.”
Con
cret
e In
tern
atio
nal.
Feb.
1998
. p.6
7-70
4.
Ahn
, Woo
suk,
et a
l. “A
Stu
dy o
n C
orro
sion
Res
ista
nce
of P
rest
ress
ed M
arin
e C
oncr
ete
Pile
s.”
Cor
rosi
on/2
003.
Mar
ch 1
6, 2
003.
5.
Aven
t, R
. and
D.J
. Muk
al, “
Inve
stig
atio
n of
Cra
cks
in C
ylin
dric
al S
pun-
Cas
t Con
cret
e P
iles
in a
Mar
ine
Env
ironm
ent.”
Fin
al R
epor
t fo
r Lou
isia
na T
rans
porta
tion
Res
earc
h C
ente
r. 19
98.
6.
G
arde
r, D
onal
d. “I
nspe
ctio
n of
Sub
stru
ctur
e of
the
Che
sape
ake
Bay
Brid
ge-T
unne
l Abo
ve a
nd B
elow
the
Wat
erlin
e.”
Tran
spor
tatio
n R
esea
rch
Rec
ord.
p.1
30-1
37.
7.
M
ered
ith, J
ack.
Virg
inia
D.O
.T.
8.
S
utto
n, L
aura
. Nor
th C
arol
ina
D.O
.T.
9.
M
ansf
ield
, Jac
k. N
ew J
erse
y D
.O.T
.
10
. S
now
, R.
“Atta
ck b
y Li
thop
haga
and
Clio
na o
n M
arin
e C
oncr
ete
Stru
ctur
es: S
ome
Pre
vent
ion
and
Con
trol M
easu
res.
” Oxf
ord
&IB
H
Pub
lishi
ng C
o. P
VT. L
td, 1
988
11
. G
erw
ick,
Ben
. “In
tern
atio
nal E
xper
ienc
e in
the
Per
form
ance
of M
arin
e C
oncr
ete.
” Con
cret
e In
tern
atio
nal.
May
199
0. p
.47-
53.

14
2 Investigation Methodology
2.1 Bridges Investigated
Cylinder piles of three approximately 40 year old FDOT marine bridges,
and another one newly built (Table 2.1), were examined to establish corrosion
performance. The newly built bridge, constructed in 2003, was examined to
compare corrosion performance of cylinder piles representative of current FDOT
building guidelines to that of cylinder piles several decades old. The cylinder
piles in all bridges showed joints with segmented construction, which is a
characteristic of Raymond Piles. Further evidence of Raymond Pile construction
included the presence of grout around strands exposed by coring in the
Hathaway and Pensacola Bay Bridge. Personal communications2 confirmed that
Raymond Pile construction was used for the Hathaway Bridge.
2 Don Theobald, V.P. Engineering, Gulf Coast Prestress, Inc. and Bob Bruce, Ph.D., Catherine and Henry Boh Chair in Civil Engineering, Tulane University, formerly of Raymond International.

15
Table 2.1. Surveyed Bridges
The Escambia Bay Bridges, also in the Florida Panhandle coast and built
with Raymond Piles, were surveyed in 1997 in a manner similar to that used
here. The results of that investigation have been reported elsewhere [2] and are
used here for comparison whenever appropriate
2.2 Methodology
Field activities involved in the inspection of the concrete cylinder piles
were coordinated among personnel from the Corrosion Laboratory of the FDOT
3 FDOT records.
Bridge Number Year
Built Inspection
Date Location
Water Chloride Content (ppm)3
Length
No. of Bents/
Cylinder Piles
Pile Diameter
Hathaway 460012 1960 Dec. 2002
Panama City, FL 25 560
3 359 ft.
(1 024 m)
34 /
74
54 in.
(1.37 m)
Pensacola Bay 480035 1960 March
2003 Pensacola,
FL 7 374 15 640 ft.
(4 767 m)
257 /
916
54 in.
(1.37 m)
Brooks 570034 1964 March 2003
Ft. Walton Beach, FL 9 833
1 318 ft.
(402 m)
14 /
80
36 in.
(0.91 m)
St. George Island (SGI)
490003 2003 March 2004
St. George Island, FL 8 875
21 615 ft.
(6 588 m)
~165 /
~646
54 in.
(1.37 m)
16
Materials Office and the Corrosion Engineering Laboratory of the University of
South Florida (USF). Subsequent laboratory experiments were conducted by
USF personnel at the Corrosion Engineering Laboratory at the University of
South Florida and at the FDOT Materials Office; some chloride analyses were
contracted to A&S Laboratories, Clearwater, FL.
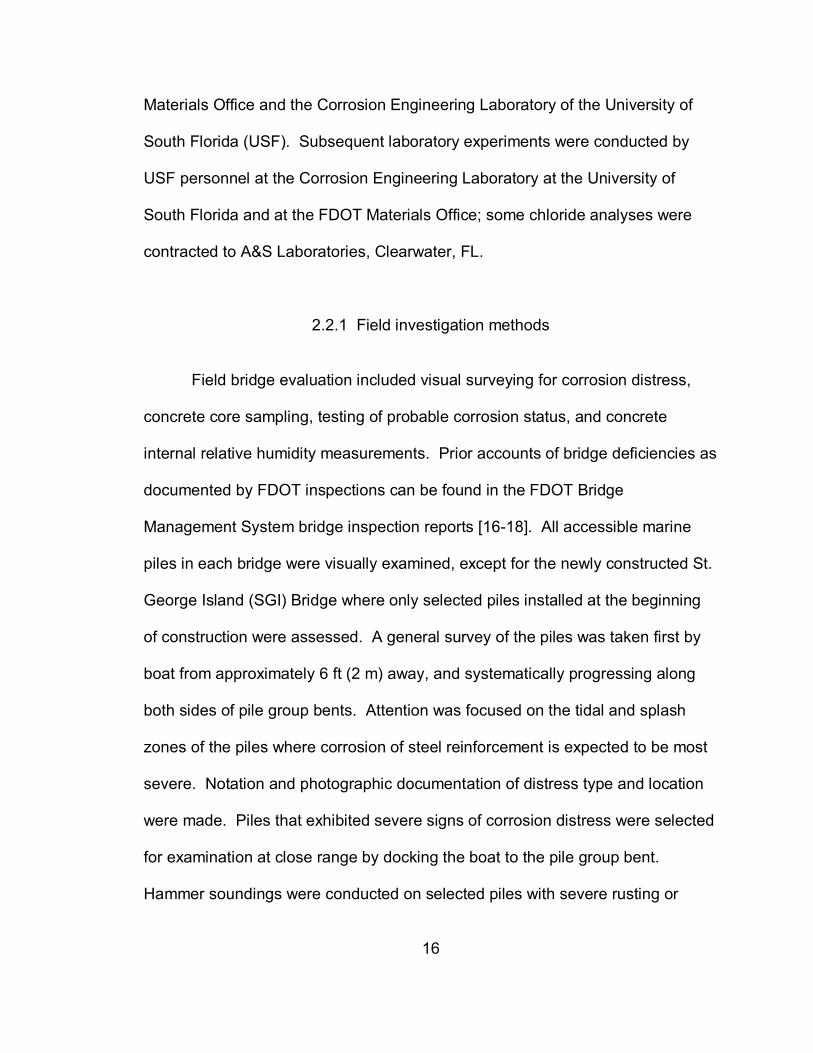
2.2.1 Field investigation methods
Field bridge evaluation included visual surveying for corrosion distress,
concrete core sampling, testing of probable corrosion status, and concrete
internal relative humidity measurements. Prior accounts of bridge deficiencies as
documented by FDOT inspections can be found in the FDOT Bridge
Management System bridge inspection reports [16-18]. All accessible marine
piles in each bridge were visually examined, except for the newly constructed St.
George Island (SGI) Bridge where only selected piles installed at the beginning
of construction were assessed. A general survey of the piles was taken first by
boat from approximately 6 ft (2 m) away, and systematically progressing along
both sides of pile group bents. Attention was focused on the tidal and splash
zones of the piles where corrosion of steel reinforcement is expected to be most
severe. Notation and photographic documentation of distress type and location
were made. Piles that exhibited severe signs of corrosion distress were selected
for examination at close range by docking the boat to the pile group bent.
Hammer soundings were conducted on selected piles with severe rusting or
17
other signs of distress to determine the presence and extent of concrete
delamination (internal separation of concrete). The presence of concrete spalls
(actual, partial or total loss of cover concrete) either pre-existing or as a result of
hammer testing were noted as well. The type, width (measured with a CTL crack
comparator gage), and probable cause of observed cracking were assessed.
For those piles where reinforcement steel had been exposed during coring, half-
cell potentials were measured with a saturated copper/copper sulfate reference
electrode (CSE). Electrical continuity between the steel reinforcement hoop wire
and strands was tested when possible.
Concrete internal relative humidity (IRH) measurements [19], were made
when permitted by time constraints. A Vaisala humidity/temperature probe was
inserted into a sealed cylindrical cavity, bored to a depth of 1.25 in (3.2 cm) from
the pile external surface (Figure 2.1), effectively sampling the humidity of air in
equilibrium with the concrete at the bottom of the cavity. A closed-cap
stabilization time of approximately 20 hours was typically allowed after
drilling/installing the fitting and the first IRH measurement; the fittings were left in
place for future monitoring. The internal relative humidity was sampled at
elevations approximately 6 in (0.15 m) and 5 ft (1.5 m) above high tide (AHT).

18
Figure 2.1 Schematic of concrete internal relative humidity set-up
Concrete core samples were extracted from the piles at the tidal and
splash zones as well as at higher elevations. A nominally 2 in (5 cm) diameter
cylindrical core drill bit was used resulting in cores of approximately 1.75 in (4.5
cm) in diameter. Coring of concrete samples was made to depths of
approximately 3.5 in (8.9 cm) or upon reaching post-tension strands. The
intersecting spiral wire and spacing rebar were typically severed by coring in the
older bridges in the study; they were not severed in the SGI Bridge. The strand
assembly was not severed, but may be nicked by the coring drill bit. The bit was
continuously cooled with fresh water while drilling. Core sample elevations
ranged from -6 in to 5 ft (-0.15 to 1.5 m) AHT. The cores were typically extracted
in pairs along the same elevation 6 in (0.15 m) apart on center. If a noticeable
vertical concrete crack was observed, two pairs of concrete cores were extracted
19
around a given elevation. One core from each pair was centered on the crack,
and the four cores formed the corners of a square 6 in (0.15 m) on the side.
Additional samples including 3.5 in (8.9 cm) diameter concrete cores of
piles that have not been placed in service were gathered from cutoff pile
segments from construction of the SGI Bridge.
2.2.2 Laboratory experimental methods
For chloride analysis selected cores were wet cut with a fine blade tile
saw, cooled with fresh water, to obtain thin slice sections. Thinner sections were
cut near the external concrete surface to better assess the rapid change of
chloride concentration near the external surface. The thin sections were ground
into powder for analysis. The initial 0.08 in (2 mm) of the concrete core was
directly powdered by shaving in a lathe and carefully collecting the powder. The
concrete cores extracted from the SGI Bridge piles, which had very narrow
chloride concentration profiles, were sampled for near surface chloride
concentration using profile grinding [20]. A 0.56 in (1.4 cm) diameter carbide-
tipped T-slot cutter was used to mill layers from the concrete core as thin as ~
0.04 in (1 mm). Thinner and more frequent layers were milled at the external
surface of the concrete core. Thicker sections were subsequently sampled from
portions deeper into the concrete by milling larger depths and cutting thin slices
with a fine blade tile saw.

20
Some of the 3.5 in (8.9 cm) diameter concrete cores from unused pile
sections of the SGI Bridge were used to make specimens for ponding with salt
solution following a modified Nordtest method [21], to measure chloride
penetration parameters. Cut samples, approximately 1.5 in (3.8 cm) in length,
were sealed with epoxy leaving only the cut surface exposed to 2.8 M NaCl
solution by means of a dam constructed for each individual sample. The salt
solution was filled to a depth 0.5 in (1.3 cm) and was periodically changed with
new solution. Ponding was conducted for an extended period (approximately 22
months) in consideration of the anticipated high quality of the concrete. Profile
grinding was conducted by the milling procedure described above.
The sampled concrete powder was normally analyzed for total chloride
content following the regular FDOT procedure [22]. Samples of concrete cores
where chloride penetration had been significant due to longer exposure to
seawater were contracted for chloride analysis to a certified FDOT provider (A&S
Laboratories, Clearwater, FL). For concrete cores where near-surface chloride
penetration was sampled by profile grinding the FDOT procedure was modified to
use a smaller amount of powder per test (typically 1.5 g instead of 3 g). Control
tests with concrete samples of known chloride content showed no significant loss
in accuracy; the homogeneity of the powder sample was addressed by
thoroughly mixing the sample and making duplicate measurements. In all cases
the concrete powder was oven dried (105oC) and digested with boiling nitric acid

21
solution. The dissolved chlorides were filtered from the undissolved remnants
such as sand. Potentiometric titration, with a silver ion selective electrode and
AgNO3 titrant, was conducted to measure the chloride content of each sample.
Results are reported in Section 2.4.1 as a ratio of chloride mass to dry concrete
mass, mg Cl- per g of dry concrete.
The apparent chloride diffusivity, D, chloride surface concentration, Cs,
and native chloride concentration, Co, were obtained by fitting the measured
chloride content and depth profile to an idealized diffusion profile described by
Eq.1 [23].
C(x,t) = Cs - (Cs - Co) erf
x2 Dt
(1)
where t is the time of service in seawater upon extraction and x is the depth from
the concrete core external surface. It is noted that this profile results from
assuming ideal Fick’s 2nd law diffusion behavior with time- and space-invariant
diffusivity in a homogeneous medium, as well as a constant surface
concentration and uniform initial concentration [23]. The resulting fit parameters
are consequently only nominal values.
Additional tests aimed at assessing concrete permeability were conducted
by conditioning selected cores in 100% relative humidity chambers. Concrete
water absorption was monitored upon reaching constant saturated weight.

22
Electrical resistivity was measured with a CNS Electronics RM MKII Wenner-
array probe or a Nilsson Model 400 resistivity meter set up with a 4-point
electrode configuration. The terminal wet resistivity, corrected for core geometry
[24] is reported as ρwet. Internal concrete relative humidity for selected core
samples was monitored for ambient and conditioned environments. A sealed
cylindrical cavity was bored from the original surface of concrete samples
collected from the unused portion of the SGI Bridge piles. Similar to field
measurements, a Vaisala humidity/temperature probe was inserted into the
cavity sampling the humidity of the air in equilibrium with the concrete. The IRH
of the concrete was initially recorded in ambient conditions and subsequently
measured as the samples were being conditioned in 100% relative humidity
chambers. Concrete permeability was also tested by density, absorption, and
porosity measurements following ASTM C 642 standard procedures [25].
Figure 2.2 Schematic of ISL concrete samples. (dimensions in cm)

23
Other concrete core samples were conditioned in 100% relative humidity
and used to measure the pH of pore water solution using the in-situ leaching
technique (ISL) [26]. Different sample configurations (Figure 2.2) were made
depending on the geometry of the specimens. Acrylic washers and rubber
stoppers were used to seal residue-free equidistant cavities drilled with a 0.125 in
(3.2 mm) masonry drill bit to depths as shown in Figure 2.2. Distilled water was
pippetted into the cavities depending on the size of the cavities and in
consideration for time required for equilibrium between the surrounding pore
water and the cavity water. For the 3.5 in (8.89 cm) and 1.75 in (4.44 cm)
diameter cores, and core fragments with shorter lengths, the amounts of distilled
water used were 0.15 mL, 0.10 mL, and 0.08 mL respectively. If the water in the
cavities dried up, the pH measurements were repeated by introducing new
distilled water into the cavities. Measurements were made with a micro-pH
electrode calibrated with certified pH buffer solutions.

24
3 Field Investigation Results
3.1 Hathaway Bridge
A detailed review of the survey results is included in Appendix I Table
A1a. Cylinder piles, all 54-in diameter, were typically configured four to a bent
and located in the approach spans. As a naming convention for this thesis, the
bents were numbered from the west and the piles were numbered from the
south. Throughout this thesis individual piles are named as in the following
example: H-8-2 for Hathaway Bridge bent 8, pile 2. Center span piers4 numbered
15 to 28 were comprised of square piles and will not be considered here. A total
of 76 piles were examined. Unpublished data from field activities conducted for
the Hathaway Bridge used in this thesis was collected by Lan Yao for USF in
2002.
3.1.1 Concrete Observations
The majority of the piles showed no visual signs of corrosion distress.
Seven piles had rust stains typically 1 ft (0.30 m) below pile cap in the
atmospheric exposure zone where severe chloride-induced corrosion is less
4 Numerical labels of center span piers are continuous with approach span bents as convention for report.

25
common. These stains were likely a result from steel exposed due to mechanical
damage from pile driving. Three piles had rust stains at intermediate elevations,
and only four piles showed rust stains at low elevations (splash zone). Few
cracks were noted.
Coring in this bridge was conducted in one pile each from bents 8 and 29.
Pile H-8-2 was one of those exhibiting rust stains in the tidal/splash zone as well
as some concrete delamination. Six cores were extracted in pairs at elevations
below high tide, within splash zone, and at atmospheric exposure zone. The
core samples were labeled H-8-2-1 through H-8-2-6. Pile 3 of bent 29 (H-29-3)
had a hairline crack ~0.013 in (0.3 mm) thick, but no rust was observed. Four
cores were extracted in pairs from the splash zone and at atmospheric exposure
zone, labeled H-29-3-1 to H-29-3
3.1.2 Steel Condition Observations
The coring of the piles sampled exposed steel that was cut and removed
with the core or steel that showed at the bottom of the core hole where the core
broke off. Most of the exposed steel was 0.25 in (6.3 mm) diameter spiral hoop
reinforcement. Post tensioning strand was exposed at the bottom of two of the
cores. One of those cores, H29-3-3 clearly showed grout and the trace of the
26
duct opening around the strand. A spacing rebar 0.25 in (~ 1.27 cm) diameter
was cut in one core.
Visual condition of the exposed steel and clear concrete cover values are
detailed in Appendix III, Table A3. For this and the other older bridges, the
exposed steel in most instances could be broken cleanly from the surrounding
concrete and had a dull to lustrous gray mill scale appearance, with no
discernable rust. This no-corrosion condition, exemplified in Figure A4, is
denoted by NC in the following. In a few instances the exposed hoop steel or
spacing bar showed faint rust-colored discoloration on part of the exposed
surface, as illustrated in Figure A5. Also in a few cases the exposed strand
showed similar minor discoloration together sometimes with tiny rusty dots or
stringers on the matching strand imprint on the surrounding grout (Figure 3.3).
No cross sectional steel loss of any significance was observed associated with
these cases, and it was not clear whether the discoloration represented corrosion
that took place in service, or prior to casting. These light corrosion situations are
denoted by LC in the following.
All steel exposed by coring in this bridge fell under the NC or LC
categories. Despite the presence of an external rust stain on the concrete in the
pile cored in Bent 8, both the steel reinforcement and strand exposed there had
an NC visual appearance. In the Bent 29 pile the core revealing a strand and a

27
spacing rebar was drilled centered on a vertical hairline crack, and both steel
surfaces had an LC rating. However, as shown later there was no evidence of
significant enhanced chloride penetration from analysis of that core.
The cumulative distributions of clear cover values for this and the other
bridges investigated are shown in Figure A2, and the results are summarized in
Table A2. The average cover value for spiral reinforcement in the cores from this
bridge was 1.20 in (3.1 cm). While this value represents measurements from
only two columns in the bridge, it is close to the 1.5 in (3.8 cm) cover value
inferred from the construction drawings for this bridge archived in the FDOT
District 3 Structures Office. There the cover to the strand duct opening is listed
as 1.75 in (4.4 cm); subtracting the 0.25 in thickness of the hoop wire assumed to
be place immediately next to the opening yields 1.5 in.
As expected, there was electrical continuity between spiral hoop
reinforcement exposed at the perimeter or bottom of different core holes of the
same pile. The one spacing rebar exposed was also continuous with the spiral
wire. The two exposed strands were found to be not continuous to the other steel
in the same pile, which is consistent with the construction method of Raymond
piles where the strand is placed and grouted afterwards.

28
3.1.3 Field Measurements of Steel Potential and Concrete Moisture
Half-cell potentials as a function of elevation are listed in Appendix III
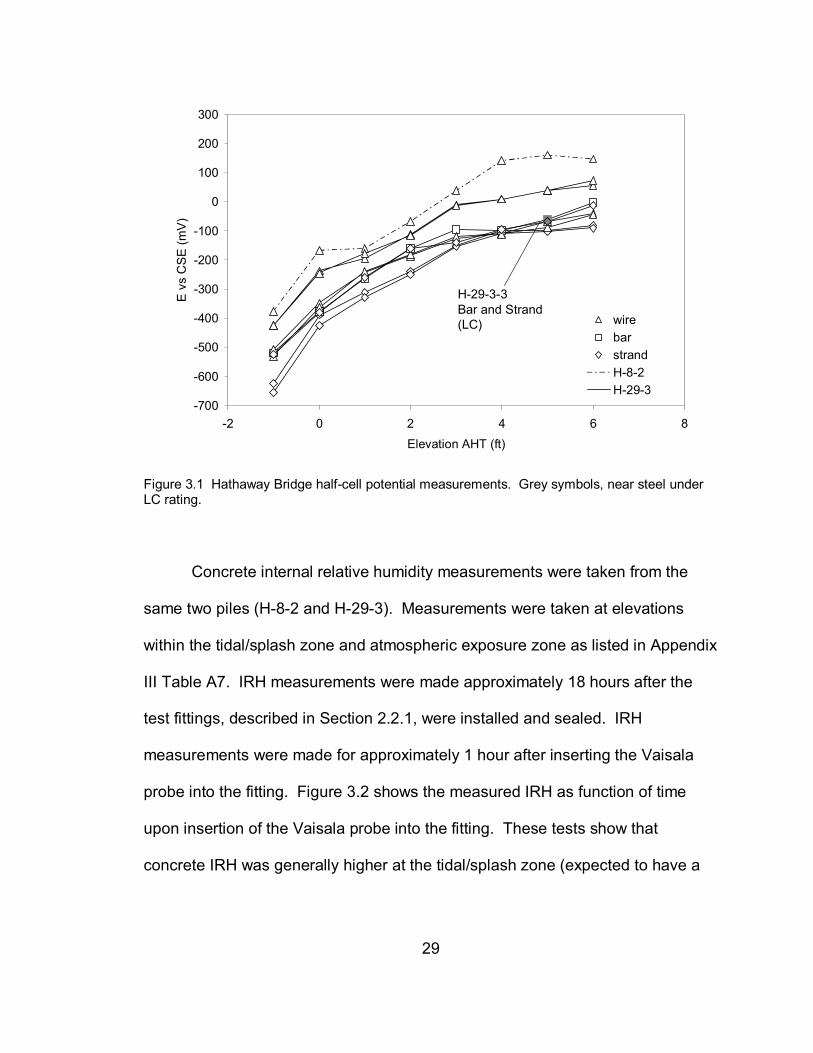
Table A5 and a summary is shown in Figure 3.1. Potential levels of -200 mV and
-350 mV vs. CSE are traditionally associated with indications of unlikely and
likely ongoing corrosion, respectively, in atmospherically exposed concrete [27].
While the potential readings more negative than -350 mV CSE in Figure 3.1 are
not a reliable indicator of corrosion in progress in wet concrete [28], values more
positive than -200 mV CSE as seen at elevations above 1 to 3 ft (0.3 to 0.9 m)
strongly suggest that the steel above those elevations was in the passive
condition at the time of the measurements. The potential of the spacing rebar
with surface rated as LC in the core drilled on a crack 5 ft (1.52 m) AHT in H-29-3
was -96 mV vs. CSE at that elevation, suggesting that active corrosion was not in
progress there when tested.
29
-700
-600
-500
-400
-300
-200
-100
0
100
200
300
-2 0 2 4 6 8Elevation AHT (ft)
E v
s C
SE
(mV
)
wirebarstrandH-8-2H-29-3
H-29-3-3Bar and Strand (LC)
Figure 3.1 Hathaway Bridge half-cell potential measurements. Grey symbols, near steel under LC rating.
Concrete internal relative humidity measurements were taken from the
same two piles (H-8-2 and H-29-3). Measurements were taken at elevations
within the tidal/splash zone and atmospheric exposure zone as listed in Appendix
III Table A7. IRH measurements were made approximately 18 hours after the
test fittings, described in Section 2.2.1, were installed and sealed. IRH
measurements were made for approximately 1 hour after inserting the Vaisala
probe into the fitting. Figure 3.2 shows the measured IRH as function of time
upon insertion of the Vaisala probe into the fitting. These tests show that
concrete IRH was generally higher at the tidal/splash zone (expected to have a
30
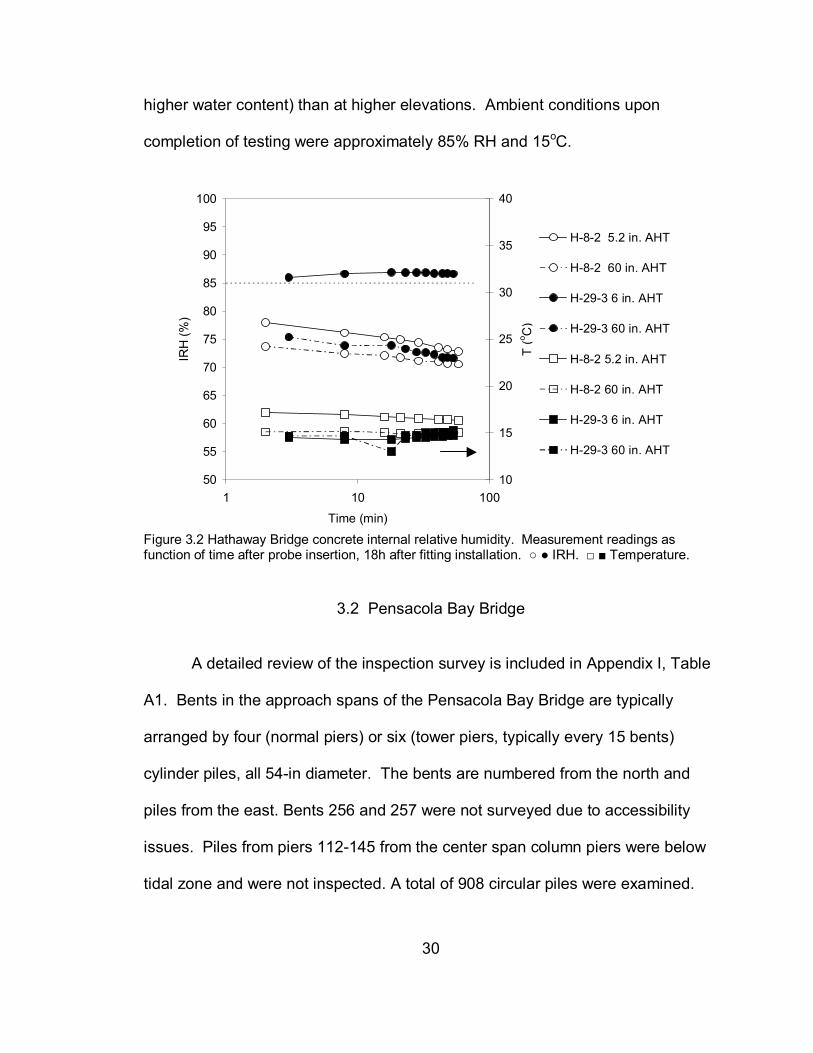
higher water content) than at higher elevations. Ambient conditions upon
completion of testing were approximately 85% RH and 15oC.
50
55
60
65
70
75
80
85
90
95
100
1 10 100
Time (min)
IRH
(%)
10
15
20
25
30
35
40
T (o C
)
H-8-2 5.2 in. AHT
H-8-2 60 in. AHT
H-29-3 6 in. AHT
H-29-3 60 in. AHT
H-8-2 5.2 in. AHT
H-8-2 60 in. AHT
H-29-3 6 in. AHT
H-29-3 60 in. AHT
Figure 3.2 Hathaway Bridge concrete internal relative humidity. Measurement readings as function of time after probe insertion, 18h after fitting installation. IRH. Temperature.
3.2 Pensacola Bay Bridge
A detailed review of the inspection survey is included in Appendix I, Table
A1. Bents in the approach spans of the Pensacola Bay Bridge are typically
arranged by four (normal piers) or six (tower piers, typically every 15 bents)
cylinder piles, all 54-in diameter. The bents are numbered from the north and
piles from the east. Bents 256 and 257 were not surveyed due to accessibility
issues. Piles from piers 112-145 from the center span column piers were below
tidal zone and were not inspected. A total of 908 circular piles were examined.

31
3.2.1 Concrete Observations
A cumulative count of deterioration features is shown in Figure A3 in
Appendix II. The most commonly observed features, seen on approximately
25% of the piles examined, were rust stains typically one per affected pile and
only a few square in (1 in2 ~ 6.3 cm2) in size. The stains were larger, of the type
shown in Figure A1, in only 15 of the 908 piles examined. Repair patches were
the next most common feature, often located just below the pile cap and
occasionally at intermediate elevations approximately 1 to 3 ft (0.3 to 0.9 m)
AHT. Nearly all of the patches were in the south approach spans, and
approximately 40% of the observed rust stains in the south approach spans were
on preexisting repair patches. As shown in Figure A3, rust stains not on repair
patches were nearly evenly distributed along the bridge.
Concrete spalls already in place and associated with rust stains were
observed only on six piles, each deteriorated area on separate piles. Those
spalls were all small and in four instances (not further examined) only of
thumbnail size and very shallow. As shown below, later hammer sounding
revealed delaminations and created new spalls at nine other rust stain areas
from eight other piles. Thin vertical cracks were occasionally observed but nearly
always not together with any corrosion damage. The cumulative deterioration
counts in Figure A3 (b) were roughly evenly distributed along the bridge.

32
Sixteen piles (fourteen among those that exhibited sizable rust stains and
two with thin cracks approximately 0.013 in (0.3 mm) in width but no rust stains,
Appendix I, Table A1b) were selected for closer inspection. Twelve of those
piles, with severe rust stains not associated with repair patches or preexisting
spalls, were hammer sounded to detect delamination. In four of the twelve the
concrete was found to be sound despite signs of external rust staining.
Delaminations were detected in the remaining eight and hammering continued to
remove the affected cover concrete. The delaminated areas were not very large,
ranging in size from approximately 4 in2 to 81 in2 (26 cm2 – 523 cm2), and the
depth of the newly created spalls was typically only 0.5 in (10 mm) with no steel
directly exposed. Coring was performed on the center of the spall in pile P-185-2
and on the center of the top spall in pile P-185-4, revealing in both cases clearly
corroded spiral wire immediately below the bottom of the spall. The sixteen piles
included also the two piles with significant preexisting spall cases, which showed
no directly exposed steel. Coring was performed on the center of one of those
spalls (P-110-2-2), revealing steel approximately 0.25 in (6 mm) with an LC
surface appearance below. Hammer sounding of the piles with longitudinal
cracks (P-4-1 and P-213-4) revealed no delamination, and coring on the cracks
showed steel with no visual signs of corrosion.

33
3.2.2 Steel Condition Observations
Spiral reinforcement steel exposed by coring at most locations in this
bridge was rated NC, and the surface of the spiral steel on the core drilled
through the delamination/spall at 14 in (0.36 m) AHT on P-110-2-2 was only
rated LC. However, the cores on spalled or delaminated areas in piles P-149-2,
P-185-4 drilled 26 and 32 in (0.66 and 0.81 m respectively ) AHT respectively
revealed steel with localized but appreciable corrosion loss of metal. The
damage is illustrated in Figure A6 (representative of both cases), showing that as
much as 25% of the wire cross section was lost near one end of the wire
segment cut out by the core. With the exception of damage near the pile caps
noted earlier, these two cases were the only direct observations of severe
corrosion in all the field inspections and are denoted by SC in the following. All
spacing bars exposed in this bridge, including one next to the SC steel in P-185-
4 were rated NC.
Pressurized grout post-tensioned strands have been identified in four core
locations (Table A3). The strands exposed from P4-1-4 and P110-2-2 were rated
LC (Figure 3.3), and the other two (237-1-2, and 252-1-1) were rated NC.
Surrounding grout was clearly visible in all cases strand was exposed. The grout
around the NC strand from cores P237-1-2 and P252-1-1 appeared to have
partial (< 0.40 in (10 mm)) voids suggesting partial consolidation (Figure 3.4). No

34
evidence of corrosion was found associated with these voids, but good grout
consolidation is an important quality control issue for future construction.
Figure 3.3 Observation of surface rusting on strand, Pensacola Bay Bridge. Faint rust on strand. Traces of rust on grout imprint, indicated by the arrows, shown in the right of the figure. a) P4-1-4. b) P-110-2-2.
a)
b)

35
a) b) Figure 3.4 Pressurized grout consolidation, Pensacola Bay Bridge. Voids indicated by the arrows. a) P237-1-2. b) P252-1-1 (triangular region).
There were signs of other steel (possible spacing rebar) exposed at the
bottom of the core hole at three other coring locations, but residual concrete
there prevented detailed observation other than noting absence of any signs of
rust.
The distribution of measured clear cover of spiral hoop steel is shown in
Figure A2, Appendix II. As shown in Table A2 the average concrete clear cover
to hoop reinforcement was thin — 2.33 cm which is ~ 20% lower than in the other
older cylinder pile bridges investigated. All spiral wire observed was ¼ in (0.64
cm) diameter. Clear cover over strand ranged from 1.85 to 2.5 in (4.7 to 6.4 cm).
Exposed spiral reinforcement was found to be electrically continuous to
each other. Strand was found not to be continuous with the spiral wire.

36
3.2.3 Field Measurements of Steel Potential and Concrete Moisture
Half-cell potential measurements were made for exposed steel
reinforcement in eight of the piles. Results are shown in Figure 3.5 and are listed
in Table A5. Four locations having LC and SC ratings are indicated by black
symbols in the figure below: P110-2, P110-2-2, P149-2, and P185-4. Duplicate
measurements are shown where available. Notably, those corrosion locations
had potentials more negative than -200 mV. While most reinforcement in
delaminated or previously spalled concrete showed highly negative potentials
suggestive of ongoing active corrosion, half-cell potential in the
delaminated/spalled concrete of P252-1 located approximately 3 ft (1 m) AHT,
was only -150 mV vs. CSE. This may indicate that the spall/delamination there
was not caused by corrosion of the spiral wire/bar or that the spiral wire/bar
located 3 ft (1 m) AHT is not continuous with the reinforcements located 1 ft (0.3
m) AHT. However as mentioned above, limited electrical continuity checks from
other piles showed that spiral wires severed by coring were electrically
continuous to one another.

37
Figure 3.5 Pensacola Bay Bridge half cell potential measurements. Solid symbols, near corroded reinforcement. Grey symbols, near rust stained/delaminated concrete. Open symbols, no observed distress.
Concrete internal relative humidity measurements were made for P-110-2
at 14 in (35.6 cm) and 5 ft (1.5 m) AHT. IRH measurements were made starting
approximately 22 hours after the fittings had been installed, and monitored for
approximately 1 hour. Consistent with measurements from the Hathaway Bridge,
the IRH is higher within the splash zone than that measured in the atmospheric
exposure zone. This is likely due to the higher degree of water saturation near
the surface of the tidal zone. Ambient conditions were approximately 65% RH
and 18oC.
-700
-600
-500
-400
-300
-200
-100
0
100
-2 0 2 4 6 8Elevation AHT (ft)
E vs
CS
E (m
V)
wire
bar
strandP219-4
P149-2
P110-2
P110-2-2
P252-2
P185-4

38
40
45
50
55
60
65
70
75
80
1 10 100Time (min)
IRH
(%)
0
5
10
15
20
25
30
35
40
T (o C
)
P-110-2 14" AHTP-110-2 5' AHTP-110-2 14" AHTP-110-2 5' AHT
Figure 3.6 Pensacola Bay Bridge concrete internal relative humidity as function of time since probe insertion, 22 hrs after test fitting installation. IRH. Temperature. Horizontal line represents ambient humidity.
3.3 Brooks Bridge
The Brooks Bridge approach spans have 36-in (91 cm) diameter cylinder
piles with a ten pile bent configuration. The bents are labeled numerically from
the south and the piles are labeled from the west. Bents 2 and 10-13 were
constructed on shore and were not examined. End bents 1 and 14 at the face of
the back wall as well as piers 5 – 8 were not examined. View of bent 9 was
limited to the southern face due to boat accessibility. It should be noted that pile
bents 3 and 9 were in shallow water. A total of 30 circular piles were examined.

39
3.3.1 Concrete Observations
Superficial rust staining was observed on Br-3-4 and Br-3-8. Shallow
concrete spalling (with no reinforcement exposed) was noticed on two piles in
bent 9, consistent with recent FDOT bridge inspection reports. Thin longitudinal
cracks were common on many of the piles. Upon closer inspection of Br-3-2, two
parallel longitudinal cracks approximately 10 in (25.4 cm) apart from one another
were documented. The width of both cracks was approximately 0.008 in (0.2
mm).
3.3.2 Steel Condition Observations
Upon coring, an LC condition was observed on the spiral wire and spacing
rebar in Br-3-2-5, located 6 in (15.2 cm) AHT. An NC condition was observed on
a spiral wire in Br-3-2-6, located 6 in (15.2 cm) AHT. As shown in Table A2, the
concrete clear cover to hoop reinforcement there was approximately 1 – 1.25 in
(2.5 – 3.2 cm), comparable to that noted for the Hathaway bridge and consistent
with the design drawings for that bridge. The cover for the bar in Br-3-2-5 was
1.5 in (3.8 cm). Strand was not exposed in any of the corings of this bridge. All
spiral wire was 0.25 in (0.64 cm) diameter. Direct continuity measurements were
not measured

40
3.3.3 Field Measurements of Steel Potential and Concrete Moisture
Half-cell potential measurements were made at elevations from high tide
to 4 ft (1.2 m) AHT as well as below the waterline on piles Br-3-2-5 and Br-3-2-6.
Potential measurements were taken for reinforcements exposed by coring from a
crack line and the companion core hole 6 in (15.2 cm) horizontally apart on
center. Potential mapping of the LC-rated wire and rebar in Br-3-2-5 showed
highly negative values characteristic of corrosion activity. Continuity
measurements are not available for this spot, but the reinforcements from the
cracked concrete location had close potential values indicative of electrical
continuity between hoop reinforcements and spacing rebar.
-800
-700
-600
-500
-400
-300
-200
-100
0
100
-2 -1 0 1 2 3 4 5
Elevation AHT (ft)
E v
s C
SE
(mV
)
wirebarBr-3-2-5Br-3-2-6
Figure 3.7 Brooks Bridge half-cell potential measurements as function of elevation.

41
3.4 St. George Island Bridge
The SGI Bridge was newly constructed (2003) at the time of the survey.
Approach span bents contain each three 54-in (1.3 m) diameter piles. The bents
are numbered from the south direction to the north direction, and the piles are
identified by position and location in the pile bent: (E) east pile, (C) center pile,
(W) west pile, (TP) test pile, and (N) north pile face, (S) south pile face. Not only
is the bridge significantly newer than the other bridges in this study, but the
cylinder piles in the bridge reflect current FDOT design specifications including
design clear cover on the spiral reinforcement 3 in (7.6 cm) instead of 0.75-1.5 in
(1.9-4.4 cm) in the older bridges examined. Also, the concrete mixture
proportions included approximately 22% fly ash cement replacement and 8%
microsilica cement replacement and a total cementitious content of ~840 pcy
(~500 kg/m3) for segments above tide level.
A limited survey of fifteen piles was conducted, twelve of which were being
evaluated by FDOT operators for a construction-related assessment independent
of the present investigation. Those twelve piles had superficial rust staining or
fine longitudinal cracks and only visual appearance is reported here. The
remaining three piles, among those earliest erected during construction, were
investigated by coring as well. Piles 162-W-S and 163-W-S were selected for
closer inspection due to the presence and condition of thin longitudinal cracks
measuring less than 0.002 in (0.051 mm) in width. Those piles were driven July
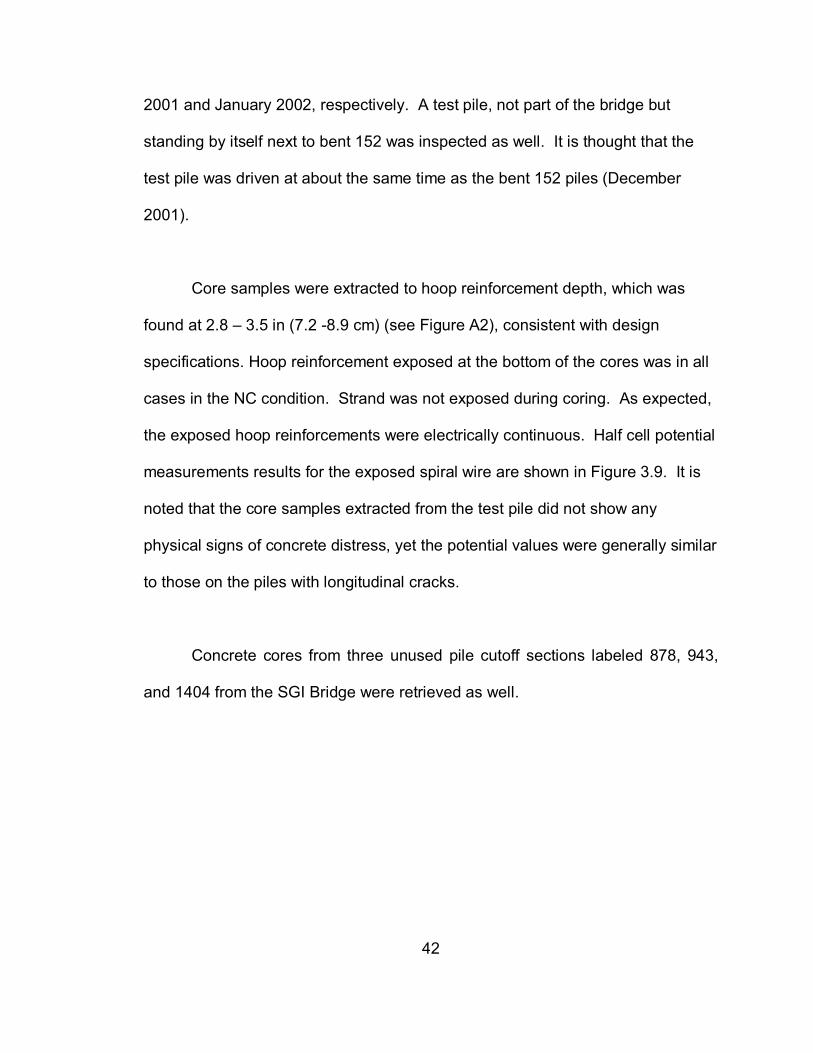
42
2001 and January 2002, respectively. A test pile, not part of the bridge but
standing by itself next to bent 152 was inspected as well. It is thought that the
test pile was driven at about the same time as the bent 152 piles (December
2001).
Core samples were extracted to hoop reinforcement depth, which was
found at 2.8 – 3.5 in (7.2 -8.9 cm) (see Figure A2), consistent with design
specifications. Hoop reinforcement exposed at the bottom of the cores was in all
cases in the NC condition. Strand was not exposed during coring. As expected,
the exposed hoop reinforcements were electrically continuous. Half cell potential
measurements results for the exposed spiral wire are shown in Figure 3.9. It is
noted that the core samples extracted from the test pile did not show any
physical signs of concrete distress, yet the potential values were generally similar
to those on the piles with longitudinal cracks.
Concrete cores from three unused pile cutoff sections labeled 878, 943,
and 1404 from the SGI Bridge were retrieved as well.

43
-600
-500
-400
-300
-200
-100
0
-2 -1 0 1 2 3 4 5 6Elevation AHT (ft)
E v
s C
SE
(mV
)
wire152-TP-N162-W-S163-W-S
Figure 3.8 St. George Island Bridge half-cell potential measurements.

44
4 Laboratory Experiment Findings
4.1 Electrical Resistivity
Resistivity measurements were performed in field-extracted cores to
determine the ionic permeability of the concrete. Initial resistivity measurements
for cores from the Hathaway Bridge, Pensacola Bay Bridge and SGI cutoffs were
contributed by Lan Yao. The tests involved simultaneous determination of
moisture pickup (by mass gain) which was informative of the permeation
properties of the concrete as well. Recall that internal relative humidity in the
piles was typically in the order of only approximately 70%. As shown in figures
4.1, 4.4, 4.7, 4.9, and 4.13 mass gain of most specimens tested in the 100% RH
chambers began to show signs of stabilization (to a small value, approximately
1% of original specimen mass) after approximately 100 days of exposure, which
was the normal test period. However, a few concrete cores that were exposed
for extended periods showed additional mass gain in measurements made
approximately 1 year later (figures 4.1, 4.4, and 4.13). The effect probably results
from more accessible pores being saturated early, while the less accessible
pores become eventually saturated at longer exposure times [29]. The modest
and slow water pickup observed is a reflection of the generally high quality of the
concretes evaluated.

45
Resistivity measurements were successfully conducted per the specified
procedures in most cases. However, it should be noted that the cores from the
Hathaway Bridge and the Pensacola Bay Bridge contained fragmented edges, so
geometric corrections [24] were only approximate. Also, several cores extracted
from the Hathaway Bridge and Pensacola Bay Bridge had lengths less than 1.5
in (3.81 cm) so the effect of non-uniformities in the aggregate and cement
distribution would become more notable with consequent variability in the results.
Data from cores shorter and longer than 1.5 in (3.81 cm) are noted in figures 4.2,
4.3, 4.5, and 4.6 which show some differentiation between the results of each
class, although the overall trends are essentially the same. It is noted also that
since moisture pickup takes place from the specimen surface inwards, the
measured resistivity of specimens that are not terminally equilibrated is only an
approximate spatial average of outer and inner regions of the specimen.

46
0.1
1
10
1 10 100 1000Time (days)
Mas
s (∆
%)
Figure 4.1 Hathaway Bridge core mass change as function of exposure time to 100% RH.
10
100
1000
1 10 100 1000Time (days)
ρ w
et (k
Ω-c
m)
Figure 4.2 Hathaway Bridge core resistivity measurements as function of exposure time to 100%RH. Cores > 1.75 inch (4.45 cm). ∆ Cores < 1.5 inch (3.81 cm).

47
1
10
100
1000
0 0.5 1 1.5 2
Mass (∆%)
ρ wet (k
Ω-c
m)
Figure 4.3 Hathaway Bridge core apparent wet resistivity as function of mass increase due to water absorption. Cores > 1.75 inch (4.45 cm). ∆ Cores < 1.5 inch (3.81 cm).
Hathaway Bridge specimens developed wet resistivity in the order of 100
– 200 kΩ-cm after 70 days and 60 – 100 kΩ-cm after extended exposure of 635
days. Those are high values, characteristic of highly impermeable concrete.
Water mass pickup and resistivity varied in inverse proportion as exposure time
increased (figure 4.1 and 4.2), as expected. The moisture mass gain was only
1% after 600 days of conditioning in 100% RH which is also indicative of low pore
connectivity.

48
0.1
1
10
1 10 100 1000Time (days)
Mas
s ( ∆
% )
Figure 4.4 Pensacola Bay Bridge core mass change as function to exposure time to 100% RH.
10
100
1000
1 10 100 1000Time (days)
ρ w
et (
k Ω
-cm
)
Figure 4.5 Pensacola Bay Bridge core wet resistivity measurements as function to exposure time to 100% RH. ♦ Cores > 1.75 inch (4.45 cm). ◊ Cores < 1.5 inch (3.81 cm).
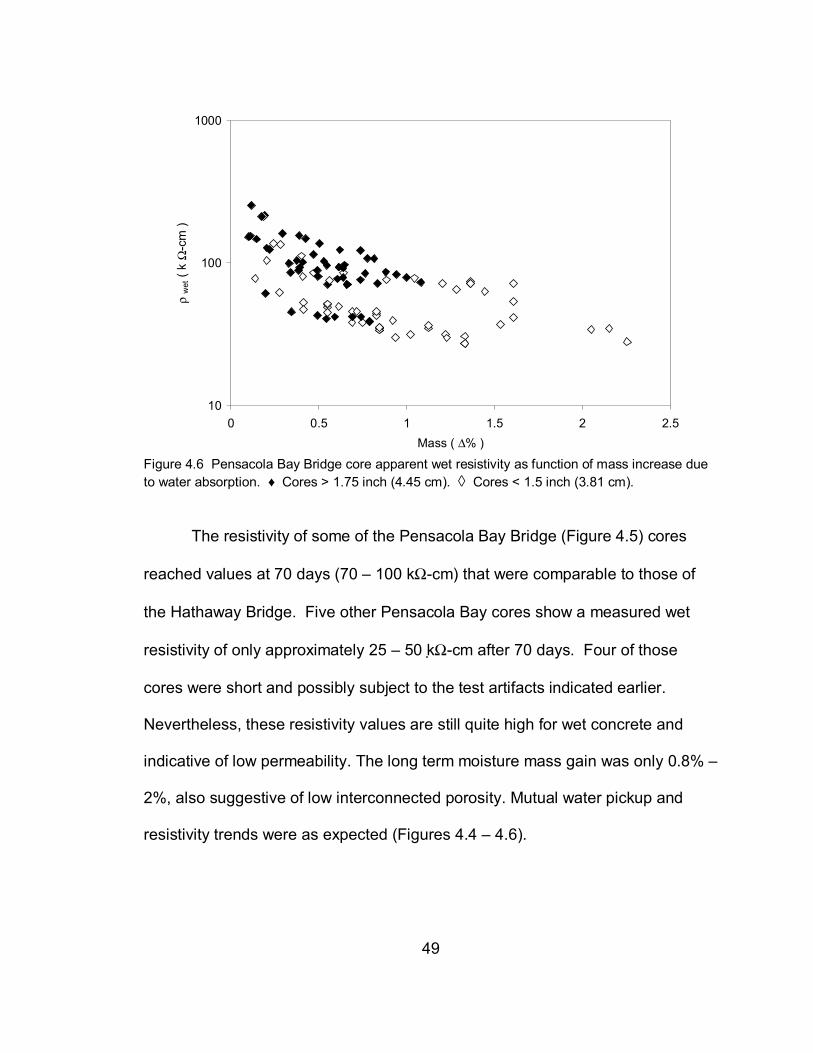
49
10
100
1000
0 0.5 1 1.5 2 2.5Mass ( ∆% )
ρ w
et (
k Ω
-cm
)
Figure 4.6 Pensacola Bay Bridge core apparent wet resistivity as function of mass increase due to water absorption. ♦ Cores > 1.75 inch (4.45 cm). ◊ Cores < 1.5 inch (3.81 cm).
The resistivity of some of the Pensacola Bay Bridge (Figure 4.5) cores
reached values at 70 days (70 – 100 kΩ-cm) that were comparable to those of
the Hathaway Bridge. Five other Pensacola Bay cores show a measured wet
resistivity of only approximately 25 – 50 kΩ-cm after 70 days. Four of those
cores were short and possibly subject to the test artifacts indicated earlier.
Nevertheless, these resistivity values are still quite high for wet concrete and
indicative of low permeability. The long term moisture mass gain was only 0.8% –
2%, also suggestive of low interconnected porosity. Mutual water pickup and
resistivity trends were as expected (Figures 4.4 – 4.6).

50
The SGI Bridge cores from the two in-service piles evaluated showed the
highest long term resistivity levels of the bridges in the study (approximately 50 to
200 kΩ-cm) and low mass gain (Figures 4.7- 4.11); the as received resistivity
values of concrete cores extracted from the SGI Bridge is shown in Figure 4.12.
High resistivity is expected from the concrete formulation that included
pozzolanic additions intended to further reduce permeability. It is noted that
resistivity tended to be higher in specimens for Pile 162 than in those of Pile 163.
As it will be shown later the apparent chloride diffusivities for concrete cores from
pile 162 were significantly lower than for those from Pile 163, which is as
expected as wet resistivity and ion diffusivity are opposite indicators of concrete
permeability [30]. Moisture-resistivity trends were as expected and seen for the
other bridges (Figure 4.11).
For both piles the resistivity of the core drilled on a crack was noticeably
smaller than that of the core on sound concrete (Figure 4.8, Figure 4.10). This
behavior indicates enhanced ionic transport through the crack region. It should
be noticed that similar enhanced transport may be present in cracks in cores
from the other bridges.
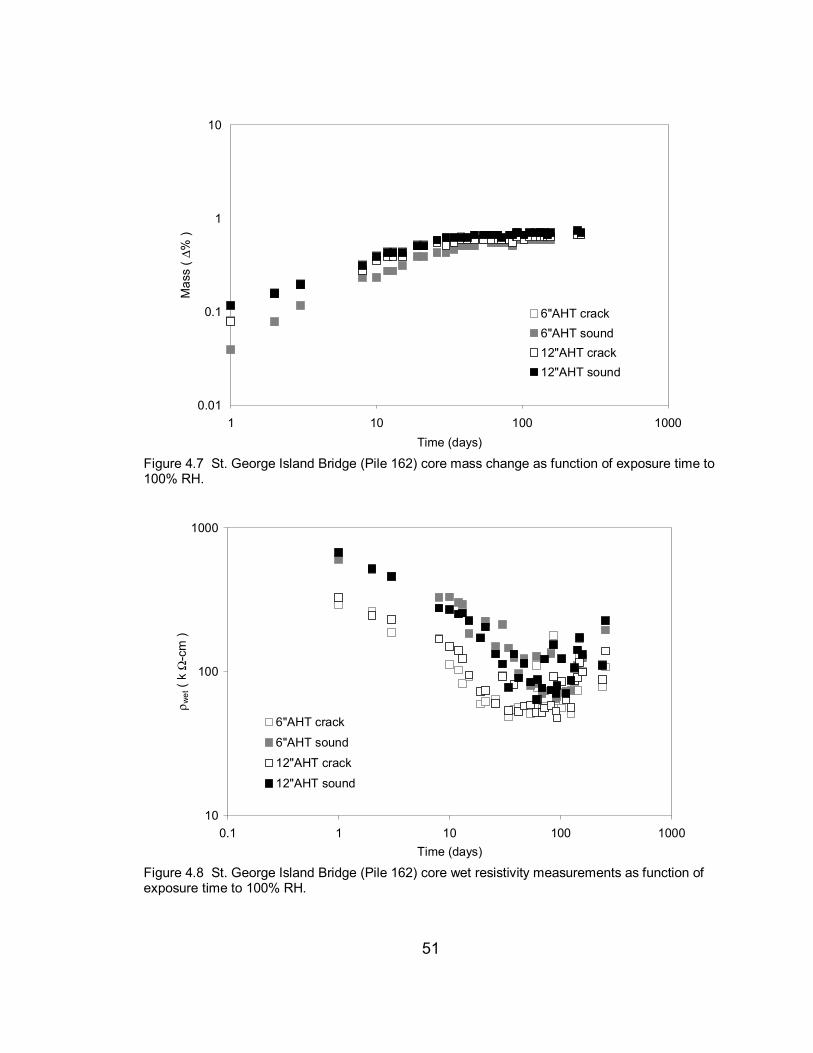
51
0.01
0.1
1
10
1 10 100 1000Time (days)
Mas
s ( ∆
% )
6"AHT crack6"AHT sound12"AHT crack12"AHT sound
Figure 4.7 St. George Island Bridge (Pile 162) core mass change as function of exposure time to 100% RH.
10
100
1000
0.1 1 10 100 1000Time (days)
ρ wet (
k Ω
-cm
)
6"AHT crack6"AHT sound12"AHT crack12"AHT sound
Figure 4.8 St. George Island Bridge (Pile 162) core wet resistivity measurements as function of exposure time to 100% RH.

52
0.01
0.1
1
10
1 10 100 1000Time (days)
Mas
s ( ∆
% )
6"AHT crack6"AHT sound12"AHT crack12"AHT sound
Figure 4.9 St. George Island Bridge (Pile 163) core mass change as function of exposure time to 100% RH.
10
100
1000
0.1 1 10 100 1000Time (days)
ρ wet (
k Ω
-cm
)
6"AHT crack6"AHT sound12"AHT crack12"AHT sound
Figure 4.10 St.George Island Bridge (Pile 163) core wet resistivity measurements as function of exposure time to 100% RH.

53
10
100
1000
0 0.1 0.2 0.3 0.4 0.5 0.6 0.7 0.8Mass (∆%)
ρ w
et (
k Ω-c
m )
162WS 6" AHT crack162WS 6" AHT sound162WS 12" AHT crack16WS2 12" AHT sound163WS 6" AHT crack163WS 6" AHT sound163WS 12" AHT crack163WS 12" AHT sound
Figure 4.11 St. George Island Bridge core apparent wet resistivity as function of mass increase due to water absorption.
0
100
200
300
400
500
600
700
800
Sound6" AHT
Crack Sound12" AHT
Crack
ρ (k
Ω-c
m)
152 TP N162 W S163 W S
Figure 4.12 St. George Island concrete resistivity measurements on as-extracted cores.

54
The concrete samples from the SGI Bridge cutoff sections not in service
were tested similar to the in-service cores. Three sets of concrete samples were
monitored: 878, 943, and 1404. The designations were labels for concrete mixes
used in construction of the SGI Bridge. Concrete sample 878 included river rock
coarse aggregate. Concrete samples 943 and 1404 had as coarse aggregate
primarily limestone, but with some river rock. The core samples extracted from
the pile cutoffs were cut into two specimens; one (avg. length 4.8 cm) consisted
of all cut edges and the other (avg. length 1.9 cm) retained the original outer
surface of the core. The original outer surface may contain a surface layer in
which water absorption [29] and ionic diffusion may be slower.
Upon testing, the uncut original concrete surface did not appear to have
affected significantly water absorption or wet resistivity, but it should be noted
that the perimeter and opposite face of the specimen were cut surfaces. Similar
to other bridge core samples conditioned in high humidity, water absorption
appears to continue upon extended exposure. Resistivity values were high,
consistent with the expected high concrete quality, but as seen in figures 4.13
and 4.14 the 878 mix with river rock had not as high wet resistivity (~ 100 kΩ-cm)
as the 943 and 1404 mixes (~ 200 kΩ-cm). The 878 mix also showed faster
water absorption that compared to the other mixes.

55
0.01
0.1
1
10
1 10 100 1000Time (days)
Mas
s ( ∆
%)
original surface
cut surface
878
943
1404
Figure 4.13 St. George Island Bridge pile cutoff mass change as function of exposure time to 100%RH.
10
100
1000
1 10 100Time (days)
Res
isiti
vity
(kΩ
-cm
)
original surfacecut surface8789431404
Figure 4.14 St. George Island Bridge pile cutoff wet resistivity measurements as function of exposure time to 100%RH.
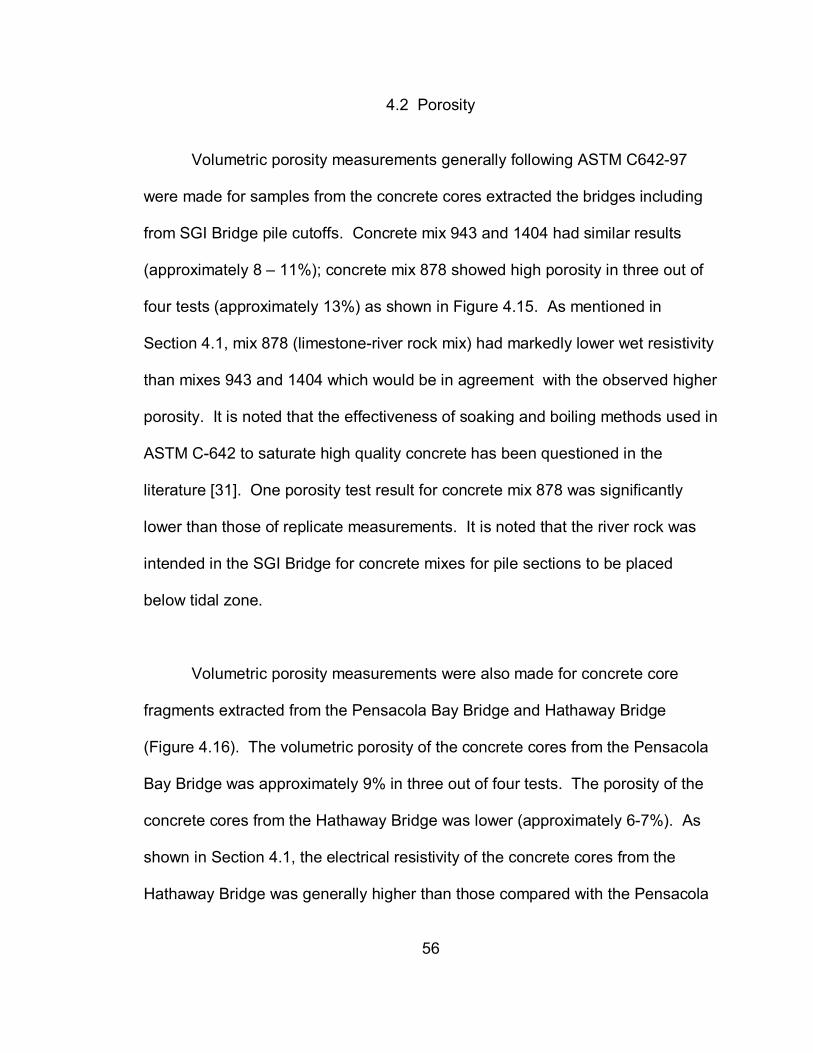
56
4.2 Porosity
Volumetric porosity measurements generally following ASTM C642-97
were made for samples from the concrete cores extracted the bridges including
from SGI Bridge pile cutoffs. Concrete mix 943 and 1404 had similar results
(approximately 8 – 11%); concrete mix 878 showed high porosity in three out of
four tests (approximately 13%) as shown in Figure 4.15. As mentioned in
Section 4.1, mix 878 (limestone-river rock mix) had markedly lower wet resistivity
than mixes 943 and 1404 which would be in agreement with the observed higher
porosity. It is noted that the effectiveness of soaking and boiling methods used in
ASTM C-642 to saturate high quality concrete has been questioned in the
literature [31]. One porosity test result for concrete mix 878 was significantly
lower than those of replicate measurements. It is noted that the river rock was
intended in the SGI Bridge for concrete mixes for pile sections to be placed
below tidal zone.
Volumetric porosity measurements were also made for concrete core
fragments extracted from the Pensacola Bay Bridge and Hathaway Bridge
(Figure 4.16). The volumetric porosity of the concrete cores from the Pensacola
Bay Bridge was approximately 9% in three out of four tests. The porosity of the
concrete cores from the Hathaway Bridge was lower (approximately 6-7%). As
shown in Section 4.1, the electrical resistivity of the concrete cores from the
Hathaway Bridge was generally higher than those compared with the Pensacola
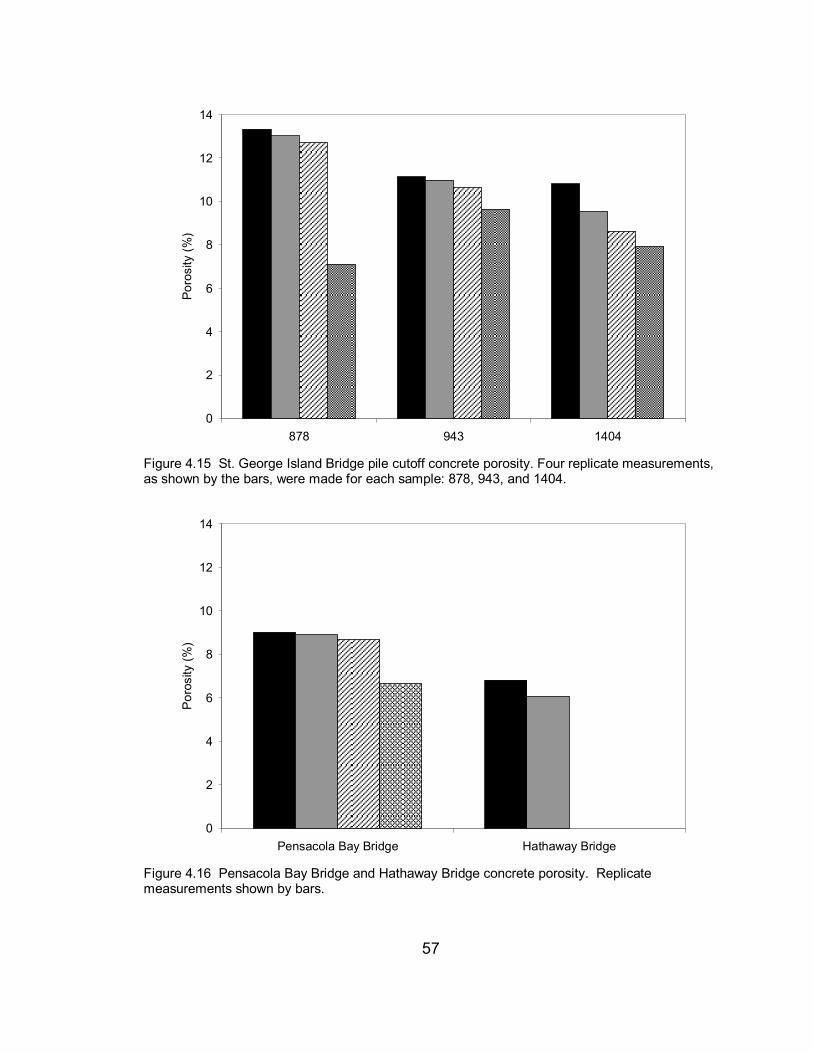
57
0
2
4
6
8
10
12
14
878 943 1404
Poro
sity
(%)
Figure 4.15 St. George Island Bridge pile cutoff concrete porosity. Four replicate measurements, as shown by the bars, were made for each sample: 878, 943, and 1404.
0
2
4
6
8
10
12
14
Pensacola Bay Bridge Hathaway Bridge
Por
osity
(%)
Figure 4.16 Pensacola Bay Bridge and Hathaway Bridge concrete porosity. Replicate measurements shown by bars.
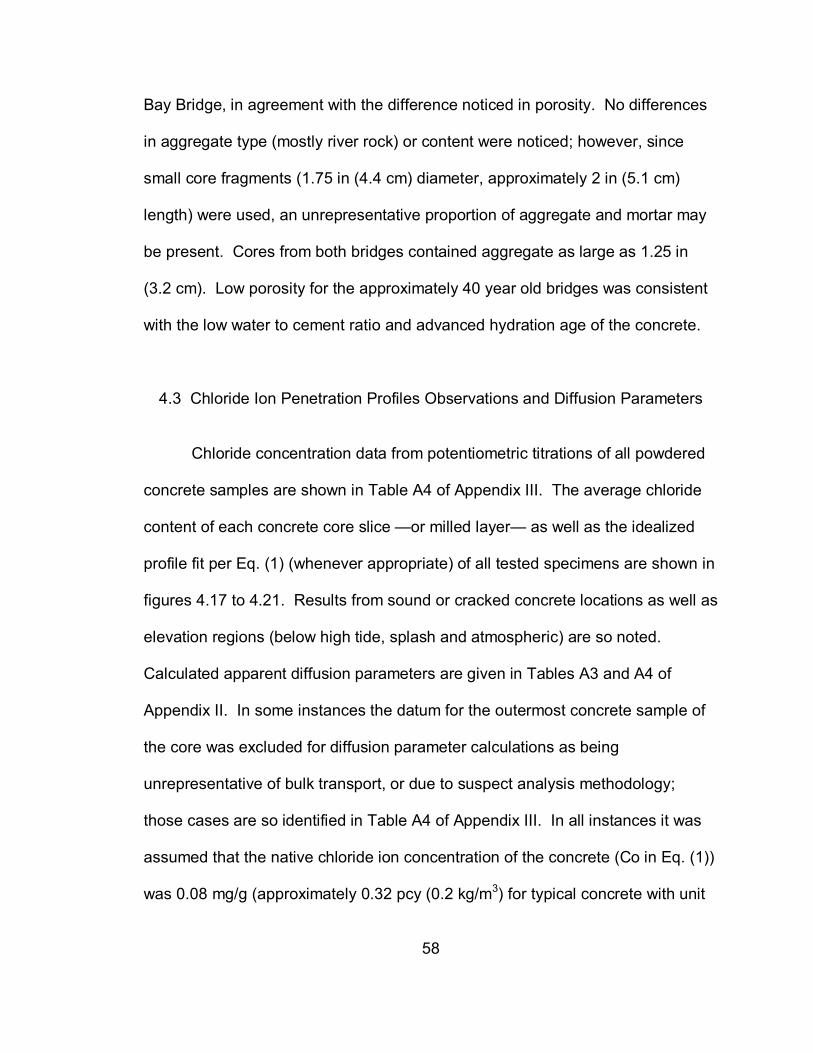
58
Bay Bridge, in agreement with the difference noticed in porosity. No differences
in aggregate type (mostly river rock) or content were noticed; however, since
small core fragments (1.75 in (4.4 cm) diameter, approximately 2 in (5.1 cm)
length) were used, an unrepresentative proportion of aggregate and mortar may
be present. Cores from both bridges contained aggregate as large as 1.25 in
(3.2 cm). Low porosity for the approximately 40 year old bridges was consistent
with the low water to cement ratio and advanced hydration age of the concrete.
4.3 Chloride Ion Penetration Profiles Observations and Diffusion Parameters
Chloride concentration data from potentiometric titrations of all powdered
concrete samples are shown in Table A4 of Appendix III. The average chloride
content of each concrete core slice —or milled layer— as well as the idealized
profile fit per Eq. (1) (whenever appropriate) of all tested specimens are shown in
figures 4.17 to 4.21. Results from sound or cracked concrete locations as well as
elevation regions (below high tide, splash and atmospheric) are so noted.
Calculated apparent diffusion parameters are given in Tables A3 and A4 of
Appendix II. In some instances the datum for the outermost concrete sample of
the core was excluded for diffusion parameter calculations as being
unrepresentative of bulk transport, or due to suspect analysis methodology;
those cases are so identified in Table A4 of Appendix III. In all instances it was
assumed that the native chloride ion concentration of the concrete (Co in Eq. (1))
was 0.08 mg/g (approximately 0.32 pcy (0.2 kg/m3) for typical concrete with unit

59
0
2
4
6
8
10
12
14
0 1 2 3 4 5 6 7 8 9 10
Distance (cm)
C (m
g Cl/g
dry)
H-29-3-2H-29-3-2H-29-3-3H-29-3-3X
0
2
4
6
8
10
12
14
0 1 2 3 4 5 6 7 8 9 10
Distance (cm)
C (m
g Cl/g
dry)
H-8-2-2H-8-2-2H-8-2-3H-8-2-3H-8-2-4H-8-2-4H-8-2-5H-8-2-5
weight of 4,000 pcy (2,400 kg/m3). This value is a rounded off average of values
measured at large depths in the SGI Bridge cores in service as well as from piles
not in service, and it is also in the order of the average of the two lowest
concentration measurements obtained in the Hathaway and Pensacola Bay
bridges where several deep cores were extracted. The value is also in the order
of typical native chloride values commonly observed in other FDOT
investigations of marine substructure. As the cylinder piles are large in diameter
and penetration depths very limited, a one-dimensional flat-wall approximation
was used instead of a cylindrical geometry treatment in the diffusion models.
a) b) Figure 4.17 Hathaway Bridge chloride ion penetration profile. a) H-8-2. b) H-29-3. Below high tide. Splash/ tidal zone. ∆ Atmospheric exposure zone. X Cracked concrete. Lines represent chloride penetration profiles predicted by Eq. 1.

60
0
2
4
6
8
10
12
14
0 1 2 3 4 5 6 7 8 9 10
Distance (cm)
C (m
g Cl/g
dry)
P-4-1-1P-4-1-1P-4-1-2P-4-1-2P-4-1-3P-4-1-3
X
0
2
4
6
8
10
12
14
0 1 2 3 4 5 6 7 8 9 10
Distance (cm)
C (m
g Cl/g
dry)
P-110-2-2P-110-2-2P-110-2-4P-110-2-4
0
2
4
6
8
10
12
14
0 1 2 3 4 5 6 7 8 9 10
Distance (cm)
C (m
g Cl/g
dry)
P-213-4-1P-213-4-1P-213-4-2P-213-4-2X
0
2
4
6
8
10
12
14
16
0 1 2 3 4 5 6 7 8 9 10
Distance (cm)
C (m
g Cl/g
dry)
P-185-4-1P-185-4-1P-185-4-2P-185-4-2
0
2
4
6
8
10
12
14
0 1 2 3 4 5 6 7 8 9 10
Distance (cm)
C (m
g Cl/g
dry)
P-219-4-1P-219-4-1P-237-1-1P-237-1-1P-252-1-2P-252-1-2
a) b)
c) d)
e) Figure 4.18 Pensacola Bay Bridge chloride ion penetration profile. a) P-4-1. b) P-213-4 c) P-110-2 d) P-185-4 e) P-219-4, P-237-1, and P-252-1 ♦ Splash/ tidal zone. ◊ Atmospheric exposure zone. X Cracked concrete. Lines are chloride penetration profiles predicted by Eq. 1.
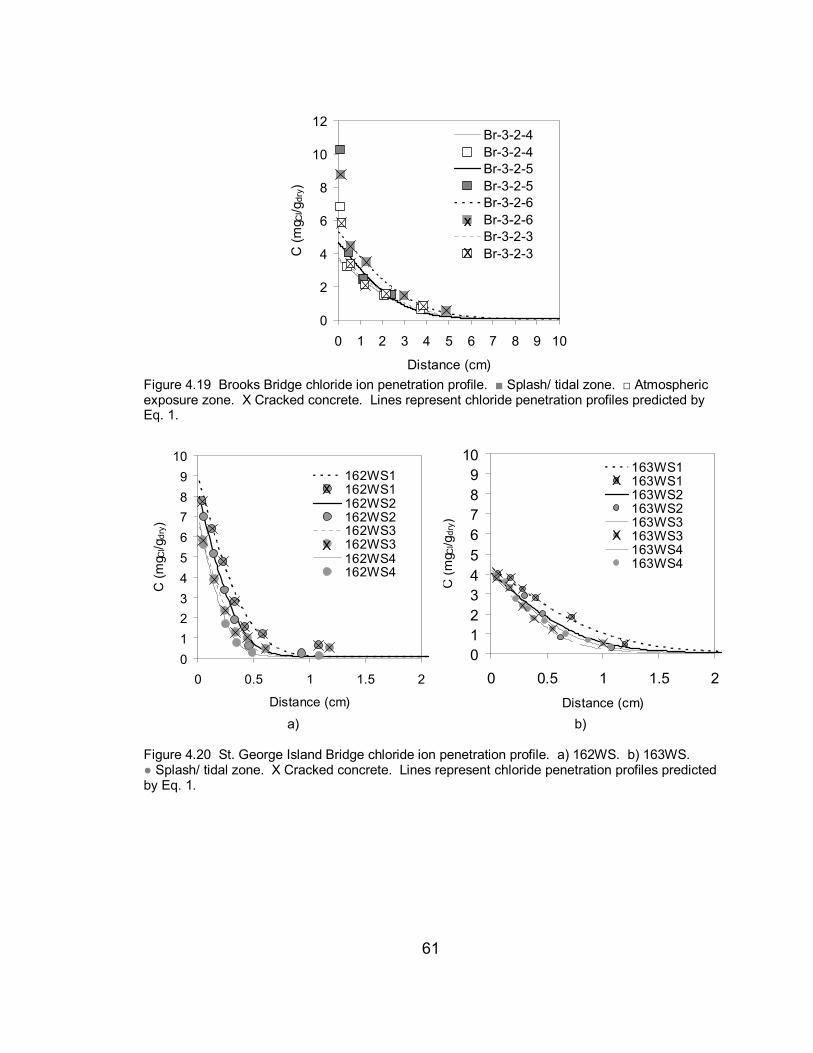
61
0123456789
10
0 0.5 1 1.5 2Distance (cm)
C (m
g Cl/g
dry)
163WS1163WS1163WS2163WS2163WS3163WS3163WS4163WS4
X
X
0
2
4
6
8
10
12
0 1 2 3 4 5 6 7 8 9 10
Distance (cm)
C (m
g Cl/g
dry)
Br-3-2-4Br-3-2-4Br-3-2-5Br-3-2-5Br-3-2-6Br-3-2-6Br-3-2-3Br-3-2-3
x
X
0123456789
10
0 0.5 1 1.5 2
Distance (cm)
C (m
g Cl/g
dry)
162WS1162WS1162WS2162WS2162WS3162WS3162WS4162WS4
X
X
Figure 4.19 Brooks Bridge chloride ion penetration profile. Splash/ tidal zone. Atmospheric exposure zone. X Cracked concrete. Lines represent chloride penetration profiles predicted by Eq. 1. a) b) Figure 4.20 St. George Island Bridge chloride ion penetration profile. a) 162WS. b) 163WS. Splash/ tidal zone. X Cracked concrete. Lines represent chloride penetration profiles predicted by Eq. 1.

62
0123456789
10
0 0.5 1 1.5 2
Distance (cm)
C (m
g Cl/g
dry)
SF1404SF943
Figure 4.21 Salt-solution-ponded concrete chloride ion penetration profile. Nordtest Method NT Build 443. St. George Island Bridge pile cutoffs. Lines represent chloride penetration profiles predicted by Eq. 1.
The most notable feature of the chloride concentration data from piles in
service in all four bridges was the very low resulting values of the apparent
chloride ion diffusion coefficient. Figures 4.22 and 4.23 show cumulative
distributions of the diffusivity and surface concentration obtained for each of the
structures assessed as well as for the previous assessment of the Escambia Bay
bridges. The overall median value for the four bridges was only approximately
1x10-13 m2/s (~0.005 in2/y), which is less than the median value recently obtained
for the best performing structures built with modern FDOT class V concretes for
aggressive marine service, approximately 4x10-13 m2/s (0.02 in2/y) [3]. The range
of diffusivity values observed in this study are also in the same class as those
obtained for cylinder piles at the Escambia Bay bridges [2], underscoring the
overall low permeability of the concrete in these components.

63
0
0.1
0.2
0.3
0.4
0.5
0.6
0.7
0.8
0.9
1
1E-14 1E-13 1E-12
Deff (m2/s)
Cum
ulat
ive
Frac
tion
Hathaway Bridge
Pensacola Bay Bridge
Brooks Bridge
Escambia Bay Bridge
St. George Island Bridge
Figure 4.22 Cumulative Fraction of Deff values for cylinder piles in study and Escambia Bay Bridge study [2]
0
0.1
0.2
0.3
0.4
0.5
0.6
0.7
0.8
0.9
1
1 10 100Cs (mgCl/gdry)
Cum
ulat
ive
Frac
tion
Hathaway Bridge
Pensacola Bay Bridge
Brooks Bridge
Escambia Bay Bridge
St. George Island Bridge
Figure 4.23 Cumulative Fraction of Cs values for cylinder piles in study and Escambia Bay Bridge study [2].

64
Measurement and model uncertainty are inherent to the process of
evaluation of the apparent diffusion parameters obtained here [32]. In addition,
there is large actual variability of transport parameters with factors such as
elevation, as shown in figures 4.24. and 4.25. Consequently, the differences in
the diffusivity and surface concentration cumulative distribution curves (figures
4.22 and 4.23) of the Escambia Bay, Pensacola Bay and Hathaway bridges may
not be statistically meaningful. For example, the D values obtained for the
Brooks bridge samples are on average 3 times greater than for the other three
bridges of similar age, but it should be noted that only 4 samples were evaluated,
and all came from a single pile. Consequently, without additional samples from
other locations in that bridge it cannot be ascertained whether the concrete used
in those piles was more permeable than in the comparable bridges. Of more
varied origins were the data for the new SGI Bridge, which include cores from
two piles in service (Figure 4.20), to which have been added from laboratory
ponding tests of cores extracted from unused pile sections (Figure 4.21).
Chloride penetration was shallow as expected for the limited time of service in
seawater. Nevertheless, the overall results tended to show values comparable to
those obtained in the other, much older structures. It is recalled that concrete
with pozzolanic additions tends to show a marked decreasing apparent diffusivity
trend with time, typically described by D=Do t-n, which n is in the order of 0.5 to
0.7 [33]. Such trend reflects the decreasing connectivity of the pore network as
the pozzolanic reactions progress over long times. As a result, it is possible that

65
the median apparent diffusivity of concrete in this structure at age 40 years
(approximately one order of magnitude greater than present age) may become
several times smaller than at present. As pointed out earlier, SGI Bridge cores
extracted from 162WS showed markedly deeper penetration than those from
163WS, even when both piles supposedly were made with the same type
concrete with the same mixture proportions. It has been speculated that
differences in pozzolanic content in the concrete of both piles may be responsible
for the difference, and magnetic susceptibility measurements for determination of
fly ash presence were made as discussed in Section 2.4.4. There may also be
some segregation of aggregate during concrete pile casting which would also
affect the permeability of the concrete at near surface layers. The concrete of
the SGI Bridge pile segments above tide level typically comprise of limestone
and some river rock. No dramatic differences in aggregate amount or spacing
were visually noticeable between 162WS and 163WS; however, it should be
noted that the small diameter of the cores precludes drawing definite conclusions
when comparing only two samples. Thus, the causes for the observed
differences in chloride penetration of both piles remain undetermined.

66
1E-14
1E-13
1E-12
-0.5 0 0.5 1 1.5 2Elevation AHT (m)
D (m
2 /s)
Hathaway Bridge
Pensacola Bay Bridge
Brooks Bridge
St. George Island Bridge
Escambia Bay Bridge
Figure 4.24 Apparent chloride ion diffusivity as function of pile elevation.
1
10
100
-0.5 0 0.5 1 1.5 2Elevation AHT (m)
Cs (
mg C
l/gdr
y)
Hathaway BridgePensacola Bay BridgeBrooks Bridge
St. George Island BridgeEscambia Bay Bridge
Figure 4.25 Chloride surface concentration as function of pile elevation.

67
In agreement with a commonly observed trend in marine substructure [3],
the apparent diffusivity and surface concentration tended to decrease with
increasing elevation AHT (figures 4.24 and 4.25). This behavior is visible in the
example of Figure 4.17a where the profiles are significantly wider for cores
extracted from below tide than for cores in the atmospheric exposure zone. The
composite graph in Figure 4.24 shows diffusivity as function of elevation for all of
the core locations in this survey as well as those from the Escambia Bay bridges.
Although there is significant local scatter, there is a clearly decreasing trend in D
as elevation increases. The decrease is expected as the water content of the
concrete decreases with increasing elevation, with consequent reduction in the
ion transport ability through the concrete.
As shown in Table 2.1, the typical chloride ion concentration of the water
traversed by the bridges in study is approximately 10,000 ppm; St. Andrews Bay
traversed by the Hathaway Bridge has a moderately higher chloride
concentration (approximately 25,000 ppm). The chloride content of Escambia
Bay was documented to be 5,640 ppm [2]. These values are characteristic of the
chloride content of gulf and intracoastal water in the Florida Panhandle; St.
Andrews Bay is comparable among the most aggressive chloride environments
statewide.

68
Figure 4.26 shows that the ranges of Cs values observed in the various
bridges investigated generally overlap, roughly independent of the chloride
content of the water in the span of salinity encountered. The similarly overlapping
data from an additional statewide sampling of Florida bridge [3] substructures
made with conventional concrete is also shown. This behavior has been noted
elsewhere [35] and it reflects the development of nearly salt-saturation conditions
(and hence approximately equal concentration independent of salinity of the
source) on much of the surface of the concrete by evaporative concentration of
marine or estuary water.
0
5000
10000
15000
20000
25000
30000
0.1 1 10 100 1000Cs (mg/g)
Chl
orid
e C
onte
nt (p
pm)
St Andrews Bay(Hathaway Bridge)
Pensacola Bay (Pensacola Bay Bridge)
Santa Rosa Sound(Brooks Bridge)
St. George Sound (St. George Island Bridge)
Escambia Bay (Escambia Bay Bridge)
Figure 4.26 Comparison of water chloride content and concrete chloride surface concentration Cs at elevations -0.5 to 5 ft AHT (-0.14 to 1.52 m) AHT. (-) data from [3] for various FDOT bridges built with conventional modern concrete.
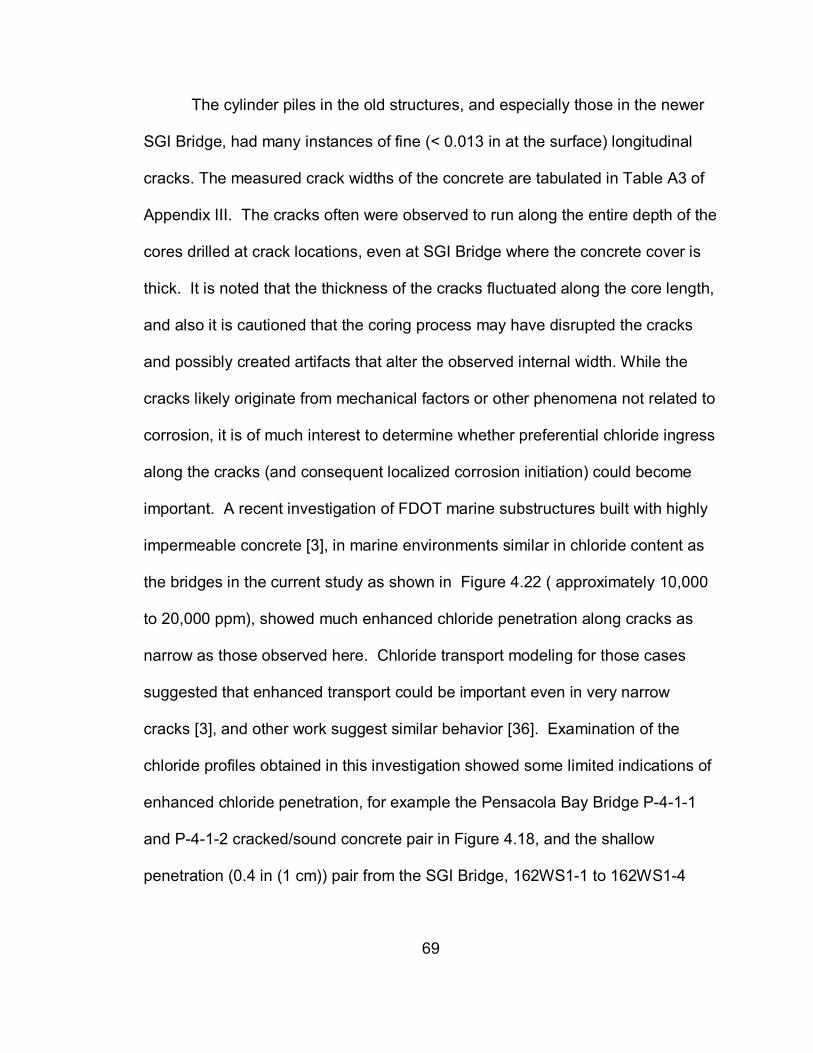
69
The cylinder piles in the old structures, and especially those in the newer
SGI Bridge, had many instances of fine (< 0.013 in at the surface) longitudinal
cracks. The measured crack widths of the concrete are tabulated in Table A3 of
Appendix III. The cracks often were observed to run along the entire depth of the
cores drilled at crack locations, even at SGI Bridge where the concrete cover is
thick. It is noted that the thickness of the cracks fluctuated along the core length,
and also it is cautioned that the coring process may have disrupted the cracks
and possibly created artifacts that alter the observed internal width. While the
cracks likely originate from mechanical factors or other phenomena not related to
corrosion, it is of much interest to determine whether preferential chloride ingress
along the cracks (and consequent localized corrosion initiation) could become
important. A recent investigation of FDOT marine substructures built with highly
impermeable concrete [3], in marine environments similar in chloride content as
the bridges in the current study as shown in Figure 4.22 ( approximately 10,000
to 20,000 ppm), showed much enhanced chloride penetration along cracks as
narrow as those observed here. Chloride transport modeling for those cases
suggested that enhanced transport could be important even in very narrow
cracks [3], and other work suggest similar behavior [36]. Examination of the
chloride profiles obtained in this investigation showed some limited indications of
enhanced chloride penetration, for example the Pensacola Bay Bridge P-4-1-1
and P-4-1-2 cracked/sound concrete pair in Figure 4.18, and the shallow
penetration (0.4 in (1 cm)) pair from the SGI Bridge, 162WS1-1 to 162WS1-4

70
(Figure 4.20). As mentioned earlier, there are indirect resistivity indications of
increased ionic transport in cracked specimens in SGI Bridge. These cases
however appeared to be much less developed than the dramatic examples of
enhanced chloride penetration documented elsewhere for conventional marine
substructure [3]. In addition, the present steel corrosion survey failed to show
any examples of clear association between prior presence of cracks and
preferential corrosion initiation, even in the bridges that had been in service for
40 years. Consequently, there is no clear indication at present that fast chloride
transport at thin cracks is a significant corrosion initiation factor in cylinder piles,
at least those built with traditional relatively low external clear concrete cover. It is
cautioned however that evidence from mechanically distressed piles at SGI
Bridge, being investigated independently by FDOT, may require revisiting this
issue in the future for the case of new cylinder pile construction using thicker
concrete cover. It is noted also that surface rust observations did not appear to
be associated with joints between pile segments.
As in most instances the presence of cracks did not appear to significantly
alter the shape and depth of the chloride profile compared to that of companion
sound cores, the apparent diffusion parameters calculated from both sources
have been considered together in the rest of this report.
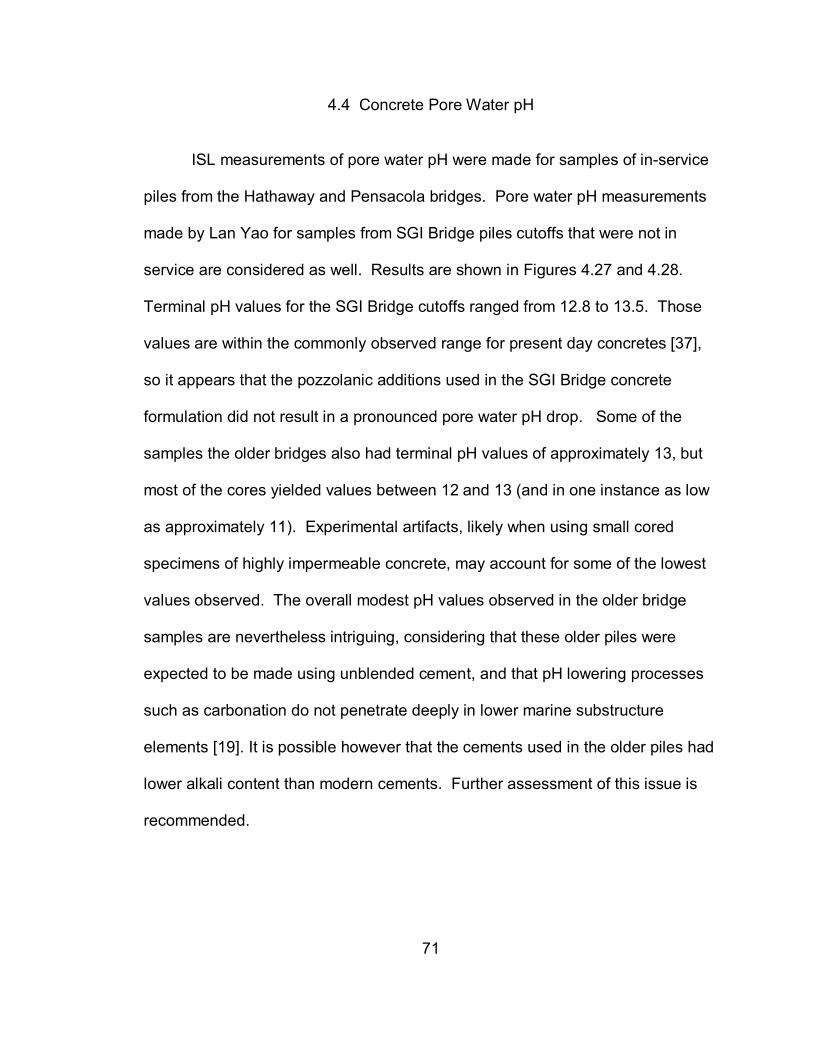
71
4.4 Concrete Pore Water pH
ISL measurements of pore water pH were made for samples of in-service
piles from the Hathaway and Pensacola bridges. Pore water pH measurements
made by Lan Yao for samples from SGI Bridge piles cutoffs that were not in
service are considered as well. Results are shown in Figures 4.27 and 4.28.
Terminal pH values for the SGI Bridge cutoffs ranged from 12.8 to 13.5. Those
values are within the commonly observed range for present day concretes [37],
so it appears that the pozzolanic additions used in the SGI Bridge concrete
formulation did not result in a pronounced pore water pH drop. Some of the
samples the older bridges also had terminal pH values of approximately 13, but
most of the cores yielded values between 12 and 13 (and in one instance as low
as approximately 11). Experimental artifacts, likely when using small cored
specimens of highly impermeable concrete, may account for some of the lowest
values observed. The overall modest pH values observed in the older bridge
samples are nevertheless intriguing, considering that these older piles were
expected to be made using unblended cement, and that pH lowering processes
such as carbonation do not penetrate deeply in lower marine substructure
elements [19]. It is possible however that the cements used in the older piles had
lower alkali content than modern cements. Further assessment of this issue is
recommended.

72
10
11
12
13
14
0 20 40 60 80Time (days)
pH
H8-2
H29-3
10
11
12
13
14
0 20 40 60 80Time (days)
pH
P110-2 P149-2P219-4 P237-1
10
11
12
13
14
0 20 40 60 80 100Time(days)
pH
8789431404
Figure 4.27 Pore water pH of St. George Island Bridge pile cutoffs by ISL technique.
a) b)
Figure 4.28 Pore water pH by ISL technique. a) Pensacola Bay Bridge. b) Hathaway Bridge
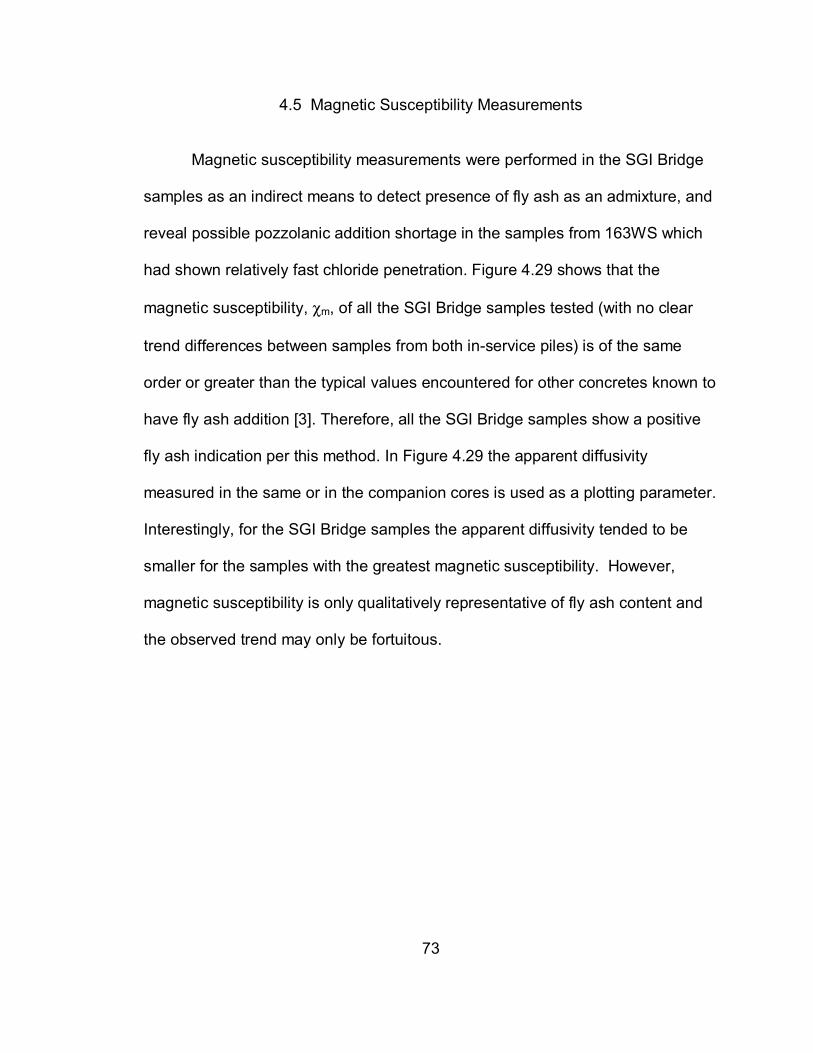
73
4.5 Magnetic Susceptibility Measurements
Magnetic susceptibility measurements were performed in the SGI Bridge
samples as an indirect means to detect presence of fly ash as an admixture, and
reveal possible pozzolanic addition shortage in the samples from 163WS which
had shown relatively fast chloride penetration. Figure 4.29 shows that the
magnetic susceptibility, χm, of all the SGI Bridge samples tested (with no clear
trend differences between samples from both in-service piles) is of the same
order or greater than the typical values encountered for other concretes known to
have fly ash addition [3]. Therefore, all the SGI Bridge samples show a positive
fly ash indication per this method. In Figure 4.29 the apparent diffusivity
measured in the same or in the companion cores is used as a plotting parameter.
Interestingly, for the SGI Bridge samples the apparent diffusivity tended to be
smaller for the samples with the greatest magnetic susceptibility. However,
magnetic susceptibility is only qualitatively representative of fly ash content and
the observed trend may only be fortuitous.

74
1E-14
1E-13
1E-12
1E-11
0 0.0002 0.0004 0.0006 0.0008 0.001χm (dimensionless)
Def
f (m
2 /s)
Figure 4.29 Magnetic susceptibility indication of fly ash presence and apparent chloride ion diffusivity. St. George Island Bridge samples. Laboratory ponded samples. x Cracked concrete. + Concrete samples with known fly ash [3]. X Concrete samples without fly ash [3]. – Concrete samples with unknown presence of fly ash [3]. Vertical line represents susceptibility detection limit.
4.6 Laboratory IRH Measurements
Concrete cores from unused pile cutoffs from the SGI Bridge were used to
measure internal relative humidity as indication of concrete permeability. A
cylindrical cavity 1 in (2.5 cm) in diameter and 1.5 in (3.8 cm) in length was drilled
centered into the flat surface of 3.75 in (9.5 cm) diameter, approximately 3 in (7.6
cm) length, concrete cores for IRH measurements as described in Section 2.2.
IRH measurements were initially made storing the core samples in ambient
laboratory conditions where the room humidity and temperature was typically in

75
the range of 60 to 75% RH and 20 to 25oC, respectively for approximately 100
days. The concrete IRH reflected a similar range in humidity level during that
time. Figure 4.30 shows the moisture pickup in the core samples from
conditioning in a 100% RH chamber as measured by IRH. The concrete IRH only
began to show signs of stabilization after approximately 100 to 200 days which is
an indication of low concrete permeability. It should be noted that the entire
surface area of the concrete core was exposed to conditioning and may
experience faster moisture gain than that of actual field conditions.
0
10
20
30
40
50
60
70
80
90
100
0 100 200 300 400 500 600Time (days)
IRH
(%)
0
5
10
15
20
25
30
35
40
45
50
T (o C
)
SF943-4SF943-8SF1404-6SF1404-10
Figure 4.30 Concrete IRH and temperature as function of time conditioned in ambient conditions and 100% RH. The vertical line represents the time when the samples were placed in high humidity.
100% RH Condition

76
5 Durability and Pile Design
5.1 Performance of Cylinder Piles from Older Bridges
The field and laboratory findings are indicative of very good corrosion
performance of older cylinder piles over service periods of several decades,
confirming similar findings in the previous Escambia Bay bridges investigation5.
Exceptions were locations such as the upper end of the pile by the pile cap,
where mechanical distress during construction had exposed reinforcement that
was not sufficiently covered afterwards. Early repair patches at the Pensacola
Bridge appear to reflect similar local construction deficiencies. Those cases will
not be considered further as they involve detailing control common to most pile
types. Conspicuous rust stains at intermediate elevations, notably in the
Pensacola Bay Bridge, appear in most cases to have resulted from corroding
steel debris or other auxiliary components but not related to corroding
reinforcement or strand. In the following, only the condition of the normally
constructed and exposed portion of the piles will be addressed.
5 A caveat applies in that only the tidal and higher elevation portion of the substructure was surveyed in these bridges. Evidence from other FDOT concrete substructures indicates that most corrosion related damage manifests itself first above water, as evaporative chloride accumulation and oxygen availability is greater there. That trend is assumed to apply here as well but deterioration below the waterline cannot be discounted without direct evidence. Autopsy of the submerged portion of cylinder piles removed from service in the future is recommenced to confirm absence of severe damage there.

77
No telltale rust patterns on the surface of the piles, reflecting the position
of spiral reinforcement or strand, were noticed upon examination. Extraction of
cores focused on spots selected for showing unusually high rust staining, and yet
only two cases of appreciable loss of steel due to corrosion were found in the
three bridges investigated. All the other observations of steel corrosion (including
some on the post tensioning strand) were of only minor rust or discoloration,
some of which may have been present prior to embedment in concrete or grout.
Steel potential measurements were equally indicative of a passive steel condition
over much of the substructure region investigated. The general evidence of little
or no corrosion is striking in view of the aggressiveness of the environment, the
four-decade long service life of the structures investigated, and the thin clear
steel concrete cover existing (especially in the Pensacola Bay bridge, with <1 in
(2.54 cm) cover on average).
The observed high corrosion resistance of these older piles appears to
stem from a combination of very slow chloride ion penetration rates through the
concrete with either or both of the following: a substantial critical chloride
concentration threshold for steel corrosion initiation, and low corrosion
propagation rates if the threshold was exceeded. These factors are considered
next.

78
5.1.1 Chloride penetration
As shown in Figure 4.22, the range of surface chloride concentrations
observed in the cylinder pile surfaces were similar to those encountered in other
marine and estuarial Florida bridges built with conventional concrete. Thus the
driving force for chloride penetration in the older cylinder piles was not unusually
high or low. The observed chloride diffusivities were however extremely small
(typically about 10-13 m2/s) which caused chloride penetration to be greatly
retarded in the bulk of the concrete. Furthermore, in contrast to observations in
conventional FDOT substructures [3], rapid chloride transport through thin cracks
was not strongly apparent in the older cylinder piles. Thus, even though thin
cracks were frequently observed, inward chloride ion penetration appeared to be
a function of bulk parameters.
Low bulk chloride diffusivity was expected in high quality concrete with
high cement content, low water to cement ratio and good compaction, as used in
the cylinder piles. Both the low bulk diffusivity and the lesser importance of thin
cracks may have been promoted by low internal concrete moisture as indicated
by the low internal RH levels measured in the field. Low internal moisture can
exist even under wet external conditions if the concrete is dense and the low w/c
induces self-desiccation upon long term hydration of the cement [38]. Under
those conditions ionic transport in the bulk, already slow due to a tight pore
network, is made slower by fewer liquid paths within the pores. Transport
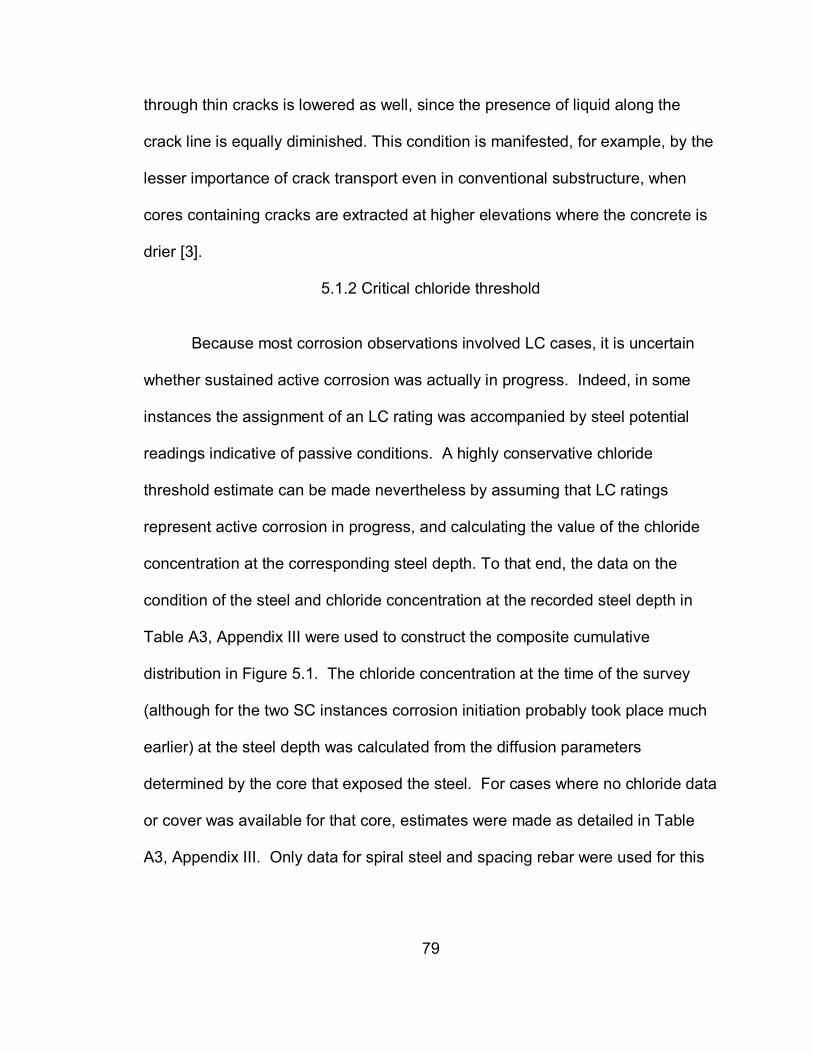
79
through thin cracks is lowered as well, since the presence of liquid along the
crack line is equally diminished. This condition is manifested, for example, by the
lesser importance of crack transport even in conventional substructure, when
cores containing cracks are extracted at higher elevations where the concrete is
drier [3].
5.1.2 Critical chloride threshold
Because most corrosion observations involved LC cases, it is uncertain
whether sustained active corrosion was actually in progress. Indeed, in some
instances the assignment of an LC rating was accompanied by steel potential
readings indicative of passive conditions. A highly conservative chloride
threshold estimate can be made nevertheless by assuming that LC ratings
represent active corrosion in progress, and calculating the value of the chloride
concentration at the corresponding steel depth. To that end, the data on the
condition of the steel and chloride concentration at the recorded steel depth in
Table A3, Appendix III were used to construct the composite cumulative
distribution in Figure 5.1. The chloride concentration at the time of the survey
(although for the two SC instances corrosion initiation probably took place much
earlier) at the steel depth was calculated from the diffusion parameters
determined by the core that exposed the steel. For cases where no chloride data
or cover was available for that core, estimates were made as detailed in Table
A3, Appendix III. Only data for spiral steel and spacing rebar were used for this
80
graph; conditions of the deeper, grout-surrounded strand are considered
separately.
The trend in Figure 5.1 (although affected by large uncertainty from the
many assumptions made) suggests that no corrosion initiation took place at
concentrations below ~ 0.5 mg/g (or ~ 2 pcy (~ 1.2 kg/m3) for typical 4000 pcy
(2400 kg/m3) concrete), and that in many instances the chloride content was
higher and not even incipient signs of corrosion took place. Thus a value of 0.5
mg/g may be suggested as a conservative lower bound for the critical chloride
threshold of reinforcing steel in these piles, recognizing that the actual effective
threshold value (or range of values6) is likely to be significantly greater. It is
worthwhile noting that corrosion thresholds reported in the literature for steel in
conventional concrete but with high cement content similar to that present in the
circular piles are in the order of approximately 1 mg/g [41]. Factors such as
better concrete compaction in the cylinder piles may result in higher threshold
values compared with that in conventional cast concrete.
6 Corrosion initiation in concrete, even under controlled conditions, is of a stochastic nature [38]. In addition, corrosion initiation at a given place on a steel assembly may be significantly retarded if the local potential of the passive steel has been driven to more negative values by ongoing corrosion in nearby regions of the same assembly, or by low oxygen availability [39]. Those phenomena may have been responsible for the absence of corrosion in some of the higher chloride concentration regimes.

81
0
0.1
0.2
0.3
0.4
0.5
0.6
0.7
0.8
0.9
1
0 1 2 3 4 5 6
Est Cl- Concentration (mg/g)
Cum
ulat
ive
Frac
tion
Hathaway BridgePensacola Bay BridgeBrooks Bridge
Figure 5.1 Cumulative fraction of estimated chloride concentration at steel depth determined for locations where spiral or spacing bar steel was exposed by coring in the Hathaway, Pensacola, and Brooks bridges. See Table A3, Appendix III for details and assumptions. Solid symbols, SC. Grey symbols, LC. Open symbols, NC. X, core drilled on crack.
The trend in Figure 5.1 suggests that corrosion initiation was just
beginning to affect a small fraction of the pile inventory in these bridges at the
time of the survey. This is consistent with a combination of normal chloride
surface concentrations, very low diffusivities and considerable threshold levels.
By application of Eq. (1) this combination results in long projected times to
corrosion initiation, even though the observed clear concrete covers were so thin.
For example, one may assume values representative of the present findings:
Cs=10 mg/g, near zero native chloride, D=10-13 m2/sec and xC=2.5 cm, together
with CT=1 mg/g. Eq.(1) then projects a time to corrosion initiation of 37 years. A
higher threshold value would extend the projected time to initiation accordingly.

82
The above discussion applies to spiral or rebar steel. Little can be said
from the present findings about the effective threshold for strand steel as in most
cases the projected chloride penetration to the strand depth was very small, and
the few instances of rust on strand wires are not clearly related to ongoing
corrosion. In the absence of other information, it will be assumed that the
corrosion threshold for properly grouted strand is comparable to that of the other
steel in these structures, with consequent expectation of much longer times to
corrosion initiation due to the deeper clear cover of the strand. A potential
concern is the observation of two cases of clearly visible grout voids (core P237-
1-2 and P252-1-1), which may locally lower the corrosion threshold. Control of
grouting quality is essential.
5.1.3 Corrosion propagation rates
From the previous section and the generally low external manifestations of
corrosion, it can be said that corrosion propagation (topical extraneous damage
excluded) has either not commenced in most of the piles, or is proceeding at a
very low rate. The steel exposed by coring that most commonly showed some
signs of corrosion (LC condition) had very small average corrosion penetration,
perhaps only a few micrometers. If that corrosion actually occurred in service,
the previous discussion suggests that initiation took place relatively recently, so
typical corrosion propagation rates should be in the micrometer per year range
(barely above usual estimates of passive corrosion rates [42]). This modest
83
range estimate is not surprising considering that the concrete in the piles, even
when wet, had high resistivity (reflecting low pore connectivity and often
moderate internal humidity), of a level commonly associated with very low or
negligible corrosion rates [28].
The corresponding time necessary for a corrosion-induced crack to occur
may be evaluated using the expression by Torres-Acosta [43].
XCRIT (mm) ~ 0.011
XcΦ
XcL + 1
1.8 (2)
where xCRIT is the steel corrosion penetration necessary to cause a crack in the
concrete, Xc is the concrete cover thickness, Φ is the steel bar diameter, and L
is the corroding length. Assuming conservatively that L is large compared to Xc,
and taking representative dimensions for the spiral wire in the old bridges (Φ = 6
mm, Xc = 30 mm) the result is xCRIT ~ 0.055 mm. Corrosion is likely to be more
localized during the early initiation events. In such case if e.g L ~ Xc, then xCRIT
would be twice as large. With corrosion rates in the micrometer per year range
[3], the typical time required to develop a corrosion induced crack after the
initiation event would be two or more decades.
After the first corrosion induced cracks take place, the corrosion rate is
likely to increase so subsequent deterioration would be faster and concrete

84
delamination would quickly ensue. The two recorded incidents of severe wire
corrosion may reflect such occurrence. In one of those cases the estimated clear
cover was only 1.4 cm, and corrosion propagation may have been in progress for
many years already. It is noted that even in those cases, the actual metal loss
was quite localized and much of each wire segment extracted retained the initial
dimensions.
The longitudinal steel strands in these structures are placed about 33% to
50% deeper than the spiral wires or spacing bars. All other factors being equal,
the time necessary to reach threshold chloride levels at reinforcement depth is
approximately proportional to the square of the cover (Eq.1). Corrosion of the
strand is then expected to start much later in the life of the structure. Thus, any
future corrosion-related severe damage to the concrete, and related repair
needs, are likely to result first from the corrosion of the spiral reinforcement.
5.1.4 Corrosion-related durability prognosis
A small fraction of piles have already shown indications of corrosion
damage. The factors considered above indicate that incipient indications of
concrete damage from corroding reinforcement beyond those observed may
already exist in a small fraction of the piles, and might become apparent upon
extensive re-examination of the structures. However, threshold values may span
a wide range above the value tentatively identified above, and evolution of the
85
corrosion propagation stage is expected to be slow. Thus, development of
corrosion damage serious enough to require repair or rehabilitation appears to be
several decades into the future. There is then a good chance that, despite their
low concrete clear cover, the cylinder piles bridges built in the 1960’s and still
commissioned will perform with little corrosion-related maintenance needs well
into a 75-year service life span. The quantitative durability treatment developed
earlier for the Escambia Bay bridges [3] reached similar conclusions using
assumptions for the initiation and propagation stage that were approximately
equivalent to the findings from the present findings. Similar forecast models for
the Hathaway, Pensacola Bay, and Brooks bridges are discussed in Section 6.
5.2 Performance of Cylinder Piles Built Under Current FDOT Guidelines
The very early information developed to date for the piles at the SGI
Bridge indicates, on average, excellent bulk concrete properties to slow down
chloride ingress. Attention is called to the somewhat higher (but still quite small
in absolute terms) diffusivity encountered in one of the piles tested; its chloride
penetration behavior should be monitored in the future and testing extended to
other piles to assess any possible systematic deficiency. Nevertheless, because
of the high pozzolanic content of the concrete, bulk chloride transport is expected
to become even slower in the future. Surface chloride concentration levels were
indicative of no unusual driving force for chloride penetration.

86
The cylinder piles in the SGI Bridge section investigated showed frequent
thin cracks (not caused by corrosion), in some instances propagating deep into
the reinforcement level. It is too early to assess the effect of those cracks on
chloride transport, except to note that preferential chloride ingress was observed
in two instances in the shallow range (approximately 0.5 in (1 cm)) where
chloride profiles were measurable. It is possible however that the same
conditions that seem responsible for mitigating chloride crack transport in the
older bridge piles will be active here as well. Future evaluation as the structure
ages is important to better assess this issue.
Chloride threshold cannot be directly evaluated at present, as no
reinforcement corrosion cases were documented (rust spots seen on the surface
of some SGI Bridge piles appear to be related to steel debris or other extraneous
sources). However, the pore water assessment indicated a high pH in spite of
the high pozzolanic content. Thus, it appears likely that normal chloride
threshold values may apply. Corrosion propagation would be expected to be
limited in these piles by the same factors prevalent in the older bridges, except
that the thicker concrete cover may further extend the time to corrosion induced
cracking if the cover to steel diameter is greater. As in the older bridges, most of
the corrosion-induced damage to the concrete is expected to originate from the
spiral reinforcement before any strand corrosion becomes important.

87
5.3 Concrete Cover and Cylinder Pile Corrosion Performance
If bulk transport of chlorides were the only relevant factor, the corrosion
limited durability of the modern cylinder piles would be expected to be
exceedingly long. As indicated earlier, projected corrosion initiation times per Eq.
(1) are proportional to the square of the clear cover. The average of the cover
from the three older bridges (Table A2) is 1.17 in (2.96 cm), while that of the SGI
Bridge is 3.18 in (8.1 cm). Thus, if as suggested by the present findings the
chloride diffusivity and corrosion threshold are comparable, the length of the
corrosion initiation stage in the newer piles would be approximately 7 times
greater than for those in the older bridges. Nominal durability far in excess of
100 years would be then projected.
The above simplistic analysis does not take into consideration the
potential for localized chloride ingress paths, notably preexisting cracks as those
noted earlier. Because of the much thicker clear cover, both the propensity for
any cracks and the width of the cracks may be significantly greater than in the
older cylinder pile design7. The use of microsilica in newer piles may also
increase the chances of cracking due to less tolerance to curing anomalies [44].
As indicated in Section 5.2, the extent of enhanced chloride penetration can not
be assessed well at this early pile age. Thus, the possibility of severe chloride
7 It is noted however that cracking at the piles in the investigated portion of SGI is generally related to other construction issues, examined separately by FDOT.

88
penetration through preexisting cracks, as noted in other FDOT structures with
otherwise highly impermeable concrete, cannot be disregarded and continuing
monitoring of those locations is needed.
The above findings suggest that, from a bulk chloride penetration
standpoint, cylinder piles constructed with the materials examined here could
have clear cover levels significantly less than the currently specified 3 in (7.5 cm)
and still result in times to corrosion initiation amply consistent with a 75-year
durability goal. In addition to lowered material requirements and fewer
fabrication constraints, a smaller cover might reduce the propensity for incidence
of cracks. Improved reliability may result as well as fabrication methods would
approach established practice that has resulted in the good corrosion
performance documented here for the older piles. This expectation is supported
by the analysis in Section 6 where the consequences of a hypothetical relaxation
of clear cover to a smaller value (2 in (5.1 cm)) as an example are considered in
more detail by means of a simplified quantitative model.
Present FDOT Structure Design Guidelines (Section 4.5, Post Tensioning)
establish multiple levels of protection for critical bridge components which may
be extended to cylinder piles as well. Of special interest is the condition of the
tendons at the joint between pile segments. At present protection to the strand
there is provided by two consecutive elements: the grout around the strand, and
89
the parallel combination of the concrete at both sides of the joint and the epoxy
or similar filler material placed between the two joined segment faces. A
reduction in design cover as considered above would also reduce the length of
the thin polymer-filled region between the segment faces possibly facilitating
chloride ingress at the joint. Special provision for added quality control or
supplemental protection there, as well as dimensioning piles to avoid joint
placement in the tidal or splash zones, may merit consideration. A possible
enhancement being considered by FDOT is the installation of a consecutive
protection element provided by a corrugated polymeric duct cast in the grout
channel. The mechanical consequences of such addition need examination for
possible disadvantages; placement of similar ducts only near the segment ends
may be a desirable alternative with fewer potential drawbacks if consistent with
practical implementation. It is noted that no particular association between pile
joints (where the joint cover is, as elsewhere, very thin) and evidence of
corrosion was noted in the survey of the three older bridges.

90
6 Deterioration Forecast Model
This section presents an exploratory analysis of the corrosion
performance of cylinder piles using deterioration models based on simple Fickian
diffusion of chloride and corrosion initiation/propagation concepts8. The concepts
discussed at the end of Section 5 are examined in more detail, with attention to
the consequences of a hypothetical relaxation of current specified clear cover.
The deterioration model used considers the region of the concrete
surface where corrosion distress may occur (typically in the tidal region and
splash zones), discretized into small surface elements, with independent
distributions of concrete properties. The modeling approach, used first for the
Escambia Bay bridges, is described elsewhere along with a discussion of the
model limitation issues such as time and spatial variant diffusivity, chloride
binding, and polarization effects [2,45]. The model inputs are chloride threshold
CT; distributions of surface chloride concentration Cs, chloride ion diffusivity D,
and concrete clear cover Xc as mean and standard deviation values9; corrosion
8 These analyses are not part of the FDOT report “Corrosion Performance of Concrete Cylinder Piles” BC353 RPWO#10 (2005) 605 Suwannee St. MS30 Tallahassee, FL 32399 and are introduced here as an additional contribution to obtain insight of concrete cylinder pile corrosion performance projections. 9 Some of these distributions are truncated at zero or at some representative value (Table 6.1). The terms mean and standard deviation as used in the following indicate the values of those parameters before applying truncation.
91
propagation time tp; and the number of pile surface elements assumed to be
susceptible to distress. Calculations using Eq. 1 determine the time of corrosion
initiation for each surface element and add the length of the propagation period
to obtain the service time at which the element is declared to be distressed (e.g.
displaying a corrosion induced crack or spall). The model output is a
deterioration function given as the damaged fraction (number of damaged
elements divided by total number of elements) of the pile surface area
susceptible to damage as function of time. The service life projected by the
model may be significantly shorter than that calculated solely with mean values
of D, Cs, and Xc. That difference results from having assumed a relatively wide
distribution of parameter values (Table 6.1), so early deterioration is ruled by the
extreme values of those parameters.
Forecast model input values are listed in Table 6.1. A surface element
size of 25 in2 (0.016 m2), representative of the size of the corrosion related spalls
and severe rust spots observed in the field, was used. The model output is
reported as the deteriorated fraction of the susceptible pile surface. Deterioration
forecast of the three older bridges has been evaluated together as one generic
case. Two other cases evaluated the deterioration forecast of the SGI Bridge
with actual observed clear cover and a hypothetical reduced specification clear
cover. Distributions of concrete clear cover, effective surface chloride
concentration and effective chloride ion diffusivity have been abstracted from
analysis of field and laboratory data or from trends identified in earlier studies [2].

92
Table 6.1 Forecast Model Inputs
Older Bridges Case SGI Bridge Cases
Elevation range (m)
1.5
1.5
Mean chloride ion diffusivity D Standard deviation σ
Min. D truncation (m2/s)
1.18e-13* 9.84e-14**
0
1.18e-13* 9.84e-14**
0
Mean Cl- surface concentration Cs Standard deviation σ
Min. Cs truncation Max. Cs truncation
(kg/m3)
20 6.0 0
40
20 6.0 0
40
Mean clear cover Xc Standard deviation σ
Min. Xc truncation (cm)
2.96 0.43 1.0
8.1 0.43 7.2
5.1† 0.43 5.0‡
* Average value from Hathaway and Pensacola Bay bridges. ** Assumed values from trend in earlier study [2], σ ~ 0.5 mean. † Example reduced specification clear cover. ‡ Assuming strict control of clear cover.
The average calculated diffusivity of the concrete from the Hathaway and
Pensacola Bay bridges was used as the mean value for the older bridges case.
For the SGI Bridge, as shown in Figure 4.22, the median chloride ion diffusivity is
approximately two times greater than that of the Hathaway and Pensacola Bay
bridges. Since the concrete in the SGI Bridge contains pozzolanic materials, the

93
chloride ion diffusivity is expected become lower with time as the pozzolanic
materials continue to hydrate. A diffusivity value representative of the older
bridges was chosen for model calculations in the SGI Bridge cases. A standard
deviation value σ for chloride ion diffusivity of one-half of the mean value was
assumed by analogy with observations in the Escambia Bay study [2]. This was
done instead of basing that parameter on the actual observations, since there
were discrepancies within the small population of field samples, particularly from
in the SGI Bridge samples (as indicated in Section 4.3).
Deterioration forecast model outputs for the older bridges case are shown
in Figure 6.1. The figure also includes bounded ranges of values for the damage
estimated to be present in each bridge at the time of the survey. The actual
corrosion related damage at the time of inspection is not exactly known as the
surveys were not comprehensive and the cause of each observed deteriorated
area could not be fully established. However, the damage was bounded by an
upper limit where each observed rust spot is considered to represent one
distressed element — even though the vast majority of those spots may be due
to steel exposed by mechanical damage or superficial corrosion not associated
with reinforcing or post tensioned steel. A lower bound limit is the amount of
corrosion-induced damage confirmed by direct observations (not related to
mechanical damage or other preexisting circumstances) in the bridge. In the
case of the Brooks Bridge no damage fell in that category, so a lower limit was

94
assigned as corresponding to at least one distressed element that may have
escaped detection during the survey.
1.E-06
1.E-05
1.E-04
1.E-03
1.E-02
1.E-01
1.E+00
10 100 1000Service Time (Years)
Det
erio
rate
d A
rea
Frac
tion
Pensacola Bay BridgeHathaway BridgeBrooks Bridge
A B C
D E F
A: tp=12 yr CT=1.2 kg/m3
B: tp=24 yr CT=1.2 kg/m3
C: tp=48 yr CT=1.2 kg/m3
D: tp=12 yr CT=13.5 kg/m3
E: tp=24 yr CT=13.5 kg/m3
F: tp=48 yr CT=13.5 kg/m3
Figure 6.1 Older bridges forecast deterioration model output. The vertical line represents the bounded range of observed damage at the time of the bridge survey. The dashed line corresponds to a 0.01 and 0.1 deterioration area fraction for nominal definitions of service life.
Although no continuous distributions were used for chloride threshold CT
and length of the corrosion propagation stage tp, the calculations include
damage projections with alternative combinations of those parameters. These
parameters were used to fit the projected deterioration to field deterioration
observations from the Hathaway, Pensacola Bay, and Brooks bridges at the time
of survey.
The chloride threshold values chosen consisted of two values: a low value
corresponding to the lower bound estimated in Section 5.1.2 (1.2 kg/m3) and an

95
upper value where high chloride content was measured (13.5 kg/m3) in a field
sample but where there was no corrosion distress of the reinforcing steel (Figure
5.1). High chloride threshold values may be possible considering that the
concrete has a high cement factor, and in the cases of the older bridges in this
study, an absence of pozzolanic materials [46]. Polarization effects are another
factor which may cause higher chloride threshold values. Still passive portions of
the steel reinforcement may be cathodically prevented from corrosion initiation by
galvanic coupling with an active corrosion site and in which case higher CT
values may be possible [40,47]. Chloride threshold values as large as 17 kg/m3
have been reported for laboratory concrete samples [40,48]
Section 5.1.3 indicates that the propagation period could easily stretch into
two or more decades. Long corrosion propagation times may be due to limited
transport of oxygen to the steel surface, high concrete resistivity or small
reinforcing wire diameter. With that in mind, nominal propagation period
durations of 12 years, 24 years, and 48 years (assumed as fixed values [45])
were chosen.
Figure 6.1 shows the projections resulting from the various combinations
(labeled A through F) of the alternative parameter values chosen. Combination
A, having the lowest tp and CT, over-projects the damage at the time of survey
and is too conservative. Combination F, with the opposite extremes of tp and CT,

96
is too optimistic. Therefore, when using single values of tp and CT, results are
better represented by intermediate combinations such as B to E. It is noted that
a range of chloride threshold values and propagation times for the surface
elements is likely to be a more realistic representation of field conditions than
singly assumed CT and tp values. Because of the cathodic prevention effects
mentioned earlier [40], lower CT values are expected to be prevalent earlier in the
life of the bridges, while higher values may exist near the end. Thus,
combinations B-C (or even A) may better describe earlier behavior while D-F
may apply to the later life stages. If low CT values dominate earlier behavior,
then propagation times that are short or very short (e.g. 5 years, as often
assumed for other marine substructure or deicing salt service cases [3]) do not
seem likely as the resulting projected damage would greatly over-predict
observations. This suggests that the corrosion durability of concrete cylinder piles
benefits from long propagation times (>12 years assuming 1.2 kg/m3 < CT < 13.5
kg/m3). The projections also suggest that long service times are achievable.
The service life of a bridge can be nominally defined as the time when a
given fraction (e.g. 1% or 10% (0.01 or 0.1)) of the pile surface elements is
projected to be distressed. Values of 1% to 10% correspond to the appearance
of about 4 to 40 damaged elements (having a combined area of approximately
100 to 1000 in2, respectively, which is in the order of a typical repair patch [2]) on
each pile of the bridge. Such level of distress may not represent severe
97
structural damage but could require extensive maintenance repairs with
considerable cost. The level chosen, however, is only used as an example and
the calculations can be performed for any other situation reflecting appropriate
economic factors. Note that in Figure 6.1 this nominal service life range is
reached at various times depending on the parameter combinations assumed.
However, if the actual performance falls somewhere in between those projected
for B-C and D-E (as suggested above), the projected times to reach 1-10%
damage may be some decades into the future, consistent with the generally good
present condition of the bridges. Under the most likely assumed parameter
combinations, it appears quite possible that these structures will achieve a 75
year service life without excessive corrosion damage.
The deterioration forecast model output for the SGI Bridge is shown in
Figure 6.2. Projected damage is considerably delayed compared to that in
Figure 6.1 for the older bridges. Corrosion initiation times are projected to be
large (>200 years assuming mean values of D, Cs, and Xc) because of the low
assumed chloride ion diffusivity (same as that of the older bridges taking into
consideration beneficial aging of the concrete) combined with the much larger
measured concrete cover (3.2 in (8.1 cm)) in SGI. The projected corrosion
related service life times for the scenarios considered in Figure 6.2 extend into
the far future.
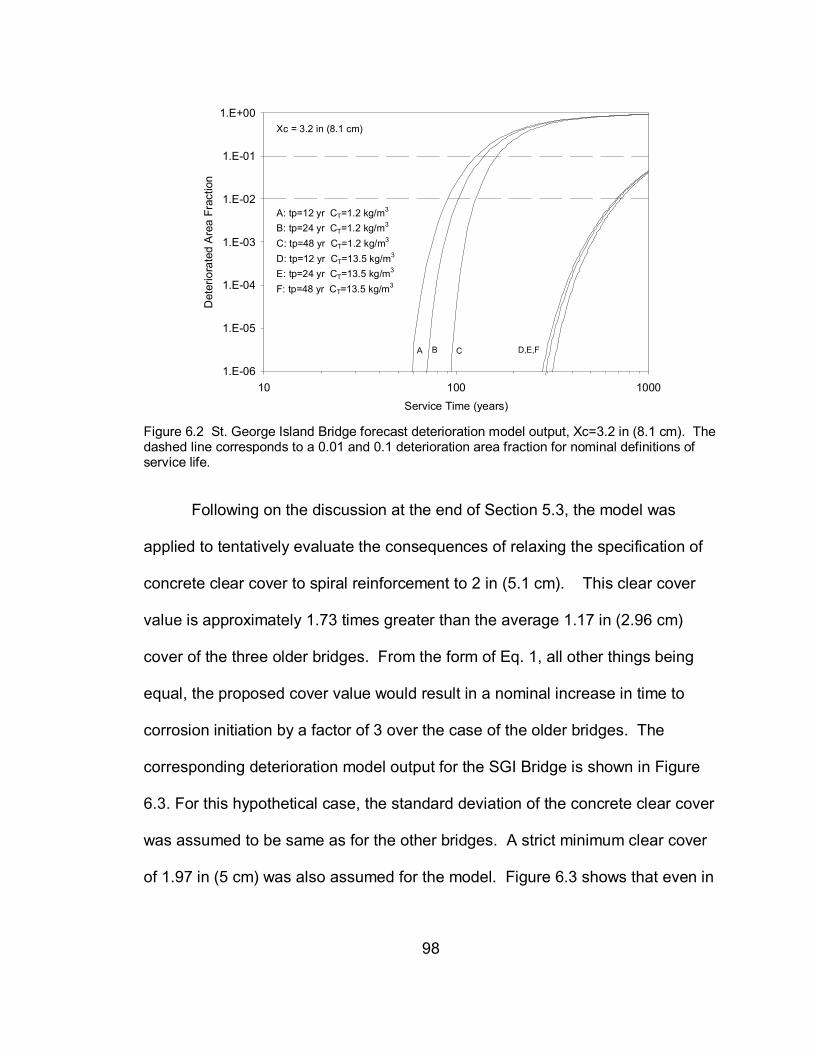
98
1.E-06
1.E-05
1.E-04
1.E-03
1.E-02
1.E-01
1.E+00
10 100 1000Service Time (years)
Det
erio
rate
d A
rea
Frac
tion
Xc = 3.2 in (8.1 cm)
A B C D,E,F
A: tp=12 yr CT=1.2 kg/m3
B: tp=24 yr CT=1.2 kg/m3
C: tp=48 yr CT=1.2 kg/m3
D: tp=12 yr CT=13.5 kg/m3
E: tp=24 yr CT=13.5 kg/m3
F: tp=48 yr CT=13.5 kg/m3
Figure 6.2 St. George Island Bridge forecast deterioration model output, Xc=3.2 in (8.1 cm). The dashed line corresponds to a 0.01 and 0.1 deterioration area fraction for nominal definitions of service life.
Following on the discussion at the end of Section 5.3, the model was
applied to tentatively evaluate the consequences of relaxing the specification of
concrete clear cover to spiral reinforcement to 2 in (5.1 cm). This clear cover
value is approximately 1.73 times greater than the average 1.17 in (2.96 cm)
cover of the three older bridges. From the form of Eq. 1, all other things being
equal, the proposed cover value would result in a nominal increase in time to
corrosion initiation by a factor of 3 over the case of the older bridges. The
corresponding deterioration model output for the SGI Bridge is shown in Figure
6.3. For this hypothetical case, the standard deviation of the concrete clear cover
was assumed to be same as for the other bridges. A strict minimum clear cover
of 1.97 in (5 cm) was also assumed for the model. Figure 6.3 shows that even in

99
this reduced clear cover case the projected performance is still considerably
improved over that for the older structures, and that there is good prognosis for
meeting a 75 year service life goal under likely parameter combinations.
1.E-06
1.E-05
1.E-04
1.E-03
1.E-02
1.E-01
1.E+00
10 100 1000Service Time (years)
Det
erio
rate
d A
rea
Frac
tion
Xc = 2 in (5.1 cm)
A B C D,E F
A: tp=12 yr CT=1.2 kg/m3
B: tp=24 yr CT=1.2 kg/m3
C: tp=48 yr CT=1.2 kg/m3
D: tp=12 yr CT=13.5 kg/m3
E: tp=24 yr CT=13.5 kg/m3
F: tp=48 yr CT=13.5 kg/m3
Figure 6.3 St. George Island Bridge forecast deterioration model output, Xc = 2 in (5.1cm). The dashed line corresponds to a 0.01 and 0.1 deterioration area fraction for nominal definitions of service life.
It is cautioned that the model projections are subjected to large
uncertainty, as evidenced by the broad range of possible alternative outcomes
shown in figures 6.1 to 6.3 and as detailed in Ref. [2,45]. Thus, the model
outputs should be viewed as an aid in examining relative consequences of
possible alternative design scenarios and not as the outcome of absolute
prediction tools. With that caveat, the results are encouraging of further
consideration of the adoption of a relaxed cover guideline for this type of pile.

100
That consideration should be made in the context of the other structural and
economical issues determining performance of concrete cylinder piles.
The previous calculations are exploratory in nature. Future analysis of the
corrosion performance of concrete cylinder piles should include consideration of
the increase of CT of still passive regions of reinforcing steel induced by prior
corrosion of nearby steel [47]. Other modeling improvements should include
quantifying oxygen transport through the clear cover as a determining factor of
the corrosion propagation time and the possible effect of local concrete
deficiencies (e.g. cracks) on accelerating onset of corrosion.
101
7 Conclusions 1. Examination of three 40 year old cylinder pile bridges (Hathaway,
Pensacola Bay, and Brooks) indicated in general minor or no corrosion
distress of the spiral reinforcement or strand in the piles, in spite of small
clear concrete cover values of ~ 0.4 to 1.5 in (10 to 39 mm). Some corrosion
noted near pile caps as well, or the presence of topical patches, appear to
reflect early mechanical damage unrelated to normal exposure. Similar
good corrosion performance was found in a previous FDOT examination of
the Escambia Bay bridges, also built with cylinder piles.
2. The rate of chloride ion penetration in the 40-year old bridges, as indicated
by the apparent diffusion coefficient, had a median value of only ~0.005
in2/y (~1x10-13 m2/s), lower than that of the best performing modern FDOT
class V concretes specified for aggressive marine service. High electrical
resistivity and moderate internal humidity of the concrete were consistent
with the slow chloride transport observed. These properties appear to have
resulted from high cement content, low water to cement ratio, and good
compaction inherent to the pile fabrication process.

102
3. Thin (< 0.013 in (<0.3 mm)) concrete cracks were observed in some of the
piles in the 40-year old bridges. However, unlike behavior recently noted in
other FDOT bridges with conventional concrete substructure, preferential
chloride penetration along the crack was less pronounced.
4. Tests of the early performance (~2 years) of new cylinder piles built to
current FDOT guidelines (thicker cover, pozzolanic admixtures) for the
recently constructed Saint George Island Bridge also show also excellent
average resistance to chloride penetration. No reinforcement corrosion was
identified at this early bridge age. Thin cracks were observed here as well,
together with evidence of enhanced chloride penetration at shallow depths.
5. The survey information from the older bridges was used to estimate a lower
bound value for the chloride threshold for corrosion initiation in the order of
~2 pcy (1.2 kg/m3). This bound is consistent with the reported high cement
content of the concrete and the observation of pH values in extracted cores
approaching normally expected values. Effective threshold values could be
significantly higher. The concrete in the new bridge piles had a desirably
high pore water pH despite its high pozzolanic content, suggesting that
chloride threshold values in the new material will be in the normal range.

103
6. Simplified corrosion damage forecasts for the older and new piles suggest
that very long service lives with minimum corrosion-related maintenance are
possible. The projections suggest also that if concrete quality could be
sufficiently assured, moderate relaxation of absolute minimum cover
requirements for new construction could be made without severely
compromising the requirements for minimum corrosion damage within a 75-
year service life goal.

104
References 1. Ahn, Woosuk, Darrel Joque and Arnfinn Rusten. “A Study on Corrosion
Resistance of Prestressed Marine Concrete Piles.” Corrosion2003, San Diego, CA. Paper no. 03239. Mar. 16-20, 2003.
2. Sagüés, A.A., W. Scannel and F.W. Soh. “Development of a Deterioration
Model to Project Future Concrete Reinforcement Corrosion in a Dual Marine Bridge” in Proc. International Conference on Corrosion and Rehabilitation of Reinforced Concrete Structures, Orlando, FL, Dec. 7-11, 1998, CD ROM Publication No. FHWA-SA-99-014, Federal Highway Administration, 1998.
3. Sagüés, A.A. and S.C. Kranc. “Corrosion Forecasting for 75-Year Durability
Design of Reinforced Concrete.” Final Report to Florida D.O.T. WPI 0510805, Contract No. BA-502. December, 2001.
4. FDOT Structures Design Guidelines, Topic No. 625-020-150c, Chapter 2:
Site and Material Durability Criteria, Effective: July 1, 1998, Revised: January 1, 1999.
5. Graves, A.S., and W.F. Knight letter to T. Malerk, FDOT, September 21,
1999. 6. Buslov, V. B., J.P. Gould, and R.C. Koch. “The Precast Pier.” Civil
Engineering. Vol. 58, no.12. 1988. 7. Cook, J.R. “Severe Foundation Problem Solved Using Long Precast
Prestressed Concrete Piles.” PCI Journal. 1974. 8. Bayshore Concrete Products. Bayshore Concrete Products private
publication. BC-15. 9. Fuller, F.M. “Raymond Cylinder Piles Meet The Challenge of High-Load
Tests.” Foundation Facts. Houston: Raymond International Builders, Inc. 1979.
10. Snow, R. K. “Performance of the Raymond Cylinder Pile.” Foundation Facts.
Houston: Raymond International Builders, Inc. 1983.

105
11. Brown, D.D. “Elba Island Bridge Construction.” Foundation Facts. Houston: Raymond International Builders, Inc. 1974.
12. LeMieux, G.F. “Underwater Inspection of the World’s Longest Overall
Bridges, Part I.” Concrete International. 1998. 13. Avent, R.R. and D.J. Mukal. “Investigation of Cracks in Cylindrical Spun-
Cast Concrete Piles in a Marine Environment.” Final Report for Louisiana Transportation Research Center. 1998.
14. Garder, D. R. “Inspection of Substructure of the Chesapeake Bay Bridge-
Tunnel above and below the Waterline.” Transportation Research Record. 15. Gerwick, B.C. “International Experience in the Performance of Marine
Concrete.” Concrete International. 1990. 16. Florida Department of Transportation. Bridge Management System.
Comprehensive Inventory Data Report. Bridge No. 460012. 2001. 17. Florida Department of Transportation. Bridge Management System.
Comprehensive Inventory Data Report. Bridge No. 48035. 2000. 18. Florida Department of Transportation. Bridge Management System.
Comprehensive Inventory Data Report. Bridge No. 570034. 2001. 19. Sagüés, A.A., et al. “Carbonation in Concrete and Effect on Steel
Corrosion.” Final Report to Florida D.O.T. WPI. No. 0510685. June 1997. 20. Carlsin, J.E. “Chloride Profile Based on Sampling of Dust by Hand Drill with
Vacuum Attachment.” in Proc. of the Nordic Seminar in Lund. February 1-2, 1995.
21. Concrete, Hardened: Accelerated Chloride Penetration. Nortest Method NT
Build 443, (1995). 22. Florida Method of Test for Determining Low-Levels of Chloride in Concrete
and Raw Materials. FM-5-516 (2000). 23. Berke, N.S. and M.C. Hicks. “Predicting Chloride Profiles in Concrete.”
Corrosion. Vol.50, no. 3. Pp. 234-239. 1994. 24. Morris, W., E.I. Moreno, and A.A. Sagüés. “Practical Evaluation of
Resistivity of Concrete in Test Cylinders Using a Wenner Array Probe.” Cement and Concrete Research. Vol.26, no.12. p.1779-87. 1996.

106
25. Standard Test Method for Density, Absorption, and Voids in Hardened
Concrete. ASTM C642 (1997). 26. Sagüés, A.A., E.I. Moreno and C. Andrade. “Evolution of pH During In-Situ
Leaching in Small Concrete Cavities”, Cement and Concrete Research, Vol. 27, p.1747, 1997.
27. Half-Cell Potentials of Uncoated Reinforcing Steel in Concrete. ASTM
C876. (1991). 28. Carino, Nicholas J. “Nondestructive Techniques to Investigate Corrosion
Status in Concrete Structures.” Journal of Performance of Constructed Facilities. Vol.13, no.3. p.96-106. 1999.
29. Emerson, M. “Mechanisms of Water Absorbtion by Concrete.” In Protection
of Concrete. London: E&F.N. Spon, 1990. p.689-700 30. Berke, N.S. and M.C. Hicks. “The Life Cycle of Reinforced Concrete Decks
and Marine Piles Using Laboratory Diffusion and Corrosion Data.” In Corrosion Forms and Control for Infrastructure, ed. V. Chaker. ASTM STP1137, American Society for Testing and Materials, Philadelphia, 1992.
31. Safiuddin, Md. and Nataliya Hearn. “Comparison of ASTM Saturation
Techniques for Measuring Permeable Porosity of Concrete.” Cement and Concrete Research. Vol.35. no.5. p.1008-13. 2004.
32. Sagüés, A.A. and S.C. Kranc. “Advanced Analysis of Chloride Ion
Penetration Profiles in Marine Substructure.” Final Report to Florida D.O.T., Contract No. BB-880, January 2003.
33. Bamforth, P. “Improving the Durability of Concrete by the Use of Mineral
Additives.” Paper presented at Concrete Durability in the Arabian Gulf, Bahrain Society of Engineers, March 19-21, 1995.
34. Sagüés, A.A. “Corrosion of Epoxy Coated Rebar in Florida Bridge.” Final
Report to Florida D.O.T., WPI No. 0510603. May, 1994. 35. Sagüés, A.A. et al. “Corrosion Resistance and Service Life of Drainage
Culverts.” Final Report to Florida D.O.T., WPI NO. 0510756. August 2001. 36. Rodriguez, O. and R. Hooton. “Influence of Cracks on Chloride Ingress into
Concrete.” ACI Materials Journal. Vol.100, no.2. p.120-6. 2003.
107
37. Caseres, Leonardo. “In-Situ Leaching for Determination of Chloride and pH in Concrete and Mortar Pore Water.” Master Thesis. University of South Florida. 2002.
38. Nilsson, L.O., “Moisture in Marine Concrete Structures.” In Durability of
Concrete in Saline Environment. Lund: Cementa AB, 1996. 39. Li, Lianfang. “Chloride Corrosion Threshold of Reinforcing Steel in Alkaline
Solutions- Cyclic Polarization Behavior.” Corrosion, Vol. 58, p.305. 2002. 40. Presuel-Moreno, F.J., A.A. Sagüés, and S.C. Kranc. “Steel Activation in
Concrete Following Interruption of Long Term Cathodic Polarization.” Corrosion. Vol. 61, p. 428-436. 2005.
41. Li, Lianfang. “Chloride Corrosion Threshold of Reinforcing Steel in Alkaline
Solutions - Open-circuit Immersion Tests." Corrosion. Vol. 57, p.19, 2001. 42. Sagüés A.A., M.A. Pech-Canul and Shahid Al-Mansur. “Corrosion Macrocell
Behavior of Reinforcing Steel in Partially Submerged Concrete Columns”, Corrosion Science, Vol.45, p.7. 2003.
43. Torres-Acosta, A.A. and A.A. Sagüés. “Concrete Cracking by Localized
Steel Corrosion- Geometric Effects.” ACI Materials Journal. Vol. 101, no.6. p.501-507. 2004.
44. Diamond, Sidney, S. Sahu and N. Thaulow. “Reaction Products of
Densified Silica Fume Agglomerates in Concrete.” Cement and Concrete Research. Vol.34, p.1625-32. 2004.
45. Sagüés, A.A. “Modeling the Effects of Corrosion on the Lifetime of Extended
Reinforced Concrete Structures.” Corrosion. Vol.59, no. 10. p.854-866. 2003.
46. Bentur, A, S. Diamond and N.S. Berke. Steel Corrosion in Concrete.
London: E&FN Spon, 1997. 47. Sagüés, A.A. and S.C. Kranc. “Model for a Quantitative Corrosion Damage
Function for Reinforced Concrete Marine Substructure.” in Rehabilitation of Corrosion Damaged Infrastructure. Chapter IV Modeling, Methods, Techniques and Technologies. Houston:NACE International. ISBN-970-92095-0-7. p.268-76. 1998.

108
48. Glass, G.K. and N.R. Buenfeld. “The Presentation of the Chloride Threshold Level for Corrosion of Steel in Concrete.” Corrosion Science. Vol.39, no. 5. p.1001-13. 1997.

109
Appendices

110
Tabl
e A
1a H
atha
way
Brid
ge S
urve
y 12
/17/
02
Bent
G
ener
al R
emar
ks
Insp
ectio
n N
otes
Po
tent
ial
Res
istiv
ity
Con
tinui
ty
IRH
C
ore
Extra
ctio
n 1
Abut
men
t. Be
gin
brid
ge.
2 Be
gin
pile
ben
t. F
our 5
4" c
ylin
der
pile
s.
3 H
-3-2
rust
sta
in n
ear t
op o
f pile
.
5 H
-5-3
rust
sta
in n
ear t
op o
f pile
. H
-5-
4 re
pair
patc
h ne
ar to
p of
pile
.
6 H
-6-2
rust
sta
in a
t top
of p
ile.
H-6
-3
rust
sta
in.
7 H
-7-2
min
or ru
st s
tain
nea
r top
of p
ile.
H-7
-4 ru
st s
tain
nea
r top
of p
ile.
8 H
-8-2
rust
sta
in in
spl
ash
zone
.
H-8
-2 ru
st s
tain
on
east
sid
e of
pi
le in
spl
ash
zone
. R
emov
ed
dela
min
ated
con
cret
e, b
ut h
oop
wire
was
not
obs
erve
d.
H-8
-2
H-8
-2
H-8
-2
H-8
-2
H-8
-2
9 H
-9-1
cra
ck n
ear t
op o
f pile
. H
-9-4
ru
st s
tain
at i
nter
med
iate
ele
vatio
n.
11
H-1
1-1
dela
min
ated
con
cret
e.
13
H-1
3-4
rust
sta
in n
ear t
op o
f pile
.
14
H
-14-
1 re
pair
patc
h ne
ar to
p of
pile
.
15-
28
colu
mn
pier
s H
-16
rust
sta
in o
n fo
oter
. H
-27
rust
sta
in o
n fo
oter
. H
-28
seve
re ru
st s
tain
ing
on fo
oter
.
29
Pi
le b
ent.
Fou
r 54"
cyl
inde
r pile
s. H
-29
-3 c
rack
.
H
-29-
3 cr
ack
0.3m
m w
idth
. H
-29-
3 H
-29-
3 H
-29-
3 H
-29-
3 H
-29-
3
30
H-3
0-3
crac
k. H
-30-
4 ru
st s
tain
in
spla
sh z
one.
31
H-3
1-2
spal
l in
tidal
zon
e. H
-31-
3 sp
all a
t int
erm
edia
te e
leva
tion.
32
H-3
2-2
rust
sta
in a
t int
erm
edia
te
elev
atio
n.
33
H-3
3-1
crac
k re
pair.
H-3
3-3
rust
sta
in
in s
plas
h zo
ne.
H-3
3-4
rust
sta
in in
sp
lash
zon
e.
Appendix I Bridge Survey

111
Tabl
e A
1b P
ensa
cola
Bay
Brid
ge S
urve
y 3/
10/0
3–3/
11/0
3
G
ener
al re
mar
ks
Insp
ectio
n N
otes
Po
tent
ial
Res
istiv
ity
Con
tinui
ty
IRH
C
ore
Extra
ctio
n
1 Ab
utm
ent.
Beg
in B
ridge
.
2 Be
gin
pile
ben
t. F
our 5
4” p
iles.
P-2
-2 ru
st s
tain
on
wes
t fac
e. P
-2-3
cra
ck b
elow
pile
cap
.
3 P-
3-1
crac
k be
low
pile
cap
. P-
3-2
rust
sta
in o
n ea
st fa
ce a
bove
tida
l zon
e.
4 P-
4-1
crac
k. P
-4-3
cra
ck b
elow
pile
cap
. P-
4-1
verti
cal t
hin
crac
k 0.
3mm
wid
th.
P-4-
1
P-4-
1
P-4-
1
5 P-
5-1
rust
sta
in o
n no
rth fa
ce a
bove
tida
l zon
e. P
-5-
3 ru
st s
tain
on
east
face
at t
idal
zon
e.
P-5-
3 la
rge
dela
min
ated
ar
ea ~
63in
2 .
6 P-
6-1
rust
sta
in o
n w
est f
ace.
P-6
-3 ru
st s
tain
on
north
face
. P-
6-4
rust
sta
in o
n no
rth fa
ce a
t tid
al
zone
.
8 P-
8-1
rust
sta
in o
n no
rthea
st fa
ce.
P-8-
3 ru
st s
tain
on
nor
th fa
ce.
P-8-
4 ru
st s
tain
on
wes
t fac
e at
tida
l zo
ne.
9 P-
9-1
crac
k on
nor
th fa
ce.
P-9-
4 ru
st s
tain
on
sout
h fa
ce.
10
P-10
-1 ru
st s
tain
on
sout
h fa
ce
12
P-12
-2 ru
st s
tain
on
wes
t and
eas
t fac
e.
13
P-13
-2 c
rack
on
sout
h fa
ce.
14
P-14
-3 ru
st s
tain
on
sout
h fa
ce.
P-14
-4 ru
st s
tain
on
eas
t fac
e.
15
P-15
-2 ru
st s
tain
on
sout
h fa
ce.
16
Tow
er b
ent.
Six
54”
pile
s. P
-16-
2 ru
st s
tain
on
sout
h fa
ce.
P-16
-3 ru
st s
tain
on
wes
t fac
e. P
-16-
6
18
P-18
-1 ru
st s
tain
on
wes
t fac
e. P
-18-
2 ru
st s
tain
on
wes
t fac
e.
19
P-19
-2 ru
st s
tain
on
sout
h fa
ce.
P-19
-3 ru
st s
tain
on
wes
t fac
e. P
-19-
4 ru
st s
tain
on
north
face
.
Appendix I (continued)

112
Tabl
e A
1 b
(con
tinue
d)
Bent
G
ener
al R
emar
ks
Insp
ectio
n N
otes
Po
tent
ial
Res
istiv
ity
Con
tinui
ty
IRH
C
ore
Extra
ctio
n
21
P-21
-1 p
ossi
bly
crac
k. P
-21-
3 ru
st s
tain
on
wes
t fa
ce.
23
P-23
-1 ru
st s
tain
on
east
face
.
24
P-24
-1 ru
st s
tain
on
north
east
and
sou
thea
st fa
ce.
P-24
-1 d
elam
inat
ed
conc
rete
rem
oved
~4i
n2 .
25
P-25
-3 ru
st s
tain
on
sout
h fa
ce.
P-25
-4 ru
st s
tain
on
nor
th fa
ce.
26
P-26
-1 ru
st s
tain
on
north
face
.
27
P-27
-3 ru
st s
tain
on
east
face
. P-
27-4
rust
sta
in o
n w
est f
ace.
29
P-29
-2 ru
st s
tain
on
eas
t fac
e.
30
P-30
-3 c
rack
nea
r pile
cap
. P-
30-4
rust
sta
in o
n w
est f
ace
31
Tow
er b
ent.
32
P-32
-1 ru
st s
tain
on
sout
h fa
ce.
33
P-33
-3 ru
st s
tain
on
wes
t fac
e.
34
P-34
-4 ru
st s
tain
on
sout
h fa
ce b
elow
pile
cap
.
35
P-
35-1
rust
sta
in o
n ea
st fa
ce.
37
P-37
-1 ru
st s
tain
on
sout
h fa
ce.
38
P-38
-2 ru
st s
tain
on
north
face
.
40
P-
40-1
rust
sta
in o
n w
est f
ace.
42
P-
42-1
rust
sta
in o
n w
est f
ace.
43
P-
43-1
rust
sta
in o
n ea
st fa
ce.
46
Tow
er b
ent.
P-4
6-1
rust
sta
in o
n ea
st a
nd w
est
face
.
48
P-48
-4 ru
st s
tain
on
sout
h fa
ce.
50
P-50
-3 ru
st s
tain
on
W fa
ce.
51
P-51
-1 ru
st s
tain
on
east
face
. P-
51-2
rust
sta
in o
n N
E fa
ce a
t tid
al z
one.
52
P-52
-2 ru
st s
tain
on
N fa
ce a
t tid
al z
one.
Appendix I (continued)

113
Tabl
e A
1 b
(con
tinue
d)
Bent
G
ener
al re
mar
ks
Insp
ectio
n N
otes
Po
tent
ial
Res
istiv
ity
Con
tinui
ty
IRH
C
ore
Extra
ctio
n 53
P-
53-1
rust
sta
in o
n N
E an
d S
face
s.
55
P-55
-2 ru
st s
tain
on
W fa
ce a
t tid
al z
one.
P-5
5-4
rust
sta
in o
n W
face
.
56
P-56
-1 ru
st s
tain
on
E an
d W
face
.
57
P-57
-4 ru
st s
tain
on
S fa
ce.
58
P-58
-1 ru
st s
tain
on
S fa
ce.
59
P-59
-3 r
ust s
tain
on
S fa
ce.
P-59
-4 ru
st s
tain
on
W fa
ce.
60
P-60
-2 ru
st s
tain
on
wes
t fac
e.
61
Tow
er b
ent.
63
P-63
-1 ru
st s
tain
on
E fa
ce n
ear t
op.
64
P-64
-2 c
rack
nea
r pile
top.
65
P-
65-1
rust
sta
in o
n E
face
.
66
P-
66-1
rust
sta
in o
n E
face
.
67
P-
67-2
cra
ck n
ear p
ile to
p.
69
P-69
-3 ru
st s
tain
on
NW fa
ce.
71
P-70
-3 ru
st s
tain
on
NE
face
,
74
P-
74-4
cra
ck.
76
Tow
er b
ent.
P-7
6-4
rust
sta
in o
n N
face
.
77
P-
77-1
rust
sta
in o
n E
face
.
79
P-79
-1 s
ever
e ru
stin
g on
E fa
ce.
P-79
-1 ru
st s
tain
nea
r pi
le c
ap. N
o in
dica
tion
of
dela
min
atio
n.
80
P-80
-4 p
op-o
ut o
n E
face
.
81
P-
81-4
rust
sta
in o
n E
face
at t
idal
zon
e.
83
P-83
-1 ru
st s
tain
on
E fa
ce n
ear p
ile to
p.
84
P-84
-1 ru
st s
tain
on
N fa
ce.
P-84
-3 ru
st s
tain
on
W
face
. P-
84-4
rust
sta
in W
face
.
86
P-86
-4 ru
st s
tain
on
W fa
ce n
ear t
op.
Appendix I (continued)

114
Tabl
e A
1 b
(con
tinue
d)
Bent
G
ener
al R
emar
ks
Insp
ectio
n N
otes
Po
tent
ial
Res
istiv
ity
Con
tinui
ty
IRH
C
ore
Extra
ctio
n 87
P-
87-4
pop
-out
on
E fa
ce.
88
P-88
-3 ru
st s
tain
on
W fa
ce.
91
Tow
er b
ent.
94
P-94
-2 p
opou
t. P
-94-
4 cr
ack.
96
P-
96-2
rust
sta
in o
n N
face
.
98
P-98
-3 ru
st s
tain
on
W fa
ce n
ear t
op.
99
P-99
-1 ru
st s
tain
on
E fa
ce n
ear t
op.
P-99
-3 ru
st
stai
n on
W fa
ce n
ear t
op.
100
P-10
0-1
popo
ut o
n S
face
.
101
P-10
1-1
rust
sta
in o
n E
face
nea
r top
. P-
101-
2 ru
st
stai
n on
SE
face
nea
r top
.
102
P-10
2-2
rust
sta
in o
n S
face
nea
r top
.
10
3 P-
103-
1 ru
st s
tin o
n E
face
nea
r top
.
10
4 P-
104-
1 ru
st s
tain
on
E fa
ce n
ear t
op.
106
Tow
er b
ent.
P-10
6-4
rust
sta
in o
n SW
face
by
top.
107
P-10
7-1
rust
sta
in o
n ea
st fa
ce.
P-10
7-2
rust
sta
in
on S
face
. P-
107-
3 ru
st s
tain
on
N fa
ce.
108
P-10
8-2
crac
k ne
ar to
p of
pile
.
109
P-10
9-1
rust
sta
in o
n E
face
. P-
109-
4 ru
st s
tain
on
N a
nd W
face
.
110
P-11
0-2
rust
sta
in o
n E
face
. P-
110-
2 sp
iral w
ire
corro
ded
in ru
st s
tain
14
”AH
T P1
10-2
P1
10-
2 P1
10-2
112-
145
Col
umn
pier
s.
146
P-14
6-4
rust
sta
in a
t W fa
ce in
tida
l zon
e
14
7 P-
147-
2 ru
st s
tain
on
W fa
ce n
ear t
op.
148
P-14
8-1
rust
sta
in o
n E
face
in ti
dal z
one.
P-1
48-3
re
pair
patc
h on
W fa
ce.
149
P-14
9-1
rust
sta
in o
n E
and
S fa
ce.
P-14
9-2
rust
st
ain
on S
face
. P-
149-
3 ru
st s
tain
on
S fa
ce.
P-14
9-2
two
larg
e de
lam
, ~3
0 an
d 42
in2 .
Wire
ap
pear
s co
rrode
d.
P149
-2
P1
49-2
Appendix I (continued)

115
Tabl
e A
1 b
(con
tinue
d)
Bent
G
ener
al R
emar
ks
Insp
ectio
n N
otes
Po
tent
ial
Res
istiv
ity
Con
tinui
ty
IRH
C
ore
Extra
ctio
n
150
P-15
0-1
rust
sta
in o
n E
face
in in
term
ed. E
leva
tion.
P-
150-
3 ru
st s
tain
in W
face
.
151
Tow
er b
ent.
P-1
52-1
rust
sta
in o
n W
face
. P-
152-
6 ru
st s
tain
on
S fa
ce.
152
P-15
2-1
rust
sta
in o
n W
face
. P-
152-
2 re
pair
patc
h on
SW
face
.
153
P-15
3-2
repa
ir pa
tch
on N
face
, rus
t sta
in o
n W
fa
ce.
154
P-15
4-1
repa
ir pa
tch
on E
face
. P-
154-
2 re
pair
patc
h on
E fa
ce.
P-15
4-4
repa
ir pa
tch
on W
face
.
155
P-15
5-1
repa
ir pa
tch
on E
face
.
156
P-15
6-1
repa
ir pa
tch
on E
face
inte
rmed
iate
el
evat
ion,
rust
sta
in o
n S
face
nea
r pile
top.
P-1
56-
2 ru
st s
tain
on
N fa
ce.
157
P-15
7-1
rust
sta
in o
n N
and
W fa
ce.
P-15
7-3
repa
ir pa
tch
on S
face
.
158
P-15
8-1
rust
sta
in o
n N
face
. D
elam
inat
ed
conc
rete
rem
oved
~12
in2 .
160
P-16
0-1
rust
sta
in o
n E
face
. P-
160-
2 ru
st s
tain
on
W fa
ce.
P-16
0-4
repa
ir pa
tch
on W
face
.
161
P-16
1-1
rust
sta
in o
n S
face
at t
idal
zon
e. P
-161
-3
rust
sta
in o
n S
face
nea
r top
.
162
P-16
2-3
repa
ir pa
tch.
P-1
62-4
repa
ir pa
tch
on W
fa
ce.
163
P-16
3-1
repa
ir pa
tch
on E
face
nea
r top
. P-
163-
3 re
pair
patc
h. P
-163
-4 c
rack
.
164
P-16
4-1
repa
ir pa
tch
on N
face
, rus
t sta
in o
n E
face
. P-
164-
2 ru
st s
tain
on
S fa
ce.
P-16
4-4
repa
ir pa
tch
on N
face
.
165
P-16
5-1
repa
ir pa
tch
on S
E fa
ce n
ear t
op.
P-16
5-4
repa
ir pa
tch
on W
face
.
166
Tow
er b
ent.
P-1
66-4
rust
sta
in o
n N
and
E fa
ce.
Appendix I (continued)

116
Tabl
e A
1 b
(con
tinue
d)
Bent
G
ener
al R
emar
ks
Insp
ectio
n N
otes
Po
tent
ial
Res
istiv
ity
Con
tinui
ty
IRH
C
ore
Extra
ctio
n
167
P-16
7-1
rust
sta
in o
n N
E a
nd S
face
. P-
167-
4 ru
st
stai
n on
W fa
ce c
lose
to p
atch
.
P-16
7-1
ham
mer
so
undi
ng d
oes
not
indi
cate
del
amin
atio
n on
N
face
168
P-16
8-3
rust
sta
in o
n E
face
. P-
168-
4 ru
st s
tain
on
E
and
W fa
ce.
169
P-16
9-2
rust
sta
in o
n N
face
. P-
169-
3 ru
st s
tain
on
N fa
ce.
P-16
9-4
rust
sta
in o
n N
E fa
ce.
170
P-17
0-1
rust
sta
in o
n S
face
nea
r top
.
171
P-17
1-1
rust
sta
in o
n N
face
. P-
171-
3 ru
st s
tain
on
S fa
ce.
P-17
1-4
rust
sta
in o
n N
E fa
ce.
172
P-17
2-1
rust
sta
in o
n E
and
N fa
ce.
P-17
2-4
rust
st
ain
on n
orth
face
und
er p
atch
.
173
P-17
3-2
rust
sta
in o
n E
face
und
er p
atch
. P-
173-
3 ru
st s
tain
on
N fa
ce.
P-17
3-4
rust
sta
in o
n W
face
un
der p
atch
.
174
P-17
4-1
rust
sta
in o
n S
face
. P-
174-
2 ru
st s
tain
on
S fa
ce.
P-17
4-3
repa
ir pa
tch
on E
face
. P-
174-
4 re
pair
patc
h on
E fa
ce.
175
P-17
5-1
rust
sta
in o
n E
face
a in
term
ed. E
lev,
rust
st
ain
on W
face
. P-
175-
3 ru
st s
tain
on
E fa
ce.
P-17
5-4
rust
sta
in o
n N
face
.
176
P-17
6-2
rust
sta
in o
n E
and
W fa
ce.
P-17
4-4
rust
st
ain
on W
face
.
177
P-17
7-1
rust
sta
in o
n E
and
S fa
ce.
P-17
7-3
rust
st
ain
on N
and
E fa
ce n
ear t
op.
P-17
7-4
rust
sta
in
on W
face
und
er p
atch
.
178
p-17
8-2
repa
ir pa
tch
in in
term
ed. Z
one.
P-1
78-4
ru
st b
etw
een
patc
hes.
180
P-18
0-1
rust
sta
in o
n E
face
. P-
180-
3 ru
st s
tain
on
E an
d W
face
.
181
Tow
er b
ent.
P-18
1-1
repa
ir pa
tch
on E
face
at
inte
rmed
leve
l.
182
P-18
2-2
repa
ir pa
tch.
P-1
82-4
repa
ir pa
tch
W fa
ce
inte
rmed
. Lev
el.
Appendix I (continued)

117
Tabl
e A
1 b
(con
tinue
d)
Bent
G
ener
al R
emar
ks
Insp
ectio
n N
otes
Po
tent
ial
Res
istiv
ity
Con
tinui
ty
IRH
C
ore
Extra
ctio
n
183
P-18
3-3
repa
ir pa
tch
on N
face
. P-
184-
4 ru
st s
tain
on
N fa
ce u
nder
pat
ch.
P-18
3-4
rust
sta
in o
n N
fa
ce.
184
P-18
4-1
rust
sta
in o
n E
face
und
er p
atch
. P-
184-
2 ru
st s
tain
on
W fa
ce.
P-18
4-3
rust
sta
in o
n N
face
un
der p
atch
. P-
184-
4 ru
st s
tain
on
N fa
ce u
nder
pa
tch.
185
P-18
5-2
rust
sta
in o
n E
face
und
er p
atch
. P-
185-
4 ru
st s
tain
on
N a
nd W
face
.
P185
-4 W
face
spa
ll ~3
2”AH
T, e
xpos
ed w
ire
corro
ded.
P18
5-4
N fa
ce
dela
min
ated
~6i
n2 .
P185
-4
P1
85-4
186
P-18
6-1
rust
sta
in o
n E
face
. P-
186-
4 ru
st s
tain
on
S fa
ce.
187
P-18
7-1
repa
ir pa
tch
on E
face
. P-
187-
2 cr
ack
on
repa
ir pa
tch.
P-1
87-4
rust
sta
in o
n N
W a
nd S
fa
ce.
188
P-18
8-1
patc
h on
SE
face
. P-
188-
4 ru
st s
tain
on
W
face
.
189
P-18
9-1
rust
sta
in o
n SE
face
. P-
189-
3 pa
tch
on N
fa
ce.
P-18
9-5
rust
sta
in o
n W
S fa
ce u
nder
pat
ch.
190
P-19
0-1
patc
h on
S fa
ce.
191
P-19
1-1
seve
re ru
st s
tain
on
NE
face
.
192
P-19
2-1
rust
sta
in.
P-19
2-3
rust
sta
in o
n E
face
.
P-19
2-1
NE
face
ha
mm
er s
ound
ing
does
no
t ind
icat
e de
lam
inat
ion.
193
P-19
3-1
rust
sta
in o
n E
face
. P-
193-
2 re
paire
d cr
ack.
194
P-19
4-1
rust
sta
in o
n SW
face
. P-
194-
2 ru
st s
tain
on
E fa
ce a
t low
ele
v.
195
P-19
5-2
rust
sta
in o
n E
face
at i
nter
med
. Ele
v.
196
Tow
er b
ent.
P19
6-1
seve
re ru
st s
tain
on
E fa
ce.
P196
-2 ru
st s
tain
on
N fa
ce, r
ust s
tain
on
W fa
ce
unde
r pat
ch.
P196
-6 ru
st s
tain
on
E fa
ce.
P196
-1 E
face
ham
mer
so
undi
ng d
oes
not
indi
cate
del
am.
Expo
sed
rein
forc
emen
t rus
t-fre
e.
P196
-1
Appendix I (continued)

118
Tabl
e A
1 b
(con
tinue
d)
Bent
G
ener
al R
emar
ks
Insp
ectio
n N
otes
Po
tent
ial
Res
istiv
ity
Con
tinui
ty
IRH
C
ore
Extra
ctio
n 19
7 P-
197-
4 ru
st s
tain
on
W fa
ce.
198
P-19
8-1
rust
on
N W
S fa
ces.
P-1
98-3
pat
ch o
n N
fa
ce.
P-19
8-4
rust
sta
in b
etw
. pat
ches
.
199
P-19
9-1
rust
sta
in o
n E
face
, pat
ch.
P-19
9-2
rust
st
ain
on N
face
. P-
199-
3 pa
tch
on W
face
.
200
P-20
0-1
rust
sta
in o
n E
face
. P-
200-
4 pa
tch
on E
fa
ce
201
P-20
1-3
rust
sta
in o
n N
face
. P-
201-
4 ru
st s
tain
on
N fa
ce.
202
P-20
2-1
patc
h on
E fa
ce.
P-20
2-4
rust
sta
in o
n E
face
bel
ow p
atch
.
204
P-20
4-1
rust
sta
in o
n S
face
.
20
5 P-
205-
4 pa
tch
on N
E fa
ce.
206
P-20
6-1
patc
h on
top
of E
face
.
207
P-20
7-1
rust
sta
in o
n W
S fa
ce.
P-20
7-3
patc
h on
N
E fa
ce.
209
P-20
9-2
patc
h on
E fa
ce.
210
P-21
0-1
rust
sta
in o
n E
face
. P-
210-
4 ru
st s
tain
on
W fa
ce.
211
Tow
er b
ent.
P-2
11-2
rust
sta
in o
n N
E fa
ce.
P-21
1-3
crac
k in
N fa
ce.
212
P-21
2-2
patc
h on
E fa
ce.
213
P-21
3-2
rust
sta
in o
n E
face
. P-
213-
4 cr
ack
on W
fa
ce.
P-21
3-4
crac
k le
ngth
~4’
, cr
ack
wid
th ~
0.3m
m.
P213
-4
P2
13-4
214
P-21
4-1
rust
sta
in o
n N
E fa
ce in
tida
l zon
e. P
-214
-2
patc
h so
uth
face
.
215
P-21
5-1
rust
sta
in o
n E
face
at i
nter
m. E
lev.
P-
215-
4 ru
st s
tain
on
W a
nd S
face
at t
idal
zon
e.
216
P-21
6-1
patc
h on
NE
face
. P-
216-
4 ru
st s
tain
on
W fa
ce.
217
P-21
7-1
rust
sta
in o
n E
face
. P-
217-
2 re
paire
d cr
ack.
P-2
17-4
rust
sta
in o
n no
rth fa
ce.
218
P-21
8-3
rust
sta
in o
n N
face
at t
idal
ele
v.
Appendix I (continued)

119
Tabl
e A
1 b
(con
tinue
d)
Bent
G
ener
al R
emar
ks
Insp
ectio
n N
otes
Po
tent
ial
Res
istiv
ity
Con
tinui
ty
IRH
C
ore
extra
ctio
n
219
P-21
9-1
rust
sta
in o
n S
and
W fa
ce in
tida
l zon
e.
P-21
9-4
sev
ere
rust
sta
in o
n w
est f
ace.
P-21
9-1
rust
sta
in o
n W
fa
ce s
ever
ely
dela
m.
Del
am c
oncr
ete
rem
oved
. Ex
pose
d re
info
rcem
ent r
ust-f
ree.
P219
-4
P2
19-4
220
P-22
0-1
rust
sta
in o
n E
face
. P-
220-
4 pa
tch
on W
fa
ce.
221
P-22
1-1
rust
sta
in o
n N
face
at t
idal
ele
v. P
-221
-2
patc
h on
N fa
ce.
P-22
1-4
rust
sta
in o
n W
face
.
222
P-22
2-4
seve
re ru
st s
tain
on
S W
face
.
223
P-22
3-1
rust
sta
in o
n N
face
. P-
223-
2 pa
tch
on N
fa
ce.
224
P-22
4-1
patc
h on
E fa
ce.
P-22
4-3
rust
sta
in o
n E
face
. P-
224-
4 ru
st s
tain
on
N fa
ce.
225
P-22
5-1
patc
h on
E fa
ce, r
ust s
tain
on
N S
face
. P-
225-
4 ru
st s
tain
on
top
of S
face
.
226
Tow
er b
ent.
227
P-22
7-1
rust
sta
in o
n E
face
. P-
227-
4 ru
st s
tain
on
S fa
ce.
228
P-22
8-4
rust
sta
in o
n N
face
.
229
P-22
9-1
rust
sta
in o
n W
face
. P-
229-
3 ru
st s
tain
on
N fa
ce.
230
P-23
0-4
rust
sta
in o
n S
face
.
231
P-23
1-1
rust
on
wes
t fac
e. P
-231
-3 ru
st o
n N
face
. P-
231-
4 ru
st o
n S
face
.
232
P-23
2-2
rust
on
N E
face
.
23
3 P-
233-
2 ru
st o
n W
and
S fa
ce.
234
P-23
4-3
rust
on
N fa
ce.
235
P-23
5-1
patc
h on
E fa
ce.
P-23
5-2
patc
h on
E fa
ce,
seve
re ru
stin
g. P
-235
-4 ru
st s
tain
on
NW
face
be
low
pat
ch.
236
P-23
6-1
rust
on
E fa
ce, p
atch
on
W fa
ce.
P-23
6-3
patc
h on
W fa
ce.
Appendix I (continued)

120
Tabl
e A
1 b
(con
tinue
d)
Bent
G
ener
al R
emar
ks
Insp
ectio
n N
otes
Po
tent
ial
Res
istiv
ity
Con
tinui
ty
IRH
C
ore
Extra
ctio
n
237
P-23
7-1
seve
re ru
st s
tain
on
E fa
ce in
term
ed.
Elev
atio
n. P
-237
-2 ru
st s
tain
on
E fa
ce
P237
-1 d
elam
in b
otto
m
~20i
n2 . Exp
osed
re
info
rcem
ent r
ust-f
ree.
P2
37-1
P237
-1
238
P-23
8-1
patc
h on
E fa
ce.
P-23
8-4
rust
sta
in o
n N
W
face
nea
r pat
ch.
239
P-23
9-1
patc
h on
E fa
ce.
P-23
9-4
rust
on
W fa
ce,
patc
h on
W fa
ce.
240
P-24
0-2
patc
h on
E fa
ce.
P-24
0-3
rust
on
E fa
ce.
P-24
0-4
rust
on
N fa
ce.
241
Tow
er b
ent.
P-2
41-1
pat
ch o
n E
face
. P-
241-
2 pa
tch
on E
and
W fa
ce.
P-24
1-3
patc
h on
E fa
ce.
P-24
1-4
on W
face
.
242
P-24
2-2
patc
h on
E fa
ce.
P-24
2-4
patc
h on
W fa
ce
243
P-24
3-2
patc
h on
N fa
ce.
P-24
3-3
patc
h on
N fa
ce.
P-24
3-4
rust
on
N W
face
.
244
P-24
4-1
patc
h on
E fa
ce.
245
P-24
5-1
rust
on
N fa
ce.
P-24
5-2
rust
on
N fa
ce
near
pat
ch.
246
P-24
6-3
rust
on
E an
d S
face
.
247
P-24
7-1
patc
h on
E fa
ce.
P-24
7-2
rust
on
W fa
ce.
P-24
7-3
rust
on
W fa
ce.
248
P-24
8-2
patc
h on
N fa
ce.
P-24
8-4
spal
l on
W fa
ce.
249
P-24
9-3
rust
sta
in o
n E
face
inte
rmed
. Ele
v, ru
st
stai
n on
W fa
ce h
igh
elev
atio
n.
P249
-4 S
pall
~4in
2 .
250
P-25
0-1
patc
h on
W fa
ce.
P-25
0-2
rust
on
S fa
ce.
P-25
0-4
rust
on
N fa
ce u
nder
pat
ch.
251
P-25
1-2
patc
h on
E fa
ce.
P-25
1-3
patc
h on
N W
fa
ce.
252
P-25
2-1
rust
sta
in o
n E
face
inte
rmed
. Ele
v. P
-25
2-2
rust
sta
in o
n W
face
hig
h el
ev.
P-25
2-4
repa
ir pa
tch
on E
face
.
P-25
2-1
seve
re
dela
min
atio
n 3’
AHT.
Ar
ea ~
36in
2 . P2
52-1
P252
-1
253
P-25
3-1
rust
sta
in o
n N
face
. P-
231-
4 pa
tch
on E
25
4 P-
254-
2 ru
st s
tain
on
W fa
ce.
255
Rus
t sta
in o
n N
face
P-2
55-1
& E
face
P-2
55-2
Appendix I (continued)

121
Tabl
e A
1c B
rook
s B
ridge
Sur
vey
3/13
/03
Bent
G
ener
al R
emar
ks
Insp
ectio
n N
otes
Po
tent
ial
Res
istiv
ity
Con
tinui
ty
IRH
C
ore
Extra
ctio
n
1
End
Abut
men
t
2 Te
n 36
” dim
amet
er c
ylin
der p
iles.
Pi
les
on s
hore
3 Pi
les
in s
hallo
w w
ater
. Br
-3-2
fine
cr
acks
0.2
mm
.
Br-3
-2 C
rack
from
top
of p
ile s
ectio
n.
Cor
e ex
tract
ion
upon
cra
cks.
Br-3
-7,
8, a
nd 9
cra
cks.
Br-3
-4 a
nd 8
rust
st
ain.
Br-3
-2-5
exp
osed
wire
sho
ws
rust
.
Br-3
-2
Br
-3-2
4 Br
-4-1
rust
sta
in o
n E
face
. Br
-4-6
fine
cr
ack.
Br-
4-9
conc
rete
spa
ll.
Br-4
-1 n
o in
dica
tion
of d
elam
inat
ion.
Br
-4-5
, 7, a
nd 8
fine
cra
ck.
Br-4
-9
crac
k ~0
.3m
m.
5 C
olum
n pi
ers.
6 C
olum
n pi
ers.
7 C
olum
n pi
ers.
8 C
olum
n pi
ers.
9 Br
-9-1
con
cret
e sp
all.
Br-9
-6 c
oncr
ete
spal
l. Br
-9-5
, 6, a
nd 9
cra
cks.
Br-9
-10
smal
l rus
t sta
in.
10
Pile
s on
shor
e.
11
Pile
s on
sho
re.
12
Pile
s on
sho
re.
13
Pile
s on
shor
e.
14
End
Abut
men
t.
Appendix I (continued)

122
Tabl
e A
1d S
t Geo
rge
Isla
nd S
urve
y 3/
2/04
Bent
G
ener
al R
emar
ks
Insp
ectio
n N
otes
Po
tent
ial
Res
istiv
ity
Con
tinui
ty
IRH
C
ore
Extra
ctio
n
73
73EN
sup
erfic
ial r
ust s
tain
. 73
ES ru
st
stai
n. 7
3CS
long
itudi
nal c
rack
ing.
133
133E
S ru
st s
tain
and
long
itudi
nal
crac
k.
139
139E
N lo
ngitu
dina
l cra
ck.
139E
S lo
ngitu
dina
l cra
ckin
g. 1
39C
S ru
st
stai
n.
145
145E
S ru
st s
tain
and
long
itudi
nal
crac
k. 1
45C
S lo
ngitu
dina
l cra
ck.
145W
S lo
ngitu
dina
l cra
ck.
146
146E
S lo
ngitu
dina
l cra
ck.
146C
N
long
itudi
nal c
rack
.
152
Test
pile
on
wes
t sid
e of
pile
ben
t.
15
2-TP
-N
152-
TP-N
15
2-TP
-N
162
162W
S lo
ngitu
dina
l cra
ck. 4
th b
ent
from
Eas
tpoi
nt a
ppro
ach.
162W
S
162W
S
162W
S
163
163W
S lo
ngitu
dina
l cra
ck.
3rd b
ent
from
Eas
tpoi
nt a
ppro
ach.
163W
S
163W
S
163W
S
Appendix I (continued)
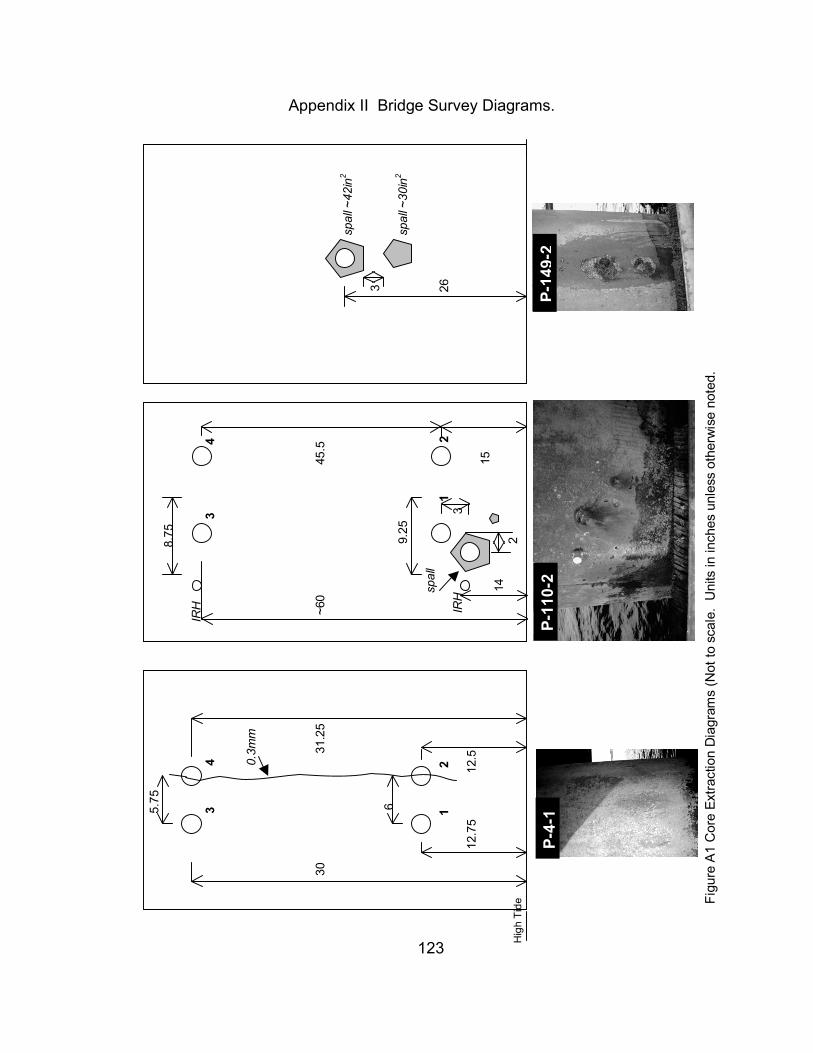
123 Hig
h Ti
de
P-11
0-2
P-4-
1 P-
149-
2
Appendix II Bridge Survey Diagrams.
Figu
re A
1 C
ore
Extra
ctio
n D
iagr
ams
(Not
to s
cale
. U
nits
in in
ches
unl
ess
othe
rwis
e no
ted.
5.75
Figu
re A
1
8.7
5
IRH
3 4
3
4
0.3m
m
3
0
31.2
5
~60
45.
5
spa
ll ~4
2in2
3
6
9.
25
s
pall
~30i
n2
sp
all
1
2
1
2
26
I
RH
3
12.7
5
1
2.5
1
5
14
2
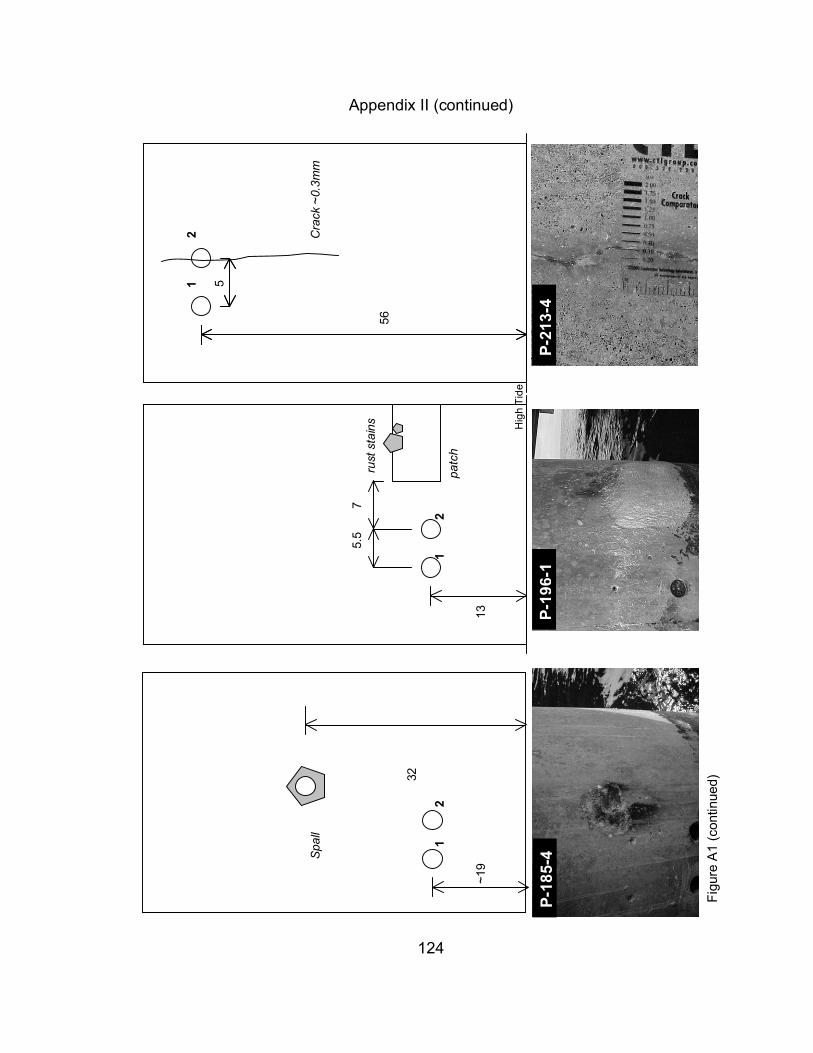
124
1
2
5
Sp
all
Cra
ck ~
0.3m
m
5.5
7
rust
sta
ins
56
32
1
2
1
2
patc
h
~
19
13
Appendix II (continued)
Hig
h Ti
de
P-18
5-4
P-19
6-1
P-21
3-4
Figu
re A
1 (c
ontin
ued)
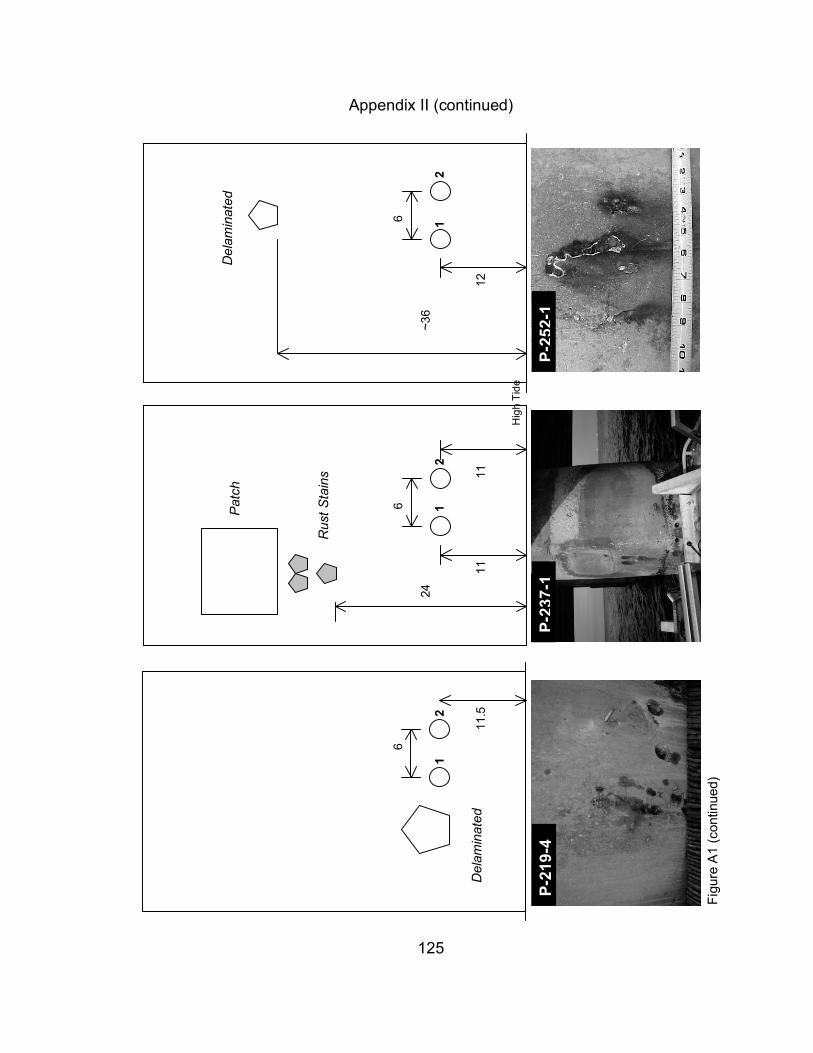
125
Hig
h Ti
de
6
6
6
24
~
36
1
2
1
2
1
2
11.
5
11
11
12
Appendix II (continued)
Pat
ch
Rus
t Sta
ins
Del
amin
ated
Del
amin
ated
P-21
9-4
P-23
7-1
P-25
2-1
Figu
re A
1 (c
ontin
ued)

126
3
4
3
4
1
2
1
2
1
2
Appendix II (continued)
Hig
h Ti
de
crac
k
6
6
6
66
66
1212
6
crac
k
Frag
men
ted
durin
g ex
tract
ion
152T
PN
162W
S16
3WS
Figu
re A
1 (c
ontin
ued)

127
IRH
IRH
9
4.5
60
5
6
3
4
1
2
3
4
1
2
3
4
1
2
5
6
H
-29-
3
Appendix II (continued)
Hig
h Ti
de
Hig
h Ti
de
6
6
610
24.5
Lost
upo
n ex
tract
ion
crac
k
IRH
IRH
6
60
6.25
45
10.5
10
5.2
H-8
-2B
r-3-
2
Figu
re A
1 (c
ontin
ued)

128
Appendix II (continued)
0
0.1
0.2
0.3
0.4
0.5
0.6
0.7
0.8
0.9
1
0 1 2 3 4 5 6 7 8 9 10Clear Cover (cm)
Cum
ulat
ive
Frac
tion
Hathaway Bridge 54"
Pensacola Bay Bridge 54"
Brooks Bridge 36"
St George Island Bridge 54"
Figure A2 Cumulative fraction of clear cover.
Table A2 Direct Clear Cover Measurements. (cm / in) Steel Type
Spiral Wire Spacing Bar Strand Bridge Pile
diameter (in.) Min. Avg. Max. Min. Avg. Max. Min. Avg. Max.
Hathaway 54 2.5 0.98
3.06 1.20
3.5 1.38
2.5 0.98
2.5 0.98
2.5 0.98
4.4 1.73
4.7 1.85
5.0 1.97
Pensacola Bay 54 1.0
0.39 2.33 0.92
3.9 1.54
1.6 0.63
2.7 1.06
3.8 1.50
4.7 1.85
5.48 2.16
6.4 2.52
Brooks 36 2.6 1.02
2.9 1.14
3.2 1.26
3.8 1.50
3.8 1.50
3.8 1.50 N.A.
54 1.9 0.75
2.64 1.04
3.17 1.25
1.27 0.5
3.51 1.38
5.08 2.0 Escambia
Bay [2] 36 1.9 0.75
2.84 1.12
5.08 2.0
2.54 1.0
4.04 1.59
5.71 2.25
SGI 54 7.2 2.83
8.08 3.18
8.9 3.50
N.A.
N.A.
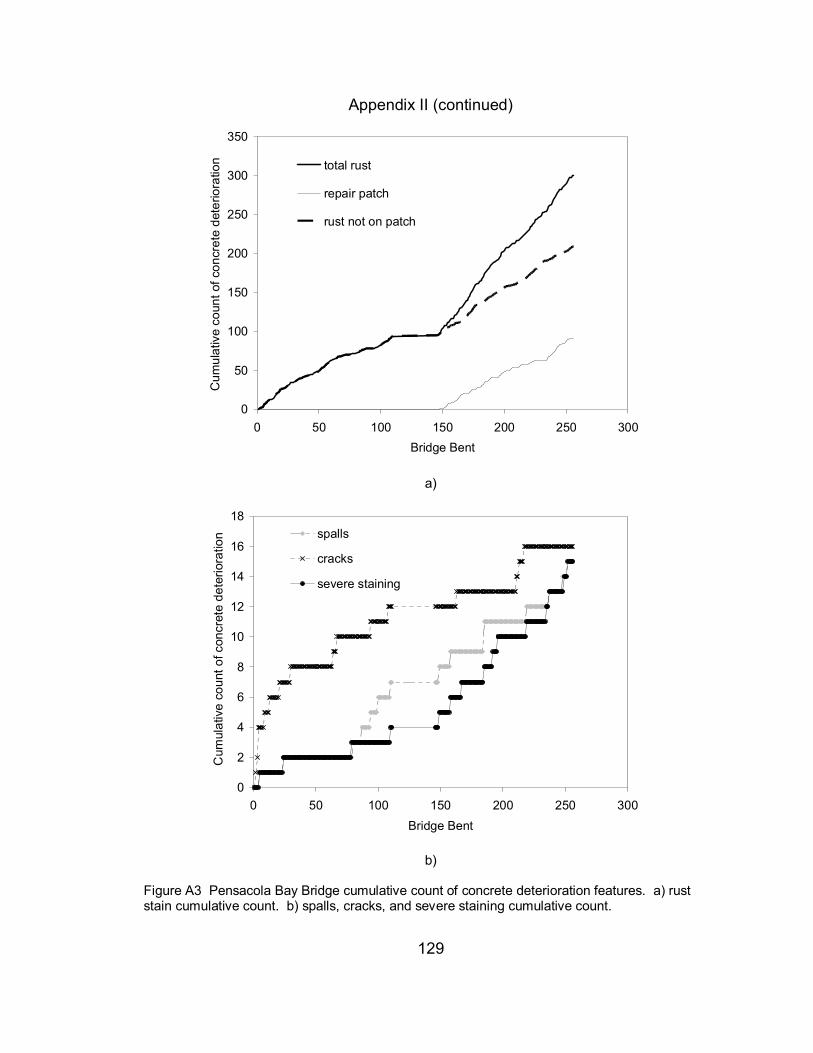
129
Appendix II (continued)
0
50
100
150
200
250
300
350
0 50 100 150 200 250 300Bridge Bent
Cum
ulat
ive
coun
t of c
oncr
ete
dete
riora
tion total rust
repair patch
rust not on patch
a)
0
2
4
6
8
10
12
14
16
18
0 50 100 150 200 250 300Bridge Bent
Cum
ulat
ive
coun
t of c
oncr
ete
dete
riora
tion spalls
cracks
severe staining
b)
Figure A3 Pensacola Bay Bridge cumulative count of concrete deterioration features. a) rust stain cumulative count. b) spalls, cracks, and severe staining cumulative count.

130
Appendix II (continued)
a) b) c) Figure A4 Examples of corrosion ratings. a) Example of spiral wire with No Corrosion (NC) rating. Hathaway Bridge, bottom of core hole, Pile H29-3. b) Example of spiral wire with Light Corrosion (LC) rating. Arrow indicates spot showing minor rust discoloration. Pensacola Bay Bridge, bottom of core hole, Pile P110-2. c) Example of severe corrosion (SC) of ¼ in (0.64 cm) diameter spiral wire from Pensacola Bay Bridge (P149-2) showing appreciable localized loss of cross section at the right end of the wire segment cut out by coring.

131
Apppendix III Data Tables
Tabl
e A
3 C
ore
Pro
perti
es, C
hlor
ide
Diff
usio
n P
aram
eter
s, P
roje
cted
Chl
orid
e C
once
ntra
tion,
and
Ste
el C
ondi
tion
Proj
ecte
d C
(m
g/g)
a C
over
Xc
(cm
) and
Ste
el C
ondi
tionb
Bridge
Cor
e El
evat
ion
AHT
(m)
Cra
ck/
Spal
l
Cra
ck
Wid
th/
Spal
l Ar
ea
Cs
(mg c
l/gdr
y) D
(m2 /s
) Sp
iral
Bar
Spira
l Ba
r St
rand
H-8
-2-1
0.
15
c c
0.19
3.3
NC
-
-
H-8
-2-2
0.
11
11.6
5.
92E-
14
- -
-
H-8
-2-3
-0
.14
9.75
2.
86E-
13
- -
-
H-8
-2-4
-0
.14
9.6
9.20
E-14
1.
16
2.
5 N
C
- -
H-8
-2-5
1.
52
7.37
3.
02E-
14
0.08
3.3
NC
-
-
H-8
-2-6
1.
52
c c
0.10
2.7
NC
-
-
H-2
9-3-
1 0.
15
c c
- -
5.0
NC
H-2
9-3-
2 0.
15
8.36
8.
41E-
14
0.25
3.5e
NC
-
-
H-2
9-3-
3 1.
52
Cra
ck
0.3
mm
4.
69
7.41
E-14
0.44
-
2.5
LC
4.4
LC
Hathaway
H-2
9-3-
4 1.
52
c c
0.14
3.5
NC
-
-
P-4-
1-1
0.32
7.
4 2.
40E-
13
3.42
1.9
NC
-
-
P-4-
1-2
0.32
C
rack
0.
3 m
m
12.8
4.
38E-
14
3.14
g
2 N
C
- -
P-4-
1-3
0.76
8.
64
7.79
E-14
0.
81
2.
5 N
C
- -
P-4-
1-4
0.79
c
c 0.
93
2.
4 N
C
- 5.
1 LC
P-11
0-2
0.30
Sp
all
100c
m2
g g
1.87
2.7e
LC
- -
P-11
0-2-
1 0.
38
c c
1.26
2.7e
NC
-
-
P-11
0-2-
2 0.
38
8.35
1.
25E-
13
1.26
2.7
NC
-
6.4
LC
Pensacola Bay
P-11
0-2-
4 1.
52
9.38
6.
07E-
14
- -
6.4
NC
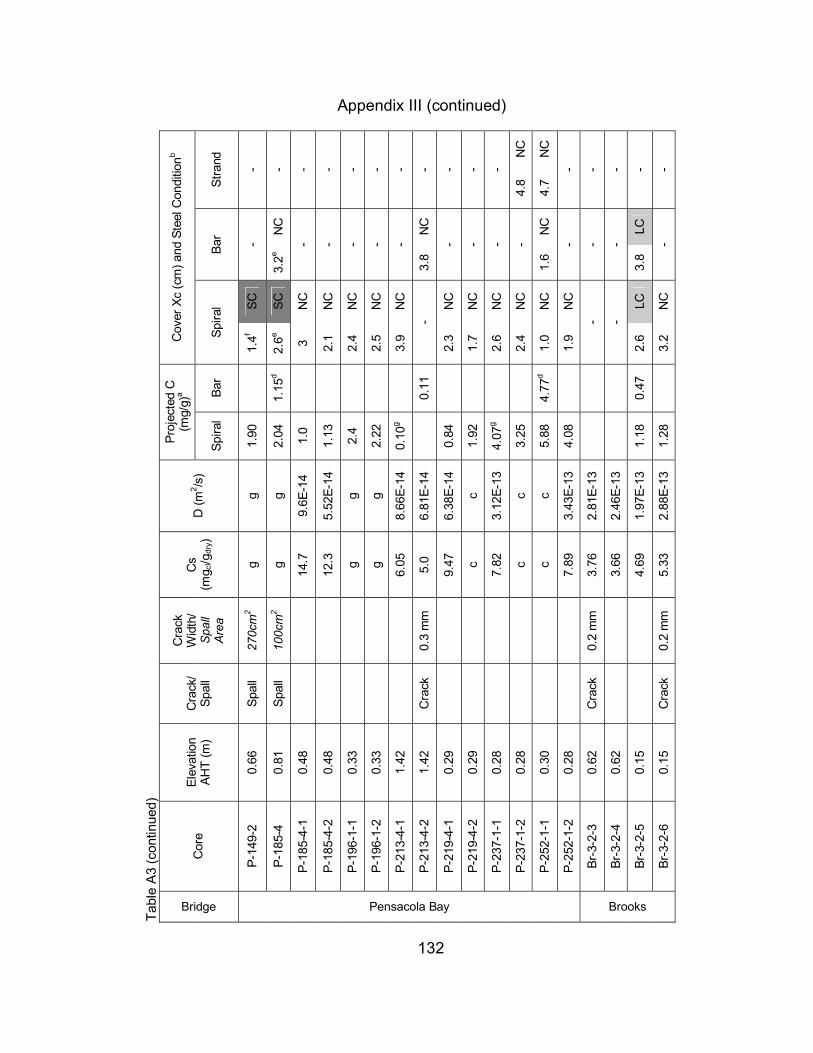
132
Appendix III (continued)
Tabl
e A
3 (c
ontin
ued)
Proj
ecte
d C
(m
g/g)
a C
over
Xc
(cm
) and
Ste
el C
ondi
tionb
Bridge
Cor
e El
evat
ion
AHT
(m)
Cra
ck/
Spal
l
Cra
ck
Wid
th/
Spal
l Ar
ea
Cs
(mg c
l/gdr
y) D
(m2 /s
) Sp
iral
Bar
Spira
l Ba
r St
rand
P-14
9-2
0.66
Sp
all
270c
m2
g g
1.90
1.4f
SC
- -
P-18
5-4
0.81
Sp
all
100c
m2
g g
2.04
1.
15d
2.6e
SC
3.2e
NC
-
P-18
5-4-
1 0.
48
14.7
9.
6E-1
4 1.
0
3 N
C
- -
P-18
5-4-
2 0.
48
12.3
5.
52E-
14
1.13
2.1
NC
-
-
P-19
6-1-
1 0.
33
g g
2.4
2.
4 N
C
- -
P-19
6-1-
2 0.
33
g g
2.22
2.5
NC
-
-
P-21
3-4-
1 1.
42
6.05
8.
66E-
14
0.10
g
3.9
NC
-
-
P-21
3-4-
2 1.
42
Cra
ck
0.3
mm
5.
0 6.
81E-
14
0.
11
- 3.
8 N
C
-
P-21
9-4-
1 0.
29
9.47
6.
38E-
14
0.84
2.3
NC
-
-
P-21
9-4-
2 0.
29
c c
1.92
1.7
NC
-
-
P-23
7-1-
1 0.
28
7.82
3.
12E-
13
4.07
g
2.6
NC
-
-
P-23
7-1-
2 0.
28
c c
3.25
2.4
NC
-
4.8
NC
P-25
2-1-
1 0.
30
c c
5.88
4.
77d
1.0
NC
1.
6 N
C
4.7
NC
Pensacola Bay
P-25
2-1-
2 0.
28
7.89
3.
43E-
13
4.08
1.9
NC
-
-
Br-3
-2-3
0.
62
Cra
ck
0.2
mm
3.
76
2.81
E-13
-
- -
Br-3
-2-4
0.
62
3.66
2.
46E-
13
- -
-
Br-3
-2-5
0.
15
4.69
1.
97E-
13
1.18
0.
47
2.6
LC
3.8
LC
-
Brooks
Br-3
-2-6
0.
15
Cra
ck
0.2
mm
5.
33
2.88
E-13
1.
28
3.
2 N
C
- -

133
Tabl
e A
3 (c
ontin
ued)
Proj
ecte
d C
(m
g/g)
a C
over
Xc
(cm
) and
Ste
el C
ondi
tionb
Bridge
Cor
e El
evat
ion
AHT
(m)
Cra
ck/
Spal
l
Cra
ck
wid
th/
Spal
l Ar
ea
Cs
(mg c
l/gdr
y) D
(m2 /s
) Sp
iral
Bar
Spira
l Ba
r St
rand
162w
s1
0.15
C
rack
<
0.05
m
m
8.96
7.
84E-
14
0.08
7.9
NC
-
-
162w
s2
0.15
8.
22
5.02
E-14
0.
08
8
NC
-
-
162w
s3
0.30
C
rack
<
0.05
m
m
6.70
4.
39E-
14
0.08
8.3
NC
-
-
162w
s4
0.30
6.
97
2.87
E-14
0.
08
8
NC
-
-
163w
s1
0.15
C
rack
<
0.05
m
m
4.33
5.
02E-
13
0.08
8.9
NC
-
-
163w
s2
0.15
4.
08
3.09
E-13
0.
08
8.
1 N
C
- -
163w
s3
0.30
C
rack
<
0.05
m
m
4.11
1.
74E-
13
0.08
7.2
NC
-
-
St. George Island
163w
s4
0.30
4.
24
2.40
E-13
0.
08
8.
3 N
C
- -
Tabl
e A
3 N
otes
a.
E
xcep
t as
indi
cate
d, v
alue
list
ed is
pro
ject
ed c
hlor
ide
conc
entra
tion
at d
epth
of s
pira
l wire
and
/or s
paci
ng b
ar (X
c) a
t tim
e of
insp
ectio
n us
ing
equa
tion
(1),
liste
d di
ffusi
on p
aram
eter
s, a
nd a
ssum
ing
Co=
0.08
mg/
g. I
n co
res
whe
re d
irect
co
mpa
rison
with
dat
a in
Tab
le A
3 w
as p
ossi
ble,
pro
ject
ed v
alue
was
foun
d to
be
betw
een
thos
e lis
ted
for s
lices
im
med
iate
ly a
bove
and
bel
ow s
teel
pos
ition
. Exc
eptio
ns a
re n
oted
und
er (g
).
b.
NC
- no
corr
osio
n. L
C- l
ight
sur
face
rust
. S
C- s
ever
e co
rros
ion.
See
Sec
tion
3.
c.
Diff
usio
n pa
ram
eter
val
ues
of c
ompa
nion
cor
e ex
tract
ed a
t the
sam
e el
evat
ion.
See
Fig
ure
A1.
d.
C
over
dat
a ta
ken
from
com
pani
on c
ore.
e.
C
over
val
ue e
stim
ated
usi
ng s
pall
and
core
frag
men
ts.
f. A
ssum
ed ty
pica
l diff
usio
n pa
ram
eter
val
ues
for c
ores
at l
ow e
leva
tion.
D=1
.5e-
13m
2 /s, C
s=10
mg/
g.
g Li
sted
val
ue is
by
linea
r in
terp
olat
ion
from
con
cent
ratio
ns o
f slic
es im
med
iate
ly a
bove
and
bel
ow s
teel
pos
ition
as
liste
d in
Tab
le A
4.
Appendix III (continued)

134
Tabl
e A
4 C
hlor
ide
Con
cent
ratio
n P
rofil
e D
ata
and
Ana
lysi
s R
esul
ts
Brid
ge
Cor
e Ti
me
in
serv
ice
(yrs
) C
(m
g/g)
M
idpo
int
(cm
) Th
ickn
ess
(cm
) C
s (m
g/g)
D
(m2 /s
)
11.0
5 0.
10
0.20
7.
53
0.55
0.
70
3.33
1.
41
0.64
0.
90
2.47
1.
12
0.16
4.
22
1.00
H8-
2-2
43
0.14
8 5.
26
1.69
11.6
5.
92e-
14
8.8
0.15
0.
3 8.
41
0.57
0.
54
7.24
1.
24
0.44
3.
92
2.19
1.
07
H8-
2-3
43
1.57
3.
85
1.88
9.75
2.
86e-
13
9.05
0.
15
0.30
6.
62
0.57
0.
54
4.60
1.
24
0.44
1.
46
2.19
1.
07
H8-
2-4
43
0.27
4.
00
2.18
9.6
9.20
e-14
6.33
0.
13
0.25
4.
76
0.41
0.
32
1.31
1.
21
0.45
0.
50
1.86
0.
92
H8-
2-5
43
0.64
3.
12
1.21
7.37
3.
02e-
14
11.4
6*
0.10
0.
20
6.07
0.
50
0.61
3.
72
1.27
0.
54
1.52
2.
23
1.01
H
29-3
-2
43
0.01
3.
67
1.48
8.36
8.
41e-
14
4.02
.2
7 .5
5 2.
29
1.07
.6
6 0.
31
2.63
.7
8
Hat
haw
ay
H29
-3
43
0.12
3.
48
1.22
4.69
7.
41e-
14
Appendix III (continued)

135
Appendix III (continued)
Tabl
e A
4 (c
ontin
ued)
Brid
ge
Cor
e Ti
me
in
serv
ice
(yrs
) C
(m
g/g)
M
idpo
int
(cm
) Th
ickn
ess
(cm
) C
s (m
g/g)
D
(m2 /s
)
7.05
0.
18
0.35
5.
69
0.71
0.
72
3.89
1.
51
0.48
2.
25
3.00
2.
12
0.43
4.
71
1.31
P4-1
-1
43
0.18
6.
14
1.17
7.4
2.40
e-13
12.1
6 0.
10
0.20
8.
22
0.47
0.
54
4.09
1.
14
0.44
P4
-1-2
43
0.99
3.
96
2.30
12.8
4.
38e-
14
8.39
0.
10
0.20
6.
08
0.47
0.
19
3.64
1.
14
0.45
1.
48
2.40
1.
72
0.08
3.
98
1.08
P4-1
-3
43
0.07
5.
83
2.25
8.64
7.
79e-
14
13.0
9 0.
14
0.28
6.
48
0.49
0.
43
4.45
1.
23
0.46
1.
69
2.41
1.
73
0.25
3.
88
1.20
P110
-2-2
43
0.12
5.
38
1.41
8.35
1.
25e-
13
6.34
0.
57
1.13
2.
57
1.52
0.
78
0.18
2.
64
1.08
P1
10-2
-4
43
0.11
4.
71
0.87
9.38
6.
07e-
14
7.91
0.
18
0.35
10
.45
0.62
0.
54
6.39
1.
29
0.45
1.
74
2.70
1.
99
Pens
acol
a Ba
y
P185
-4-1
43
0.03
4.
39
1.40
14.7
9.
6e-1
4

136
Tabl
e A
4 (c
ontin
ued)
Brid
ge
Cor
e Ti
me
in
serv
ice
(yrs
) C
(m
g/g)
M
idpo
int
(cm
) Th
ickn
ess
(cm
) C
s (m
g/g)
D
(m2 /s
)
10.7
3 0.
20
0.40
7.
66
0.59
0.
38
0.38
3.
31
1.73
0.
16
4.90
1.
07
P185
-4-2
43
0.12
6.
00
0.75
12.3
5.
52e-
14
3.75
0.
79
1.58
1.
30
2.04
0.
91
0.11
3.
22
1.07
P2
13-4
-1
43
0.09
4.
48
1.07
6.05
8.
66e-
14
4.23
0.
32
0.63
1.
98
1.10
0.
94
0.87
1.
98
0.44
0.
45
2.60
0.
44
P213
-4-2
43
0.33
3.
23
0.44
5.0
6.81
e-14
7.87
0.
30
0.60
4.
73
0.87
0.
54
2.65
1.
54
0.44
0.
19
2.80
1.
71
P219
-4-1
43
0.13
4.
91
2.13
9.44
6.
61e-
14
6.99
0.
30
0.60
5.
85
0.87
0.
54
5.00
1.
54
0.44
3.
33
2.80
1.
71
0.59
4.
38
1.07
P237
-1-1
43
0.16
6.
25
2.29
7.86
3.
12e-
13
6.31
0.
23
0.45
6.
80
0.72
0.
54
4.51
1.
39
0.45
3.
79
2.34
1.
08
2.03
3.
61
1.08
Pens
acol
a Ba
y
P252
-1-2
43
0.54
5.
71
2.73
7.89
3.
43e-
13
Appendix III (continued)

137
Appendix III (continued)
Tabl
e A
4 (c
ontin
ued)
Brid
ge
Cor
e Ti
me
in
serv
ice
(yrs
) C
(m
g/g)
M
idpo
int
(cm
) Th
ickn
ess
(cm
) C
s (m
g/g)
D
(m2 /s
)
5.84
* 0.
14
0.27
3.
40
0.54
0.
54
2.12
1.
21
0.44
1.
59
2.16
1.
07
Br3-
2-3
39
0.86
3.
84
1.92
3.76
2.
81e-
13
6.83
* 0.
10
0.20
3.
20
0.39
0.
39
2.46
1.
09
0.63
1.
46
2.07
0.
95
Br3-
2-4
39
0.66
3.
73
1.99
3.66
2.
46e-
13
10.2
2*
0.10
0.
20
4.05
0.
47
0.43
2.
52
1.15
0.
50
Br3-
2-5
39
1.54
2.
43
1.47
4.69
1.
97e-
13
8.77
* 0.
13
0.25
4.
45
0.54
0.
58
3.51
1.
27
0.50
1.
44
2.97
2.
54
Broo
ks
Br3-
2-6
39
0.59
4.
89
1.30
5.33
2.
88e-
13
9.48
0.
06
0.11
8.
32
0.16
0.
10
152T
PN-2
2.
18
6.67
0.
28
0.13
10
.3
2.26
e-13
7.75
0.
04
0.08
6.
38
0.13
0.
09
4.76
0.
23
0.11
2.
81
0.33
0.
10
1.57
0.
42
0.09
1.
18
0.58
0.
23
St. G
eorg
e Is
land
162W
S-1
2.6
0.65
1.
08
0.61
8.96
7.
84e-
14
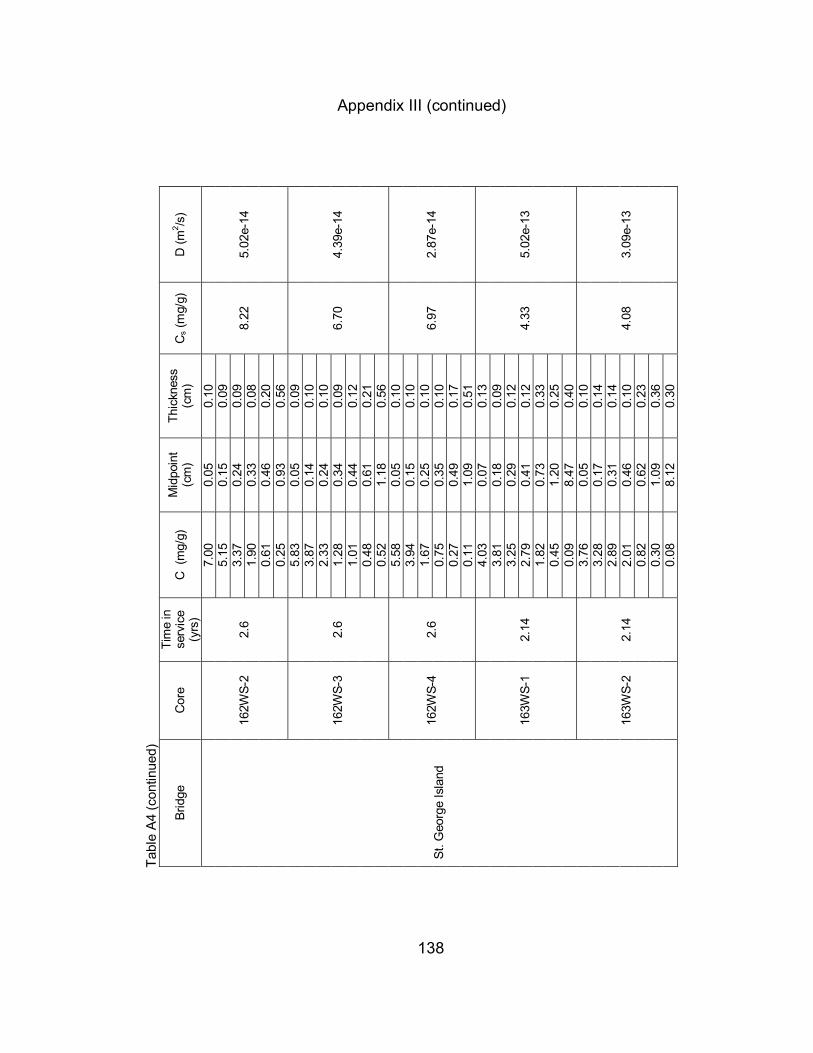
138
Appendix III (continued)
Tabl
e A
4 (c
ontin
ued)
Brid
ge
Cor
e Ti
me
in
serv
ice
(yrs
) C
(m
g/g)
M
idpo
int
(cm
) Th
ickn
ess
(cm
) C
s (m
g/g)
D
(m2 /s
)
7.00
0.
05
0.10
5.
15
0.15
0.
09
3.37
0.
24
0.09
1.
90
0.33
0.
08
0.61
0.
46
0.20
162W
S-2
2.6
0.25
0.
93
0.56
8.22
5.
02e-
14
5.83
0.
05
0.09
3.
87
0.14
0.
10
2.33
0.
24
0.10
1.
28
0.34
0.
09
1.01
0.
44
0.12
0.
48
0.61
0.
21
162W
S-3
2.6
0.52
1.
18
0.56
6.70
4.
39e-
14
5.58
0.
05
0.10
3.
94
0.15
0.
10
1.67
0.
25
0.10
0.
75
0.35
0.
10
0.27
0.
49
0.17
162W
S-4
2.6
0.11
1.
09
0.51
6.97
2.
87e-
14
4.03
0.
07
0.13
3.
81
0.18
0.
09
3.25
0.
29
0.12
2.
79
0.41
0.
12
1.82
0.
73
0.33
0.
45
1.20
0.
25
163W
S-1
2.14
0.09
8.
47
0.40
4.33
5.
02e-
13
3.76
0.
05
0.10
3.
28
0.17
0.
14
2.89
0.
31
0.14
2.
01
0.46
0.
10
0.82
0.
62
0.23
0.
30
1.09
0.
36
St. G
eorg
e Is
land
163W
S-2
2.14
0.08
8.
12
0.30
4.08
3.
09e-
13

139
Tabl
e A
4 (c
ontin
ued)
*
Dat
a fo
r sam
ple
clos
est t
o su
rface
not
use
d to
fit c
hlor
ide
conc
entra
tion
and
dept
h to
Eq.
1 (s
ee S
ectio
n 4.
3).
Brid
ge
Cor
e Ti
me
in
serv
ice
(yrs
) C
(m
g/g)
M
idpo
int
(cm
) Th
ickn
ess
(cm
) C
s (m
g/g)
D
(m2 /s
)
3.77
0.
06
0.12
3.
34
0.17
0.
12
2.41
0.
28
0.10
1.
77
0.38
0.
10
1.23
0.
55
0.24
0.
54
1.00
0.
32
163W
S-3
2.14
0.14
8.
30
0.29
4.11
1.
74e-
13
3.90
0.
05
0.09
3.
57
0.13
0.
07
2.75
0.
22
0.11
2.
26
0.33
0.
10
1.66
0.
48
0.20
0.
99
0.67
0.
19
0.68
0.
87
0.21
0.
35
1.07
0.
20
163W
S-4
2.14
0.08
8.
29
0.25
4.24
2.
4e-1
3
5.45
0.
052
0.10
4.
19
0.15
0.
08
3.19
0.
23
0.09
14
04-3
1.
83
2.49
0.
32
0.08
5.95
1.
44e-
13
8.50
0.
03
0.07
6.
48
0.13
0.
12
4.77
0 0.
21
0.12
4.
33
0.28
0.
09
1404
-4
1.80
2.72
0.
39
0.14
9.53
1.
09e-
13
7.39
0.
077
0.94
7.
14
1.45
1.
03
6.04
2.
49
0.75
5.
04
3.47
1.
21
St. G
eorg
e Is
land
943-
3 1.
89
4.36
4.
55
1.25
8.37
4.
03e-
13
Appendix III (continued)

140
Appendix III (continued)
Tabl
e A
5 F
ield
Pot
entia
l Map
ping
Brid
ge
Pile
R
einf
orce
men
t El
evat
ion
AHT
(ft)
E vs
CSE
(mV)
R
emar
ks
Wat
er
-361
-3
76
0 -1
51
-167
1
-143
-1
60
2 -4
0 -6
8 3
73
38
4 17
2 14
1 5
191
160
H-8
-2-1
w
ire
6 18
0 14
7
Wat
er
-656
-6
25
0 -4
26
-389
1
-328
-3
12
2 -2
51
-240
3
-154
-1
51
4 -1
11
-100
5
-103
-1
00
H-2
9-3-
1 st
rand
6 -9
0 -8
2
Wat
er
-425
-4
25
0 -2
45
-238
1
-179
-1
94
2 -1
16
-113
3
-14
-11
4 9
9 5
40
40
H-2
9-3-
2 w
ire
6 72
55
Wat
er
-520
-5
24
0 -3
76
-382
1
-264
-2
60
2 -1
61
-161
3
-96
-140
4
-99
-96
5 -6
0 -6
8
Hat
haw
ay
H-2
9-3-
3 sp
acin
g re
bar
6 -3
-1
2
Min
or ru
stin
g on
re
bar.
Coi
ncid
ent
with
cra
ck.

141
Tabl
e A
5 (c
ontin
ued)
Brid
ge
Pile
R
einf
orce
men
t El
evat
ion
AHT
(ft)
E vs
CSE
(mV)
R
emar
ks
Wat
er
-530
-5
08
0 -3
64
-348
1
-240
-2
44
2 -1
81
-187
3
-120
-1
27
4 -1
11
-108
5
-88
-69
Hat
haw
ay
H-2
9-3-
4 w
ire
6 -4
3 -4
0
0 -5
35
1
-499
2 -4
20
3
-276
P-4-
1-1
wire
4 -2
40
0 -3
79
1
-306
2 -2
60
3
-167
P-4-
1-2
stra
nd
4 -1
12
0 -3
02
-331
1
-282
-2
82
2 -2
69
-248
3
-157
-1
50
P-4-
1-3
wire
4 -7
5 -1
19
0
-380
1 -2
99
2
-285
3 -1
48
P-
4-1-
4 st
rand
4 -1
30
0 -2
70
-250
1
-301
-2
56
2 -1
82
-160
3
-134
-7
9 4
-100
-5
4
Pens
acol
a Ba
y
P-11
0-2
w
ire
5 -5
7
Cor
e ex
tract
ed fr
om
spal
led
conc
rete
. C
orro
ded
wire
.
Appendix III (continued)
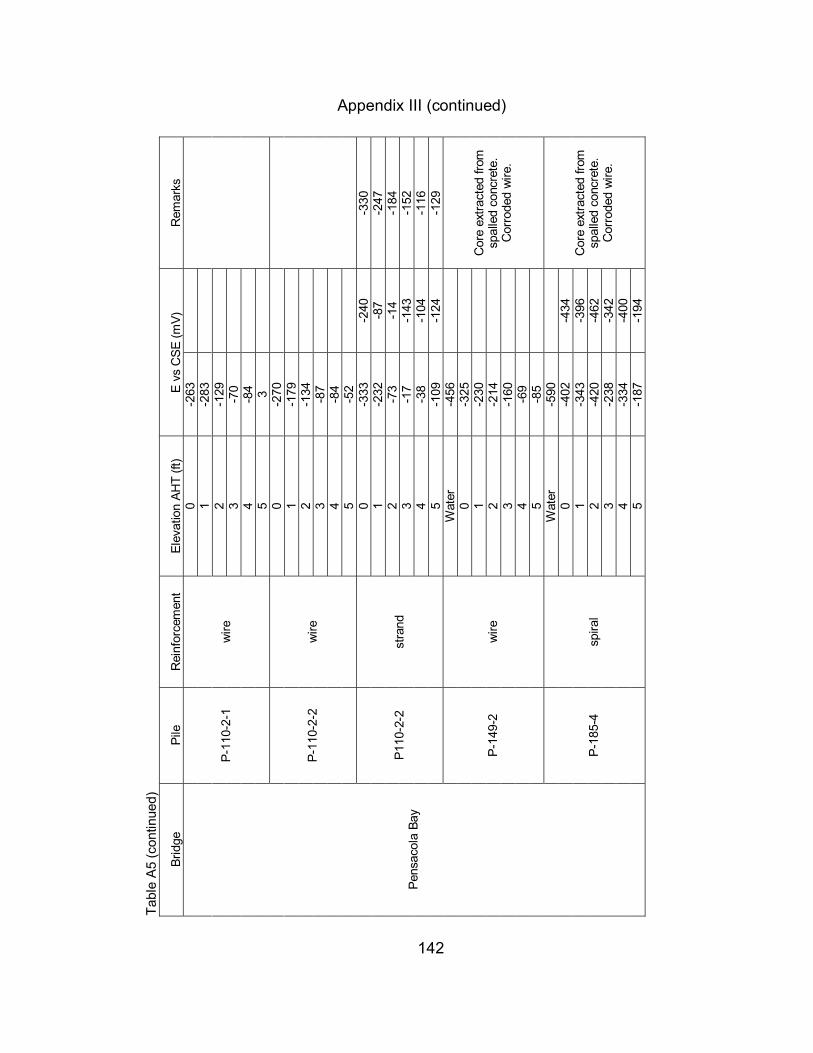
142
Tabl
e A
5 (c
ontin
ued)
Brid
ge
Pile
R
einf
orce
men
t El
evat
ion
AHT
(ft)
E vs
CSE
(mV)
R
emar
ks
0 -2
63
1
-283
2 -1
29
3
-70
4
-84
P-11
0-2-
1 w
ire
5 3
0 -2
70
1
-179
2 -1
34
3
-87
4
-84
P-11
0-2-
2 w
ire
5 -5
2
0
-333
-2
40
-330
1
-232
-8
7 -2
47
2 -7
3 -1
4 -1
84
3 -1
7 -1
43
-152
4
-38
-104
-1
16
P110
-2-2
st
rand
5 -1
09
-124
-1
29
Wat
er
-456
0 -3
25
1
-230
2 -2
14
3
-160
4 -6
9
P-14
9-2
wire
5 -8
5
Cor
e ex
tract
ed fr
om
spal
led
conc
rete
. C
orro
ded
wire
.
Wat
er
-590
0 -4
02
-434
1
-343
-3
96
2 -4
20
-462
3
-238
-3
42
4 -3
34
-400
Pens
acol
a Ba
y
P-18
5-4
spira
l
5 -1
87
-194
Cor
e ex
tract
ed fr
om
spal
led
conc
rete
. C
orro
ded
wire
.
Appendix III (continued)

143
Tabl
e A
5 (c
ontin
ued)
Brid
ge
Pile
R
einf
orce
men
t El
evat
ion
AHT
(ft)
E vs
CSE
(mV)
R
emar
ks
W
ater
-5
85
0
-404
-4
01
1 -3
52
-342
2
-404
-3
96
3 -2
41
-248
4
-335
-3
12
P-18
5-4
Stra
nd
5 -1
97
-196
Cor
e ex
tract
ed fr
om
spal
led
conc
rete
. C
orro
ded
wire
.
Wat
er
-530
0 -4
48
1
-290
2 -2
69
3
-205
4 -2
07
5
-178
P-21
3-4-
1 w
ire
6 -1
54
Wat
er
-530
0 -4
44
1
-305
2 -2
75
3
-262
4 -2
27
5
-187
P-21
3-4-
2 st
rand
6 -1
81
0 -4
09
1
-381
2 -2
98
3
-260
P-21
9-4-
1 w
ire
4 -2
40
Wat
er
-490
-4
89
0 -4
10
-380
1
-290
-3
02
2 -1
96
-214
3
-138
-1
45
Pens
acol
a Ba
y
P-23
7-1-
1 w
ire
4 -1
15
-135
Appendix III (continued)

144
Tabl
e A
5 (c
ontin
ued)
Brid
ge
Pile
R
einf
orce
men
t El
evat
ion
AHT
(ft)
E vs
CSE
(mV)
R
emar
ks
Wat
er
-460
0 -4
17
1
-351
2 -1
80
3
-150
P-25
2-1-
1 w
ire
4 -1
09
0 -3
65
1
-287
2 -7
0
3 -1
09
P-
252-
1-1
spac
ing
reba
r
4 -1
19
Wat
er
-500
0 -4
2
1 -3
62
2
-194
3 -3
7
P252
-1-1
st
rand
4 -2
12
Wat
er
-499
0 -3
24
1
-160
2 -8
4
3 -1
53
Pens
acol
a Ba
y
P-25
2-1-
2 w
ire
4 -4
4
W
ater
-6
84
-693
0
-638
-6
45
1 -3
59
-395
2
-109
-1
54
3 -1
16
-153
Br-3
-2-5
sp
iral
4 -6
9 -9
2
Wat
er
-670
-6
93
0 -6
24
-643
1
-376
-3
78
2 -1
62
-153
3
-140
-1
25
Broo
ks
Br-3
-2-5
sp
acin
g re
bar
4 -1
29
-95
Appendix III (continued)

145
Tabl
e A
5 (c
ontin
ued)
Brid
ge
Pile
R
einf
orce
men
t El
evat
ion
AHT
(ft)
E vs
CSE
(mV)
R
emar
ks
Wat
er
-640
-6
43
0 -5
84
-549
1
-337
-3
00
2 -9
3 -8
1 3
-50
-26
Broo
ks
Br-3
-2-6
spira
l
4 -3
0 -8
Wat
er
-489
0 -3
60
1
-241
2 -1
68
3
-68
4
-55
152T
PN-2
w
ire
5 -7
2
W
ater
-5
67
0
-415
1 -2
67
2
-159
3 -1
10
4
-153
162W
S-1
wire
5 -1
55
Wat
er
-568
0 -3
82
1
-241
2 -1
34
3
-134
4 -1
63
162W
S-4
wire
5 -1
74
Wat
er
-410
0 -3
82
1
-275
2 -2
32
3
-131
4 -6
8
St. G
eorg
e Is
land
163W
S-3
wire
5 -5
7
Appendix III (continued)

146
Tabl
e A
5 (c
ontin
ued)
Brid
ge
Pile
R
einf
orce
men
t El
evat
ion
AHT
(ft)
E vs
CSE
(mV)
R
emar
ks
Wat
er
-407
0 -4
05
1
-321
2 -1
48
3
-136
4 -4
2
St. G
eorg
e Is
land
16
3WS-
4 w
ire
5 -4
2
Appendix III (continued)

147
Tabl
e A
6 F
ield
IRH
Mea
sure
men
ts
IRH
(%)
Brid
ge
Pile
El
evat
ion
AHT
(ft)
Tim
e M
easu
red
Cal
ibra
ted
Tem
pera
ture
(o C)
Rem
arks
10
:30
82.8
84
.7
15
Seal
ed p
robe
into
fitti
ng.
10:3
1 78
.9
80.6
16
.5
10
:33
76.3
77
.9
17.2
10:3
9 74
.6
76.1
17
10:4
7 73
.9
75.4
16
.7
10
:52
73.5
75
.0
16.6
11:0
0 72
.9
74.4
16
.5
11
:12
72.1
73
.5
16.4
11:1
9 71
.8
73.2
16
.4
H-8
-2
0.44
11:2
9 71
.4
72.8
16
.3
Ambi
ent c
ondi
tions
85%
RH
15o C
10
:31
83.5
75
.1
15.1
Se
aled
pro
be in
to fi
tting
. 10
:33
82.3
73
.7
15.1
10:3
9 81
.1
72.4
15
.2
10
:47
79.9
72
.1
15.1
10:5
2 79
.6
71.7
14
.9
11
:00
79.2
71
.1
14.9
11:1
2 78
.7
71.0
15
11:1
9 78
.6
70.7
15
H-8
-2
5
11:2
9 78
.3
70.6
15
Am
bien
t con
ditio
ns 8
5%R
H 1
5o C
11:4
1 74
.9
76.4
14
.9
Seal
ed p
robe
into
fitti
ng.
11:4
2 83
.6
85.6
14
.8
11
:45
84
86.0
14
.5
11
:50
84.6
86
.6
14.3
12:0
0 84
.9
86.9
14
.3
12
:05
84.8
86
.8
14.4
12:1
0 84
.8
86.8
14
.5
12
:15
84.8
86
.8
14.5
12:2
0 84
.7
86.7
14
.6
12
:26
84.7
86
.7
14.6
12:3
0 84
.7
86.7
14
.7
Hat
haw
ay
H-2
9-3
0.5
12:3
5 84
.6
86.6
14
.7
Appendix III (continued)

148
Tabl
e A
6 (c
ontin
ued)
IRH
(%)
Brid
ge
Pile
El
evat
ion
AHT
(ft)
Tim
e M
easu
red
Cal
ibra
ted
Tem
pera
ture
(o C)
Rem
arks
11
:41
85.1
79
.0
15.7
Se
aled
pro
be in
to fi
tting
. 11
:42
83.5
76
.4
15.1
11:4
5 82
.6
75.4
14
.7
11
:50
81.2
73
.9
14.7
12:0
0 80
.5
73.9
13
.0
12
:05
79.9
73
.3
14.7
12:1
0 79
.4
72.7
14
.8
12
:15
79.3
72
.6
15.0
12:2
0 79
72
.3
15.0
12:2
6 78
.5
71.7
15
.1
12
:30
78.5
71
.7
15.1
Hat
haw
ay
H-2
9-3
5
12:3
5 78
.4
71.6
15
.3
4:
00
- -
- Se
aled
pro
be in
to fi
tting
. 4:
02
71
66.7
18
.7
4:
04
71.6
67
.4
18.8
4:06
72
.2
68.1
18
.7
4:
10
73.2
69
.3
18.8
4:26
73
.5
69.6
19
.3
4:
33
73.7
69
.9
19.4
4:41
73
.7
69.9
19
.4
4:
46
73.8
70
.0
19.4
P110
-2
1.17
4:51
73
.9
70.1
19
.4
Ambi
ent 6
3.7%
RH
19.
6o C
4:02
-
- -
Seal
ed p
robe
into
fitti
ng.
4:04
68
.6
64.2
19
.7
4:
06
69.4
65
.2
19.6
4:10
70
.3
66.3
19
.3
4:
26
71.1
67
.2
19.4
4:33
71
.3
67.5
19
.4
4:
41
71.4
67
.6
19.5
4:46
71
.5
67.7
19
.5
Pens
acol
a Ba
y
P110
-2
5
4:51
71
.5
67.7
19
.4
Ambi
ent 6
3.7%
RH
19.
6o C
Appendix III (continued)