Embed Size (px)
Citation preview

CORROSION OF THERMALLY-AGED ADVANCED
GAS-COOLED REACTOR FUEL CLADDING
By:
PHUAH, CHIN HENG
(CID# 00577443)
Submitted in partial satisfaction of the requirements for the degree of:
DOCTOR OF PHILOSOPHY
in the:
DEPARTMENT OF MATERIALS
IMPERIAL COLLEGE LONDON
SEPTEMBER 2012

2
Abstract
The microstructure of Advanced Gas-Cooled Reactor (AGR) fuel cladding that
underpins its corrosion behaviour has been established, contributing to an
understanding of long-term control, monitoring practice and storage decisions for
this fuel. AGR fuel cladding specimens sourced from Sellafield Ltd, cut and
individually heat treated at temperatures from 400 to 800°C for 24 to 192h were
attempts to approximate irradiated AGR fuel cladding and characterised both in
terms of their corrosion behaviour and of microstructure. Niobium carbide (NbC)
second phases are the primary local corrosion sites. Bulk austenite-γ cladding metal
(50.3±1.7 at% Fe, 21.0±1.1 at% Cr and 21.0±0.4 at% Ni) around NbC precipitates
exhibited extensive corrosion even though the precipitate themselves appear
unchanged. Corrosion observed from the specimen surface took the form of lacy
covers around an NbC precipitate at the cover centre (~10 to 25 µm dia. depending
on the site) and in the subsurface were voids (~0.1 µm pin-holes), cavities (~2 to 5
µm), an envelope of dissolved-metal region along NbC peripheries (~1 µm thick
with austenite-γ composition decreased by on average 20% Fe, 21% Cr and 17% Ni)
or a large, smooth concave pit bottom comparable to the cover dimension. These
observations collectively suggest that AGR cladding corrosion is a diffusion-
controlled phenomenon where the NbC precipitate may act as the cathode in a local
galvanic couple and the adjacent austenite-γ metal is the anode that undergoes
preferential oxidation. The primary contributing factors to NbC-induced AGR
cladding corrosion are high NaCl concentration of the electrolyte solution, large NbC
precipitates, small austenite-γ grains and presence of stress in the microstructure.
Specifically, corrosion potential measurements in the 0.001M electrolyte NaCl are
~800mV (v.s. Ag|AgCl reference electrode) more noble than in the 0.1M electrolyte,
suggesting that cladding wet storage requires maintenance with lowest chloride
concentration practically achievable. Specimens with comparatively large NbC
precipitates (~5 µm) and small austenite-γ grains (~10 µm) that result from heat
treatment are ~810mV more corrosion susceptible than the as-received specimens
with ~0.1 dia. NbC precipitate and ~25 µm austenite-γ grains. Increased dislocation
densities were observed adjacent to the grown-NbC precipitate, imparting a stress-
corrosion effect on the AGR cladding corrosion.

3
Table of Contents
Abstract ..................................................................................................................... 2
Acknowledgements ................................................................................................... 5
List of Figures ........................................................................................................... 7
List of Tables .......................................................................................................... 11
List of Appendices .................................................................................................. 11
1.0 Introduction .................................................................................................. 12
1.1 Research Problem Overview .......................................................................... 12
1.2 Research Objectives ....................................................................................... 16
1.3 Organisation of Thesis ................................................................................... 18
2.0 Literature Review ......................................................................................... 19
2.1 Overview of Advanced Gas-Cooled Reactor (AGR) Fuel Cladding ............. 19
2.2 Metallurgical Properties of AGR Fuel Cladding ............................................ 25
2.3 Components Adjacent AGR Fuel Cladding: Fuels, Coolant
and Moderator ................................................................................................ 34
2.3.1 Fuel Forms ........................................................................................... 36
2.3.2 Coolant ................................................................................................. 39
2.3.3 Neutron Moderation ............................................................................. 44
2.4 Effects of Radiation Fields on AGR Fuel Cladding Corrosion ...................... 47
2.4.1 Grain Boundary Chromium Depletion ................................................. 47
2.4.2 Radiolysis of water ............................................................................... 50
2.5 Corrosion of AGR Fuel Cladding .................................................................. 52
2.5.1 Critical Factors Affecting AGR Corrosion Processes .......................... 55
2.5.2 Metal Ion Hydrolysis and Acidification of Pits ................................... 56
3.0 Experimental Methods ................................................................................. 62
3.1 Heat Treatment and Electrode Preparation of As-sourced AGR
Fuel Cladding ................................................................................................. 62
3.2 Corrosion Measurements using Anodic Polarisation ..................................... 66
3.3 Morphology Characterisation of the Polarised Working Electrode ............... 72
3.4 Morphology and Chemical Composition of Corrosion Products ................... 75

4
3.5 Microstructural Characterisation .................................................................... 80
4.0 Results and Discussion ................................................................................. 82
4.1 Electrochemical Behaviour of Thermally-Aged AGR Fuel Cladding ........... 82
4.2 Corrosion Morphologies of Post-Polarised Electrodes .................................. 91
4.3 Chemical Analysis of Subsurface Corrosion ............................................... 108
4.4 Microstructures of Heat-Treated Samples .................................................... 126
5.0 Summary – Importance of Microstructure to AGR Fuel Cladding
Corrosion ..................................................................................................... 135
6.0 Conclusions and Recommendations for Further Study .......................... 141
7.0 References .................................................................................................... 145
Appendices ............................................................................................................ 153

5
Acknowledgements
I dedicate this thesis to my father Phuah Ah Thong and my mother Yap Yoke
Peng without whose love and support it could not have been written. I have also
been writing with much inspiration from my brothers Kenny and Benny from whom
every encouraging long distance calls I was periodically able to put a pair of fresh
lenses into the project. With the deepest gratitude, I must especially thank Leo Bey
Fen, who rekindled my spirits by sparks from her love during the times when I
experienced low.
I am able to produce and accomplish this thesis because of Professor William
Lee and Professor Mary Ryan. I am indebted to their guiding and stimulating the
progress of my research in Imperial College London and, recently, correcting the
many versions of drafts in their valuable time which made the thesis consistent and
coherent. I would like to thank Dr. Paul Standring and Dr. Paul Cook at Sellafield
Limited for providing samples, as well as the Engineering and Physical Science
Research Council (EPSRC) through the Decommissioning Immobilisation and
Management of Nuclear Waste for Disposal (DIAMOND) University Consortium
and the Department of Materials for providing research funds and nuclear training
courses throughout my study. I am most grateful to Mr. Richard Chater, Dr.
Mahmoud Ardakani, Mr. Robert Rudkin and Dr. Ecaterina Ware who taught me
experimental techniques and provided invaluable suggestions for characterising my
samples. I must also thank Mr. Stephen Ramsay, Mr. Russell Stracey and Mr. Phil
Jones of the mechanical workshop who on occasions when time was most pressing
promptly repaired the broken glass-pieces of my electrochemistry kit and operated
the heavy machineries to shape my samples so I could meet conference deadlines. I
must thank Mr. Benjamin Chan and Ms. Norma Hikel for their assistance in the
laboratory and department throughout my study. I especially would like to thank
Prof. John Cosgrove, Dr. Rob Theid, Dr. Barry Jones and Ms. Gill Davies for their
unwavering encouragement in my studies.
During my academic training I have been fortunate to have gained from the
philosophies, teachings and friendship of my past mentors and supervisors who have
opened up my doors to the world. I am truly grateful to Dr. Ann Dillner, Dr. Warren
White, Dr. Nicole Hyslop, Prof. Shaliza Ibrahim, Assoc. Prof. Thomas Young,

6
Assoc. Prof. Michael Kleeman, and Dr. Sumiani Yusoff from whom I learned at the
University of California Davis and University of Malaya. I would also like to thank
family and friends whose experiences and interactions have inspired not only my
thesis but also many other aspects of my life; I am grateful to Uncle Kim, Uncle
Jason, Uncle William and Aunty Melinda, Ying Yng Choy, Kathryn Tyson, Anne
Beard, Cate Klepacki, Dr. Stephen McCord, Ben and Mary Giudice, Dr. Jon
Leatherbarrow, Jennifer Wilson, Elisabet Goula, Melanie Nägele, Dr. Esther Valliant,
Dr. Frédéric Aguesse, Marié-Christiné Esposito, Tim “Dr.” Crouch and Edoardo
Giorgi.
Finally, I want to thank all individuals who will read my thesis about
metallurgy and corrosion. It has been a unique opportunity to document such a
highly-specialised and important subject. It was composed over many excellent, fine
times during the process, and of course also times of stretching that require resilience.
It develops the thought process, critical thinking and analytical skills that I am sure
are useful in many things continuing. It cultivates good disposition and personality
that I am sure can carry me further than most things in life.

7
List of Figures
Figure 1 – Spent AGR fuel storage in THORP receipt and storage pond.................. 15
Figure 2 – Schematic illustration of experimental approach ..................................... 17
Figure 3 – Nano and macro–scale depiction of uranium dioxide UO2 nuclear fuel
swelling. ..................................................................................................................... 19
Figure 4 – Effects of fuel swelling on cladding ......................................................... 20
Figure 5 – 1000-hour rupture strength of selected austenitic stainless steels ............ 21
Figure 6 – Advanced gas-cooled reactor (AGR) fuel cladding, oxide fuel pellets and
fuel element. ............................................................................................................... 22
Figure 7 – Metal cross-section illustration of critical factors affecting AGR fuel
cladding corrosion ...................................................................................................... 24
Figure 8 – Schaffler diagram for microstructure prediction in solid solution based on
nickel and chromium concentrations ......................................................................... 28
Figure 9 – Ellingham diagram for oxidation potential by metallic elements ............. 29
Figure 10 – Limit of solubility of carbon in austenite and precipitation of chromium
carbide at the grain boundaries .................................................................................. 30
Figure 11 – Ellingham diagram for carbide formation potential by metallic elements
.................................................................................................................................... 31
Figure 12 – Dispersion of fine Mg2Si secondary phases in a precipitation-hardened
Mn-metal .................................................................................................................... 32
Figure 13 – MAGNOX uranium metal fuel and magnesium alloy fuel cladding ...... 36
Figure 14 – Fuel bearing particles dispersed in metallic matrices ............................. 39
Figure 15 – Air-cooled Windscale Plutonium Pile .................................................... 42
Figure 16 – Variation of fission cross-section over neutron energy spectrum .......... 44
Figure 17 – Segregation of alloying elements at the grain boundaries ...................... 48
Figure 18 – Effect of neutron irradiation on metallic lattice that leads to radiation-
induced segregation .................................................................................................... 49
Figure 19 – Critical factors of AGR corrosion processes .......................................... 53

8
Figure 20 – Pitting, crevice and intergranular corrosion ........................................... 55
Figure 21 – Unidirectional pit model proposed by Galvele ....................................... 58
Figure 22 – Role of manganese sulphide inclusion in corrosion processes. .............. 60
Figure 23 – Secondary Electron Image of a lacy metal cover ................................... 61
Figure 24 – Preparation of working-electrode from as-sourced AGR fuel cladding
tubes ........................................................................................................................... 64
Figure 25 – Three electrode cell notations and operating principles ......................... 67
Figure 26 – Raw current measurements in a three-electrode cell and procedures for
normalising the measured current to surface area submerged in electrolyte. ............ 69
Figure 27 – Evaluation of pit or crevice‟s width and depth of the post-polarised
working electrode ....................................................................................................... 73
Figure 28 – Build-up of white-light interference on sample surface ......................... 74
Figure 29 – FIB cross-section preparation for TEM analysis .................................... 77
Figure 30 – Lift-out procedure for transferring a FIB-section to TEM grid .............. 79
Figure 31 – Electrode potential measurements of the heat-treated samples obtained at
benchmark current density of 5.0 mA.cm-2
in 0.001M and 0.1M electrolyte-NaCl .. 84
Figure 32 – Anodic polarisation curves for 700°C 48, 96 and 192h heat-heated
samples in 0.001M and 0.1M electrolyte-NaCl. ........................................................ 85
Figure 33 – Anodic polarisation curves for 500°C 48, 96 and 192h heat-heated
samples in 0.001M and 0.1M electrolyte-NaCl ......................................................... 86
Figure 34 – Percent changes in electrode potential in response to varying heat
treatment time for all temperatures ............................................................................ 87
Figure 35 – Electrode potential measured at constant current density of 5.0 mAcm-2
as a function of heat treatment time in electrolyte-NaCl 0.1M. Note that the dotted-
lines are smoothed-curves. ......................................................................................... 88
Figure 36 – Surface conditions of post-polarised working electrodes ....................... 92
Figure 37 – Opacity of electrolyte solution containing dissolved metal ions ............ 93
Figure 38 – Crevice corrosion on 800°C 192h post-polarised electrode ................... 95

9
Figure 39 – Occurrences of pitting corrosion in the post-polarised 800°C 192h post-
polarised electrode ..................................................................................................... 97
Figure 40 – Typical size and feature of lacy corrosion covers .................................. 98
Figure 41 – Depth profiling of 600°C 192h sample with interferometers ............... 100
Figure 42 – Subsurface geometry characterisation of pit using FIB on 500°C 192h
sample ...................................................................................................................... 101
Figure 43 – Subsurface geometry characterisation of crevice using FIB on 500°C
192h sample ............................................................................................................. 102
Figure 44 – Subsurface development of pits in 800°C 192h sample. ...................... 104
Figure 45 – Salt deposits on the metal-resin interface of the unrinsed, post-polarised
500°C 96h heat treated electrode.............................................................................. 106
Figure 46 – Salt deposit morphologies of the unrinsed, post-polarised 500°C 96h heat
treated electrode ....................................................................................................... 107
Figure 47 – FIB cross-sections of as-received AGR fuel cladding .......................... 109
Figure 48 – X-ray analyses of the FIB cross-section from the as-received AGR fuel
cladding .................................................................................................................... 110
Figure 49 – Scanning-probe analysis of the niobium-manganese-niobium rich
precipitates from site #8 of the as-received AGR fuel cladding specimen .............. 111
Figure 50 – FIB cross-section analyses with a scanning probe of the 500°C 192h
post-polarised working electrode ............................................................................. 114
Figure 51 – FIB cross-section of high dislocation densities and scanning probe
analyses of the 500°C 192h heated post-polarised working electrode ..................... 115
Figure 52 – X-ray analyses of the FIB cross-section from the 500°C 192h AGR fuel
cladding .................................................................................................................... 116
Figure 53 – FIB cross-section of the 600°C 192h heated post-polarised working
electrode.. ................................................................................................................. 117
Figure 54 – X-ray analyses of FIB cross-section from 600°C 192h AGR fuel
cladding .................................................................................................................... 118

10
Figure 55 – FIB cross-section of the 600°C 192h heated post-polarised working
electrode ................................................................................................................... 119
Figure 56 – X-ray analyses of the FIB cross-section from the 600°C 192h AGR fuel
cladding .................................................................................................................... 120
Figure 57 – X-ray spectra indicating counts of elements from the 600°C 192h AGR
fuel cladding ............................................................................................................. 121
Figure 58 – FIB cross-section of the 800°C 192h heated post-polarised working
electrode ................................................................................................................... 124
Figure 59 – X-ray analyses of the FIB cross-section from the 800°C 192-hour AGR
fuel cladding ............................................................................................................. 125
Figure 60 – SEM images of as-received AGR fuel cladding microstructures from
several etchants ........................................................................................................ 126
Figure 61 – Microstructure and precipitate count of as-received AGR fuel cladding
.................................................................................................................................. 128
Figure 62 – Microstructure and precipitate count of 500°C 192h heated sample .... 129
Figure 63 – Microstructure and precipitate count of 600°C 192h heated sample .... 130
Figure 64 – Microstructure and precipitate count of 800°C 192h heated sample .... 131
Figure 65 – Variation in number of precipitates and maximum precipitate diameter
with E5.0 .................................................................................................................... 132
Figure 66 – Illustration of increased probability of NbC grain boundary contact with
the austenite matrix (γ) with heat treatment ............................................................. 133
Figure 67 – Illustration of AGR fuel cladding microstructures that underpin its
corrosion behaviour .................................................................................................. 140

11
List of Tables
Table 1 – Physical properties of AGR fuel cladding ................................................. 25
Table 2 – Physical properties of important alloying elements for nuclear
applications ............................................................................................................... 27
Table 3 – Precipitate formation in AGR fuel cladding .............................................. 33
Table 4 – Nuclear power development in the United Kingdom ................................ 35
Table 5 – Physical properties of metals and oxide fuels ............................................ 37
Table 6 – Fission isotopes, energies and thermal fission cross-sections ................... 40
Table 7 – Comparison of coolant fluid for nuclear reactors ...................................... 43
Table 8 – Physical properties of neutron-moderating materials ................................ 45
Table 9 – Elementary equations and rate constants of water radiolysis .................... 51
Table 10 – Anodic and cathodic reactions on surface................................................ 57
Table 11 – Determination of etchant for metallographic examination ...................... 80
Table 12 – Secondary phase distribution and size of on heat treatment .................. 132
List of Appendices
Appendix 1 – MATLAB algorithm for electrode surface area determination ......... 153

12
1.0 Introduction
1.1 Research Problem Overview
The Advanced Gas-Cooled Reactor (AGR) has been the primary generation of
nuclear electricity in the UK for the past several decades, producing ~15% of the
nation‟s electricity at its peak. Corrosion of the spent AGR fuel cladding – the metal
rod that encapsulate the ~4%-enriched uranium oxide fuel pellets and made of
austenite-γ stainless steel 20Cr/25Ni/Nb (50.3±1.7 at% Fe, 21.0±1.1 at% Cr,
21.0±0.4 at% Ni and 0.07 at% Nb) – have important, long term implications due to
the long-lived radioactive fission products that are contained within the cladding
which microstructure adversely impacted from radiation damage effects. The
implications are their management measures that include interim storage, handling,
transport and geological disposal.
Currently, spent fuels arise from seven AGR power stations (Dungeness B,
Hinkley Point B, Hunterston B, Hartlepool, Heysham 1 &2, and Torness). Their
subsequent interim store lifecycle include boric acid storage in station ponds for
several months, a pond dosed with corrosion inhibitors caustic soda at pH 11.4 or an
undosed pond that are maintained with demineralised water at pH7 in Sellafield
(following rail transfer) and potentially emplacement in a geological disposal facility
(GDF) that would be available around year 2075.
Overall, interim storage of the spent fuels under wet environments, hence
corrosion concern of the fuel cladding, are expected to last for several decades and
may even extend in the GDF environments should a first wet condition potentially
occur beyond year 2075. So, while the current use of corrosion inhibitor has
demonstrated measurable success in controlling cladding corrosion, the underlying
corrosion mechanisms and its mode of control has nonetheless been an important
subject in order to provide a more comprehensive understanding on the implications
of AGR spent fuel management strategy.
The focus of the investigation reported in this thesis is the impact of
microstructure and secondary phase formation on Advanced Gas-Cooled Reactor
(AGR) fuel cladding corrosion in chloride aqueous solutions, amongst other known
corrosion factors which include radiation-induced segregation and thermal
sensitisation. The experimental conditions of the investigation are reflective of the

13
AGR fuel cladding storage in the demineralised-water Receipt and Storage Pond at
the Thermal Oxide Reprocessing Plant (THORP). THORP, built in 1994 and situated
in Sellafield, Cumbria, is a facility that reprocesses both the AGR spent fuels and the
Light Water Reactors‟ (LWR) that were contracted from overseas customers to
recover plutonium and uranium for Mixed-Oxide (MOX) fuel fabrication and to
separate fission products (FPs) for improving its management. The fuels are interim
stored in the pond for approximately five years until their decay heat dissipates to
safe levels for reprocessing to be undertaken or, the more recent proposal, permanent
disposal in a geological repository. Due to Sellafield‟s coastline proximity, trace
amounts of environmental constituents that originate from the sea-salt particles or
aerosol droplets including sodium, chloride and sulphate, about 50ppm, have been
accidentally introduced into the pond which pose corrosion concerns [1, 2].
Both the AGR and LWR spent fuels stored in the Receipt and Storage Pond are
stored in stainless steel containers (Figure 1) to minimise leakage risk and provide
criticality control. Specifically, the AGR fuel elements are encased in stainless steel
316L „skips‟ whereas the LWRs are in Multi-Element Bottles (MEB) that are lined
with neutron-absorbing boronated-aluminium plates or „Boral‟ [2]. In addition to the
container metals, the fuel cladding that maintains the structural integrity of the fuels
containing FPs is made of austenitic stainless steel 20Cr/25Ni/Nb for the AGRs
whereas Zircaloy or Zirconium Alloy for the LWRs. There has, therefore, been no
dosage to the demineralised-water with corrosion inhibitors or other pH control
measures because co-location of the metal mixes may risk complex electrochemical
behaviour. The pond is currently maintained with high-quality demineralised-water
in a reinforced concrete pool with water circulation to provide decay heat removal
and filtration to ensure thorough mixing of freshly treated water returning from the
demineralising chemical plant.
The recent Nuclear Decommissioning Authority (NDA) strategic plan has
required extending both the AGR and LWR spent fuel in THORP‟s Receipt and
Storage Pond for a further 80 years [2]. From THORP‟s spent fuel storage technical
department standpoint, currently with about 20 years of operating experience, this
strategy requires a safety case for long-term integrity of the fuel cladding against
corrosion in the ponds, either through employing a potential corrosion inhibitor that

14
is compatible with both the AGR and LWR fuels and their containers or
demonstrating the viability of demineralised-water as a long term storage solution
[3]. On-going studies which include work by Herbert et al. [4] and Hands et al. [5, 6]
have identified that nitrate-based corrosion inhibitor are compatible with both the
AGR and LWR fuels, thus a potentially viable long term storage solution. Note that
the AGR Storage Pond (not in THORP) that stores only the AGR spent fuel currently
employs caustic soda (NaOH) at pH 11.5 as corrosion inhibitor that has successfully
controlled austenitic stainless steel corrosion – not an option, however, for the
Receipt and Storage Pond because caustic soda is corrosive to aluminium in the
LWR‟s MEB via the dissolution reaction Al(s)+NaOH(aq)→Al(OH)4-
(aq)+H2(g).
Whilst empirical data showed that the use of both nitrate and caustic soda corrosion
inhibitor can arrest AGR fuel cladding corrosion (see work by Herbert et al. [4] and
Hands et al. [5, 6]), the microstructures and mechanisms that underpin this corrosion
control or behaviour have not been clarified. This thesis investigates the latter to
contribute to informing the long-term aqueous corrosion control, monitoring practice
or storage decisions (e.g. dry storage in geological repository) of the AGR spent fuel.
As a general overview, this investigation involves sourcing an as-manufactured
AGR fuel cladding from Sellafield Ltd as the raw material for experimentation. The
associated experiments have been carried out in a non-irradiative environment with
the advanced microstructure characterisation capabilities in the Materials
Department of Imperial College London under the aims outlined in Work Package 3
(WP3) of the Decommissioning, Immobilisation and Management of Nuclear waste
for Disposal (DIAMOND) Universities research consortium working in
collaboration with industry supervisers from THORP Technical Department,
Sellafield Ltd. The sourced cladding was subjected to temperature processing
between 400 and 800°C that mimics the gradient or hot-spots along the cladding‟s
one metre length and was subsequently tested for corrosion susceptibility at low
chloride concentrations (0.001M) close to that measured in the demineralised-water
pond. The relationship between corrosion susceptibility and the variety of
microstructures and secondary phase size and distribution that renders it corrosion
susceptible, including corrosion morphologies and their aspect ratios and grain and
grain boundary chemical compositions, are established in this thesis.

15
LWR‟s Multi-Element Bottles
made of aluminium alloy
Demineralised-water Pond Storage
LWR fuel elements (~5m long) with
Zircaloy fuel cladding
Figure 1 – Spent AGR fuel storage in THORP Receipt and Storage Pond
AGR fuel elements (~1m long) with
austenitic 20Cr/25Ni/Nb stainless
steel fuel cladding in AGR‟s „skips‟
made of stainless steel 316L

16
1.2 Research Objectives
The experimental approach for investigating the relations between
microstructure and secondary phases of the AGR fuel cladding and its associated
corrosion behaviour is schematically illustrated in Figure 2. The specific research
objectives are:
I. Identification from the literature of the AGR fuel cladding temperature
processing conditions and in the reactor as well as storage conditions in the
demineralised-water pond to simulate laboratory conditions that mimics in-
situ corrosion environment.
II. Production of a varied microstructure of the as-sourced AGR fuel cladding
specimens that have been individually thermally-aged at discrete
temperatures of 400, 500, 600, 700 and 800 °C for 24, 48, 96 and 192 hours
and fabricated as electrodes. The thermal aging employed simulates the
temperature range across the eight AGR fuel elements, stacked that form a
stringer in AGR reactors.
III. Establishment of the effect of chloride concentrations on AGR fuel cladding
corrosion through corrosion potential quantification, using the anodic
polarisation method, of the thermally-aged specimens (fabricated as
electrodes) in both 0.001M and 0.1 M sodium chloride (NaCl) electrolyte.
IV. Characterisation of the surface corrosion morphology of the post-polarised
electrodes by Scanning Electron Microscopy (SEM).
V. Characterisation of the subsurface corrosion morphology of the post-
polarised electrodes; specifically Focused Ion Beam (FIB) cross-sections
were acquired from subsurface corrosion morphologies of interest and
subsequently characterised by Transmission Electron Microscopy (TEM)
for chemical composition of the austenite grains, grain boundaries and
secondary phases using Energy Dispersive X-ray Spectroscopy (EDS).
VI. Development of a suitable etchant for revealing in the SEM the physical
distribution of the austenite grains, grain boundaries and secondary phases
that are varied due to thermal-aging. This includes development of an
approach for quantifying the distribution of secondary phases by image
processing.

17
ELUCIDATE EFFECT OF THERMAL ANNEALING
ON MICROSTRUCTURE EVOLUTION AND
CORROSION POTENTIAL
[Methods in Section 3.1]
MEASURE CORROSION
POTENTIAL OF THERMALLY
ANNEALED SAMPLES
[Methods in Section 3.2]
Surface Corrosion Morphology
Characterisation [Methods in Section 3.3]
Sub-surface Corrosion Morphology
Characterisation [Methods in Section 3.4]
Figure 2 – Schematic illustration of experimental approach
QUANTIFY SIZE, DISTRIBUTION AND
COMPOSITION OF GRAINS,
PRECIPITATES AND THEIR INTERFACES
[Methods in Section 3.5]
Experimental Aims Specific Objectives
Legend:
correlations to be established
Corrosion Potential
Measurements via Anodic
Polarisation Method
(Results in Section 4.1)
Testing sample with
suitable etchant and
subsequent SEM
characterisation
(Results in Section 4.4)
Morphologies of Pits
and Crevices via SEM
characterisation
(Results in Section 4.2)
Composition of Secondary
Phases, Grains and Grain
Boundaries of FIB-Prepared
Cross-sections in TEM
(Results in Section 4.3)
III.
IV.
VI.
V.

18
1.3 Organisation of Thesis
This thesis is organised in seven chapters. Chapter 1.0 Introduction herein
describes the research problem, objectives of the study and structure of the thesis.
Chapter 2.0 Literature Review retrieved literature relating to three key areas: i)
development, lifecycle and metallurgical properties of the AGR fuel cladding, ii)
effects of radiation damage and high-temperature oxidation on the fuel cladding, and
iii) metal corrosion processes that are relevant to the AGR fuel cladding drawn from
corrosion studies of other materials. Chapter 3.0 Methods describes the specific
characterisation techniques, for example electrode fabrication from the thermally-
aged cladding specimens and a detailed description of the anodic polarisation
method employed for their corrosion tests, and targeted measurements which were
employed to achieve the research objectives above outlined. Chapter 4.0 Results and
Discussion links the critical microstructural factors for AGR fuel cladding corrosion
susceptibility, which includes results from the corrosion potential measurements,
surface and subsurface corrosion morphologies and physical microstructural features
revealed by the etched electrodes. In Chapter 5.0 Summary the relevance of study for
the long-term corrosion control, monitoring and storage decisions of the AGR fuel
cladding are discussed. Chapter 6.0 Conclusions and Future Work underlines the
key strengths and contributions specific to this study and to corrosion science in
general and suggests opportunities for future experiments that have led from the
conclusions. Chapter 7.0 References provides a reference list to the Literature
Review and Discussion sections. An Appendix concerning the image processing
algorithms developed for determining the electrode surface area in the corrosion
potential measurements (used in normalisation of the measured current) is included.

19
2.0 Literature Review
2.1 Overview of Advanced Gas-Cooled Reactor (AGR) Fuel Cladding
Within a nuclear fuel element fuel cladding is the component that encapsulates
the nuclear fuels. The fuel cladding is made of rigid materials, commonly stainless
steel or other alloys that possess relatively high structural strength, in order to
maintain the geometry of the nuclear fuels against excessive swelling [7, 8] and
contain internal gas pressure. Swelling or buckling of nuclear fuels is a result of
neutron irradiation that is principally attributed to the accumulation of three primary
fission gases: helium from (n,α) decay reactions and krypton-85 (Kr-85) and xenon-
133 (Xe-133) from fission reactions. Figure 3a shows a fission gas „bubble‟ that
Figure 3 – Nano and macro–scale depiction of uranium dioxide UO2
nuclear fuel swelling.
Fuel Cladding UO2-ceramic
Nuclear Fuel
b) cross-section of
nuclear fuel and
cladding, adapted from
Glasgow et al. [7]
a) volume of fission gas
molecule (4πr3/3, r = radius)
exerting pressure (p) on the
fuel matrix

20
exerts stresses on the adjacent solid in the nuclear fuel matrix. Continuous irradiation
promotes coalescence of the initial bubbles to form larger bubbles that, due to the
volume they occupy, cause considerable build-up of radial cracks in the fuel and
stresses to the internal walls of the cladding [7]. Note that the hollow space in the
fuel centre (Figure 3b) is designed to accommodate fission gases. In certain fuel
element designs, both ends of the fuel incorporate additional free spaces called a
„plenum‟ for this purpose. Figure 4 depicts the mechanical impact of fuel swelling on
the cladding which includes pellet-clad interactions and regions of stress
concentration along the length of the cladding. The primary objective of the fuel
cladding is, therefore, to provide adequate containment of the fuel against rupture
that might lead to escape of FPs to the environment.
Conforming to the „strong‟ cladding requirement, the AGR employs an
austenitic stainless steel cladding, around the 4% enriched uranium dioxide (UO2)
fuel pellets, that has a nominal alloy composition of 20%wt Cr and 25%wt Ni
stabilised with 0.7%wt Nb. Commonly known as the 20/25/Nb steel, Figure 5
illustrates the metal possesses one of the best high-temperature mechanical
performances indicated by its excellent 1000-hour rupture strength [9].
Figure 4 – Effects of fuel swelling on cladding, adapted from Olander [34]
Pellet-clad interaction
Stress concentration
Plenum
Plenum

21
Figure 6a shows an AGR fuel cladding. It measures one metre long by one-
and-a-half centimetres diameter with 0.38 millimetres (mm) wall thickness. There
are circumferential threads that are 0.31 mm tall at every 2.5 mm pitch to improve
heat transfer with the circulating carbon dioxide (CO2) gas coolant. The cladding
encapsulates sixty-four UO2 fuel pellets (Figure 6b), each measuring 13 mm tall, 13
mm outer diameter and 1.5 mm diameter at the hollow region at the centre of the fuel
pellet that are intended for fission gas accommodation and reduce fuel peak
temperature. The fuel pellets that are contained and secured within the fuel cladding
are referred as a unit of fuel pin. Figure 6c shows that a unit of AGR fuel element
consists of thirty-six fuel pins which are secured by metal braces (also 20Cr/25Ni/Nb
steel) which maintain the fuel pins-element geometry [10]. Surrounding the fuel pins
are the neutron-moderating graphite sleeves. The fuel element is readily employable
by the AGR reactor core for on-load refuelling without powering-down.
Figure 5 – 1000-hour rupture strength of selected austenitic stainless steels,
adapted from ATI Allegheny Ludlum Brochure [9]
Lower grade
stainless steels

22
Figure 6 – Advanced gas-cooled reactor (AGR) fuel cladding (a), oxide
fuel pellets (b) and fuel element (c). Figures adapted from Westinghouse
Electric Company Brochure [10]
a) AGR fuel cladding
and dimension
c) AGR fuel element
b) AGR‟s 4%-enriched
UO2 fuel pellet
1.0m long by
1.5cm diameter
fuel pin
braces
graphite sleeve

23
The fuel cladding is not only subjected to the internal stresses that arise from
fuel pellet swelling, but also, directly, to a flux of thermal neutrons of ~1012
neutrons/m2 [11] and an axial temperature variation between 400°C (bottom of
stringer) to as high as 800°C (mid-stringer) in a circulation of CO2-coolant at a
pressure of 45.2 bar [12]. In broad terms, exposure to these conditions adversely
affects the fuel cladding including causing degradation in mechanical performance
(e.g., helium embrittlement), degradation in thermal properties (e.g., formation of
gas bubbles which disrupt the heat transfer), dimensional changes (e.g., creep and
thermal expansion due to radiation damage), and corrosion susceptibility (e.g.,
intergranular corrosion caused by grain boundary chromium depletion).
Parallel to the thesis‟ objectives this literature review focuses on the factors
which influence the corrosion susceptibility of fuel cladding. Section 2.2 examines
the metallurgical basis of the fuel cladding specific to the AGRs. Specifically, the
formation of the primary austenitic microstructure, its grain boundaries and the
niobium-based secondary phases in the cladding are elucidated, since one of the
causes of corrosion is believed to be the presence and size of the secondary phases,
for instance around manganese-sulphide inclusions [13-15]. Section 2.3 examines
the relation between the fuel cladding and the individual components surrounded by
it, i.e., the nuclear fuels, coolant and moderator, that may lead to corrosion
susceptible conditions. In respect to the pellet-clad interactions and regions of stress
concentration along the length of the cladding previously mentioned, the CO2
oxidation and temperature cycling of the cladding results in surface inhomogeneities
that may become potential corrosion sites [16, 17]. Section 2.4 reviews the direct
effects of radiation on the cladding. It has been established that phenomena such as
grain boundary chromium depletion [18, 19] and the hydrolysis of water by α, β, and
γ emissions [11] are correlated to corrosion susceptibility. Lastly, section 2.5 reviews
the manifestation, mechanisms and environmental factors that pertain to the wet
storage of the spent AGR fuel cladding.
To summarise and as a guiding post Figure 7 illustrates an overview of the
critical factors that affect the AGR fuel cladding corrosion which is discussed in the
literature review.

24
Formation of secondary phases in cladding metal
Grain boundaries between austenite grains,
potentially chromium depleted.
Salt film formation
Chloride from the environment in the cooling
ponds
Dissolved metal ion from the solid. May exist as
intermediate complexes
Transfer of electrons to cathodic sites, usually at
the metal surface where O2 is available
Water radiolysis because the AGR metal has been
irradiated
H+ acidified
pits
Mn+
Legend:
Cl-
Figure 7 – Metal cross-section illustration of critical factors affecting AGR
fuel cladding corrosion
Mn+
Re-passivated pits
(either individually or
around inclusions)
Cl-
e-
e-
Possible salt-
film formation
Water radiolysis
(AGR metal has been
irradiated)
Metal surface as
cathodic site:
O2 +2H2O+4e-→4OH
-

25
2.2 Metallurgical Properties of AGR Fuel Cladding
The physical properties of the AGR fuel cladding, austenitic stainless steel
with a nominal alloy composition of 20%wt Cr and 25%wt Ni stabilised with
0.7%wt Nb, are summarised in Table 1 (data adapted from Waddington and Jones
[20]). The cladding possesses a melting temperature of about 1390°C, a relatively
high value compared to, for example, zinc alloys that fully melt at 477°C [21]. Its
density of 8.0 Mgm-3
is close to that of iron (7.87 Mgm-3
). The specific heat of 628
J/kg.K is a relatively low value compared to, for example, quartz (SiO2) which has a
high specific heat capacity of 1000 J/kg.K [22], which indicates that the fission heat
from the fuel pellets can be more efficiently extracted through the fuel cladding into
the circulating CO2 coolant. The thermal expansion of the cladding given by the
equation and constants in row 6 of Table 1 is a measure of thermal strain that the
metal potentially develops due to the cladding‟s expansion and contraction over the
Table 1 – Physical properties of AGR fuel cladding [20]
Properties Values
Typical alloy
composition (wt%)
chromium (Cr) – 20.12
nickel (Ni) – 25
niobium (Nb) – 0.7
silicon (Si) – 0.57
manganese (Mn) – 0.62
carbon (C) – 0.049
sulphur (S) – 0.004
tantalum (Ta) – <0.05
phosphorus (P) – 0.006
nitrogen (N) – 0.016
iron (Fe) – balance
Melting temperature 1390°C (solidus). 1460°C (liquidus)
Atomic volume 1.15x10⁻²⁹
m3
Density 8.01 Mgm-3
(25°C)
Specific heat 628 J/kg.K (750°C)
Thermal expansion LT=L0(1+αT+βT2), α=16.0 x 10
-6, β =2.97 x 10
-9
Thermal conductivity 20.09 W/m.K (500°C), 24.28 W/m.K (750°C)
Emissivity 0.4 (surface oxidized in CO2)
Thermal Neutron
Absorption Cross-
Sections
3.22 barns (averaged across all alloying elements)

26
course of temperature cycling on power adjustments in the reactor core. At an
arbitrary temperature of 600°C the cladding is predicted to elongate about 1.5% from
its original length. Compared to zinc alloys, for example, which at 600°C elongates
by about 6% of its original length [23], the cladding metal possesses better thermal
stability. Its thermal conductivity value of about 25 W/m.K, intermediate between
high thermal conductivity materials such as aluminium (247 W/m.K) and copper
(398 W/m.K) and insulator materials such as quartz (3 W/m.K) [21], adequately
transfers the fission heat from the fuel pellet to the CO2 coolant. The cladding has an
average thermal neutron absorption cross section (σa) of about 3.22 barns. The term
cross section is synonymous with probability, i.e. the probability of a thermal
neutron being absorbed by the cladding, if not otherwise fissioned (σf) or scattered
(σs). In general, elements that possess low σa values are desirable as construction
materials for nuclear applications because neutron losses due to absorption by the
surrounding system are minimised. The element zirconium, for instance, possesses
one of the lowest σa values of only 0.18 barns hence it is an important element in
structural materials for water-cooled reactors when water itself is a neutron absorber
[21]. Table 2 is a compilation of physical properties of several common metal
elements for nuclear application which compares the σa values of the AGR fuel
cladding‟s individual alloying elements.
The cladding contains about 20%wt Cr and 25%wt Ni which is relatively high
compared to other stainless steels. The alloy composition is intended to primarily
produce austenitic grains which are desired to retain its physical and mechanical
properties up to temperatures of approximately 1000 °C [21]. Figure 8 shows the
Schaffler diagram which estimates the metallurgical phases present in stainless steels
based on their chromium and nickel contents. It is shown that the austenite
microstructure is promoted by nickel (e.g., no nickel no austenite), also known as an
austenite stabiliser, in contrast to chromium which promotes the ferrite phase. The
austenite grains are a solid solution of nickel and chromium solute atoms that are
homogeneously and randomly distributed among the solvent atoms iron in the face-
centred cubic lattice (γ) without clusters of separate phases.

27
Table 2 – Physical properties of important alloying elements for nuclear applications [23]
Element Al Be Cr Cu Fe Mg Mo Ni Nb Ta Ti Te Zr
Density, (g/m3) 2.67 1.85 7.19 8.96 7.87 1.74 10.22 8.90 8.57 16.60 4.51 19.30 6.50
Atomic Weight 26.98 9.01 52.00 63.55 55.85 24.31 95.94 58.69 92.91 180.9 47.87 183.8 91.92
Thermal Neutron Absorption
Cross-Section (barns)
0.23 0.01 2.90 3.70 2.50 0.06 2.50 4.60 1.10 21.00 5.60 19.00 0.18
Thermal Neutron Scattering
Cross-Section (barns)
1.50 7.63 3.49 8.03 11.62 3.71 5.71 18.50 6.26 6.01 4.35 4.60 6.46
Melting Temp. (°C) 655 - - 1080 1535 - 2610 1315 2470 2995 1683 3410 1852
Thermal Conductivity @25°C
(W/m.K)
247 210 67 398 80.4 155 142 82.9 52.3 54.4 11.4 160 21.1
Tensile Strength (MPa) 50 400 83 209 265 90 600 317 585 - - 150 -

28
The cladding contains 20 %wt Cr which gives the metal its remarkable
corrosion and oxidation resistance. Generally found in iron that is alloyed above
12 %wt Cr, these qualities are attributed to the spontaneous formation of a ~2 – 3nm
thick chromium-oxide film on exposure to the atmosphere. Also referred to as the
passive film these protective scales formed on the outermost layer of the cladding‟s
surface prevent oxidation of the structural alloy beneath it. An Ellingham diagram
(Figure 9) shows that the potential for chromium-oxide (Cr2O3) formation is higher
than that of the iron oxide (FeO) indicative of its lower ΔG or Gibbs Free Energy
value [24]. In essence a process or formation that has a comparatively lower ΔG
value indicates that it is more likely to occur. With regards to the passive film one of
the most challenging issues in corrosion science is in elucidating the mechanisms
and conditions that lead to its breakdown which subsequently results in iron
dissolution.
Niobium, as a minor alloying element of about 0.7 %wt, serves two roles in the
cladding: first „stabilising‟ its austenitic microstructure against a condition called
Figure 8 – Schaffler diagram for microstructure prediction in solid solution
based on nickel and chromium concentrations, adapted from Sedriks [53]
AGR cladding X

29
thermal sensitisation and second, improving the creep and structural strength of the
fuel cladding through precipitation hardening.
Thermal sensitisation is characterised by the precipitation of chromium by the
free carbon atoms in the metal‟s matrix to form chromium carbides (M23C6, M
denotes chromium predominantly but also some iron) which primarily occurs along
the grain boundaries at elevated temperatures between 400 to 800°C [25]. Figure 10a
shows that chromium from the grain boundary is precipitated as M23C6, raising
intergranular corrosion concerns. From the steelmaking perspective, „stabilising‟ the
metal refers to trapping the free carbon atoms by stabilising elements such as
niobium, tantalum and titanium [23]. Note that free carbon always exists in the
lattices of bulk iron matrices, about 2 to 4wt% in carbon steel [26]. Even though the
carbon concentration in the cladding has been specifically limited to about
0.049 %wt (composition indicated in Table 1), Evans et al. [16, 27] and Millward et
Figure 9 – Ellingham diagram for oxidation potential by metallic
elements, adapted from He et al. [24]
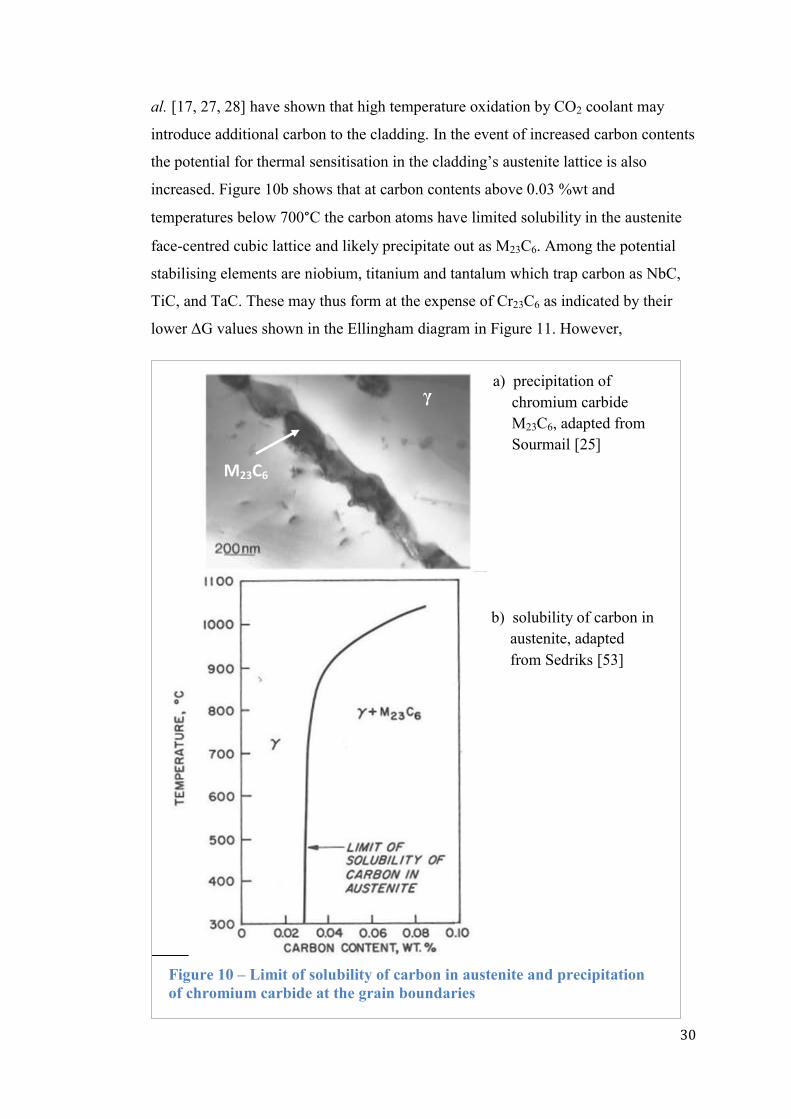
30
al. [17, 27, 28] have shown that high temperature oxidation by CO2 coolant may
introduce additional carbon to the cladding. In the event of increased carbon contents
the potential for thermal sensitisation in the cladding‟s austenite lattice is also
increased. Figure 10b shows that at carbon contents above 0.03 %wt and
temperatures below 700°C the carbon atoms have limited solubility in the austenite
face-centred cubic lattice and likely precipitate out as M23C6. Among the potential
stabilising elements are niobium, titanium and tantalum which trap carbon as NbC,
TiC, and TaC. These may thus form at the expense of Cr23C6 as indicated by their
lower ΔG values shown in the Ellingham diagram in Figure 11. However,
Figure 10 – Limit of solubility of carbon in austenite and precipitation
of chromium carbide at the grain boundaries
γ
M23C6
b) solubility of carbon in
austenite, adapted
from Sedriks [53]
a) precipitation of
chromium carbide
M23C6, adapted from
Sourmail [25]

31
niobium is invariably used in nuclear applications due to its low thermal neutron
capture cross-section (1.1 barns) as compared to titanium and tantalum which have
higher cross-sections (5.6 and 21.0 respectively, Table 2). Addition of niobium equal
to 10 times the carbon content of the steel is deemed necessary to prevent M23C6
precipitation [23]. On a separate but related note, grain boundary chromium
depletion may also be caused by the radiation-induced segregation phenomenon
which is reviewed in section 2.4.
Creep, on the other hand, is the tendency of a solid material to become
permanently deformed after long periods of exposure to stress levels that are below
the yield strength of the material. Creep strength of a solid material is improved by a
phenomena and steel making practice called precipitation hardening. Precipitation
hardening is „the hardening in metals caused by the precipitation of a constituent
from a super-saturated solid solution [21]. Figure 12 shows a micrograph which
Figure 11 – Ellingham diagram for carbide formation potential by
metallic elements, adapted from He et. al. [24]

32
illustrates precipitation hardening by the finely dispersed constituent Mg2Si (a
secondary phase) in the manganese-matrix. These constituents gives the metal
remarkable creep strengthening by trapping the dislocations and voids in its lattice
[29].
The role of niobium in the precipitation strengthening of the steel can be
assimilated from the ideas of Merica and Merica et al. [30, 31]. Merica, one of the
pioneering investigators of the phenomenon, first described precipitation
strengthening in Duralumin, an alloy of aluminium containing about 5 %wt of
copper and magnesium that is precipitation-hardened by CuAl2. Of relevance to the
AGR fuel cladding, the solute atoms Nb can absorb into the atomic lattice, i.e., solid
solution, of the austenite. Its solubility, however, varies considerably with
temperature. At temperatures near to its melting point of 1390°C which occurs in
practical steelmaking the austenite solid solution possesses the highest solubility
where most of the Nb is absorbed in its lattice. At low temperatures, however, the
solubility of Nb in the metal lattice is decreased markedly. Therefore, upon drastic
cooling or quenching, the excess Nb is precipitated as secondary phases, usually
NbC carbide, in the supersaturated solid solution. It is the dispersion of these NbC
Figure 12 – Dispersion of fine Mg2Si secondary phases in a precipitation-
hardened Mn-metal, adapted from Martin [29]
Mg2Si
Mn

33
carbides which give the initial structural strength and creep resistance of the steel. To
enhancement these initial properties, the precipitation hardening technique
specifically involves a final heat aging step at intermediate temperature which is
intended to optimise the size and distribution of the NbC carbides that further
improves its creep and structural strength. Table 3 lists the types of secondary phases
of about 0.5 µm that are randomly distributed in the AGR fuel cladding lattice which
has a uniform grain size of ~25 µm [20].
Table 3 – Precipitate formation in AGR fuel cladding
1. Processing route for AGR Fuel Cladding [20]:
Stage Process
1 Anneal thick-walled tube for 5 min at 1025°C
2 Cold draw ~25%
3 Machine ribs on tube
4 Load pellets and weld on end caps
5 Hydraulically pressurise onto the fuel
6 Anneal 930°C for 1h
2. Types of Precipitate Formation [20]:
Secondary Phases Crystal State Lattice Parameter, nm
a c
Nb(C,N) Cubic a=0.443 -
M6(C,N) Cubic a=1.125 -
M23(C,N)6 Cubic a=1.064 -
Fe2Nb Hex a=0.483 c=0.788
Fe-Cr (σ-phase) Hex a=0.879 c=0.454
Cr2Nb2(C,N)2 (Z-phase) Hex a=0.303 c=0.739
*M indicates alloying elements other than Fe, e.g. Ni or Cr

34
2.3 Components Adjacet AGR Fuel Cladding: Fuels, Coolant and Moderator
This section examines the relations between the AGR fuel cladding and its
adjacent components which include the 4% enriched uranium dioxide (UO2) nuclear
fuel pellets, carbon dioxide (CO2) coolant fluid and the graphite moderator. The
cladding‟s interactions with the latter impacts its metallurgical state and in turn its
corrosion susceptibility. In broad terms, nuclear fuels are responsible for sustaining
the fission chain reactions whereas the cladding retains the FPs and other radioactive
species so preventing their escape to the environment. The moderator governs the
type of fission physics occurring whereas the coolant absorbs and transports its heat
to the power generation systems. A review of these individual components adjacent
to the AGR fuel cladding highlights the underlying causes of issues such as pellet-
clad interactions and oxidation of the cladding by CO2 which impacts corrosion. In
wider terms, these issues are not only confronted in AGRs but also in the majority of
nuclear reactors operating today.
From the developmental perspective AGRs are second generation reactor
amongst the others that Britain has explored, as the compilation in Table 4 shows. It
is an improvement from its predecessor, the first generation MAGNOX reactor [32].
Both are CO2-cooled and graphite moderated. One of their major differences lies in
the nuclear fuels and fuel cladding that they employ; the AGR uses a 4% enriched
UO2 fuels in an austenitic stainless steel cladding whereas the MAGNOX uses
natural, un-enriched uranium metal fuels that are clad in a non-oxidizing magnesium
alloy as depicted in Figure 13. The first MAGNOX reactor, Calder Hall station built
in Sellafield in 1956, is derived from the research prototype PIPPA (Pressurized Pile
for Producing Power and Plutonium) in Harwell that also produces plutonium [33].
This notion traces to the historical Windscale Plutonium Pile which solely produces
plutonium for military uses and not electricity. All MAGNOXs‟ subsequent to
Calder Hall (240 MWe) are optimised for electricity production until the last unit,
Wylfa, whose power output approached ~800 MWe. The subsequent generations of
AGRs achieve power output of up to ~1000 MWe and are scheduled to continue
around year 2030 after which they are subjected to decommissioning. The future
third generation reactors are the highly-optimised version of the second generations
(mostly PWRs) based on operating experience

35
Table 4 – Nuclear power development in the United Kingdom
Reactor Type Reactor Name Key Features
Plutonium Pile
GLEEP (research)
BEPO (research)
Windscale
Plutonium-producing only.
No conversion to electricity.
Fast Breeder
Reactor (FBR)
ZEPHYR (research)
ZEUS (research)
DMTR (research)
ZEBRA (research)
Dounreay (research)
Dounreay PFR (prototype)
Research only. One of the
inherent problems is corrosive
coolant. French PHENIX and
SUPERPHENIX were
commercially operated.
High Temperature
AGR (HTAGR)
Dragon (research) Decommissioned.
Steam Generating
Heavy Water
Reactor (SGHWR)
Winfrith Heath Successful operation.
Decommissioned.
Magnox PIPPA (research)
Calder Hall
Chapelcross
Berkeley
Bradwell
Hunterston A
Hinkley Pt A
Trawsfynydd
Dungeness A
Sizewell A
Oldbury
Wylfa
First generation reactors.
First built: Calder Hall (1956)
Last built: Wylfa (1971)
Power output: ~500 MWe
Advanced Gas-
Cooled Reactor
(AGR)
Windscale (prototype)
Hinkley Pt B
Hunterston B
Dungeness B
Heysham 1
Hartlepool
Torness
Heysham 2
Second generation reactors.
First built: Hinkley Pt B (1976)
Last built: Heysham 2 (1988)
Power output: ~1000 MWe
Pressurised Water
Reactor (PWR)
LEO (research)
Sizewell B
American design. UK
possesses one commercial unit.
Fusion Research ZETA (research)
JET (research)
Fusion reactor.

36
whereas the fourth generations reactors (so called Gen-IV) are the commercialisation
of Fast Breeder Reactors (FBR) and others [34].
2.3.1 Fuel Forms
A nuclear reactor essentially taps the heat energy that is amassed from the
fission chain reactions of the fissile isotopes. There are three primary fissile isotopes,
that is: uranium-233 (U-233), uranium-235 (U-235) and plutonium-239 (Pu-239)
that spontaneously fission on neutron absorption. Only U-235 occurs naturally in a
small abundance of 0.7%wt as found in the ore and the rest if natural uranium is U-
238. U-233 and Pu-239 are artificial fissile isotopes that are derived from the
transmutation of thorium-232 (Th-232) and U-238 respectively. The fissile isotopes,
either individually or in combination and at particular enrichment level, are
Figure 13 – MAGNOX uranium metal fuel and magnesium alloy
fuel cladding
a) MAGNOX fuel:
natural uranium metal
„billet‟, adapted from
BNFL Oxide Fuel
Brochure [32]
b) MAGNOX cladding:
magnesium alloy,
adapted from Frost
[37]
37
fabricated into suitable fuel matrices or forms, commonly: metals, ceramics, and
ceramic-metal fuels (dispersion of ceramic fuels in metal matrices).
The AGR employs uranium oxide fuels, the ceramics category, in which the
fissile U-235 content is enriched to 4 %wt by absolute atom fraction of U. Oxide fuel
pellets are produced through the Integrated Dry Route (IDR) process at Springfields
situated in the north of England by mixing the enriched-UO2 powder with binder and
lubricant materials, granulating to form free-flowing particles, compacting in an
automatic press, heating to remove the binder and lubricant, sintering in a controlled
atmosphere, and grinding to a final diameter [32]. In general, a combination of UO2
and plutonium-oxide (PuO2) powders may be sintered together such as in MOX fuel
for LWR [34]. In addition, the enrichment level can be acquired at any purity, up to
99%. For instance FBRs employ PuO2 fuels in which Pu-239 is enriched up to 20%
[35].
Oxide fuels are generally sought for their radiation stability. They do not
swell as much as metal fuels, so posing reduced risk of fuel rupture. As ceramic fuels
are manufactured by sintering techniques their porosity can be tailored to
accommodate the fission gases. The unit cell of UO2 has a face-centred cubic
packing of the large U4+
cations in a CaF2 type structure (space group Fm3m); this
leaves space at the cell centre that can accommodate FPs so contributing to its
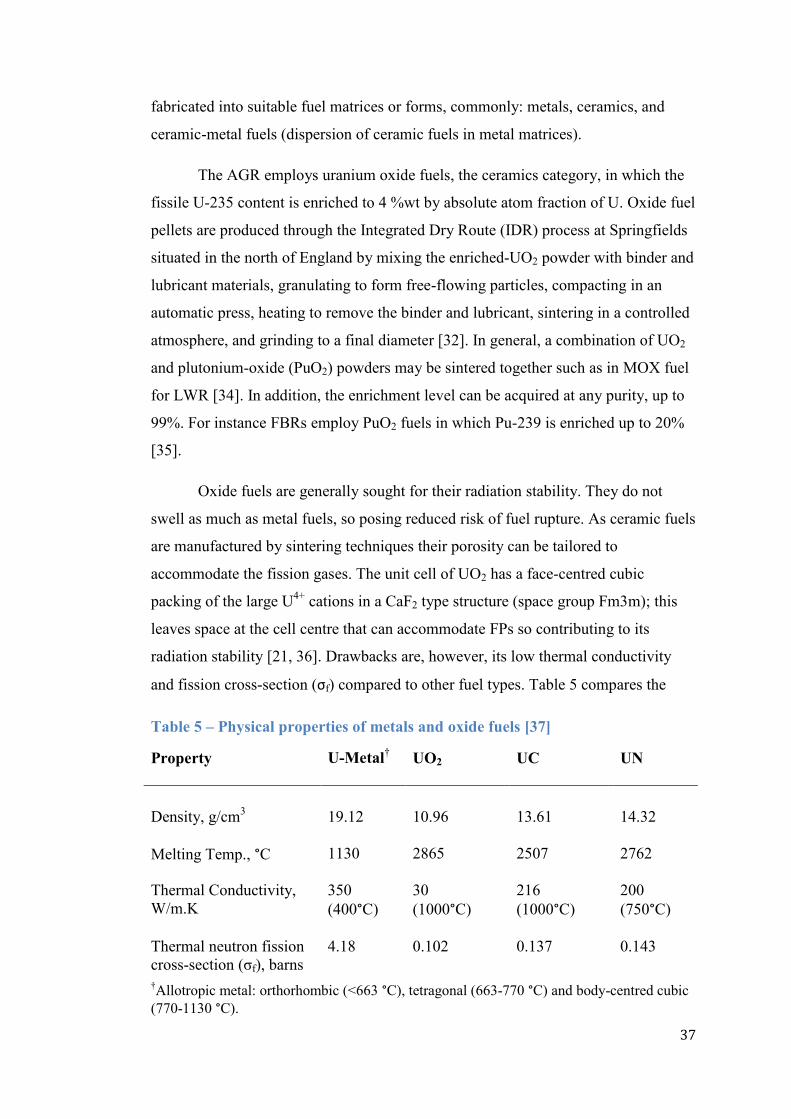
radiation stability [21, 36]. Drawbacks are, however, its low thermal conductivity
and fission cross-section (σf) compared to other fuel types. Table 5 compares the
Table 5 – Physical properties of metals and oxide fuels [37]
Property
U-Metal† UO2 UC UN
Density, g/cm3 19.12 10.96 13.61 14.32
Melting Temp., °C 1130 2865 2507 2762
Thermal Conductivity,
W/m.K
350
(400°C)
30
(1000°C)
216
(1000°C)
200
(750°C)
Thermal neutron fission
cross-section (σf), barns
4.18
0.102 0.137 0.143
†Allotropic metal: orthorhombic (<663 °C), tetragonal (663-770 °C) and body-centred cubic
(770-1130 °C).

38
physical properties of uranium metal and ceramic fuels and indicates that the metal‟s
thermal conductivity and σf of 350 W/m.K and 4.18 barns respectively are
considerably higher than the ceramic values. Other variations of ceramic fuels that
have more desirable range of physical properties for nuclear application such as the
uranium carbides (UC) and uranium nitrides (UN) have also been developed [37].
Uranium metal fuels, on the other hand, were adopted in early reactors for
their workability, high thermal conductivity, reprocessability and because no fuel
enrichment is necessary for sustaining a chain reaction. Reprocessability refers to the
use of electrochemical techniques to separate and concentrate the spent uranium,
plutonium and minor actinides (MAs), benefitting waste management and nuclear
proliferation aspects [33]. Contrary to ceramic fuels, however, metal fuels have low
deformation stability which is associated with its allotropic nature. The metal
assumes three crystalline forms: orthorhombic α-U which is stable up to 663 °C,
tetragonal β-U up to 770 °C and body-centred-cubic γ-U up to its melting
temperature of 1130 °C. This suggests that the reactor operating temperatures, thus
power output, must be maintained below 663°C within the range of the α-U phase
thereby avoiding the dimensional changes associated with phase transitions. In
addition, thermal cycling has been shown to cause anisotropic irradiation growth
under irradiation, i.e., the metal crystal elongates in the a-direction and shrinks in the
c-direction, where the metallic fuel can exhibit substantial growth to more than 60%
of its original length [36]. On a related note, the fission gasses which are insoluble in
uranium metal also contribute to the dimensional growth in metallic fuels.
Another potentially viable fuel form is a composite of ceramic and metal or
materials that are inert to irradiation effects. In essence, the fuel consists of fuel-
bearing ceramic particles that are dispersed in a stainless steel or inert matrix. Figure
14a adopted from Frost [37] shows the cross-section of a typical UO2-steel
composite fuels. The ceramic fuel particles are tailored with fine internal structures
which contain adequate porosity to account for fission gas accommodation. The steel
matrix surrounds the hot ceramic fuel particles and conducts its heat. As the fuel
particles are isolated a substantial volume of the steel matrix remains unchanged and
undamaged by the FPs thus minimising fuel swelling. The challenges of composite
fuels are largely maximising the fuel fraction and achieve uniform fuel dispersion.

39
2.3.2 Coolant
The circulation of coolant fluid in nuclear reactors is intended to absorb and
transport the abundant heat generated within the nuclear fuel to the power generation
system. In the fission reaction pathway U-235→Cs-144+Br-90+n for example, the
fissile isotope U-235, fission fragments Cs-144 and Br-90 and prompt neutron n
have atomic mass units (u) of 235.0439222u, 143.9320274u, 89.9306350u and
1.008664u respectively; the 0.1725958u mass differences from Einstein‟s mass-
energy conservation equation E=mc2 (c
2 taken as 931.502 MeV.u
-1) equates to a
conserved heat energy (E) of roughly 168 MeV. Table 6 shows the average energy
per-fission of several common fissile isotopes that accounts for all fission reaction
a) Dispersion of ceramic fuel
in metal matrices. Metal
distance between ceramic
fuel particles should ideally
be greater than FPs recoil
distance of ~10µm
Figure 14 – Fuel bearing particles dispersed in metallic matrices, adapted
from Frost [37]
b) Internal structure of the
ceramic fuel particles
(~50 – 500µm diameter)

40
pathways [38]. Considering U-235 which have the latter value of 201.7±0.6 MeV,
the criticality of one mole or 235 grams of this substance which contains an
Avogadro number of fissile atoms theoretically yields about 1026
MeV or 4500
MWh of energy, equalling better than burning 10000 tons of coal [39]. This justifies
nuclear electricity as a truly viable alternative amongst the basket of ways forward to
meet both electricity demand and carbon targets.
The fission heat from the AGR‟s oxide fuels are extracted by a circulating
CO2-coolant at 45.2 bar pressure. The principal attractiveness of gas-cooling is the
natural convection that it affords, i.e., warmer gas draws out from the core and cooler
gas draws in by convection. For this reason gas-cooled reactors are inherently safer
than water reactors in the advent of loss of coolant circulation due to pump damage
or loss of power supply [33]. In addition, gas-cooled reactor cores are not as reactive
as water-cooled reactors which need to account for the extra neutron absorption by
the water. In the event of water cut-off, the water boils to steam which is 100 times
less dense than water thus not absorbing neutrons but causing a surge of neutron flux
that increases the core‟s temperature sufficiently for melting to occur. In the recent
incident involving the Fukushima Daiichi nuclear power plants (NPP) in Japan, for
example, the magnitude-9.0 earthquake on 11 March 2011 caused the cooling system
to fail. At some point the falling water levels must have left the fuel exposed leading
to the core meltdown. Apart from the water-cooled Sizewell B which is a PWR, all
the reactors designed in the UK are gas-cooled.
Table 6 – Fission isotopes, energies and thermal fission cross-sections
Isotope Energy
(MeV/fission)
Thermal Neutron Fission
Cross-section (barns)
Th-232 196.2 ± 1.1 -
U-233 199.0 ± 1.1 527
U-235 201.7 ± 0.6 584
U-238 208.5 ± 1.1 -
Pu-239 210.7 ± 1.2 746
Pu-241 213.8 ± 1.0 1025
41
The fuel cladding is constantly exposed to oxidation by the circulating CO2
atmosphere in the reactor core. CO2 has the advantage of not having a liquid-gas
phase change under reactor operating or accident conditions. Millward et al. [17, 27,
28] show that CO2 circulation can cause „solid carbonaceous filaments with
turbostatic packing‟ on the surface of the unirradiated 20Cr/25Ni/Nb metal on
exposure to CO2, CO and C2H4 gas mixtures at 550°C for various durations. Due to
prolonged temperature cycling these scales may mechanically spall-off the
cladding‟s surface. Commonly referred to as spallation, this condition is
characterised by the surface scales rupture caused by the circulating coolant fluid
turbulence, internal stresses from fuel pellet swelling and repeated temperature
cycling which because of differences in contraction rates between the metal cladding
and the scale. The spalled-scales become a dust source in the circulating coolant
fluid which may mechanically impact on the cladding surface. In fact, spallation
results in severe surface irregularities where pits up to 40μm deep (about 10% of the
0.38mm wall thickness) have been measured [20, 40] and they may potentially
become sites for accommodation of corrosive agents for corrosion initiation.
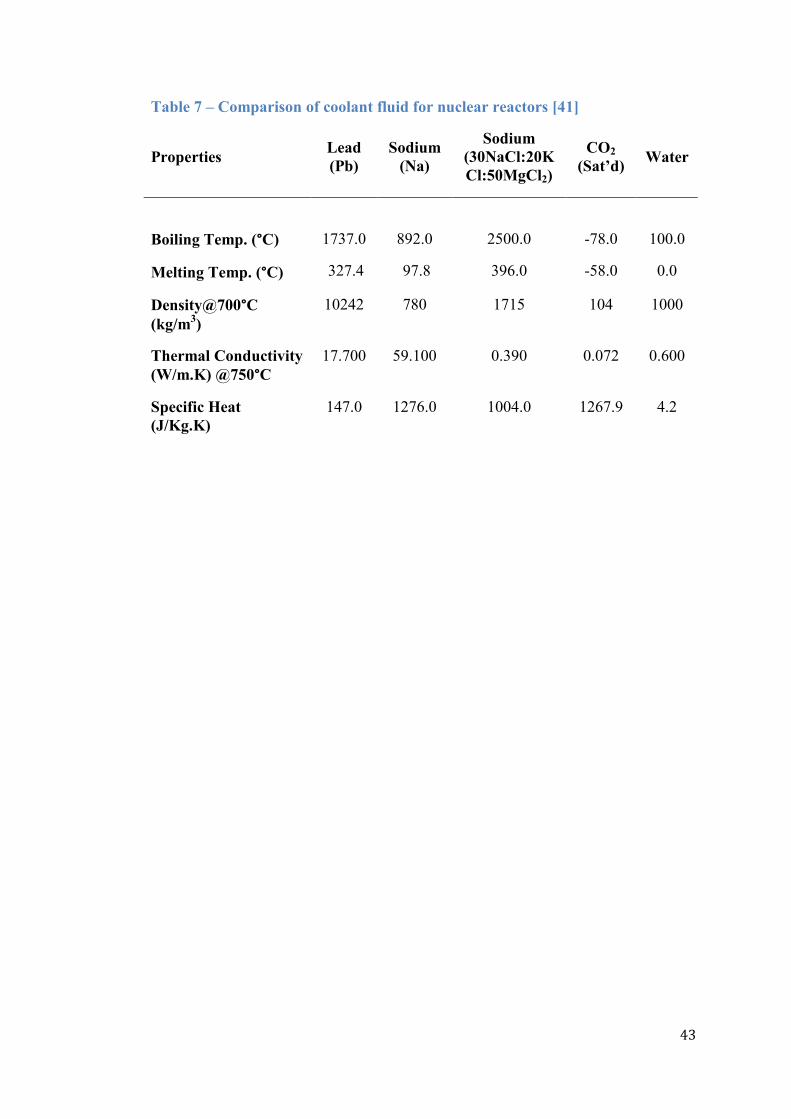
This section concludes with Table 7 which compares the physical properties of
the CO2-coolant with several other coolant fluid candidates that are considered for
the new nuclear build initiatives [41]. In essence, future reactors are designed to
achieve high burn-up and temperatures in order to maximise electricity production.
For these purposes, the physical properties demanded of the coolant fluid are high
density, thermal conductivity and specific heat. The sodium-fluid of composition
30NaCl/20KCl/50MgCl2 and lead (Pb) mixture, for example, have boiling
temperatures of 1737 °C and 2500 °C respectively which protects the reactor core
from meltdown and stores large amounts of decay heat during transients. In
particular, the lead-coolant‟s density that approaches 10000 kg.m-3
is remarkable.
The challenges that are faced with these advanced coolant fluids, however, include
their corrosive behaviour that affects the piping system and meeting the high
pumping power requirements to sustain the required coolant flow rates [41]. The
historical Windscale Plutonium Pile which was constructed to manufacture weapons-
grade Pu simply utilised air as its coolant (Figure 15).

42
Figure 15 – Air-cooled Windscale Plutonium Pile, adapted from Pocock
[33]
b) Charge Face where
uranium fuel „cartridges‟
are inserted to undertake
transmutation
U-238+n→Pu-239
c) A section through the
pile showing air
cooling
a) Air cooled chimneys of
the Windscale Plutonium
Pile
43
Table 7 – Comparison of coolant fluid for nuclear reactors [41]
Properties Lead
(Pb)
Sodium
(Na)
Sodium
(30NaCl:20K
Cl:50MgCl2)
CO2
(Sat’d) Water
Boiling Temp. (°C)
Melting Temp. (°C)
1737.0
327.4
892.0
97.8
2500.0
396.0
-78.0
-58.0
100.0
0.0
Density@700°C
(kg/m3)
10242 780 1715 104 1000
Thermal Conductivity
(W/m.K) @750°C
17.700 59.100 0.390 0.072 0.600
Specific Heat
(J/Kg.K)
147.0 1276.0 1004.0 1267.9 4.2

44
2.3.3 Neutron Moderation
Nuclear fission reactors are classified into two kinds based on the neutron
energy spectrum that they are designed to operate with – either fast or thermal. The
AGR is a thermal reactor whose characteristics of radiation damage and potential for
carbide formation, hence their corrosion behaviour during latter wet storage, are
fundamentally different from the fast reactors. A thermal reactor employs a neutron
moderator to attenuate the prompt neutron (interchangeably referred to as fast or
fission neutrons) kinetic energies of approximately 1.0x10⁶ eV to about 0.025 eV
where the „slowed‟ neutrons are in thermal equilibrium with the atoms of the
moderator material [38]. The thermal neutron energy of 0.025 eV is derived from the
equation
which parameters neutron mass m = 1.675x10
-27 kg,
Boltzmann‟s constant kB = 8.617 ×10⁻⁵
eV.K-1
and room temperature T = 300°K
yields the most probable neutron velocity (v) of 2200 ms-1
; at this velocity the
thermal neutron energy (E) from the equation E=0.5mv2
computes as 0.025 eV.
Figure 16 shows that the fission cross-section (σf) of U-235 for the thermal neutrons
is 584.4 barns which is much higher than that of the fast neutrons at 1.136 barns [42].
Figure 16 – Variation of fission cross-section over neutron energy spectrum,
adapted from Hill [39]
1.136 b

45
At the atomic scale, the low fission cross-section of the fast neutrons, i.e.,
1.136 barns, is due to the elastic scattering phenomenon; the fast neutron that
encounters a U-235 molecule simply bounces off its target due to its high incident
energy, with only a small chance of colliding with high impact if the target lies
directly in its path. In contrast, the slowed neutrons have a relatively high fission
cross-section, i.e., 584.4 barns, because they are likely to participate in the inelastic
scattering phenomenon; the imparting neutron binds to the target fissile material U-
235 thus inducing fission reactions.
AGRs employ graphite as the moderator, amongst other materials which
include water, heavywater, and beryllium. Table 8 summarises their physical
properties. Good moderating media should have small neutron absorption cross-
section and high scattering cross-section [36]. The small neutron absorption cross
section dictates the low neutron losses through absorption by the system whereas the
high scattering cross section promotes „slowing down‟ as each neutron collision with
the moderator materials absorbs a proportion of its energy until a thermal
equilibrium is reached. Beryllium has good slowing-down ability indicated by its
scattering cross-section of 11.86 barns but is less used because of its toxicity,
brittleness and difficulty in processing [36]. Water has one of the largest scattering
cross-sections of 41.01 barns but, paradoxically, has the highest absorption cross-
sections of 0.664 barns which means the neutrons scattered are absorbed.
Table 8 – Physical properties of neutron-moderating materials [36]
Moderator Be
(metal)
BeO
(oxide)
Graphite H2O D2O
Density (g/m3) 1.85 2.8 1.6 1.00 1.10
Atomic Weight 9.01 25.01 12.01 18.02 20.03
Thermal Neutron Absorption
Cross Section, (barns)
0.01 0.01 0.0045 0.664 0.00114
Thermal Neutron Scattering
Cross Section, (barns)
7.63 11.86 5.551 41.01 3.82
Melting Temperature (°C) 1282 2550 3650 0 0

46
On a related note, nuclear graphite poses a problem due to its Wigner energy.
Graphite, if operated below a certain temperature, exhibits a substantial increase in
the potential energy in its lattice structure due to the displacement of graphitic atoms
by the bombarding neutrons. This potential energy, if unreleased, leads to
remarkable dimensional distortion but it can simply be annealed-out by heating the
graphite at a higher temperature. The Windscale incident in 1957 was a fire caused
by the unexpectedly large un-released Wigner stored in its graphite core whilst
performing annealing operation to remove the Wigner energy [33].

47
2.4 Effects of Radiation Fields on AGR Fuel Cladding Corrosion
The radiation field adversely impacts on the corrosion performance of the
AGR fuel cladding in several ways. In addition to the stresses from fuel pellet
swelling and thermal cycling in CO2 oxidation there are two further ways in which
the radiation fields directly impact fuel cladding corrosion: grain boundary
chromium depletion and the radiolysis of water. Grain boundary chromium depletion
is a condition characterised by the segregation of alloying elements from the grain
boundaries due to radiation-induced segregation phenomena [18, 19]. A chromium-
depleted site loses the ability to form the protective chromium-oxide scales at the
particular grain boundary which then becomes susceptible to attack by corrosive
agents such as chloride. Radiolysis of water, on the other hand, is caused by
emissions of α, β, and γ radiation by the „hot‟ fuel pellets which hydrolyses the layer
of water immediately adjacent to the cladding‟s surface [11, 43]. The enhanced water
radiolysis dissociation products, for example H+ and OH
-, result in acidic or alkaline
conditions depending on the type of metal and electrolyte solution which accelerates
corrosion processes. This section reviews both phenomena.
2.4.1 Grain Boundary Chromium Depletion
Grain boundary chromium depletion has been experimentally observed in
cladding materials that are retrieved from the spent fuels. Norris and et al. [18]
measured the extent of alloying element segregation in the irradiated AGR fuel
cladding using field emission gun (FEG) EDS chemical analysis in the TEM on thin
specimens sourced from the Hinkley Point-B reactor [18, 44]. Both samples from the
410°C and 440°C batches of fuel cladding (Figure 17) exhibit appreciable alloying
element segregation at the grain boundaries. Chromium decreased from its initial
concentration of 20%wt to less than 10%wt, iron was decreased from 55%wt to less
than 40%wt whereas nickel was enriched from 25%wt to 45%wt. The higher
temperature 440°C sample exhibited wider, enhanced grain boundary damage
distances of about 50 nm compared to the lower temperature 410°C sample of about
20 nm. Note that silicon was also significantly enriched at the grain boundaries.

48
The radiation-induced segregation (RIS) phenomenon has been explained by
the inverse-Kirkendall mechanism [45-47]. Initially, neutron irradiation induces a
cascade of displacement defects in the bulk microstructure of the fuel cladding.
Figure 18 illustrates the types of displacement defects which include the vacancy,
self- interstitial atom, and substitutional impurity atoms. A vacancy is created when
an incident neutron displaces a regular lattice atom leaving a „vacancy‟ whereas the
interstitial is the displaced atom itself. If the incident neutron is a prompt neutron or
a primary knock-on atom (PKA), a cascade of displacement defects continues to
occur until its energy dissipates. A vacancy and an interstitial pair are known as a
Frenkel-pair [48]. Frenkel-pairs are mobile so that they may migrate through the
lattice and interact with other Frenkel-pairs or solute atoms in the lattice, leading to
increased concentration of defects (e.g., dislocations) especially at the grain
boundaries where they annihilate. The substitutional impurity atoms, on the other
hand, are fission fragments that result from the fission or transmutation of the
alloying elements in the cladding. Subsequently, the inverse-Kirkendall mechanism
proposed that each type of alloying element interacts with these displacement defects
Figure 17 – Segregation of alloying elements at the grain boundaries,
adapted from Norris et al. [18]

49
Substitutional
atom
Vacancy
Interstitial atoms
(Fission fragments)
Figure 18 – Effect of neutron irradiation on metallic lattice that leads to
radiation-induced segregation
a) Generation of point defects by primary knock-on neutrons
b) Preferential segregation of chemical species to sink (annihilation of
vacancies at grain boundaries and dislocations) due to their different size
and diffusivity, adapted from Smallman [56]

50
at different rates due to their different diffusivity and size [45-47, 49]. Consider the
alloying elements in the AGR fuel cladding have diffusivity (D) in the order
DCr>DFe>DNi and silicon has the smallest size. Figure 18b illustrates schematically
that silicon (the small solute atom) is drawn into the sink, frequently the grain
boundaries which the vacancy annihilates, but leaves behind its own vacancy (non
radiation-induced) where the faster-diffusing solute chromium and iron move
towards as an „inverse flux‟ away from the grain boundary at the expense of nickel
[46].
2.4.2 Radiolysis of water
Radiolysis of water concerns the emission of α, β, and γ radiation from the „hot‟
fuel pellets that produce free radicals from the water molecules immediately adjacent
to the cladding‟s surface [11, 43], increasing the metals corrosion susceptibility. An
example of water decomposition by radiolysis is adopted from Stobbs and Swallow
[11]: 4.5 H2O → 3.7H+ + 2.9OH
- + 0.4H2 + 0.8H2O2. A more complete range of
water radiolysis products includes: H2, O2, O2-, HO2, O2 [43, 50]. Their
concentrations, typically on the order of 10-10
to 10-8
molar and with lifetimes of
micro- to nano-seconds, could differ substantially along the length of the fuel
cladding since radiolysis yield depends on the neutron flux [50].
Once formed the radiolysis products may undergo further chemical reactions
amongst themselves and participate in electrochemical reactions leading to corrosion.
Table 9 shows the elementary electrochemical reactions and their rate constants. The
anodic and cathodic (redox) reactions on the metal surface or at a locally-active site
occur at different rates, in addition to the concentrations of the radiolysis yield being
different. Consequently the potential for electrochemical reaction increases in the
presence of radiolysis products; Wyllie et al. [51] have shown that the open circuit
potentials (OCP, a condition where anodic and cathodic potential occurs at the same
rate) of stainless steel 316 shifts to a lower value which is less noble from the
starting materials. On a related note, the production of volatile species which include
O2 and H2 may represent a combustion hazard [50].

51
Table 9 – Elementary equations and rate constants of water radiolysis [51]
Reaction Rate Constant (s-1
)
e- + H2O= H + OH
-
e- + OH = OH
-
H + H = H2
e- + HO2 = HO2
-
OH + OH = H2O2
H + OH = H2O
H + O2 = HO2
OH- + H2O2 = HO2
- + H2O
HO2 = O2- + H
+
2.4x10¹⁰
3.0x10¹⁰
1.0x10¹⁰
2.0x10¹⁰
4.5x10⁹
2.4x10¹⁰
1.0x10⁹
1.0x10⁸
8.0x10⁵
Although radiolysis varies along the length of AGR fuel pins, the variation is
much smaller than for LWR elements. Radiolysis is primarily caused by gamma
radiation from the fuel and beta radiation from cladding. Post irradiation spontaneous
neutron emissions are comparatively small. So axial radiolysis, and hence peroxide
concentration, varies with local burnup (which in turn is related to time averaged
neutron flux the fuel experienced in the reactor).

52
2.5 Corrosion of AGR Fuel Cladding
Once AGR fuels have reached a certain level of burn-up where they are no
longer able to sustain chain reactions, they are discharged from the reactor core and
wet-stored. Wet storage of the spent fuels can be divided in two sequences. First, the
discharged AGR fuels are immediately stored in a pool of boric acid that is
neutralized to pH 7 by caustic soda (NaOH) adjacent to the reactor. The element
boron possesses one of the highest neutron absorption cross-sections (34400±30,
Table 8) and so is an excellent neutron absorber. After a period of approximately 6
months [2], the spent fuels are transferred to the interim storage alkaline pond
situated away from the reactor which is maintained with NaOH at pH 11.5
stabilisation condition. The pool is fabricated from reinforced concrete with water
circulation to provide cooling so avoiding local temperature variations and filtration
to ensure thorough mixing of freshly treated water returning from the chemical plant.
The spent fuel remains here for several years pending reprocessing or, the more
recent stance, permanent disposal in a geological repository [2]. Corrosion control of
the spent AGR fuel in the alkaline ponds is critical for its long-term stability [2, 52].
This section reviews the critical factors affecting AGR corrosion processes.
When reprocessing is scheduled, the spent fuel is transferred to THORP. The
recoverable materials include the remaining uranium-235 (< 0.7%wt) and the
transmuted plutonium-239 for MOX fuel fabrication and long-lived fission
fragments that can potentially be incorporated into fast reactor fuels for
transmutation into short-lived ones. In the THORP facility, the spent AGR fuels are
stored in a neutral pool of demineralised-water that is maintained at pH 7 and 25°C.
As the pond also contains LWR fuels that were acquired from overseas spent fuel
reprocessing contracts, the NaOH pH control with which the aluminium-based MEB
may react cannot be used. The AGR fuel becomes vulnerable to corrosion without
the NaOH inhibitor protection, having been subjected to radiation damage and in the
presence of chloride anions (about 30 ppm) [2]. Due to Sellafield‟s proximity to the
sea, trace concentrations of sea minerals predominantly chloride, sodium and
sulphate may deposit into the ponds due to gravitational deposition of large (>15µm)
sea-salt droplets.

53
In its broadest sense metal corrosion is one of the earth‟s most perplexing
problems, costing billions of pounds to remedy in the utilities and manufacturing
industry [53]. The AGR fuel cladding corrosion have shown to manifest in various
forms which include surface rusts and subsurface-growing pits, crevices and inter-
granular dissolution that over time progress to materials failure [2]. At the nanometre
scale the strongly bound metal-metal atoms have disintegrated as free, unbound
metal ions into the environment. The mechanisms by which this phenomenon may
occur have been considered through several electrochemical reaction pathways [8,
54, 55] whose kinetics for metal dissolution is affected by the metal‟s quality,
environmental conditions and the characteristic interface layer that forms between
the latter, as schematically shown in Figure 19.
State of Metal*:
Alloying elements
Radiation Damage
Precipitates
Inclusions
Intermetallic Phases
Internal Stress
*impacted by the UO2 fuel swelling, circulating CO2 coolant and neutron flux discussed in sections chapter 2.1 to 2.3
Environmental Conditions:
Aggressive species, e.g. chloride ions
Radiolysis products
Inhibitor agents
Water and humidity
Temperature
Biological entities
Figure 19 – Critical factors of AGR corrosion processes
Fe(s) Fe3+(aq) Ni(s) Ni3+(aq) Cr(s) Cr3+(aq)
metal dissolution
AGR Fuel Cladding Corrosion Manifestation:
General
Pits
Crevices
Galvanic
Intergranular
Stress Corrosion Cracking

54
Metals are traditionally improved by adding alloying elements and using
modern steel-making techniques. A metal with chromium (Cr) contents above
12 %wt, for example, is corrosion resistant because chromium oxidises
spontaneously in the atmosphere to form a surface-adherent chromium-oxide (Cr2O3)
scale that protects the metal beneath [56]. Under neutron irradiation, however, this
corrosion resistance degrades substantially due to irradiation-induced changes to its
metallurgical properties which include precipitation of free chromium into a newly-
formed secondary phase, incorporation of free chromium into the growth of existing
secondary phases, and chromium depletion at the grain boundaries due to alloying
element segregation [25, 48, 57]. Environmental conditions, on the other hand,
promote metal dissolution by acting as the medium which carries charge from the
dissolving metal (anode), i.e., electrons from the iron corrosion reaction
Fe(s)→Fe3+
(aq)+3e, to the next convenient adjacent site that is located at a cathodic
potential in the electromotive scale. Natural environmental conditions such as
elevated temperature, humidity, biological entities, and dissolved gas concentrations,
notably in the presence of chloride, have been shown to escalate metal dissolution
rates [40]. However, controlling environmental conditions such as by the use of
corrosion inhibitors can slow and even stop corrosion reaction kinetics. Lastly, one
of the crucial but puzzling considerations for metal corrosion is the exact mechanism
of ion and electron transport processes underlying the nano-structures of the
interface layer, which remains a significant knowledge gap in the field of corrosion
science [53, 58].

55
2.5.1 Critical Factors Affecting AGR Corrosion Processes
There are three common classifications of localised corrosion problems in
stainless steels: pitting, crevice and intergranular corrosion. Pitting corrosion (Figure
20a), as suggested by Frankel and Sridhar [59], is „the localised metal dissolution on
vulnerable surface area leading to the formation of cavities beneath the passive
films‟. Crevice corrosion (Figure 20b), according to DeForce and Pickering [60], is
„a form of localised corrosion in which a metal in contact with an aqueous solution
dissolved within a crevice at a much greater rate than at other, crevice free surface‟
[60]. Example of crevices are metal A–metal B junctions, where A and B are separate
metal components such as bolts, rivets, and gaskets, which over a service period may
become sufficiently wide to permit the entry of corrodent ions but narrow enough to
Figure 20 – Pitting, crevice and intergranular corrosion
a) Pitting corrosion
b) Crevice corrosion
c) Intergranular corrosion

56
ensure that the corrodent remains stagnant. Intergranular corrosion (Figure 20c), as
defined in the ASM International Metals Handbook [21], is „corrosion occurring
preferentially at the grain boundaries, usually with slight or negligible attack on the
adjacent grains‟. This type of corrosion is penetrative to a certain depth within the
subsurface grain boundaries and is an important propagation step preceding pitting
or crevice corrosion. In the presence of stress, the latter can become intergranular
stress corrosion cracking (IGSCC).
AGR fuel cladding is potentially susceptible to all three kinds of corrosion
problems along its one metre length (Figure 6a). Pitting may occur at a local,
electrochemically favourable site on the inhomogeneous fuel cladding surface that
was oxidised by the CO2 coolant. Crevices may be present at „gaps‟ between the
braces and the cladding (Figure 6c) in which the storage pond fluid may potentially
access and remain stagnant to cause crevice corrosion. Intergranular corrosion arises
because the cladding‟s grain boundaries are chromium-depleted due to radiation-
induced segregation in the presence of stress field from the fuel pellet swelling
(Section 2.1).
2.5.2 Metal Ion Hydrolysis and Acidification of Pits
The mechanisms that lead to the aforementioned corrosion problems are
important. Of particular significance are the electrochemical reactions that cause the
disintegration or dissolution of the strongly-bonded metal-metal atoms into the bulk
electrolyte solution, i.e. M(s) → Mn+
(aq) + e- where M(s) is the bulk metal, M
n+(aq)
is the oxidised state of metal in the electrolyte solution with n being the oxidation
number and e- is the electron produced. Due to the direction of the latter reaction
metal corrosion reactions are also referred to as anodic dissolution. Table 10 shows
the anodic dissolution that pertains to the AGR fuel cladding alloy compositions and
the corresponding standard cathodic reactions that take place simultaneously since
the conditions of zero net current have to be satisfied. The cathodic reactions are
reduction reactions that consume electrons.

57
Table 10 – Anodic and cathodic reactions on surface [53]
Anodic Reactions:
Cathodic Reactions:
Fe(s) → Fe2+
(aq) + 2e- O2(g) + 2H2O(aq) + 4e
- → 4OH
-(aq)
Fe2+
(aq) → Fe3+
(aq) + e - 2H2O(aq) + 2e
- → H2(g) + 2OH
- (aq)
Cr(s) → Cr3+
(aq) + 3e -
Ni(s) → Ni3+
(aq) + 3e -
H2(g)→ 2H+(aq) + 2e
-
2H2O(aq) → O2(g)+ 4H+(aq) + 4e
-
One of the basic models which partly describes the mechanisms of anodic
dissolution is Galvele‟s uni-directional pit model [61, 62]. The initial stages of
anodic dissolution, assumed to occur in the model, are initiated via some ambiguous
conditions; perhaps due to slight imbalances in the electrolyte composition or an
electrochemically unfavourable couple on the metal‟s surface. The anodic
dissolution proceeds as the following:
At its start metal dissolution may occur at the bottom of the pit, i.e.
M(s)→Mn+
(aq) + ne-.
In the next steps the electrons (ne) that are produced are consumed for
hydrolysis or cathodic reactions to maintain charge neutrality; this may
include O2+2H2O+4e-→4OH
- or M
n++H2O→M(OH)
n-1+H
+ that hydrolyses
the water molecules and in which product H+ indicates pit acidification.
In addition, the free metal ions M(OH)n-1
may readily attract the migration of
free chloride (Cl-) to the bottom of the pit and form metastable complexes
such as M(OH)+Cl
-. They are unstable constituents that undergo further
hydrolysis reactions, i.e., M(OH)+Cl
-+H2O→MOH+H
++Cl
- that leads to the
generation of more acidic regions at the bottom of the pit.
Exactly what types of metastable complexes formed, if they do form, is a
contentious subject. Nonetheless, in this instance, it can be assumed that the
aforementioned metal dissolution and hydrolysis activities generate a pit current
density, denoted by i. Galvele showed that the product i and the depth of the pit x, as
indicated in Figure 21, is a critical quantity which dictates whether a pit is active, in

58
which the self-sustaining propagation mechanism would continue to occur, or
passive, in which the pit would cease to grow. In this way, the „current will produce
a time-dependent local concentration built up of metal cations, until steady state
conditions are reached‟.
In practical terms, however, anodic dissolution encompasses a wider,
dynamic aspect that includes several other factors. For one, the rate or kinetics of
anodic dissolution is mediated by the environment. The presence of anions such as
chloride (Cl-), sulphate (SO4
2-), thiosulphate (S2O3
2-), dissolved oxygen (O2),
dissolved ozone (O3) and certain microbes, in addition to thermodynamic factors
such as temperature and fluid velocity in contact with the metal, accelerates the rate
at which metal corrosion processes occur [63-66]. The anions or cations in the
electrolyte solution are thought to influence the characteristics of the electrical
double layer that is formed instantaneously at the metal‟s surface upon environment
contact [67-70]. This double layer, which is an electrical field, in turn has the
potential to break down the Cr2O3 passive film [71].
Figure 21 – Unidirectional pit model proposed by Galvele, adapted from
Galvele [61]

59
With regards to the passive-film breakdown the key questions concerning its
initiation are: what mechanism does it undergo and where does the charge dissipate?
The mechanisms of passive-breakdown, according to the review by Frankel [72],
could be due to the theories of: penetration, adsorption and film-breaking. The
penetration theory states that the high electric-field in the film assists transport of
aggressive anions, e.g. chloride, through the passive film, though it contended that it
was not always the case where chloride is found in the passive film. The adsorption
theory suggests that passive-film breakdown is caused by the more competitively-
adsorbed chloride ions than the oxygen, e.g, the oxygen in the chromium-oxide film.
This theory, too, has reported inconsistency in experimental results. Lastly, the film-
breaking theory considers that the „passive-film is in a continual state of breakdown
and repair‟. The alteration to this steady state of breakdown and repair is affected by
the presence of chloride-containing solution. Pertaining to the charge transfer
processes, theoretically, the electrons from the dissolution process should be
consumed by one of the cathodic reactions in Table 10. However, Gileadi et al. [73-
75] have contended the traditional dissolution theory with the prospect that
electrochemical reactions are strictly governed by ion transfer, not electrons.
Additionally, taking into account the role of inclusions in passive film
breakdown, some observations suggest that corrosion evolution is manifested around
secondary phases in the metal matrix. Figure 22a, adapted from Ryan et al. [13],
showed corrosion processes that are occurring around a manganese sulphide (MnS)
precipitate. Bohni et al. [15] showed that large precipitate sizes are detrimental to
pitting corrosion. Figure 22b shows that inclusions of size greater than one micron
possess a greater affinity for pitting indicative of the low pitting potential of just 400
mV (vs. saturated calomel electrode). The presence of inclusions or secondary
phases potentially produces a galvanic effect between the inclusion itself and the
bulk metal, promoting self-sustaining electron transfer processes due to their relative
electromotive potentials.
Apart from inclusions, passive film breakdown has also been observed to
involve a metal lacy cover [55, 66, 76]. Figure 23 shows that a lacy metal cover is
characterised by a porous metallic cover on the metal surface under which a

60
hemispherical-shaped pit is evolving or has stopped. Ernst et al. [55, 76] suggest that
the evolution of the hemispherical pit is a mass transport process controlled by the
concentration of the metal dissolution product, i.e. the metal-chloride cation, that
forms between below 70% of its saturation concentration. The finely perforated lacy
metal cover stabilises the corrosion evolution initially by acting as a diffusion barrier.
Figure 22 – Role of manganese sulphide inclusion in corrosion processes.
a) Voids around the MnS
inclusion, adapted from
Ryan et al. [13]
b) Correlation between
pitting potential and
inclusion size, adapted
from Bohni et al. [15]
Inclusion volume,

61
20m
Figure 23 – Secondary Electron Image of a lacy metal cover, adapted from
Ernst et al. [55]

62
3.0 Experimental Methods
This chapter detailed the experimental methodology that was adopted for
characterising the effect of microstructure on the corrosion behaviour of the as-
manufactured AGR fuel cladding sourced from Sellafield Ltd, Cumbria. Section 3.1
described the procedures for i) thermal-aging of the individual small-cut cladding
specimens at discrete temperatures of 400, 500, 600, 700 and 800 °C for 24, 48, 96
and 192 hours to produce individual specimens of varied microstructure and ii)
fabrication of the thermally-aged specimens as electrodes for corrosion
measurements. Section 3.2 described the procedures for corrosion measurement –
specifically the anodic polarisation method – that was employed to measure the
corrosion potential of the electrodes (fabricated from thermally-aged specimens) in
both 0.001M and 0.1 M sodium chloride (NaCl) electrolyte. Section 3.3 describes
the procedures for surface corrosion morphology characterisation of the post-
polarised electrodes by Scanning Electron Microscopy (SEM). Section 3.4, similarly,
describes procedures for the subsurface corrosion morphology characterisation of the
post-polarised electrodes. Specifically, the subsurface corrosion features are obtained
using the Focused Ion Beam (FIB) instrument to acquire cross-sections above a
corrosion site that is subsequently measured using Energy Dispersive X-ray
Spectroscopy (EDS) in the TEM for its chemical composition of the austenite grains,
grain boundaries and secondary phases. Section 3.5 detailed procedures for a series
of etchant testing in order to evaluate the etchant most suitable to reveal under the
SEM the physical distribution of the austenite grains, grain boundaries and
secondary phases that have been varied due to thermal-aging. This includes
development of an algorithm for quantifying the numbers and sizes of secondary
phases by image processing and statistical analysis.
3.1 Heat Treatment and Electrode Preparation of As-sourced AGR Fuel
Cladding
A unit of as-manufactured AGR fuel cladding rod which has been
manufacturer-annealed (1050°C, 2 hours) was sourced from Sellafield Ltd, Cumbria.
Figure 24a shows an AGR fuel cladding that resembles a hollow tube, allowing for
the insertion of 64 13mm long and dia. uranium-dioxide (UO2) fuel pellets. The fuel

63
cladding is austenitic stainless steel 20Cr/25Ni/Nb and measured 100.0cm long by
1.5cm dia. with 0.38mm wall thickness. Using a wire electro-discharge machine
(EDM) cutter (GF AgieCharmilles; Model CUT20; North View, Coventry, CV2 2SJ)
and a custom-made hexagonal jig to support the length of the cladding in the
machine, the cladding was sectioned at every 1.5cm intervals producing a series of
„rings‟. Each of these „rings‟ was subsequently cross-sectioned into 8 1.5cm wide by
1.0cm long cut-samples (Figure 24b). The EDM utilises spark-cutting mechanisms
and machining was carried out under water to minimise thermal stresses generated in
the metal.
The cut-samples were heat-treated using a chamber furnace (Carbolite
Furnaces; Model 1200 S/N: 4/91/559; Bamford, Sheffield, S30 2AU) equipped with
a Eurotherm 120 thermostat. Heat treatment was performed on the cut-samples in
order to produce a range of microstructure features for characterisation. The heat
treatment involved the following preset temperatures and times: 400, 500, 600, 700
and 800°C and 24, 48, 96 and 192h. In the furnace chamber the cut-samples – in
batches of five laid flat on a crucible (Figure 24c: inset) – were subjected to a heating
ramp rate of 20°C/min to the preset heating temperature.
Each of these thermally-aged cut-samples was fabricated as working-
electrodes in order for their corrosion properties to be tested using the anodic
polarisation method described in section 3.2. Fabricating the samples as working-
electrodes is essential to ensure that the three-electrode cell‟s alligator-clip (Figure
26a) is electrically-connected to a sample that is free from crevices and edge-
inhomogeneities. The aim is to provide an electrically-connected sample surface that
is homogeneous, well-polished and flat for the anodic polarisation testing. These
attributes can be achieved via two steps. First, a short wire-extension that can be
gripped by the alligator-clip was provided by a 0.2 mm diameter fine-wire
(7/0.200mm PTFE sleeve; Belden OL15 8YJ) that is electrically-connected to the
„rib-free‟ surface of the cut-samples. To ensure electrical connection between the
wire-extension and the sample, several layers of silver paint were applied to the
contact-area and tested for zero-resistance using a voltmeter (ISO Tech Multimeter;
Model IDM91E; RS Components Ltd., Northants, NN17 9RS) set at 20kΩ. Second,
the cut-sample with the wire-extension intact was moulded into epoxy-resin (Struer
Epofix Resin and Harderner Kit; Struers Ltd., Rotherham, S60 5BL) in a fume-hood.

64
Figure 24 – Preparation of working-electrode from as-sourced AGR
fuel cladding rod
1.5cm long by 0.5cm wide
1.0m long by 1.5cm dia.
a) As-sourced AGR fuel cladding b) Cut-samples
c) Heat treatment (inset: sample on crucible inside the oven)
d) Working electrode from thermally-aged samples

65
Upon drying and hardening of the mould, this article has greatly enhanced general
handle-ability considering the relatively small dimension of the freshly cut-samples
(Figure 24b). The mould was mechanically ground (Struers ROTOR Polishing Unit;
Struers Ltd., Rotherham, S60 5BL) with silicon carbide paper from coarse grit-size
of 400 to fine grit-size 1200 followed by diamond polishing (diamond particles
embedded in cloth laps) with 3µm abrasive particles and finished with 3µm particles.
Each grinding and polishing step was performed for no less than three minutes at a
rotary speed of 200 rpm. After final polishing the sample was re-checked for zero-
resistance using the voltmeter and, if this was the case, categorically designated as a
working-electrode of the heat-treatment in question. Figure 24d shows five working-
electrodes from the 500°C 24h heat treatment.
Figure 24b – Surface oxide layer of heat-treated specimens (2h) that was
polished off for corrosion measurement of bulk microstructure.
300°C
400°C
500°C
600°C
700°C
800°C

66
3.2 Corrosion Measurements using Anodic Polarisation
The anodic polarisation method is an electrochemical technique commonly
used to quantify a metal‟s potential for corrosion [63]. This method is employed to
quantify the corrosion potential of the electrodes fabricated from the thermally-aged
AGR fuel cladding cut-samples (section 3.1). In principal the electrode, submerged
in an electrolyte solution, is applied a positive rate of increasing electrical potential
and simultaneously measured its current evolution which is characteristic of the state
of the sample and the type and concentration of the electrolyte solution.
The general experimental setup of the anodic polarisation method, which
comprises the working electrode (WE), counter electrode (CE) and reference
electrode (RE), is schematically illustrated in Figure 25. Note that the electrodes are
submersed in the electrolyte solution and are connected terminals of a potentiostat
device. Regarding the terminal connections, a sample of interest is always connected
to the WE terminal. Upon submersion in the electrolyte, an electrical double layer
forms spontaneously on the sample surface where the potential drop across the layer
gives rise to the WE‟s electrochemical potential, VWE. The absolute value of VWE,
however, cannot be determined standalone but, rather, is measured against the
potential of a RE that acts as an arbitrary zero potential value. Commonly used RE
terminals include the silver/silver-chloride (Ag|AgCl) electrode which contains metal
silver submersed in silver chloride solution, saturated calomel electrode or the
standard hydrogen electrodes. As is expected, the unique double layer that forms
gives rise to the RE‟s electrochemical potential, VRE. A voltmeter between the WE
and RE terminal measures the voltage or potential difference between VWE and VRE.
The voltmeter is read as VWE in reference to VRE and commonly reported in the
notation volts (V) versus Ag|AgCl. At rest condition with no external current applied,
the natural value of VWE is referred as the open circuit potential (OCP). Lastly, the
CE terminal is connected with an inert metal, usually platinum, which only plays a
role in completing the cell‟s current flow in the test solution.
A potentiostat device through a user-interface computer program is used to
alter the potential of VWE to either above or below its OCP. In anodic polarisation
studies, VWE is incrementally increased from its OCP towards the noble direction
(contrary to metal deposition studies in which VWE is decreased from its OCP values)
[77]. The potentiostat controls the VWE values by altering the VRE and subsequently

67
Figure 25 – Three electrode cell notations and operating principles
Working
Electrode
(WE)
Counter
Electrode
(CE)
Reference
Electrode (RE)

68
maintaining VWE at VRE by applying an external current (marker X in Figure 25).
According to Ohm‟s law, VWE equals current flow (i) times resistance (R); since R is
constant, i is imposed via an external source to increase VWE until it matches VRE.
A condition related to low conductivity is the IR drop. Corrosion current
measurements can be obscured in low electrolyte-containing test solutions due IR
drop. Pure water, for example, is a poor electrical conductor due to lack of charge-
transporting electrolytes and thus possesses a resistance that prevents the current
movement through the test solution. To minimise the effect of solution IR drop, the
reference electrode is placed in a Luggin‟s capillary which is a glass tube filled with
the same test solution as in the bulk that extends close to (but not shielding) the
surface of the working electrode. Consequently, there is no current flowing between
point Y and Z indicated in Figure 25, since there is no exit for the current in that tube.
The IR drop that remains within the small distance between Z and the electrode‟s
surface is usually negligible [71].
In the anodic polarisation tests employed throughout this study, polarising the
working-electrode above its anodic potential was carried out using a three-electrode
cell as shown in Figure 26a. The cell utilises a platinum counter-electrode,
silver/silver-chloride (Ag|AgCl) reference-electrode placed in a Luggin‟s capillary
and 80 ml. of electrolyte-NaCl solution. The cell is driven by a General Purpose
Electrochemical System (GPES) Potentiostat (Model VersaSTAT3; S/N: Autolab
AUT73534; Princeton Applied Research, Oak Ridge, TN 37830, USA). The
polarisation tests were evaluated at two concentrations of electrolyte-NaCl – 0.001M
and 0.1M – prepared by mixing 3.045 g and 0.029 g of NaCl (VWR BDH AnalR;
NaCl 58.44g/mol, Lot K33094133412; VWR International, Lutterworth,
Leicestershire LE17 4XN), respectively, into one litre of de-ionised water (Purite
Select <0.005 mg/ml solids, 18.2MΩ). In addition, the three-electrode cell
configuration was placed in a large Faraday Cage (340cm by 340cm base and 600cm
tall) to improve the sensitivity of current measurements against the influence of
external electric fields [77]. The experiments were carried out at room temperature.
Ten minutes of equilibration time was allowed for the working-electrode‟s
submerged surface to be in contact with the electrolyte-NaCl before starting a
measurement.

69
Working Electrode Counter
Electrode (Pt)
Reference Electrode
(Ag|AgCl) in a
Luggin’s Capillary
Electrolyte’s meniscus level
a) Raw current measurements in a three-electrode cell
b) Normalising the measured currents with surface-area
exposed to electrolyte-NaCl
MATLAB determines, by
differentiating brightness and contrast
pixel values, the area exposed to
electrolyte as 0.21 cm2
The calibrated Motic Image Plus
software indicates that the image
above has an actual dimension of
7.11 by 10.49 mm
Figure 26 – Raw current measurements in a three-electrode cell (a)
and procedures for normalising the measured current to surface area
submerged in electrolyte (b).

70
Using the GPES software, the potential of the working-electrode, VWE (Volts,
V (Ag|AgCl), was set to increase from -0.2 to 1.8V at a ramping rate of 0.0106V/s.
As VWE is increased, the corrosion current, i (Amperes, A), is simultaneously
measured. At the end of a measurement, the working-electrode in question was
immediately removed from the solution and thoroughly rinsed with generous
quantities of de-ionised water followed by drying with a jet of air. The dried samples
were stored in a cylindrical specimen-tube (SAMCO Vials, 48mm high x 10mm
diameter - 2.6 ml; ThermoFisher Scientific Ltd, Southend-on-Sea, Essex SS2 5PH)
with a small desiccating silicate-pack to preserve the sample against deterioration by
moisture. The post-polarised working electrodes were to be retrieved for
characterisation of corrosion morphology in a Scanning Electron Microscope (SEM)
and Light Interferometer (LI) (Section 3.3), preparation of electron transparent cross-
sections using the Focus-Ion Beam (FIM) instrument for compositional analysis in a
Transmission Electron Microscope (TEM) (Section 3.4), and etched for general
metallographic examination of grain structure and sizes as well as distribution of
secondary phases using SEM (Section 3.5).
The reliability of the current measurements was established by repeating the
above procedures with two new samples with fresh electrolyte-NaCl solutions in
order to obtain the mean and standard deviation values. That is, a total three anodic
polarisation measurements were evaluated for each specific heat-treated sample.
Should the mean current measurement be calculated as X and standard deviation as
Y then there is a 95% chance that the true mean is within plus or minus two standard
deviations. To illustrate, if the measured mean current X is 10.0 mA and standard
deviation Y is 2.0 mA then there would be a 95% chance of being correct to claim
that the true average of our mean estimate 10.0 mA was between 6.0 and 14.0 mA.
Sources of uncertainty in the experiment include solution preparation, working-
electrode surface area determination and irregular Luggin‟s capillary placement in
the three-electrode cell throughout the experimental duration.
The current measurement of a given sample is characteristic not only of the
heat-treatment but also of its surface area submerged in the electrolyte-NaCl solution.
The current measurement, therefore, is normalised against its post-corrosion surface
area evaluated using a creative digital-image processing procedure. There were two

71
steps. In the first step, the general dimension of the post-corrosion working-electrode
was evaluated with a Light Microscope (LM) (NOVEX Microscopes; Model: RZT-
SF; S/N: 65-560; Papenkamp 20, 6836 BD Arnhem, The Netherlands) that was
calibrated to the sample‟s geometric range. An Image Capture Camera (Moticam 480;
S/N: S573763; The Global Motic Group, Xiamen 361006, China) on the LM was
used to acquire a digital picture of the sample with the appropriate scale-marker.
Figure 26b shows a 500°C 48h heat-treated working electrode which was determined
from the calibration to have a physical dimension of approximately 7.11 by 10.49
mm. In the second step, this image was processed with a MATLAB code utilising
the Image Processing Toolbox aimed at resolving the brightness-contrast pixel
difference of the image. The MATLAB algorithm is provided in Appendix I. Figure
26b also shows that this particular working electrode has a surface area contrast that
was subjected to electrolyte-NaCl solution of approximately 0.21cm2. Normalised or
effective current measurements in units of mA.cm-2
, including the standard deviation,
were reported throughout the thesis.

72
3.3 Morphology Characterisation of the Polarised Working Electrode
The corrosion morphology of the polarised working-electrode was
characterised using a SEM [78]. High resolution images were obtained by detection
of interacted electrons from an incident electron beam that was rastered over a
surface area of interest under a vacuum generally better than 10-6
Torr. Alone
amongst the various types of interacted electrons (e.g. backscattered, secondary,
auger, diffracted, and transmitted), the secondary electron – orbital electrons that are
ejected from sample atoms by the incident electron beam – were detected to produce
the secondary electron images (SEI). The SEM (Model LEO 1525; S/N: 1289;
Zentrum für Werkstoffanalytik Lauf (ZWL) GmbH, Hardtstrasse 39b, 91207 Pegnitz,
Germany) was configured at an acceleration voltage of 20kV and an aperture size of
60m to eliminate the high-angle electrons from the beam source. Note that for
chemical composition quantification, even though information can be conveniently
obtained by detecting the characteristic X-ray from the electron interactions within
the SEM, this study employs instead the scanning Energy Dispersive X-ray
(scanning-EDX) technique in the TEM from the specimens prepared using the FIB
instrument (detailed in Section 3.4). The benefits of chemical analysis using the
scanning-EDX technique on thin foils are threefold. First, the measurement
uncertainties associated with the penetrative nature of electrons that may pervade
several microns deep beneath an unprepared, bulk metal at an acceleration voltage of
20kV are eliminated (i.e., large „activation volume‟ of the electron beam may give
chemical measurements that are irrelevant to the corrosion site of interest). Second,
bright-field, dark-field and energy loss signals can be acquired simultaneously as
more information is gathered per incident transmitted-electron in the TEM. Third,
„line-scan‟ chemical analysis on the FIB cross sections from developing corrosion
sites – for instance corrosion sites immediately adjacent to secondary phases such as
MnS or NbC as suggested by studies of Pardo et al. [79], Ryan et al.[13] and
Williams et al. [14] – enables the mechanism of corrosion to be determined.
In addition to corrosion morphology imaging, the other physical
characterisation of the polarised working electrode is the evaluation of the ratio of
width to depth of the well-developed pits and crevices. Two techniques have been
developed for this purpose. The first uses the ion-sputtering capability of the FIB

73
microscope (detailed in Section 3.4). The FIB microscope produces a highly-
energetic Ga ion beam that physically exerts a cascade of collisions on the targeted
area to cause ejection or sputtering of atoms. In order for the width and depth of a
particular pit or crevice to be evaluated, the targeted area for FIB sputtering is about
half the size of a site of interest until a sufficiently deep trench is formed. Figure 27
Width a
θ = 45°
(cross section)
Pit or crevice
Depth b
Figure 27 – Evaluation of pit or crevice’s width and depth of the post-
polarised working electrode
Milling
direction
θ = 0° (surface plane) Pit or crevice

74
illustrates schematically the FIB sputtering operation. The dotted-rectangle shows
sputtering intervals – with maximum ion current intensities of 20 nA – that are
successively aimed towards the centre of a pit or crevice of interest. At a tilting angle
of 60° the ratio of width to depth was evaluated.
The second technique utilises an Light Interferometer to determine the 3-D
topography of a pit or crevice of interest where the ratio of width to depth can be
subsequently determined. The 3-D topography was acquired using a scanning-white
light interferometer (ZYGO Interferometers; Model: NewView 200; S/N: 98-08-
60674; ZYGO Ltd Middlefield, CT 06455, USA). In principal, as the interferometric
objective lense is scanned along the vertical direction (z-axis) of the stainless steel
sample, the 3-D topography of this highly reflective material is mapped from the
coherent interference with the white light (Figure 28). Coherent interferences are a
result of the optical recombination between the initially split light source by an
internal reference mirror – causing bright (constructive) and dark (destructive)
fringes – and the sample interferences [80].
Figure 28 – Build-up of white-light interference on sample surface,
adapted from Leach et al. [80]

75
3.4 Morphology and Chemical Composition of Corrosion Products
FIB microscopes have been used increasingly in material science applications
which include Secondary Ion Mass Spectrometry (SIMS) and Low Energy Ion
Scattering (LEIS) analyses [81-85]. Whilst specimen preparation from the post-
polarised working electrode for TEM analysis is focused in this section, FIB has
been used extensively for circuit modification in the semiconductor industry utilising
its in-situ sectioning and micro-machining capabilities. Ion-beams are generated in
FIB microscopes as compared to electron beams in conventional electron
microscopes; therein lie its advantages and limitations. As ions are large relative to
electrons they are able to sputter materials and so shape them for examination. In
addition, the sputtered ions can be collected for surface or mass spectrometry
analysis of important lighter elements such as beryllium, carbon, nitrogen and
oxygen that cannot be detected from characteristic X-ray analyses. Energy
Dispersive Spectroscopy (EDS) in the SEM, for example, is limited by beryllium
window detector which prevents the passage of characteristic X-rays with energy
less than one keV, i.e. Kα X-rays below sodium (Na, Z=11) [86]. However, ion-
induced damage, in addition to other consequences such as tunnelling,
amorphophrisation, and redeposition of sputtered materials [87] render FIB
unsuitable for certain type of studies where sample perseveration is an issue. Both
the resulting secondary ions and electrons can be collected for imaging.
The FIB microscope (Model: FEI FIB200; S/N: 4604; Software version; Xpert
ver. 2.25; FEICO, Hillsboro, Oregon 97124 USA) was used in this study to prepare
samples for elucidating subsurface information of the post-polarised working
electrode. There are two specific applications. First, as described in Section 3.3,
determining the ratio of depth to width of well-developed pits or crevices was
enabled by FIB-milling of about half the size of the site of interest, subsequently
allowing a clearance for geometrical evaluation of the site when tilted at 60° (e.g.,
Figure 27). Second, the FIB microscope is used to prepare electron transparent cross-
sections (abbreviated to FIB-sections) ~0.1 µm thick for chemical composition
analysis in the TEM. The cross-sections are mostly chosen from sites that exhibit
developing pits or crevices – in particular those around secondary phases such as
manganese sulphide (MnS) or niobium carbide (NbC) – in order to examine the
factors governing their corrosion evolution processes. The FIB microscope was

76
equipped with a gallium-Liquid Metal Ion Source (Ga-LMIS). The accelerating
voltage for the ion column was set to 30kV and ion emission current was optimised
at 2.3µA. The sample is positioned in the vacuum chamber at eucentric height where
the ion-beam focus does not change laterally while tilting the sample (a manipulation
extensively used throughout FIB-section preparation). The ion currents for sputtering
are, from relatively strong to intermediate, 5000, 3000, 1000, 300, 200 and 100 pA
respectively. The sputtering time was adjusted to the type of material, e.g. a harder
material will require longer sputtering time to achieve the same effect as in a softer
material. Both the ion currents and sputtering times in the FIB microscope are
controlled by the Xpert 2.25 software. A particular function within the software that
is frequently used for FIB-section preparation is the milling-scripts that are
automated for initial bulk-milling operations (as opposed to fine-thinning operations
which must be performed manually).
The milling procedure for obtaining a FIB-section involved three operations
(and their associated ion currents): bulk-milling (~5000 pA), partial freeing (~300
pA) and final-thinning (~100 pA). At its start a layer of platinum strip is deposited
above an area of interest to protect it from damage during subsequent milling
operations. Figure 29a shows that the strip has a nominal thickness of ~1.3 m. In
addition, its length and width of 30.0 by 2.5 m adequately covers the envisaged
final FIB-section dimension of about 10.0 by 1.0 m. Note that the „X‟ markers were
intentionally etched on the platinum strip for image correlation purposes used by the
Xpert 2.25 software to implement the automated scripts. The bulk-milling operation
employs a relatively high ion current of about 5000 pA in order to optimise the
removal rate of the majority of the material adjacent to the cross-section of interest.
Figure 29b shows the resultant FIB-section to-be that is sufficiently „thin‟ but, more
importantly, the spaces adjacent allows for the next operation – „partial freeing‟.
Partial freeing refers to milling regions at the sides and base of the FIB-section in
order to „free‟ the section from the bulk metal. Figure 29c shows a partially „free‟
FIB-section at a tilt angle of 45°; yet, the FIB-section still hinges to the top-edge of
the platinum strip that is structurally-supportive for the final-thinning operation.
Note that it is essential that milling the sides of the FIB-section is carried out at
angles of 6° clockwise on the far right and 6° anti-clockwise on the far left as the

77
Figure 29 – FIB cross-section preparation for TEM analysis
a) 1.3m thick platinum deposited on
surface for protection during milling
b) initial milling at high currents
producing a thick sample
e) grain-structure revealing thin section f) thin-section as seen in TEM
c) tilted 45° for cutting the „sides‟ d) final milling to 1.0m thick

78
section gradually expands due to internal stress relief throughout the final-thinning
operation. Subsequently, final-thinning is carried out at ±0.8° on the front and back
faces of the FIB-section respectively at intermediate ion beam currents of 100 pA
until an approximate thickness of 1.0 µm as shown in Figure 29d. Figure 29e reveals
its grain structure when tilted at an angle of 45°. At this thickness electron
transparency is generally attained but on occasion settling within a sensible range of
thickness is allowable where the lack of electron transparency can still be
compensated with a higher acceleration voltage in the TEM. It is, however,
paramount to take precautions against distortion of the FIB-section during the final
thinning operation. Potential causes of distortion are: added weight on, and artificial
stresses in, the FIB-section arising from the re-deposited materials as a result of
over-milling or mis-focused milling; unbalanced alternation of milling sequence at
the front and back faces of the FIB-section; and lack of surface flatness of the sample
which causes biased milling rates across the section.
FIB-sections were retrieved from the crater and transferred to the TEM grid
(Type: S162A3H Formvar/Carbon 300 mesh Au-25; Agar Scientific Ltd, Stansted
Essex CM24 8GF) using the liftout method. The liftout method is schematically
illustrated in Figure 30.
FIB-sections were subsequently evaluated in the TEM (Model: JEM2010, S/N:
EM13004; JOEL Ltd, Tachikawa, Tokyo 190-0012, Japan). The two aspects
evaluated were transmitted-electron, bright-field imaging and scanning-EDX
chemical composition analysis. Both analyses were operated at an accelerating
voltage of 200 kV with the FIB-section stage at the eucentric height. At eucentric
height the electron-beam focus does not change laterally while tilting the sample as a
15°-tilt is necessary to maximise X-ray count whilst acquiring scanning-EDX data).
For imaging, the contrast of the FIB section arises due to the differences in the phase
of the electron waves that are transmitted through the thin specimen. The transmitted
electron images were acquired from the CCD camera (Mulltiscan Model 794; S/N:
04080601; Gatan GmBH, München D-80807, Germany). The TEM was equipped
with a scanning-energy dispersive x-ray detector (Model X-Max; S/N: 55355;
Software: INCA; Oxford Instruments Ltd, Abingdon, Oxfordshire, OX13 5QX)
which was used to quantify the chemical composition of the grains, grain boundaries,

79
and across secondary phases of the FIB-section. The scanning beam probe size was
20 nm and the energy-range quantified is 0-20kV. The analysis is optimised by using
an iron-Kα line calibration for each sample and performing the analysis at a tilt angle
(θ) of 20° as recommended by the manufacturer.
c) FIB-section lifted away from
the trench
d) FIB-section and needle
approaching a TEM-grid
e) FIB-section electrostatically
attached on the TEM-grid
f) needle removed and FIB-specimen
is ready for TEM analysis
Figure 30 – Lift-out procedure for transferring a FIB-section to TEM grid
b) FIB-section electrostatically
attached to the needle
a) A micromanipulator-controlled fine-
needle approaching the FIB-trench

80
3.5 Microstructural Characterisation
As a concluding analysis, the post-polarised working electrodes were etched
for metallographic examination. Several etchants, shown in Table 11, were
investigated for their ability to reveal the distribution of grain structures and
secondary phases of the heat-treated austenitic stainless steel 20Cr/25Ni/Nb samples.
The etchants preferentially dissolve the higher surface energy sites to provide grain
structure contrast. Apart from Kalling‟s No.2, Vilella‟s and Marbles which were
swab-based etchant chemicals as recommended by Struers Application Note:
Metallographic Preparation of Stainless Steel [88], electrolytic-etching with
saturated oxalic acid proposed by the Metals Handbook [21] were also evaluated.
The latter involves applying a large anodic voltage (note that 6V is relatively large in
electrochemistry applications) to the specimen surface in the saturated oxalic acid
solution. For this purpose, the three-electrode cell and GPES Potentiostat system
(described in Section 3.2) is convenient. The cell‟s configuration is as follows: the
post-polarised sample as the working-electrode, platinum counter-electrode, silver-
silver chloride (Ag|AgCl) reference-electrode placed in a Luggin‟s capillary with
about 80 ml. of saturated oxalic acid solution. The GPES software was subsequently
used to apply to the working electrode a constant anodic potential of 6V and held for
10s.
Table 11 – Determination of etchant for metallographic examination
Etchant Composition Remarks
Kalling‟s No.2
100mL HCl, 5g CuCl2, 100ml
ethanol (95%)
Swab for 3s, 20s and 40s
Vilella‟s 5ml HCl, 1g Picric Acid, 100ml
ethanol (95%)
Swab for 20s
Marbles 10g CuSO4, 50mL HCl, 50ml
distilled water
Swab for 3s and 20s
Oxalic Acid 10g Oxalic acid in 100ml distilled
water (saturated solution)
Electrolytically-etch at 6V
for 10s according to
procedures outlined in
Davis [21]

81
Subsequent to etching, the electrodes were analysed in SEM (same SEM
conditions described in section 3.3 for corrosion morphology characterisation) to
acquire the SEI images which revealed the distribution of grain structures and
secondary phases. The SEI image was processed with the MATLAB code earlier
described in section 3.1 (and enclosed in Appendix 1) aimed at resolving the counts
and average size of the secondary phases which appear as bright pixels in the SEI
image. The bright pixels are regions of high average atomic number particles that
give a higher variation in number of emitted electrons, thus appearing bright relative
to regions of low atomic number. In this case, based on the difference in electron
emission from regions of different atomic number, the bright pixels are by and large
associated with niobium carbides (NbC) in the electrodes, since niobium precipitates
are the primary strengthening particles for the AGR fuel cladding (described in
section 2.1). The counts of secondary phases are averaged across three 2000x-
magnified SEI images of different sites but within the same electrode to obtain the
statistical uncertainty or standard deviation of their distribution.
82
4.0 Results and Discussion
4.1 Electrochemical Behaviour of Thermally-Aged AGR Fuel Cladding
Figure 31 summarises the absolute electrode potentials of the as-sourced and
heat-treated AGR fuel cladding specimens that were measured during the potentio-
dynamic scanning when the current density reached 5.0 mA.cm-2
, abbreviated E5.0, in
both the electrolyte-NaCl of concentration 0.001M (Figure 31a) and 0.1M (Figure
31b). A current density of 5.0 mA.cm-2
was selected as the analysis benchmark due
to its suitability to compare both electrolyte-NaCl concentrations using the same
scales. Averaged across samples from every heat treatment temperature and time, the
E5.0 values measured were 1.47±0.27V in the 0.001M electrolyte-NaCl and
0.66±0.14V in the 0.1M electrolyte-NaCl. The relatively low E5.0 of 0.66±0.14V that
has been sufficient to drive the metal dissolution currents up to the 5.0 mA.cm-2
mark is due to the high chloride concentrations in the 0.1M NaCl-electrolyte. In
contrast the relatively high E5.0 of 1.47±0.27V that was required to drive a current of
5.0 mA.cm-2
is because of the low chloride concentration in the 0.001M NaCl-
electrolyte. The distinct electrode potential ranges – about 800mV per two decades
of chloride concentration differences – indicate that lower amounts of chloride ion in
the electrolyte decrease the rate at which metal dissolution occurs (e.g.,
Cr(s)→Crn+
+ne, Fe(s)→Fen+
+ne, Ni(s)→Nin+
+ne). This trend is consistent with
Newman et al. [8] – who reported for stainless steel 316L a 200mV difference for
the same concentration in thiosulphate electrolyte – and others including Galvele
[89], Laycock et al. [90], Moayed and Newman [91], Soltis et al. [64], Smialowska
[63] and Williams and McMurray [92] reporting for other metals and electrolyte
concentrations. Note that the difference of 800mV is also attributable to the
benchmark 5.0 mA.cm-2
adopted for analysis which is close to the O2 evolution
regions. At around 1.4V, there exist a rapid rise in currents due to the dissolution of
O2: O2+H2O+4e→4OH-. Demonstrating a trend consistent with the literature
throughout the experimental duration, by means of experimenting with at least two
electrolyte-NaCl concentrations as have been employed in this study, provides an
empirical gauge of logical corrosion measurements over the many courses of
solution preparation, working-electrode fabrication and Luggin‟s capillary placement
in the three-electrode cell.

83
In addition to the absolute electrode potentials E5.0, the percentage values
shown at the top of the bar charts in Figure 31 conveniently shows the average
percent change in E5.0 due to heating time increases, i.e. from 24 to 48h, 48 to 96h
and 96 to 192h. The arrow indicates the trends in E5.0 changes. The data exhibit both
positive and negative changes depending on the heating time transition. A positive
change indicates relative widening of passive range in the anodic polarisation curves
of the electrodes, i.e. improvement in corrosion behaviour. To illustrate, Figure 32
shows the individual polarisation curves from the 700°C samples which constantly
exhibit a passive range widening or improvement in the sample‟s corrosion
resistance in response to increasing heating time. At high NaCl concentrations
(Figure 32a) the absolute E5.0 values were 0.69V, 0.72V and 0.89V – a 13.6% or
200mV compound increase in passive range – corresponding to heating time
increase of 48, 96 and 192h respectively. This trend is similar to the measurements at
low NaCl concentrations (Figure 32b); the E5.0 measured in 0.001M electrolyte-NaCl
were 1.38V, 1.57V and 1.63V – a 8.7% or 250mV compound increase in passive
range – corresponding to the latter heating time increases. A negative percent change
in E5.0, on the other hand, is a measure of the relative narrowing of the passive range
in the anodic polarisation curves or decreasing corrosion resistance of the electrodes
as a result of heat treatment. Figure 33 shows the individual polarisation curves of
the 500°C samples which consistently exhibit the trend of decreasing corrosion
resistance in both electrolyte-NaCl concentrations. The E5.0 values measured in the
0.1M electrolyte-NaCl (Figure 33a) were 0.92V, 0.58V and 0.34V – a 63.0% or
580mV compound decrease in passive range – corresponding to a heating time
increase of 48, 96 to 192h respectively. Within the same heating times, samples in
the 0.001M electrolyte-NaCl (Figure 33b) measured E5.0 value decreases from 1.65V,
1.35V and 1.14V – a 29.6% or 510mV compound decrease in passive range.
To compare the trends of corrosion behaviour across all heating temperatures,
the percent changes in E5.0 for the 24-48h, 48-96h, and 96-192h heating time
transitions for the 0.1M electrolyte-NaCl are plotted in Figure 34. In general, heat
treatments of up to 96h improve the passive range of the samples (with the exception
of the 500°C samples). The averaged percentage increase in electrode potential for
the 24-48h heating transition across all heating temperatures is 18.1±10.7%. The
successive 48-96h heating transitions shows a further 14.2±6.5% increase averaged

84
Figure 31 – Electrode potential measurements of the heat-treated samples
obtained at benchmark current density of 5.0 mA.cm-2
in 0.001M and 0.1M
electrolyte-NaCl
a)
b)

85
Figure 32 – Anodic polarisation curves for 700°C 48, 96 and 192h heat-
heated samples in 0.001M and 0.1M electrolyte-NaCl.
Increasing passive
range with heating
time at 700°C
Increasing
passive range
with heating
time at
700°C

86
Figure 33 – Anodic polarisation curves for 500°C 48, 96 and 192h heat-
heated samples in 0.001M and 0.1M electrolyte-NaCl
Decreasing
passive range
with heating
time at 500°C
Decreasing
passive range
with heating
time at 500°C

87
across all temperatures (apart from the 500°C samples). Prolonged heating of up to
192h, however, almost always results in a decreased E5.0 from its initially increased
values over the first 96h of heating; apart from the 700°C samples the 96-192h
heating time transition measured a steep, average percent decrease in E5.0 values of
29.9±15.0%. Note also that for the 500°C samples the decrease in corrosion
resistance has already occurred in the 48-96h heating time transition. The observed
changes in corrosion behaviour (variation in the E5.0 values) of the specimens can be
attributed to the age hardening characteristics (section 2.3.1) that manifest in the
heat-treated microstructure, which are characterised by various methods as described
in sections 4.2 to 4.5. Specifically, the microstructures which led to the corrosion
susceptibility (i.e., 400°C 192h, 500°C 192h, 600°C 192h and 800°C 192h) are
characterised and compared to the as-sourced, factory annealed AGR fuel cladding
specimens.
Figure 35 shows the absolute E5.0 value of the heat treated specimens in the
0.1M electrolyte-NaCl on a time-series plot to examine the effect of heating times on
Figure 34 – Percent changes in electrode potential in response to varying
heat treatment time for all temperatures

88
Figure 35 – Electrode potential measured at constant current density of 5.0 mAcm-2
as a function of heat treatment time
in electrolyte-NaCl 0.1M. Note that the dotted-lines are smoothed-curves.
*not including 500°C 96h

89
its corrosion behaviour. Note that the E5.0 of the as-sourced, factory-annealed AGR
fuel cladding specimens is 1.15V, a high electrode potential which drives a current
of 5.0 mA.cm-2
due to the sample‟s optimum corrosion resistance from the
manufacturing process. The absolute E5.0 values for the 24 and 48h heated samples
averaged across all heating temperatures were 0.61±0.06V and 0.72±0.03V
respectively, an increase of about 18%. The narrow error-bars exhibited in both
averages that are reproducible within 9.9% and 4.5% respectively indicate that for
short heating times (i.e., <48h) the heating temperatures employed have not been
able to induce a marked difference in the specimens microstructure, hence their
similar corrosion behaviours. This notion can be extended to the heating time of 96h
(if the 500°C specimens are excluded from the analysis) in which case the absolute
E5.0 values averaged across all other temperatures was 0.81±0.05V – a value
reproducible within 6.2%. The 500°C 96h heated samples, however, measured E5.0
value of 0.5V which is a steep decrease from the 48h heating time at a rate of -0.59%
h-1
(28.3%/48h). The prolonged heating time of 192h shows a wide range of E5.0
values, which indicates temperature-dependent microstructural changes. Whilst the
700°C samples showed a marginal improvement in E5.0 value from the previous
heating times, all other treatment temperatures revealed a decrease. The 800°C
samples, in particular, exhibit the sharpest decrease in E5.0 at a rate -0.52% h-1
(48.3%/96h). The 500°C 192h samples exhibit the lowest E5.0 value in this study at
0.34V, i.e., the least corrosion resistance with performance about 810mV relative to
the factory-annealed value of 1.15V.
As a summary this section shows the corrosion measurement results from the
heat-treated and as-sourced AGR fuel cladding samples that had their electrode
potentials measured at the current density of 5.0 mA.cm-2
, E5.0. E5.0 is an expression
of passive range; a comparatively smaller value indicates the sample‟s corrosion
susceptibility to the other since that value is already enough to drive a dissolution
current to 5.0 mA.cm-2
. Averaged across samples from all heating temperature and
time, the E5.0 values are 1.47±0.27V and 0.66±0.14V in electrolyte-NaCl 0.001M
and 0.1M respectively – about 800mV difference per two decades of chloride
concentration. High chloride concentration adversely impacts AGR fuel cladding
corrosion and therefore should be kept to a minimum in the Receipt and Storage
Ponds. Within both electrolyte concentrations, E5.0 exhibit a consistent trend of

90
variability across the heat treatment matrix employed in this study (temperatures:
400°C to 800°C, times: 24 to 192h). This suggests that the AGR fuel cladding which
operates over a gradient of similar temperature ranges across its 1m length may
consist of areas of different corrosion susceptibility, certainly more profoundly if
also coupled to effect of radiation damage. Generally, the E5.0 values increase over
the first 96h of heating (annealing effect) but deteriorate when the sample is further
heated to 192h (Figure 34). In particular, heating temperatures of 500°C and 800°C
produce samples of the highest magnitude and percent decrease in E5.0 values (Figure
34). The next section shows their corrosion morphologies from the post-polarised
electrodes and attribution of the deteriorated E5.0 values to specific microstructure
that results from the heat treatment matrix employed. In particular, the 500°C 192h
and 800°C 192h samples, and in comparison to the 600°C 192h and as-received
samples, are extensively examined to elucidate the critical microstructural features
that affect its corrosion behaviour. These samples have average E5.0 values,
respectively, of 0.34V, 0.45V, 0.65V and 1.15V.

91
4.2 Corrosion Morphologies of Post-Polarised Electrodes
This section of the thesis examines the corrosion morphology of the post-
polarised electrodes in the SEM. Figure 36 compares at low magnification a series of
electrode surface conditions that exhibit an increasing tendency of crevice corrosion
between the as-received, 500°C 96h, 500°C 192h, and 800°C 192h electrodes that
register E5.0 electrode potential values of 1.15V, 0.65V, 0.45V and 0.34V
respectively. For the as-received electrode (Figure 36a) the interface between the
steel and resin remains „seamless‟. This observation parallels the expectation that the
as-manufactured metal should possess a good level of corrosion performance; a
relatively high electrode potential of 1.15V is required to drive the metal dissolution
currents up to the 5.0 mA.cm-2
mark. In stark contrast the electrode from the 800°C
192h heated cladding specimens (Figure 36d), i.e., the highest heating temperature
and duration employed in the thermal-aging treatment, exhibited appreciable crevice
corrosion between the steel-resin interface and pitting corrosion on the bulk metal‟s
surface. This observation suggests that the corrosion resistance afforded by the as-
received cladding has been diminished due to the heat treatment; an electrode
potential of only 0.30V has raised the metal dissolution current to a level of 5.0
mA.cm-2
or 74% lower electrode potential than the as-received electrode. The
microstructural and chemical features that distinguish their corrosion susceptibility
are reported in Sections 4.3 and 4.4. The other electrodes, given intermediate heat-
treatment temperatures and times of 500°C 96h (Figure 36b) and 500°C 192h (Figure
36c), show intermediate degrees of corrosion between the as-received and 800°C
192h electrodes.
Another observation with regard to the corrosion susceptibility of these
electrodes is the proportional decrease in the electrolyte solution‟s opacity in the
three-electrode cell containing the dissolved metal ions from the anodic dissolution
processes. Figure 37 compares qualitatively the electrolytes opacity containing
dissolved metal ions from the electrodes. For the as-received sample (Figure 37a) the
electrolyte solution remains virtually transparent and clear. For the 400°C and 600°C
192h samples the solution became „murky‟ (Figures 37b and 37c). For the 500°C
96h, 500°C 192h and 800°C 192h electrodes their electrolyte solution shown in
Figures 37d, 37e and 37f respectively are highly sedimentitious. Therefore on a
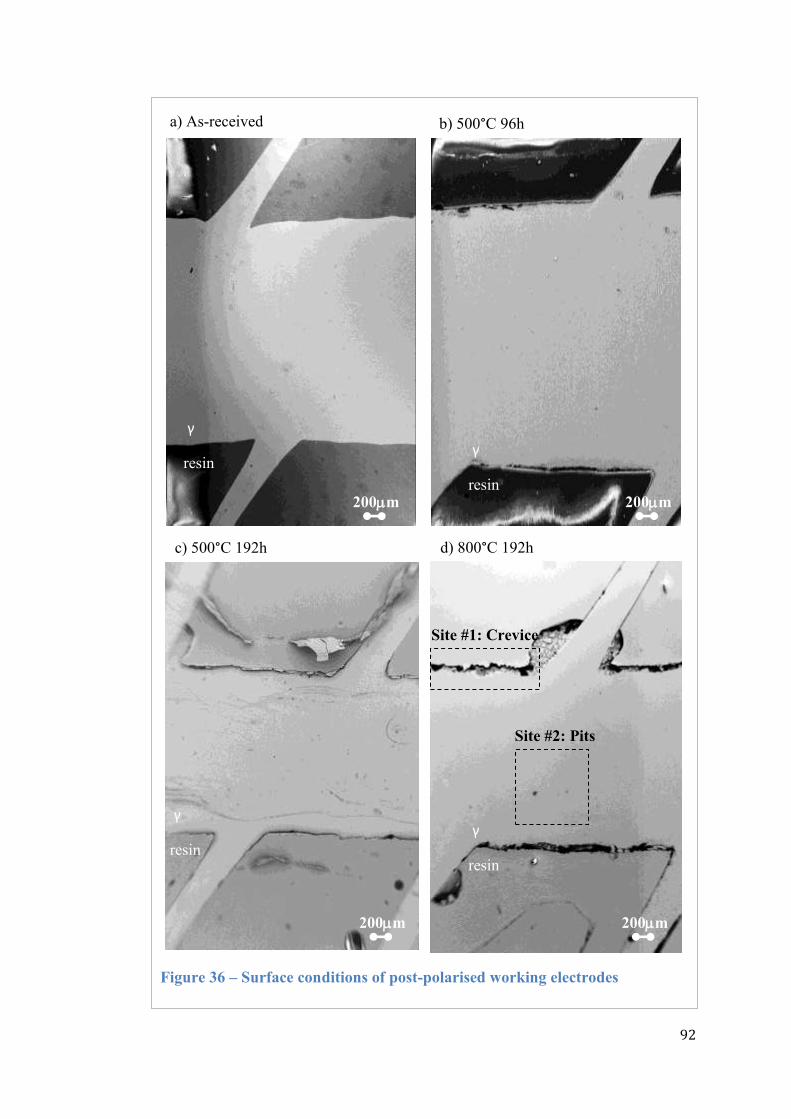
92
a) As-received b) 500°C 96h
c) 500°C 192h d) 800°C 192h
Figure 36 – Surface conditions of post-polarised working electrodes
Site #1: Crevice
Site #2: Pits
200m 200m
200m 200m
γ
resin γ
resin
γ
resin
γ
resin

93
Figure 37 – Opacity of electrolyte solution containing dissolved metal ions
a) as-received
d) 500°C 96h
b) 400°C 192h
c) 600°C 192h
e) 500°C 192h f) 800°C 192h

94
preliminary, qualitative basis there is evidence of increased corrosion susceptibility
due to thermal-aging of the cladding specimen as indicated by both the increasing
concentrations of pits (discussed in detail later in Section 4.4) and crevices and the
proportional decrease in electrolyte solution opacity which contains the dissolved
metal.
Site #1 and Site #2 (labelled in Figure 36d) from the 800°C 192h electrode
were analysed in detail.
Figure 38 shows three micrographs from Site #1 illustrating its crevice
corrosion morphology. Figure 38a shows a deep, ~ 100 µm wide crevice between the
steel-resin interface which contrasts the marked corrosion susceptibility of the
electrode compared to the „seamless‟ interface in the as-received electrode. The
metal portion along the crevice exhibits some lace-like corrosion (a lacy corrosion
cover). Figure 38b utilised a tilt-angle of 70° to examine the morphology beneath the
lacy corrosion cover, albeit with a restricted view. The area beneath the cover
extends to a much wider, deeper region. The pit bottom exhibits a smooth surface
which indicates that the corrosion process is diffusion controlled as suggested by
Galvele [61] (Section 2.5). This micrograph in particular also reveals the metal
scales that have collapsed to the pit bottom. At higher magnification (Figure 38c)
traces of salt crystals, e.g sodium chloride (NaCl), were seen to have deposited on
the surface of these metal scales.

95
Figure 38 – Crevice corrosion on 800°C 192h post-polarised electrode
a) Site #1,
imaged
at θ = 0°
b) Site #1,
imaged
at θ = 70°
c) close-up of
micrograph
b)
γ
γ
resin
resin 100m
100m
2m
Salt
crystal
Lacy
cover

96
Considering pitting corrosion morphologies, Figure 39 shows a high
magnification image of Site #2 from Figure 36d which reveals three forms of pitting
corrosion. They include: pitting accompanied by a lacy corrosion cover adjacent to
an inclusion, determined to be niobium-carbide (NbC), Figure 39a; pitting without
visible lacy corrosion cover that also occurs around an inclusion, Figure 39b; and
open pits with a concave geometry that are freely exposed to the bulk environment,
Figure 39c. Figure 39a shows two examples of pitting corrosion morphology
associated with a lacy corrosion cover that is evolving around an inclusion. In the
left micrograph, the lacy cover is ~12 µm wide around a rectangular-shaped ~10 by
2 µm NbC particle. The right micrograph shows a larger lacy corrosion cover ~30
µm diameter that is evolving around an angular (4 by 4 µm) NbC particle. Figure 40
shows a compilation of lacy corrosion covers from other electrodes, with details of
heat treatment given in the caption, to illustrate their size ranges, even though there
is no trend between cover size and heat treatment. Most of the lacy corrosion covers
bend over the surface plane due to their width and weight. At some stage, this is
potentially followed by collapse into the bottom of the pit. These morphologies
suggest that pit acidification processes are potentially maintained by the lacy
corrosion cover as suggested by Ernst et al. [55, 66, 76] and that the acidification
process stops as the cover is mechanically detached from the bulk metal. Note that
the geometry of these NbC inclusions is well maintained even though extensive
corrosion has occurred around them, suggesting that it acts as a cathode and is
relatively stable to the matrix. Figure 39b shows two other examples of pitting
corrosion that do not exhibit a lacy metal cover but that occurs around NbC
inclusions. Figure 39c shows two examples of stabilised pits consisting of neither
lacy corrosion cover nor inclusions. The left figure shows a stabilised twin-pit
feature measuring about 16 µm wide whereas the right figure shows a stabilised
hemispherical pit (~10 µm wide) that contain remnants of metal that may have
originated from a pre-existed lacy corrosion cover.

97
a) lacy corrosion cover-type of pitting adjacent NbC inclusion
b) pitting corrosion adjacent NbC inclusion
c) stabilised pits with concave geometry that is freely exposed to bulk environment
Figure 39 – Occurrences of pitting corrosion in the post-polarised 800°C
192h post-polarised electrode
5m 2m
2m
2m 2m
2m
γ
NbC
γ
NbC
NbC
NbC
γ γ
γ γ
NbC

98
Figure 40 – Typical size and feature of lacy corrosion covers
a) 400°C 192h (~15 µm dia.)
3m 2m
4m 1m
3m 2m
3m 1m
g) 700°C 192h (~12 µm dia.) h) 700°C 192h (~5 µm wide)
e) 600°C 192h (~10 µm dia.) f) 600°C 192h (~12 µm dia.)
c) 500°C 192h (~5 µm dia.) d) 500°C 192h (~25 µm dia.)
b) 400°C 192h (~10 µm dia.)

99
Figures 41 to 43 show the results from two techniques – interferometry and
FIB milling as detailed in Section 3.3 – employed to profile the subsurface geometry
of the observed pits and crevices. Figure 41 shows the width and depth measurement
of a pit using an interferometer. The left micrograph in Figure 41a shows a pit that
was imaged under the SEM whereas the right micrograph shows the corresponding
pit that was tracked and analysed under the interferometer. Figure 41b shows two
orientations of the resulting 3-D topography image which indicates the flexibility of
this method to study the surface roughness and varied depths across the bottom of
the pit. This particular pit is 23.0 µm wide by 14.5 µm deep giving a width-depth
ratio of ~1.6.
Figure 42 explores the pit geometry of another site using the FIB-milling
capability. In Figure 42a material adjacent to the site was removed by milling to
provide sufficient clearance to enable the features at the pit to be characterised at a
tilt angle of 45°. Figure 42b revealed the pit was 21.5 µm wide by 8.1 µm deep,
yielding a width-depth ratio of ~2.6. The micrograph also illustrates the highly
porous structure of the lacy corrosion cover and smooth concave nature at the pit
bottom which may be stable to further corrosion.
Figure 43 is an attempt to use the FIB-milling technique to characterise the
subsurface geometry of a crevice. Figure 43a shows a ~160 µm wide crevice site.
Figure 43b shows a rectangular strip along the metal portion of the site that was
milled to provide clearance for subsurface examination. Note that the brighter resin
contrast in this image is indicative of the metal layer that is re-deposited on the resin
surface from the milling process. Figure 43c, however, indicates that the crevice
extends to a much greater depth beneath the visible regions which restricts the
crevice geometry profiling and also observation of its full morphology. Nonetheless
this micrograph reveals that the crevice exhibits several layers of lacy corrosion
cover.

100
Figure 41 – Depth profiling of 600°C 192h sample with interferometers
a) Secondary electron and interferometer images of Figure 44g
c) Width and depth profiling
metal
b) Two orientations of 3D-topography image
5m
width: 6.5 – 29.5µm
depth: -13.5 – 1.0 µm
width/depth ratio: 1.6

101
Figure 42 – Subsurface geometry characterisation of pit using FIB on
500°C 192h sample
10m
a) start of bulk milling, image obtained at θ = 45°
10m
b) bulk milling approaching middle of pit, image obtained at θ = 45°
depth:7.1µm
width: 21.5µm
Depth/width ratio: 3.0

102
resin
γ
resin
Figure 43 – Subsurface geometry characterisation of crevice using FIB
on 500°C 192h sample
a) crevice
site
b) FIB ion
milling
c) imaging at
tilt angle of
35°
resin
γ
γ
50m
50m
50m

103
Figure 44 shows FIB characterisation of one of the most-corroded electrodes,
the 800°C 192h sample, to indicate the extent and magnitude of microstructural
changes arising from subsurface pitting and corrosion. The large micrograph shows a
large lacy corrosion cover ~200 µm from the „centre‟, although only a portion of the
whole cover is shown in Figure 44. Two sites labelled Site #3 and #4 (situated about
300 and 150 µm from the „centre‟ respectively) were intended for FIB cross-section
characterisation. However, as shown in the magnified micrographs of Site #3 and #4,
the regions below the lacy corrosion covers are by-and-large voids. It is reasonable
to expect that a much larger network of corrosion remnants exist underneath the
surface of the metal cover and that it extends beyond the „centre‟.

104
Figure 44 – Subsurface development of pits in 800°C 192h sample. Note that the slightly dark contrast
regions are FIB scanning marks whose materials have been sputtered-off whilst focussing the image
Site #4:
5m
5m 25m
Site #3:
Large region of
lacy metal cover
„centre‟

105
On a related matter, in order to analyse the salt crystals formation that has been
observed in Figure 38c, an additional experiment was performed to characterise
another 500°C 96h post-polarised electrodes retrieved from the electrolyte solution
in the three electrode cell but let dry under ambient conditions so not using the
normal sample handling protocol involving rinsing by a jet of water. Figure 45
shows salt crystal deposits on the surface of the unrinsed, post-polarised electrode
that were concentrated at the metal-resin interfaces and throughout the metal surface.
Sites #5, #6 and #7 were analysed more closely to characterise the salt deposit
morphologies. Figures 46a and 46b are higher magnification images of Sites #5 and
#6 respectively which show high concentrations of salt deposits crystallised along
the metal-resin interfaces. Figure 46a, in particular, shows that the salt deposits are
least concentrated above the area in which the lacy corrosion cover appears most
intense. On the other hand, Figures 46c and 46d, higher magnification images of Site
#7, suggests that these salt crystals are adherent rather than chemically-absorbed on
the metal surface as indicated by the „detached‟ salt deposit feature. These
preliminary observations suggest that the effects of salt crystallisation may
potentially be important in metal dissolution processes and that one of the future
work should focus on the effects of crystallisation stresses imparted on the metal
surface and modification of the surface tension by the salt deposits [93].
To conclude this section, the morphologies of AGR fuel cladding corrosion,
both crevice and pitting, have been revealed with the post-polarised electrodes.
Three common types of pitting corrosion were encountered: (i) pitting accompanied
by a lacy corrosion cover (Figure 39a); (ii) pitting without visible lacy corrosion
cover but which extends to a certain depth beneath the surface plane (Figures 39b
and 40); and (iii) repassivated or restabilised pits with a concave geometry that are
freely exposed to the bulk environment (Figure 39c). They have a width-depth ratio
between 1.6 to 2.6, although their actual size varies locally depending on the site and
no correlation to their E5.0 values as a result of heating temperature and time have
been established. Niobium carbide precipitates have a significant role in cladding
corrosion as they are involved in most of the pitting and crevice corrosion
morphologies encountered. They may act as cathode in the electrochemical
corrosion mechanisms due to their relatively well-maintained geometry even though
extensive corrosion has occurred around them. The next section shows from TEM

106
analyses on FIB-prepared cross sections the subsurface corrosion features, including
chemical composition analyses, of the post-polarised electrodes.
Figure 45 – Salt deposits on the metal-resin interface of the unrinsed,
post-polarised 500°C 96h heat treated electrode
γ
resin
50m
Site #5:
crevice
Site #6:
edges
Site #7:
surface
Salt deposits
Salt deposits

107
Figure 46 – Salt deposit morphologies of the unrinsed, post-polarised 500°C
96h heat treated electrode
b) close-up of Site #6: edges
γ
resin
30m
Salt
deposits
Salt
deposits
resin
γ
a) close-up of Site #5: crevice
‘adherent’
salt deposits
5m
c) close-up of Site #7: crevice d) close-up of c)
‘detached’ salt
deposit
30m
30m
clear

108
4.3 Chemical Analysis of Subsurface Corrosion
Cross-sections of the post-polarised electrodes were obtained using the FIB
technique for subsurface chemical composition characterisation in a TEM. The
characterisation presented in this section includes imaging and acquisition of
characteristic X-rays from the FIB cross-section using an electron probe of 0.5 nm
diameter in either a fixed-spot or scanning mode. Figures 47 to 49 show
representative examples of the FIB cross-sections and analyses of the as-received
samples (previously measured an average E5.0 value of 1.15V). They are compared to
the 500°C, 600°C and 800°C 192h heated samples which registered average E5.0
values of 0.34V, 0.65V and 0.45V (v.s. Ag|AgCl, Section 4.1) shown in Figures 50-
52, 53-57 and 58-59 respectively. In several instances the FIB cross-sections shown
were obtained from sites in which corrosion is „developing‟ in order to investigate
the conditions or internal structure of the anodic dissolution processes occurring.
Figures 47 show FIB cross-sections of two as-received AGR fuel cladding
specimens. Low magnification micrographs (Figure 47a and 47b) show an electron-
transparent section (~10 µm wide by 4 µm deep) within which the fine precipitates
(0.1 – 0.5 µm diameter), indicated by the dark-contrast spots, are dispersed
homogeneously throughout the austenitic grains. Three sites highlighted as Site #8,
#9 and #10 are shown magnified in Figures 47c, d, e and f with labels indicating the
location of probes used for chemical analyses at specific features. The dispersion of
fine precipitates was labelled from M to T with their chemical analyses given in
Figure 48. The fine precipitates were determined as niobium-rich phases with a mean
composition of about 66.6±16.8 at% Nb; they range from 0.1 to 0.5 µm in diameter.
The chemical composition of the nominal AGR fuel cladding‟s austenite grains
indicated as A to L in Figure 48 (not explicitly labelled in the micrographs) is
50.3±1.7, 21.0±1.1 and 22.0±0.4 at% of iron, chromium and nickel respectively.
Site #8 contains the occurrence of three adjacent precipitates (labelled X, Y
and Z). Analyses indicate that they are a sequence of niobium-manganese-niobium
rich phases. Precipitates X and Y have on average a high niobium concentration of
88.4±0.7 at% whereas the manganese-rich precipitate contains about 50.3 at%
manganese and 37.1 at% sulphur. Figure 49 confirms their chemical composition via
a scanning-probe analysis. The dashed-line indicates the location of the scanning-
probe. The chemical profile across the 1.2 µm scan-length, shown as % count,

109
Figure 47 – FIB cross-sections of as-received AGR fuel cladding
a) FIB section of as-received AGR
fuel cladding #1
c) Site #10 d) Site #8
e) Site #10 (extension) f) Site #9
Site #8
b) FIB section of as-received AGR
fuel cladding #2
Site #10
Site #9
X Y
Z
T
S
R
Q
P
M
N
O

110
Figure 48 – X-ray analyses of the FIB cross-section from the as-received AGR fuel cladding
Ato
mic
pe
rce
nt

111
Figure 49 – Scanning-probe analysis of the niobium-manganese-niobium rich
precipitates from site #8 of the as-received AGR fuel cladding specimen
X Z
Y
X Z
Y
0.1m

112
conveniently illustrates a sequence of five alternating features: austenite-γ metal;
niobium rich precipitate (X); manganese-sulphide precipitate (Z); niobium-rich
precipitate (Y); and austenite-γ metal. These features may potentially become
conditions for corrosion initiation due to potential for galvanic or electrochemical
imbalance. One of the benefits of chemical analyses with FIB cross-sections in a
TEM are that features with complex internal structure can be analysed by the fine
electron probe, contrary to chemical analyses of the sample surface in an SEM which
may produce characteristic X-rays from a large activation volume several angstroms
beneath the surface that are not representative of the particular feature.
Figures 50-52 show FIB cross-sections and analyses of the 500°C 192h post-
polarised working electrode. Figure 50a shows the electrode surface which consists
of a relatively large (~20 µm dia.) lacy corrosion cover located in the bottom left of
the micrograph. The rectangular box adjacent to the cover highlights the approximate
area where a FIB cross-section was obtained for subsurface corrosion morphology
characterisation. Figure 50b (the corresponding FIB cross-section) reveals
microstructures containing strain fields indicative of high dislocation density and
also, interestingly, two „voids‟ indicated by the bright spots. The two „voids‟ are
situated around the particle labelled M (Figure 50d), determined to be niobium-rich
phases with an average concentration of 77.2±0.8 at% Nb from the chemical
analyses presented in Figure 52. This observation shows that one of the potential
avenues for metal dissolution is around NbC precipitates. The NbC precipitates in
this sample are large, up to 6 µm wide, relative to those observed in the as-received
samples (0.1–0.5 µm dia.) and so are likely due to the heat treatment employed.
Figure 50c shows the chemical profile, in % count, across the 3.0 µm scan-length
indicated by the dashed-line in Figure 50d which revealed a sequence of alternating
phases along regions labelled B, M, C and L: austenite-γ metal; niobium-rich
precipitate (M); dissolved-metal below the north bright „void‟; niobium-rich
precipitate (L); and austenite-γ metal. The term dissolved-metal was coined to refer
to an alloy composition that is significantly lower than the nominal austenite-γ
concentration, previously determined to be 50.3±1.7 at% Fe, 21.0±1.1 at% Cr and
22.0±0.4 at% Ni (Figure 48), which has been frequently observed along the gaps
between NbC precipitates. This feature is presented more clearly with another 500°C
192h FIB cross-section shown in Figure 51. Figure 51a was labelled X, Y and Z for

113
the fixed-spot chemical analyses and a dashed-line parallel to them for scanning-
mode chemical analyses. The results of the fixed spot chemical analyses shown in
Figure 52 (the right hand bar charts) indicate that Y is a dissolved-metal region
which contains niobium (18.7 at% Nb) with dissolved alloy compositions of 40.1 at%
Fe, 16.7 at% Cr and 18.2 at% Ni – a 20.2%, 20.5% and 17.3% decreased in Fe, Cr
and Ni from the nominal austenite-γ metal. Y is sandwiched between X and Z, both
of which are relatively large (compared to the 0.1 µm-sized niobium phases in as-
received samples) niobium-rich phases that averaged 90.0±0.3 at% niobium and
were ~1 µm wide for precipitate Z and up to 6 µm wide for precipitate X. Results
from the scanning-mode chemical analyses (Figure 51b) shows the chemical profile,
in % count, across the 1.2 µm scan-length which confirms a dissolved-metal region
in between two large niobium carbide precipitates. Regions G, H, I, J and K
represents the austenite-γ metal of the heat treated samples with 50.3±0.6 at% Fe,
20.9±0.6 at% Cr and 22.1±0.2 at% Ni that are closely comparable to those measured
in the as-manufactured samples (Figure 48).
Comparing the FIB sections of as-received AGR fuel cladding (2 samples
shown in Figure 47) and those heated 500°C 192h (2 samples shown in Figure 50
and 51), we can say that heat treatment causes the NbC precipitates to grow
considerably in size; across the FIB sections which have consistent dimension, the
former contains NbC precipitates of ~0.5 µm dia. whereas the latter ~5um dia. (an
order magnitude growth), even becoming comparable to the austenite-γ grains
adjacent to them. In section 4.2, we proposed that, because the NbC precipitates
remains well maintained even though extensive corrosion has occurred around them,
NbC acts as a cathode in the participating galvanic corrosion processes; the current
observations (and further substantiated later in the section) we propose that the NbC
precipitate size is an issue which may enhance this corrosion effect. In addition,
Figures 50b and 51a shows FIB sections with high dislocation densities (thus high
stress fields), potentially as a result of the particle size growth, which may be another
contributing factor to the corrosion processes. FIB cross-sections shows subsurface
corrosion propagation occurs along the periphery of the NbC precipitates, either as
a fully oxidised metal manifesting as voids (Figure 50d) or alloy of decreased
concentration from its nominal austenite-γ metal (coined dissolved-metal regions),
on the order of 20.2%, 20.5% and 17.3% depletion in Fe, Cr and Ni respectively.

114
Figure 50 – FIB cross-section analyses with a scanning probe of the 500°C 192h post-polarised working electrode
5m
a) post-
polarised
electrode
surface with
lacy cover
b) FIB cross-
section
indicating
high
dislocation
densities*
d) location of
scanning probe
indicated by
the dashed-line
c) scanning
probe
analyses
L = NbC
M=NbC
N O A
Platinum
Platinum
B
C
D
E
F
M B C C L
voids
L = NbC
M=NbC
*
* *
X

115
Figure 51 – FIB cross-section of high dislocation densities and scanning probe
analyses of the 500°C 192h heated post-polarised working electrode
X•
Y•
Z•
Depleted-
metal
G H
J
K
I
X
Y
Z
a)
b)
1m
High dislocation
densities*
*
*
*
*
*

116
Figure 52 – X-ray analyses of the FIB cross-section from the 500°C 192h AGR fuel cladding
Ato
mic
pe
rce
nt

117
Figures 53 to 57 show two FIB cross-sections and their analyses from the
600°C 192h post-polarised electrodes. Figure 53a shows a corroding site adjacent to
an inclusion whose FIB cross-section was obtained (Figure 53b). Figure 54 shows
the chemical composition results from areas labelled from the same region A to E.
Metal dissolution is shown to occur around a 2 µm wide aluminium-rich precipitate
(A) of about 86.1 at% Al. The austenite grains (labelled B to E), however, were
composed of 47.4±1.4 at% Fe, 19.9±0.5 at% Ni and 21.9±0.3 at% Cr respectively.
Compared to as-received samples, which contained 50.3±1.7 at% Fe, 21.0±1.1 at%
Cr and 22.0±0.4 %at Ni, this particular heat treatment causes a small but significant
change from the cladding‟s nominal austenite-γ composition, i.e., a 5.6% and 5.2%
Figure 53 – FIB cross-section of the 600°C 192h heated post-polarised
working electrode. Note that the rough surface in Figure 53a is just an
artefact due to over-rastering with ion beams whilst focussing the sample
for FIB section preparation.
5m
2m
a) metal
dissolution
around
inclusion
b) FIB cross-
section

118
decrease in austenite Fe and Cr respectively. This decrease in alloy Fe and Cr may
indicate increased activity of the niobium in the microstructure, i.e., more alloy were
precipitated by the niobium atoms as secondary phases that are large in size.
Figure 54 – X-ray analyses of FIB cross-section from 600°C 192h AGR fuel
cladding
1m
A E
B
C
D
Subsurface corrosion
of fully oxidised metal

119
The FIB cross-section shown in Figure 55 indicates a „bright‟ region of about
10% the area of the section in which the metal is apparently „disintegrating‟. Figure
58a labels alphabetically the detailed chemical composition measurement within this
region in order to characterise the internal structure of the „disintegrating‟ metal. The
varied contrast parts of this region are indicative of the presence of different phases;
the brightest contrast is at void arising from anodic dissolution of the metal.
Chemical analyses (Figure 56b) reveal four different phases:
I. sites E, I, J, L and A are aluminium-rich silicon phases (AlSi) with average
concentrations 74.0±4.1 at% Al and 12.9±1.8 at% Si;
II. sites F, K, and B are zirconium-rich aluminium phases (ZrAl) with average
concentrations 56.8±10.3 at% Zr and 26.3±9.8 at% Al;
III. sites H and G are manganese-sulphide phase (MnS) of concentrations 42.1±0.5
at% Mn and 35.6±0.3 at% S; and
Figure 55 – FIB cross-section of the 600°C 192h heated post-polarised
working electrode
1m
Subsurface
corrosion site
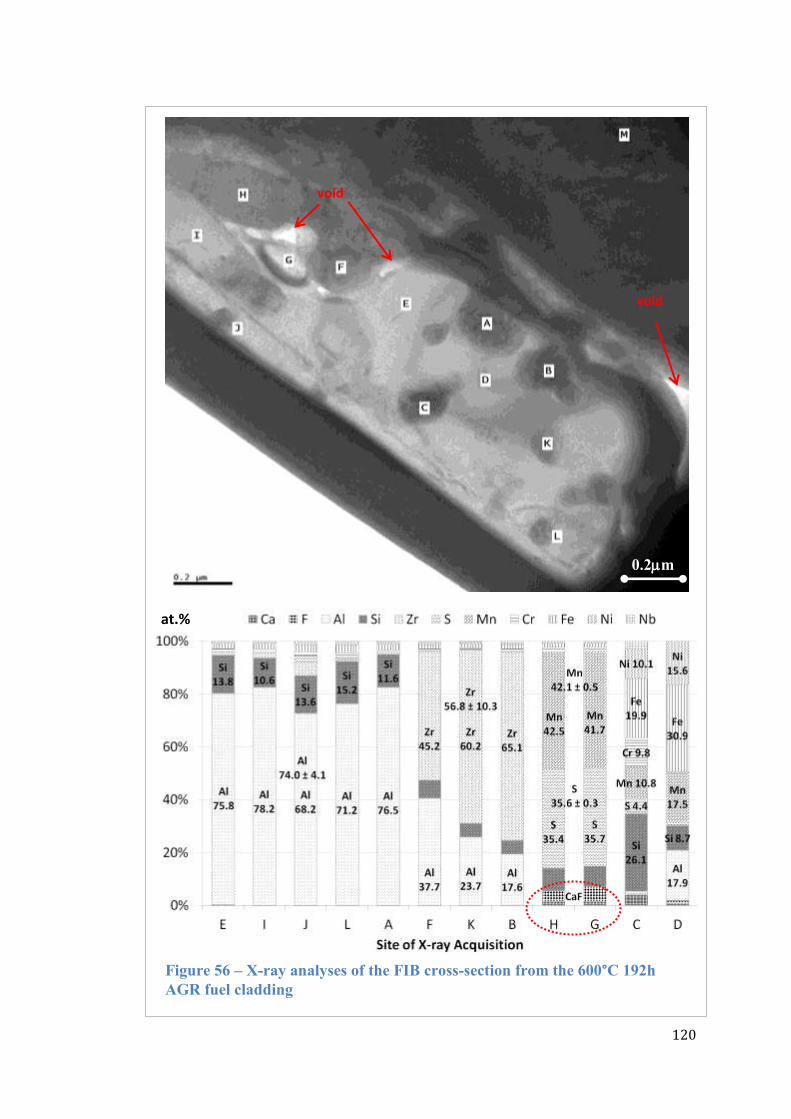
120
Figure 56 – X-ray analyses of the FIB cross-section from the 600°C 192h
AGR fuel cladding
0.2m
void
s
void
s
at.%

121
IV. sites C and D which are dissolved-metal phase, as previously discussed, of
25.4±7.8 at% Fe (49.5% decrease from nominal austenite-γ) and 12.8±3.9 at%
Ni (42.1% decrease from nominal austenite-γ). Note that Site C is silicon-rich
with 26.1 at% Si and Site D is aluminium-rich with 17.9 at% Al but zero
chromium, rendering the metal non-stainless.
Sites H and G (the MnS-phase) beside the voids revealed elevated levels of
calcium and fluorine, even though the co-located site F (the ZrAl-phase) was not
calcium- or fluorine-containing. The occurrence of calcium is confirmed by EDS
(Figure 57) which shows distinct peaks for calcium (as well as Mn and S) indicative
of its presence, supporting the role of MnS in localised corrosion processes as
demonstrated by Ryan et al. [13].
Other sites of corrosion interest include the periphery of sites A, B, C, D and K
which have different chemical compositions, including the zero- chromium, non-
stainless zone (site D). These observations may indicate the different corrosion rates
of the alloy or micro-segregation.
Figure 57 – X-ray spectra indicating counts of elements from the 600°C
192h AGR fuel cladding
122
Figure 58 shows the pitted surface, FIB cross-section and a TEM image with
labels of the 800°C 192h electrode. Figure 58a shows the electrode‟s surface which
contains a small pit ~2µm wide. A FIB cross-section was obtained from around this
region to characterise the subsurface corrosion morphology. Figure 58b shows a
successfully-prepared FIB cross-section which indicates a large ~2µm wide
subsurface corrosion cavity beneath the metal. Figure 58c is the corresponding
bright-field TEM image. Labelled alphabetically A to F are the locations of electron
probes used for chemical composition analysis, results shown in Figure 59a. A and B
were both niobium-rich particles having average concentrations of 83.7±1.1% Nb.
All other regions analysed were austenite grains of composition iron, chromium and
nickel of concentration 47.7±1.1, 19.7±0.4 and 20.9±0.3 at% respectively. In
addition a line-scan of ~3.5 µm long was performed parallel to E, A, B and C
indicated by the dotted-line, results shown in Figure 59b. The scan profile shows in
sequence: nominal austenite-γ; weakened metal; niobium-rich precipitate (A);
weakened metal; niobium-rich precipitate (B); weakened metal; and nominal
austenite-γ. This observation reaffirms the detrimental effect of the niobium-rich
particle which appears to be one of the drivers for corrosion initiation.
As a summary, this section has compared the subsurface corrosion
morphologies of the post-polarised electrodes which include the as-received cladding
specimens, the 600°C 192h, 800°C 192h, and 500°C 192h heat-treated specimens
that register E5.0 electrode potential values of 1.15V, 0.65V, 0.45V and 0.34V
respectively (Section 4.1). The two most important microstructural features that
affect corrosion behaviour are NbC size and presence of dislocations in the
austenitic-γ matrix. Compared to the heat-treated samples, the as-received specimens
have small NbC precipitates ~0.1µm and there were numerous counts of these
precipitates, ~20 within a 10 by 4 µm analysable area within a FIB-section, that are
homogeneously distributed (Figure 47). Upon heat treatment, it was observed NbC
precipitates between ~1.5 and 5µm in size, significantly larger than those observed
in the as-received specimens. In addition, there were increased dislocation densities
in the surrounding austenite-γ matrix (Figures 50 and 51). Whilst the surface
corrosion morphologies characterisation discussed in Section 4.2 suggest that the
NbC precipitate may act as cathode in the participating galvanic corrosion processes,
the subsurface corrosion morphologies characterisation with FIB-sections herein

123
suggest that corrosion is initiated around the periphery of these phases indicated by
the metal depleted regions which have alloying elements concentration substantially
decreased from its nominal austenite-γ composition (50.3±1.7 at% Fe, 21.0±1.1 at%
Cr, 21.0±0.4 wt% Ni), at varying degrees up to zero-percent chromium which
renders the steel non-stainless. This effect is also shown in between individual NbC
precipitates and austenite-γ matrix and between two collocated NbC precipitates
(Figures 50b, 51a and 58c). In most cases (7 out of 8 FIB sections prepared), the
observed metal dissolution occurs around NbC precipitates because they are the
primary strengthening particles for the AGR fuel cladding (reviewed in section 2.2).
However, it has also been observed that metal dissolution may also occur around the
non-primary secondary phases including MnS, AlSi, ZrAl as shown in Figures 54
and 56, not a critical corrosion issue because of their low distribution in the AGR
fuel cladding matrix.

124
Figure 58 – FIB cross-section of the 800°C 192h heated post-polarised
working electrode
a) post-polarised electrode surface
with a 2 µm wide pit
b) FIB-cross section from a)
c) Bright-field TEM
image
5m
0.5m
5m
corrosion

125
Figure 59 – X-ray analyses of the FIB cross-section from the 800°C 192-
hour AGR fuel cladding
a) fixed-spot X-ray analyses
b) scanning-probe analyses
E
A
B
C
at.%

126
4.4 Microstructures of Heat-Treated Samples
Several etchant candidates were compared for their ability to reveal the
electrode‟s microstructure for SEM examination. Figure 60 compares the as-received
AGR fuel cladding electrode to those that have been swabbed in Kallings solution
for 20s, Marbles solution for 20s and electrolytically-etched with saturated oxalic
acid solution for 10s on a 6V potential. The electrolytic-etch (Figure 60d) most
30m
Figure 60 – SEM images of as-received AGR fuel cladding microstructures
from several etchants
a) Post-polarised electrode b) Kalling‟s, swabbed 20s
b) Marbles, swabbed 20s
30m 30m
30m
d) Oxalic acid, electrolytic-etching

127
clearly revealed the microstructural feature including the austenitic grains, twins,
grain boundaries and dispersion of secondary phases indicated by the bright atomic
contrasts. SEM images obtained from the other swab-based etchants generally
produce lower contrast micrographs with increased numbers of etch-pits, even
though etching with the Marble‟s reagent for 20s produced images that are similar to
the electrolytically-etched samples. Etching by Kalling‟s reagent produced an
increase in number and size of etch-pits, low image quality and is an ineffective
etchant for the AGR cladding material. Given the satisfactory micrographs from
electrolytically-etched samples, these techniques were used throughout the thesis and
further systematic investigation of the dependence of etchant and etching time for
image optimisation was not pursued.
Figures 61 to 64 show low magnification microstructures and counts of bright
contrast indicative of secondary phases from the as-received, 600°C 192h, 800°C
192h and 500°C 192h electrolytically-etched electrodes that are associated with E5.0
values (section 4.1) of 1.15V, 0.65V, 0.45V and 0.34V respectively. To enable
comparison among samples, all the micrographs were recorded under consistent
SEM condition of 20kV accelerating voltage and 13 mm working distance. Over an
area of 0.05 cm2, 3115±296 precipitates were observed in the as-received cladding
(Figure 61), 1729±146 in the 500°C 192h samples (Figure 62), 2264±44 in the
600°C 192h samples (Figure 63) and 1580±105 in the 800°C 192h samples (Figure
64); the maximum precipitate diameter within the microstructures were ~2, 20, 5 and
20 µm respectively. Figure 65 is a summary of the variation in number of
precipitates and maximum precipitate diameter with E5.0 (current when potentio-
dynamic scan reach 5.0 mA/cm2).
The microstructure of the as-received samples is characterised by the
homogenous dispersion of fine ~0.1 µm precipitates (the largest being ~2µm) and
relatively high precipitate counts of ~3115±296 (/0.05cm2). The observed austenitic
grains ~25 μm dia. agree with those reported by Waddington and Jones [20]; they
have composition of 50.3±1.7 at% Fe, 21.0±1.1 at% Cr, 21.0±0.4 wt% Ni as
established from EDS analyses on the FIB sections (Figure 48). Such are the general
microstructural features that correspond to the least corroding samples which has an
average E5.0 of 1.15V. On the contrary, for the samples that were heat-treated at
critical temperatures (500°C and 800°C, Figure 34) and heating times (192h, Figure
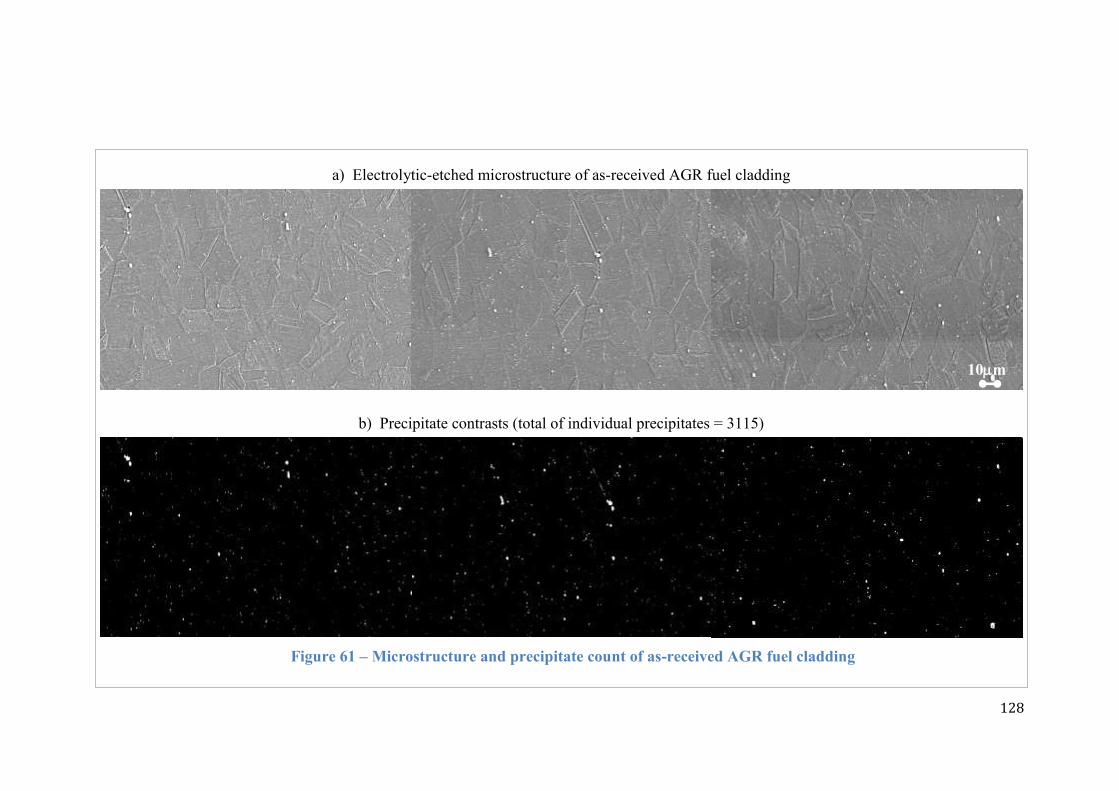
128
Figure 61 – Microstructure and precipitate count of as-received AGR fuel cladding
a) Electrolytic-etched microstructure of as-received AGR fuel cladding
b) Precipitate contrasts (total of individual precipitates = 3115)
10m

129
Figure 62 – Microstructure and precipitate count of 500°C 192h heated sample
a) Electrolytic-etched microstructure of 500°C 192h specimens
b) Precipitate contrasts (total of individual precipitates = 1789)
10m

130
Figure 63 – Microstructure and precipitate count of 600°C 192h heated sample
a) Electrolytic-etched microstructure of 600°C 192h specimens
b) Precipitate contrasts (total of individual precipitates = 2264)
10m
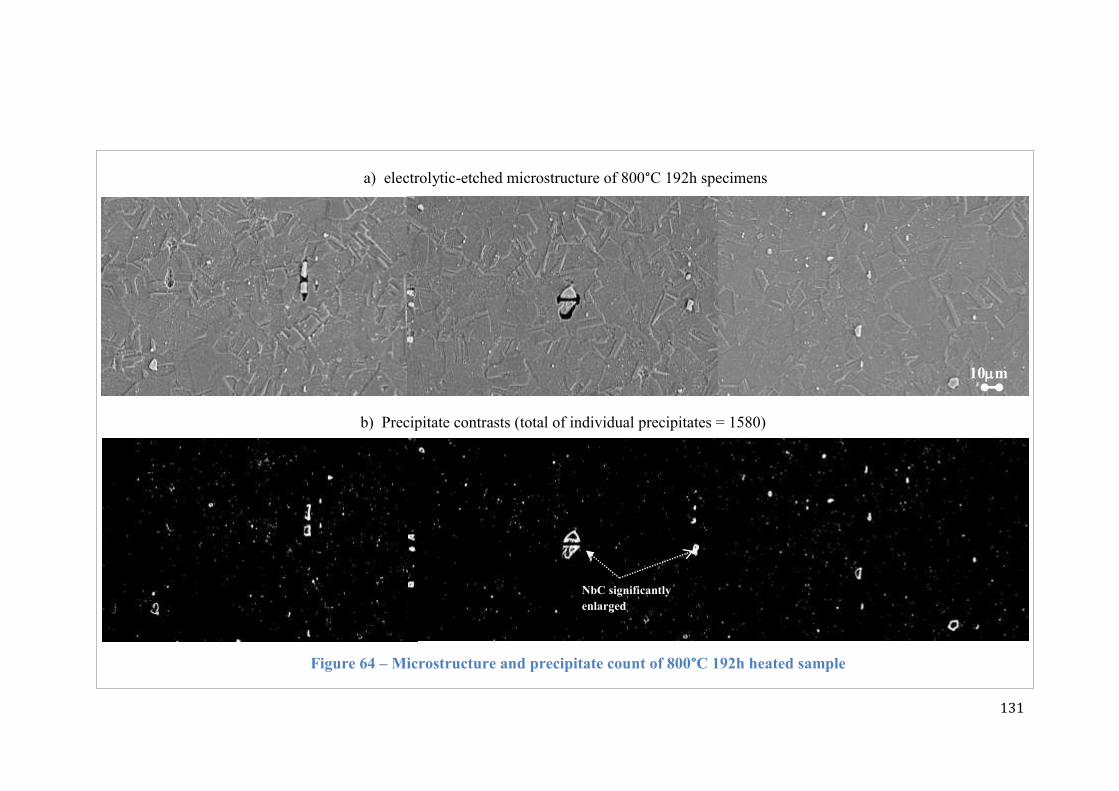
131
Figure 64 – Microstructure and precipitate count of 800°C 192h heated sample
a) electrolytic-etched microstructure of 800°C 192h specimens
10m
b) Precipitate contrasts (total of individual precipitates = 1580)
NbC significantly
enlarged

132
35) that produces E5.0 of 0.45V and below (~800mV difference from the as-received
samples), their precipitate size were generally larger with maximum diameter ~20
µm and precipitate count lower <1789±146 (/0.05cm2). The increase in sample‟s
corrosion susceptibility with size is consistent with the results of Bohni et al. [15]
whose work on MnS similarly suggests that a critical precipitate size is necessary for
initiation of corrosion chemistry (Figure 22b). Note that in the case where the
samples were not heated at the critical temperatures, i.e. the 600°C 192h specimens
which measured intermediate E5.0 of 0.65V, the precipitate counts are on average
Figure 65 – Variation in number of precipitates and maximum precipitate
diameter with E5.0
Corrosion susceptibility

133
2264±44 (/0.05cm2) whereas the precipitate size were ~5 µm, values that falls
between the as-received cladding and the 500°C 192h and 800°C 192h samples.
Figures 61 to 64 also shows that the austenite-γ grain sizes in the matrix are
smaller, ~15 µm or less, when heated at the critical temperature and time compared
to the ~25 µm austenite grains in the as-received cladding. Note that the FIB-
sections of the as-received AGR fuel cladding (Figure 47) show austenite grains of at
least 3 by 3 µm or larger (full elucidation limited by FIB-section size) whereas those
heat-treated, for example the 600°C 192h sample (Figure 54), have smaller grains as
small as 1.0 by 0.5 µm. Since smaller grain sizes within the bulk metal increase grain
boundary availability, and together with the observations that NbC grows with heat-
treatment, it can be suggested that heat treatment may increase the probability of
NbC contact with austenite-γ grain boundaries, schematically illustrated in Figure 66.
As a summary, this section shows the varied microstructural distribution
between the as-received AGR fuel cladding and those due to heat treatment that are
important to substantiate the findings established from FIB-sections analyses in
section 4.3 of the bulk metal. Whilst the FIB-sections have enabled precise
quantification of chemical composition in the NbC precipitates, the austenite-γ
matrix and their interfaces and high resolution imaging on the internal structure of
corrosion, each of them, however, only represent a very small region (~4 µm
subsurface thickness by 10 µm wide) within the bulk metal. It is not practical to
produce enough FIB-sections and to statistically analyse the microstructural
Figure 66 – Illustration of increased probability of NbC grain boundary
contact with the austenite matrix (γ) with heat treatment
Austenite-γ Smaller
austenite-γ
enlarged
NbC
NbC
NbC NbC
NbC
As-received Heat-treated
Smaller
austenite-γ
Smaller
austenite-γ Smaller
austenite-γ

134
distribution of key phases in the bulk metal. Therefore, the development of etchant
and subsequent image analysis has been a reliable approach to compare the
microstructures across a wider area within a sample. Indeed, the observation that it is
the large NbC precipitates between 5 to 20 µm causing corrosion susceptibility
agrees very well with those previously obtained from the FIB-sections‟ analyses
(section 4.3). The relationship between E5.0 with both the precipitate count and
precipitate size shown in Figure 65 indicates that they are the two most important
microstructural distribution features that are correlated to a high-corrosion AGR
cladding. These observations also agree well with the results of Bohni et al. [15]
who suggest that the role of MnS precipitates in stainless steel 316L corrosion
initiation are profound above a critical precipitate size of 1.0 µm dia. (Figure 22). In
the case of AGR cladding the E5.0 values indicative of corrosion susceptibility are
profound above a precipitate diameter of 1.0 µm and in microstructures that have
lower precipitate counts as a result of their growth into larger particles.

135
5.0 Summary – Importance of Microstructure to AGR Fuel Cladding
Corrosion
Successful corrosion control of spent AGR fuel during interim storage at
Sellafield has traditionally employed a corrosion inhibitor, specifically caustic soda
(NaOH) at pH 11.4, to prevent fuel cladding corrosion in the AGR Storage Pond in
which the spent fuels are immersed. In THORP‟s Receipt and Storage Pond,
however, corrosion inhibitors cannot be employed due to a mix of cladding and
container metals from both the AGRs and LWRs (Chapter 1). Although acceptable
corrosion control has been achieved by the current demineralised-water storage at
pH 7, the need to store them for a further 80 years under NDA‟s strategic plan
requires a demonstration of the fuel cladding integrity against corrosion and release
of FPs. Furthermore, there have been concerns that environmental constituents (e.g.
sea salt) accidentally introduced into the pool may accelerate corrosion. The focus of
the investigation reported in this thesis is understanding of the physical
microstructural aspects that underpin AGR fuel cladding corrosion. The findings
may contribute to the scientific basis that informs long-term control, monitoring
practice and storage decisions over the AGR fuel cladding lifetime.
Although many studies have clarified metal corrosion processes, both
theoretically and experimentally, including the classic studies of Galvele, Laycock,
Newman, Pickering and Frankel (Section 2.5), there has to date been no explanation
that fully describes the phenomena in AGR fuel cladding. This is because corrosion
processes specific to the AGRs involve concurrently a number of microstructural
factors, e.g. radiation damage, sensitisation, passive film oxidation and stress, that
involve radionuclides and occur at the nanometre scale so making elucidation
difficult. In this thesis, AGR fuel cladding samples sourced from Sellafield Ltd, cut
and individually heat treated at temperatures from 400 to 800°C for 24 to 192h were
characterised both in terms of their corrosion behaviour and of microstructure. Since
the principal goal was to contrast microstructural features attributable to corrosion
susceptibility, the characterisation techniques employed were corrosion
measurements using the anodic polarisation method and microscopy techniques
using the SEM, FIB, TEM and EDS analyses (Chapter 3) which revealed the

136
geometry, distribution and composition of grains, secondary phases and grain
boundaries that have evolved.
Corrosion behaviour measurements using the anodic polarisation method are
commonly made to measure a metal‟s corrosion performance. The cut samples were
formed as electrodes and an electrode potential applied from zero to 1.6V (limit of
oxygen evolution) in reference to the Ag|AgCl electrode potential (the potential that
our measurements are referenced against). Figure 31 in Section 4.1 summarises the
electrode potential when dissolution current density reaches 5.0 mA.cm-2
, E5.0. With
E5.0, the relative corrosion susceptibility of the samples was compared, both across
the heat treatment temperatures and times and in electrolyte concentrations of
0.001M and 0.1M. The E5.0 values were 1.47±0.27V in the 0.001M electrolyte-NaCl
and 0.66±0.14V in the 0.1M electrolyte-NaCl – about 800mV difference per two
decades of chloride concentrations. As expected, a high chloride concentration
adversely impacts AGR fuel cladding corrosion and this result confirms that chloride
levels should be kept to a minimum in the Receipt and Storage Ponds. The E5.0
measurements further revealed that samples from heating temperatures of 500°C and
800°C (Figure 34) and a heating time of 192h (Figure 35) exhibit the highest
corrosion rates, consistently observed in both electrolyte concentrations. Specifically,
the 500°C 192h (E5.0 = 0.34V) and 800°C 192h (E5.0 = 0.45V) samples were
compared with the 600°C 192h (E5.0 = 0.65V) and as-received samples (E5.0 = 1.15V)
to elucidate the critical microstructural features that impact on its corrosion
behaviour. Note that the lower E5.0 value indicates the more corroded samples since
that applied potential is already enough to drive a dissolution current to 5.0 mA.cm-2
.
Figure 67 summarises the main findings that are important considerations in
developing a safety case for the fuel cladding integrity during wet storage. By
employing various microscopy techniques on the post-polarised electrodes to
examine the corrosion morphologies and its internal structures, corroborative
evidence has been obtained that niobium carbide (NbC) second phases are a critical
element that underpins AGR cladding aqueous corrosion behaviour, and are involved
in most of the pitting and crevice morphologies encountered. Paradoxically, NbC is
the principal precipitation strengthening particle in the AGR fuel cladding added in
the austenite-γ metal up to 0.7 %wt (Table 1). Analogous to the results of Bohni et al.

137
[15], Ryan et al. [13] and Williams et al. [14] on the role of MnS inclusion in
stainless steel 316 corrosion and Buchheit et al. [94] and Suter and Alkine [95] who
described corrosion around Al2CuMg (S-phase) in aluminium alloy, the roles of NbC
in AGR fuel cladding corrosion are clarified by the following observations:
I. The pitting corrosion morphologies, if not occurring as open hemispherical
cavities that are freely exposed to the bulk environment, occur
predominantly around NbC. SEM examination shows extensive corrosion
around NbC precipitates even though they themselves remain well-
maintained and geometrically-intact (e.g., in Figure 40). This observation
suggests that a localised galvanic couple may have formed where the NbC
precipitate may act as a cathode in the participating galvanic dissolution
processes and the adjacent austenite-γ metal is the anode that undergoes
preferential oxidation. FIB-sections (Figures 50, 53, 54, 56 and 58) show
austenite-γ metal dissolution where proportionally large (~2 by 5 µm)
subsurface cavities and ~0.1 µm dia. voids were formed between NbC and
bulk austenite-γ indicative of dissolution processes occurring or that have
occurred.
II. The pitting corrosion morphologies that occur around the NbC precipitates
exhibit four important dissolution characteristics indicated by examining
localised pits in detail:
i) Lacy Corrosion Cover
SEM examination shows bulk austenite-γ dissolution in the form of
lacy corrosion covers around NbC precipitates. Figure 39a shows two
lacy corrosion covers ~10 to 20 µm dia. that evolve around the NbC
precipitates and extend beneath the surface plane. Cross-section
examination shows that the covers have width-depth ratio between 1.6
to 2.6, although their actual size varies locally depending on the site.
Note that the lacy corrosion covers previously described by Ernst et al.
[66, 76] for thin stainless steel foils and Laycock et al. [54] for bulk
metals were not associated by them with any secondary phases as
have been demonstrated in this investigation.

138
ii) Dissolved Metal Regions along NbC Peripheries
Chemical analyses (EDS) on FIB-sections show that the interface
between NbC precipitates and bulk austenite-γ contains a thin
envelope (~ 1 µm thickness) of dissolved-metal regions along the
NbC peripheries. Specifically, the dissolved-metal region is
characterised by substantially decreased alloying element
concentration compared to its nominal austenite-γ composition
(50.3±1.7 at% Fe, 21.0±1.1 at% Cr and 21.0±0.4 at% Ni). On average,
the dissolved-metal region exhibits 20%, 21% and 17% reduction in
Fe, Ni and Cr, respectively. In certain sites, for example Site D in
Figure 56, the metal-dissolved regions contain no chromium,
rendering the localised region in question non-stainless and
susceptible to the slightest driving force for corrosion initiation.
Alterations to the bulk austenite-γ in the presence of NbC precipitates,
albeit at selected sites, show that there exists a preferential and
accelerated attack on the austenite-γ (anode) member within a
localised galvanic couple.
iii) Diffusion-Controlled Mechanisms of Austenite-γ Dissolution
The corrosion morphologies exhibit a smooth concaved pit bottom,
both as open hemispherical cavities that are freely exposed to the bulk
environment (e.g. Figure 39c) or as shielded cavities beneath a lacy
corrosion cover (e.g. Figure 42 and Figure 43). The smooth pit
bottoms indicate that diffusion-controlled mechanisms were involved
in the austenite-γ dissolution processes, potentially similar to the pit-
acidification theory suggested by Galvele [61]. As he pointed out, at
its start metal dissolution may occur at the bottom of the pit which is
followed by a self-sustaining pit-acidification mechanism that enables
the pit to grow until a steady state condition is reached.
iv) Enhanced Austenite-γ Dissolution in Microstructures with High
Dislocation Densities
FIB-sections revealed samples that exhibit comparatively high
corrosion susceptibility – e.g., the 500°C 192h (E5.0 = 0.34V) and

139
800°C 192h (E5.0 = 0.45V) electrodes – show high dislocation
densities in their austenite-γ metal matrix. The presence of
dislocations, thus high-stressed regions in the microstructure, is also
accompanied by large ~5 µm dia. NbC precipitates (e.g. Figures 50b
and 51a). In the samples that are relatively corrosion noble – e.g. the
600°C 192h (E5.0 = 0.65V) and as-received (E5.0 = 1.15V) electrodes –
the NbC precipitates sizes are small (~0.1 µm dia.) and ~10 of them
are homogeneously distributed within an observable FIB-section area
of typically 10 µm wide by 4 µm deep from the surface (e.g. Figure
47). These contrasting features show the growth of fine NbC
precipitates into larger inclusions due to heat treatment during which
dislocation densities also increase. The growth of NbC precipitates
above a certain critical size, parallel to the suggestion by Bohni et al.
[15] and along with subsequent increased stress generation, may be
responsible for the adverse impact on cladding corrosion.
Whilst FIB-sections have enabled precise quantification of chemical
composition of the NbC precipitates, the austenite-γ grains and the dissolved-metal
interfaces, as well as high resolution imaging of the internal structure of corrosion,
only a small area (~4 µm subsurface thickness by 10 µm wide) is examined within
the bulk metal. Since it is impractical to examine enough FIB-sections to get
statistically significant understanding of bulk material the electrodes were etched in
oxalic acid solution to reveal the bulk-scale microstructures that are critical to
corrosion. Specifically, the highly corroded 500°C 192h (E5.0 = 0.34V) and 800°C
192h (E5.0 = 0.45V) samples show behaviour attributed to their large ~20 µm dia.
NbC precipitates and small ~15 µm dia. austenite-γ grains. The 600°C 192h (E5.0 =
0.65V) and as-received (E5.0 = 1.15V) electrodes, the relatively corrosion-noble ones
that give corrosion stability to the AGR cladding, contained fine ~0.1 µm NbC
precipitates that are homogeneously distributed with large ~25 µm austenite-γ grains.
These observations suggest that corrosion susceptibility is proportional to both the
increase in NbC precipitate size and decrease in austenite- γ grain size.

140
Increased dislocation
density in austenite-γ
impacts corrosion
Effect of radiation
damage on grain
boundary corrosion
(future work)
Austenite-γ
Effect of critical distance,
dc, between precipitate
(future work)
dc
Large NbC
precipitates above
~5 µm critical to
corrosion
NbC
Thin envelope (~1µm) of
depleted-metal regions
around NbC precipitates
important in corrosion
mechanisms
Figure 67 – Illustration of AGR fuel cladding microstructures that underpin
its corrosion behaviour

141
6.0 Conclusions and Recommendations for Further Study
The focus of the investigation reported in this thesis is the impact of
microstructure and secondary phase formation on Advanced Gas-Cooled Reactor
(AGR) fuel cladding corrosion in chloride aqueous solutions, amongst other known
corrosion factors which include radiation-induced segregation and thermal
sensitisation. An understanding of the AGR fuel cladding microstructure that may
underpin its corrosion behaviour has been established. There are several important
considerations in developing a safety case for the fuel cladding integrity during long-
term storage. Primarily, NbC precipitates are strongly correlated to corrosion
susceptibility in wet storage, encountered in most pitting corrosion morphologies.
Even though NbC is the principle precipitation strengthening particle in the
austenitic 20Cr/25Ni/Nb fuel cladding providing improved resistance to irradiation
creep and fuel swelling during reactor operation, corrosion morphologies were
mostly present around NbC precipitates. Both SEM and FIB-section examination
show that the bulk austenite-γ metal around NbC precipitates exhibits extensive
corrosion. The principal mechanism through which the NbC acts is potentially as the
cathode of a localised galvanic couple where the surrounding austenite-γ matrix is
the sacrificial anode preferentially dissolved. This dissolution process is likely to
involve a diffusion-controlled process, potentially a pit-acidification step since the
bottoms of the pits are often smooth as observed under the lacy corrosion covers and
subsurface features in FIB-sections. Dissolution is more profound in samples that i)
were tested in high chloride concentrations, ii) contain NbC precipitates greater than
~5 µm dia., iii) exhibit high dislocation densities in their microstructure and iv) have
small austenite-γ grain sizes (~15 µm dia.). Accounting for all potential possibilities
of AGR spent fuel safe store, both wet and dry, these results suggest that aqueous
contact with chloride must be avoided when possible and development of corrosion
inhibitors should be focussed on NbC precipitate mechanisms.
Not all aspects of the AGR fuel cladding microstructure have been covered to
provide a complete the description of its corrosion phenomenology. The principle
challenge lies in the difficulties to procure, process and examine radioactive
materials. Nonetheless, continuing on the successful demonstration of a combined
corrosion measurements and creative microscopy techniques, there are five further
study areas that should be pursued to add to the current knowledge base:

142
I. Heavy-Water Studies for Pitting Corrosion Mechanisms
Whilst FIB-sections obtained from carefully selected lacy corrosion cover
and active corrosion sites have successfully revealed the internal structure
of corrosion processes, one of the first employed in studying active
corrosion sites, further characterisation of cladding corrosion mechanisms
could be performed using heavy water (D2O) as a tracer-electrolyte with a
broader range of corrosion inhibitor solution which includes sulphate (SO42-
), thiosulphate (S2O32-
) and nitrate (NO32-
). Its electrochemical behaviour is
the same as that of normal water (H2O) but its location in the subsurface
corrosion cavities and pit can be distinguished, leading to information that
relates to the nature of the galvanic interaction between the NbC precipitate
and bulk austenite-γ metal and pit-acidification condition in corrosion
processes. In addition, residual electrolytes from the post-anodic
polarisation experiments could be analysed for the concentrations of
dissolved ion, e.g. iron, chromium, and nickel using Inductively-Coupled
Plasma Mass Spectrometry (ICP-MS).
II. Effect of Grain Boundary Chromium Depletion on Corrosion
One of the limitations to providing an overall and encompassing
microstructure perspective to AGR fuel cladding corrosion has been that the
current facility has not been equipped to examine the corrosion of cladding
that has been processed in a reactor. Whilst this study has adopted simulated
conditions by thermal-aging to investigate the impact of a variety of
secondary phase formation, the in-situ grain boundary chromium depletion
condition due to neutron-irradiation as pointed out by Norris et al. [18, 19]
needs to be understood for a complete understanding of corrosion behaviour.
The next steps should focus on mimicking materials of varying grain
boundary-damaged microstructures at proton- or neutron- irradiation
facilities to be tested for its corrosion impact. Such samples can be
characterised with the experimental capabilities that have been developed
and demonstrated in this thesis. In addition, localised corrosion
measurements could be performed using microcapillaries as electrochemical
cells (e.g., developed by Suter et al. [95]), sensitive down to pA and fA
current measurements and involve only a small ~1.0 µm dia. exposed

143
surface area (as opposed to cm2 exposed area in this study), to investigate
growth and evolution of NbC corrosion mechanisms.
III. In-situ Corrosion Monitoring Methods
The corrosion measurement technique that has been employed in this study
is the anodic polarisation method – an accelerated measure of the metal‟s
corrosion performance under deliberately applied electrode potentials.
Whilst electrode potential measurements have successfully compared in
relative terms the corrosion performance of the heat-treated specimens, the
AGR spent fuels in the ponds are, however, subjected to a „true‟ corroding-
potential or the open circuit potential (OCP). One important work is to
develop a correlation between the laboratory-measured electrode potentials
to its actual environmental performance (e.g. its OCP) since the spent fuels
will undergo a foreseeable storage time before either the resumed
reprocessing schedules or disposal in a geological repository can be
undertaken.
IV. Role of Salt Films
That the presence of chloride accelerates corrosion processes is well-known.
Further to the chloride-induced diffusion theories developed (e.g., Galvele
[61]) and corrosion initiation mechanisms proposed (e.g., Ernst et al. [55])
to clarify metal dissolution processes, one of the issues that can be
investigated is the mechanical and electrochemical effect of salt
crystallisation in pit formation. In observing the formation of salt crystals in
post-polarised electrodes that are deliberately un-rinsed (e.g., Figure 46), it
is likely that salt crystallisation effects, including stresses imparted on the
metal surface and modification of the surface tension by the salt deposits,
may be important in the initial steps of corrosion processes. Further
experimentation with instrumentation that can provide metal density data or
surface sensitive measurements (e.g., skin current or surface acoustic waves)
should be useful in elucidating the evolution of metal corrosion under the
salt films.

144
V. Role of Stress in Corrosion
Corrosion susceptible specimens contained grown, large NbC precipitates
(~5 µm) that have increased dislocation densities in their adjacent austenite-
γ microstructures. It possible that there is a thermal expansion mismatch
between the NbC and austenite-γ metal during the heat treatment, causing
the increased dislocation densities. One important aspect to investigate is
the extent to which stress in the AGR metal impacts corrosion. Potential
experiments that can be conducted would involve annealing out the
dislocations and repeat the corrosion measurements.

145
7.0 References
1. Seinfeld, J.H. and S.N. Pandis, Atmospheric Chemistry and Physics: From
Air Pollution to Climate Change. 2nd ed. 2006, Hoboken, NJ , Chichester:
Wiley, John Wiley. 1203.
2. Standring, P.N. The Long Term Storage of Advanced Gas-Cooled Reactor
(AGR) Fuel. in Storage of Spent Fuel from Power Reactors. 1999. Vienna,
Austria: International Atomic Energy Agency (IAEA).
3. Hands, B.J., Investigation of the Viability of Demineralised Water as a Long
Term Storage Medium for AGR Fuel, BNFL Commercial Reports, 2005,
Copyright © British Nuclear Fuels Plc.
4. Herbert, D., G.O.H. Whillock, and S.E. Worthington, Zero Resistance
Ammetry - Its Application in Preventing the Corrosion of Stainless Steel in
Cooling Waters. Materials Science Forum, 1995. 192-194: p. 469-476.
5. Hands, B.J., Alternative Corrosion Inhibitors for Long Term AGR Fuel
Storage, BNFL Commercial Reports, 2005, Copyright © British Nuclear
Fuels Plc.
6. Hands, B.J., A New IGA Sensor Design as an Alternative to Active Brace
Tests, BNFL Commercial Reports, 2005, Copyright © British Nuclear Fuels
Plc.
7. Glasgow, B. B., Siahmed, A., Wolfer, W. G. and Garner, F. A., Helium
Bubble Formation and Swelling in Metals. Journal of Nuclear Materials,
1982. 103(1-3): p. 981-986.
8. Newman, R.C., Newman, R. C., Wong, W. P., Ezuber, H. and, Garner, A.,
Pitting of Stainless Steels by Thiosulfate Ions. Corrosion, 1989. 45(4): p. 282-
287.
9. ATI Allegheny Ludlum Brochure, Technical Data Blue Sheet: ATI 20-
25+Nb Alloy, 2009, Allegheny Technologies Incorporated.
10. Westinghouse Electric Company Brochure, Nuclear Fuel Manufacture at
Springfields, 2008, Westinghouse Electric Company.
11. Stobbs, J.J. and A.J. Swallow, Effects of Radiation on Metallic Corrosion.
Metallurgical Review, 1962. 7(25): p. 95-132.

146
12. Powell, D.J., R. Pilkington, and D.A. Miller, The Precipitation
Characteristics of 20Cr/25Ni/Nb Stabilised Stainless Steel. Acta Metallurgica,
1988. 36(3): p. 713-724.
13. Ryan, M. P., Williams, D. E., Chater, R. J., Hutton, B. M. and McPhail, D. S,
Why Stainless Steel Corrodes. Nature, 2002. 415(6873): p. 770-774.
14. Williams, D. E., Kilburn, M. R., Cliff, J. and Waterhouse, G. I. N.,
Composition Changes Around Sulphide Inclusions in Stainless Steels and
Implications for the Initiation of Pitting Corrosion. Corrosion Science, 2010.
52(11): p. 3702-3716.
15. Bohni, H., T. Suter, and F. Assi, Micro-electrochemical Techniques for
Studies of Localized Processes on Metal Surfaces in the Nanometer Range.
Surface & Coatings Technology, 2000. 130(1): p. 80-86.
16. Evans, H.E. and R.C. Lobb, Conditions for the Initiation of Oxide Scale
Cracking and Spallation. Corrosion Science, 1984. 24(3): p. 209-222.
17. Millward, G. R., Evans, H. E., Jones, I. P. and Eley, C. D., Carbon
Deposition on Stainless Steel in Oxidising Environments. Materials at High
Temperatures, 2003. 20(4): p. 535-541.
18. Norris, D.I.R., C. Baker, and J.M. Titchmarsh, A Study of Radiation-Induced
Sensitization in 20/25/Nb Steel by Compositional Profile Measurements at
Grain Boundaries, 1987, British Library: London. p. 277.
19. Ashworth, M.A., D.I.R. Norris, and I.P. Jones, Radiation-Induced
Segregation in Fe-20Cr-25Ni-Nb Based Austenitic Stainless Steels. Journal
of Nuclear Materials, 1992. 189(3): p. 289-302.
20. Waddington, J.S. and R.B. Jones. Properties of Stainless Steel Cladding for
Use in Advanced Gas-Cooled Reactors. in Physical Metallurgy of Reactor
Fuel Elements. 1973. Berkeley Nuclear Laboratories, Gloucestershire: The
Metals Society.
21. Davis, J.R. and ASM International Handbook Committee., Metals Handbook.
Desk ed. 1998, Materials Park, Ohio USA: ASM International. 1521.
22. Ng, K.K., Complete Guide to Semiconductor Devices. 2nd ed. 2002, New
York: Wiley. 740.
23. Hampel, C.A., Rare Metals Handbook. 2nd ed. 1961: Reinhold. 715.
24. He, Y. D., Li, Z. W., Qi, H. B. and Gao, W., Standard Free Energy Change
of Formation per Unit Volume: A New Parameter for Evaluating Nucleation

147
and Growth of Oxides, Sulphides, Carbides and Nitrides. Materials Research
Innovations, 1997. 1(3): p. 157-160.
25. Sourmail, T., Precipitation in Creep Resistant Austenitic Stainless Steels.
Materials Science and Technology, 2001. 17(1): p. 1-14.
26. Beddoes, J. and J.G. Parr, Introduction to Stainless Steels. 3rd ed. 1999,
Materials Park, Ohio USA: ASM International. 315.
27. Millward, G. R., Evans, H. E., Aindow, M. and Mowforth, C. W., The
Influence of Oxide Layers on the Initiation of Carbon Deposition on Stainless
Steel. Oxidation of Metals, 2001. 56(3-4): p. 231-250.
28. Millward, G. R., Evans, H. E., Jones, I. P., Eley, C. D. and Simpson, K. A.,
Burn-off of Filamentous Carbon and Subsequent Re-deposition on a
20Cr25Ni Austenitic Steel. Materials at High Temperatures, 2009. 26(1): p.
57-61.
29. Martin, J.W., Precipitation Hardening. 2nd ed. 1998, Oxford: Butterworth-
Heinemann. 256 p.
30. Merica, P.D., The Precipitation-Hardening of Metals. Journal of the Franklin
Institute, 1942. 234(2): p. 137-146.
31. Merica, P.D., R.G. Waltenberg, and H. Scott, The Heat Treatment of
Duralumin. Journal of the Franklin Institute, 1919. 188(4): p. 549-550.
32. BNFL Brochure, Oxide Fuels for the Worlds Energy Suppliers: New Oxide
Fuels Complex, 2008, Copyright © British Nuclear Fuels Plc .
33. Pocock, R.F., Nuclear Power: Its Development in the United Kingdom. 1977,
Old Woking London: Unwin Brothers Ltd ; Institution of Nuclear Engineers.
272.
34. Olander, D., Nuclear Fuels - Present and Future. Journal of Nuclear
Materials, 2009. 389: p. 1-22.
35. Abram, T. and S. Ion, Generation-IV Nuclear Power: A Review of the State
of the Science. Energy Policy, 2008. 36(12): p. 4323-4330.
36. Weisman, J., Elements of Nuclear Reactor Design. 1977, Amsterdam ;
Oxford: Elsevier.
37. Frost, B.R.T., Nuclear Fuel Elements: Design, Fabrication and Performance.
Pergamon international library of science, technology, engineering and social
sciences. 1982, Oxford: Pergamon.

148
38. Hill, J.F., Textbook of Reactor Physics: An Introduction. 1961, London:
Allen and Unwin.
39. Grover, R.B., Nuclear Energy: Emerging Trends. Current Science, 2000.
78(10): p. 1191-1195.
40. Lobb, R.C., Observations on the Microstructure of 20Cr-25Ni-Nb Stainless
Steel After Exposure to Iodine Vapor during Creep at 750C. Oxidation of
Metals, 1981. 15(1-2): p. 147-167.
41. Hejzlar, P., Todreas, N. E., Shwageraus, E., Nikiforova, A., Petroski, R. and
Driscoll, M. J., Cross-comparison of Fast Reactor Concepts with Various
Coolants. Nuclear Engineering and Design, 2009. 239(12): p. 2672-2691.
42. Krane, K.S. and D. Halliday, Introductory Nuclear Physics. 1988, Hoboken,
NJ: John Wiley & Sons, Inc. 845.
43. Marsh, G. P., Taylor, K. J., Bryan, G. and Worthington, S. E., The Influence
of Radiation on the Corrosion of Stainless Steel. Corrosion Science, 1986.
26(11): p. 971-982.
44. Damcott, D.L., T.R. Allen, and G.S. Was, Dependence of Radiation-Induced
Segregation on Dose, Temperature and Alloy Composition in Austenitic
Alloys. Journal of Nuclear Materials, 1995. 225: p. 97-107.
45. Marwick, A.D., Segregation in Irradiated Alloys - Inverse Kirkendall Effect
and Effect of Constituition on Void Swelling. Journal of Physics F-Metal
Physics, 1978. 8(9): p. 1849-1861.
46. Nakajima, H., The Discovery and Acceptance of the Kirkendall Effect: The
Result of a Short Research Career. Jom-Journal of the Minerals Metals &
Materials Society, 1997. 49(6): p. 15-19.
47. Watanabe, S., Sakaguchi, N., Hashimoto, N., Nakamura, M., Takahashi, H.,
Namba, C. and Lam, N. Q., Radiation-Induced Segregation Accompanied by
Grain Boundary Migration in Austenitic Stainless Steel. Journal of Nuclear
Materials, 1996. 232(2-3): p. 113-118.
48. Simonen, E.P. and S.M. Bruemmer, Radiation Effects on Environmental
Cracking of Stainless Steels. Journal of the Minerals Metals & Materials
Society, 1998. 50(12): p. 52-55.
49. Smallman, R.E., Physical Metallurgy and Advanced Materials Engineering,
2007, Elsevier.

149
50. Yakabuskie, P.A., J.M. Joseph, and J.C. Wren, The Effect of Interfacial Mass
Transfer on Steady-State Water Radiolysis. Radiation Physics and Chemistry,
2010. 79(7): p. 777-785.
51. Wyllie, W.E., D. Steiner, and D.J. Duquette, The Effect of Water Radiolysis
on the Stress Corrosion Behavior of UNS S31600 Stainless Steel at 50 and 90
degrees C. Journal of Nuclear Materials, 1996. 233: p. 1372-1377.
52. IAEA Technical Document, Further Analysis of Extended Storage of Spent
Fuel, 1996, Document Number: IAEA-TECDOC-944, International Atomic
Energy Association (IAEA) Publication: Vienna.
53. Sedriks, A.J., Corrosion of Stainless Steels. 2nd ed. Corrosion monograph
series. 1996, New York ; Chichester: John Wiley.
54. Laycock, N.J. and R.C. Newman, Localised Dissolution Kinetics, Salt Films
and Pitting Potentials. Corrosion Science, 1997. 39(10-11): p. 1771-1790.
55. Ernst, P., Laycock, N. J., Moayed, M. H., and Newman, R. C., The
Mechanism of Lacy Cover Formation in Pitting. Corrosion Science, 1997.
39(6): p. 1133-1136.
56. Sugimoto, K. and Y. Sawada, Role of Molybdenum Additions to Austenitic
Stainless-Steels in Inhibition of Pitting in Acid Chloride Solutions. Corrosion
Science, 1977. 17(5): p. 425-445.
57. Evans, H.E. and R.C. Lobb, The Influence on Oxide Spallation of Annealing
Periods During a Cooling Cycle. Corrosion Science, 1993. 35(5-8): p. 999-
1005.
58. Taylor, C.D., The Transition from Metal-Metal Bonding to Metal-Solvent
Interactions During a Dissolution Event as Assessed from Electronic
Structure. Chemical Physics Letters, 2009. 469(1-3): p. 99-103.
59. Frankel, G.S. and N. Sridhar, Understanding Localized Corrosion. Materials
Today, 2008. 11(10): p. 38-44.
60. Deforce, B. and H. Pickering, A Clearer View of How Crevice Corrosion
Occurs. Journal of the Minerals Metals & Materials Society, 1995. 47(9): p.
22-27.
61. Galvele, J.R., Transport Processes and Mechanism of Pitting of Metals.
Journal of the Electrochemical Society, 1976. 123(4): p. 464-474.
62. Galvele, J.R., Transport Processes in Passivity Breakdown-II Full Hydrolysis
of the Metal Ions. Corrosion Science, 1981. 21(8): p. 551-579.
150
63. Szklarska-Smialowska, Z., Pitting Corrosion of Metals. 1986, Houston, Tex.:
National Association of Corrosion Engineers.
64. Soltis, J., D. Krouse, and N. Laycock, Localised Dissolution of Iron in
Buffered and Non-Buffered Chloride-Containing Solutions. Corrosion
Science, 2011. 53(6): p. 2152-2160.
65. Linhardt, P., G. Ball, and E. Schlemmer, Electrochemical Investigation of
Chloride Induced Pitting of Stainless Steel under the Influence of a Magnetic
Field. Corrosion Science, 2005. 47(7): p. 1599-1603.
66. Ernst, P. and R.C. Newman, Pit Growth Studies in Stainless Steel Foils II:
Effect of Temperature, Chloride Concentration and Sulphate Addition.
Corrosion Science, 2002. 44(5): p. 943-954.
67. Scholz, F., Electroanalytical Methods: Guide to Experiments and
Applications. 2002, Berlin ; London: Springer. 331.
68. Frankel, G.S., M. Stratmann, and A.J. Bard, Encyclopedia of
Electrochemistry. 2003, Weinheim: Wiley-VCH. 745.
69. Delahay, P., Double Layer and Electrode Kinetics. 1965, New York:
Interscience Publishers. 321.
70. Monk, P.M.S., Fundamentals of Electro-Analytical Chemistry. Analytical
techniques in the sciences. 2001, Chichester: Wiley. 361 p.
71. Piron, D.L., The Electrochemistry of Corrosion. 1991, Houston, TX:
National Association of Corrosion Engineers.
72. Frankel, G.S., Pitting Corrosion of Metals. A Review of the Critical Factors.
Journal of the Electrochemical Society, 1998. 145(8): p. 2970-2970.
73. Gileadi, E., The Enigma of Metal Deposition. Journal of Electroanalytical
Chemistry, 2011. 660(2): p. 247-253.
74. Gileadi, E. and E. Kirowa-Eisner, Some Observations Concerning the Tafel
Equation and its Relevance to Charge Transfer in Corrosion. Corrosion
Science, 2005. 47(12): p. 3068-3085.
75. Gileadi, E., Can an Electrode Reaction Occur without Electron Transfer
across the Metal/Solution Interface? Chemical Physics Letters, 2004. 393(4-
6): p. 421-424.
76. Ernst, P. and R.C. Newman, Pit Growth Studies in Stainless Steel Foils I:
Introduction and Pit Growth Kinetics. Corrosion Science, 2002. 44(5): p.
927-941.

151
77. Tachibana, M., Ishida, K., Wada, Y., Aizawa, M. and Fuse, M., Study of
Polarization Curve Measurement Method for Type 304 Stainless Steel in
BWR High Temperature-High Purity Water. Journal of Nuclear Science and
Technology, 2009. 46(2): p. 132-141.
78. Lawes, G., A.M. James, and Analytical Chemistry by Open Learning
(ACOL), Scanning Electron Microscopy and X-ray Microanalysis.
Analytical chemistry. 1987, Chichester: Published on behalf of ACOL by
Wiley.
79. Pardo, A., Merino, M. C., Coy, A. E., Viejo, F., Arrabal, R. and Matykina, E.,
Pitting Corrosion Behaviour of Austenitic Stainless Steels - Combining
Effects of Mn and Mo Additions. Corrosion Science, 2008. 50(6): p. 1796-
1806.
80. Leach, R., Brown, L., Xiangqian, J., Blunt, R., Conroy, M. and Mauger, D.,
Measurement Good Practice Guide No. 108. Guide to the Measurement of
Smooth Surface Topography using Coherence Scanning Interferometry, 2008,
National Physics Laboratory.
81. Giannuzzi, L.A. and F.A. Stevie, A Review of Focused Ion Beam Milling
Techniques for TEM Specimen Preparation. Micron, 1999. 30(3): p. 197-204.
82. Munroe, P.R., The Application of Focused Ion Beam Microscopy in the
Material Sciences. Materials Characterization, 2009. 60(1): p. 2-13.
83. Phaneuf, M.W., Applications of Focused Ion Beam Microscopy to Materials
Science Specimens. Micron, 1999. 30(3): p. 277-288.
84. Ooi, T.N., McPhail, D. S., Chater, R. J. and Shollock, B. A., Isotope
Exchange Studies of Oxidation Mechanisms in Nickel-Base Superalloys using
FIB-SIMS Techniques. Surface & Coatings Technology, 2006. 201(7): p.
3885-3888.
85. Overwijk, M.H.F., F.C. Vandenheuvel, and C.W.T. Bullelieuwma, Novel
Scheme for the Preparation of Transmission Electron-Microscopy Specimens
with a Focused Ion-Beam. Journal of Vacuum Science & Technology B,
1993. 11(6): p. 2021-2024.
86. Williams, D.B. and C.B. Carter, Transmission Electron Microscopy: A
Textbook for Materials Science. 2nd ed. 2009, New York ; London: Springer.
760.

152
87. Silk, J.R., R.J. Dashwood, and R.J. Chater, Determination of Lattice
Orientation in Aluminium Alloy Grains by Low Energy Gallium Ion-
Channelling. Nuclear Instruments & Methods in Physics Research Section B-
Beam Interactions with Materials and Atoms, 2010. 268(11-12): p. 2064-
2068.
88. Weidmann, E., A. Guesnier, and B. Taylor, Struers Application Note:
Metallographic Preparation of Stainless Steel, S. A/S, Editor 2005, Struers
Ltd: Ballerup, Denmark.
89. Galvele, J.R., Tafel's Law in Pitting Corrosion and Crevice Corrosion
Susceptibility. Corrosion Science, 2005. 47(12): p. 3053-3067.
90. Laycock, N.J., J. Stewart, and R.C. Newman, The Initiation of Crevice
Corrosion in Stainless Steels. Corrosion Science, 1997. 39(10-11): p. 1791-
1809.
91. Moayed, M.H. and R.C. Newman, Deterioration in Critical Pitting
Temperature of 904L Stainless Steel by Addition of Sulfate Ions. Corrosion
Science, 2006. 48(11): p. 3513-3530.
92. Williams, G. and H.N. McMurray, Localized Corrosion of Magnesium in
Chloride-Containing Electrolyte Studied by a Scanning Vibrating Electrode
Technique. Journal of the Electrochemical Society, 2008. 155(7): p. C340-
C349.
93. Espinosa, R.M., L. Franke, and G. Deckelmann, Phase Changes of Salts in
Porous Materials: Crystallization, Hydration and Deliquescence.
Construction and Building Materials, 2008. 22(8): p. 1758-1773.
94. Buchheit, R. G., Grant, R. P., Hlava, P. F., McKenzie, B., Zender, G. L.,
Local Dissolution Phenomena Associated with S-phase (Al2CuMg) Particles
in Aluminum Alloy 2024-T3. Journal of the Electrochemical Society, 1997.
144(8): p. 2621-2628.
95. Suter, T. and R.C. Alkire, Microelectrochemical Studies of Pit Initiation at
Single Inclusions in Al 2024-T3. Journal of the Electrochemical Society,
2001. 148(1): p. B36-B42.

153
Appendices
Appendix 1 – MATLAB algorithm for electrode surface area determination
%OPEN THE IMAGE FILE
I=imread('A4PS.tif');
figure, imshow(I)
title ('Original Image');
%THRESHOLD THE IMAGE IMMEDIATELY
level=graythresh(I);
bw=im2bw(I,level);
figure, imshow(bw);
%title('Thresholded Image');
%FIND IMAGE OF THE LARGEST AREA AND EDIT
CC = bwconncomp(bw,4);
STATS= regionprops(bw, 'all');
idx=find([STATS.Area]>2); %%1000 is arbritary
bw2=ismember(labelmatrix(CC), idx);
imwrite(bw2,'THRESHOLDEDIMAGE.jpeg');
%SEE WHICH ARE AT FAULT (DOUBLE CHECKING)
n=CC.NumObjects;
for i = 1:n
grain = false(size(bw));
eval(['grain(CC.PixelIdxList{‘,int2str(i),’})=true;'])
figure, imshow(grain);
eval(['title(', int2str(i),');']);
%end
%DISPLAY THE IMAGE TO CONFIRM
disp ('***IMAGE FILE THRESHOLDING COMPLETE***');
disp ('(Check all objects associated with thresholding)');
disp ('The image to be propped is named THRESHOLDEDIMAGE-
JPEG:');
disp ('1. Edit THRESHOLDEDIMAGE-JPEG with windows Paint.');
disp ('2. Run PROP to re-treshold.');
disp (' *exposed electrolyte area in cm2 will be provided');
%ERODE IMAGE
%se=strel('disk',2); %condition for erosion
%I2=imerode(bw,se);
%figure, imshow(I2);
%title('Eroded Image');
%PLEASE ENTER IMAGE ‘REAL’ DIMENSIONS
disp('PHOTOSHOP DATA NEEDED:');
width = input (' Enter Width (mm) of Photoshop File: ');
height = input (' Enter Height (mm)of Photoshop File: ');
%OPEN THE FILE
I=imread('THRESHOLDEDIMAGE.jpeg');
%figure, imshow(I)
%title ('Edited Image');

154
%[ypixel,xpixel,zpixel] = size(I);
%xpixelbycm = 2.54*xpixel/DPI;
%ypixelbycm = 2.54*ypixel/DPI;
totalareabymm2 = width*height;
totalareabycm2 = (width/10.0)*(height/10.0);
%RETHRESHOLD THE IMAGE
level=graythresh(I);
rebw=im2bw(I,level);
figure, imshow(rebw);
title('ReThresholded Image');
%FIND IMAGE OF THE LARGEST AREA AND EDIT
CC = bwconncomp(rebw,4);
STATS= regionprops(rebw, 'all');
idx=find([STATS.Area]>10); %%1000 is arbritary
rebw2=ismember(labelmatrix(CC), idx);
%imwrite(rebw2,'neweditedimage.jpeg', 'Quality', 100);
%ONLY ONE AREA IN QUESTION
n=CC.NumObjects;
if (n>1), error ('n > 1: somethings wrong; exist additional
object in image'),end
totareamm2=totalareabymm2*(1-STATS.Solidity);
totareacm2=totalareabycm2*(1-STATS.Solidity);
disp(' ');
disp('CALCULATED DATA:');
fprintf ('Area exposed to electrolyte (pc): %f\n', 1-
STATS.Solidity);
fprintf ('Area exposed to electrolyte (mm2): %f\n',
totareamm2);
fprintf ('Area exposed to electrolyte (cm2): %f\n',
totareacm2);
mycell = { ‘width(mm)', 'height(mm)', 'totarea(mm)',
'totarea(cm)', 'NaClArea(%)', 'NaClArea(mm2)',
'NaClArea(cm2)’};
%save data.txt mycell xpixel ypixel -ASCII
filename = 'data.txt';
fid = fopen(filename, 'w');
fprintf(fid, '%s %s %s %s %s %s %s\n', mycell{‘:,:’});
fprintf(fid, '%f %f %f %f %f %f %f\n', width, height,
totalareabymm2, totalareabycm2, 1-STATS.Solidity, totareamm2,
totareacm2 );
fclose(fid);
disp(' ');
disp('**DATA ALSO SAVED IN DATA.TXT');