Embed Size (px)
Citation preview
CORROSION OF PHOSPHOR BRONZE IN DIFFERENT
BIODIESEL BLENDS
RATHINEE A/P BALAKUMAR
FACULTY OF ENGINEERING
UNIVERSITY OF MALAYA
KUALA LUMPUR
2015

CORROSION OF PHOSPHOR BRONZE IN DIFFERENT
BIODIESEL BLENDS
RATHINEE A/P BALAKUMAR
RESEARCH REPORT SUBMITTED IN PARTIAL
FULFILMENT OF THE REQUIREMENT FOR THE
DEGREE OF MASTER OF ENGINEERING
FACULTY OF ENGINEERING
UNIVERSITY OF MALAYA
KUALA LUMPUR
2015

ii
UNIVERSITY OF MALAYA
ORIGINAL LITERARY WORK DECLARATION
Name of Candidate: Rathinee A/P Balakumar (I.C/Passport No:
Registration/Matric No: KMB130003
Name of Degree: Masters of Engineering (Materials Engineering and Technology)
Title of Project Paper/Research Report/Dissertation/Thesis (“this Work”):
Corrosion of Phosphor Bronze in Different Biodiesel Blends
Field of Study: Corrosion
I do solemnly and sincerely declare that:
(1) I am the sole author/writer of this Work;
(2) This Work is original;
(3) Any use of any work in which copyright exists was done by way of fair
dealing and for permitted purposes and any excerpt or extract from, or reference
to or reproduction of any copyright work has been disclosed expressly and
sufficiently and the title of the Work and its authorship have been acknowledged
in this Work;
(4) I do not have any actual knowledge nor do I ought reasonably to know that
the making of this work constitutes an infringement of any copyright work;
(5) I hereby assign all and every rights in the copyright to this Work to the
University of Malaya (“UM”), who henceforth shall be owner of the copyright in
this Work and that any reproduction or use in any form or by any means
whatsoever is prohibited without the written consent of UM having been first had
and obtained;
(6) I am fully aware that if in the course of making this Work I have infringed
any copyright whether intentionally or otherwise, I may be subject to legal action
or any other action as may be determined by UM.
Candidate’s Signature Date:
Subscribed and solemnly declared before,
Witness’s Signature Date:
Name:
Designation:

iii
ABSTRACT
Biodiesel fuel is gaining rapid recognition around the globe as a reliable alternative to the
use of petroleum fuel in the automotive industry. This safer, greener, renewable energy
source originates from naturally forming feedstocks such as animal fats and vegetable oils.
Biodiesel blends consist of mixtures of biodiesel with diesel at different composition.
Biodiesel fuel is much more corrosive when compared to petroleum fuel, thus giving rise to
many compatibility issues with the material construction of a typical combustion ignition
engine. This research studies the effects of Tert-butylamine and Benzotriazole additive on
the corrosion behaviour of phosphor bronze in different diesel/biodiesel blends. The
biodiesel feedstock used in the research originates from palm oil. The corrosion behaviour
of phosphor bronze was studied through immersion test in B0, B20 (20% biodiesel and
80% diesel), B50 (50% biodiesel and 50% diesel) and B100 for 1440 hours. Similar test
was carried out with the addition of additive Tert-butylamine and Benzotriazole in B20 and
B100. The test coupons were weighed before and after the immersion test to determine the
weight loss measurement and calculate the corrosion rate. The metal surface was
characterized by Scanning Electron Microscopy and Energy Dispersive X-Ray, while fuels
was analysed by measuring Total Acid Number and density. The test result indicates that
biodiesel is more corrosive to phosphor bronze sample when compared to diesel. Increasing
biodiesel volume in the immersion solution increases the corrosion attack on phosphor
bronze. The presence of additive Tert-butylamine and Benzotriazole, retards the corrosion
attack and protects the phosphor bronze from further deteriorating. Benzotriazole was
found to be a more efficient and effective corrosion inhibitor for phosphor bronze in
biodiesel environment.

iv
ABSTRAK
Bahan api biodiesel semakin mendapat pengiktirafan pesat di dunia sebagai alternatif yang
boleh dipercayai untuk menggantikan bahan api petroleum dalam industri automotif. Bahan
api ini selamat, mesra alam, dan merupakan sumber tenaga yang boleh diperbaharui. Ia
berasal daripada bahan semualjadi seperti lemak haiwan dan minyak sayur-sayuran. Bahan
api biodiesel lebih menghakis berbanding bahan api petroleum serta menimbulkan isu-isu
ketidakserasian dengan bahan pembinaan enjin pembakaran biasa. Kajian ini menyelidik
kesan penambahan perencat kakisan Tert-butylamine dan Benzotriazole terhadap tahap
kakisan bahan phosphor bronze dalam campuran diesel/biodiesel yang berlainan. Larutan
biodiesel yang digunakan dalam kajian ini berasal dari minyak kelapa sawit. Phosphor
bronze direndam dalam campuran B0, B20 (20% biodiesel dan 80% diesel), B50 (50%
biodiesel dan 50% diesel) dan B100 untuk 1440 jam. Ujian yang sama diulang dengan
menambah perencat kakisan Tert-butylamine dan Benzotriazole pada campuran B20 dan
B100. Phosphor bronze ditimbang sebelum dan selepas ujian rendaman untuk menentukan
penurangan berat bahan dan menghitung kadar kakisan. Ujian Scanning Electron
Microscopy dan Energy Dispersive X-Ray dijalankan pada phosphor bronze manakala
ujian Total Acid Number dan ketumpatan dijalankan pada larutan campuran. Keputusan
ujian menunjukkan bahawa biodiesel lebih mengakis kepada phosphor bronze berbanding
diesel. Peningkatan biodiesel dalam campuran, meningkatkan kadar kakisan terdadap
sampel. Kehadiran Tert-butylamine dan Benzotriazole bertindak sebagai perencat kakisan
yang melambatkan serangan kakisan dan melindungi sampel phosphor bronze daripada
terus merosot. Kajian menunjukkan Benzotriazole adalah lebih cekap dan berkesan sebagai
perencat kakisan untuk bahan phosphor bronze dalam biodiesel.

v
ACKNOWLEDGEMENTS
I would like to take this opportunity to convey my earnest and heartfelt gratitude
and recognition to each and every one who has supported, motivated, reinforced and
assisted me in completing this research project.
Firstly, I would like to take this great opportunity to show my appreciation and
gratitude towards my supervisor, Dr. Mohammad Abul Fazal Mohammad Ismail for his
continuous support, guide and motivation to complete this project with great success and
within the given time frame.
Beyond that, I would like to thank full time master student, Mr. Saazad Sharif for
his willingness, patience and time allocated to educate and share his knowledge with me
regarding the structure and working methodology of this research.
I also would like thank my friend Mr. Mohd Adam Mohd Noor who has supported
me during my lab work and testing procedures.
Last but not least, my sincerest gratefulness and thanks goes to my beloved family
and friends for their reassurance, inspiration and blessings throughout these academic
years. Without their constant guide and support, this achievement would not have been
possible for me.

vi
TABLE OF CONTENT
ABSTRACT .......................................................................................................................... iii
ABSTRAK ............................................................................................................................ iv
ACKNOWLEDGEMENTS ................................................................................................... v
TABLE OF CONTENT ........................................................................................................ vi
LIST OF FIGURES ............................................................................................................... x
LIST OF TABLES ............................................................................................................... xii
LIST OF SYMBOLS AND ABBREVIATIONS ............................................................... xiii
CHAPTER 1 : INTRODUCTION ......................................................................................... 1
1.1. Biodiesel .................................................................................................................. 1
1.2. Biodiesel: An Alternative Automation Fuel ............................................................ 3
1.3. Material Compatibility to Biodiesel Fuel ................................................................ 4
1.4. Biodiesel Blending and Additive Additions ............................................................ 5
1.5. Objective ................................................................................................................. 7
1.6. Scope of Studies ...................................................................................................... 7
1.7. Structure of Thesis ................................................................................................... 8
CHAPTER 2 : LITERATURE REVIEW .............................................................................. 9
2.1. Introduction to Biodiesel ......................................................................................... 9
2.2. Disadvantages of Petroleum Fuel .......................................................................... 10

vii
2.3. Biodiesel: Fuel for the Future ................................................................................ 11
2.4. Biodiesel Production ............................................................................................. 12
2.5. Biodiesel Blends .................................................................................................... 14
2.6. Biodiesel Properties ............................................................................................... 15
2.7. Factors Affecting the Performance and Stability of Biodiesel as Automation Fuel
18
2.7.1 Oxidation Stability ......................................................................................... 18
2.7.2. Thermal Decomposition ................................................................................. 19
2.7.3. Storage Stability ............................................................................................. 21
2.7.4. Corrosion ........................................................................................................ 22
2.7.5. Wear and Friction ........................................................................................... 23
2.7.6. Economical Capability and Acceptance of Biodiesel .................................... 24
2.8. Material Selection for a Typical CI Engine System .............................................. 25
2.9. Corrosion of Ferrous Metal in Different Biodiesel Blends ................................... 27
2.10. Corrosion of Non-Ferrous Metal in Different Biodiesel Blends ....................... 33
2.11. Additives and its Effects on Biodiesel Blends ................................................... 42
CHAPTER 3 : METHODOLOGY ...................................................................................... 48
3.1. Introduction ........................................................................................................... 48
3.2. Material ................................................................................................................. 48
3.2.1. Phosphor Bronze ............................................................................................ 48
3.2.2. Biodiesel ......................................................................................................... 48

viii
3.2.3. Diesel.............................................................................................................. 49
3.2.4. Tert-Butylamine (TBA) ................................................................................. 49
3.2.5. Benzotriazole (BTA) ...................................................................................... 50
3.3. Equipment ............................................................................................................. 50
3.3.1. Metallography Grinding & Polishing Machine ............................................. 50
3.3.2. Analytical Balance ......................................................................................... 51
3.3.3. Scanning Electron Microscope (SEM) and Energy Dispersive X-Ray (EDX)
Machine 51
3.3.4. Acid Value Tester .......................................................................................... 51
3.3.5. Density Meter ................................................................................................. 52
3.4. Methodology ......................................................................................................... 52
3.4.1. Sample Preparation ........................................................................................ 52
3.4.2. Immersion of Coupons in Different Fuels ..................................................... 53
3.4.3. Weight Loss Measurement and Corrosion Rate Calculation ......................... 54
3.4.4. Characterization Study of Metals and Fuels .................................................. 55
CHAPTER 4 : RESULTS AND DISCUSSION .................................................................. 57
4.1. Visual Inspection ................................................................................................... 57
4.2. Weight Loss Measurement and Corrosion Rate Calculation ............................... 59
4.3. Scanning Electron Microscopy (SEM) ................................................................. 61
4.4. Energy Dispersive X-Ray (EDX) ......................................................................... 63
4.5. Total Acid Number (TAN) ................................................................................... 66

ix
4.6. Density .................................................................................................................. 68
CHAPTER 5 : CONCLUSION ............................................................................................ 71
5.1. Introduction ........................................................................................................... 71
5.2. Future Recommendation ....................................................................................... 72
REFERENCE ....................................................................................................................... 73

x
LIST OF FIGURES
Figure 1.1: Chemical reaction of the Tri-glyceride with alcohol forming glycerol and fatty
acid methyl esters (Haseeb, Fazal, Jahirul, & Masjuki, 2011) ............................................... 2
Figure 2.1: Production yield for various source of biodiesel feedstock (Ong et al., 2011) . 10
Figure 2.2: Catalytic transesterification production diagram (Balat & Balat, 2008) ........... 13
Figure 2.3: CI fuel engine system with common material selection (K. Sorate & Bhale,
2013) .................................................................................................................................... 22
Figure 2.4: Typical process flow of CI engine (Haseeb et al., 2011) .................................. 26
Figure 2.5: Comparison of TAN and viscosity of fuels with (+) and without (-) additon of
microorganism (Kamiński & Kurzydłowski, 2008)............................................................. 29
Figure 2.6: Corrosion rate (mpy) for SS, Al and Cu sample immersed in biodiesel (B100)
and diesel (B0) for (a) 600 hours and (b) 1200 hours (Fazal et al., 2010) ........................... 31
Figure 2.7: Deterioration trend of carbon steel as a function of time measured by LPR
Method (Meenakshi et al., 2010) ......................................................................................... 32
Figure 2.8: Deterioration trend of copper sample exposed to palm biodiesel for different
immersion time (Fazal et al., 2013) ..................................................................................... 34
Figure 2.9: Corrosion rate of copper and leaded bronze at (a) room temperature and (b)
60°C (Haseeb et al., 2010) ................................................................................................... 36
Figure 2.10: Corrosion rate of copper and leaded bronze at (a) room temperature and (b)
60°C(Fazal et al., 2012) ....................................................................................................... 40
Figure 2.11: Corrosion rate for aluminum (Al), copper (Cu) and mild carbon steel (MCS)
(a) at room temperature and (b) at 60 ◦C (Cursaru et al., 2014) .......................................... 41
Figure 2.12: Corrosion rate of cast iron in the presence of palm oil biodiesel with and
without addition of corrosion inhibitor (Fazal et al., 2011b) ............................................... 44

xi
Figure 2.13: Effects of BTA concentration and sample rotating velocity to the weight loss
of copper sample (Khan et al., 2015) ................................................................................... 46
Figure 3.1: Phosphor bronze coupon. .................................................................................. 52
Figure 3.2: Experimental setup for immersion of phosphor bronze coupons ...................... 54
Figure 4.1: Appearance of (a) As- received phosphor bronze coupons before and after
exposure in (b) B0, (c) B20, (d) B50 and (e) B100 fuels for 1440 hours. ........................... 57
Figure 4.2: Effect of additives TBA and BTA on the appearance of phosphor bronze upon
exposure in B20 and B100 ................................................................................................... 58
Figure 4.3: Colour of B20 and B100 before (a,e) and after exposure (b-d, f-h) to phosphor
bronze in the absence and presence of additives (TBA and BTA) ...................................... 59
Figure 4.4: Corrosion rate of phosphor bronze in different fuels ........................................ 60
Figure 4.5: Corrosion rate of phosphor bronze in B20 and B100 in the presence of TBA and
BTA additive ........................................................................................................................ 60
Figure 4.6: SEM micrographs of phosphor bronze in different fuels .................................. 62
Figure 4.7: SEM micrographs of phosphor bronze in B20 and B100 in the presence of TBA
and BTA additive ................................................................................................................. 62
Figure 4.8: EDX of phosphor bronze in different fuels ....................................................... 64
Figure 4.9: EDX on test sample in B20 and B100 in the presence of TBA and BTA additive
.............................................................................................................................................. 65
Figure 4.10: Change in TAN of different fuels, before and after immersion test ................ 67
Figure 4.11: Comparison of change in TAN of B20 and B100 in the absence and presence
of TBA and BTA additive .................................................................................................... 68
Figure 4.12: Change in density of different fuels exposed to phosphor bronze .................. 69
Figure 4.13: Comparison of density of fuels in the absence and presence of TBA and BTA
additive ................................................................................................................................. 70
xii
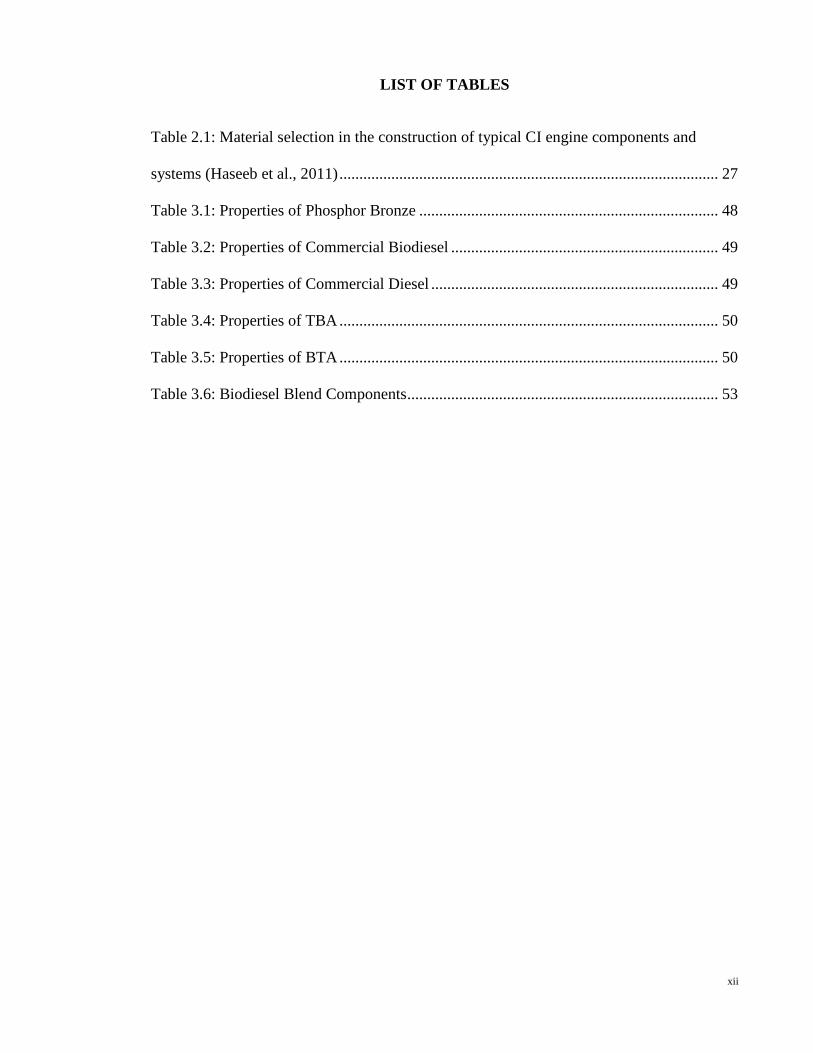
LIST OF TABLES
Table 2.1: Material selection in the construction of typical CI engine components and
systems (Haseeb et al., 2011) ............................................................................................... 27
Table 3.1: Properties of Phosphor Bronze ........................................................................... 48
Table 3.2: Properties of Commercial Biodiesel ................................................................... 49
Table 3.3: Properties of Commercial Diesel ........................................................................ 49
Table 3.4: Properties of TBA ............................................................................................... 50
Table 3.5: Properties of BTA ............................................................................................... 50
Table 3.6: Biodiesel Blend Components .............................................................................. 53

xiii
LIST OF SYMBOLS AND ABBREVIATIONS
CI - Combustion-ignition
SEM - Scanning Electron Microscopy
EDX - Energy Dispersive X-Ray
TAN - Total Acid Number
FAME - Fatty acid methyl esters
FFA - Free fatty acids
TBA - Tert-butylamine
BTA - Benzotriazole
R&D - Research and Development
Na - Sodium
NaOH - Sodium hydroxide
KOH - Potassium hydroxide
PP - Pour point
CP - Cloud point
CFPP - Cold filter pluggin point
PB - Phosphor bronze
Cu - Copper

xiv
BS - Brass
Al - Aluminnium
EDA - Ethylenediamine
TBHQ - Tert-butylhydroquinone
BHT - Butylated hydroxytoluene
BHA - Butylated hydroxyanisole
nBA - n-butylamine
PEG - Polyethylene glycol
NaCl - Sodium chloride
PPy - Polypyrrole film
1
CHAPTER 1 : INTRODUCTION
1.1. Biodiesel
Biodiesel fuel is rapidly gaining its place as an effective and reliable alternative
compared to the use of petroleum based fuels around the globe. Biodiesel is being
widely researched and developed in order to improve its fuel properties and also to
adapt its properties for many other applications and industries. One of the main
advantages of the use of biodiesel fuel is its cleaner-burning efficiencies and eco-
friendly combustion properties when compared to petroleum diesel (Balat & Balat,
2008). Other than that, biodiesel fuel also serves as a renewable energy, which helps to
overcome the concerns related to depletion of petroleum or fossil fuels in the coming
future. The continuous and unfavourable impact of utilising petroleum fuels has led to
the vast and extensive development of biodiesel fuel and its blends in many developing
countries.
Biodiesel is produced domestically from naturally forming fatty acid feedstock.
These feedstocks includes animal fats, vegetable oils and also recycled oils and grease
from cooking waste. Vegetable oils are more commonly used as biodiesel feedstock due
to its renewable stock that can be obtained through continuous plantation (Jaichandar &
Annamalai, 2011; Ong, Mahlia, Masjuki, & Norhasyima, 2011). The most commonly
used vegetable oils are coconut, rapeseed, sunflower, palm, peanut, cotton seed and
soybean oil. Malaysia, as one of the leading countries in palm oil production is also
actively involved in introducing and promoting the utilization of biodiesel fuels for
many application and industries in the country. Biodiesel is generally produced through
transesterification reaction method. This method involves the chemical reaction between
vegetable or animal oils with short chain alcohols such as methanol or ethanol. Figure
1.1 shows the chemical reaction of one mole tri-glyceride with three mole of alcohol

2
forming one mole of glycerol and three moles of fatty acid methyl esters (FAME). The
presence alcohol acts as a catalyst that tends to increase the transesterification reaction
rate (Jaichandar & Annamalai, 2011). The glycerol is the by-product of the reaction,
while esters are known as biodiesel.
Figure 1.1: Chemical reaction of the Tri-glyceride with alcohol forming glycerol and
fatty acid methyl esters (Haseeb, Fazal, Jahirul, & Masjuki, 2011)
Neat biodiesel in its pure and unblended form is indicated as B100. However,
B100 is hardly used as fuel because of its higher viscosity and incompatibility with
engine components. Therefore, in most cases, biodiesel are usually used in the forms of
blends, whereby the composition of the blend consist of controlled mixture between
biodiesel and petroleum fuels. Common biodiesel blends such as B20 consist of 20%
biodiesel and 80 % diesel (Tyson & McCormick, 2006). Biodiesel blends are primarily
formulated in order to improve the chemical and physical properties, thus making it
suitable for automotive application. The physical and chemical properties of biodiesel
fuel, also depends on the type of biodiesel feedstock and its FAME composition
(Hoekman, Broch, Robbins, Ceniceros, & Natarajan, 2012). The variation in these
factors, gives both advantages and disadvantages to the overall use of biodiesel fuel as
an alternative in automation fuel. Therefore, it is highly necessary to analyse and
research on the impact of biodiesel blends towards the fuel properties and also the
operating environment.
3
1.2. Biodiesel: An Alternative Automation Fuel
The inconsistent hike in petroleum fuel prices and fluctuation in the supply and
demand chain of petroleum fuel causes many disruption and interference in the
automation industry. This mainly affects the operation of travel and transportation
business in the country. As a result, many countries are now venturing into the
prospects and potentials of biodiesel fuel as an alternative for conventional petroleum
fuel. Countless designs experiments together with innovation ideas are being
researched and developed in order to stabilize, improve and optimise the properties and
compatibility of biodiesel fuel when operating in conventional compression- ignition
(CI) engines.
Some of the main concerns involving the use of biodiesel fuel in CI engines are
the level of compatibility of the fuel to the components and materials of the
conventional CI engine, together with the combustion quality and performance of the
engine. Research has shown that there are certain downfalls in the properties of
biodiesel fuel such as low volatility, high viscosity and its cold flow properties that can
lead to various problems, such as reduced atomization of fuel, partial combustion with
heavy smoke discharge, carbon deposition, and injector chocking within the CI engine
(Karmakar, Karmakar, & Mukherjee, 2010). Therefore, it is essential to conduct further
research and improvement in order to rectify and minimise these impacts prior complete
use of biodiesel fuel in CI engine.
Biodiesel fuel is generally instable, whereby its properties and composition can
degrade over time and under selective operating conditions, causing it to deviate from
the standard properties (Jakeria, Fazal, & Haseeb, 2014). There are certain factors that
can affect the stability and performance of biodiesel as automation fuels. These include
oxidation stability, thermal decomposition, storage stability, corrosion and
4
contamination together with wear and friction properties of biodiesel fuel (Jakeria et al.,
2014; K. A. Sorate & Bhale, 2015). Depending on the percentage of unsaturated fatty
acid components within various biodiesel feedstock, palm and coconut biodiesel
exhibits the least amount of unsaturated fatty acid, thus making them much more stable
when compared to other biodiesel feedstock such as peanuts, rapeseed, soybean and
sunflower (Jakeria et al., 2014).
It is essential to address and refine these factors in order to boost the
performance and stability of the operating environment and its components in contact
with biodiesel fuel. The economic capability of biodiesel fuel also plays a vital role in
guaranteeing its potential as an alternative automation fuel. The cost of primary
feedstock, processing and mass production of biodiesel fuel are primary factors that
needs to be considered in order to ensure the sustainability of utilising biodiesel fuel in
the automation industry (Atabani et al., 2012).
1.3. Material Compatibility to Biodiesel Fuel
The material technologies of CI engine has evolved greatly throughout the years,
introducing many more complex materials and alloys that is proven to be well suited
and able to improve the performance and durability of the engine. Therefore, it is highly
necessary to study the compatibility of biodiesel fuel with the typical materials
composed in the CI engine system. Much research has shown that biodiesel fuel
exhibits higher corrosion, contamination and wear tendencies when compared to
petroleum fuel (K. A. Sorate & Bhale, 2015). This is due to auto-oxidation or instability
of biodiesel together with the presence of moisture in the operating environment. The
fuel coming in contact with the engine components also varies according to its operating
condition, in terms of temperature, velocity, load and pressure (Singh, Korstad, &
Sharma, 2012). In such events, different engine parts and components in contact with
5
biodiesel fuel will undergo different corrosion rates, thus giving rise to problems such
as metal thinning, sediment and corrosion product formation, clogging of filters and
injector pumps, and reduced durability and lifespan of CI engine. The biodiesel fuel
properties and composition could also be off specification or degraded.
The common materials in a typical CI engine can be divided into metallic and
non-metallic materials, comprising ferrous alloys, non-ferrous alloys and elastomer
material (Haseeb et al., 2011). Ferrous alloys such as stainless steel tends to show
greater resistance to corrosion in the biodiesel environment, due to the presence of a
regenerating passive layer that acts as a barrier to corrosion activity on the metal
surface. Similar corrosion protection mechanism was also exhibited by aluminium alloy
in the non-ferrous alloy category (Ortega et al., 2013). Research by Ortega et al., (2013)
has also shown that copper alloys are more susceptible to corrosion than aluminium
alloys and ferrous alloys. Upon exposure in biodiesel, materials such as copper, brass
and bronze tend to accelerate biodiesel degradation, leading to weight loss and
formation of pitting on the metal surface. This leads to the formation of deposits and
sedimentation in the biodiesel fuel. Copper acts as a strong catalyst in driving palm oil
oxidation (Ortega et al., 2013).
1.4. Biodiesel Blending and Additive Additions
The poor corrosion resistance of copper and copper alloy in contact with
biodiesel fuel gives a major impact to the use of biodiesel fuel in CI engines. This is
because fuel system components such as fuel feed pumps and fuel pumps within the CI
engine are constructed with copper based alloys (Haseeb et al., 2011). Therefore, it is
highly essential to analyse and study the behaviour of copper and copper alloys towards
biodiesel fuel in depth in order to improve its corrosion resistance and compatibility
when in service. Fuel blending is one of the alternatives that have been proposed to

6
improve the corrosion resistance of metals in contact with biodiesel fuel. The formation
of fuel blending can decrease metal corrosion while similarly improving the physical
and chemical properties of the biodiesel blended automation fuel.
The corrosion behaviours of metals in contact with biodiesel can also be
improved by the addition of additives. These include chemicals such as antioxidants and
also corrosion inhibitors. Antioxidants play a key role in improving the stability of
biodiesel blend by reducing the oxidation rate of biodiesel when in operating condition.
Research shows that oxidised biodiesel is more corrosive when compared to as-received
biodiesel (Haseeb et al., 2011). This is due to the mechanism involved in the oxidation
process, which increases the fatty acid content in the biodiesel, making it highly
corrosive. Elements like copper, brass and bronze has higher tendencies to accelerate
the oxidation of biodiesel when compared to elements like stainless steel, aluminium
and carbon steel. Therefore, it is highly necessary to retard oxidation reaction of
biodiesel by the addition of antioxidants especially when in contact with copper and
copper alloys. Some of the commonly used antioxidants include tertbutylated
hydroquinone (TBHQ), butylated hydroxytoluene (BHT), butylated hydroxyanisole
(BHA) (Yaakob, Narayanan, Padikkaparambil, Unni K, & Akbar P, 2014).
Corrosion inhibitors are also another group of additives that can be used to
reduce the corrosion activity at the metal surface. Corrosion inhibitors form a protective
layer on the metal surface, reducing the contact points between the metals and its
environment. This action reduced the corrosion rate and corrosion product discharged
into the environment. Tert-butylamine (TBA) is an amine base compound used as
corrosion inhibitors for diesel system. Research has shown that TBA is effective in
retarding corrosion activity through the formation of protective layer on the metal
surface (Fazal, Haseeb, & Masjuki, 2011b). The formation of iron nitrite hydrate layer,
shields oxygen and moisture contact with the metal surface, and decreases the corrosion

7
effects. Benzotriazole (BTA) is also a well-known and effective corrosion inhibitor for
copper and copper alloys. The presence of BTA in the biodiesel solution minimises the
copper dissolution rate, thus preventing the formation of corrosion deposits and
sediments in the fuel. However, research has shown that the performance of BTA
addition is also dependent on factors such as pH and flow velocity of the solution
(Khan, Shanthi, Babu, Muralidharan, & Barik, 2015). Therefore, it is necessary to study
and understand the operating condition of the CI engine to optimise the effects of BTA
addition towards improving the corrosion protection for copper and copper alloy based
components (Khan et al., 2015).
1.5. Objective
The specific objectives of the present study are as listed below:
1. To analyse the corrosion behaviour of phosphor bronze in contact with
petroleum fuel (B0), biodiesel fuel (B100) and different diesel-biodiesel fuel blends
(e.g. B20, B50).
2. To investigate the effect of corrosion inhibitor on the corrosion behaviour of
phosphor bronze and properties of the investigated fuels.
1.6. Scope of Studies
The scope of this research is to analyse and investigate the corrosion behaviour
of phosphor bronze in contact with biodiesel fuel and its blends when used as
automotive fuel. It also studies the effects of corrosion inhibitor on the corrosion
behaviour of phosphor bronze in contact with biodiesel fuel and its blends. The research
primarily focuses on the corrosion rate calculation obtained through weight loss of the
sample before and after immersion test. Other than that, experiments to determine metal
surface properties and composition using Scanning Electron Microscopy (SEM) and
8
Energy Dispersive X-Ray (EDX) was also conducted. The Total Acid Number (TAN)
and density properties of the respective fuels was also measured and analysed to
determine the changes in the fuel properties in contact with phosphor bronze.
1.7. Structure of Thesis
The organization of the report is as follow:
Chapter 1 provides a brief introduction of the research. In Chapter II, a complete
literature review on biodiesel, its properties, the drawbacks and improvement methods
for its future in the automotive industry is provided. In Chapter III, design of the
experiment, implementation, tools, materials and process flow were discussed. Chapter
IV focuses on discussions of the obtained results and comparison with some of previous
research work. Meanwhile, the final chapter which is Chapter V concludes the research
with some future recommendations and improvements.

9
CHAPTER 2 : LITERATURE REVIEW
2.1. Introduction to Biodiesel
Biodiesel fuel has grown as a valuable alternative to the use of petroleum based
fuel for many industries. Biodiesel can be defined as fuel consisting of mono-alkyl
esters of long chain fatty acids obtained and processed from any natural or used
feedstock that contains fatty acids. Biodiesel feedstock includes vegetable fats and oils,
animal fats and also used or waste oils. The first test involving biodiesel was initiated in
the early years by Rudolph Diesel, using peanut oil. The development of biodiesel has
then grown steadily by research in many countries, such as France and Belgium,
involving the use of other type vegetable oils and also palm oil ethyl ester. The
widespread production of biodiesel (mono alkyl esters) took place in 1990s as a
substitute to the growing demand of energy levels (Balat & Balat, 2008)
Biodiesels are predominantly produced from vegetable oils. The common source
of biodiesel feedstock comes from coconut, rapeseed, sunflower, palm, peanut, cotton
seed, soybean oil and Jathropa. Vegetable oils (triglycerides) consist of a major portion
of triglycerides (98%) and small portion of mono- and diglycerides. It is seen that
different vegetable oils varies from one another based on the types of the fatty acid
present in terms of the length of its carbon chains and the presence and numbers of
double bonds within the molecule (Balat & Balat, 2008; Ong et al., 2011). The
feedstock of biodiesel and its production is highly depending on the availability of the
feedstock in the region. Figure 2.1 shows the comparison of productivity per unit
hectares for various types of vegetable oil feedstock. Based on this comparison, palm oil
is seen as most potential to cater for a higher production of biodiesel. Palm oil provides
the highest oil productivity when compared to other highly used feedstock in the
European Union such as rapeseed oil and soybean. One of the advantages of palm oil is

10
its continuous availability and productivity throughout the year without interruption,
thus giving a higher yield when compared to other crop such as soybean and rapeseed.
Figure 2.1: Production yield for various source of biodiesel feedstock (Ong et al., 2011)
As a major producer of palm oil, Malaysia is also greatly developing through
extensive Research & Development (R&D) on the application of palm oil biodiesel
products and production quality since 1980s. South East Asia provides the highest palm
oil output, which is a total of 89% from the world production. Malaysia, having 4.5
million hectares of palm oil plantation contributes to 40% of the world production (Ong
et al., 2011). It is now a growing demand in Malaysia to research and develop biodiesel
as a new fuel alternative that also serves as a renewable energy for the depletion of
traditional petroleum fuels. In this scenario, the utilization of palm oil feedstock in
biodiesel production serves as an efficient and reliable yield in terms of productivity per
hectar.
2.2. Disadvantages of Petroleum Fuel
The production and utilization of biodiesel from vegetable oils, animal fats and
waste or used cooking oil have been found to provide greater advantage in terms of
environmental and also cost aspects to daily users. The main concerns involving the use
of petroleum fuel involves the constant and unpredictable hike in the petroleum fuel

11
price, which affects the need for daily use of petroleum fuel by the people. Fossil fuel is
also not a renewable energy and faces depletion over time when compared to the
increasing need in the fuel demand for the transportation industry. Other than that, the
increase in environmental pollution and also the greenhouse effect by the use of
petroleum fuel has led to serious global warning crisis. The impact of reduction in fossil
fuel and environmental degradation has led to the successive research and development
of biodiesel to be introduced as a much safer, cleaner and reliable alternative for fossil
fuel (Balat & Balat, 2008; Ong et al., 2011).
2.3. Biodiesel: Fuel for the Future
The active search for a reliable and renewable fuel has led to the drastic growth
of research and development of biodiesel fuel. In comparison with all other means of
alternative fuels, biodiesel from on vegetable oil feedstock has proved to be the most
promising alternative with many advantages. Vegetable oils are widely available around
the globe, thus making it readily available for processing and production. Vegetable oils
are also renewable, whereby the source can be obtained through ongoing plantation
throughout the year. Other than that, the combustion of biodiesel based from vegetable
oils is also more environmental friendly, with less or no contamination such as sulphur
element, aromatic hydrocarbons, and crude oil residue in the source.
The CO2 emission form the combustion of biodiesel fuels is also well-balanced
whereby the emitted gas is reabsorbed by the plants planted for the production of
biodiesel feedstock. Biodiesel is also much safer for use and is classified as non-
flammable fluid. The use of biodiesel fuels also provides better lubrication properties,
thus providing better performance and life span extension for the combustion-ignition
(CI) engine (Jaichandar & Annamalai, 2011).

12
However, research has also shown that there are known disadvantages to the use
of biodiesel based from vegetables oils. The use of vegetable oil has a tendency to
exhibit higher viscosity that can lead to many problems in the injection and combustion
process of the biodiesel. The viscosity of vegetable oil based biodiesel is 10 to 20 times
greater than that using petroleum fuels (Balat & Balat, 2008). Viscosity is an essential
property that affects the fuel injection equipment in the compression- ignition (CI)
engine. Operating at low temperature condition also has a tendency to increase the
biodiesel viscosity, leading to failures such as clogging and choking that can affect the
engine performance and durability (Balat & Balat, 2008; Jaichandar & Annamalai,
2011). Therefore, it is highly necessary that the viscosity properties of biodiesel to be
monitored and controlled in order to improve its performance as a vehicular combustion
fuel.
2.4. Biodiesel Production
The most common method of biodiesel production is through transesterification
of vegetable oils and also animal fats. Transesterification is well-known and economical
biodiesel processing method in which the vegetable oils and animals fats are reacted
with alcohol such as methanol, leading to the formation of ester and glycerol. Research
shows that transesterification process of biodiesel is able to lower the viscosity of the
fuel and also increase combustion properties (Jaichandar & Annamalai, 2011; Ong et
al., 2011). The main variable affecting this process includes the type of alcohol utilized,
the type and amount of catalyst, the reaction condition such as temperature and time
together with the amount of free fatty acids (FFA) and water content of the origin base
biodiesel.
Catalytic transesterification with methanol, (methanolysis) is a common
production method in which catalyst such as sodium hydroxide or sulfuric acid is used

13
to escalate the reaction and improve the biodiesel synthesis (Balat & Balat, 2008).
Figure 2.2 shows a typical catalytic transesterification production method using
vegetable oil as the feedstock.
Figure 2.2: Catalytic transesterification production diagram (Balat & Balat, 2008)
One of the advantages of this process is that the methanol used in the processing
is highly recoverable by distillation method, while the by-product formed by the
reaction, that is glycerin, which has a higher density than that of biodiesel, can be used
in the pharmaceutical and cosmetics industries (May, 2004). It was reported that it is
possible to obtain 80 -85% pure glycerol after the removal of excess methanol. This
approach is highly necessary to reduce the cost and maximize the utilization of the
reaction products. The research on the transesterification of palm oil shows that Na,
NaOH and KOH are effective catalyst that is able to produce a higher yield of biodiesel,
within the shortest reaction time (May, 2004).
The concentration of the type of catalyst used is also essential to determine the
rate of transesterification (May, 2004). The research shows that increasing the
concentration of catalyst NaOH on the transesterification of RBD palm oil using
methanol up to 2 weight% based on oil, can decrease the completion time of the
reaction up to 1 minute. Therefore, it is highly essential to conduct a proper selection of
type and concentration of catalyst in the catalytic transesterification process, which can

14
lead to a higher yield of processed biodiesel within the shortest reaction time (May,
2004).
2.5. Biodiesel Blends
Biodiesel is commonly used as blends with petroleum diesel. Biodiesel blends
consist of mixtures of biodiesel with diesel at different composition. Biodiesel blends
are indicated with the letter B and the consequent numbers to the letter B indicates the
biodiesel percentage. The typical industrial standard biodiesels found in the market are
B2, B5, B10 and B20. Concentration up to 5% biodiesel, B5 in conventional diesel fuel
is considered to be as pure petroleum diesel (Tyson & McCormick, 2006).
Concentrations beyond that value, which is from 6 to 20% biodiesel, can be used with
little or no modification requirement for any application that currently utilizes
petroleum fuel. The common biodiesel blend used in the United States is B20 as it
provides a well-balanced and suitable combination that is able to sustain the material
selection, engine performance and cost benefits of biodiesel (Tyson & McCormick,
2006).
Some examples of application utilising B20 are CI engines, turbines and oil
boilers. The B20 blend has been successfully used in low-temperature climates in the
US, in order to reduce the cloud point (CP) that is the temperature at which fuel starts to
visually form crystals when cooled (Tyson & McCormick, 2006). On the other hand,
biodiesel blends with higher combination such as B50 and B100 will require careful
handling and also major modification to the contact equipment or process, in order to
ensure the safety and compatibility of the blend to the operating system and its
surroundings (Tyson & McCormick, 2006).

15
2.6. Biodiesel Properties
The property of biodiesels varies from the type of feedstock involved in the
biodiesel production. The physical and chemical properties of biodiesel are tied up to
the specific composition of the fatty acid methyl esters (FAME) present in the biodiesel
(Hoekman et al., 2012). The major characters such as the number of FFA and its
composition in the feedstock influence the biodiesel production and final properties
(Karmakar et al., 2010). FFA can be defined as the amount of fatty acid in the feedstock
(wt %) that is not chemically bonded to the triglyceride molecule. Therefore, it is
essential to compare the general properties of biodiesel to that of petroleum diesel, in
order to achieve similar or improved performance for the automation fuel system.
Biodiesel has a higher oxygen content when compared to diesel, giving it a
lower carbon and hydrogen content. This leads to a lower mass energy content in
biodiesel (Hoekman et al., 2012). Chemically bonded oxygen has the tendency to lower
the heating value and also reduce the CO emission content during combustion
(Jaichandar & Annamalai, 2011). Biodiesel also exhibits higher fuel density when
compared to diesel. The density factor is essential in the process involving fuel injector
pumps and determines the energy level and air-fuel ratio within the CI engine.
In terms of cetane number, biodiesel shows an excellent value compared to diesel, in
particular, No 2 diesel fuel. Cetane number represents the combustion or ignition
properties of a fuel. A higher cetane number indicates a shorter delay period in ignition
time and thus the fuel easily combustible. Higher speed diesel engine can operate much
efficient and effectively with higher cetane number in fuels (Hoekman et al., 2012;
Tyson & McCormick, 2006). The chain length and its saturation level can influence the
cetane number in a particular feedstock (Karmakar et al., 2010). Biodiesel blends tend
to exhibit a higher cetane value due to the increase in B-level of the blends.

16
Some of the downfall in the biodiesel properties when compared to diesel
properties is due to the higher viscosity of biodiesel. Viscosity represents the level of
resistance in a fluid by friction within the surrounding and its fluid. A review conducted
by Hoekman et al., (2012) comparing the kinematic viscosity in 12 types of biodiesel
shows that more than 80% of biodiesel exhibits a viscosity range between 4–5 mm2/s.
This comparison is also made clear by Tyson & McCormick, (2006) proving that the
higher viscosity of biodiesel when compared to diesel can be an impact to the
performance and durability of the conventional CI engine. The viscosity of biodiesel is
higher than that of diesel, usually by a factor of two. Higher viscosity leads to
performance deterioration in terms of fuel injection volume and atomization. This
problem is more significant in cold climate and low temperature operating conditions
where the fuel viscosity is also highly affected by the surrounding temperature.
Cold flow peoperties of biodiesel is also one of the concern when utilizing
biodiesel fuels in CI engine. Review conducted by Sorate & Bhale, (2015) highlights
that the crystallization of FAME in biodiesel at low or cold temperature can lead to
clogging and choking of fuel injector pump and filters and is capable to deteriorate
engine performance. The cold flow properties of biodiesel is tied to the CP and pour
point (PP) of the feedstock. The CP is generally higher than the PP, which is the lowest
temperature at which the fuel will crease to flow and solidify to form gel like substance
(Tyson & McCormick, 2006). The CP and PP of biodiesel is generally higher when
compared to diesel, typically, No 2 diesel fuel. The fuel selected for cold or low
temperature condition is best recommended to have the lowest cold flow properties. It is
seen that the low temperature flow properties of biodiesel and its higher blends is
affeted by the hydrocarbon chain length and also the amount or presence of unsaturated
bonds (K. A. Sorate & Bhale, 2015).

17
Another property of biodiesel that is considered under cold flow properties is the
cold filter pluggin point (CFPP) (Hoekman et al., 2012). This point is defined as the the
minimum temperature at which fuel form crystallization or gels and causes the filters to
plug (Dwivedi & Sharma, 2014). The CFPP of biodiesel varies according to the content
of fatty acid in the feedstock, whereby the CFPP is directly proportional to the fraction
of saturated fatty acid in the biodiesel. The CFPP tends to be lower then the CP in
which, upon cooling to CP temperature of the biodiesel, the methy ester molecules
within the fluid tends to precipate and crystallize, leading to the clogging of fuel filters
(Karmakar et al., 2010). Dwivedi & Sharma, (2014) informed that the criticality of cold
flow properties is seen especially during winter season, where decreasing temperature in
the surroundings is unavoidable and prolonger over a period. Fuels with higher CFPP
points will lead to faster malfunction of the vehicles during these critical times. In such
scenarios, further alternative steps such as addition of additive and blending of fuels
needs to be implemented to reduce the freezing points of fuels (Dwivedi & Sharma,
2014).
The value of CP, PP and CFPP are interrelated to one another and thus can be
used as an indication to determine or assess on the cold flow properties of the biodiesel
feedstock (Hoekman et al., 2012). Biodiesel exhibits a much higher flash point when
compared to diesel, and is considered as less hazardaous in terms of flammability
(Hoekman et al., 2012; Tyson & McCormick, 2006). Flash point can be defined as the
lowest temperature in which a fluid is able to evaporate and ignite in the presence of a
heat source. Flash point is the inverse of fuel volatility, whereby biodiesel exhibits low
volatility. Many research has shown that the low volatility of biodiesel can lead to poor
combustion quality in diesel engines, thus affecting the performance of the CI engine
(Balat & Balat, 2008; Jaichandar & Annamalai, 2011; Tyson & McCormick, 2006).

18
2.7. Factors Affecting the Performance and Stability of Biodiesel as Automation
Fuel
The widespread use and application of biodiesel in the transportation industry is
greatly expanding among the developing countries around the world. Therefore, it is
highly necessary that research in understanding and classifying the properties of
biodiesel be conducted in order to maximize the development of biodiesel fuel as
automation fuel. There are many factors that are able to affect the stability and quality
of biodiesel used as automation fuel. These factors include oxidative stability, thermal
decomposition, corrosion and contamination, wear and friction, microbial growth,
combustion and emissions and also storage capabilities of biodiesel. These factors can
cause the instability of biodiesel which will eventually lead to the alteration of biodiesel
properties and composition (Jakeria et al., 2014).
2.7.1 Oxidation Stability
Oxidation stability is one of the main concerns in evaluating the performance of
biodiesel as automation fuel. One of the main reasons of rapid oxidation in biodiesel is
due to the level of unsaturated fatty acid components together with the higher number of
carbon-carbon double and lower number of hydrogen molecules in the feedstock
(Jakeria et al., 2014). This gives biodiesel much lower oxidation stability when
compared to petroleum diesel leading to the formation of decomposition products such
as acid, alcohol, peroxides and ester as sediments in the biodiesel. Oxidation stability
can be determined by evaluating the concentration of antioxidant together with the total
glycerine and fatty acid content. Jakeria et al., (2014) also mentions that other factors
such as light intensity, temperature, metallic traces within the biodiesel can also affect
the rate of oxidation.
19
There are two mechanisms in which biodiesel oxidation can take place that is
auto-oxidation and photo-oxidation. Auto-oxidation is much more common in biodiesel
feedstock and occurs readily when exposed to oxygen through a series of chain
reactions involving initiation, propagation and termination (Yaakob et al., 2014). The
UV light acts as an initiator that breakdown the compound such as peroxides, carbonyl
and hydroperoxides into free radical that act as an initiator in the for subsequent auto-
oxidation reaction (Yaakob et al., 2014). The level of oxidation susceptibility can affect
basic properties such as cetane number, CP, PP and viscosity of the biodiesel feedstock.
Beyond that, a drastic rate in the oxidation degradation of biodiesel can lead to the
formation of insoluble high molecular weight polymers that can be harmful when in
used in application.
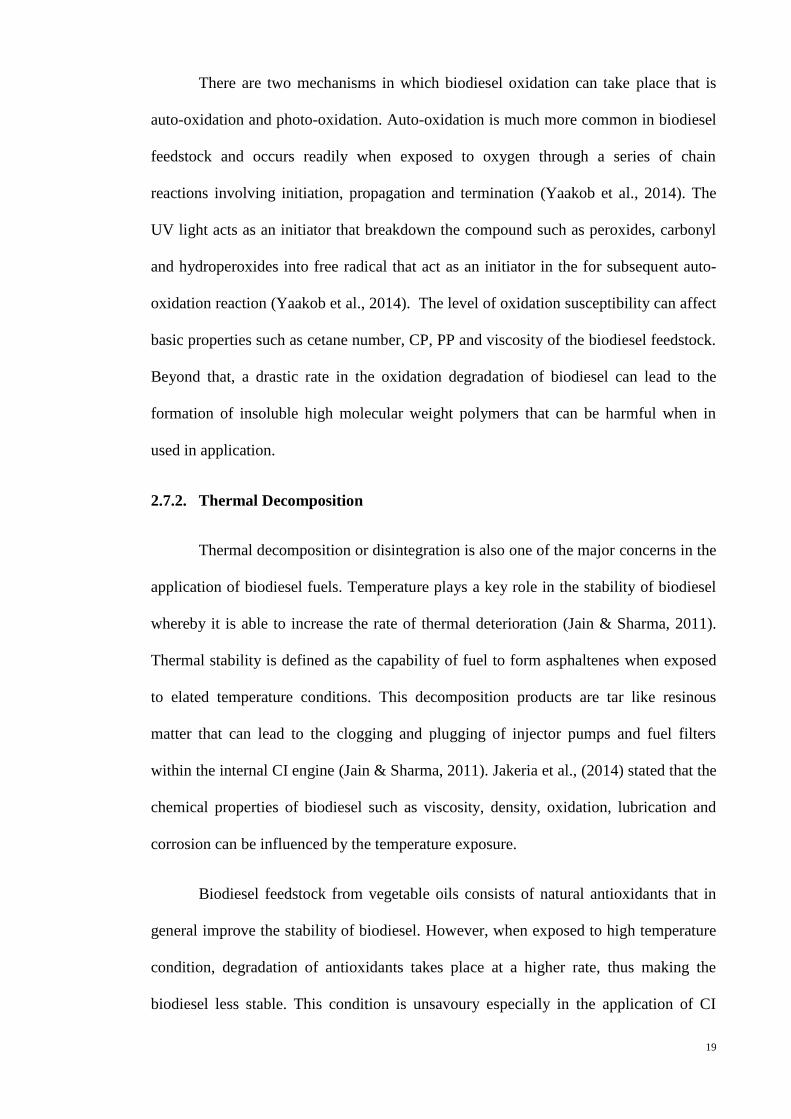
2.7.2. Thermal Decomposition
Thermal decomposition or disintegration is also one of the major concerns in the
application of biodiesel fuels. Temperature plays a key role in the stability of biodiesel
whereby it is able to increase the rate of thermal deterioration (Jain & Sharma, 2011).
Thermal stability is defined as the capability of fuel to form asphaltenes when exposed
to elated temperature conditions. This decomposition products are tar like resinous
matter that can lead to the clogging and plugging of injector pumps and fuel filters
within the internal CI engine (Jain & Sharma, 2011). Jakeria et al., (2014) stated that the
chemical properties of biodiesel such as viscosity, density, oxidation, lubrication and
corrosion can be influenced by the temperature exposure.
Biodiesel feedstock from vegetable oils consists of natural antioxidants that in
general improve the stability of biodiesel. However, when exposed to high temperature
condition, degradation of antioxidants takes place at a higher rate, thus making the
biodiesel less stable. This condition is unsavoury especially in the application of CI

20
engine, where high temperature condition is unavoidable (Jain & Sharma, 2011). A
study on the oxidative and thermal stability of biodiesel during frying was conducted by
comparing the quality of soybean oil (SO) and a blend of soybean: palm (6:4) (MO) at a
temperature of 180°C for 12 hours. The results indicated that the increase in the
temperature led to the formation of higher weight molecules that causes an increase in
the viscosity of biodiesel for both types of feedstock. However, it is seen that SP
biodiesel exhibits a higher viscosity when compared to SO biodiesel. This could be due
to the lower level of anti-oxidants present in the MO biodiesel blend, leading to a higher
decomposition rate of biodiesel (Nzikou et al., 2009).
The result also shows a decrease in linoleic acid content, with an increase in
polar compounds within the biodiesel for both types of feedstock as the frying
temperature increase. Linoleic acid contributes to the highest percentage of
polyunsaturated fatty acids in the feedstock and is more susceptible to oxidation
degradation. Polar compounds on the other hand represent the oxidation products due to
high temperature exposure (Nzikou et al., 2009). It was concluded that the decrease in
linoleic acid content as a results of lipid oxidation, and increase in the percentage of
polar compound is correlated with the increasing temperature of biodiesel. The results
show that higher degradation rate is exhibited by MO feedstock when compared to SO
feedstock (Nzikou et al., 2009).
Many other researches have also gained similar findings, concluding that the
increase in the operating temperature affects the viscosity, peroxide and acid value
within the biodiesel (Jain & Sharma, 2011; Jakeria et al., 2014; Nzikou et al., 2009).
Therefore, it is highly necessary to analyse and understand the effects of temperature
towards the performance and stability of biodiesel as automation fuel.

21
2.7.3. Storage Stability
Storage stability of biodiesel is a concern where prolonged duration of biodiesel
storage can affect the primary composition of the fuel. Research has reported biodiesel
is not be used as fuel after 6 months storage period due to deterioration in the biodiesel
stability and may be detrimental in use. There is an increase in properties such as
peroxide and acid value, density and viscosity of biodiesel with increasing storage time
(Jakeria et al., 2014). The storage stability of biodiesel is affected by the level of air
exposure and water content in the feedstock. The degradation rate of biodiesel stored for
a prolonged time at lower temperature is much lower when compared to biodiesel stored
for the same duration of time, at higher temperature. This is due to the induction period
of biodiesel that decreases with the increase in temperature (K. A. Sorate & Bhale,
2015).
A research on the effect of storage time and condition on biodiesel from
vegetable oils and used frying oil after a period of 12 months indicates that there is an
increase in the peroxide value and acid value of all the biodiesel samples (Bouaid,
Martinez, & Aracil, 2007). The increase in acid and peroxide value is due to the
hydrolysis of FAME to fatty acids. The viscosity of all the biodiesel blends also shows
an increment with increase in storage time, whereby initial increment in viscosity only
takes place when the peroxide value has reached a critical level. It was mentioned that
factors such as the water content and level of exposure to air can affect the rate of
biodiesel degradation. In conclusion, a significant deterioration in biodiesel fuel quality
after a period of 12 months. Therefore, precautionary steps such as limiting oxygen,
light and moisture excess during storage of biodiesel and also addition of additives such
as antioxidants and stabilizers can improve the storage life and quality of biodiesel
(Bouaid et al., 2007).

22
2.7.4. Corrosion
Corrosion is one of the major deterioration faced by engine components when in
contact with biodiesel. Biodiesel is seen to exhibit higher corrosive tendencies when
compared to petroleum diesel due to the presence of unsaturated molecules that is prone
to oxidation and decomposition (Singh et al., 2012). The CI engine consists of main
parts that come in contact with the biodiesel fuel. Figure 2.3 shows a typical CI diesel
fuel engine system and its commonly material selection for the components. The critical
parts comprises of the fuel assembly that includes fuel tank, pump, lines, filters and its
injector cylinder. The level of corrosion within the CI engine depends on the type of
alloy in contact with the biodiesel fuel and also the biodiesel composition such as level
of unsaturation, FFA content, and also hygroscopic nature of the biodiesel (Singh et al.,
2012).
Figure 2.3: CI fuel engine system with common material selection (K. Sorate & Bhale,
2013)
Corrosion is an important aspect of assessment for the widespread use of
biodiesel as automation fuel as many of the components in the existing CI engine

23
configuration consist of metal such as cast iron, stainless steel, aluminium, copper and
copper alloys and also elastomers (Singh et al., 2012). Therefore, it is important to
monitor effects of factors such as water retention, auto-oxidation, and microbial activity
during storage that can lead to increase in corrosion rate of the exposed components.
Other than that, the hygroscopic nature of biodiesel that is prone to water absorption and
retention can lead to increased hydrolysis of the ester chemical bonds, this forming a
higher amount of FFA (K. Sorate & Bhale, 2013).
2.7.5. Wear and Friction
Wear is defined as the material degradation or loss in thickness due to friction
when sliding motion between two surfaces (Fazal, Haseeb, & Masjuki, 2014). The
combination effect of wear and corrosion in biodiesel fuel leads to an inter-related effect
and is commonly known as tribo-corrosion. The deposit formed from the action of
corrosion activity over time is capable to reduce the lubrication characteristics of
biodiesel at sliding points, thus increasing abrasion action, leading to engine component
damage (Fazal, Haseeb, et al., 2014). It is known that biodiesel exhibits better lubricity
properties when compared to diesel, however factors such as auto-oxidation, corrosion
and hygroscopic nature of biodiesel, can influence the wear and friction characteristics,
thus altering the chemical properties of biodiesel (Fazal, Haseeb, & Masjuki, 2011a). It
has been reported that biodiesel shows better lubrication and wear resistance during
short term test, but it tends to lose its lubrication characteristics under long term
condition, thus making it more susceptible to wear and friction. Therefore, it is
important to study and understand the tribo-corrosion phenomena of biodiesel fuel for
both long and short term condition in a typical CI engine. Engine components that are
commonly effected by tribo-corrosion action are cylinder liners, pistons and piston pins
and the valve assembly (Fazal et al., 2011a).

24
Many researches have shown that there is no significant change in wear
characteristics when compared between biodiesel and diesel fuel (Fazal et al., 2011a;
Fazal, Haseeb, et al., 2014). It is seen that biodiesel with appropriate level of FFA,
monoglycerides, and polyglycerides can improve the lubrication and wear resistance
properties; however, an increase beyond that level can lead to deterioration due to
oxidation and corrosion. A distinct decrease of wear was seen at the range of 10–20%
biodiesel (Fazal, Haseeb, et al., 2014). Research has shown that biodiesel blend B20 is
capable to demonstrate physical wear reduction up to 30% lesser when compared to
diesel fuel engine. Injector cocking and carbon deposit accumulation was also seen to be
much lesser in the biodiesel fuelled engine (Agarwal, 1999). The lower increase in
density of biodiesel fuel when compared to the density of diesel fuel also indicates that
lesser degradation and wears contamination in the biodiesel fuel. Based on this research,
it can be concluded that the wear and friction characteristics of biodiesel is correlated to
the lubrication properties of its fuel, which is tied up to the level of unsaturated
molecules and FFA content in the biodiesel feedstock (Agarwal, 1999).
2.7.6. Economical Capability and Acceptance of Biodiesel
Biodiesel exhibits its own advantages and also disadvantages when considered
to be applied as automation fuel. Certain detrimental properties such as its high
viscosity and FFA content, polymerisation tendencies, moisture absorption and
oxidation instability together with its high corrosive nature of biodiesel leads to the
requirement for detailed and precise assessment on the short and long term durability to
the CI engine prior utilization. The economic viability of biodiesel is also a factor that
leads to the limitation use of biodiesel. Biodiesel is known to be more expensive than
conventional petroleum diesel (Atabani et al., 2012; Balat & Balat, 2008). The cost of
biodiesel in developing countries is 1.5 to 3 times higher when compared to the prices

25
of petroleum diesel, thus making it less practical in terms of economic viability
(Atabani et al., 2012).
Atabani et al., (2012) stated that costs of primary feedstock and its processing to
biodiesel comprise the two main segments of cost expenditure. Approximately 80% of
the total production cost of biodiesel is allocated for the feedstock (Balat & Balat,
2008). Additional production cost is then required for the use of methanol, catalyst and
labour in the biodiesel processing technology. Therefore, it was emphasised that proper
selection of biodiesel feedstock is crucial in order to ensure low capital expenditure.
Non-edible oils as feedstock has been recommended as a better choice in terms cost
value. Other than that, the production cost due to biodiesel transesterification
technology can be reduced by practising continuous transesterification process, thus
providing a higher production capability with reduced reaction time. It is also
recommended for biodiesel plants to have its own glycerol recovery service line, in
order to ensure recovery of high quality glycerol that acts as an additional income to the
main processing facility (Atabani et al., 2012).
In conclusion, more research and development emphasising on biodiesel
feedstock cost, production and processing technology, properties and its effects to CI
engine needs to be conducted in order to improve its economic feasibility and also to
ensure the continuous growth and widespread expansion of biodiesel and it's blends as
automation fuels.
2.8. Material Selection for a Typical CI Engine System
A typical CI engine system consist of three sub-assembly that is the fuel feed,
combustion and the exhaust system (Haseeb et al., 2011). The basic scematic of a CI
engine process flow is as shown in Figure 2.4. The fuel flowing in the CI engine comes
in contact with various types of material selected for the internal emgine components.

26
These material can be divided into metallic and non-metallic materials that includes
ferrous materials such as carbon steel, stainless steel and cast-iron together with non-
ferrous material such as aluminium, copper and copper aloys. Elastomers and plactics
are classified under non-metallic material.
Figure 2.4: Typical process flow of CI engine (Haseeb et al., 2011)
Table 2.1 shows the common materials selected for the respestive components
and systems in a CI engine. Based on the selected materials, it is seen that the fuel
comes in contact with these materials at different stages and process in the CI engine
and will be with different chemical properties due to the changes in the operating
condition and process based on the respective sub-section (Haseeb et al., 2011).
Therefore, it is important to understand the effects of biodiesel towards respective
material categories in the CI engine. In general, it is seen that various materials react
differently in terms of corrosive characteristics and wear degradation when in contact
with biodiesel fuel. It is also important to determine the most compatible biodiesel
blends that is able give the excellent corrosion properties by reducing metal loss and
preventing degardation of biodiel fuels when in contact with the respective metals.

27
Table 2.1: Material selection in the construction of typical CI engine components and
systems (Haseeb et al., 2011)
2.9. Corrosion of Ferrous Metal in Different Biodiesel Blends
An experiment testing the integrity of carbon steel specimens was conducted by
using standard 1 in. by 1 in. of low carbon steel (ASTM 36) immersed in two B100
biodiesel blends derived from soy oil and animal fat and two types of petroleum diesel
consist of 7 ppm and 4000 ppm sulfur content respectively (Grainawi, Jakab,
Westbrook, & Hutzler, 2008). The corrosion behaviour was measured through the use
of an electrochemical impedance spectroscopy (EIS) whereby the samples were
partially immersed in the fuel blends to measure the corrosion activity at the air/fuel
interface. The impedance signal is used to measure the conductivity of cell across two
electrodes, whereby one electrode acts as the reference electrode while the other acts as
the working electrode. The impedance spectrum was recorded weekly for a 90-days

28
exposure period. The test involves various fuel blends and combination of biodiesel and
petroleum diesel.
The results upon 90-day period indicated that there was no significant corrosion
activity measurement. The visual inspection indicated small traces of surface rusting
due to the reaction between the surface oxide layer and the fuel blend. The results also
indicated that the corrosion activity was more significant in carbon steel specimen
immersed in animal-fat biodiesel when compared to soybean biodiesel blend.
Substantially higher corrosion rate was also observed in fuel blend with 5% animal-fat
biodiesel and 95% petroleum diesel with 7ppm sulfur content (Grainawi et al., 2008).
This is due to animal fats and waste cooking oils that contain larger amount of FFA
when compared to vegetable oils, thus making the biodiesel feedstock more instable and
susceptible to corrosion. It was mentioned that crude vegetable oil contains 0.3 to 0.7%
of FFA content while animal fat contains 5-30% FFA content (Karmakar et al., 2010).
An experiment studying the corrosion properties of carbon steel grade A765,
and stainless steel grade SS 304 under the influence of microorganisms was conducted
using diesel fuel (B0), biodiesel fuel (B100) and biodiesel blends, B5, B20, B35 and
B50 (Kamiński & Kurzydłowski, 2008). The finding shows that there is a significant
effect with the addition of microorganism on the total acid number (TAN) of fuels with
increasing biodiesel content. In other word, it is seen that the microbiological activity is
highly affected by the content of FAME in the fuel whereby there is a drastic increase in
the TAN number for B35, B50 and B100 biodiesel blends. It was also seen that the
viscosity of the biodiesel fuel is not influenced by the addition of microorganisms to the
fuels. This shows that the viscosity factor of the fuel mainly depends on the FAME
content where the viscosity for fuels with and without addition of microorganism,
shows an increasing trend from B 20 to B100 (Kamiński & Kurzydłowski, 2008). The
comparison is as shown in Figure 2.5.

29
Figure 2.5: Comparison of TAN and viscosity of fuels with (+) and without (-) additon
of microorganism (Kamiński & Kurzydłowski, 2008)
Maru et al., (2009) tested the corrosion behaviour of 3 different types of fuels,
that is petroleum diesel with 870 ppm sulfur content (D), soybean (SB) and sunflower
(SF) derived biodiesel when in contact with carbon steel and high density polyethylene
(HDPE). The immersion test was carried out for a period of 60 and 115 days with
carbon steel specimen and 75 and 125 days for polymer specimen. The test temperature
was manintained at a temperature of 60 °C (Maru et al., 2009). The weight loss
measurement after 115 days indicated that the weight reduction of carbon steel exposed
to biodiesel is higher when compared to diesel. Furthermore, it is also seen that the
sunflower biodiesel is much more reactive to the metal when compared to the soybean
biodiesel. It was said that the difference in the corrosion activity of biodiesel feedstock
is higly due to the variation in the primary chemical composition of the feedstock.
Similar findings by other researchers also shows that carbon steel is highly reactive and
not compatible in the biodiesel environment (Ortega et al., 2013).
The storage stability of soybean biodiesel in contact with carbon steel and
galvanised steel has been studied by Fernandes et al., (2013). The experiment also
measured the effects of additions, tert-butyl-hydroquinone (TBHQ) that functions as
antioxidants to overcome the low oxidation stability of biodiesel. The findings indicated

30
that the peroxide value of biodiesel in contact with carbon steel increased throughout
the immersion period, but the peroxide value of galvanised steel only shown increment
upon 84 days of exposure. Increasing exposure time also tends to increase the TAN in
the biodiesel fuel, proving that corrosion activity increases with the formation of
organic compound. Analysis on galvanised steel shows that there is a substantial
amount of zinc in the diesel exposed to galvanised steel recorded since the first day of
immersion (Fernandes et al., 2013). This indicates the occurrence of corrosion activity
due to the presence of free-water content in the biodiesel feedstock. On the other hand,
the addition of antioxidant TBHQ has shown to decrease the corrosion rate of
galvanised steel with no zinc indicated in the biodiesel feedstock even after a period of
12 weeks. It was concluded that antioxidant TBHQ was being consumed in the
biodiesel environment thus preserve the metal from deterioration during immersion
period (Fernandes et al., 2013).
An experiment studying the corrosion characteristics of copper, aluminium, and
stainless steel in the presence of palm oil biodiesel and diesel have been conducted at
80°C for 600 and 1200 hours (Fazal, Haseeb, & Masjuki, 2010). The results, as per
shown in Figure 2.6, indicates that the corrosion activity in stainless steel is the least
when compared to aluminium and copper samples, while copper exhibits the highest
corrosion rate in both diesel (B0) and palm oil biodiesel (B100). There is also no
significant change in the surface morphology of the 316 stainless steel sample when
observed under microscopy. Stainless steel generates an invisible, exceedingly thin,
passive film of chromium oxide that is formed on the surface of the material to protect it
against the onset of corrosion and also other forms of contamination such as leaching.
The protective oxide layer causes stainless steel to undergo very little leaching when
compared to carbon steel. Therefore, stainless steel, namely Type 304L is very
compatible in the biodiesel environment (Torsner, 2010). Other research has also

31
mentioned that stainless steel and aluminium are metallic materials that is compatible
and recommended in the use with biodiesel, partly due to the formation of protective
passive film on the metal surface (Ortega et al., 2013).
Figure 2.6: Corrosion rate (mpy) for SS, Al and Cu sample immersed in biodiesel
(B100) and diesel (B0) for (a) 600 hours and (b) 1200 hours (Fazal et al., 2010)
An experiment assessing on the corrosion rates of carbon steel together with
aluminum, copper and bronze was conducted by immersing the sample material for a
period of 100h in 200 ml of biodiesel (B100), biodiesel (B99) and NaCl (1%) solution
and NaCl (3%) solution individually (Meenakshi, Anisha, Shyamala, Saratha, &
Papavinasam, 2010). Figure 2.7 shows the corrosion rate measurement (mpy)
comparison between all the three immersion samples for the first 24 hours. The results
indicate that carbon steel shows lower corrosion rates in biodiesel when compared to
that in NaCl solution. The addition of 1% NaCl was also found to increase the corrosion
rate of the sample, while the highest corrosion rate was seen in the sample with NaCl
medium. A commercial conductivity meter was also used to measure the conductivity of
the solutions before and after exposure of carbon steel coupons. The measurements
indicate that the conductivity of biodiesel blend solutions in contact with carbon steel
increases after upon complete immersion period (Meenakshi et al., 2010).

32
Figure 2.7: Deterioration trend of carbon steel as a function of time measured by LPR
Method (Meenakshi et al., 2010)
The effect of temperature on the corrosion activity of biodiesel in contact with
mild steel was experimented at three temperatures that is room temperature, 50°C and
80°C (Fazal, Haseeb, & Masjuki, 2011c). The mild steel samples were immersed in a
solution of B0, B50 and B100 for 1200 hours, upon which the corrosion rate was
calculated through weight loss measurements. The findings indicated that the corrosion
rate of in each fuel increases with increasing temperature, however, biodiesel (B100)
shows the highest corrosion rate followed by biodiesel blend B50 and least corrosion
was seen in diesel (B0) solution (Fazal et al., 2011c).
Elemental analysis on the samples, before and after immersion also shows that
there is an increase in the oxygen content with the increase in immersion temperature.
The presence of oxygen was not detected on the as received sample but sample exposed
to biodiesel (B100) at room temperature increases the oxygen content to 5.33 wt%,
while the sample exposed to biodiesel at 80°C shows the highest content of oxygen with
10.04 wt% (Fazal et al., 2011c).The hygroscopic nature of biodiesel tends to increase
with increasing temperature. The as-received biodiesel solution does not show any
presence of water; however, there was an indication of increasing percentage of water in

33
biodiesel solution from immersion temperature 27°C to 80°C that is 0.30% to 0.36%
respectively. The increasing temperature also has the tendency to increase the oxidation
rate and TAN of the sample. It was concluded that exposure of mild steel in biodiesel
leads to oxidation instability, with higher corrosion activity and is further accelerated
with increasing temperature of the immersed solution (Fazal et al., 2011c).
2.10. Corrosion of Non-Ferrous Metal in Different Biodiesel Blends
Copper is one of the highly applied materials in automotive components
especially for the fuel pump components. However, many published research shows that
biodiesel causes enhanced corrosion activity and rapid degradation in copper base
components within the CI engine (Fazal et al., 2010; Ortega et al., 2013). An
experiment investigating the behavior of copper in palm biodiesel was carried out by
immersing copper (99.9%, commercially pure) in palm biodiesel (B100) for 200, 300,
600, 1200 and 2880 h of immersion period (Fazal, Haseeb, & Masjuki, 2013).
The experiment results for an immersion periods of 200 to 2880 hours shows
that there is an increase in the corrosion rate up to a maximum rate at 600–1200 h
immersion time and decreases gradually. This decrease is due to the increasing
thickness of corrosion products on the copper surface, tends to decrease the area of
contact for corrosion activity, thus reducing the corrosion rate of the sample. An
interesting finding in this research also shows that there is a difference in the appearance
of test coupons before and after exposure to biodiesel for different periods. As shown in
Figure 2.8, the appearance if the bluish-green colour is firstly seen around the edges of
the sample. It is found to increases upon increase in the immersion time of the sample,
which finally covers the entire surface of the sample in a strong greenish colour. This is
due to the conversion of copper compound on the surface of the sample, whereby the

34
increase in the immersion time increases the thickness of the corrosion product (Fazal et
al., 2013).
The SEM micrograph results shows that there are formations of small pits
randomly on the surface of the sample exposed in the biodiesel environment for 200h.
The pits are also found to increase in size with the increase in immersion time.
Elemental analysis through EDS also shows that there is an increase in the oxygen and
carbon content with the increase in immersion time of copper in biodiesel due to
oxidation reactions (Fazal et al., 2013).
Figure 2.8: Deterioration trend of copper sample exposed to palm biodiesel for different
immersion time (Fazal et al., 2013)
Copper and copper alloys are highly reactive and more prone to degrade in the
biodiesel environment. Copper and copper alloys are susceptible to pitting and also
discoloration due to the formation of oxide species (Fazal et al., 2013; Geller, Adams,
Goodrum, & Pendergrass, 2008). Brass coupons show a lesser extent of corrosion rate
in comparison to copper yet with similar corrosion patterns. Copper coupons in contact

35
with 20% biodiesel solution shows a higher percentage of weight loss, that is 0.71%,
while increasing biodiesel content to 80% gives a slight increment in the weight loss,
that is 0.74% (Geller et al., 2008). Brass coupons are less reactive in lower
concentration of biodiesels where weight loss of the samples exposed to 20% biodiesel
was an average of 0.46% while those exposed to 80% biodiesel lost approximately
0.74% weight. Therefore, it was mentioned that copper and /or brass components should
be replaced with steel based materials as it may affect the storage, transport, quality and
utilization of the biodiesel (Geller et al., 2008).
The performance of leaded bronze in comparison to copper in palm oil solution
was investigated by immersing of copper (99.99% commercially pure) and leaded
bronze (87% Cu, 6% Sn, 6% Pb) in three solution, B0, B50 and B100 at two different
immersion temperatures that is room temperature and 60 °C. Figure 2.9 shows the
corrosion rate measurement, for the respective samples at different immersion
temperature (Haseeb, Masjuki, Ann, & Fazal, 2010). Based on the results, it is seen that
the corrosion rate of copper and leaded bronze in biodiesel is higher when compared
with diesel in all solutions (Haseeb et al., 2010).
It is also seen that leaded bronze is less reactive and more compatible in diesel
and biodiesel environment as compared to copper. Further analysis also shows that
copper tends to form oxide on its surface in B100 at room temperature, while it turns
into black at 60 °C. For leaded bronze, test coupons at 60 °C is cleaner and more
shining compared with those tested at room temperature. The TAN assessment also
shows that there is an increase in the TAN value of biodiesel upon exposure, whereby
the increment is found to be similar in both copper and leaded bronze immersed
solution. It was also found that the oxidation product increases with increasing biodiesel
percentage in the solution (Fazal et al., 2013; Haseeb et al., 2010).
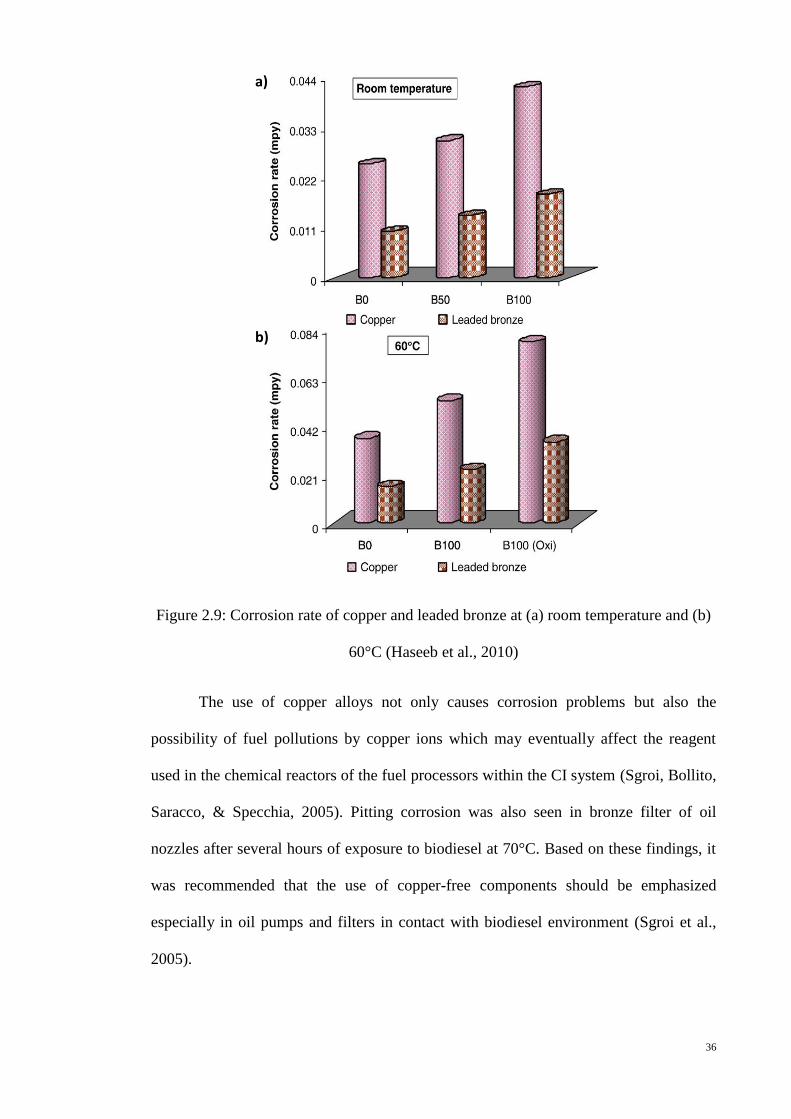
36
Figure 2.9: Corrosion rate of copper and leaded bronze at (a) room temperature and (b)
60°C (Haseeb et al., 2010)
The use of copper alloys not only causes corrosion problems but also the
possibility of fuel pollutions by copper ions which may eventually affect the reagent
used in the chemical reactors of the fuel processors within the CI system (Sgroi, Bollito,
Saracco, & Specchia, 2005). Pitting corrosion was also seen in bronze filter of oil
nozzles after several hours of exposure to biodiesel at 70°C. Based on these findings, it
was recommended that the use of copper-free components should be emphasized
especially in oil pumps and filters in contact with biodiesel environment (Sgroi et al.,
2005).
a)
b)

37
Edible oils face the problem of high feedstock cost and affect the food storage,
supply and demand trend when is increased in utilization as biodiesel production
feedstock. Therefore, non-edible oils such as Pongamia pinnata, Calophyllum
inophyllum, Madhuca indica and Jatropha curcas are widely investigated as a
replacement for biodiesel feedstock (Karmakar et al., 2010; Meenakshi et al., 2010; Ong
et al., 2011). An experiment comparing corrosion rate of copper and brass in contact
with Pongamia pinnata oil (B100) shows that the corrosion rate of copper is much
higher when compared to brass in contact with biodiesel for an immersion period of 100
hours. It was explained that brass is mainly the alloy of copper and zinc, making it more
resistant to corrosion activity. The conductivity measurement of solution upon complete
immersion also shows that brass exhibits lower conductance value as compared to
copper. This indicates that there is a higher increase in the ionic content in copper
biodiesel solution as a result of the increased corrosion activity (Parameswaran, Anand,
& Krishnamurthy, 2013).
An experiment evaluating the influence of light intensity and temperature on the
corrosion activity of brass and copper samples was conducted by immersing the
samples for duration of 5 days in commercial biodiesel (B100) at room temperature, in
the presence and absence of light. The immersion was also carried out in an oven set to
55°C, in order to simulate the condition of no light (Aquino, Hernandez, Chicoma,
Pinto, & Aoki, 2012). The results shows that the condition with presence or absence of
light incidence at room temperature gives similar corrosion rate to both copper and
brass, with a slightly higher indication of corrosion under the presence of light.
However, it was seen that the condition in the absence of light and higher temperature
(55°C), shows a drastic decrease in the corrosion rate measured for both copper and
brass sample. It was explained that the limitation to oxygen absorption and
replenishment at higher temperature limits the corrosion rate activity in the immersed

38
sample (Aquino et al., 2012). Induction period measures the duration leading to
oxidative degradation of biodiesel. The optimum condition with least corrosion rate
however contradicts with the optimum condition for storage stability of biodiesel. It is
seen that based on the induction period and viscosity measurement, the absence of light
and at room temperature is most suitable condition for the storage of biodiesel (Aquino
et al., 2012).
Further study on the relationship between immersion time and fuel stability was
conducted by comparing the fuel properties and palm oil composition after immersion
of mild steel and copper sample for a period of 20, 40 and 60 days (Fazal, Jakeria, &
Haseeb, 2014). The GC (gas chromatography) analysis of the fuel upon immersion
shows that methyl oleate is the major constituent of palm oil biodiesel. However, it is
seen that there is a drastic and continuous reduction of methy oleate in copper exposed
solution, within the 20 to 60 days duration, giving a final amount of 24.62% methy
oleate in the solution when compared to the initial 46.16% methy oleate before
immersion. Mild steel however shows a much lesser reduction with a final amount of
42% methy oleate after 60 days of immersion. Methyl oleate is an unsaturated
component providing oxidation sites such as double bonds that offers more reaction
sites for a metal ion leading to oxidation degradation of biodiesel. It is seen that copper
has a higher tendency to react with these sites when compared to mild steel, thus
leading to reduction of methy oleate in the solution (Fazal, Jakeria, et al., 2014).
It was also seen that copper affects the instability of the biodiesel solution giving
it a lower induction period when compared to mild steel biodiesel solution. It was stated
that the induction period decreases with the decrease in the methy oleate content, thus
affecting the fuel properties of copper in biodiesel. Copper immersed biodiesel also
shows a higher kinematic viscosity, water content and TAN of the solution when
compared to mild steel immersed biodiesel. This is associated with the higher corrosion
39
rate exhibited by copper in comparison to mild steel. The EDS analysis also shows that
there is a higher content of oxygen detected on the copper sample surface than that of
mild steel. This implies that there are more oxides in the copper surface, and also inside
the corrosion pits. The increase in immersion time also tends to increase the oxygen
content detected on the sample surface (Fazal, Jakeria, et al., 2014).
A research studying the effect of biodiesel fuel made from rapeseed oil and
methanol on common automotive materials was conducted on copper, mild carbon steel,
aluminum and stainless steel material (Hu, Xu, Hu, Pan, & Jiang, 2012). The findings
are in line with other researches in the field, stating that corrosions of copper and mild
carbon steel were more severe than those of aluminum and stainless steel in biodiesel.
This is attributed to the reactivity and oxidation of both copper and mild steel. Minor
corrosion effects were seen in aluminum and stainless steel, similar to those of diesel.
This may be due to the formation of films of metal oxide, which prevents metal
oxidation, thus giving lower corrosion rates.
However, the corrosion rates of all four metals are still lower in diesel when
compared to biodiesel environment. This is attributed to the higher amount of saturated
fatty acids in diesel, giving it a better stability when compared to biodiesel. It was also
seen that there is a higher percentage of oxygen and carbon elements on the corrosion
oxide layer of biodiesel. It was stated that the reaction between metal oxides and fatty
acids of biodiesel leads to the production and adherence of reaction salts on the surface
of the exposed metals. This leads to the increase in oxygen and carbon content detected
on the biodiesel immersed samples (Hu et al., 2012).
Much research comparing the overall performance of various material in contact
to biodiesel has been conducted across the globe. This is an essential comparison as the
components within a CI engine consist of both ferrous and non-ferrous metals, with

40
different corrosion reaction and stability towards biodiesel. A study comparing the
corrosion deterioration and oxidation stability of common automotive component
materials such as aluminum, copper and stainless steel, brass and cast iron in both
petroleum diesel and palm biodiesel shows that aluminum is the most compatible
material among the non-ferrous materials showing the least difference in corrosion rates
between diesel (B0) and biodiesel (B100) environment. The corrosion measurement of
the tested sample is as shown in Figure 2.10. The decomposition of biodiesel produces
copper and iron ions that tend to further activate various other chemical reactions
(Fazal, Haseeb, & Masjuki, 2012).
Figure 2.10: Corrosion rate of copper and leaded bronze at (a) room temperature and (b)
60°C(Fazal et al., 2012)
An experiment evaluating the corrosion behaviors of aluminum, copper and mild
carbon steel exposed to sunflower biodiesel (B100), biodiesel blend (B20) and
conventional petroleum diesel (B0) was conducted at room temperature and 60◦C for
3000 hours (Cursaru, Brănoiu, Ramadan, & Miculescu, 2014). It is noted that the
increase in temperature, increase the corrosion rate. This can be attributed to the TAN
factor. High TAN factor in biodiesel is due to the formation of free fatty acid in the

41
solution. The experimental research indicates that increase in the immersion
temperature, causes the TAN factor to increase in the biodiesel and consequently, the
oxidation of metal in the biodiesel environment increases (Cursaru et al., 2014). Figure
2.11 shows the experimental results indicating that the corrosion activity increase from
aluminum to mild carbon steel to copper.
Figure 2.11: Corrosion rate for aluminum (Al), copper (Cu) and mild carbon steel
(MCS) (a) at room temperature and (b) at 60 ◦C (Cursaru et al., 2014)
The increase in temperature leads to higher oxygen content and moisture
adsorption which eventually gives a higher corrosion rate. The SEM observation
indicates the formation of pits on the surface of copper and mild steel upon exposure to
biodiesel at room temperature and intensifies at exposure of 60◦CThe corrosion rate of
all metals shows similar observation in regards of lower corrosion rate in diesel when
compared to biodiesel. As seen in various researches, copper tends to exhibit higher
a)
b)

42
corrosion rate when compared to other materials under the same condition (Fazal et al.,
2012; Geller et al., 2008; Haseeb et al., 2010). The present research studies the
behaviors of copper based alloy phosphorus bronze in the presence of biodiesel and its
blends. However, significant and published research on this scope is not available yet.
2.11. Additives and its Effects on Biodiesel Blends
Many research has shown that the compatibility of biodiesel to the selected
materials, namely ferrous and non-ferrous materials within a conventional CI engine is
still very much poor in performance when compared to diesel fuel. Therefore, it is
highly necessary to develop an alternative method in order to improve the performance
and quality of biodiesel as a suitable replacement for diesel fuel in the automation
industry. The addition of additives is one of the alternatives that is able to improve the
properties and stability of fuel (Rashedul et al., 2014). There is a vast selection of
additives can be added according to improve specific limits and enhance the properties
of automotive biodiesel. Commonly used additives can be further divided in terms of
the purpose of its addition.
One of the major drawbacks in the use of biodiesel is the deterioration of
oxidation stability of the fuel. Oxidation of biodiesel cannot be completely eliminated
but can be reduced by the addition of antioxidants (K. A. Sorate & Bhale, 2015).
Antioxidants are one of the common additives that functions to inhibit the oxidation
process of biodiesel fuel by intercepting the formation of free radicals, thus, preventing
the initiation of oxidation chain reaction. The oxidation process leads to the formation
of free radical and peroxides within the fuels. The addition of antioxidants tends to
decompose the peroxide formed and acts as free radical traps to retard the biodiesel fuel
oxidation process. Antioxidants are also used to improve the flash point and cetane
number of the biodiesel fuel properties (Rashedul et al., 2014). The naturally formed

43
antioxidant in the biodiesel only partially exists and transferred to the final product after
the transesterification processing technology. Therefore, it is highly necessary to re-
introduce the presence of antioxidants to improve the stability of biodiesel fuels
(Domingos, Saad, Vechiatto, Wilhelm, & Ramos, 2007).
A research was conducted to study effects antioxidant tert-butylhydroquinone
(TBHQ) towards the storage stability of biodiesel (Almeida et al., 2011). The storage
stability of biodiesel with and without the addition of antioxidant was evaluated through
static immersion test with copper corrosion coupons. The result shows that the addition
of antioxidant TBHQ shows higher induction time for the biodiesel fuel of 24 hours
during initial exposure condition. The oxidation stability of biodiesel without the
addition of TBHQ antioxidant shows a period of 6.5 hours. However, both samples
shows similar oxidation trend with prolonged exposure to pro-oxidative condition,
giving an approximate induction period of 2.42 hours after 24 hours. This shows that
the presence of antioxidants retards the corrosion process, by protecting the coupon
surface from corrosion activation sites (Almeida et al., 2011).
Corrosion inhibitors are also considered as effective additives to improve the
corrosion reactivity of biodiesel when in contact with CI engine components (Almeida
et al., 2011). The corrosion protection mechanism involves the formation of an
enduring, resistive layer on the metal surface, thus reducing contact point at the
metal/solution interface (Fazal et al., 2011b). It has been reported that amine based
compounds such as primary amines, diamines, aminoamines, and oxyalkylated amines
are effective corrosion inhibitors in diesel. An experiment investigating the performance
of three common corrosion inhibitors, ethylenediamine (EDA), n-butylamine (nBA),
tert-butylamine (TBA) was conducted on cast iron in contact with palm oil biodiesel
(Fazal et al., 2011b). The results of corrosion rate calculation shows that all three
addition of corrosion inhibitor is able to reduce the corrosion of cast iron, when

44
compared to corrosion rate of cast iron in biodiesel without corrosion inhibitor additive.
The effectiveness of corrosion inhibitor is as shown in Figure 2.12, with decreasing
performance from EDA>TBA>nBA (Fazal et al., 2011b).
Figure 2.12: Corrosion rate of cast iron in the presence of palm oil biodiesel with and
without addition of corrosion inhibitor (Fazal et al., 2011b)
However, further analysis on fuel samples shows that the fuel properties of
biodiesel with EDA addition undergoes greater degradation when compared to fuels
with addition of other corrosion inhibitors. Based on this assessment, it was found that
TBA is most effective in reducing corrosion activity whereby the formation of
protective layer iron nitrite hydrate, prevents oxygen or water contact on the metal
surface, thus eliminating the formation and dissolution of metal oxides. In comparison
of fuel TAN and density, TBA added biodiesel shows an optimum performance due to
the lower amount of corrosion products and sediments formation (Fazal et al., 2011b).
Benzotriazole (BTA) is a well-known corrosion inhibitor used to inhibit
corrosion activity of metals, especially of copper and its alloys (Allam, Nazeer, &
Ashour, 2009). The chemical structure of BTA consist of benzene and triazole rings,
C6H5N3. The structure of BTA with free electrons enables itself to bond on the copper
45
surface, thus preventing the occurrence of corrosion. Many researches has been
conducted to understand the effects of BTA in copper and its alloys exposed to various
condition and environments such as strongly acidic, alkaline and neutral solutions. It
was stated that the performance of BTA is most effective in clean environments,
whereby the presence of pollutants such as sulfide ions, is able to not only retard the
performance of BTA against corrosion of copper and its alloys but also increase the
corrosion rate to a greater level leading to faster metal degradation (Allam et al., 2009).
The inhibition of copper corrosion by addition of BTA mentions that a
protective barrier film, mainly composed of copper and BTA complex, is formed as the
copper surface is penetrated by BTA (Finšgar & Milošev, 2010). This mechanism
prevents the discoloration and staining of copper surface. A study was conducted to
understand the performance of BTA as corrosion inhibitor of archaeological polished
copper and archaeological copper covered with corrosion products exposed to aqueous
polyethylene glycol (PEG) (Guilminot, Rameau, Dalard, Degrigny, & Hiron, 2000).
The result shows that the addition of BTA was less significant for polished copper
samples, whereby the presence of PEG was sufficient to limit the dissolution current of
the polished copper sample. On the other hand, samples covered with corrosion
products were highly affected by PEG, whereby corrosion products degradation
increases with time. Here, the presence of BTA was able to reduce the dissolution
current of the corrosion product, thus protecting the corrosion layer of the copper. It was
seen that the higher protection was achieved with increasing BTA concentration and
immersion time (Guilminot et al., 2000).
An experiment was conducted to study the effect of BTA of various
concentration and velocity towards providing corrosion protection to copper samples
(Khan et al., 2015). The samples were immersed in 3.5% NaCl test solution with and
without the presence of BTA at different concentrations and velocities. The results as
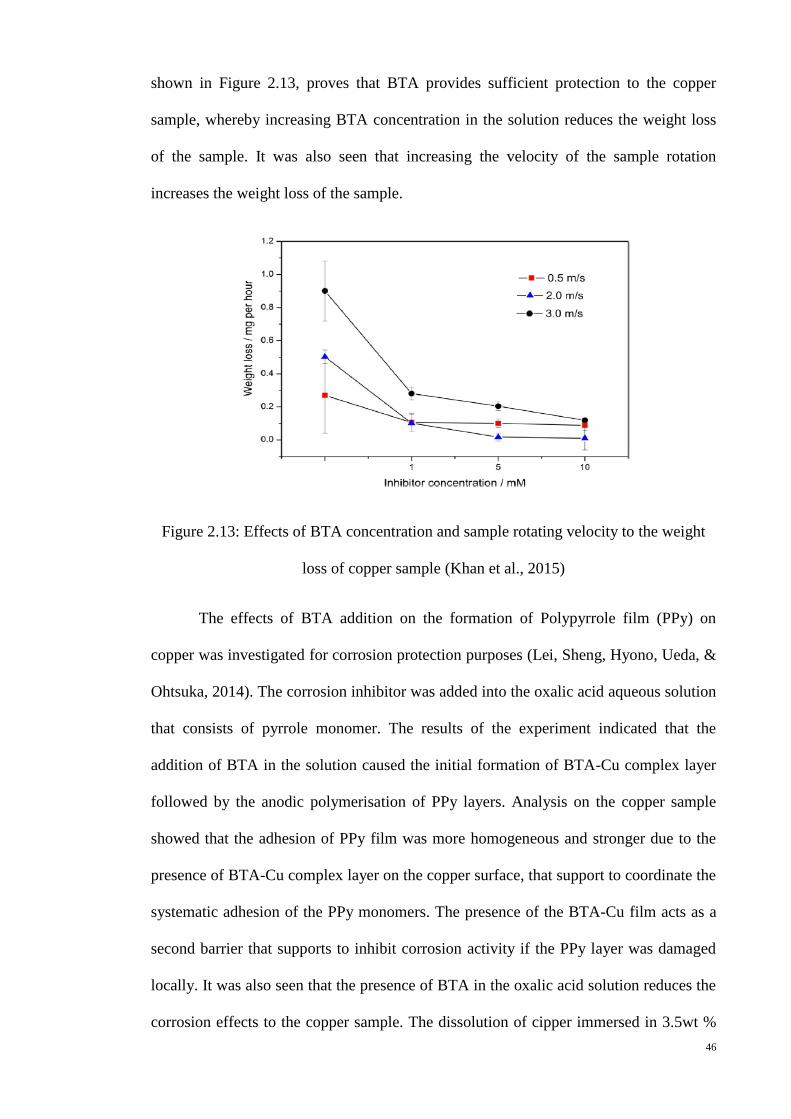
46
shown in Figure 2.13, proves that BTA provides sufficient protection to the copper
sample, whereby increasing BTA concentration in the solution reduces the weight loss
of the sample. It was also seen that increasing the velocity of the sample rotation
increases the weight loss of the sample.
Figure 2.13: Effects of BTA concentration and sample rotating velocity to the weight
loss of copper sample (Khan et al., 2015)
The effects of BTA addition on the formation of Polypyrrole film (PPy) on
copper was investigated for corrosion protection purposes (Lei, Sheng, Hyono, Ueda, &
Ohtsuka, 2014). The corrosion inhibitor was added into the oxalic acid aqueous solution
that consists of pyrrole monomer. The results of the experiment indicated that the
addition of BTA in the solution caused the initial formation of BTA-Cu complex layer
followed by the anodic polymerisation of PPy layers. Analysis on the copper sample
showed that the adhesion of PPy film was more homogeneous and stronger due to the
presence of BTA-Cu complex layer on the copper surface, that support to coordinate the
systematic adhesion of the PPy monomers. The presence of the BTA-Cu film acts as a
second barrier that supports to inhibit corrosion activity if the PPy layer was damaged
locally. It was also seen that the presence of BTA in the oxalic acid solution reduces the
corrosion effects to the copper sample. The dissolution of cipper immersed in 3.5wt %

47
NaCl for 480h was retarded with 80% inhibition efficiency when compared to bare
copper (Lei et al., 2014).
Experiment was also conducted to study the effects of BTA addition as
corrosion inhibitors for brass in chloride solution (Kosec, Milošev, & Pihlar, 2007). The
tested samples includes copper, zinc and copper-zinc alloy, Cu-10Zn and Cu-40Zn. It
was seen that the addition of BTA decreases the corrosion current for all metals tested,
however, highest inhibition efficiency was seen in sample Cu-10Zn. The higher
inhibition efficiency of the sample was due to the formation of copper based alloy
having a better resistance in chloride containing solution. It was concluded that BTA is
an effective corrosion inhibitor for zinc metal as well. The formation of a mixed copper-
zinc protective oxide surface acts as an effective barrier for both metal components in
the copper alloy (Kosec et al., 2007).
Similar conclusion was drawn by other researchers stating that BTA and BTA
derivative corrosion inhibitors such as N,N-dibenzotriazol-1-ylmethylamine (DBMA),
and 2-hydroxy ethyl benzotriazole (HEBTA) are excellent additions for improving
corrosion protection and reducing dezincification of brass. The solution analysis of
brass immersed in NaCl solution, with and without the presence of BTA, shows that the
dissolution of copper and zinc in the solution is lesser when compared to the bulk alloy.
The formation of BTA-Cu complex protective layer controls the rate of metal
dissolution, thus inhibiting corrosion activity on the metal surface and reducing the rate
of metal leaching into the solution (Ravichandran, Nanjundan, & Rajendran, 2004).

48
CHAPTER 3 : METHODOLOGY
3.1. Introduction
The research experiment was carried out in different stages that comprise of
sample preparation and immersion, weight loss measurement and corrosion rate
calculation followed by metal and fuel characterization study. The detailed
methodology is explained in this chapter.
3.2. Material
3.2.1. Phosphor Bronze
Phosphor bronze was produced by Morgan Bronze Products, Inc, and purchased
from a local company. The phosphor bronze (92% Cu, 6% Sn, 0.35% P, 0.30% Zn)
were cut to a size of 29.0 mm diameter and 2.0 mm thickness. The properties of the
coupon are as shown in Table 3.1.
Table 3.1: Properties of Phosphor Bronze
3.2.2. Biodiesel
The commercial palm oil biodiesel used in this research was purchased from
Weschem Technologies Sdn. Bhd. in Batang Kali, Selangor. Biodiesel is used in its
pure form, B100 and also to produce biodiesel blends, B20 and B50. The properties of
the commercial biodiesel are as shown in Table 3.2.
Properties Value
Liquidus Melting Point (ºC) 1049
Solidus Melting Point (ºC) 954
Density at 20 ºC (g/cm3) 8.86
Specific Gravity 8.86
Thermal Conductivity at 20 ºC ( W/m · °K) 69.2
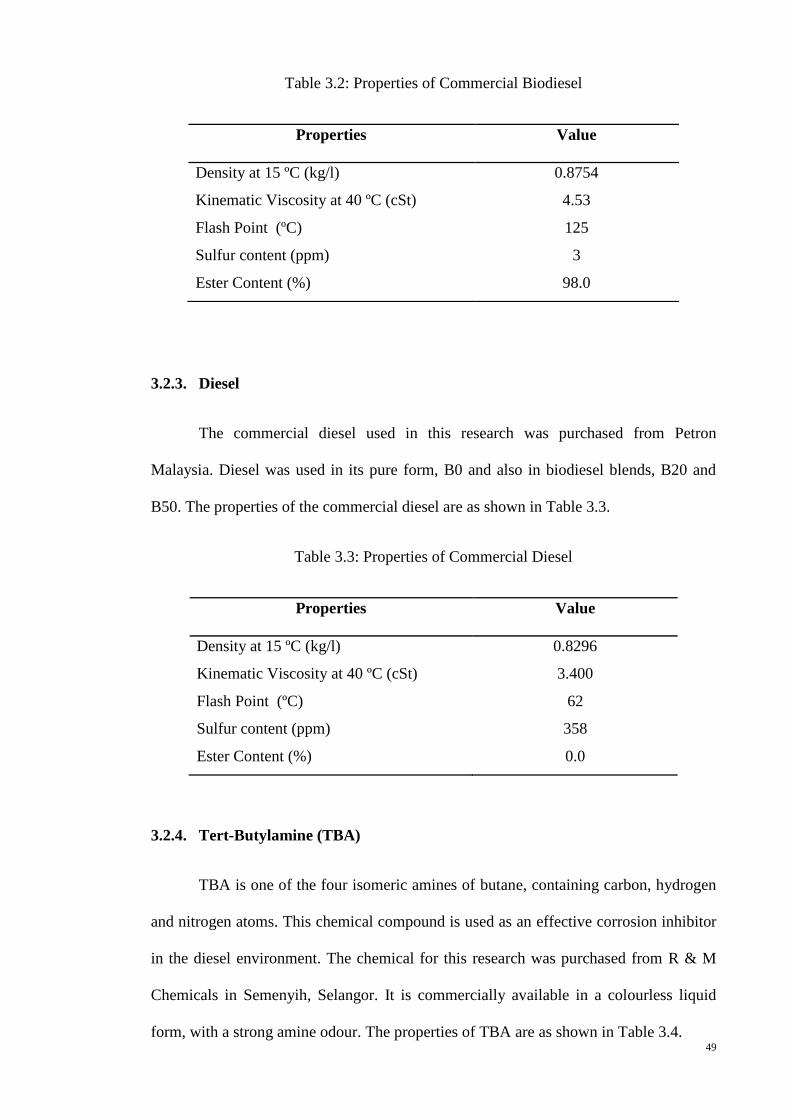
49
Table 3.2: Properties of Commercial Biodiesel
3.2.3. Diesel
The commercial diesel used in this research was purchased from Petron
Malaysia. Diesel was used in its pure form, B0 and also in biodiesel blends, B20 and
B50. The properties of the commercial diesel are as shown in Table 3.3.
Table 3.3: Properties of Commercial Diesel
Properties Value
Density at 15 ºC (kg/l) 0.8296
Kinematic Viscosity at 40 ºC (cSt) 3.400
Flash Point (ºC) 62
Sulfur content (ppm) 358
Ester Content (%) 0.0
3.2.4. Tert-Butylamine (TBA)
TBA is one of the four isomeric amines of butane, containing carbon, hydrogen
and nitrogen atoms. This chemical compound is used as an effective corrosion inhibitor
in the diesel environment. The chemical for this research was purchased from R & M
Chemicals in Semenyih, Selangor. It is commercially available in a colourless liquid
form, with a strong amine odour. The properties of TBA are as shown in Table 3.4.
Properties Value
Density at 15 ºC (kg/l) 0.8754
Kinematic Viscosity at 40 ºC (cSt) 4.53
Flash Point (ºC) 125
Sulfur content (ppm) 3
Ester Content (%) 98.0

50
Table 3.4: Properties of TBA
Properties Value
Molecular Formula C4H11N
Molecular Weight (g/mol) 73.14
Melting Point (ºC) -67.50
Boiling Point (ºC) 43 - 47
3.2.5. Benzotriazole (BTA)
BTA is a heterocyclic compound commonly used as CI in the presence of
copper and its alloys (Finšgar & Milošev, 2010). It contains carbon, hydrogen and
nitrogen atoms. BTA for this research was purchased from a local company where it
was produced by Alfa Aesar. It is commercially available in a white to light tan,
crystalline powder form. The properties of BTA are as shown in Table 3.5.
Table 3.5: Properties of BTA
3.3. Equipment
3.3.1. Metallography Grinding & Polishing Machine
This machine is used to grind the phosphor bronze coupon prior immersion test.
This step is essential in order to remove the scratches and oxide layer. The coupon is
grinded on its entire exposed surface. These layers need to be removed in order to
Properties Value
Molecular Formula C6H5N3
Molecular Weight (g/mol) 119.12
Melting Point (ºC) 100
Boiling Point (ºC) 350

51
ensure the accuracy of the weight loss and corrosion rate measurement of the phosphor
bronze coupon. The silicon carbide grinding paper grade goes from 800 to 1200.
3.3.2. Analytical Balance
This machine is used to measure smaller masses in sub-milligram scale, such as
the weight of phosphor bronze coupon, before and after immersion testing together with
the weight of chemicals and additives added to the fuel. The equipment is shielded in a
transparent enclosure, also known as draft shield with doors to prevent the collection of
dust, contaminants and air current to affect the accuracy of the measurements and its
deviance.
3.3.3. Scanning Electron Microscope (SEM) and Energy Dispersive X-Ray (EDX)
Machine
This machine is used to analyse the image of the phosphor bronze coupon upon
complete immersion and also to study the elemental composition or chemical
characterization of the coupons. The model of the equipment is Hitachi SU1510 SEM &
Horiba EMAX EDX. The SEM analysis was carried out at a magnification of 3000X.
The similar coupon was then subjected for EDX analysis.
3.3.4. Acid Value Tester
This machine is used to determination of the free fatty acid content of animal
and vegetable oils and fats. The model of the machine is G20 Compact Titrator by
Mettler Toledo It quantifies the amount of potassium hydroxide (KOH) in milligrams
that is needed to neutralize one gram of the test solution. The testing takes place by
titration of the test solution with KOH solution, which is a strong basic solution. The
result determines the amount of KOH utilised in the neutralization process thus
indicating the level of acidity in the fuel.

52
3.3.5. Density Meter
This tester is used to determine the density of the fuel. This is a portable density
meter that is lightweight and suitable for on-site measurement. The model of the tester
is DMA 35 by Anton-Paar. The density is measured in units g/cm3 @15 ºC.
3.4. Methodology
3.4.1. Sample Preparation
The phosphor bronze coupons (29.0 mm diameter and 2.0 mm thickness) was
abraded with 800, 1000 and 1200-grit silicon carbide papers in order to remove
scratches and oxide layer. A hole of diameter 0.002 m was drilled near the edge of each
coupon. The cross section of the coupon upon grinding is shown in Figure 3.1.
Figure 3.1: As-received phosphor bronze coupon
Coupons were then washed by deionised water and degreased with acetone. The
initial weight measurement of phosphor bronze coupons was measured prior immersion
using an analytical balance to four decimal points accuracy. The immersion fuels
consist of pure biodiesel, pure diesel and biodiesel blends. Biodiesel blends are
indicated with the letter B and the consequent numbers to the letter B indicates the
biodiesel percentage. In this experiment, the biodiesel blends refers to B20 and B50
fuels. B0 represents pure diesel, while B100 represents pure biodiesel. B20 and B50 on

53
the other hand consist of 20:80 and 50:50 ratio of biodiesel-diesel fuels respectively.
The biodiesel blends were prepared by measuring the specific amount of biodiesel and
diesel required to form a 500ml solution. The specific amount for biodiesel blend is as
shown in Table 3.6. A similar setup of fuels was prepared with biodiesel blends B20
and B100 doped with 500ppm of TBA and BTA corrosion inhibitors respectively.
Table 3.6: Biodiesel Blend Components
Biodiesel
Blend
Biodiesel (ml)
Composition
Diesel (ml)
Composition
Total (ml)
B0 0 500 500
B20 100 400 500
B50 250 250 500
B100 500 0 500
3.4.2. Immersion of Coupons in Different Fuels
The phosphor bronze coupons that has been weight for initial weight
measurement is labelled and tied to thin bamboo sticks using a tie string. The tie is
secured in a hole (diameter 0.002 m) that was drilled in the coupons edge with sellotape
to ensure that the coupons is always in a vertically upright position, while being
immersed completely in the fuel. Sufficient distance is ensured between each coupon to
prevent overlapping. This can reduce the exposed surface area of the coupons. The
setup involves three phosphor bronze coupons tied in a horizontal line, in a single stick
and fitted into the immersion beaker. Three coupons are immersed to obtain a more
precise and accurate averages in the weight loss of coupons upon complete immersion.
The beaker is then tightly closed with aluminium foil to prevent contamination and
moisture from the environment to affect the experimental procedure and results. The
experimental setup is as shown in Figure 3.2.

54
Figure 3.2: Experimental setup for immersion of phosphor bronze coupons
The coupons were immersed in their respective solution for a period of 1440
hours. The experimental setup was stored at room temperature, approximately 25ºC to
27 ºC and relative humidity, approximately 82%.
3.4.3. Weight Loss Measurement and Corrosion Rate Calculation
Upon completion of immersion test, the coupons were inspected visually to
gauge the variation in the physical appearance. The coupons were then cleaned carefully
in a water stream by using a polymer brash in order to remove the corrosion products.
The coupons were dried under a blower and the weight of each coupon after immersion
test was recorded by using an analytical balance to four decimal points accuracy. The
weight loss measurement is applied to determine the corrosion rate of the coupons.
Corrosion rate measurement determines the analytical measurement and extent
of corrosion on the phosphor bronze coupons. The obtained data from weight loss will
be converted into corrosion rate (mpy) by using Equation 1 (Fazal et al., 2010)
Corrosion rate (mpy) = W x 534
D x T x A (1)
Aluminium foil
Bamboo stick
Tie string
Phosphor Bronze Coupons
Beaker (500ml)
Fuel
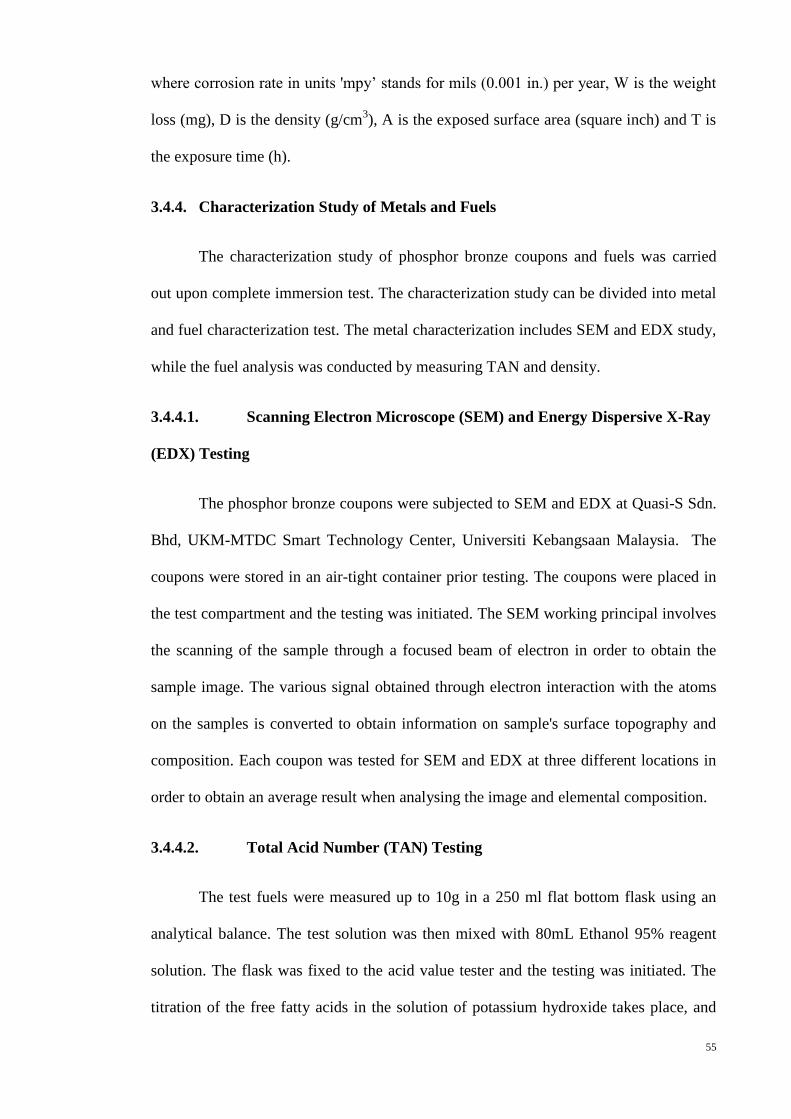
55
where corrosion rate in units 'mpy’ stands for mils (0.001 in.) per year, W is the weight
loss (mg), D is the density (g/cm3), A is the exposed surface area (square inch) and T is
the exposure time (h).
3.4.4. Characterization Study of Metals and Fuels
The characterization study of phosphor bronze coupons and fuels was carried
out upon complete immersion test. The characterization study can be divided into metal
and fuel characterization test. The metal characterization includes SEM and EDX study,
while the fuel analysis was conducted by measuring TAN and density.
3.4.4.1. Scanning Electron Microscope (SEM) and Energy Dispersive X-Ray
(EDX) Testing
The phosphor bronze coupons were subjected to SEM and EDX at Quasi-S Sdn.
Bhd, UKM-MTDC Smart Technology Center, Universiti Kebangsaan Malaysia. The
coupons were stored in an air-tight container prior testing. The coupons were placed in
the test compartment and the testing was initiated. The SEM working principal involves
the scanning of the sample through a focused beam of electron in order to obtain the
sample image. The various signal obtained through electron interaction with the atoms
on the samples is converted to obtain information on sample's surface topography and
composition. Each coupon was tested for SEM and EDX at three different locations in
order to obtain an average result when analysing the image and elemental composition.
3.4.4.2. Total Acid Number (TAN) Testing
The test fuels were measured up to 10g in a 250 ml flat bottom flask using an
analytical balance. The test solution was then mixed with 80mL Ethanol 95% reagent
solution. The flask was fixed to the acid value tester and the testing was initiated. The
titration of the free fatty acids in the solution of potassium hydroxide takes place, and

56
the amount of KOH solution used in the neutralization process is recorded. The final
result indicates the total amount of KOH required to neutralise the fuels. A higher TAN
value indicates a more acidic fuel, with higher number of free fatty acid within the
solution. Therefore, a higher amount of KOH solution is necessary to neutralise the test
solution.
3.4.4.3. Density Testing
The filling tube is connected to the density meter. The pump level on the density
meter is pressed down and held, while the filling tube is submerged in the fuel. The
pump level is then slowly released, as fuel is drawn into the density meter. The density
measurement appears on the meter screen and is recorded. The pump level is then
rapidly and repeatedly pumped down to ensure that all fuels are removed from the
filling tube before preceding the density test for the next fuel.

57
CHAPTER 4 : RESULTS AND DISCUSSION
4.1. Visual Inspection
Figure 4.1 shows the physical appearances of phosphor bronze before and after
exposure in fuels for 1440 hours. It is seen that the colour of the corrosion compounds
formed on the coupons upon exposure in biodiesel or its blends is greenish in colour.
The appearance of coupons exposed to diesel fuel was not significantly changed.
Similar findings were reported by Haseeb et al., (2010) when experimenting on copper
and leaded bronze in B100. Figure 4.1 also shows that the greenish corrosion product
seems to be darker with the increase of biodiesel concentration in the blends.
Figure 4.1: Appearance of phosphor bronze (PB) coupons (a) before and (b-e) after
exposure in (b) B0, (c) B20, (d) B50 and (e) B100 fuels for 1440 hours
Figure 4.2 shows the effects of additives on the appearance of phosphor bronze
immersed in B20 and B100. It is seen that the addition of TBA and BTA in the fuels
caused the formation of greenish corrosion product to be highly reduced. This
a) PB / As-received b) PB/ B0
c) PB / B20 d) PB / B50 e) PB / B100

58
demonstrates that additives are effective in reducing corrosion of phosphor bronze.
Coupons immersed in BTA doped fuels do not show any discolouration on the exposed
surface. Therefore, BTA seems to be more effective than TBA in inhibiting corrosion
attack for both B20 and B100.
Figure 4.2: Effect of additives TBA and BTA on the appearance of phosphor bronze
(PB) upon exposure in B20 and B100
Figure 4.3 shows the colour changes of B20 and B100 before and after exposure
to phosphor bronze for 1440 hours. It is seen that the colour of both B20 and B100
turned to yellowish upon exposure of phosphor bronze. The addition of TBA in B20 and
B100 in the presence of phosphor bronze does not significantly prevent the change in
the fuel colour. The change in colour may suggest the compositional change in the fuel.
However, BTA doped fuel for both B20 and B100 does not show a significant change in
the fuel colour even after exposure to phosphor bronze when compared to the as-
received diesel and biodiesel fuels. This suggests that the addition of BTA may control
the change in fuel composition when exposed to phosphor bronze.
b) PB / B20 / TBA
e) PB / B100 / TBA
f) PB / B100 / BTA
c) PB / B20 / BTA
a) PB / B20
d) PB / B100

59
Figure 4.3: Colour of B20 and B100 before (a,e) and after exposure (b-d, f-h) to
phosphor bronze (PB) in the absence and presence of additives (TBA and BTA)
4.2. Weight Loss Measurement and Corrosion Rate Calculation
The weight loss measurement of the respective phosphor bronze coupons was
recorded and applied to calculate the corrosion rates. Figure 4.4 shows the corrosion
rate of phosphor bronze coupons in different fuels. The result shows that increasing
biodiesel content in blend increases the corrosion rate of the coupon. However, it does
not indicate a significant change in terms of weight loss measurement and corrosion rate
calculation in between B50 and B100. Corrosion rates of phosphor bronze in diesel and
biodiesel are 0.0063 mpy and 0.0101 mpy respectively. This finding proves that
biodiesel fuel is much more corrosive than diesel fuel. Figure 4.5 shows the corrosion
rate of phosphor bronze in the absence and presence of TBA and BTA additive.
a) As-received / B20
b) PB / B20
c) PB / B20 / TBA
d) PB / B20 / BTA
e) As-received / B100
f) PB / B100
g) PB / B100 / TBA
h) PB / B100 / BTA

60
Figure 4.4: Corrosion rate of phosphor bronze in different fuels
Figure 4.5: Corrosion rate of phosphor bronze in B20 and B100 in the presence of TBA
and BTA additive

61
The results prove that the addition of corrosion inhibitor is capable to retard and
provide better corrosion protection to the test sample. It is also seen that BTA acts more
effectively in retarding corrosion activity and sample deterioration when compared to
the TBA. Corrosion rates of phosphor bronze in B100 fuel doped with TBA and BTA
0.0095 and 0.0092 respectively. Although a significant change is not recorded in terms
of corrosion rate, the trend still proves that the addition of corrosion inhibitors improves
the corrosion resistance of phosphor bronze.
4.3. Scanning Electron Microscopy (SEM)
Figure 4.6 shows the scanning electron micrographs of phosphor bronze in
different fuels. It is seen that diesel is much more resistant to corrosion attack when
compared to biodiesel. Localised corrosion takes place on the sample surface. The as-
received sample shows a clean and scratch free appearance. Sample B0 shows the least
corrosion attack when compared to sample B100. Similar trend was seen in the
experimental research conducted by Fazal et al., (2012), proving that increasing
biodiesel volume in the immersion solution tends to increase the corrosion rate of the
sample. It was also stated that copper and brass tends to exhibit a higher corrosion
attack in the biodiesel environment.
Figure 4.7 shows the scanning electron micrographs of phosphor bronze
in B20 and B100 fuels in the presence of TBA and BTA additive. The results supports
the findings that increasing biodiesel percentage in the immersion solutions tends to
increase the corrosion attack on the sample. The corrosion attack on sample B100 in the
presence of TBA additive is visibly more severe when compared to the corrosion attack
on sample B20 in the presence of TBA additive. The result also shows that the addition
of TBA in B20 and B100 in the presence of phosphor bronze does not provide
significant corrosion protection to phosphor bronze sample.
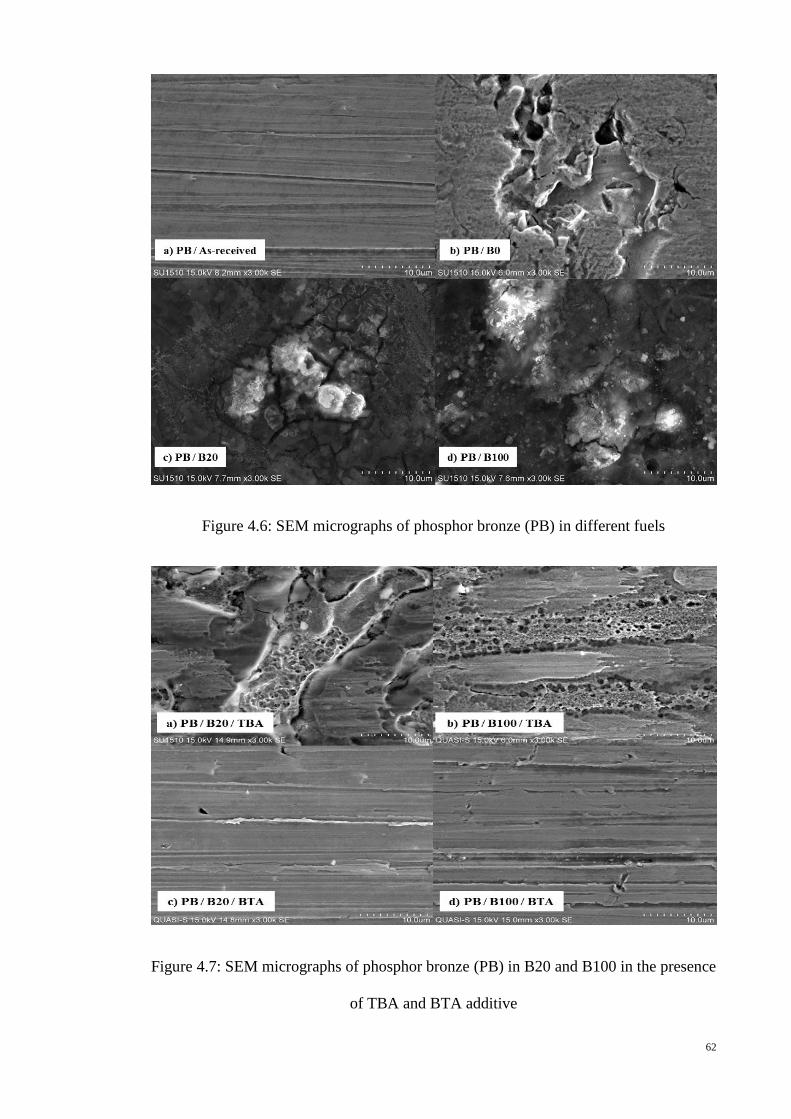
62
Figure 4.6: SEM micrographs of phosphor bronze (PB) in different fuels
Figure 4.7: SEM micrographs of phosphor bronze (PB) in B20 and B100 in the presence
of TBA and BTA additive

63
BTA addition is seen to be more effective in corrosion inhibition of copper and
copper based alloys. The least physical variation in terms of corrosion attack can be
noted when comparing the SEM micrographs in between as-received phosphor bronze
(Figure 4.5) and sample immersed in biodiesel in the presence of BTA (Figure 4.6).
This finding is in line with a review conducted by Finšgar & Milošev, (2010) stating
that BTA forms a protective barrier film when in contact with copper and copper alloys.
BTA is more effective at higher pH values, leading to the formation of Cu(I)BTA
surface complex that is responsible for corrosion protection.
It was reported that thickness of the Cu(I)BTA layer is dependent on the
transport of Cu(I) ions from the copper metal to the surface layer, whereby the
transferred cuprous ions will then react with the physisorbed BTA molecules and form
Cu(I)BTA protective layer. It was concluded that the increasing thickness of Cu(I)BTA
layer, tends to increase the inhibitory effectiveness of the layer. However, the actual
theory on the corrosion inhibition mechanism of BTA on copper and its alloys is still
not well defined and requires more clarification and in depth research (Finšgar &
Milošev, 2010). Based on these findings, BTA is seen to be the most efficient and
effective corrosion inhibitor for phosphor bronze in biodiesel environment.
4.4. Energy Dispersive X-Ray (EDX)
The elemental study was conducted on phosphor bronze immersed in different
fuels. Figure 4.8 shows the elemental study of phosphor bronze before and after
immersion test. It is seen that there is increasing oxygen content on the sample surface,
with increasing biodiesel content in the blend. The as-received phosphor bronze does
not indicate the presence of any elements of oxygen on the metal surface. Sample
immersed in pure diesel, B0, contains the least amount of oxygen, that is 6.90 wt%
while sample immersed in pure biodiesel contains the most amount of oxygen content,

64
that is 20.07 wt%. There is also an increase in the carbon content when comparing
between B0, B20 and B100.
Similar findings were reported through research stating that the higher
concentration of oxygen drives to increase the reaction between metal and metal
compounds (Fazal et al., 2012). This eventually increases the weight loss and corrosion
rate of the metal. It is also seen that the copper content decreases with increasing
biodiesel content in the immersion solution. The oxidation of metal to form different
oxides and metal compound in the presence of oxygen, leads to the dissolution and
decrease in the copper content of the metal.
Figure 4.8: EDX of phosphor bronze (PB) in different fuels
The increasing metal oxidation is also due to the hygroscopic nature of
biodiesel, which causes water retention. Water is available through condensation or
dissolution in the air. Excessive water retention can also promote microbial growth and
contamination within the biodiesel fuel. These factors are also able to increase metal

65
dissolution and corrosion attack on the sample (Jakeria et al., 2014). There are also
traces of Lead (Pb) element detected on the test sample immersed in solution B0, B20
and B100. This element was however not detected on the as-received sample. The
actual theory regarding the corrosion mechanism and chemical reaction of phosphor
bronze is not clearly defined and requires further in-depth research. Figure 4.9 shows
the elemental study of phosphor bronze in B20 and B100 fuels in the presence of TBA
and BTA additive.
Figure 4.9: EDX on phosphor bronze (PB) in B20 and B100 in the presence of TBA and
BTA additive
The comparison of elemental analysis in the presence of additive shows that the
corrosion inhibitor works in favour to retard the corrosion activity on the metal surface.
Based on the results, there is a decrease in the oxygen content accordingly from 18.45
wt % in B20 fuel in the absence of additive to 12.32 wt% in B20 fuel with TBA additive
a) PB/B20/TBA
c) PB/B100/TBA
b) PB/B20/BTA
d) PB/B100/BTA

66
to finally 1.04 wt% in B20 fuel with BTA additive. The similar trend was seen when
comparing the elemental analysis in B100 fuels, in the presence and absence of TBA
and BTA additive respectively.
The results show that BTA acts as the most effective inhibitor addition for
copper and copper alloy. The low oxygen and carbon content and high copper content
show that metal oxidation and dissolution reaction is not significant. It is also noted that
lead element is present in the samples immersed in TBA doped fuels, but not present in
samples immersed in BTA doped fuels. The addition of BTA corrosion inhibitor
increases the protection against corrosion and metal deterioration, thus making the
material suitable to be used in the biodiesel environment.
However, the velocity control within the operating condition is an important
factor to be considered when attempting the use of BTA additive addition in biodiesel
environment. A review by Khan et al., (2015) explains that the increasing velocity
subjected to the sample causes the more damage to the copper surface, leading to
increased exposed area for corrosion activity. Copper samples undergo passivation and
depassivation of protective film with increasing rotating velocity, leading to the
formation of pitting corrosion. However, it was seen that the effects of flow on copper
decreases with the increase of BTA concentration, proving that BTA with appropriate
concentration is able to provide sufficient protection to copper when under constant
flow or rotating condition (Khan et al., 2015).
4.5. Total Acid Number (TAN)
The standard limit of TAN value in biodiesel blend stocks is 0.5mg KOH/g, as
per ASTM D6751. This represents the content of fatty acid within the solution. Figure
4.10 shows the TAN value recorded before and after immersion for B0, B20 and B100.
The TAN analysis shows that the as-received fuel of B0, B20 and B100 is well and

67
below the standard limit of 0.5mg KOH/g (Yaakob et al., 2014). However, there is an
increase in the overall TAN value after immersion test. It is seen that pure diesel (B0),
undergoes an increase in the TAN value after immersion, but still exhibits an acceptable
TAN value of 0.305mg KOH/g, that is below the standard limit.
B20 and B100 show a drastic increase in the TAN, far exceeding the standard
limit, giving a value of 1.028mg KOH/g and 1.142 mg KOH/g respectively. The trend
shows that the TAN value increases with increasing biodiesel in the fuel. In other
words, there is an increase in the free fatty acid content within the fuels, thus requiring a
higher volume of KOH to neutralise the fuel. The increasing TAN value is due to the
increasing level of biodiesel oxidation to form free fatty acids in the fuel. The presence
of corrosive acids in the fuel can also lead to the increase in TAN value (Fazal et al.,
2012).
Figure 4.10: Change in TAN of different fuels, before and after immersion test

68
Figure 4.11 compares the TAN value recorded for B20 and B100 in
the absence and presence of TBA and BTA additive. Based on the results, it is seen that
there is a decrease in the TAN value for both B20 and B100, in the presence of
corrosion inhibitor. It is also noted that fuels doped with BTA shows the least increment
in TAN value when compared to the as-received fuels.
Figure 4.11: Comparison of change in TAN of B20 and B100 in the absence and
presence of TBA and BTA additive
4.6. Density
The standard density of as-received diesel is 0.842 g/cm3, while the standard
density of as-received biodiesel is 0.875 g/cm3. Figure 4.12 shows the density of B0,
B20, B50 and B100 before and after immersion test. The results indicate that the
increasing biodiesel from B0 to B100 increases the density of the fuel. B0 that is pure
diesel shows the least increase in the density of fuels. This result is in line with much
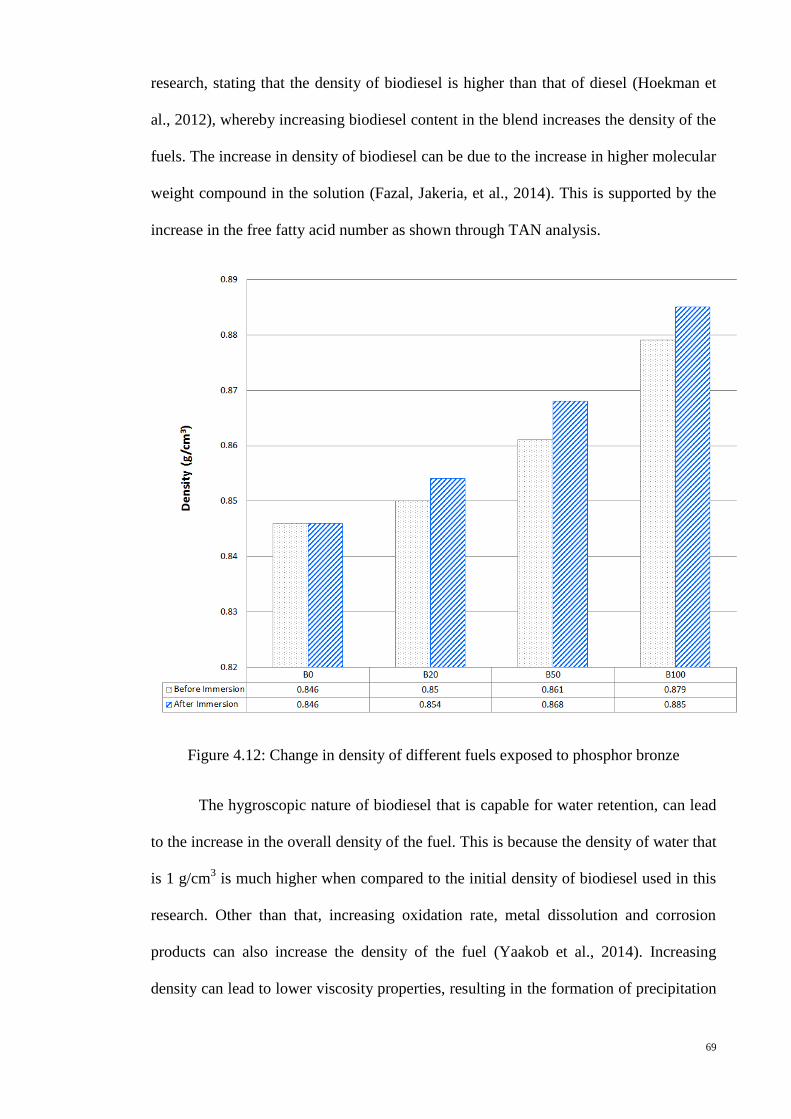
69
research, stating that the density of biodiesel is higher than that of diesel (Hoekman et
al., 2012), whereby increasing biodiesel content in the blend increases the density of the
fuels. The increase in density of biodiesel can be due to the increase in higher molecular
weight compound in the solution (Fazal, Jakeria, et al., 2014). This is supported by the
increase in the free fatty acid number as shown through TAN analysis.
Figure 4.12: Change in density of different fuels exposed to phosphor bronze
The hygroscopic nature of biodiesel that is capable for water retention, can lead
to the increase in the overall density of the fuel. This is because the density of water that
is 1 g/cm3 is much higher when compared to the initial density of biodiesel used in this
research. Other than that, increasing oxidation rate, metal dissolution and corrosion
products can also increase the density of the fuel (Yaakob et al., 2014). Increasing
density can lead to lower viscosity properties, resulting in the formation of precipitation

70
compounds and sediments that can plug and damage the filters and pumps in the CI
engine (Hoekman et al., 2012).
Figure 4.13 shows the density measurement of B20 and B100 in the presence of
TBA and BTA additive. Based on the results, it is seen that there is a decrease in the
density of the fuels. BTA doped fuels tends to be more effective in reducing the density
of the fuel when compared to the addition of TBA. This finding is supported by the
similar decreasing trend seen through TAN analysis, thus proving that corrosion
inhibitors, particularly BTA is a practical solution for corrosion prevention of phosphor
bonze in the biodiesel.
Figure 4.13: Comparison of density of fuels in the absence and presence of TBA and
BTA additive
71
CHAPTER 5 : CONCLUSION
5.1. Introduction
This research has shown that biodiesel fuel is much more instable when
compared to diesel fuel. This is due to variation of characteristic in the basic
composition of biodiesel, especially the level of saturated and unsaturated fatty acid
esters. The conclusions drawn from this research are:
I. There is an increasing greenish colour appearance on phosphor bronze with
increasing biodiesel in the fuel. The lowest corrosion activity was recorded in the
B0 while the highest corrosion rate was recorded in the B100. The presence of
corrosion inhibitors was seen to reduce the corrosion rate of phosphor bronze. The
addition of BTA is most effective in reducing the corrosion rate of phosphor bronze
when compared to the addition of TBA.
II. The SEM micrographs results show phosphor bronze immersed in B100 has the
highest corrosion attack with localised thinning on the surface. B0 shows the least
corrosion attack. TBA doped fuel does not provide sufficient protection to phosphor
bronze when compared to BTA doped fuels that shows minimum corrosion attack
with almost similar appearance to the as-received test sample prior immersion.
III. There is an increase in the oxygen and carbon content with increasing biodiesel in
the fuel. This indicates that there is an increase in the corrosion compound formed
on the sample surface. The addition of TBA and BTA reduces the oxygen and
carbon elements detected on phosphor bronze. BTA is seen to be more effective in
reducing the formation of corrosion compounds when compared to TBA.
IV. There is an increase in the acid value of the test solution with increasing biodiesel
content. B100 solution shows the highest TAN value among the different fuels. The
addition of BTA additive gives the lowest TAN value for both B20 and B100

72
solution that is 0.362 mg KOH/g and 0.817 mg KOH/g respectively. It is seen that
increasing biodiesel content leads to the dissolution and oxidation of biodiesel to
form free fatty acids, thus resulting in the instability of biodiesel.
V. The density of biodiesel fuel is higher that diesel fuel. Increasing biodiesel content
in the test solution tends to increase the overall density of the blend. Biodiesel
solution B100 shows that highest density of 0.885 g/cm3. The addition of corrosion
inhibitor is seen to reduce the density of both B20 and B100 immersion solution.
The addition of BTA additive acts as an effective corrosion inhibitor giving the
lowest density of 0.848 g/cm3 and 0.880 g/cm
3 for both B20 and B100 fuels.
VI. The performance of phosphor bronze test sample is highly affected by the content of
biodiesel in the immersion solution. Increasing biodiesel content in the solution
tends to increase rate of metal dissolution and corrosion attack on the test sample.
The addition of corrosion inhibitors is capable to improve the corrosion resistance of
phosphor bronze. BTA additive serves as a better and more efficient corrosion
inhibitor in reducing the corrosion attack on phosphor bronze.
5.2. Future Recommendations
I. In-depth research and further experiment can be conducted to understand the
mechanism of BTA additive in reducing corrosion of phosphor bronze in biodiesel.
II. X-Ray Diffraction (XRD) study on the test coupon can be performed to analyse the
crystalline material and determine the composition of the corrosion product, to
better understand the corrosion mechanism that takes place when dealing with
phosphor bronze. This will also support in understanding the origin of Lead (Pb)
element detected on phosphor bronze upon complete immersion, except for sample
immersed in B20 and B100 fuels with BTA additive.

73
REFERENCE
Agarwal, A. K. (1999). Performance evaluation and tribological studies on a biodiesel-
fuelled compression ignition engine. Ph. D. thesis, Center for Energy Studies,
Indian Institute of Technology, Delhi, India.
Allam, N. K., Nazeer, A. A., & Ashour, E. A. (2009). A review of the effects of
benzotriazole on the corrosion of copper and copper alloys in clean and polluted
environments. Journal of Applied Electrochemistry, 39(7), 961-969. doi:
10.1007/s10800-009-9779-4
Almeida, E. S., Portela, F. M., Sousa, R. M. F., Daniel, D., Terrones, M. G. H., Richter,
E. M., & Muñoz, R. A. A. (2011). Behaviour of the antioxidant tert-
butylhydroquinone on the storage stability and corrosive character of biodiesel.
Fuel, 90(11), 3480-3484. doi: 10.1016/j.fuel.2011.06.056
Aquino, I. P., Hernandez, R. P. B., Chicoma, D. L., Pinto, H. P. F., & Aoki, I. V.
(2012). Influence of light, temperature and metallic ions on biodiesel
degradation and corrosiveness to copper and brass. Fuel, 102, 795-807. doi:
10.1016/j.fuel.2012.06.011
Atabani, A. E., Silitonga, A. S., Badruddin, I. A., Mahlia, T. M. I., Masjuki, H. H., &
Mekhilef, S. (2012). A comprehensive review on biodiesel as an alternative
energy resource and its characteristics. Renewable and Sustainable Energy
Reviews, 16(4), 2070-2093. doi: 10.1016/j.rser.2012.01.003
Balat, M., & Balat, H. (2008). A critical review of bio-diesel as a vehicular fuel. Energy
Conversion and Management, 49(10), 2727-2741. doi:
10.1016/j.enconman.2008.03.016
Bouaid, A., Martinez, M., & Aracil, J. (2007). Long storage stability of biodiesel from
vegetable and used frying oils. Fuel, 86(16), 2596-2602. doi:
10.1016/j.fuel.2007.02.014
Cursaru, D.-L., Brănoiu, G., Ramadan, I., & Miculescu, F. (2014). Degradation of
automotive materials upon exposure to sunflower biodiesel. Industrial Crops
and Products, 54, 149-158. doi: 10.1016/j.indcrop.2014.01.032
Domingos, A. K., Saad, E. B., Vechiatto, W. W. D., Wilhelm, H. M., & Ramos, L. P.
(2007). The influence of BHA, BHT and TBHQ on the oxidation stability of
soybean oil ethyl esters (biodiesel). Journal of the Brazilian Chemical Society,
18(2), 416-423. doi: 10.1590/s0103-50532007000200026

74
Dwivedi, G., & Sharma, M. P. (2014). Impact of cold flow properties of biodiesel on
engine performance. Renewable and Sustainable Energy Reviews, 31, 650-656.
doi: 10.1016/j.rser.2013.12.035
Fazal, M. A., Haseeb, A. S. M. A., & Masjuki, H. H. (2010). Comparative corrosive
characteristics of petroleum diesel and palm biodiesel for automotive materials.
Fuel Processing Technology, 91(10), 1308-1315. doi:
10.1016/j.fuproc.2010.04.016
Fazal, M. A., Haseeb, A. S. M. A., & Masjuki, H. H. (2011a). Biodiesel feasibility
study: An evaluation of material compatibility; performance; emission and
engine durability. Renewable and Sustainable Energy Reviews, 15(2), 1314-
1324. doi: 10.1016/j.rser.2010.10.004
Fazal, M. A., Haseeb, A. S. M. A., & Masjuki, H. H. (2011b). Effect of different
corrosion inhibitors on the corrosion of cast iron in palm biodiesel. Fuel
Processing Technology, 92(11), 2154-2159. doi: 10.1016/j.fuproc.2011.06.012
Fazal, M. A., Haseeb, A. S. M. A., & Masjuki, H. H. (2011c). Effect of temperature on
the corrosion behavior of mild steel upon exposure to palm biodiesel. Energy,
36(5), 3328-3334. doi: 10.1016/j.energy.2011.03.028
Fazal, M. A., Haseeb, A. S. M. A., & Masjuki, H. H. (2012). Degradation of automotive
materials in palm biodiesel. Energy, 40(1), 76-83. doi:
10.1016/j.energy.2012.02.026
Fazal, M. A., Haseeb, A. S. M. A., & Masjuki, H. H. (2013). Corrosion mechanism of
copper in palm biodiesel. Corrosion Science, 67, 50-59. doi:
10.1016/j.corsci.2012.10.006
Fazal, M. A., Haseeb, A. S. M. A., & Masjuki, H. H. (2014). A critical review on the
tribological compatibility of automotive materials in palm biodiesel. Energy
Conversion and Management, 79, 180-186. doi:
10.1016/j.enconman.2013.12.002
Fazal, M. A., Jakeria, M. R., & Haseeb, A. S. M. A. (2014). Effect of copper and mild
steel on the stability of palm biodiesel properties: A comparative study.
Industrial Crops and Products, 58, 8-14. doi: 10.1016/j.indcrop.2014.03.019
Fernandes, D. M., Montes, R. H. O., Almeida, E. S., Nascimento, A. N., Oliveira, P. V.,
Richter, E. M., & Muñoz, R. A. A. (2013). Storage stability and corrosive
character of stabilised biodiesel exposed to carbon and galvanised steels. Fuel,
107, 609-614. doi: 10.1016/j.fuel.2012.11.010

75
Finšgar, M., & Milošev, I. (2010). Inhibition of copper corrosion by 1,2,3-
benzotriazole: A review. Corrosion Science, 52(9), 2737-2749. doi:
10.1016/j.corsci.2010.05.002
Geller, D. P., Adams, T. T., Goodrum, J. W., & Pendergrass, J. (2008). Storage stability
of poultry fat and diesel fuel mixtures: Specific gravity and viscosity. Fuel,
87(1), 92-102. doi: 10.1016/j.fuel.2007.03.043
Grainawi, L., Jakab, M. A., Westbrook, S. R., & Hutzler, S. A. (2008). Testing for
compatibility of steel with biodiesel. SwRI® Project(08.13070).
Guilminot, E., Rameau, J., Dalard, F., Degrigny, C., & Hiron, X. (2000). Benzotriazole
as inhibitor for copper with and without corrosion products in aqueous
polyethylene glycol. Journal of Applied Electrochemistry, 30(1), 21-28.
Haseeb, A. S. M. A., Fazal, M. A., Jahirul, M. I., & Masjuki, H. H. (2011).
Compatibility of automotive materials in biodiesel: A review. Fuel, 90(3), 922-
931. doi: 10.1016/j.fuel.2010.10.042
Haseeb, A. S. M. A., Masjuki, H. H., Ann, L. J., & Fazal, M. A. (2010). Corrosion
characteristics of copper and leaded bronze in palm biodiesel. Fuel Processing
Technology, 91(3), 329-334. doi: 10.1016/j.fuproc.2009.11.004
Hoekman, S. K., Broch, A., Robbins, C., Ceniceros, E., & Natarajan, M. (2012).
Review of biodiesel composition, properties, and specifications. Renewable and
Sustainable Energy Reviews, 16(1), 143-169. doi: 10.1016/j.rser.2011.07.143
Hu, E., Xu, Y., Hu, X., Pan, L., & Jiang, S. (2012). Corrosion behaviors of metals in
biodiesel from rapeseed oil and methanol. Renewable Energy, 37(1), 371-378.
doi: 10.1016/j.renene.2011.07.010
Jaichandar, S., & Annamalai, K. (2011). The status of biodiesel as an alternative fuel for
diesel engine-An Overview. Journal of Sustainable Energy & Environment, 2,
71-75.
Jain, S., & Sharma, M. P. (2011). Thermal stability of biodiesel and its blends: A
review. Renewable and Sustainable Energy Reviews, 15(1), 438-448. doi:
10.1016/j.rser.2010.08.022
Jakeria, M. R., Fazal, M. A., & Haseeb, A. S. M. A. (2014). Influence of different
factors on the stability of biodiesel: A review. Renewable and Sustainable
Energy Reviews, 30, 154-163. doi: 10.1016/j.rser.2013.09.024

76
Kamiński, J., & Kurzydłowski, K. (2008). Use of impedance spectroscopy to testing
corrosion resistance of carbon steel and stainless steel in water-biodiesel
configuration. J. Corros. Measur.
Karmakar, A., Karmakar, S., & Mukherjee, S. (2010). Properties of various plants and
animals feedstocks for biodiesel production. Bioresour Technol, 101(19), 7201-
7210. doi: 10.1016/j.biortech.2010.04.079
Khan, P. F., Shanthi, V., Babu, R. K., Muralidharan, S., & Barik, R. C. (2015). Effect of
benzotriazole on corrosion inhibition of copper under flow conditions. Journal
of Environmental Chemical Engineering, 3(1), 10-19. doi:
10.1016/j.jece.2014.11.005
Kosec, T., Milošev, I., & Pihlar, B. (2007). Benzotriazole as an inhibitor of brass
corrosion in chloride solution. Applied Surface Science, 253(22), 8863-8873.
doi: 10.1016/j.apsusc.2007.04.083
Lei, Y. H., Sheng, N., Hyono, A., Ueda, M., & Ohtsuka, T. (2014). Effect of
benzotriazole (BTA) addition on Polypyrrole film formation on copper and its
corrosion protection. Progress in Organic Coatings, 77(2), 339-346. doi:
10.1016/j.porgcoat.2013.10.009
Maru, M. M., Lucchese, M. M., Legnani, C., Quirino, W. G., Balbo, A., Aranha, I. B., .
. . Achete, C. A. (2009). Biodiesel compatibility with carbon steel and HDPE
parts. Fuel Processing Technology, 90(9), 1175-1182. doi:
10.1016/j.fuproc.2009.05.014
May, C. Y. (2004). Transesterification of palm oil: effect of reaction parameters.
Journal of Oil Palm Research, 16(2), 1-11.
Meenakshi, H., Anisha, A., Shyamala, R., Saratha, R., & Papavinasam, S. (2010).
Corrosion of metals in biodiesel from Pongamia pinnata. Paper presented at the
Proceedings of the NACE Corrosion Conference (CORROSION’10).
Nzikou, J., Matos, L., Moussounga, J., Ndangui, C., Pambou-Tobi, N., Bandzouzi, E., . .
. Desobry, S. (2009). Study of oxidative and thermal stability of vegetable oils
during frying. Res. J. Appl. Sci, 4, 94-100.
Ong, H. C., Mahlia, T. M. I., Masjuki, H. H., & Norhasyima, R. S. (2011). Comparison
of palm oil, Jatropha curcas and Calophyllum inophyllum for biodiesel: A
review. Renewable and Sustainable Energy Reviews, 15(8), 3501-3515. doi:
10.1016/j.rser.2011.05.005

77
Ortega, M. A. C., Alpírez, G. M., Eliezer, A., González, C. G., Román, J. C., Pelayo, L.
J. P., & Bautista, J. R. A. (2013). Materials technological challenges for the
biodiesel industry development in Mexico.
Parameswaran, M. H. N., Anand, A., & Krishnamurthy, S. R. (2013). A Comparison of
Corrosion Behavior of Copper and Its Alloy in Pongamia pinnata Oil at
Different Conditions. Journal of Energy, 2013, 1-4. doi: 10.1155/2013/932976
Rashedul, H. K., Masjuki, H. H., Kalam, M. A., Ashraful, A. M., Ashrafur Rahman, S.
M., & Shahir, S. A. (2014). The effect of additives on properties, performance
and emission of biodiesel fuelled compression ignition engine. Energy
Conversion and Management, 88, 348-364. doi:
10.1016/j.enconman.2014.08.034
Ravichandran, R., Nanjundan, S., & Rajendran, N. (2004). Effect of benzotriazole
derivatives on the corrosion and dezincification of brass in neutral chloride
solution. Journal of Applied Electrochemistry, 34(11), 1171-1176.
Sgroi, M., Bollito, G., Saracco, G., & Specchia, S. (2005). BIOFEAT: Biodiesel fuel
processor for a vehicle fuel cell auxiliary power unit. Journal of Power Sources,
149, 8-14. doi: 10.1016/j.jpowsour.2004.12.059
Singh, B., Korstad, J., & Sharma, Y. C. (2012). A critical review on corrosion of
compression ignition (CI) engine parts by biodiesel and biodiesel blends and its
inhibition. Renewable and Sustainable Energy Reviews, 16(5), 3401-3408. doi:
10.1016/j.rser.2012.02.042
Sorate, K., & Bhale, P. (2013). Impact of biodiesel on fuel system materials durability.
Journal of Scientific and Industrial Research, 72, 48-57.
Sorate, K. A., & Bhale, P. V. (2015). Biodiesel properties and automotive system
compatibility issues. Renewable and Sustainable Energy Reviews, 41, 777-798.
doi: 10.1016/j.rser.2014.08.079
Torsner, E. (2010). Solving corrosion problems in biofuels industry. Corrosion
Engineering, Science and Technology, 45(1), 42-48. doi:
10.1179/147842209x12579401586726
Tyson, K. S., & McCormick, R. L. (2006). Biodiesel handling and use guidelines.

78
Yaakob, Z., Narayanan, B. N., Padikkaparambil, S., Unni K, S., & Akbar P, M. (2014).
A review on the oxidation stability of biodiesel. Renewable and Sustainable
Energy Reviews, 35, 136-153. doi: 10.1016/j.rser.2014.03.055