Embed Size (px)
Citation preview

Int. J. Electrochem. Sci., 16 (2021) Article ID: 210436, doi: 10.20964/2021.04.61
International Journal of
ELECTROCHEMICAL SCIENCE
www.electrochemsci.org
Corrosion Behaviour of Welded Steel Bars in Concrete with and
without Cracks under Potentiostatic Conditions
Shicai Li, Zuquan Jin*, Xiaoying Zhang
Engineering Research Center of Concrete technology in marine environment, Ministry of Education,
Qingdao University of Technology, Qingdao 266033, China *E-mail: [email protected]
Received: 15 December 2020 / Accepted: 7 February 2021 / Published: 28 February 2021
Welding is a simple and effective way to connect steel bars in concrete structures. However, the high
temperature during welding can affect the phase composition of the steel bars. In particular, when the
welding part is located at the crack, it will be directly affected by corrosion ions, which will destroy the
corrosion resistance and the durability of the steel bars. This study aimed to investigate the effects of
welding on the corrosion behaviour of steel bars in concrete with and without cracks under potentiostatic
acceleration. The corrosion time of the steel bar is shortened 48 h by welding, and the depassivation time
of welded corrosion-resistant steel bars was approximately 18 h shorter than that of welded ordinary
steel bars. In addition, the depassivation time of the welded steel bars and that of nonwelded bars in
concrete was advanced by approximately 15 h and 14 h, respectively, due to cracks. Because the progress
of galvanic corrosion has been promoted, the influence is most significant when the type of welded steel
bar is LC & CR. For the welded LC & LC types, the corrosion current density was increased by cracks.
Keywords: crack; concrete; welding; potentiostatic acceleration; corrosion behaviour
1. INTRODUCTION
Many RC structures, such as cross-ocean tunnels, sea-crossing bridges, and harbour, are exposed
to marine environments containing chloride ions and sulfate ions, which leads to a series of durability
problems [1]. Corrosion is one of the critical factors reducing the durability of concrete in marine and
other severely corrosive environments. In 2014, the loss caused by corrosion in China was approximately
2,127.8 billion RMB, accounting for 3.34% of the county’s GDP [2]. How to eliminate and slow down
the corrosion of steel bars is one of the most urgent problems to be solved in practical engineering [3,
4].
Currently, some efficient strategies are being developed to reduce the risk of reinforcement
corrosion [5], and include the use of high-performance concrete, protective coatings, corrosion

Int. J. Electrochem. Sci., Vol. 16, 2021
2
inhibitors, etc. In addition, using corrosion-resistant steel bars as a method to avoid reinforcement
corrosion from the fundamental way has been widely studied. Adding Cr, Ni, Mo, and other alloying
elements to obtain corrosion-resistant steel bars can significantly prolong the service life of concrete
structures in the ocean and severely corrosive environments [6-8]. Since the cost of stainless steel bars
and corrosion-resistant steel bars is 3 to 5 times that of ordinary steel bars, the use of welded steel bars
in severely corrosive areas such as ocean splash areas and tidal areas is currently a common choice [9-
12]. However, the problem of connecting corrosion-resistant steel bars with ordinary steel bars or
corrosion-resistant steel bars will undoubtedly appear in welded steel bars. Some researchers have found
that the probability of corrosion at welded joints is high [13-15]. Weld decay, which is severe
intergranular corrosion in the heat-affected zone (HAZ), is a common and serious problem encountered
during the welding of austenitic stainless steel [16-18]. Some researchers have shown that the chloride
threshold value for the initiation of corrosion in nonwelded rebar is approximately 3 to 5 times higher
than that in conventional rebar. However, the welding of stainless steel reduced the critical chloride level
by 50% [19-21]. Experimental results from Gnanarathinam [22] showed that weldments have high
corrosion resistance at room temperature and that the rate of corrosion increases with respect to the
temperature and welding time. However, current research has focused on the microstructure and
mechanical properties of weldments. Only a few studies on the corrosion of welded steel in concrete
have been conducted.
In addition, once steel bars are corroded, the expansion stress generated by the corrosion products
will inevitably lead to cracks in the concrete. Cracks can accelerate corrosion by providing a convenient
path for the penetration of corrosion substances (water, oxygen, carbon dioxide, chloride, etc.) [23, 24].
If the corrosion process occurs cyclically, the failure of the RC structures cannot be avoided. Therefore,
studying the influences of cracks on steel corrosion in concrete is of great significance for the prediction
of the durability and service life of marine concrete structures. Numerous experimental and theoretical
studies have investigated the influences of cracks on the durability of reinforced concrete by studying
chloride penetration [25-27] and steel corrosion in concrete structures [28-30]. Experimental results from
Du et al. [31] showed that cracks have a greater influence on reinforced concrete under electrochemical
corrosion conditions than under natural exposure conditions. Natural corrosion is two orders of
magnitude faster than accelerated corrosion when the crack width is over 0.20 mm. Experimental results
from Ji et al. [32]showed that the steel in cracks was activated once transverse cracks occurred in
concrete. Additionally, if cracks in concrete are located at the weld joints of the welded steel bars, the
rapid intrusion of water and corrosion ions will accelerate damage to the connectivity and durability of
the steel bars. However, there is almost no research on the effect of cracks on the corrosion of welded
steel bars in concrete.
As mentioned above, cracks and welding can both accelerate reinforcement corrosion. Although
many experiments and much research have been carried out, there is still a gap in realizing the relation
between welds and cracks and their effect on reinforcement corrosion. Hence, in this study, reinforced
concretes with and without cracks were prepared and chloride migration was induced via potentiostatic
acceleration. The influence of welding on the corrosion behaviour of steel bars in concrete with and
without cracks was studied by electrochemical technology. The results of this study may help to propose

Int. J. Electrochem. Sci., Vol. 16, 2021
3
a more reasonable steel connection method and provide a reference for the indicators of cracks at the
steel connection.
2. EXPERIMENTS
2.1 Materials
Portland cement P·I.52.5 was used as the binder material. Class I fly ash (FA) and S95 granulated
blast furnace slag (GGBS) were used as mineral admixtures. Their chemical compositions are shown in
Table 1. River sand (with a fineness modulus of 2.6) was used as the fine aggregate, and crushed granite
(with a maximum size of 20 mm) was used as the coarse aggregate.
Table 1. Chemical compositions of cement, fly ash, and GGBS (wt %)
Chemical composition LOI SiO2 Al2O3 Fe2O3 CaO SO3 MgO K2O Na2O
Cement 0.77 20.87 4.87 3.59 64.49 2.52 2.13 0.65 0.11
FA 0.77 4.09 47.86 35.5 4.52 1.05 0.55 1.18 1.62
GGBS 3.38 33.87 34.59 18.15 0.7 6.5 1.27 0.57
In this study, two types of steel bars (Q235 low carbon steel and corrosion-resistant steel) with a
length of 300 mm and a diameter of 10 mm were used. Corrosion-resistant steel (CR) was alloyed with
Cr and Mo and developed by Southeast University [33]. The chemical compositions of the steel bars are
shown in Table 2.
Table 2. Chemical compositions of steel bars
Type Chemical composition
Fe C Si Mn P S V Cr Mo
CR Bal. 0.01 0.49 1.49 0.01 0.01 0.06 10.36 1.16
LC Bal. 0.23 0.52 1.42 0.04 0.03 0.03 - -
Table 3. Physical properties of steel bars
Rm (MPa) ReL
(MPa) Rp (MPa) Lo (cm) Lu (cm)
Elongatio
n
Nonwelded 678 552 568 20 23.9 19.5%
Welded 655 517 511 20 24.1 20.5%
where Rm is the tensile strength, ReL is the lower yield strength, Rp is the specified
nonproportional elongation strength, Lo is the original gauge length, and Lu is the final gauge length.

Int. J. Electrochem. Sci., Vol. 16, 2021
4
To explore the influence of welded steel bars of different welding types on their corrosion
resistance, two types of steel bars were welded separately, welded low-carbon steel and low-carbon steel
(LC & LC), welded low-carbon steel and corrosion-resistant steel (LC & CR), welded corrosion-resistant
steel and corrosion-resistant steel (CR & CR). The physical properties of the welded and nonwelded
corrosion-resistant steel obtained by the test are shown in Table 3.
Tensile tests were carried out on the corrosion-resistant reinforcement after welding, and the
morphology of the tensile reinforcement is shown in Figure 1. Obviously, the damage point of the welded
corrosion-resistant steel bar under tension is not located at the welding joints. As shown in Table 3, the
tensile strength after welding is 655 Mpa, indicating that the welding does not affect the mechanical
properties of the corrosion-resistant steel bar. Welding can be used for corrosion-resistant steel bars
because, after welding, the design requirements of the bearing capacity can be met.
Figure 1. Topography of welded steel bars: (a) before the tensile test and (b) after the tensile test
2.2 Mix proportion
An air-entraining agent and a polycarboxylic superplasticizer were used to adjust the air content
of fresh concrete by approximately 3% to 5% and the slump of fresh concrete by approximately 180 mm
to 220 mm, respectively. A solution-polymerized superabsorbent polymer (SAP) was used as an internal
curing agent. The SAP was fed with water first before use, and the water absorbency was 30 g water/1
g SAP. The mixture proportion of concrete is listed in Table 4. The standard compressive strengths of
concrete after curing for 3 d, 7 d, 28 d, and 56 d were tested, and the results were 41.6 MPa, 52.6 MPa,
61.5 MPa, and 68.9 MPa, respectively.
Table 4. Mix proportion of concrete (kg/m3)
Cement FA GGBS Sand Granite Water
Air
entraining
agent
Water
reducing
agent
SAP
250 75 145 730 1095 125 0.22 6 1

Int. J. Electrochem. Sci., Vol. 16, 2021
5
2.3 Experimental program
2.3.1 Preparation of concrete samples with cracks
Reinforced concrete specimens with 15 mm grooves on their surfaces were cast in a mould with
a size of 100 mm ×100 mm × 300 mm. Before casting, the steel bars were pretreated by pickling and
sanding. After removing 25 mm from the left and right ends, the wires were bonded to both ends, and
epoxy resin was used for sealing to ensure that the exposed length of the steel bar was 250 mm. Then,
five types of steel bars (LC, CR, and three welded steels) with a 10 mm diameter were set in concrete
(the concrete cover was 25 mm thick).
Plastic flakes with 0.15 mm thicknesses were used to prepare transverse cracks perpendicular to
the rebar, as shown in Figure 2. These plastic flakes were inserted into concrete samples during the initial
setting stage and were pulled out before the final setting stage.
Figure 2. The casting of concrete specimens with cracks: (a) cast concrete and (b) after mould removal
2.3.2 Accelerated corrosion tests
Figure 3. The schematic diagram of accelerated corrosion.
Int. J. Electrochem. Sci., Vol. 16, 2021
6
As shown in Figure 3, the reinforced concretes were used as a medium to accelerate corrosion
under potentiostatic conditions that were kept constant at 30 V. The current was continuously tested
every 1 ~ 2 h during the daytime and every 8 ~ 10 h at night. The entire duration of the accelerated
corrosion test was 18 to 180 h according to different series. The reinforced concretes were immersed in
tap water, and the groove on its surface was filled with seawater. The positive and negative poles of the
DC power supply were severely connected to the steel bar in the concrete (anode) and auxiliary steel
bar-a stainless steel rod (cathode). In addition, a digital camera was used to monitor the corrosion of
reinforced concrete at any time.
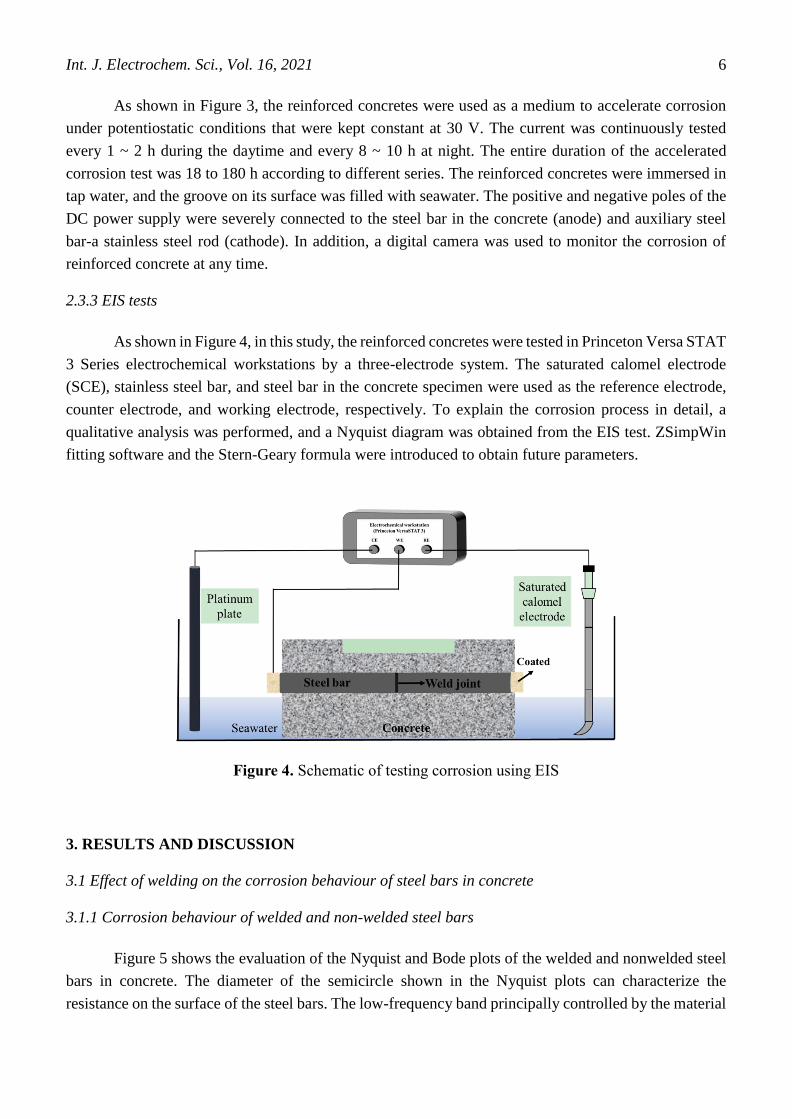
2.3.3 EIS tests
As shown in Figure 4, in this study, the reinforced concretes were tested in Princeton Versa STAT
3 Series electrochemical workstations by a three-electrode system. The saturated calomel electrode
(SCE), stainless steel bar, and steel bar in the concrete specimen were used as the reference electrode,
counter electrode, and working electrode, respectively. To explain the corrosion process in detail, a
qualitative analysis was performed, and a Nyquist diagram was obtained from the EIS test. ZSimpWin
fitting software and the Stern-Geary formula were introduced to obtain future parameters.
Figure 4. Schematic of testing corrosion using EIS
3. RESULTS AND DISCUSSION
3.1 Effect of welding on the corrosion behaviour of steel bars in concrete
3.1.1 Corrosion behaviour of welded and non-welded steel bars
Figure 5 shows the evaluation of the Nyquist and Bode plots of the welded and nonwelded steel
bars in concrete. The diameter of the semicircle shown in the Nyquist plots can characterize the
resistance on the surface of the steel bars. The low-frequency band principally controlled by the material

Int. J. Electrochem. Sci., Vol. 16, 2021
7
transfer process in the impedance spectrum reflects the corrosion of the steel bars in the concrete. When
the slope of the low-frequency band curve rises, the steel bars have a large transfer resistance and are in
a passivated state. At this time, the steel bars in the concrete have better corrosion resistance. A capacitive
reactance arc appeared in the low-frequency band as the corrosion time increased. If the steel bars have
a smaller capacitive arc radius, they will be more likely to corrode [34]. In the Bode phase plots, the
greater the absolute value of the maximum phase angle is in the low-frequency region, the more stable
the metal in the electrochemical system.
0 300 600 900 12000
300
600
900
1200
Zre(Ω·cm2)
Zim
(Ω·c
m2)
4h
12h
20h
44h
52h
62h
72h
82h
(a)
-3 -2 -1 0 1 2 3 4 5 6-60
-50
-40
-30
-20
-10
0 (b)
Ph
ase
ang
le (
deg
)lgf (Hz)
4h
12h
20h
44h
52h
62h
72h
82h
0 200 400 600 8000
200
400
600
800
Zre(Ω·cm2)
0h
6h
12h
18h
24h
30h
Zim
(Ω·c
m2)
(c)
-3 -2 -1 0 1 2 3 4 5 6
-40
-30
-20
-10
0(d)
Ph
ase
ang
le (
deg
)
lgf (Hz)
0h
6h
12h
18h
24h
30h
Figure 5. Nyquist and Bode plots of welded and nonwelded steel bars in concrete. (a) Nyquist plots of
LC, (b) Bode plots of LC, (c) Nyquist plots of welded LC & LC, and (d) Bode plots of welded
LC & LC
There is a high-frequency loop and a low-frequency loop in the Nyquist plot. The diameter of
the capacitive loop shrank gradually with increasing corrosion time, and the corrosion times needed to
produce obvious changes in the capacitive resistance arcs of the different types of steel bars were
different. The topological structure of the Nyquist diagram has not undergone a qualitative change when
the power was just turned on, and the low-frequency part exhibits an upward slope. This indicates that
the impedance and capacitance of the passive film on the surface of the steel bar are very large, and the
protective ability of the passive film is not undermined. The capacitive reactance arc in the Nyquist
diagram gradually contracts significantly as the corrosion time increases. The topological structure of
the low-frequency loop changes from a straight upward line to a flattened capacitive arc. The passive
film on the surface of the steel bars in the concrete has undergone a qualitative change. Moreover, the
impedance spectrum shows that the times corresponding to the obvious changes in the impedance spectra
of welded and nonwelded steel bars are different. The times at which the capacitive arc is changed for
the welded steel bars and nonwelded bars are 24 h and 72 h, respectively. It can be concluded that the
Int. J. Electrochem. Sci., Vol. 16, 2021
8
corrosion time of the steel bar is accelerated to 48 h by weld. Additionally, the absolute value of the
maximum phase angle of welded steel bars is lower than that of nonwelded steel bars.
The obvious change in the capacitive resistance arc indicates that the steel bar is about to corrode,
and its corrosion degree can be analysed quantitatively. AC impedance spectroscopy only qualitatively
characterizes the corrosion of steel bars through a graphical topological structure, and it also needs to be
fitted by ZsimpWin software to obtain corrosion parameters for auxiliary analysis [35]. The polarization
resistance RP of the steel bar was obtained by fitting. Then, RP was introduced into the Stern-Geary
formula, and the corrosion current density of the steel bar was calculated. The obtained Nyquist plots
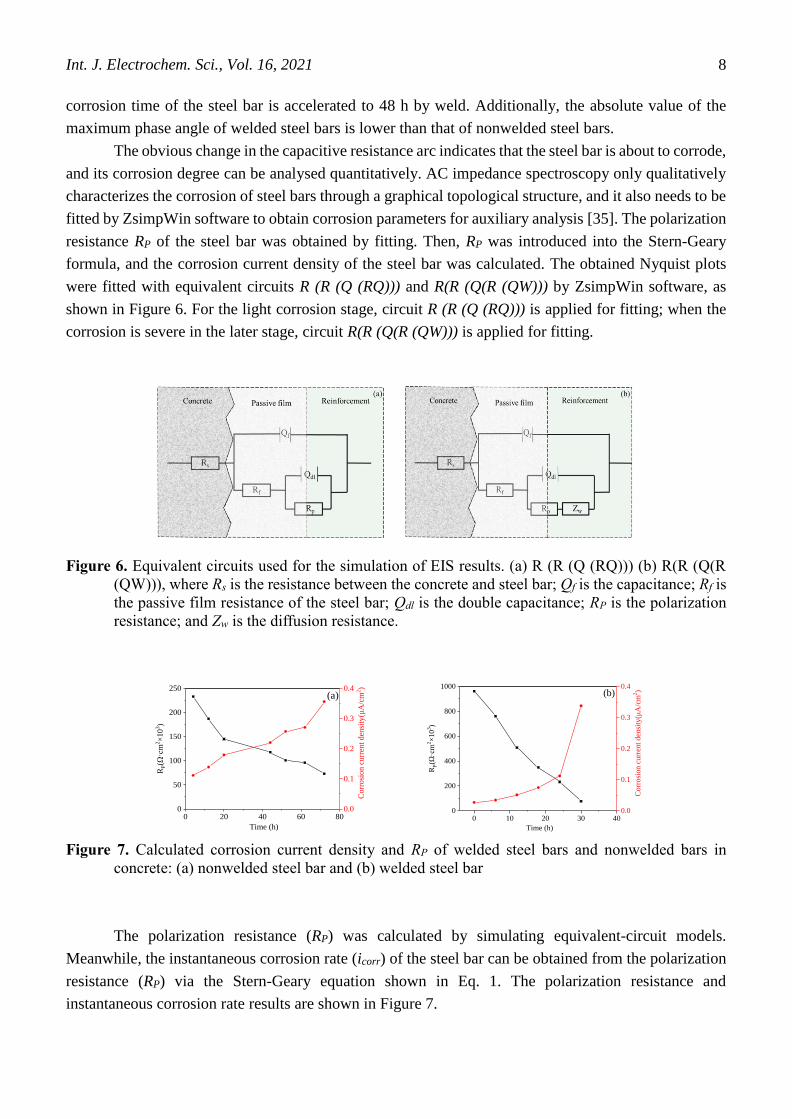
were fitted with equivalent circuits R (R (Q (RQ))) and R(R (Q(R (QW))) by ZsimpWin software, as
shown in Figure 6. For the light corrosion stage, circuit R (R (Q (RQ))) is applied for fitting; when the
corrosion is severe in the later stage, circuit R(R (Q(R (QW))) is applied for fitting.
Figure 6. Equivalent circuits used for the simulation of EIS results. (a) R (R (Q (RQ))) (b) R(R (Q(R
(QW))), where Rs is the resistance between the concrete and steel bar; Qf is the capacitance; Rf is
the passive film resistance of the steel bar; Qdl is the double capacitance; RP is the polarization
resistance; and Zw is the diffusion resistance.
0 20 40 60 800
50
100
150
200
250
Time (h)
RP(Ω
·cm
2×
10
3)
(a)
0.0
0.1
0.2
0.3
0.4
Corr
osi
on c
urr
ent
den
sity
(μA
/cm
2)
0 10 20 30 40
0
200
400
600
800
1000
RP(Ω
·cm
2×
10
3)
Time (h)
0.0
0.1
0.2
0.3
0.4(b)
Corr
osi
on c
urr
ent
den
sity
(μA
/cm
2)
Figure 7. Calculated corrosion current density and RP of welded steel bars and nonwelded bars in
concrete: (a) nonwelded steel bar and (b) welded steel bar
The polarization resistance (RP) was calculated by simulating equivalent-circuit models.
Meanwhile, the instantaneous corrosion rate (icorr) of the steel bar can be obtained from the polarization
resistance (RP) via the Stern-Geary equation shown in Eq. 1. The polarization resistance and
instantaneous corrosion rate results are shown in Figure 7.

Int. J. Electrochem. Sci., Vol. 16, 2021
9
(1)
where B is a function of the Tafel slope. For steel bars in concrete, B values of 26 mV for the
active state and 52 mV for the passive state have been proposed [36].
With increasing corrosion time, the current density of the two specimens increases with
decreasing polarization resistance of the steel bar, as shown in Figure 7. However, the changing
situations of the two types of steel bars and different periods are different. When the steel protective film
is in a passivated state, the polarization resistance of the steel exhibits a small change, and its corrosion
current density increases slowly. When the steel passive film is damaged and begins to rust, the
polarization resistance and the corrosion current density of the steel bars change sharply. Figure 7 shows
that after accelerating corrosion for 24 h, a large increase in the corrosion current density of the welded
steel bar is observed. However, the corrosion current density of the nonwelded steel bar is still low. It
can be concluded that welded steel bars are activated earlier than nonwelded bars. Similar to the report
by Zhang et al. [37], ferrite presents a higher volume fraction and more easily suffers from corrosion
attack than austenite in the welded zone of the as-welded metal.
3.1.2 Corrosion behaviour of welded steel bars of different weld types
Figure 8 shows the Nyquist and Bode plots of welded steel bars with different types in concrete.
There are three types of welded steel bars: welded low-carbon steel and low-carbon steel (LC & LC),
welded of corrosion-resistant steel and low-carbon steel (LC & CR), and welded corrosion-resistant steel
and corrosion-resistant steel (CR & CR). The Nyquist plots show that the capacitive resistance arc of
welded CR & CR exhibits the largest contraction change. Therefore, welding corrosion-resistant steel
bars and corrosion-resistant steel bars, has the most significant effect on the corrosion behaviour of steel
bars. In the Bode plots, the maximum phase angle of the three types of welded steel bars is between 40°
and 50° before the beginning of energization. With increasing energization time, the phase angle
gradually decreases and transfers to the high-frequency band, which indicates that the corrosion
resistance of the steel bar gradually decreases. When the corrosion time was 6 h, the largest decrease in
the phase angle appeared in the welded CR & CR samples.
0 200 400 600 8000
200
400
600
800
Zre(Ω·cm2)
0h
6h
12h
18h
24h
30h
Zim
(Ω·c
m2)
(a)
-3 -2 -1 0 1 2 3 4 5 6
-40
-30
-20
-10
0(b)
Ph
ase
ang
le (
deg
)
lgf (Hz)
0h
6h
12h
18h
24h
30h
p
corrR
Bi

Int. J. Electrochem. Sci., Vol. 16, 2021
10
0 300 600 900 12000
300
600
900
1200(c)
0h
6h
12h
18h
24h
30h
36h
Zre(Ω·cm2)
Zim
(Ω·c
m2)
-3 -2 -1 0 1 2 3 4 5 6
-50
-40
-30
-20
-10
0 (d)
Ph
ase
ang
le (
deg
)
lgf (Hz)
0h
6h
12h
18h
24h
30h
36h
0 400 800 1200 16000
400
800
1200
1600(e)
0h
6h
12h
18h
24h
30h
Zre(Ω·cm2)
Zim
(Ω·c
m2)
-3 -2 -1 0 1 2 3 4 5 6
-50
-40
-30
-20
-10
0 (f)
Ph
ase
ang
le (
deg
)
lgf (Hz)
0h
6h
12h
18h
24h
30h
Figure 8. Nyquist and Bode plots of welded steel bars of different welding types. (a) Nyquist plots of
welded LC & LC, (b) Bode plots of welded LC & LC, (c) Nyquist plots of welded LC & CR, (d)
Bode plots of welded LC & CR, (e) Nyquist plots of welded CR & CR, and (f) Bode plots of
welded CR & CR
The polarization resistance and instantaneous corrosion rate results are shown in Figure 9. The
order of the corrosion start time is CR & CR > LC & CR > LC & LC, and the activation time of welded
corrosion-resistant steel bars is approximately 18 h shorter than that of welded ordinary steel bars. This
illustrates that the influence of welding on corrosion-resistant steel is greater than that on ordinary steel.
The main reason for this is that the corrosion-resistant steel bars contain other alloying elements. Phase
transformation occurs at a high temperature during welding, which makes it more prone to corrosion
[38].
0 10 20 30 400
200
400
600
800
1000
RP(Ω
·cm
2×
10
3)
Time (h)
0.0
0.1
0.2
0.3
0.4(a)
Corr
osi
on c
urr
ent
den
sity
(μA
/cm
2)

Int. J. Electrochem. Sci., Vol. 16, 2021
11
0 10 20 300
100
200
300
400
RP(Ω
·cm
2×
10
3)
Time (h)
(b)
0.0
0.1
0.2
0.3
0.4
Corr
osi
on c
urr
ent
den
sity
(μA
/cm
2)
0 10 20 300
250
500
750
1000(c)
Time (h)
RP(Ω
·cm
2×
10
3)
0.0
0.1
0.2
0.3
0.4
Corr
osi
on c
urr
ent
den
sity
(μA
/cm
2)
Figure 9. Calculated corrosion current density and RP of welded steel bars of different weld types: (a)
welded LC & LC, (b) welded LC & CR, and (c) welded CR & CR
3.2 Effect of cracks on the corrosion behaviour of steel bars in concrete
3.2.1 Corrosion behaviour of nonwelded steel bars in concrete with and without cracks
(1) Macroscopic phenomenon and corrosion current evolution
Figure 10 shows that in the early stage of steel corrosion, red-brown rust overflowed from the
prefabricated cracks. The prefabricated cracks became wider due to tension during the overflow of the
rust. In the later stage of steel corrosion, steel swelling caused the concrete protective layer to crack.
When accelerated corrosion was carried out, rust gradually accumulated, and the prefabricated cracks
on the concrete surface continued to widen and expand. Splitting the completely rusted test block, as
shown in Figure 10 (c), shows that the electrically accelerated rust is uneven. In addition, the steel bars
on the side close to the site of seawater infiltration are very severely corroded, while the steel bars on
the other side exhibit almost no corrosion.
Figure 10. Crack propagation of concrete (a) before rust formation and (b) after rust formation. (c)
Corrosion distribution

Int. J. Electrochem. Sci., Vol. 16, 2021
12
The corrosion of two types of reinforced concrete specimens after 28 days of standard curing
was accelerated until the current changed suddenly, and then, energization was stopped. An instrument
was used to record the current change with respect to the power-on time, as shown in Figure 11. In the
early stage of electrification, the currents of the two types of reinforced concrete specimens tend to be
stable. With increasing accelerating time, the currents slowly decrease. After accelerating corrosion for
a period, the currents tend to be stable after a large sudden change. At this time, the concrete surface
began to overflow with rust, which expanded the concrete specimen along the prefabricated cracks.
When a sudden current change occurs, cracks will appear on the surface of the concrete, and the
specimen will be completely cracked. According to the point at which the current suddenly changes, the
cracking times of low-carbon steel and corrosion-resistant reinforced concrete specimens are 113 h and
154 h, respectively. The energization time of corrosion-resistant reinforced concrete is approximately
40 h longer than that of low-carbon steel. The main reason for this is that the corrosion-resistant steel
bars have good corrosion resistance and are not easily corroded. Rust formation produced is slow, and
the concrete specimens crack late in the process.
0 30 60 90 120 150 180
30
40
50
60
70
80
Acc
eler
ated
curr
ent(
mA
)
Time(h)
LC
CR
Figure 11. The change in accelerated current with time
(2) The Nyquist and Bode plots
Figure 12 shows the Nyquist and Bode plots of nonwelded steel bars in concrete with and without
cracks. As the energization time increases, the impedance curve of the continuously reinforced concrete
shrinks, which leads to a continuous decrease in the capacitive arc radius. However, the time at which
the capacitive reactance arc changes significantly is different. Under the same electrical acceleration
conditions, the capacitive arc of the nonwelded steel bars in concrete with cracks exhibits obvious
shrinkage changes when electricity was applied for 6 h. The capacitive resistance arc of the nonwelded
steel bars in concrete without cracks is still a straight line, and there is no obvious shrinkage change until
72 h after electrification. This illustrates that the cracks advanced the corrosion time of the nonwelded
steel bars in concrete by more than 60 h. In the Bode plots, the phase angle of the nonwelded steel bars
decreases more significantly with increasing energization time, indicating that the cracks have a greater
impact on the nonwelded steel bars.

Int. J. Electrochem. Sci., Vol. 16, 2021
13
0 300 600 900 12000
300
600
900
1200
Zre(Ω·cm2)
Zim
(Ω·c
m2)
4h
12h
20h
44h
52h
62h
72h
82h
(a)
-3 -2 -1 0 1 2 3 4 5 6-60
-50
-40
-30
-20
-10
0
Ph
ase
ang
le (
deg
)
lgf (Hz)
4h
12h
20h
44h
52h
62h
72h
82h
(b)
0 300 600 900 1200 15000
300
600
900
1200
1500
Zre(Ω·cm2)
Zim
(Ω·c
m2)
0h
6h
12h
18h
24h
30h
(c)
-3 -2 -1 0 1 2 3 4 5 6
-60
-50
-40
-30
-20
-10
0
Ph
ase
ang
le (
deg
)
lgf (Hz)
0h
6h
12h
18h
24h
30h
(d)
Figure 12. Nyquist and Bode plots of nonwelded steel bars in concrete with and without cracks. (a)
Nyquist plots of the concrete without cracks. (b) Bode plots of the concrete without cracks. (c)
Nyquist plots of the concrete with cracks. (d) Bode plots of the concrete with cracks
Figure 13 shows the calculated corrosion current density and RP of nonwelded steel bars in
concrete. As the energization time increases, the current density of the two specimens shows an
increasing trend, and the polarization resistance of the steel bar decreases. When icoor < 0.1 μA/cm2, the
steel bar is in a passivated state, and when 0.2 ≤ icoor < 0.5 μA/cm2, the steel bar is in a low corrosion
rate state. The activation of nonwelded steel bars in concrete with cracks begins at an early stage. The
activation of nonwelded steel bars in concrete is advanced by approximately 14 h due to cracks. As
reported by Lopez-Calvo [39], cracks are found to be an influencing factor promoting the corrosion of
steel in concrete.
0 20 40 60 800
50
100
150
200
250
Time (h)
RP(Ω
·cm
2×
10
3)
0.0
0.1
0.2
0.3
0.4
Co
rro
sio
n c
urr
ent
den
sity
(μA
/cm
2)
(a)
0 5 10 15 20 250
160
320
480
640
800
0.0
0.1
0.2
0.3
0.4
Co
rro
sion
curr
ent
den
sity
(μA
/cm
2)
RP(Ω
·cm
2×
10
3)
Time(h)
(b)
Figure 13. Calculated corrosion current density and RP of nonwelded steel bars in concrete: (a) concrete
without cracks and (b) concrete with cracks

Int. J. Electrochem. Sci., Vol. 16, 2021
14
3.2.2 Corrosion behaviour of welded steel bars in concrete with and without cracks
The change in the corrosion current of the welded steel bars in concrete was monitored in real-
time through a camera, as shown in Figure 14. The initial current value of the welded CR & CR samples
was relatively low. From the point at which the current suddenly changes, it can be concluded that the
cracking time of the welded steel bars of LC & LC, LC & LC-crack, LC & CR, LC & CR-crack, CR &
CR, and CR & CR-crack in concrete is 50 h, 22 h, 36.5 h, 12 h, 50.5 h, and 15.5 h, respectively. The
order of the total power-on time is CR & CR > LC & CR > LC & LC > LC & LC-crack > CR & CR-
crack > LC & CR-crack. In addition, the order of the accelerated current magnitude during power-on is:
LC & LC-crack > LC & CR-crack > LC & LC > LC & CR > CR & CR-crack > CR & CR. In summary,
it can be concluded that the LC & CR-crack samples have the fastest corrosion rate and the shortest
cracking time. The main reason for this is that the progress of galvanic corrosion has been promoted by
cracks for LC & CR welded steel bars. As reported by Pantelis [40], galvanic corrosion appears as the
preferential corrosion type on HAZ, owing to the different corrosion susceptibilities of the distinct
weldment microstructures. Additionally, the CR & CR sample has the slowest corrosion rate and the
longest cracking time. The cracking time of welded steel bars in concrete is advanced by approximately
30 h due to cracks.
0 10 20 30 40 50 60 7010
20
30
40
50
60
LC&LC
LC&CR
CR&CR
Acc
eler
ated
curr
ent(
mA
)
Time(h)
(a)
0 5 10 15 20 25 30
20
40
60
80
100
LC&LC
LC&CR
CR&CR
(b)
Acc
eler
ated
curr
ent(
mA
)
Time(h)
Figure 14. The change in the accelerated current with time: (a) concrete without cracks and (b) concrete
with cracks
Figure 15 shows the Nyquist and Bode plots of welded steel bars in concrete with and without
cracks. The curve position of the welded steel bars in concrete with cracks is significantly shifted to the
left relative to that of the concrete without cracks. This indicates that under the conditions of accelerated
corrosion, the welded steel bars in concrete with cracks corrode significantly faster than those in concrete
without cracks. The slope of welded LC & LC curve changes significantly when the acceleration time is
15 h.

Int. J. Electrochem. Sci., Vol. 16, 2021
15
0 200 400 600 8000
200
400
600
800
Zre(Ω·cm2)
0h
6h
12h
18h
24h
30h
Zim
(Ω·c
m2)
(a)
-3 -2 -1 0 1 2 3 4 5 6
-40
-30
-20
-10
0(b)
Ph
ase
ang
le (
deg
)
lgf (Hz)
0h
6h
12h
18h
24h
30h
0 200 400 600 800 10000
200
400
600
800
1000 0h
6h
9h
12h
15h
18h
Zim
(Ω·c
m2)
Zre(Ω·cm2)
(c)
-3 -2 -1 0 1 2 3 4 5 6
-60
-50
-40
-30
-20
-10
0 (d)
Ph
ase
ang
le (
deg
)
lgf (Hz)
0h
6h
9h
12h
15h
18h
0 200 400 600 800 10000
200
400
600
800
1000(e)
0h
6h
12h
18h
24h
30h
36h
Zre(Ω·cm2)
Zim
(Ω·c
m2)
-3 -2 -1 0 1 2 3 4 5 6
-50
-40
-30
-20
-10
0 (f)
Ph
ase
ang
le (
deg
)
lgf (Hz)
0h
6h
12h
18h
24h
30h
36h
0 200 400 6000
200
400
600
(g) 0h
6h
9h
12h
15h
18h
Zre(Ω·cm2)
Zim
(Ω·c
m2)
-3 -2 -1 0 1 2 3 4 5 6
-40
-30
-20
-10
0(h)
Ph
ase
ang
le (
deg
)
lgf (Hz)
0h
6h
9h
12h
15h
18h
0 300 600 900 12000
300
600
900
1200
(i)
0h
6h
12h
18h
24h
30h
Zre(Ω·cm2)
Zim
(Ω·c
m2)
-3 -2 -1 0 1 2 3 4 5 6
-50
-40
-30
-20
-10
0 (j)
Ph
ase
ang
le (
deg
)
lgf (Hz)
0h
6h
12h
18h
24h
30h

Int. J. Electrochem. Sci., Vol. 16, 2021
16
0 200 400 6000
200
400
600
(k) 0h
6h
9h
12h
15h
18h
Zre(Ω·cm2)
Zim
(Ω·c
m2)
-3 -2 -1 0 1 2 3 4 5 6
-40
-30
-20
-10
0 (l)
Ph
ase
ang
le (
deg
)
lgf (Hz)
0h
6h
9h
12h
15h
18h
Figure 15. Nyquist and Bode plots of welded steel bars in concrete with and without cracks: (a) Nyquist
plots of LC & LC, (b) Bode plots of LC & LC, (c) Nyquist plots of LC & LC-crack, (d) Bode
plots of LC & LC-crack, (e) Nyquist plots of LC & CR, (f) Bode plots of LC & CR, (g) Nyquist
plots of LC & CR-crack, (h) Bode plots of LC & CR-crack, (i) Nyquist plots of CR & CR, (j)
Bode plots of CR & CR, (k) Nyquist plots of CR & CR-crack, and (l) Bode plots of CR & CR-
crack
However, for the other types, the same phenomenon is not found. In addition, the Bode plots
show that as the energization time increases, the phase angle of welded steel bars with cracks decreases
more significantly. Moreover, the absolute value of the initial phase angle of CR & CR-crack is the
smallest, indicating that cracks have the greatest impact on the welding of corrosion-resistant steel bars.
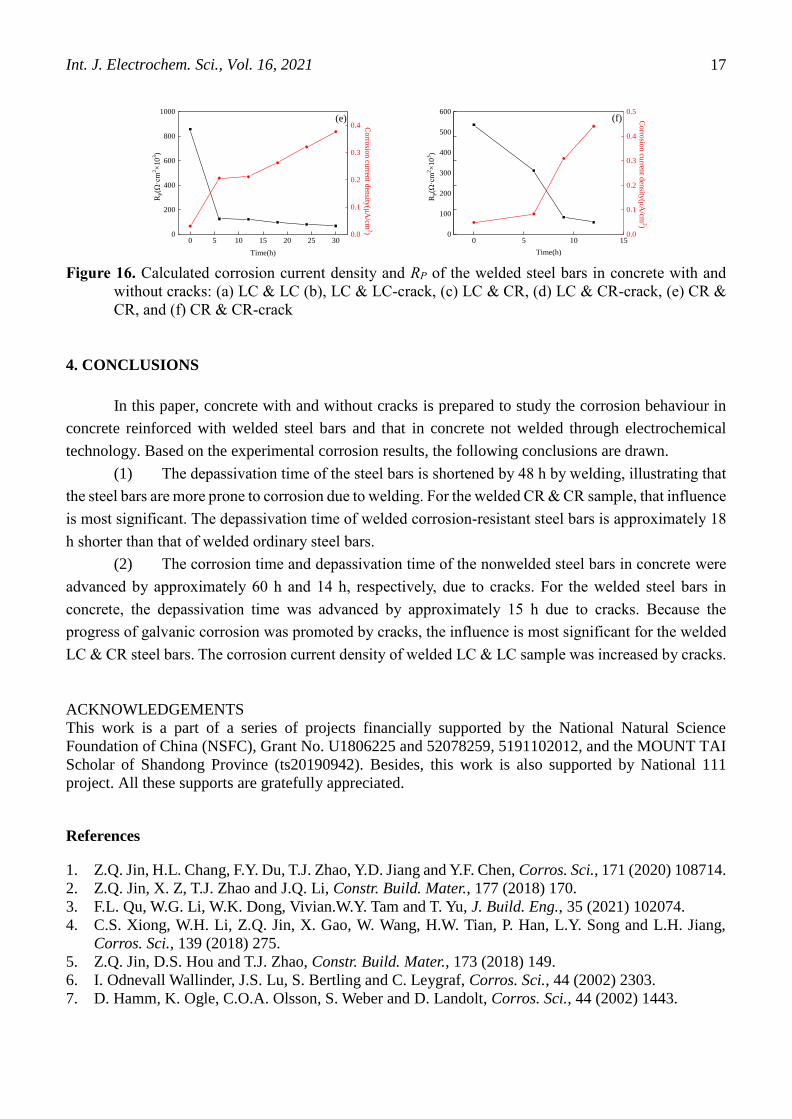
Figure 16 shows the polarization resistance and corrosion current density of the welded steel bars
in concrete with and without cracks. The acceleration time of welded steel bars in concrete without
cracks is approximately twice as long as that in concrete with cracks. For the welded LC & LC sample,
the corrosion current density exceeded 0.5 μA/cm2 when the acceleration time was 18 h. This illustrates
that for the welded LC & LC sample, the corrosion current density was increased by cracks. In addition,
the activation of welded steel bars in concrete is advanced by approximately 15 h due to cracks.
0 5 10 15 20 25 300
200
400
600
800
1000
0.0
0.1
0.2
0.3
0.4
RP(Ω
·cm
2×
10
3)
Time (h)
Co
rrosio
n cu
rrent d
ensity
(μA
/cm2)
(a)
0 5 10 15 20
0
200
400
600
800
1000(b)
Time(h)
RP(Ω
·cm
2×
10
3)
0.0
0.1
0.2
0.3
0.4
0.5
0.6 Co
rrosio
n cu
rrent d
ensity
(μA
/cm2)
0 5 10 15 20 25 30
50
100
150
200
250
300
350(c)
RP(Ω
·cm
2×
10
3)
Time (h)
Co
rrosio
n cu
rrent d
ensity
(μA
/cm2)0.1
0.2
0.3
0.4
0 5 10 15 200
200
400
600
800
1000(d)
Co
rrosio
n cu
rrent d
ensity
(μA
/cm2)
Time(h)
RP(Ω
·cm
2×
10
3)
0.0
0.1
0.2
0.3
0.4
Int. J. Electrochem. Sci., Vol. 16, 2021
17
0 5 10 15 20 25 300
200
400
600
800
1000(e)
Time(h)
RP(Ω
·cm
2×
10
3)
0.0
0.1
0.2
0.3
0.4
Co
rrosio
n cu
rrent d
ensity
(μA
/cm2)
0 5 10 150
100
200
300
400
500
600(f)
Time(h)
Co
rrosio
n cu
rrent d
ensity
(μA
/cm2)
RP(Ω
·cm
2×
10
3)
0.0
0.1
0.2
0.3
0.4
0.5
Figure 16. Calculated corrosion current density and RP of the welded steel bars in concrete with and
without cracks: (a) LC & LC (b), LC & LC-crack, (c) LC & CR, (d) LC & CR-crack, (e) CR &
CR, and (f) CR & CR-crack
4. CONCLUSIONS
In this paper, concrete with and without cracks is prepared to study the corrosion behaviour in
concrete reinforced with welded steel bars and that in concrete not welded through electrochemical
technology. Based on the experimental corrosion results, the following conclusions are drawn.
(1) The depassivation time of the steel bars is shortened by 48 h by welding, illustrating that
the steel bars are more prone to corrosion due to welding. For the welded CR & CR sample, that influence
is most significant. The depassivation time of welded corrosion-resistant steel bars is approximately 18
h shorter than that of welded ordinary steel bars.
(2) The corrosion time and depassivation time of the nonwelded steel bars in concrete were
advanced by approximately 60 h and 14 h, respectively, due to cracks. For the welded steel bars in
concrete, the depassivation time was advanced by approximately 15 h due to cracks. Because the
progress of galvanic corrosion was promoted by cracks, the influence is most significant for the welded
LC & CR steel bars. The corrosion current density of welded LC & LC sample was increased by cracks.
ACKNOWLEDGEMENTS
This work is a part of a series of projects financially supported by the National Natural Science
Foundation of China (NSFC), Grant No. U1806225 and 52078259, 5191102012, and the MOUNT TAI
Scholar of Shandong Province (ts20190942). Besides, this work is also supported by National 111
project. All these supports are gratefully appreciated.
References
1. Z.Q. Jin, H.L. Chang, F.Y. Du, T.J. Zhao, Y.D. Jiang and Y.F. Chen, Corros. Sci., 171 (2020) 108714.
2. Z.Q. Jin, X. Z, T.J. Zhao and J.Q. Li, Constr. Build. Mater., 177 (2018) 170.
3. F.L. Qu, W.G. Li, W.K. Dong, Vivian.W.Y. Tam and T. Yu, J. Build. Eng., 35 (2021) 102074.
4. C.S. Xiong, W.H. Li, Z.Q. Jin, X. Gao, W. Wang, H.W. Tian, P. Han, L.Y. Song and L.H. Jiang,
Corros. Sci., 139 (2018) 275.
5. Z.Q. Jin, D.S. Hou and T.J. Zhao, Constr. Build. Mater., 173 (2018) 149.
6. I. Odnevall Wallinder, J.S. Lu, S. Bertling and C. Leygraf, Corros. Sci., 44 (2002) 2303.
7. D. Hamm, K. Ogle, C.O.A. Olsson, S. Weber and D. Landolt, Corros. Sci., 44 (2002) 1443.

Int. J. Electrochem. Sci., Vol. 16, 2021
18
8. M. Criado, D.M. Bastidas, S. Fajardo, A. Fernández-Jiménez and J.M. Bastidas, Cem. Concr.
Compos., 33 (2011) 644.
9. M. Liu, X.Q. Cheng, X.G. Li, Z. Jin and H.X. Liu, Constr. Build. Mater., 93 (2015) 884.
10. M. F. Hurley and J. R. Scully, Corr05., 62 (2006) 892.
11. L. Freire, M.J. Carmezim, M.G.S. Ferreira and M.F. Montemor, Electrochim. Acta, 55 (2010) 6174.
12. M. Serdar, L.V. Žulj and D. Bjegović, Corros. Sci., 69 (2013) 149.
13. C. Garcia, F. Martin, P. de Tiedra, Y. Blanco and M. Lopez, Corros. Sci., 50 (2008) 1184.
14. C. Garcia, M.P. de Tiedra, Y. Blanco, O. Martin and F. Martin, Corros. Sci., 50 (2008) 2390.
15. M. Dadfar, M.H. Fathi, F. Karimzadeh, M.R. Dadfar and A. Saatchi, Mater. Lett., 61 (2007) 2343.
16. H. Kokawa, M. Shimada, M. Michiuchi, Z.J. Wang and Y.S. Sato, Acta Mater., 55 (2007) 5401.
17. S. Tokita, K. Kadoi, S. Aoki and H. Inoue, Corros. Sci., 175 (2020) 108867.
18. M.A. Derakhshi, J. Kangazian and M. Shamanian, Vac., 161 (2019) 371.
19. R.K. Gupta and N. Birbilis, Corros. Sci., 92 (2015) 1.
20. C.M. Lin, H.L. Tsai, C.D. Cheng and C. Yang, Eng. Fail. Anal., 21 (2012) 9.
21. S.W. Tang, Y. Yao, C. Andrade and Z.J. Li, Cem. Concr. Res., 78 (2015) 143.
22. A. Gnanarathinam, D. Palanisamy, N. Manikandan, A. Devaraju and D. Arulkirubakaran, Mater.
Today:. Proc., (2020).
23. K.F. Li and L. Li, Cem. Concr. Res., 124 (2019) 105811.
24. Z.Q. Jin, X. Zhao, T.J. Zhao and L. Yang, Constr. Build. Mater., 113 (2016) 805.
25. K.J. Wang, D.C. Jansen, S.P. Shah and A.F. Karr, Cem. Concr. Res., 27 (1997) 381.
26. M. Ismail, A. Toumi, R. François and R. Gagné, Cem. Concr. Res., 38 (2008) 1106.
27. S.Y. Jang, B.S. Kim and B.H. Oh, Cem. Concr. Res., 41 (2011) 9.
28. W.J. Zhu, R. François, C.P. Zhang and D.L. Zhang, Cem. Concr. Res., 103 (2018) 66.
29. C. Cao, M.M.S. Cheung and B.Y.B. Chan, Corros. Sci., 69 (2013) 97.
30. F. Xu, Y.F. Xiao, S.G. Wang, W.W. Li, W.Q. Liu and D.S. Du, Constr. Build. Mater., 180 (2018) 55.
31. F.Y. Du, Z.Q. Jin, W. She, C.S. Xiong, G.Y. Feng and J.F. Fan, Constr. Build. Mater., 263 (2020)
120099.
32. Y.S. Ji, Y.J. Hu, L.L. Zhang and Z.Z. Bao, Cem. Concr. Res., 69 (2016) 28.
33. Z.Y. Ai, J.Y. Jiang, W. Sun, D. Song, H. Ma, J.C. Zhang and D.Q. Wang, Appl. Surf. Sci., 389 (2016).
34. D.V. Ribeiro and J.C.C. Abrantes, Constr. Build. Mater., 111 (2016) 98.
35. J.J. Shi, J. Ming, W. Sun and Y.M. Zhang, Constr. Build. Mater., 149 (2017) 315.
36. C. Andrade and C. Alonso, Constr. Build. Mater., 10 (1996) 315.
37. Z.Y. Zhang, Z.Y. Wang, Y.M. Jiang, H. Tan, D. Han, Y.J. Guo and J. Li, Corros. Sci., 62 (2012) 42.
38. Z.Q. Zhang, H.Y. Jing, L.Y. Xu, Y.D. Han, L. Zhao and X.Q. Lv, Corros. Sci., 141 (2018) 30.
39. H.Z. Lopez-Calvo, P. Montes-García, V.G. Jiménez-Quero, H. Gómez-Barranco, T.W. Bremner and
M.D.A. Thomas, Cem. Concr. Compos., 88 (2018) 200.
40. D.I. Pantelis and T.E. Tsiourva, Trends in Oil and Gas Corrosion Research and Technologies,
Woodhead Publishing, (2017) Boston, America.
© 2021 The Authors. Published by ESG (www.electrochemsci.org). This article is an open access
article distributed under the terms and conditions of the Creative Commons Attribution license
(http://creativecommons.org/licenses/by/4.0/).