Embed Size (px)
Citation preview

Corrosion Behaviour of Alumix 123 P/M Alloy and AA2014-T6 in 3.5wt% NaCl
by
William David Judge
Submitted in partial fulfillment of the requirements
for the degree of Master of Applied Science
at
Dalhousie University
Halifax, Nova Scotia
August 2015
© Copyright by William David Judge, 2015

ii
This thesis is dedicated to my grandfather, Larry Judge, for his love and support
throughout my life

iii
TABLE OF CONTENTS
LIST OF TABLES .......................................................................................................... vii
LIST OF FIGURES ......................................................................................................... ix
ABSTRACT .................................................................................................................... xvi
LIST OF ABBREVIATIONS AND SYMBOLS USED ............................................ xvii
ACKNOWLEDGEMENTS .......................................................................................... xix
CHAPTER 1 INTRODUCTION ............................................................................... 1
CHAPTER 2 BACKGROUND .................................................................................. 2
2.1 ALUMINUM-COPPER ALLOY SYSTEMS .................................................................. 2
2.1.1 Wrought Alloys .............................................................................................. 2
2.1.2 Powder Metallurgy Alloys ............................................................................ 5
2.1.3 Temper Designations .................................................................................... 7
2.2 PROCESSING AND STRUCTURE OF ALUMINUM-COPPER ALLOYS ........................... 9
2.2.1 Wrought Alloys .............................................................................................. 9
2.2.1.1 Ingot Casting ............................................................................................. 9
2.2.1.2 Forming ................................................................................................... 11
2.2.1.3 Precipitation Hardening ......................................................................... 13
2.2.1.4 Characteristics of Secondary Phases ...................................................... 15
2.2.2 Powder Metallurgy Alloys .......................................................................... 17
2.2.2.1 Raw Materials ......................................................................................... 17
2.2.2.2 Compaction ............................................................................................. 20
2.2.2.3 Sintering .................................................................................................. 22
2.2.2.4 Structure Formation ................................................................................ 25
2.2.2.5 Secondary Operations ............................................................................. 30
2.3 CORROSION BEHAVIOUR OF ALUMINUM−COPPER ALLOYS IN NEAR-
NEUTRAL, CHLORIDE-CONTAINING ELECTROLYTES ........................................... 32
2.3.1 Electrode Processes .................................................................................... 32
2.3.1.1 Cathodic Processes ................................................................................. 32
2.3.1.2 Anodic Processes ..................................................................................... 36
2.3.2 Electrochemical Characteristics of Intermetallic Phases ........................... 39
2.3.3 Localized Corrosion .................................................................................... 42
2.3.3.1 Passive Film Breakdown ......................................................................... 42
2.3.3.2 Localized Corrosion Involving Intermetallic Phases .............................. 44
2.3.4 Effect of Major Alloying Elements .............................................................. 46

iv
2.3.5 Effect of Minor Alloying Elements and Impurities ..................................... 47
2.3.6 Effect of Thermomechanical Treatment and Sequence History .................. 49
CHAPTER 3 EXPERIMENTAL ............................................................................. 52
3.1 POWDER METALLURGY PROCESSING .................................................................. 52
3.1.1 Compaction ................................................................................................. 52
3.1.2 Sintering ...................................................................................................... 53
3.1.3 Sizing ........................................................................................................... 54
3.1.4 Processing Response ................................................................................... 55
3.2 ELECTROCHEMICAL TESTING .............................................................................. 56
3.2.1 Sample Preparation .................................................................................... 56
3.2.2 Electrolyte Preparation .............................................................................. 58
3.2.3 Electrochemical Cell & Potentiostat .......................................................... 59
3.2.4 Open Circuit Potential ................................................................................ 61
3.2.5 Potentiodynamic Polarization .................................................................... 62
3.2.5.1 Cathodic Polarization ............................................................................. 62
3.2.5.2 Cyclic Polarization .................................................................................. 62
3.2.6 Potentiostatic Polarization ......................................................................... 64
3.3 MATERIALS CHARACTERIZATION ........................................................................ 65
3.3.1 Chemical Analysis ....................................................................................... 65
3.3.2 Particle Size Analysis .................................................................................. 66
3.3.3 Optical Microscopy ..................................................................................... 66
3.3.4 Scanning Electron Microscopy ................................................................... 67
3.3.5 X-Ray Diffraction ........................................................................................ 69
CHAPTER 4 MATERIALS ..................................................................................... 71
CHAPTER 5 CHARACTERIZATION OF RAW MATERIALS ........................ 72
5.1 ALUMIX 123 ........................................................................................................ 72
5.2 AA2014-T6 ......................................................................................................... 78
CHAPTER 6 P/M PROCESSING OF ALUMIX 123 ............................................ 85
CHAPTER 7 CORROSION BEHAVIOUR OF ALUMIX 123 P/M
ALLOY AND AA2014-T6. PART I: OCP AND
POTENTIODYNAMIC POLARIZATION .......................................................... 97
ABSTRACT ...................................................................................................................... 98
7.1 INTRODUCTION .................................................................................................... 99
7.2 EXPERIMENTAL ................................................................................................. 101

v
7.2.1 Materials ................................................................................................... 101
7.2.2 P/M Processing ......................................................................................... 102
7.2.3 Materials Preparation .............................................................................. 103
7.2.4 Electrochemical Testing ............................................................................ 104
7.2.5 Materials Characterization ....................................................................... 105
7.3 RESULTS & DISCUSSION .................................................................................... 106
7.3.1 Microstructure of Alumix 123-(T1, T2) and AA2014-T6 .......................... 106
7.3.2 Electrochemistry ....................................................................................... 112
7.3.3 Microstructure after Open Circuit Corrosion .......................................... 120
7.4 CONCLUSIONS ................................................................................................... 128
7.5 ACKNOWLEDGEMENTS ...................................................................................... 129
CHAPTER 8 CORROSION BEHAVIOUR OF ALUMIX 123 P/M
ALLOY AND AA2014-T6. PART II: POTENTIOSTATIC
POLARIZATION .................................................................................................. 130
ABSTRACT .................................................................................................................... 131
8.1 INTRODUCTION .................................................................................................. 132
8.2 EXPERIMENTAL ................................................................................................. 133
8.2.1 Materials and Materials Preparation ....................................................... 133
8.2.2 Electrochemical Testing ............................................................................ 134
8.2.3 Materials Characterization ....................................................................... 135
8.3 RESULTS AND DISCUSSION ................................................................................ 136
8.3.1 Electrochemistry ....................................................................................... 136
8.3.2 Microstructure after Potentiostatic Polarization ...................................... 144
8.3.2.1 Alumix 123-(T1, T2) .............................................................................. 144
8.3.2.2 AA2014-T6 ............................................................................................ 153
8.4 CONCLUSIONS ................................................................................................... 161
8.5 ACKNOWLEDGEMENTS ...................................................................................... 162
CHAPTER 9 EFFECT OF COMPACTION PRESSURE ON
CORROSION BEHAVIOUR OF ALUMIX 123 ............................................... 163
CHAPTER 10 CONCLUSIONS .............................................................................. 170
10.1 FUTURE WORK .................................................................................................. 173
REFERENCES .............................................................................................................. 175
APPENDIX A FULL RESULTS OF CHEMICAL ANALYSES ......................... 193
APPENDIX B FULL RESULTS OF PARTICLE SIZE ANALYSIS .................. 195

vi
APPENDIX C LABORATORY SINTER PROFILES .......................................... 196
APPENDIX D FULL RESULTS OF DENSITY, DIMENSION, AND
MASS CHANGE ................................................................................................... 197
APPENDIX E FULL RESULTS OF EFFECT OF COMPACTION
PRESSURE ON CORROSION BEHAVIOUR OF ALUMIX 123 .................. 200

vii
LIST OF TABLES
Table 2.1 – General composition limits for wrought aluminum-copper alloys [11]. .......... 3
Table 2.2 – Compositions of some commercial ‘press-and-sinter’ aluminum-
copper P/M alloys (wt%) [1,3,17]. Balance Al. ........................................... 5
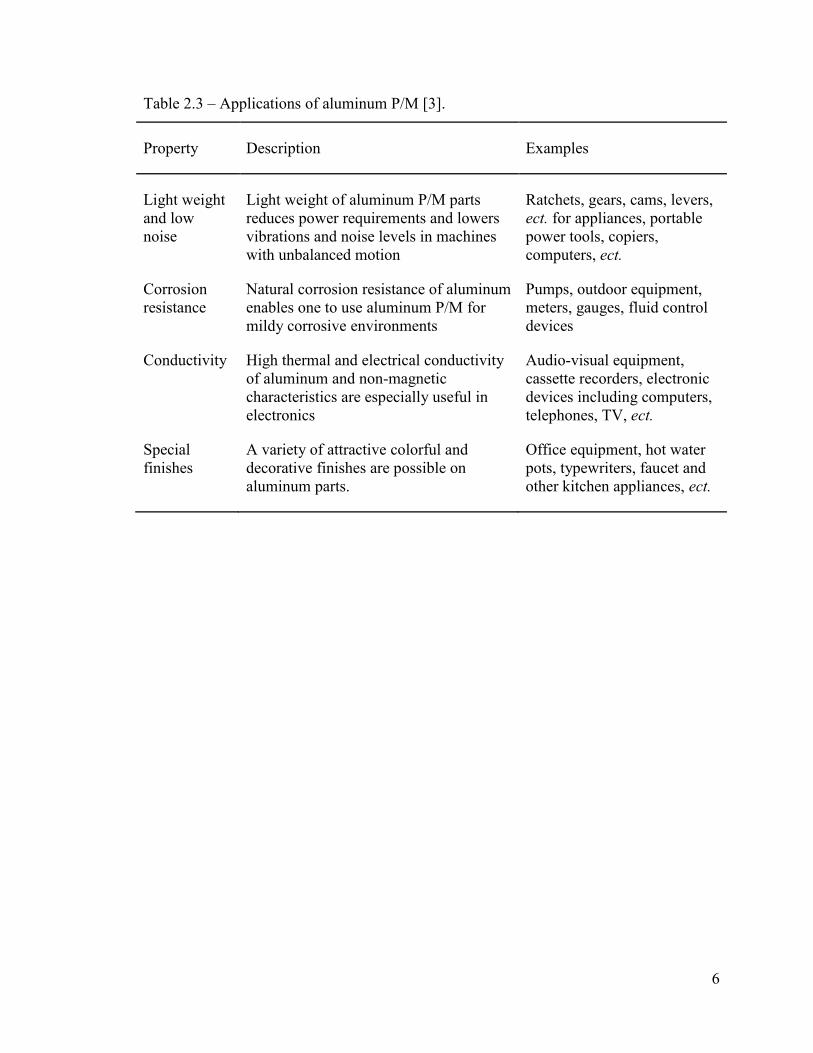
Table 2.3 – Applications of aluminum P/M [3]. .................................................................. 6
Table 2.4 – Basic temper designations for wrought aluminum alloys [9]. .......................... 8
Table 2.5 – Some temper designations used for P/M aluminum alloys [5,7]. ..................... 8
Table 2.6 – Phases formed in aluminum-copper alloys [11]. ............................................ 16
Table 5.1 – Chemical analysis of Alumix 123 by ICP-OES (wt%). Balance Al. .............. 72
Table 5.2 – Summary of EDS point analyses of different particles in Alumix 123
(wt%). ......................................................................................................... 74
Table 5.3 – Chemical analysis of AA2014-T6 by ICP-OES (wt%). Balance Al. ............. 79
Table 5.4 – Summary of EDS point analyses of major phases in AA2014-T6
(wt%). ......................................................................................................... 82
Table 6.1 – Summary of EDS point analyses of major phases in industrially
sintered Alumix 123-T1 (wt%). ................................................................. 95
Table 7.1 – Chemical analyses of Alumix 123 and AA2014 by ICP-OES (wt%). ......... 102
Table 7.2 – Summary of electrochemical data of Alumix 123-(T1, T2) and
AA2014-T6. Values are given as mean ± standard deviation (no. of
experiments). ............................................................................................ 119
Table A.1 – Full results of chemical analysis of AA2014. .............................................. 193
Table A.2 – Full results of chemical analysis of Alumix 123. ........................................ 194
Table B.1 – Full results of particle size analysis of Alumix 123. .................................... 195
Table D.1 – Green density of Alumix 123. ...................................................................... 197
Table D.2 – Density of laboratory sintered Alumix 123.................................................. 197
Table D.3 – Dimension and mass change of laboratory sintered Alumix 123. ............... 198
Table D.4 – Density of industrially sintered Alumix 123. ............................................... 198
Table D.5 – Dimension and mass change of industrially sintered Alumix 123............... 198
Table D.6 – Effect of sizing pressure on reduction in height of industrially sintered
Alumix 123. ............................................................................................. 199

viii
Table E.1 – Effect of compaction pressure on electrochemical parameters of
laboratory sintered Alumix 123-T1.......................................................... 200
Table E.2 – Effect of compaction pressure on corrosion rate of laboratory sintered
Alumix 123-T1. ........................................................................................ 200
ix
LIST OF FIGURES
Figure 2.1 – Relationships among commonly used aluminum-copper alloys [12]. ............ 4
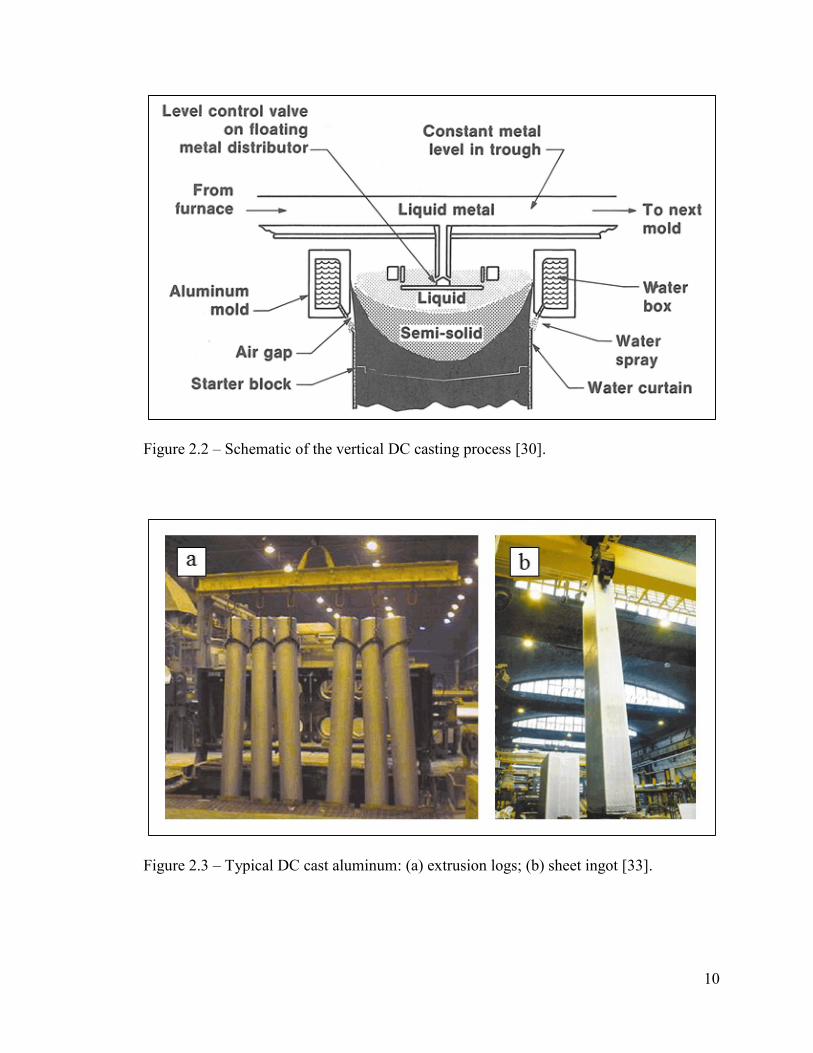
Figure 2.2 – Schematic of the vertical DC casting process [30]. ....................................... 10
Figure 2.3 – Typical DC cast aluminum: (a) extrusion logs; (b) sheet ingot [33]. ............ 10
Figure 2.4 – Directions in wrought materials [11]. ............................................................ 12
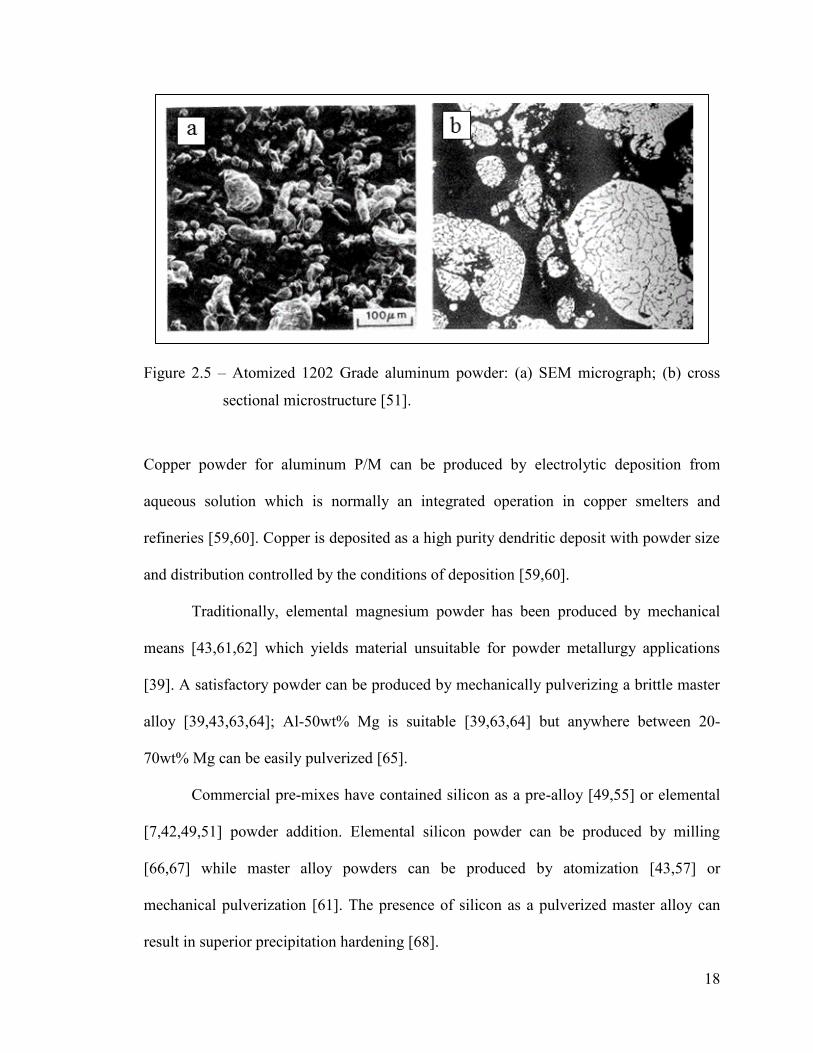
Figure 2.5 – Atomized 1202 Grade aluminum powder: (a) SEM micrograph; (b)
cross sectional microstructure [51]. ........................................................... 18
Figure 2.6 – Flowchart of the production process for ECKA ALUMIX blends and
process control measures [36]. ................................................................... 19
Figure 2.7 – Density variation during the pressing of a cylindrical compact in a
floating die [70]. ......................................................................................... 21
Figure 2.8 – Continuous muffle type furnace for sintering aluminum [3]. ........................ 23
Figure 2.9 – Heating cycle for a continuously sintered aluminum P/M part [75].
The dashed line indicates the new heating cycle for the furnace
after a design modification. ........................................................................ 23
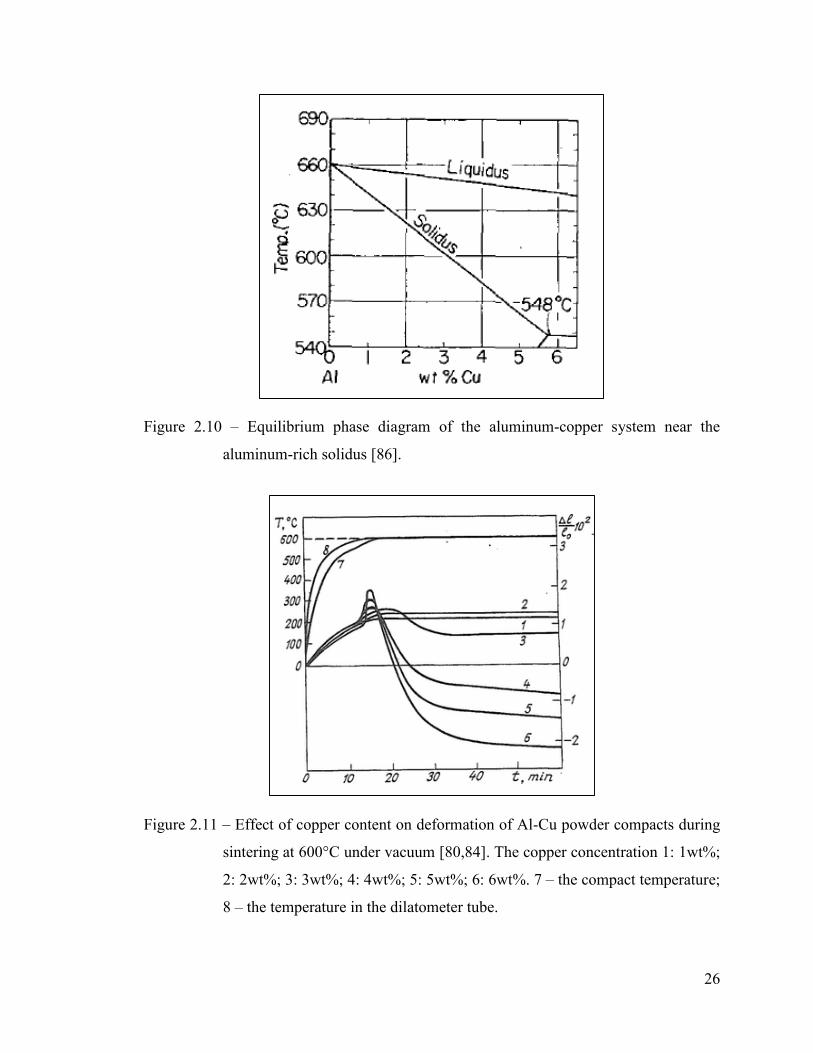
Figure 2.10 – Equilibrium phase diagram of the aluminum-copper system near the
aluminum-rich solidus [86]. ....................................................................... 26
Figure 2.11 – Effect of copper content on deformation of Al-Cu powder compacts
during sintering at 600°C under vacuum [80,84]. The copper
concentration 1: 1wt%; 2: 2wt%; 3: 3wt%; 4: 4wt%; 5: 5wt%; 6:
6wt%. 7 – the compact temperature; 8 – the temperature in the
dilatometer tube. ........................................................................................ 26
Figure 2.12 – Structure formation of Al-6Cu sintered at 620°C under vacuum
[80,82]: (a) during growth stage; (b) during shrinkage stage; (c)
after shrinkage; (d) after isothermal hold. Etched, ×140
magnification. ............................................................................................ 28
Figure 2.13 – Dilatometer curve of Al-3.8Cu-1Mg-0.7Si under argon and nitrogen
[91]. The expansion and initial shrinkage is similar under both
atmospheres, but the total shrinkage is substantially greater under
nitrogen. ..................................................................................................... 29
Figure 2.14 – Secondary operations on aluminum P/M parts [2]: (a) coining for a
detailed surface; (b) machining with better chip characteristics than
wrought counterparts. ................................................................................ 31

x
Figure 2.15 – Cathodic polarization curves for duralumin (i.e. AA2017-T4) in
0.5M NaCl [102-107]. 1: direct course with agitated electrolyte; 2:
reverse course with agitated electrolyte; 3: with static electrolyte;
4: technical unalloyed aluminum in agitated electrolyte. Abscissa is
in VNHE. ...................................................................................................... 34
Figure 2.16 – Schematic representation of Al-solution interface in chloride
solutions [133]: (a) at the open circuit potential; (b) during the
anodic polarization. .................................................................................... 37
Figure 2.17 – Corrosion potentials for intermetallic compounds common in
aluminum alloys as a function of sodium chloride concentration in
pH=6 solution. Data from [144]. ................................................................ 40
Figure 2.18 – Electrode kinetic scheme for pit initiation on pure aluminum in
chloride solutions [142]. In Al(oxide)OH: 'Al' represents the atoms
immediately below the oxide layer and 'OH' represents the outer
layer of surface hydroxyl groups. VO•• represents an oxygen
vacancy in the oxide film. ClO• represents a chloride ion occupying
an oxygen lattice site. ................................................................................. 43
Figure 2.19 – Schematic illustration of a mechanism for redistribution of copper
by dissolution of large CuMgAl2 and CuAl2 intermetallic particles
in aluminum alloys [166]. .......................................................................... 45
Figure 2.20 – The potentials of the grains and grain boundaries of an Al-4wt%Cu
alloy which was heat-treated at 930°F (500°C), quenched in cold
water, and aged at 375°F (190°C) [195]. Solution of 53gL–1 NaCl +
3gL–1 H2O2. ................................................................................................ 50
Figure 3.1 – Floating die assembly for powder compaction. ............................................. 52
Figure 3.2 – Horizontal tube furnace for sintering. ........................................................... 54
Figure 3.3 – Water purification system for electrolyte preparation. .................................. 58
Figure 3.4 – Electrochemical cell and potentiostat used for electrochemical
measurement. ............................................................................................. 60
Figure 3.5 – Schematic of the working electrode (from Princeton Applied
Research) ................................................................................................... 60
Figure 3.6 – Inductively coupled plasma emission spectrometer for chemical
analyses. ..................................................................................................... 65
Figure 3.7 – Laser diffraction particle size analyzer. ......................................................... 66
Figure 3.8 – Optical microscope and digital capture system. ............................................ 67

xi
Figure 3.9 – Scanning electron microscope with integrated energy dispersive X-
ray spectroscopy system. ........................................................................... 69
Figure 3.10 – X-ray diffractometer. ................................................................................... 70
Figure 5.1 – Particle size distribution of Alumix 123. ....................................................... 73
Figure 5.2 – Optical micrograph of polished cross section of Alumix 123 pre-mix
mounted in epoxy resin (unetched). ........................................................... 73
Figure 5.3 – SEM micrographs of different particles in Alumix 123: (a) elemental
aluminum; (b) elemental copper; (c) magnesium-containing master
alloy; (d) silicon-containing master alloy. The powders were
mounted on silver chloride paste. .............................................................. 74
Figure 5.4 – Optical micrograph of cross sectional microstructure of different
particles of Alumix 123 mounted in epoxy resin (etched): (a)
elemental aluminum; (b) silicon-containing master alloy. ........................ 75
Figure 5.5 – XRD pattern of Alumix 123 powder pre-mix: (a) full pattern; (b)
close up of smaller peaks. .......................................................................... 75
Figure 5.6 – SEM micrographs of surface characteristics of different particles in
Alumix 123: (a), (b) magnesium-containing master alloy; (c), (d)
silicon-containing master alloy. The powders were mounted on
silver chloride paste. .................................................................................. 77
Figure 5.7 – Optical micrographs of AA2014-T6 (etched): (a) transverse plane; (b)
longitudinal plane. ...................................................................................... 79
Figure 5.8 – SEM micrographs of AA2014-T6: (a) transverse plane; (b)
longitudinal plane. ...................................................................................... 80
Figure 5.9 – SEM micrographs of constituents in AA2014-T6 (transverse plane):
(a) round, globular constituent; (b) Chinese script constituent. ................. 81
Figure 5.10 – XRD pattern of AA2014-T6 (transverse plane): (a) full pattern; (b)
close-up of smaller peaks. .......................................................................... 82
Figure 6.1 – Green and sintered density of Alumix 123 as a function of
compaction pressure. .................................................................................. 86
Figure 6.2 – Sintering-induced dimensional and mass changes measured for green
compacts of Alumix 123 as functions of compaction pressure. ................ 86
Figure 6.3 – Optical micrographs stitched together to show the distribution of
porosity throughout the longitudinal plane of industrially sintered
(unetched): (a) Alumix 123-T1; (b) Alumix 123-T2(5%). ........................ 88
xii
Figure 6.4 – Sizing curve for industrially sintered Alumix 123 specimens. All
specimens were initially compacted at 300MPa. ....................................... 90
Figure 6.5 – SEM micrograph of industrially sintered: (a) Alumix 123-T1; (b)
Alumix123-T2(5%) with no polishing. ...................................................... 91
Figure 6.6 – Optical micrograph of industrially sintered Alumix 123-T1 (etched).
The micrograph was taken in longitudinal plane near the edge of
the sample. ................................................................................................. 93
Figure 6.7 – SEM micrograph of industrially sintered Alumix 123-T1. ........................... 93
Figure 6.8 – SEM micrographs of constituents in industrially sintered Alumix
123-T1: (a) copper-rich intergranular; (b) iron-containing
intergranular; (c) iron-containing needles. ................................................. 94
Figure 6.9 – XRD pattern of industrially sintered Alumix 123-T1 (polished): (a)
full scan; (b) close up of smaller peaks. ..................................................... 95
Figure 7.1 – SEM micrographs of Alumix 123-T1: a) general microstructure; b)
close up of an aluminum grain; c) close up of a carbon-rich area
which is believed to be a remnant from the EBS lubricant. ..................... 108
Figure 7.2 – SEM micrographs of Alumix 123-T2: a) general microstructure; b)
close up an aluminum grain showing cracks in the refractory
surface layer as a result of the sizing operation. ...................................... 110
Figure 7.3 – SEM micrograph of AA2014-T6. The phase with the round, globular
morphology is believed to be θ-CuAl2 and the phase with the
Chinese script morphology is believed to be α-AlFeMnSi. ..................... 112
Figure 7.4 – Attainment of the open circuit potential (OCP) of Alumix 123-(T1,
T2) and AA2014-T6 as a function of time: (a) full transient; (b)
close up of initial transient. ...................................................................... 114
Figure 7.5 – Cathodic polarization diagrams of Alumix 123-(T1, T2) and
AA2014-T6 using a scan rate of 0.1667mVs–1. ....................................... 116
Figure 7.6 – Polarization diagrams of Alumix 123-(T1, T2) and AA2014-T6 using
a scan rate of 0.1667mVs–1. The reverse scans have been excluded
from the figure for clarity......................................................................... 117
Figure 7.7 – Cyclic polarization diagram of Alumix 123-T1 using a scan rate of
0.1667mVs–1. ........................................................................................... 120
Figure 7.8 – SEM micrograph of Alumix 123-T1 after 2 hours at OCP. ........................ 121
xiii
Figure 7.9 – SEM micrographs of pitting in Alumix 123-T1 after 2 hours at OCP:
a) cluster of pits which are not associated with copper-rich phases
in the area; b) high magnification micrograph showing interior
structure of some pits (indicated by arrows). ........................................... 123
Figure 7.10 – SEM micrograph of the cross sectional microstructure of Alumix
123-T1 after 2 hours at OCP. The corrosion product indicated by
the arrows was found by EDS analyses to consist primarily of
aluminum and oxygen. ............................................................................. 124
Figure 7.11 – SEM micrograph of Alumix 123-T2 after 2 hours at OCP. ...................... 124
Figure 7.12 – SEM micrograph of blistering in Alumix 123-T2 after 2 hours at
OCP. ......................................................................................................... 125
Figure 7.13 – SEM micrograph of AA2014-T6 after 1 hour at OCP. ............................. 127
Figure 7.14 – SEM micrograph of pits formed in the matrix of AA2014-T6 after 1
hour at OCP. ............................................................................................. 127
Figure 8.1 – Current transients during potentiostatic polarization at –1.50VSCE. ............ 136
Figure 8.2 – Current transients during potentiostatic polarization at –1.10VSCE. ............ 138
Figure 8.3 – Current transients during potentiostatic polarization at –0.75VSCE. ............ 140
Figure 8.4 – Current transients during potentiostatic polarization at –0.70VSCE. ............ 142
Figure 8.5 – Current transients during potentiostatic polarization at –0.50VSCE. ............ 143
Figure 8.6 – SEM micrograph of Alumix 123-T1 after potentiostatic polarization
at –1.10VSCE showing areas of film breakdown: (a) in the matrix;
(b) over a copper-rich intermetallic. ........................................................ 146
Figure 8.7 – SEM micrograph of Alumix 123-T2 after potentiostatic polarization
at –0.75VSCE showing two hemispherical cathodic pits. .......................... 147
Figure 8.8 – SEM micrograph of Alumix 123-T1 after potentiostatic polarization
at –0.75VSCE showing the deposition of corrosion product near
residual porosity. ...................................................................................... 149
Figure 8.9 – SEM micrograph of the cross section of Alumix 123-T1 after
potentiostatic polarization at –0.75VSCE showing corrosion product
accumulated in residual porosity. ............................................................ 149
Figure 8.10 – SEM micrograph of Alumix 123-T1 after potentiostatic polarization
at –0.75VSCE showing an acicular corrosion product in some areas. ....... 150
Figure 8.11 – SEM micrograph of Alumix 123-T1 after potentiostatic polarization
at –0.70VSCE showing a uniform distribution of corrosion product. ........ 151

xiv
Figure 8.12 – SEM micrograph of the cross section of Alumix 123-T1 after
potentiostatic polarization at –0.70VSCE showing intergranular
corrosion (indicated by arrows). .............................................................. 152
Figure 8.13 – SEM micrograph of the cross section of Alumix 123-T1 after
potentiostatic polarization at –0.50VSCE showing sporadic
crystallographic pitting (indicated by arrows) and extensive
intergranular corrosion. ............................................................................ 152
Figure 8.14 – SEM micrograph of AA2014-T6 after potentiostatic polarization at
–1.10VSCE showing cracking in the matrix surrounding θ-CuAl2,
possibly a result of hydrogen evolution. .................................................. 154
Figure 8.15 – SEM micrographs of AA2014-T6 after potentiostatic polarization at
–1.10VSCE showing: (a) θ-CuAl2 and (b) α-AlFeMnSi. The fine,
nodular deposit on the intermetallics is postulated to be rich in
copper. ...................................................................................................... 156
Figure 8.16 – SEM micrographs of AA2014-T6 after potentiostatic polarization at
–0.75VSCE showing: (a, b) α-AlFeMnSi and (c) θ-CuAl2. It is
postulated that cathodic trenching around α-AlFeMnSi liberated
copper from the matrix in a non-Faradaic process. .................................. 158
Figure 8.17 – SEM micrograph of the cross section of AA2014-T6 after
potentiostatic polarization at –0.70VSCE showing crystallographic
pitting and intergranular corrosion. .......................................................... 160
Figure 8.18 – SEM micrograph of the cross section of AA2014-T6 after
potentiostatic polarization at –0.50VSCE showing extensive
crystallographic pitting. ........................................................................... 160
Figure 9.1 – Effect of compaction pressure on the evolution of the OCP of
laboratory sintered Alumix 123-T1.......................................................... 165
Figure 9.2 – Effect of compaction pressure on potentiodynamic polarization
curves of laboratory sintered Alumix 123-T1. The reverse scans
have been excluded from the figure for clarity. ....................................... 165
Figure 9.3 – Effect of compaction pressure on corrosion current (icorr) and passive
current (ipass) of laboratory sintered Alumix 123-T1. .............................. 168
Figure 9.4 – Effect of compaction pressure on pitting potential (Epit) and
repassivation potential (Erepass) of laboratory sintered Alumix 123-
T1. ............................................................................................................ 169
Figure 9.5 – Effect of compaction pressure on corrosion rate of laboratory sintered
Alumix 123-T1. ........................................................................................ 169

xv
Figure C.1 – Laboratory sinter profile for Alumix 123 samples compacted at 100,
200, and 300MPa which were subsequently corrosion tested. ................ 196
Figure C.2 – Laboratory sinter profile for Alumix 123 samples compacted at 400,
500, and 600MPa which were subsequently corrosion tested. ................ 196

xvi
ABSTRACT
The corrosion behaviour of the commercial aluminum powder metallurgy (P/M) alloy
‘Alumix 123’ and a compositionally similar wrought alloy, AA2014-T6, has been studied
in naturally aerated 3.5wt% NaCl electrolyte by a variety of electrochemical methods and
the subsequent corrosion morphology characterized by scanning electron microscopy
(SEM) and energy dispersive X-ray spectroscopy (EDS). The P/M material was sintered
in an industrial setting and was studied in the ‘as-sintered’ condition or after a standard
sizing operation, denoted by the T1 and T2 temper, respectively. The electrochemical
methods employed included open circuit potential (OCP), cathodic potentiodynamic
polarization, cyclic potentiodynamic polarization, and potentiostatic polarization.
The OCP of Alumix 123-T1 stabilized at potentials near the onset of hydrogen evolution,
where corrosion was partially under anodic control and proceeded via cathodic hydrogen
evolution. This is postulated to be due to a reduction in cathode area or depassivation
induced by propagating crevice corrosion within residual porosity. In this state, most of
the anodic current on Alumix 123-T1 was generated from creviced areas within residual
porosity which eventually repassivated when the concentration of anodic reaction
products exceeded the solubility limit and precipitation occurred.
The OCP of Alumix 123-T2 stabilized at the pitting potential, where corrosion was
predominantely under cathodic control and proceeded via cathodic oxygen reduction. The
sizing operation of Alumix 123-T2 reduced the amount of residual porosity through
plastic deformation and sealed surface porosity with sizing fluid so that crevice corrosion
did not initiate.
In Alumix 123-(T1, T2), pitting was not always associated with copper- and iron-rich
intermetallics. This behaviour was attributed to the refractory layer formed on the P/M
materials as a result of the sintering process, which retained integrity over these
intermetallics. Above the pitting potential of Alumix 123-(T1, T2), crystallographic
pitting was scarcely observed and the majority of attack was intergranular in nature.
The OCP of AA2014-T6 stabilized at the pitting potential where corrosion was
predominantly under cathodic control and proceeded via cathodic oxygen reduction. In
AA2014-T6 pitting was associated with copper- and iron-rich intermetallics. SEM
observations of AA2014-T6 suggested that copper is redeposited on copper- and iron-rich
intermetallics and that cathodic trenching around iron-rich intermetallics may have
liberated copper from the matrix in a non-Faradaic process. Above the pitting potential of
AA2014-T6, there was extensive attack by crystallographic pitting and intergranular
corrosion.

xvii
LIST OF ABBREVIATIONS AND SYMBOLS USED
a.u. Arbitrary units
ads Adsorped
avg Average
AESEC Atomic emission spectroelectrochemistry
AMS Aerospace Material Specification
ASTM American Society for Testing and Materials
CR Corrosion rate
d Particle diameter
D10 Particle diameter at 10% of the cumulative particle size distribution
D50 Particle diameter at 50% of the cumulative particle size distribution
D90 Particle diameter at 90% of the cumulative particle size distribution
DC Direct-chill (casting)
Ecorr Corrosion potential
Epit Pitting potential
Erepass Repassivation potential
EBS Ethylene bisstearamide
EDS Energy dispersive X-ray spectroscopy
EW Equivalent weight
GP Guinier-Preston (zone)
hr Hour
icorr Corrosion current density
ipass Passive current density
ICP-OES Inductively coupled plasma optical emission spectroscopy
IGC Intergranular corrosion
ISO International Organization for Standardization
LPS Liquid phase sintering
m Mass
M Molarity
MEC Minerals Engineering Centre, Dalhousie University

xviii
MPIF Metal Powder Industries Federation
NDE Negative difference effect
NIST National Institute of Standards and Technology
NSERC National Sciences and Engineering Council of Canada
OCP Open circuit potential
P/M Powder metallurgy
PAR Princeton Applied Research
PDF Powder diffraction file
ppm Parts per million
sat’d Saturated
SCC Stress corrosion cracking
SCE Saturated calomel electrode; E = +0.241VSHE
SEM Scanning electron microscope
SHE Standard hydrogen electrode; E ≡ 0V
SSSS Super saturated solid solution
t Time
T Temperature
wt% Weight percent
XPS X-ray photoelectron spectroscopy
XRD X-ray diffraction
yr Year
βc Cathodic Tafel slope
θ Diffraction angle
λ Wavelength
ρ Density

xix
ACKNOWLEDGEMENTS
I am sincerely grateful to my supervisors, Dr. Georges Kipouros and Dr. Paul Bishop, for
their continued support and excellent leadership throughout the course of this work,
without this the culmination of this work would not be possible. I am also grateful for the
financial support provided by the National Sciences and Engineering Research Council of
Canada (NSERC) and AUTO21 Network of Centers of Excellence, and the industrial
cooperation from ECKA Granules and GKN Sinter Metals. I would like to thank Dr.
George Jarjoura and Dr. Abdulwahab Ibrahim for helpful discussions and assistance with
electrochemical instrumentation, and Dr. Kevin Plucknett for thorough review of this
work.
I would also like to thank a number of people at Dalhousie University for their help:
Allison Fulford and Hilary Lynd of Sexton Library, Marlyn McCann and Joe Wickens of
Document Delivery, Dean Grijm of the machine shop, Patricia Scallion of the Institute for
Research in Materials, Dan Chevalier and Gerald Fraser of the Minerals Engineering
Centre, Md. Aminul Islam of the Advanced Tribology Lab, Matt Harding and Randy
Cooke of the Particulate Material Research Group, and the rest of the students, faculty,
and staff of the Materials Engineering Program and Department of Process Engineering
and Applied Science.

1
CHAPTER 1 INTRODUCTION
Conventional ‘press-and-sinter’ powder metallurgy (P/M) aluminum alloys are
fabricated to near net shape and serve as a low-cost alternative to conventional die cast
and machined aluminum parts [1]. Aluminum P/M has found application where the high
strength, low weight, natural corrosion resistance, and good conductivity of aluminum
can be combined with the cost-effective mass production technology of P/M
manufacturing [1-3].
There is expected to be increased demand for aluminum P/M dependent upon current
research and development efforts with China and India identified as potential markets [1].
Most research and development has been focused on improving established material
properties such as modulus, high temperature strength, wear resistance, and fatigue [1];
however in other areas, such as corrosion resistance, even basic material properties
including corrosion rate have not been specified and made available to design engineers.
In this work, the corrosion behaviour of the commercial aluminum P/M alloy
‘Alumix 123’ has been evaluated as part of a continuing effort from our laboratory to
assess the corrosion behaviour of commercial aluminum P/M alloys with an emphasis on
electrochemistry [4]. Prior corrosion evaluations have been confined to salt spray tests
which only assign a letter-rating of ‘A’ through ‘E’ based on specimen appearance [5-7].
Electrochemical studies aim to identify fundamental corrosion mechanisms and provide
quantitative thermodynamic and kinetic information which can be used to predict material
performance and design systems of corrosion prevention and inhibition. The corrosion
behaviour of a compositionally similar wrought alloy, AA2014-T6, has been studied
simultaneously to provide a comparison to the P/M material.

2
CHAPTER 2 BACKGROUND
2.1 ALUMINUM-COPPER ALLOY SYSTEMS
2.1.1 Wrought Alloys
Several different types of wrought aluminum-copper alloys exist which can be
broadly categorized according to Table 2.1. Some relationships among some commonly
used aluminum-copper alloys are shown in Figure 2.1. These alloys comprise 2xxx series
in the Aluminum Association alloy designation system [8]. The second digit in 2xxx
indicates the alloy modification; ‘0’ being the original alloy and other values (1, 2, 3, etc.)
indicating modifications of the original alloy [9]. The third and fourth digits in 2xxx serve
to identify each unique alloy [9].
The development of aluminum-copper alloys began in 1906 after the accidental
discovery of natural aging of ‘duralumin,’ whose composition corresponds to present day
alloy 2017 [10]. The industrial use of duralumin was limited by its poor fabricability [10].
In 1926, alloy 2025 containing no magnesium and a controlled amount of silicon was
developed for improved forgability [10].
Alloy 2014 was then developed in 1928 in an attempt to combine the magnesium
addition of alloy 2017 with the silicon addition of alloy 2025 [10]. The result was an
alloy with improved forgability that also responded very well to artificial aging [10].
Alloy 2014 is used primarily as a general purpose high strength forging alloy but extruded
and rolled product are sometimes used as well [10].

3
Table 2.1 – General composition limits for wrought aluminum-copper alloys [11].
5% Cu
wrought
Durals Al-Cu-Ni
alloysa
Cu 4-6 3.0-5 2-5
Fe to 0.7 to 0.7 to 1.5
Si to 2 to 1.0 to 1.5
Mg < 0.1 0.4-1.7 0.1-2
Mn to 1.5 0.5-1.5 to 0.5
Ni to 1.0 < 0.2 0.5-2.5
Zn < 0.5 < 0.2 < 0.2
Sn < 0.1 < 0.05 < 0.05
Pb to 1 < 0.05 < 0.05
Bi to 1 < 0.05 < 0.05
Cd to 2 < 0.05 < 0.05
Li to 2 < 0.05 < 0.05
Ti to 0.1 to 0.1 to 0.1
V to 0.2 < 0.05 < 0.05
W < 0.05 < 0.05 < 0.05
Ag to 1 < 0.05 < 0.05
Zr to 0.5 to 0.2 < 0.05
Sb < 0.05 < 0.05 < 0.05
Cr to 0.2 to 0.2 to 0.2
aThese alloys can be subdivided in two groups: the
Y alloy type, whose basic composition is 4% Cu,
2% Ni, 1.5% Mg; and the Hyduminiums, which
usually have lower copper contents and in which
iron replaces some of the nickel.
The strength of alloy 2014 is primarily based off precipitation hardening. The
presence of magnesium and silicon together enhance aging [11]. The iron content is kept
as low as practically possible [11] as iron forms intermetallics which embrittle the alloy
and simultaneously reduce the amount of copper for artificial aging [11]. The embrittling
effect of iron is reduced by the presence of manganese – whose intermetallics are not
embrittling and absorb some iron [11].

4
Figure 2.1 – Relationships among commonly used aluminum-copper alloys [12].

5
2.1.2 Powder Metallurgy Alloys
Conventional ‘press-and-sinter’ aluminum P/M alloys were developed as a low-
cost alternative for small and complex conventional die cast and machined parts [13].
Some commercial P/M alloys based off the aluminum-copper alloy system that have been
developed, but not necessarily remain in production, are shown in Table 2.2.
Aluminum P/M was commercialized in the 1960s by Alcoa [14-16] and has been
in large scale commercial production [2,3,7,17-26] in the applications outlined in Table
2.3. Perhaps the most defining moment for aluminum P/M came in the early 1990s when
General Motors began manufacturing the camshaft bearing caps in the cylinder head
assembly of their Northstar engines from 201AB aluminum P/M alloy [27]. In one line of
Chrysler cars, 20 aluminum P/M cam caps are used per engine and offer 35% cost savings
over die cast and machined caps [28].
Table 2.2 – Compositions of some commercial ‘press-and-sinter’ aluminum-copper P/M
alloys (wt%) [1,3,17]. Balance Al.
Manufacturer Alloy Cu Mg Si Mn Sn
ALCAN 22 2.0 1.0 0.3 – –
ALCAN 24 4.4 0.5 0.9 0.4 –
ALCOA 201AB 4.4 0.5 0.8 – –
ALCOA 202AB 4.0 – – – –
AMPAL 2712 3.8 1.0 0.75 – –
AMPAL 2712A 4.4 0.5 0.6 – –
AMPAL 2905 3.0 1.2 0.25 – 0.6
ECKA 13 4.5 0.5 – – –
ECKA 123 4.5 0.5 0.7 – –
SINTERAL – 2.0 0.6 – – –
(various) – 3.4 0.6 0.5 – –
6
Table 2.3 – Applications of aluminum P/M [3].
Property Description Examples
Light weight
and low
noise
Light weight of aluminum P/M parts
reduces power requirements and lowers
vibrations and noise levels in machines
with unbalanced motion
Ratchets, gears, cams, levers,
ect. for appliances, portable
power tools, copiers,
computers, ect.
Corrosion
resistance
Natural corrosion resistance of aluminum
enables one to use aluminum P/M for
mildy corrosive environments
Pumps, outdoor equipment,
meters, gauges, fluid control
devices
Conductivity High thermal and electrical conductivity
of aluminum and non-magnetic
characteristics are especially useful in
electronics
Audio-visual equipment,
cassette recorders, electronic
devices including computers,
telephones, TV, ect.
Special
finishes
A variety of attractive colorful and
decorative finishes are possible on
aluminum parts.
Office equipment, hot water
pots, typewriters, faucet and
other kitchen appliances, ect.
7
2.1.3 Temper Designations
The temper designation system for aluminum alloys is used to indicate the
thermomechanical treatment and sequence history of an aluminum alloy product [9]. The
basic temper designation system, shown in Table 2.4, is applicable to all product forms.
The as-fabricated temper (-F) is used for shaped products with no special control
over the amount of strain hardening or thermal treatment during processing and usually
indicates a semi-finished product which will be further processed to a finished form or
temper [9]. The annealed temper (-O) is used for products that are thermally treated to the
lowest strength and highest ductility condition to increase workability [9]. The strain
hardened temper (-H) is used for products that are strengthened by varying amounts of
plastic deformation and, in some cases, supplementary thermal treatment [9]. Wrought
aluminum-copper alloys are rarely strain hardened [11]. The solution heat treated temper
(-W) is an unstable temper used for heat treated and quenched products, and indicates a
semi-finished product that will be subsequently worked or age hardened [9]. The heat
treated (-T) temper is for products thermally treated, with or without supplementary strain
hardening, to produce stable tempers [9]. Subsequent digits in the T1 to T10 tempers
indicate variations in the processing of heat treated products that can signify: residual
stress relief, modifications in quenching, heat treatment by user, additional cold work
between quenching and aging, additional cold work following aging, special corrosion
resistance, or special/premium properties [9].
The natural differences in P/M manufacturing have resulted in slight
modifications to the traditional definitions shown in Table 2.5. At present, there are no
standardized definitions for P/M tempers.

8
Table 2.4 – Basic temper designations for wrought aluminum alloys [9].
Letter Description Digit(s) Description
-F As fabricated
-O Annealed
-W Solution heat
treated
-H Strain hardened -H1 No thermal treatment
-H2 Partially annealed
-H3 Stabilized
-H4 Lacquered or painted
-T Heat treated -T1 Cooled from hot working, naturally aged
-T2 Cooled from hot working, cold worked, naturally
aged
-T3 Solution heat treated, cold worked, naturally aged
-T4 Solution heat treated, naturally aged
-T5 Cooled from hot working, artificially aged
-T6 Solution heat treated, artificially aged
-T7 Solution heat treated, overaged/stabilized
-T8 Solution heat treated, cold worked, artificially aged
-T9 Solution heat treated, artificially aged, cold worked
-T10 Cooled from hot working, cold worked, artificially
aged
Table 2.5 – Some temper designations used for P/M aluminum alloys [5,7].
Letter Description Digit(s) Description
-O Annealeda
-T Heat
treated
-T1 Cooled from sintering temperature to 260°C in nitrogen
(at uncontrolled rate), air cooled to room temperature
-T2 As sintered, repressed
-T4 Solution heat treated in air, cold water quenched,
naturally aged
-T41 Repressed, heat treated to T4
-T6 Solution heat treated in air, cold water quenched,
artificially aged
-T61 Repressed, heat treated to T6
-T8 Solution heat treated in air, repressed, artificially aged aAnnealed 1 hour, furnace cooled at max rate of 10°C∙hr–1 to 260°C or lower

9
2.2 PROCESSING AND STRUCTURE OF ALUMINUM-COPPER ALLOYS
2.2.1 Wrought Alloys
2.2.1.1 Ingot Casting
Melting, remelting, or holding of primary aluminum typically takes place in a
reverberatory furnace which operates continuously [29]. Alloy additions are added
directly to the melt [29]. Elements with low melting points are introduced as pure metals
and elements with high melting points are introduced as master alloys to help with
dissolution [29]. If dissolution remains problematic, master alloys can also be added
directly to the electrolytic cell where there is higher turbulence and temperatures [29].
Once a satisfactory composition is achieved the melt is treated to reduce hydrogen,
alkalis, and non-metallic inclusions [30]. The melt is then degassed and fluxed with Ar-
Cl2 gas mixtures and finally passed through ceramic foam filters to remove insoluble
constituents [30].
Virtually all aluminum alloy ingots are cast by the direct-chill (DC) process [30],
shown in Figure 2.2. Extrusion ingot is cast in cylindrical form and sheet ingot in
rectangular form [30], Figure 2.3. The ingots are not cast under equilibrium conditions, so
the structure is dependent upon the casting variables as well as chemical composition
[11,30-32]. Important structural characteristics of the ingot include: grain size and shape,
cell size and dendrite arm spacing, macro- and micro-segregation, and primary
constituents [30]. Grain size is controlled by grain refining additions whereas cell size,
segregation, and primary constituents are affected by composition and solidification rate
[30,32].
10
Figure 2.2 – Schematic of the vertical DC casting process [30].
Figure 2.3 – Typical DC cast aluminum: (a) extrusion logs; (b) sheet ingot [33].

11
2.2.1.2 Forming
The as-cast ingot structure has numerous characteristics that are unattractive for
subsequent operations, including macro- and micro-segregation, low melting point
eutectics, brittle intermetallic phases, supersaturated solid solutions of finely dispersed
precipitates, and skin enriched with up to 30wt% copper containing primary iron-,
manganese-, or nickel-bearing crystals [11,30,31,34]. It is standard practice to scalp the
ingot to remove the skin and then homogenize it to help remedy the rest of the
unattractive characteristics [11].
Homogenization temperature is determined by alloy composition; generally the
temperature of the lowest melting point eutectic should not be exceeded [11,34].
Magnesium-free alloys can be homogenized at 525-540°C while alloys containing
magnesium must be homogenized below 525°C [11]. Homogenization time depends on
diffusivity considerations; large ingots can require up to 24 hours [11]. Excessive
homogenization time or temperature will lead to recrystallization and grain growth [11].
Ingots for hot working are cooled slowly from the homogenization to the working
temperature in order to precipitate and spheroidize soluble constituents [11]. Hot working
temperatures range from 375-525°C [11].
Generally at least 60-70% deformation is required to produce the desired
properties in wrought products [11]. The properties of wrought products are commonly
anisotropic; the reference directions are shown in Figure 2.4. Light reductions result in
only slight directionality and coarse grains while heavy reductions lead to extreme
elongation of grains in the working direction [11].

12
Figure 2.4 – Directions in wrought materials [11].
Formability is highest in the annealed condition and lower in the naturally or
artificially aged condition [11]. Alloys containing magnesium are significantly more
prone to cracking [11]. Iron, silicon, nickel, manganese, titanium, and chromium have
little effect on formability [11]. In magnesium-containing alloys, bismuth, lead, and tin
form brittle intermetallics that reduce formability [11]. Dissolved hydrogen reduces
formability and can lead to blistering and cracking [11].
Copper lowers the recrystallization temperature and slows the recrystallization
rate, especially if present in solution or as fine precipitates [11]. Iron, silicon, magnesium,
and nickel do not affect the recrystallization temperature but can refine grain size [11].
Chromium, manganese, and vanadium only raise the recrystallization when in solid
solution [11].

13
2.2.1.3 Precipitation Hardening
Materials are precipitation hardened only after some form of solution heat
treatment and accelerated cooling [11]. To optimize this process the solution heat
treatment temperature must be below the solidus and must be held for sufficient time to
diffuse all soluble elements and distribute them evenly [11] – specifics are dependent
upon alloy composition and product form [11,35]. Most wrought products are quenched
in to a cold water bath with a maximum permissible quench delay of 5-15 seconds [35].
Five distinct structures have been identified in the precipitation hardening process
of aluminum-copper alloys [11]: the supersaturated solid solution (SSSS), Guinier-
Preston (GP) 1 zones, GP2 zones (θ" phase), θ' phase, and θ phase (CuAl2). As aging
progresses these structures typically appear consecutively in the order: SSSS → GP1 →
GP2 (θ") → θ' → θ [11].
GP1 zones are one or two atomic layers of pure copper in the (100) planes of the
matrix surrounded by planes of almost entirely aluminum atoms [11]. They are coherent
with the matrix and distort (shrink) the lattice up to 10-15 planes away from the copper
layers [11]. These zones grow up to a size of 30-70×10–10m at 300°K or 100-150×10–10m
at 350-400°K [11]. As GP1 zones grow, hardness is increased and ductility decreases
[11].
GP2 zones have a tetragonal lattice with five interchanging sheets of aluminum
and copper (3 sheets aluminum, 2 sheets copper) in the (100) planes [11]. GP2 zones are
coherent with the matrix and can grow to 100-1000×10–10m in diameter and 10-40×
10–10m thick [11]. As GP2 zones grow, hardness increases as dislocation motion is

14
inhibited by the increased lattice strain [11]. When the stress fields from different GP2
zones reach each other peak hardness is reached and θ' phase begins to appear [11].
The θ' phase has a tetragonal lattice and is considered a separate phase from the
matrix [11]. Each θ' particle is surrounded by a ring of dislocations so that no lattice
strains are present in the matrix [11].
θ' particles occur at defects, slip planes, and grain boundaries and grow up to 100-
6000×10–10m in diameter and 100-150×10–10m thick depending on aging time and
temperature [11]. When the matrix softens and recrystallizes to form the ring of
dislocations surrounding θ' particles, new advancing dislocations are able to bypass θ'
particles due to the lack of lattice strain in the matrix [11]. Maximum strength occurs with
a mixture of GP2 zones and θ' precipitates [11].
The equilibrium θ phase (CuAl2) forms after prolonged aging time or temperature
[11]. It has a tetragonal lattice and is incoherent with the matrix [11]. It can nucleate from
θ' particles or directly from the matrix, which results in different crystallographic
orientation relationships between θ and the matrix [11].

15
2.2.1.4 Characteristics of Secondary Phases
Secondary phases can be classified as either soluble or insoluble [11]. The soluble
phases are comprised of: copper, lithium, magnesium, silicon, or zinc [11]. The insoluble
phases contain at least one element with limited solid solubility such as iron, manganese,
or nickel [11]. A summary of phases likely to occur in aluminum-copper alloys is shown
in Table 2.6.
The soluble phases formed depend on the amount of soluble elements available
and their ratio [11]. With high Mg:Cu and Mg:Si ratios, the CuMg4Al6 phase is favoured
[11]. At lower Mg:Cu and Mg:Si ratios, the CuMgAl2 phase is formed [11]. If the ratio
Mg:Si is low then Cu2Mg8Si6Al5 is formed, typically in conjunction with CuAl2 [11].
Some copper can be confined to iron-, manganese-, or nickel-bearing compounds, Table
2.6, including (CuFe)Al6, Cu2FeAl7, (CuFeMn)Al6, Cu2Mn3Al20, and Cu4NiAl7 [11].
When >1wt% silicon is present, however, iron and manganese can preferentially combine
with silicon as FeSiAl5 over Cu2FeAl7 and (CuFeMn)3Si2Al15 over (CuFeMn)Al6 and
Cu2Mn3Al20 [11], Table 2.6.
Magnesium is usually combined with silicon or copper, except in alloys
containing bismuth, lead, or tin where Mg2Pb, Mg2Bi3, or Mg2Sn are formed [11]. In
commercial alloys magnesium never combines with iron or manganese [11]. When
silicon-containing insoluble phases are formed, silicon will first appear as Mg2Si and then
recombine with iron or manganese [11]. When nickel is present with manganese or iron it
will combine with them as the Mn3NiAl16 or FeNiAl9 at the expense of their other
compounds: (CuNi)2Al3, Cu4NiAl7, Cu2Mn3Al20, and (FeMn)Al6 [11].

16
Table 2.6 – Phases formed in aluminum-copper alloys [11].
16

17
2.2.2 Powder Metallurgy Alloys
2.2.2.1 Raw Materials
Virtually all P/M grade aluminum powder is produced by air atomization [1,3,36].
Air atomized aluminum powder is preferred due to its superior shape, size, and flow
characteristics [14,15,37-42]. The shape of air atomized aluminum powder is irregular or
tear-drop, Figure 2.5 [43-45]. Particle size and distribution are controlled by process
variables [36,39,46,47] and through the application of post-atomization size classification
techniques. Air atomized aluminum is normally sieved in to different grades by
manufacturers [1] – the P/M grade powder having an average particle size of 40-100µm
[3,39,48,49]. Typical commercial composition limits are ~0.15wt%Fe (max), ~0.10wt%Si
(max), and 0.30wt%O (max) [3,14,15,23,42,44,47]. The oxide is mostly present as a thin
protective layer on the surface of the powder particles [23,41,47,50] and is thought to be
at least partially amorphous [1]. The oxide layer contains ‘oxide islands’ throughout the
surface which are a result of the oxygen content of the atomizing gas [44]. Powder
particles solidify with a dendritic cell pattern, Figure 2.5, with iron and silicon-enriched
cell boundaries [50,51].
Aluminum pre-mixes can be prepared from: (i) purely elemental mixes, (ii)
partially elemental mix and partly pre-alloyed powder, or (iii) completely pre-alloyed
powder [3]. Many investigators have found elemental copper powder superior to pre-
alloyed or composite powder [14,15,39,52-54] and this reflects in the use of elemental
copper in commercial pre-mixes [7,14,15,42,49,55]. Finer copper powders (d<45µm) are
superior over coarser powders with respect to sintered tensile strength [40,56], sintered
pore size [56,57] and surface finish after sintering [57]. Such powders also promote the
formation of liquid earlier during sintering [57,58].
18
Figure 2.5 – Atomized 1202 Grade aluminum powder: (a) SEM micrograph; (b) cross
sectional microstructure [51].
Copper powder for aluminum P/M can be produced by electrolytic deposition from
aqueous solution which is normally an integrated operation in copper smelters and
refineries [59,60]. Copper is deposited as a high purity dendritic deposit with powder size
and distribution controlled by the conditions of deposition [59,60].
Traditionally, elemental magnesium powder has been produced by mechanical
means [43,61,62] which yields material unsuitable for powder metallurgy applications
[39]. A satisfactory powder can be produced by mechanically pulverizing a brittle master
alloy [39,43,63,64]; Al-50wt% Mg is suitable [39,63,64] but anywhere between 20-
70wt% Mg can be easily pulverized [65].
Commercial pre-mixes have contained silicon as a pre-alloy [49,55] or elemental
[7,42,49,51] powder addition. Elemental silicon powder can be produced by milling
[66,67] while master alloy powders can be produced by atomization [43,57] or
mechanical pulverization [61]. The presence of silicon as a pulverized master alloy can
result in superior precipitation hardening [68].

19
Commercial aluminum P/M alloys typically contain 1.2 or 1.5wt% admixed
internal lubricant [1,3] with a low ash and moisture content to maintain the low dew point
during sintering [3,7,14,15,19]. Zinc stearate lubricants have been used in the past,
however these partially dissociate to zinc oxide which interferes with sintering [3,66,69].
Organic fatty acids or waxes are more suitable [14,15,19,42]. The prevailing lubricant is
ethylene bisstearamide (EBS) [1,3].
Raw materials are normally blended in an inert atmosphere at the plant of the
powder manufacturer [3,36,42]. Powder pre-mixes are subject to several quality control
checks, such as particle size distribution, apparent density, tap density, and flowability
[2,36]. A flowchart detailing the manufacturing of an aluminum pre-mix is shown in
Figure 2.6. Oxidation during storage or transport is normally not an issue [2].
Figure 2.6 – Flowchart of the production process for ECKA ALUMIX blends and process
control measures [36].

20
2.2.2.2 Compaction
Aluminum P/M alloys are compacted with standard mechanical or hydraulic
presses in closed steel dies [14,15,19,20,23], although tungsten carbide tools are
recommended for high-volume production runs [3,19,23]. This can be done on existing
tooling designed for ferrous or cuprous P/M materials [2,5-7,14,15,42]. In fact, the
excellent compressibility of aluminum powder allows for larger cross sectional parts to be
pressed on the same equipment [2,3,5,7,14,15,42].
Internal or die wall lubrication is an absolute necessity for compaction
[3,7,14,15,42]. Without lubricant, aluminum powder has severe seizing and galling
characteristics against steel dies [14,15,18,39,68]. Lubricant also promotes a homogenous
density distribution [55], however there is always some density variation due to friction
on the die wall and die face [70], Figure 2.7. Increasing lubricant content decreases
ejection force but also decreases green strength by inhibiting the cold welding of particles
[55]. Lubricant also helps prevent dusting during transfer of the powder pre-mix to the
hopper [3].
Successful compaction requires information on flow rate, apparent density, and
compressibility of powder blends [49]. Compressibility of aluminum powder is sensitive
to impurities, particularly iron, silicon, and oxygen [39]. Compressibility decreases with
increasing copper content, probably due to the mechanical properties of the metal [66,71].
Copper particles can assist in compaction and ejection by dislodging aluminum particles
that have adhered to the die wall [68]. Silicon slightly lowers compressibility but reduces
ejection pressure and improves green surface finish [66].

21
Figure 2.7 – Density variation during the pressing of a cylindrical compact in a floating
die [70].
Pressing to 85-95% green density is desirable [42,71,72] as higher compaction
pressures cause pressure cracks [54], increase distortion during sintering [73], and result
in blowholes and poor densification [40,71]. At higher green densities, close particle
contacts and large contact areas interfere with liquid phase sintering [74]. The good
compressibility of aluminum powder yields compacts with high green strength [23] but
this is also partially a result of the nodular and irregular shape of the air atomized
aluminum powder which allows for good interlocking [7,14,15]. Handling parts after
pressing is not normally a problem due to the high green strength of aluminum P/M alloys
[3].

22
2.2.2.3 Sintering
Nitrogen is the preferred atmosphere for industrial sintering of aluminum P/M
alloys [1-3,14,15,42,75]. Nitrogen offers the best sintered properties
[1,3,14,15,42,50,75,76], is economical in bulk quantities, and requires no special
handling, gas re-generation, or adsorbent drying [1,3,7,75,76]. The dew point of the
nitrogen atmosphere should be controlled to below –40°C (equivalent to ~120ppm
moisture) [1-3,7,14,15,42,75], although the optimum dew point varies somewhat between
different alloys [1] . At higher moisture contents sintered properties decrease sharply
[14,15,19] and the lubricant can oxidize during de-lubrication [55]. Standard grade
nitrogen normally has a dew point of –60°C, but moisture and oxygen are picked up on
the way to the sinter zone [3].
Most commercial aluminum P/M alloys are sintered between 590-620°C for 15-30
minutes [1-3,7,14,15,42,75,76]. Industrially, sintering typically takes place in a muffle-
type furnace with a wire mesh belt conveyor [3,7,14,15,42,75,77], Figure 2.8, that has a
thermal profile similar to the one shown in Figure 2.9. These furnaces operate with three
different zones. Namely those for de-lubrication, sintering, and cooling [3].
The lubricant is removed as a vapour phase during the de-lubrication stage which
typically takes place at 345-425°C for 15-20 minutes [1,3,23,75,76]. The upper limit is
controlled by the onset of diffusional reactions between components of the powder pre-
mix [55]. A directed nitrogen curtain flows counter to the belt movement so that lubricant
vapor and other volatiles are prevented from entering the sinter zone [3,23,75].

23
Figure 2.8 – Continuous muffle type furnace for sintering aluminum [3].
Figure 2.9 – Heating cycle for a continuously sintered aluminum P/M part [75]. The
dashed line indicates the new heating cycle for the furnace after a design
modification.
24
Precise temperature and dew point control are necessary for the sinter zone
[1,3,14,15,42,75]. Sintering temperature should be controlled to ±5°C [1,2,7,20,23,42]
and temperature across the belt width should not vary more than ±2.8°C [1,3,27,75]. The
dew point and thermal profile of the sintering zone is normally checked weekly, while
complete furnace profiles are checked on a monthly basis [3]. At the exit of the sinter
zone is a gas inlet where diverted curtains of pre-heated nitrogen are introduced to
maintain a lubricant- and moisture-free atmosphere in the sinter zone and to prevent back-
diffusion of cold nitrogen from the cool zone [3,75]. The gas flow is pre-heated to the
sinter temperature to prevent the cooling of smaller parts [1,3].
The parts exit the sinter zone in to a water-jacketed section [75] and experience
cooling rates of about 5-30°C per minute [73]. The protective atmosphere should be
maintained in the cooling zone until parts cool to at least 427°C or less [23]. Afterwards
parts can be cooled to room temperature in air [23]. At the exit of the cool zone, a depth
curtain made of fibrous glass wool, 30-60cm long helps keep a dry atmosphere in the
furnace [3].
These furnaces can typically sinter about 1000 to 2500 parts per hour depending
on part shape and size [1]. A 6 inch wide mesh belt furnace sinters about 40lb per hour
[75] while using an 18 inch belt can increase production rates up to 250lb per hour [2].
Belt speeds can be 2-10 inches per minute because of the good thermal conductivity of
aluminum and short sinter times [23].

25
2.2.2.4 Structure Formation
During heating, prior to liquid phase sintering (LPS), there are several
transformations that occur on the surface of aluminum particles: absorbed water is
dehydrated, Al(OH)3 is decomposed to γ-Al2O3, and amorphous Al2O3 is crystallized to γ-
Al2O3 [1,3]. The density and volume change associated with crystallization [1] and the
thermal expansion of underlying aluminum metal [3,78,79] is thought to crack the oxide
layer and expose bare aluminum.
The LPS of aluminum-copper based alloys occurs mostly under non-equilibrium
conditions but can still be interpreted via the equilibrium aluminum-copper phase
diagram [73], Figure 2.10. LPS takes place in at least two stages [80], Figure 2.11. The
first stage, which is characterized by volume growth [40,48,55,57,58,66,69,74,80-84],
commences above 548°C where contact melting of aluminum and copper particles occurs
[52,53,55,57,58,72,83-88]. All metallic copper and surrounding aluminum particles are
rapidly consumed, leaving behind ‘melt-off’ pores at the sites of original copper particles
[40,58,78,79,84-87]. The appearance of the eutectic melt occurs locally and does not
induce any volume changes [80,84]. The liquid phase rapidly spreads over the surface of
aluminum particles, possibly between metallic aluminum and its oxide layer in some
places [3,23,51-53,55,57,58,89], and copper from the melt begins diffusing in to the
aluminum particles resulting in compact growth [3,58,80-84]. The compact growth stage
lasts a matter of minutes and occurs before the compact has reached the isothermal
sintering temperature [80]. The magnitude of growth surpasses the amount which can be
attributed to the diffusion of copper from the melt [80]. The additional growth is probably
due to ‘negative rearrangement’ caused by non-uniform diffusion over the surface of
particles [48,80,84].
26
Figure 2.10 – Equilibrium phase diagram of the aluminum-copper system near the
aluminum-rich solidus [86].
Figure 2.11 – Effect of copper content on deformation of Al-Cu powder compacts during
sintering at 600°C under vacuum [80,84]. The copper concentration 1: 1wt%;
2: 2wt%; 3: 3wt%; 4: 4wt%; 5: 5wt%; 6: 6wt%. 7 – the compact temperature;
8 – the temperature in the dilatometer tube.

27
The second stage of sintering, which is characterized by volume shrinkage
[40,48,55,58,66,69,74,80-84,86], occurs only if, for a given alloy composition, the
isothermal sintering temperature lies above the solidus and below the liquidus on the
aluminum-copper phase diagram [72,80,82,84,86], Figure 2.10. As the temperature of the
compact rises, the decreasing solid solubility of copper, Figure 2.10, results in the
formation and decomposition of a super saturated solid solution to a liquid phase along
grain and subgrain boundaries within aluminum particles [48,58,80-82,84]. Volume
shrinkage is brought about primarily by rearrangement of the fragmented aluminum
particles from capillary forces [66,80,83,84]. The contribution of solution-reprecipitation
to densification is probably small [80-83]. The majority of shrinkage occurs before the
compact has reached its isothermal sintering temperature, which makes it unlikely that the
composition of the liquid or solid is close enough to equilibrium for the solution-
reprecipitation mechanism to occur [80-83].
Once the isothermal sintering temperature is reached, the melt becomes saturated
and the solid and liquid phase can be considered to be in chemical equilibrium which
allows for grain growth by the solution-reprecipitation process [82,85,87], Figure 2.12.
During this stage a polyhedral structure is formed and the microstructure coarsens with
longer isothermal holding times [40,82,85,87].
Additions of magnesium enhance LPS [1] and magnesium also plays a role in
reducing the aluminum oxide layer [1,90], probably via formation of the spinel phase
(MgAl2O4) [1,90]. Magnesium is also thought to act as a local oxygen getter [1]. In
magnesium-containing alloys, the expansion event occurs earlier and the magnitude of
densification increases [55,91]. The addition of magnesium as an elemental or Al-
35wt%Mg eutectic master alloy leads to the fastest densification, but these alloys coarsen

28
rapidly when sintered above 595°C [92,93]. Excessive sintering times can lead to
evaporation of magnesium near the surface [76,93].
Small amounts (<1wt%) of silicon also enhance LPS [1,91]. However, these
alloys are more sensitive to sintering conditions due to the tendency of silicon to oxidize
[68]. Larger amounts of elemental silicon (2.5 or 5.5wt%) cause excess liquid during
sintering, slow the diffusion of copper and result in undissolved silicon along the grain
boundaries, even after long sinter times [66].
Sintering may also be significantly influenced by the presence of trace elements
[91,94,95] and impurities [96]. This is usually a result of influencing the amount of liquid
phase present [95] or affecting surface tension and wettability [91,94].
Figure 2.12 – Structure formation of Al-6Cu sintered at 620°C under vacuum [80,82]: (a)
during growth stage; (b) during shrinkage stage; (c) after shrinkage; (d) after
isothermal hold. Etched, ×140 magnification.

29
The sintering atmosphere plays an important role in densification [1,97], Figure
2.13. During the densification stage under nitrogen, the first rapid contraction is followed
by a second contraction with lower shrinkage rate and then a third rapid contraction [1].
The second contraction event is related to the formation of individual nanoscale
aluminum nitride (AlN) crystals inside pores [1] which assist in densification by locally
consuming nitrogen and establishing a pressure differential. The third rapid shrinkage
event is due to pore filling by a persistent liquid whose meniscus forces are destabilized
by the pressure differential created by the formation of aluminum nitride [1].
Figure 2.13 – Dilatometer curve of Al-3.8Cu-1Mg-0.7Si under argon and nitrogen [91].
The expansion and initial shrinkage is similar under both atmospheres, but
the total shrinkage is substantially greater under nitrogen.
30
2.2.2.5 Secondary Operations
Aluminum P/M alloys are highly responsive to a number of post-sintering
operations. For instance, they have excellent formability in the as sintered condition
permitting sizing for close dimensional control, coining for a detailed surface, or
repressing for increased strength [2,3,14,15,23,26,42,50,75], Figure 2.14.
P/M alloys also respond to precipitation hardening, in a similar manner to wrought
alloys, by natural or artificial aging [2,3,5-7,14,15,23,26,39,42,67,75,76,98-100]. They
are solutionized in air or controlled atmosphere at 504-538°C for 30 minutes and then
cold-water quenched [23,26,27,67].
P/M alloys are then naturally aged at room temperature for a minimum of four
days [27] or artificially aged at 165-200°C [67,85]. In general, they precipitation harden
faster than their wrought counterparts [43,67]. During aging precipitates are
homogenously distributed in the matrix, however upon over-aging θ precipitates exist
preferentially at grain boundaries and pore surfaces [67]. The magnitude of hardening is
primarily influenced by the copper content in solution and porosity, but grain size can
also have an effect [67]. The presence of magnesium improves response to heat treatment
[93].
Sintered P/M bodies are also excellent preforms for forgings [7,42,101] with scrap
loss reduced by 80% compared to conventional forgings [7]. Hot working collapses
residual porosity and breaks up microstructural constituents (i.e. oxides) so as to increase
interparticle bonding and density [51,101]. Cold forming should be done in the as sintered
condition or within 24 hours of quenching [23]. Some parts are formed after solutionizing
when they are the most ductile [27].
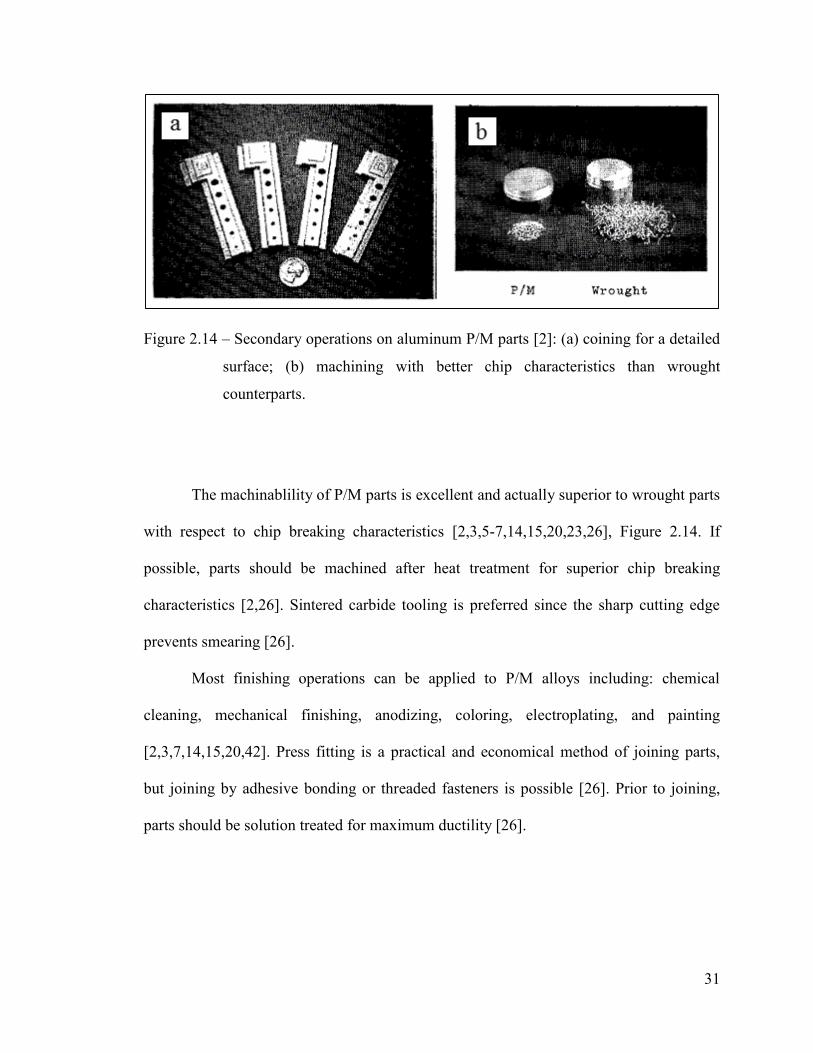
31
Figure 2.14 – Secondary operations on aluminum P/M parts [2]: (a) coining for a detailed
surface; (b) machining with better chip characteristics than wrought
counterparts.
The machinablility of P/M parts is excellent and actually superior to wrought parts
with respect to chip breaking characteristics [2,3,5-7,14,15,20,23,26], Figure 2.14. If
possible, parts should be machined after heat treatment for superior chip breaking
characteristics [2,26]. Sintered carbide tooling is preferred since the sharp cutting edge
prevents smearing [26].
Most finishing operations can be applied to P/M alloys including: chemical
cleaning, mechanical finishing, anodizing, coloring, electroplating, and painting
[2,3,7,14,15,20,42]. Press fitting is a practical and economical method of joining parts,
but joining by adhesive bonding or threaded fasteners is possible [26]. Prior to joining,
parts should be solution treated for maximum ductility [26].

32
2.3 CORROSION BEHAVIOUR OF ALUMINUM−COPPER ALLOYS IN NEAR-NEUTRAL,
CHLORIDE-CONTAINING ELECTROLYTES
2.3.1 Electrode Processes
2.3.1.1 Cathodic Processes
The electrochemical corrosion of metals involves cathodic, anodic, and electronic
and ionic conduction processes with the total rate of corrosion being determined by the
process with the rate limiting kinetics [102-108]. The resistance associated with the
cathodic reaction usually has the greatest influence on corrosion rate [102-108].
The cathodic process in the corrosion of aluminum and aluminum alloys in near-
neutral electrolytes and under atmospheric conditions proceeds along two paths [102-
113]: depolarization with hydrogen evolution and depolarization with oxygen ionization,
which act in parallel and independent of each other.
The cathodic process of oxygen reduction consists of several stages [102-108]: (i)
passage of oxygen from the atmosphere into the electrolyte, (ii) transmission of oxygen
by convection through the main body of solution, (iii) transmission of oxygen through the
static layer of electrolyte adjacent to the cathode, (iv) reduction of oxygen at the cathode
to hydroxide ions, and (v) diffusion of hydroxide ions away from the cathode. The
passage of oxygen into solution, its convection to the cathode, and the diffusion of
hydroxide away from the cathode generally do not influence the rate of the cathodic
process [102-108]. Oxygen diffusion to the cathode and oxygen ionization at the cathode
are the primary high resistance processes that limit the rate of the cathodic process (i.e.
concentration and chemical polarization, respectively) [102-108].

33
Oxygen reduction at the cathode proceeds along two parallel paths, direct reduction of
oxygen to hydroxide ion [102-108,114,115]:
(1) O2 + 4e– + 2H2O = 4OH–
and reduction of oxygen to hydrogen peroxide, with the further partial reduction of
hydrogen peroxide [102-108,114,115]:
(2) O2 + 2e– + 2H2O = H2O2 + 2OH–
(3) H2O2 + 2e– = 2OH–
The cathodic process of hydrogen evolution also consists of several stages [108]:
(i) transport of water molecules to the cathode, (ii) ionization of water molecules, (iii)
removal of hydroxide ion, (iv) recombination (chemical desorption) of hydrogen atoms or
electrochemical desorption of hydrogen atoms, (v) diffusion of hydrogen atoms or
formation and detachment of hydrogen bubbles. It can be considered to consist of the
following stages [108]:
(4) H2O + e– = Hads + OH–
(5) Hads + Hads = H2
(6) Hads + H2O + e– = H2 + OH–
Hydrogen evolution is electrochemically independent from oxygen reduction but has an
indirect influence on the process [108]. Evolving hydrogen bubbles agitate the electrolyte
and decrease the diffusion layer which can increase the diffusion limited oxygen current
by up to 50% [108]. Of the two cathodic processes, oxygen reduction has lower resistance
and is the predominant cathodic process, but there is still some hydrogen evolution that
occurs at open circuit conditions [102-107].

34
Aluminum is strongly polarized to potentials of hydrogen evolution [102-
108,110,116,117], as are the aluminum-copper alloys, Figure 2.15. Aluminum is an
inefficient cathode for oxygen reduction [102-108], not because of poor catalytic activity,
but because of its negative electrode potential and the instability of the oxide film in
alkaline conditions [102-108]. Under cathodic polarization, alkali formed at the cathode
significantly affects the local pH [108,116-123] and, in the vicinity of the cathode,
dissolves the oxide film which shifts the electrode potential more negative due to
exposure of bare aluminum [102-108,117,119,120,122,124].
Figure 2.15 – Cathodic polarization curves for duralumin (i.e. AA2017-T4) in 0.5M NaCl
[102-107]. 1: direct course with agitated electrolyte; 2: reverse course with
agitated electrolyte; 3: with static electrolyte; 4: technical unalloyed
aluminum in agitated electrolyte. Abscissa is in VNHE.

35
At potentials around –1.0VSCE or more negative, hydrogen evolution becomes
significant [102-107]. Aluminum is also a poor cathode for hydrogen evolution [102-
107,123,125]. However, at potentials around –1.5VSCE or more negative, the efficiency of
hydrogen evolution increases [110,111,117,119-121,123,124,126], Figure 2.15, due to
total hydration of the oxide layer which renders it ionically conductive [110,125,127]. As
the hydrated part of the duplex film penetrates toward the metal, hydrogen evolution may
take place directly on aluminum metal [125,127]. A stable oxide film cannot be
maintained [111,119-121,123,124] and aluminum dissolution occurs partly by a chemical
process [125,127]. At potentials around –1.7VSCE or more negative, the formation of
aluminum hydride as an intermediate monolayer at the metal/oxide interface or in the
oxide before hydrogen evolution becomes possible [125,127].

36
2.3.1.2 Anodic Processes
In near-neutral solutions the oxide film on aluminum is stable and aluminum ions
can only enter solution by migrating through the oxide film [128]. The 3 valence
electrons of aluminum are in different orbitals (3s23p1) so it is probable that oxidation
proceeds in a two-step process at the metal/oxide interface [111]:
(7) Al = Al+ + e–
(8) Al+ = Al3+ + 2e–
Reaction (8) is probably the rate limiting step [111]. The formation of sub-valent ions is
also responsible for the so-called ‘negative difference effect1’ (NDE) [108,129] and the
fact that the dissolution of aluminum has a Faradaic efficiency above 1 [108,131,132], i.e.
aluminum dissolves with an effective valence of 2.4-2.6 [118,130,131]. So long as
Reaction (8) is the rate limiting step, a certain amount of Al+ ions are expected to react
with water and release hydrogen at the oxide/solution interface [111,133]. The flux of Al+
ions, and therefore the amount of hydrogen evolved, is proportional to anodic polarization
which is in accordance with observations [111].
The anodic dissolution of aluminum is highly irreversible – its potential is well
below the stability of H2O [129,132] and the Al3+ ion has a large hydration energy [129].
This also means the anodic process is not susceptible to concentration polarization [134].
Even if the concentration of Al3+ exceeds the solubility product of the hydroxide,
precipitation occurs away from the electrode surface and does not influence the processes
occurring on the electrode surface.
1The difference between hydrogen evolution at open circuit and on anodic polarization is referred to as the
‘difference effect’ in the Russian literature [108,129]. Aluminum is unusual in that this difference is
negative – i.e. hydrogen evolution increases linearly with increasing anodic current [111,130]. This
behaviour is referred to as the ‘negative difference effect’ and is only seen in near-neutral solutions [129].

37
The active dissolution of aluminum is thermodynamically possible at all potentials
noble to its standard electrode potential –1.90VSCE [111]. This potential represents
elemental aluminum with no impurities, an oxide layer possessing no electronic
conductivity or water permeability, in pure water with a pH of 7 [111]. Considerable
active dissolution occurs above a characteristic breakdown potential, i.e. the ‘pitting
potential’ [111]. Above the pitting potential, there are large increases in current associated
with localized attack or pitting [111,120,122,133,135-138]. Above this potential, the
oxide loses its stability and anywhere on the electrode surface is subject to attack
[139,140]. The interface is shown schematically in Figure 2.16. There may be an
induction period before pitting begins [111,121,141].
Figure 2.16 – Schematic representation of Al-solution interface in chloride solutions
[133]: (a) at the open circuit potential; (b) during the anodic polarization.

38
The anodic dissolution of aluminum is strongly affected by the chloride ion
[108,112,117,122,133,136,137,142-144]. The pitting potential is not affected by pH in the
range 4-11 [111,122,145] but becomes more negative with increasing chloride
concentration [111,121,122,136,137,142,144,146]. The activating effect of chloride may
be related to the absorption of chloride ions [129,142,147] or the formation of complexes
[111,121,130,147] such as: Al(OH)2Cl, Al(OH)Cl2, AlCl3, Al(OH)Cl+, and AlCl2+, all of
which are highly soluble [111]. The adsorption of chloride affects the electric field in the
double layer, Figure 2.16, in a way that accelerates the transport of aluminum ions
through the oxide layer [111]. Furthermore if chlorine becomes incorporated into the
oxide film this would increase the number of charge carriers [111].
On increasing anodic polarization to high current densities, dissolution goes
through an ohmic-limited region and then a mass transport limited region [130]; in the
latter, dissolution is limited by convective diffusion. Aluminum is unable to form a salt
film in solution of less than 80% saturation due to the vigorous hydrogen evolution [130].
When anodic polarization is decreased from high values the dissolution potential deviates
to more negative values [111,138] and upon cessation a new open circuit potential is
established at more negative values [135,146]. This potential is also referred to as the
‘repassivation potential’ and is thought to be the result of an increase in anodic area on
the electrode surface [135,146]. The repassivation potential is not as strictly reproducible
as the pitting potential and is somewhat dependent upon the amount on anodic current
passed [135]. The deactivation process occurs quickly (ca. 1ms) [111] and may be related
to desorption of chlorine [147].

39
2.3.2 Electrochemical Characteristics of Intermetallic Phases
Traditionally the intermetallics in aluminum alloys have been classified according
to nobility concepts [144]. This is not an accurate representation of the corrosion of
aluminum alloys since it does not take into account kinetic information. A more
complete classification has been proposed to be [144]: (i) noble particles with high
electrochemical activity, (ii) noble particles with low electrochemical activity, (iii) active
particles with high self-dissolution rates, and (iv) active particles with low self-dissolution
rates. Some corrosion potentials for intermetallic phases are shown in Figure 2.17. In
general, the most efficient cathodes are constituents containing iron or copper [102-
108,148,149]. Oxygen reduction and hydrogen evolution kinetics are enhanced on these
intermetallics [148-150]. The cathodic efficiency of iron-containing intermetallics is
attributed to the stability of iron in alkaline solutions [144]. Intermetallics containing
significant zinc, magnesium, or silicon typically do not show a passive region [144].
The Mg2Si compound actively dissolves unless at high pH (12.5) [151]. It has a
very negative potential (ca. –1.5VSCE) and may be subject to selective dissolution of
silicon [151].
The corrosion of the CuMgAl2 phase is characterized by selective dissolution of
aluminum and magnesium [137,148,151-157], leaving a copper rich residue. Copper and
cuprous oxide (Cu2O) have been identified in the remnants of corroded CuMgAl2 by
electron [152] and X-ray [158] diffraction. The de-alloying occurs on both cathodic [156]
and anodic [137,152-155] polarization. Its mechanism is not completely understood. The
oxide layer on CuMgAl2 is not very protective and once broken down magnesium
selectively dissolves [159]. It is thought that the dissolution of magnesium prevents
repassivation and results in the simultaneous dissolution of aluminum [159].

40
Figure 2.17 – Corrosion potentials for intermetallic compounds common in aluminum
alloys as a function of sodium chloride concentration in pH=6 solution. Data
from [144].
After de-alloying, the copper-rich remnant reorganizes into a crystalline nanoporous
structure or ‘sponge’ with very high surface area [155,159] and enhanced oxygen
reduction kinetics [148,155,156]. Any cathodic hydroxide produced further destabilizes

41
aluminum but has no effect on copper [155,159]. There is evidence for non-Faradaic
liberation of de-alloyed copper clusters by convective forces [156]. It is considered to be
a borderline case as to whether CuMgAl2 de-alloys to a mechanically stable structure
[159].
The CuAl2 intermetallic behaves similarly to CuMgAl2 in that it is subject to
selective de-alloying of aluminum [123,160]. De-alloying may proceed by selective
dissolution of only aluminum or the dissolution of aluminum and copper and then
redeposition of copper [160]. In situ atomic emission spectroelectrochemistry (AESEC)
suggests that CuAl2 is not susceptible to the same mechanism of non-Faradaic liberation
of de-alloyed copper clusters as CuMgAl2 [123]. CuAl2 has a high cathodic Tafel slope
which indicates an oxide film is present and stable on cathodic polarization [123]. This is
consistent with observations that the cathodic behaviour of CuAl2 is not affected by
increases in pH [151]. XPS studies of CuAl2 indicate that metallic copper may be present
in the oxide film or enriched at the oxide/metal interface [150].
The iron-containing intermetallics FeAl3, Al7Cu2Fe, Al20Cu2(MnFe)3, and
(FeMn)3Si2Al15 are not significantly affected by increases in pH [137,144,148,151,161],
probably due to the stability of iron in alkaline solutions [144,151]. The Al7Cu2Fe phase
supports remarkably high cathodic currents (>100µAcm–2) and becomes a more efficient
cathode at higher pH [144]. The FeAl3, Al20Cu2(MnFe)3, and (FeMn)3Si2Al15
intermetallics are subject to de-alloying of aluminum [137,161].

42
2.3.3 Localized Corrosion
2.3.3.1 Passive Film Breakdown
The thickness of the natural air-formed oxide layer on aluminum is usually
between 150-250Å but varies depending upon environmental conditions [108]. It contains
absorbed water vapour and a small amount of carbon dioxide [162]. It has a duplex
structure with an inner barrier layer consisting of mostly amorphous Al2O3 and a porous
outer layer that is partially hydrated [113,162,163]. The oxide film is virtually insoluble
between pH 4-8 [111,132,162].
Pitting is the result of several processes [142]: adsorption of chloride on the oxide
surface, penetration of chloride ions through the oxide film, and localized dissolution of
aluminum at the metal oxide interface, Figure 2.18. In solution, the outer layer of the
natural air-formed oxide film is covered with a layer of hydroxyl groups whose charge is
determined by its Lewis acid-base properties [142]. The isoelectric point of the natural
air-formed oxide on aluminum is at pH of 9 or 9.5 [111,142], which means in neutral
solutions the electrode surface acquires a positive charge, Reaction 1 in Figure 2.18, and
is susceptible to adsorption of chloride ions, Reaction 2 in Figure 2.18 [142]. Adsorption
is primarily the result of coulombic forces and induction of the adsorbent by the
approaching chloride ion [142]. There is considerable evidence supporting the adsorption
of chloride [111,121,122,133,142,147,164].
The chloride ion may penetrate the oxide film via oxygen vacancies
[111,121,142], ‘water channels’ [142], localized film dissolution or thinning [111,142], or
an ion exchange mechanism caused by complexing affinity [111]. Partial penetration
through local flaws or cracks in the film is also possible [142]; cracking may be a result
of stresses induced by adsorbed chloride [111].

43
Figure 2.18 – Electrode kinetic scheme for pit initiation on pure aluminum in chloride
solutions [142]. In Al(oxide)OH: 'Al' represents the atoms immediately
below the oxide layer and 'OH' represents the outer layer of surface hydroxyl
groups. VO•• represents an oxygen vacancy in the oxide film. ClO• represents a
chloride ion occupying an oxygen lattice site.
After penetration, dissolution of aluminum occurs at the metal/oxide interface in a series
of one-electron transfer reactions, Reactions 3-6, Figure 2.18 [142]. The water necessary
for dissolution may exist in the oxide film itself or can penetrate through pores, cracks, or
structural defects at impurities or surface heterogeneities [142]. Pits are associated with
blisters underneath the oxide layer which form, grow, and eventually rupture due to
hydrogen pressure [142].
Pits also form on cathodic polarization as a result of local alkalinity [119,120],
especially in the presence of oxygen [110]. Cathodic pits are about 10-20µm in diameter,
with pit diameter increasing in proportion to polarization [120].
44
2.3.3.2 Localized Corrosion Involving Intermetallic Phases
Intermetallic phases are associated with a distinct localized attack morphology
known as ‘trenching’ where circumferential pitting appears mainly in the matrix phase as
a ring of attack around the periphery of particles [151]. Cathodic trenching is trenching
caused by alkaline attack from hydroxide ions produced by cathodic reactions occurring
on the intermetallic [148,149]. The trenches can grow large enough that the cathodic
phase becomes dislodged from the electrode and the area repassivates [120,124].
Anodic trenching is caused by galvanic coupling of the matrix and intermetallic
[149]. The matrix surrounding soluble copper-containing intermetallics is depleted of
copper and as a result has a more negative pitting potential [149,152]. This mechanism is
supported by the observation that trench characteristics are influenced by chloride ion
concentration – which has no effect on oxygen reduction kinetics, but influences pitting
potential [149].
CuMgAl2 is initially anodic to the matrix [144,148,154]. It is subject to de-
alloying of aluminum and magnesium, preferentially from edges first [137,152-155], and
its copper-rich remnants eventually become cathodic to the matrix
[137,148,155,156,159,165,166]. The porous de-alloyed structure is subject to non-
Faradaic liberation of copper [166], Figure 2.19. Copper containing clusters (10-100nm in
diameter), which are mechanically removed by convection of the electrolyte, are held in
the corrosion product gel and transported by convection [159,165]. The copper clusters
are electrically isolated from the electrode and attain their own natural corrosion potential
which allows for their oxidation [159,165]. The copper ions can then be redeposited on
the matrix causing secondary pitting [159,165] or redeposited on other cathodic particles
[148,155].

45
Figure 2.19 – Schematic illustration of a mechanism for redistribution of copper by
dissolution of large CuMgAl2 and CuAl2 intermetallic particles in aluminum
alloys [166].
Trenching is also observed around CuAl2 [148,152], possibly the result of CuAl2
locally polarizing the surrounding matrix above its pitting potential [148]. Aluminum is
de-alloyed in a similar manner to CuMgAl2, Figure 2.19 [159,165], however in situ
AESEC seems to suggest that it is not susceptible to the non-Faradaic liberation of de-
alloyed copper clusters [123].
Trenching is also observed around Al20Cu2(MnFe)3 [149,152,153] but less than
the copper-rich soluble intermetallics [149] and only after other active particles are
consumed [137,153]. Al20Cu2(MnFe)3 is expected to be cathodic to the matrix
[148,153,155] and can be a site for the deposition of dissolved copper in solution [155].

46
2.3.4 Effect of Major Alloying Elements
In general, increasing the copper content reduces corrosion resistance
[108,113,167-172]. The amount of copper in solid solution primarily controls the
electrode potential [11] but the presence of CuAl2 also has some influence [173]. The
corrosion and pitting potential become more noble with increasing amounts of copper
[139,172,174,175]. The pitting dissolution rate decreases with copper in solid solution
[175] and pit interiors become enriched with copper [174]. Copper in solid solution
enhances oxygen reduction currents on the matrix [144]. Copper has a low hydrogen
overvoltage and significantly increases the amount of cathodic hydrogen evolution [102-
108,117,123]. Pure aluminum corrodes with only oxygen reduction, but annealed
duralumin (i.e. AA2017) corrodes with equal amounts of oxygen reduction and hydrogen
evolution at open circuit conditions in 0.5M NaCl [108]. When copper is present as CuAl2
it increases the amount of hydrogen evolution without affecting oxygen reduction [108].
The ratio of hydrogen evolution to oxygen reduction remains constant even under
different conditions of aeration.
Copper-containing intermetallics act as efficient cathodes [102-108,148,149] and
also affect the continuity of the oxide film [102-108]. The morphology of the copper-
containing intermetallics determines the magnitude of their effect on corrosion rate. A
larger amount of electrolyte is involved in diffusion to the edges of cathodic inclusions,
so the limiting diffusion current for oxygen reduction is related to not only the cathode
area but also the cathode perimeter [102-108,176]. This so-called ‘edge effect’ can have a
large effect depending on the size and distribution of precipitates [102-108,176]. Any
copper is also a potential source for dissolution and cathodic redeposition of metallic
copper which accelerates corrosion [163,164,168,177].

47
Moderate additions (0.5wt%) of magnesium improve corrosion resistance
[113,167,170]. Higher amounts of magnesium decrease corrosion resistance [170]. It is
postulated that magnesium ions may affect the cathodic process if incorporated into the
oxide film [164]. Silicon has a beneficial effect in the range 0.5-0.8wt% [170,178]. If free
silicon is present it is detrimental [167,168].
Manganese (<0.6wt%) improves corrosion resistance [167,169,170], especially in
the presence of 0.5-0.6wt% silicon [170]. Compounds of manganese can absorb some
iron which helps prevent the formation of more harmful iron-rich intermetallics
[113,167,168,178]. Manganese does not counteract the negative effects of nickel or cobalt
[167]. Large amounts of manganese (>1.5wt%) form ternary compounds with aluminum
and copper that decrease corrosion resistance [169,170].
2.3.5 Effect of Minor Alloying Elements and Impurities
In general, the presence of impurities has a detrimental effect on corrosion
resistance [129,167,168,178,179], however their microsegregation (e.g. to grain
boundaries or the surface film) is more important than the impurity content
[111,167,168]. Impurities may affect the electrode potential and corrosion rate
[111,135,145] but generally do not change the pitting potential [111,136,145] or affect
dissolution rate at current densities above 0.01mAcm–2 [111]. Impurities usually affect
the cathodic process [180,181] and typically increase the amount of hydrogen evolution
[111,120]. The most common impurities in aluminum-copper alloys are iron, nickel, tin,
lead, zinc, and antimony [178].

48
Iron is the most common impurity and is detrimental to corrosion resistance in
contents from 0.2-1.5wt% [113,170,171,178]. Its compounds act as efficient cathodes
[102-108,148,149], affect the continuity of the oxide film [102-108,162] and enhance
aluminum dissolution [182]. It forms a compound with aluminum and copper, Cu2FeAl7,
which supports cathodic currents orders of magnitude larger than other intermetallics
[151]. Nickel behaves similarly to iron and is harmful to corrosion resistance
[113,171,178].
Tin (0.2-0.7wt%) has a negative effect on corrosion resistance [113,178,183].
Lead (0.3-0.7wt%) and antimony (0.1-0.6wt%) are not detrimental to corrosion resistance
[113,169,178,183].
Zinc (<1wt%) is usually present in solid solution and has no detrimental effect on
corrosion or stress corrosion [178,183-185]. It may have a slight effect on the pitting
potential and cathodic current [186,187] or increase the potential difference between the
matrix and CuAl2 [169].
Titanium (0.2wt%) is usually added as a grain refiner and has no effect on
corrosion resistance [171,183] but has a beneficial effect on resistance to SCC
[113,178,188-192]. It may slightly shift the corrosion or pitting potential [191,193] and
also the potential difference between the matrix and CuAl2 [193]. The use of niobium
instead of titanium as a grain refiner has no adverse effect on corrosion resistance [171].
Chromium (0.2wt%) improves resistance to corrosion and SCC [113,178,183] but its
effect is less than is seen in other aluminum alloys (e.g. Al-Zn alloys) [178].

49
2.3.6 Effect of Thermomechanical Treatment and Sequence History
Metal working and heat treatment procedures bring about changes in structure that
can have a dramatic effect on corrosion behaviour, particularly: resistance to intergranular
corrosion (IGC), stress corrosion cracking (SCC), and exfoliation corrosion
[113,171,178,193,194].
If the quench rate after solution heat treatment is too slow or there is delay
between removal from the furnace and quenching, there is excessive precipitation at grain
boundaries which lowers resistance to IGC, SCC, and exfoliation [35,113,157,194]. There
are residual stresses from quenching which are compressive near the surface and actually
enhance resistance to SCC [113,194]. However, subsequent machining operations
frequently leave the tensile area exposed which lowers resistance to SCC [194].
Stretching after quenching helps relieve stresses and improves resistance to SCC
[113,194,195]. During artificial aging, resistance to IGC and SCC drastically decreases
with short aging times and then increases as full aging is approached [113,194,195]. The
changes in IGC and SCC resistance are the result of the potential difference between the
grain bodies and the copper-depleted area near the grain boundaries [113,174,194-197],
Figure 2.20. The copper-depleted region is anodic to the grain interiors and to the grain
boundary precipitates [113,174,194-197]. The best resistance to IGC and SCC occurs
when precipitation occurs evenly throughout the matrix [113,194].
Working changes grain structure to the extent that IGC, SCC, and exfoliation
resistance are affected [194]. Long, thin, ‘pancake-like’ grains are the most susceptible to
exfoliation [113,194]. The resistance to SCC is best in the longitudinal direction and
worst in the short transverse direction [113,194,195].

50
Figure 2.20 – The potentials of the grains and grain boundaries of an Al-4wt%Cu alloy
which was heat-treated at 930°F (500°C), quenched in cold water, and aged
at 375°F (190°C) [195]. Solution of 53gL–1 NaCl + 3gL–1 H2O2.
Sheet product is thin enough that it is fully recrystallized during heat treatments
and is very resistant to SCC in all directions [113,194]. Plate products are not fully
recrystallized during heat treatments and cannot be quenched as rapidly as thin sheet and
are more susceptible to SCC than sheet [113,194]. The center of the plate contains
elongated grains which are susceptible to SCC, especially in the short transverse direction
[113,194].
Rod and bar product has similar SCC resistance to plate product [113]. It has
superior SCC resistance in the longitudinal direction and poor SCC resistance in the
transverse direction [113,194]. Extrusions have a SCC resistance similar to rolled
products [194]. The recrystallized outer surface band on extrusions is not susceptible to
exfoliation [113,194].

51
The corrosion behaviour of forgings depends upon metal flow patterns [113,194].
Their SCC resistance is similar to extrusions and rolled products [194] but typically have
lower resistance in the longitudinal direction as a result of non-uniform metal flow [113].
Forgings may also be more susceptible because their residual stresses from quenching
cannot be relieved by stretching or pressing [113].

52
CHAPTER 3 EXPERIMENTAL
3.1 POWDER METALLURGY PROCESSING
3.1.1 Compaction
Green compact ‘pucks’ were made by compacting 2.5g of powder pre-mix in a
15mm diameter, tungsten carbide, floating die assembly manufactured by Quala-Die, Inc.
(St. Marys, Pennsylvania, U.S.A.), Figure 3.1. Compacting pressure was applied using a
SATEC Series 5594-200HVL load frame (1MN capacity) manufactured by Instron
Industrial Products (Grove City, Pennsylvania, U.S.A.). The desired compaction pressure
was approached in a step-wise manner with a loading rate of 2kNs–1. Samples sintered
industrially were all compacted at 300MPa. Samples sintered in the laboratory were
compacted at: 100, 200, 300, 400, 500, or 600MPa.
Figure 3.1 – Floating die assembly for powder compaction.

53
3.1.2 Sintering
A portion of samples were sintered amongst industrial production at GKN Sinter
Metals (Conover, North Carolina, U.S.A.). This plant regularly sinters Alumix 123 parts
in high volume. The samples were sintered under a nitrogen atmosphere in a continuous
wire mesh belt conveyor furnace employing standard operating conditions for industrially
sintering Alumix 123. The pucks were placed on a shallow tray which was then placed on
the wire mesh belt conveyor of the furnace. The pucks were oriented on the tray so that
the flat circular face of the puck that was in contact with the lower punch during powder
compaction was adjacent to the tray.
Samples sintered in the laboratory were done so in a Lindberg/Blue M 3-zone
horizontal tube furnace with a stainless steel retort, Figure 3.2, manufactured by Thermo
Electron Corporation (Asheville, North Carolina, U.S.A.). During the entire sinter cycle
the temperature in the immediate vicinity of the compacts was measured with a
thermocouple connected to a digital thermometer with a sensitivity of 0.1°C. Prior to
sintering the furnace was evacuated (<7Pa) and purged with nitrogen twice. The sinter
cycle consisted of a 30 minute de-lubrication stage at 400°C followed by a 20 minute
sinter at 595°C. The entire sinter cycle took place under an atmosphere of flowing (20L
per minute) ALPHAGAZ 1 nitrogen (>99.999% pure; H2O: <3ppm; O2: <2ppm) sold by
Air Liquide America Specialty Gases LLC (Houston, Texas, U.S.A.). After the sinter
cycle was completed, samples were gas quenched in a water cooled jacket and remained
under flowing nitrogen until their temperature reached 100°C, upon which they were
removed from the furnace and air cooled to room temperature.

54
Figure 3.2 – Horizontal tube furnace for sintering.
3.1.3 Sizing
Samples were sized using the same load frame used for powder compaction but in
a larger (30mm diameter) die assembly in order to accommodate the expansion of the
samples as a result of sintering. The die assembly used for sizing was of the same type
and manufacture as used for powder compaction, except containing the larger diameter
die. Prior to sizing samples, the peripheries of their flat circular faces were carefully
deburred – the samples were held at an inclination and the edges abraded using motion
and force applied by hand against a piece of stationary SiC paper.
Sizing fluid was obtained from GKN Sinter Metals (Conover, North Carolina,
U.S.A.) and as per industry norm was diluted with 3 parts water to 1 part sizing fluid in
order to emulate industry as much as possible. As per industry recommendations,
immediately prior to sizing, samples were thoroughly coated by full submersion in to a
55
container of sizing fluid. During sizing, the pucks were oriented so that the flat circular
face of the puck that was in contact with the lower punch during powder compaction was
in contact with the lower punch during sizing. Only industrially sintered samples were
sized. The sizing pressure was approached in a step-wise manner with a loading rate of
2kNs–1. Sizing pressures were 100, 200, 300, 310, 390, 400, 460, 500, or 600MPa.
Samples that were corrosion tested were all sized at 310MPa which corresponds to a
reduction in height of 5%.
3.1.4 Processing Response
The change in diameter, height, and mass of samples upon sintering and the
change in height of samples upon sizing were measured. Diameter was measured using
calipers with a sensitivity of 0.01mm, height was measured using a micrometer with a
sensitivity of 0.001mm, and mass was measured using a scale with a sensitivity of
0.0001g.
Green and sintered density was measured in accordance with Metal Powder
Industries Federation (MPIF) Standard 42. Specimens were weighed in air and in
deionized water containing a small amount of wetting agent. Specimens were suspended
in the deionized water by 0.12mm diameter copper wire using the ‘twisted wire
arrangement.’ The temperature of the deionized water was measured by a digital
thermometer with a sensitivity of 0.1°C and its density calculated with correction for the
presence of dissolved air according to recent equations [198] which are recommended by
the National Institute of Standards and Technology (NIST). The presence of solid
lubricant in the powder pre-mix effectively sealed the exterior of the green compacts

56
during compaction so that no oil impregnation was necessary. Green density was
calculated using the following equation:
(9) 𝜌𝑔𝑟𝑒𝑒𝑛 = 𝑚𝑎𝑖𝑟 𝜌𝐻2𝑂
𝑚𝑎𝑖𝑟− 𝑚𝐻2𝑂
Prior to weighing the porous sintered samples in deionized water, they were sealed by
vacuum oil impregnation at room temperature. The specimens were submersed in
hydraulic oil of ISO viscosity grade 46 and the pressure over the sample was reduced to
<7kPa and held for 30 minutes. Afterwards the pressure was increased to ambient
atmospheric pressure and the specimens were kept immersed for 30 minutes. Sintered
density was calculated using the following equation:
(10) 𝜌𝑠𝑖𝑛𝑡𝑒𝑟𝑒𝑑 = 𝑚𝑎𝑖𝑟(𝑛𝑜 𝑜𝑖𝑙) 𝜌𝐻2𝑂
𝑚𝑎𝑖𝑟(𝑜𝑖𝑙)− 𝑚𝐻2𝑂(𝑜𝑖𝑙)
The theoretical density of Alumix 123 was calculated from its nominal composition as
2.777gcm–3 according to the equations from the Aluminum Association (Arlington,
Virginia, U.S.A.).
3.2 ELECTROCHEMICAL TESTING
3.2.1 Sample Preparation
Wrought AA2014-T6 test specimens were prepared from 3.25 inch (83mm)
diameter extruded rod so that the transverse plane was in contact with the electrolyte
during electrochemical testing. The rod was sectioned with a band saw along the
transverse plane into 4mm thick slices and a hole-saw drilled in to the longitudinal plane
of the slices was used to extract 0.625 inch (15.9mm) diameter test specimens.

57
Wrought AA2014-T6 test specimens and laboratory sintered Alumix 123-T1
samples were polished using standard metallographic techniques immediately prior to
electrochemical testing. Samples were abraded on successively finer grits of wet SiC
paper (240, 320, 400, and 600 grit), then polished using successively finer oil-based
diamond suspensions (9, 6, 3, and 1μm) on manufacturer recommended polishing clothes,
cleaned ultrasonically in acetone and then in deionized water, and finally thoroughly
rinsed with deionized water and dried using a hand drier. The SiC paper, diamond
suspensions, and polishing clothes were from BUEHLER (Lake Bluff, Illinois, U.S.A.).
Industrially sintered Alumix 123-T1 samples were tested ‘as-sintered’ with no
polishing but the peripheries of their flat circular faces had to be deburred so that a
sufficient seal and electrical contact could be maintained during testing. The samples
were held at an inclination and the edges abraded using motion and force applied by hand
against a piece of stationary SiC paper. The surface of the flat circular face which was
exposed to the electrolyte during testing was not disturbed by the deburring operation.
During testing the sample was oriented so that the flat circular face, which was in contact
with the upper punch during powder compaction, was exposed to the electrolyte.
Industrially sintered and sized Alumix 123-T2 samples were tested ‘as-sized’ with
no polishing. These samples were previously deburred prior to the sizing operation. These
samples retained some sizing fluid in their pores and on their surface which was present
during testing. During electrochemical testing, the sample was oriented so that the flat
circular face which was in contact with the upper punch during sizing was exposed to the
electrolyte.
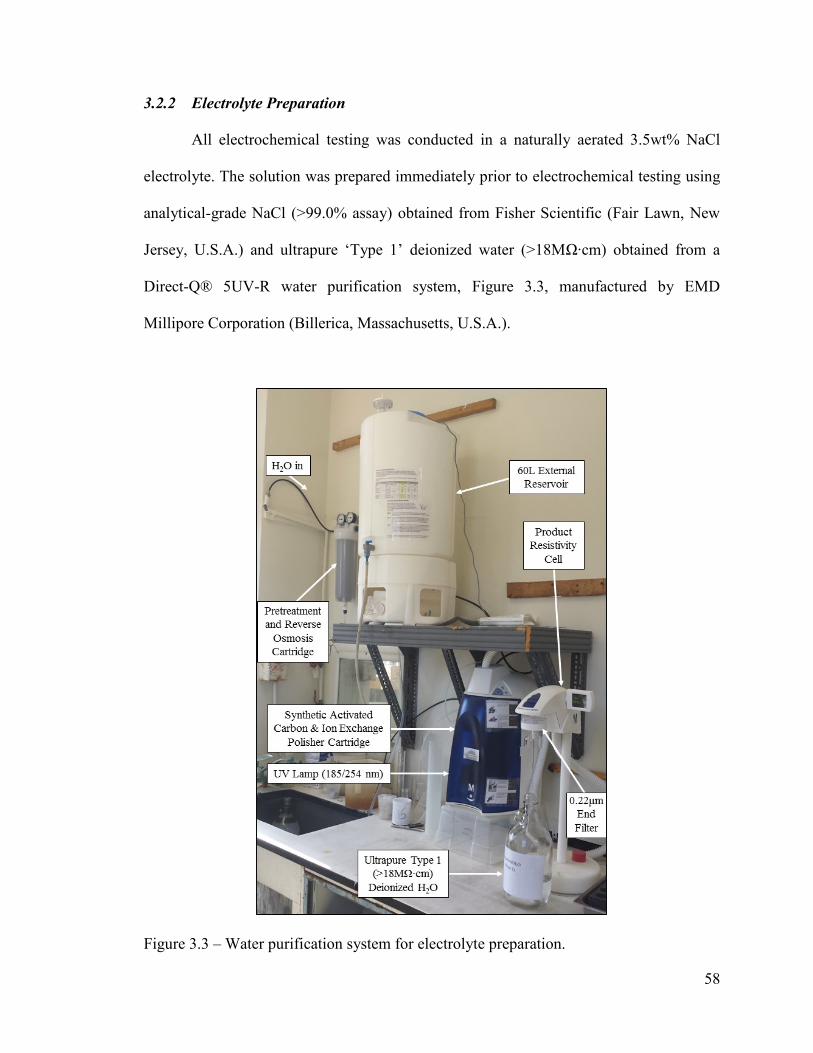
58
3.2.2 Electrolyte Preparation
All electrochemical testing was conducted in a naturally aerated 3.5wt% NaCl
electrolyte. The solution was prepared immediately prior to electrochemical testing using
analytical-grade NaCl (>99.0% assay) obtained from Fisher Scientific (Fair Lawn, New
Jersey, U.S.A.) and ultrapure ‘Type 1’ deionized water (>18MΩ∙cm) obtained from a
Direct-Q® 5UV-R water purification system, Figure 3.3, manufactured by EMD
Millipore Corporation (Billerica, Massachusetts, U.S.A.).
Figure 3.3 – Water purification system for electrolyte preparation.
59
3.2.3 Electrochemical Cell & Potentiostat
Standard electrochemical instrumentation consisting of a three electrode bulb cell
connected to a Model 273A Potentiostat/Galvanostat manufactured by EG&G Princeton
Applied Research (Princeton, New Jersey, U.S.A.), which incorporated a grounded
electrometer, was used for electrochemical measurements, Figure 3.4. The potentiostat
was connected to a desktop computer and controlled via CorrWare® software sold by
Scribner Associates, Inc. (Southern Pines, North Carolina, U.S.A.). The potentiostat was
calibrated by the use of a laboratory-made ‘dummy cell.’
The standard three electrode 1L glass bulb cell contained a working electrode
assembly that exposed a nominal area of exactly 1cm2 of the test specimen to the
electrolyte, two high purity fully dense 0.25 inch (6.35mm) diameter graphite counter
electrodes, and a saturated calomel reference electrode (SCE) (KCl(sat’d) | Hg2Cl2(s) |
Hg(l) | Pt), Figure 3.4.
Apart from the reference electrode, the entire electrochemical cell was comprised
from the Model K0047 Corrosion Cell System and Model K0105 Flat Specimen Holder
manufactured by Princeton Applied Research (Oak Ridge, Tennessee, U.S.A.). The
working electrode sample holder was composed of 303 stainless steel encapsulated in a
rigid fluorocarbon ‘Tefzel-280’ and the area around the test specimen was sealed with a
‘DuPont Kalrez’ fluorocarbon elastomer washer, Figure 3.5. The sample holder is
suspended in the electrolyte by a 303 stainless steel rod which screws into the top of the
sample holder. The rod is isolated from the electrolyte by a glass tube which is sealed to
the working electrode body with a DuPont Kalrez O-ring and kept in place by a thumb
nut and Teflon washer, Figure 3.5.

60
Figure 3.4 – Electrochemical cell and potentiostat used for electrochemical measurement.
Figure 3.5 – Schematic of the working electrode (from Princeton Applied Research)

61
The reference electrode was a glass body Accumet® SCE with a porous ceramic
junction manufactured by Fisher Scientific (Fair Lawn, New Jersey, U.S.A.), and was
brought in close proximity to the working electrode via a Luggin capillary which was
filled with 3.5wt% NaCl electrolyte and equipped with an ultra low-leakage ‘Vycor’ frit.
The reference electrode was regularly checked against a laboratory standard.
Electrochemical tests were conducted in approximately 900mL of 3.5wt% NaCl
electrolyte under naturally aerated conditions at ambient temperature (22±3°C). During
testing approximately 23cm2 of nominal counter electrode surface area was in contact
with the electrolyte. All current densities are based off the nominal area of test specimen
exposed to the electrolyte (1cm2).
3.2.4 Open Circuit Potential
The potential of the working electrode under open circuit conditions was
monitored versus time for a period of 1 hour for the wrought samples and 2 hours for the
P/M samples. The P/M samples were monitored for a longer period of time because they
were highly non-planar and took longer to equilibrate with the electrolyte. The potential
at the conclusion of the test is referred to as the ‘open circuit potential’ (OCP). Prior to all
subsequent applied-potential electrochemical testing, the open circuit potential was
monitored and allowed to stabilize for the times indicated above.
62
3.2.5 Potentiodynamic Polarization
3.2.5.1 Cathodic Polarization
During cathodic polarization the potential of the working electrode was varied
continuously at a rate of 0.1667mVs–1 (0.6Vhr–1) from the open circuit potential (OCP) to
–2.000VSCE.
3.2.5.2 Cyclic Polarization
During cyclic polarization the potential of the working electrode was varied
continuously at a rate of 0.1667mVs–1 (0.6Vhr–1) from a potential more negative than the
OCP to a predefined anodic current density or potential and then the direction of the scan
was reversed to the cathodic direction until a predefined potential was reached. The
characteristic test potentials and current densities varied between different samples and
are outlined below. The polarization curves were analysed using the CorrViewTM
software sold by Scribner Associates, Inc. (Southern Pines, North Carolina, U.S.A.). The
corrosion current (icorr) and corrosion potential (Ecorr) of all samples were found by Tafel
extrapolation; however the method of extrapolation had to be modified for different
samples as outlined below. For all samples the repassivation potential (Erepass) was
defined as the potential where the anodic current density reaches a value of 1μA on the
reverse scan.
For wrought AA2014-T6 samples the potential of the working electrode was
varied from –0.875VSCE until an anodic current density of 0.01Acm–2 was reached and
then the direction of the scan was reversed to the cathodic direction until a potential of –

63
1.000VSCE. The corrosion current was found by the intersection of manually-fitted anodic
and cathodic Tafel curves.
For industrially sintered Alumix 123-T1 samples the potential of the working
electrode was varied continuously from –1.250VSCE until an anodic current density of
0.01Acm–2 was reached and then the direction of the scan was reversed to the cathodic
direction until a potential of –1.000VSCE. The anodic branch of the polarization curve of
these samples displayed non-Tafelian dependence and could not be accurately
extrapolated by the conventional means. The corrosion current was found by the
intersection of the manually-fitted cathodic Tafel curve with the corrosion potential. The
passive current (ipass) was taken as the current density immediately prior to breakdown at
the pitting potential.
For industrially sintered and sized Alumix 123-T2 samples the potential of the
working electrode was varied continuously from –0.875VSCE until an anodic current
density of 0.01Acm–2 was reached and then the direction of the scan was reversed to the
cathodic direction until a potential of –1.000VSCE. The corrosion current was found by the
intersection of manually-fitted anodic and cathodic Tafel curves.
For laboratory sintered Alumix 123-T1 samples the potential of the working
electrode was varied continuously from –1.250VSCE until a potential of –0.400VSCE and
then the direction of the scan was reversed to the cathodic direction until a potential of –
1.000VSCE. The anodic branch of the polarization curve of these samples displayed non-
Tafelian dependence and could not be accurately extrapolated by the conventional means.
The corrosion current was found by the intersection of the manually-fitted cathodic Tafel
curve with the corrosion potential. The passive current (ipass) was taken as the current
density immediately prior to breakdown at the pitting potential.

64
Corrosion rate was calculated from corrosion current in accordance with ASTM
G102. Equivalent weight (EW) was calculated based off nominal composition and as per
norm only alloy components present in amounts over 1wt% were included, meaning for
both AA2014-T6 and Alumix 123 calculations were made for an alloy containing
95.5wt% Al and 4.5wt% Cu. The valence of aluminum and copper were taken to be 3 and
2 respectively and the equivalent weight (EW) of the alloys calculated to be 9.29 gram
equivalents. Corrosion rate (CR) in mmyr–1 was calculated by:
(11) 𝐶𝑅 = 3.27 × 10⁻³ 𝑖𝑐𝑜𝑟𝑟
𝜌𝐸𝑊
where corrosion current (icorr) is in μAcm–2 and density (ρ) is in gcm–3. The density of
AA2014-T6 was taken as 2.80gcm–3 as per the Aluminum Association. The sintered
density of Alumix 123 was used for corrosion rate calculations.
3.2.6 Potentiostatic Polarization
During all potentiostatic polarization experiments current transients were recorded
as a function of time and at rate of 1 point per second. All sample types were subject to
the same potentiostatic tests. Potentiostatic polarization experiments were conducted at: –
1.100VSCE, –0.750VSCE, and –0.700VSCE for 6 hours and at –1.500VSCE and –0.500VSCE
for 3 hours. These potentials were identified as points of interest from potentiodynamic
polarization experiments.

65
3.3 MATERIALS CHARACTERIZATION
3.3.1 Chemical Analysis
Chemical analysis by inductively coupled plasma optical emission spectroscopy
(ICP-OES) was performed by the Minerals Engineering Centre (MEC) at Dalhousie
University using a Vista-Pro CCD Simultaneous ICP-OES, Figure 3.6, manufactured by
Varian, Inc. (Palo Alto, California, U.S.A.). All samples were analyzed using standard
operating procedures and alongside appropriate quality control samples certified by the
National Bureau of Standards (Washington, D.C., U.S.A.). Chemical analysis of Alumix
123 was performed on a sintered compact.
Figure 3.6 – Inductively coupled plasma emission spectrometer for chemical analyses.
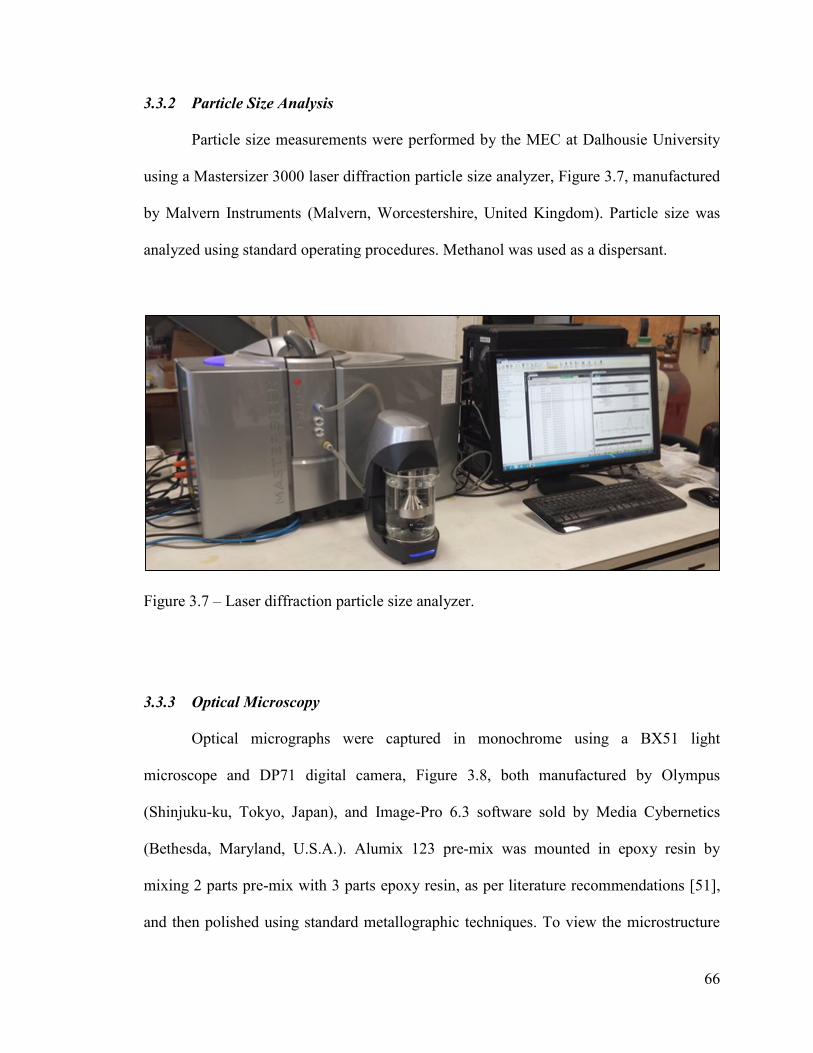
66
3.3.2 Particle Size Analysis
Particle size measurements were performed by the MEC at Dalhousie University
using a Mastersizer 3000 laser diffraction particle size analyzer, Figure 3.7, manufactured
by Malvern Instruments (Malvern, Worcestershire, United Kingdom). Particle size was
analyzed using standard operating procedures. Methanol was used as a dispersant.
Figure 3.7 – Laser diffraction particle size analyzer.
3.3.3 Optical Microscopy
Optical micrographs were captured in monochrome using a BX51 light
microscope and DP71 digital camera, Figure 3.8, both manufactured by Olympus
(Shinjuku-ku, Tokyo, Japan), and Image-Pro 6.3 software sold by Media Cybernetics
(Bethesda, Maryland, U.S.A.). Alumix 123 pre-mix was mounted in epoxy resin by
mixing 2 parts pre-mix with 3 parts epoxy resin, as per literature recommendations [51],
and then polished using standard metallographic techniques. To view the microstructure

67
of air atomized aluminum particles, the mounted pre-mix was etched using Keller’s
reagent. All other samples were etched in a solution of 2g NaOH, 5g NaF, and 93mL
deionized H2O.
Figure 3.8 – Optical microscope and digital capture system.
3.3.4 Scanning Electron Microscopy
Electron micrographs were captured using a Model S-4700 cold field emission
scanning electron microscope (SEM), Figure 3.9, manufactured by Hitachi High-
Technologies Corporation (Minato-ku, Tokyo, Japan). The SEM contains an integrated
INCA X-MaxN 80mm silicon drift detector (SDD) manufactured by Oxford Instruments
(Abingdon, Oxfordshire, United Kingdom) that is used for energy dispersive X-ray
spectroscopy (EDS). For imaging, the SEM was operated with a 10kV accelerating

68
voltage and 20μA emission current. For EDS, the SEM was operating with a 20kV
accelerating voltage and 10μA emission current. The working distance was always kept
close to 12mm. In order to analyse Alumix 123 powder pre-mix it was secured to a pin
stub mount with silver chloride paste. Prior to analysis in the SEM, sized P/M samples
were treated in a Soxhlet apparatus for 8 hours with petroleum ether to remove sizing
fluid.
To analyse cross sections some samples were mounted by vacuum impregnation
with a low viscosity self-curing resin, sectioned, and polished. Before mounting, the sized
P/M samples were treated in a Soxhlet apparatus for 8 hours with petroleum ether to
remove sizing fluid. Prior to examination in the SEM, mounted samples were carbon
coated using a DV-502A high vacuum evaporator platform manufactured by Denton
Vacuum (Moorestown, New Jersey, U.S.A.).

69
Figure 3.9 – Scanning electron microscope with integrated energy dispersive X-ray
spectroscopy system.
3.3.5 X-Ray Diffraction
X-ray diffraction (XRD) patterns were collected using CuKα1 radiation (λ=1.54Å)
in a D8 ADVANCE X-ray diffractometer, Figure 3.10, manufactured by Bruker
(Madison, Wisconsin, U.S.A.) operating with a tube voltage of 40kV and a tube current
of 40mA.
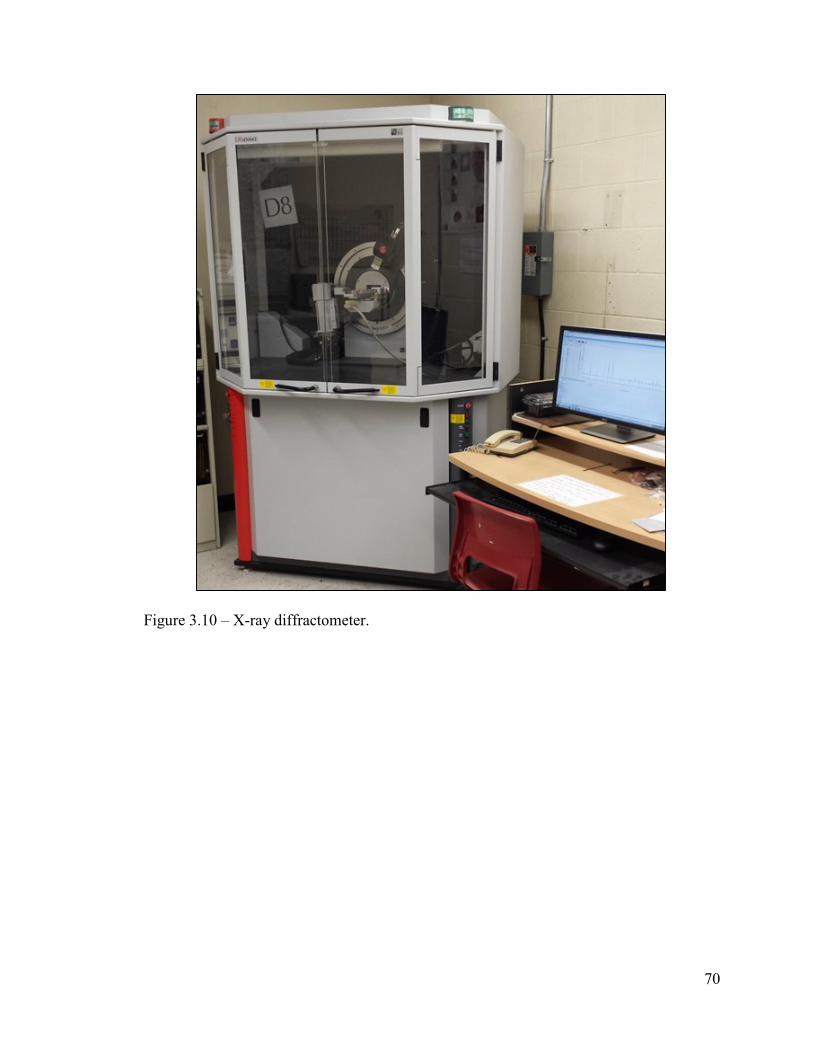
70
Figure 3.10 – X-ray diffractometer.

71
CHAPTER 4 MATERIALS
Alumix 123 was obtained from ECKA Granules Germany GmbH (Fürth, Bavaria,
Germany) as a ‘press ready’ pre-mix containing 1.5wt% admixed ‘Licowax C’ solid
lubricant and blended by the manufacturer. The product was analysed by the
manufacturer and certified to quality control standards for particle size distribution,
apparent density, flowability, and chemical composition.
Wrought AA2014-T6 was obtained as a 3.25 inch (83mm) diameter extruded rod
from the Tennalum Division of Kaiser Aluminum (Jackson, Tennessee, U.S.A.) and
conformed to ASTM B211 and AMS-QQ-A-225/4 standards.

72
CHAPTER 5 CHARACTERIZATION OF RAW MATERIALS
5.1 ALUMIX 123
The analysed chemical composition of Alumix 123 is shown in Table 5.1, particle
size distribution in Figure 5.1, and polished cross section in Figure 5.2. The small
increase in particle size frequency between 10 and 30μm may be due to the admixed solid
lubricant or alloy additions which are typically added in fine particle size to promote a
homogenous distribution.
The pre-mix is comprised of elemental and master alloy powders, Figure 5.3
through Figure 5.6, whose approximate composition is shown in Table 5.2. The elemental
aluminum powder has a nodular and irregular shape which is characteristic of air
atomization [1,3,36] and contains some silicon and iron as impurities, Table 5.2. The
cross sectional microstructure, Figure 5.4, has a dendritic cell pattern which is typical of
air atomized aluminum.
Table 5.1 – Chemical analysis of Alumix 123 by ICP-OES (wt%). Balance Al.
Composition Cu Mg Si Fe Mn Others
(each)
Others
(total)
Nominala 4.30-4.70 0.40-0.60 0.50-0.80 – – – –
Analysed 4.57 0.52 0.80 0.11 <0.01 –b 0.21
aPlus 1.40-1.60wt% lubricant bCa: 0.03; Ga: 0.01; K: <0.01; Na: 0.02; Ni: 0.01; P: 0.03; Pb: 0.01; S: 0.02; Sn: 0.02;
V: 0.01; Zn: 0.05

73
Figure 5.1 – Particle size distribution of Alumix 123.
Figure 5.2 – Optical micrograph of polished cross section of Alumix 123 pre-mix
mounted in epoxy resin (unetched).

74
Figure 5.3 – SEM micrographs of different particles in Alumix 123: (a) elemental
aluminum; (b) elemental copper; (c) magnesium-containing master alloy; (d)
silicon-containing master alloy. The powders were mounted on silver
chloride paste.
Table 5.2 – Summary of EDS point analyses of different particles in Alumix 123 (wt%).
Particle Type
EDS Point Analysis (wt%)a
Al Cu Mg Si Other No. of
points
Al 99.8±0.3 – – 0.1±0.3 0.1±0.1 Fe 9
Cu – 100.0±0.0 – – – 2
Mg-containing 50.2±2.6 – 49.7±2.7 0.1±0.2 0.0±0.1Zn 12
Si-containing 90.1±3.2 – – 9.9±3.1 0.0±0.1 Fe 16
aValues are given as mean ± standard deviation

75
Figure 5.4 – Optical micrograph of cross sectional microstructure of different particles of
Alumix 123 mounted in epoxy resin (etched): (a) elemental aluminum; (b)
silicon-containing master alloy.
Figure 5.5 – XRD pattern of Alumix 123 powder pre-mix: (a) full pattern; (b) close up of
smaller peaks.

76
The elemental copper powder has a high purity, Table 5.2, and dendritic shape,
Figure 5.3, characteristic of electrolytic deposition from aqueous solution. The XRD
pattern for the powder pre-mix, Figure 5.5, contains peaks corresponding to elemental
copper. Other investigators [55,199-201] have also found Alumix 123 to contain
elemental copper powder.
The magnesium-containing particles have a jagged and angular particle shape,
Figure 5.3, and in some areas ‘saw tooth’ pattern marks are apparent, Figure 5.6. These
features are indicative of a mechanical powder production process. The high magnesium
content of the master alloy, Table 5.2, would make it easy to pulverize. Based on the
composition in Table 5.2, the Al12Mg17 intermetallic is expected to be the only phase
present [11] and in the XRD pattern for the pre-mix, Figure 5.5, there is a small peak
which could correspond to this phase. Other investigators [55,200,201] have found
Alumix 123 to contain magnesium as a master alloy powder – some of which also found a
composition of Al-50wt%Mg by EDS analyses [200,201] and suggested the angular
morphology to be the result of mechanical grinding [200].
The silicon-containing particles are rounded and have an ellipsoid or cylindrical
particle shape, Figure 5.3, with a rough, irregular surface, Figure 5.6. These features may
be the result of an atomization process – although the silicon-containing particles are
much more elongated and smoother than the elemental aluminum powder which is also
believed to be air atomized. The silicon-content of the master alloy, Table 5.2, would
presumably increase fluidity and could have modified particle shape and solidification
during atomization. The cross sectional microstructure of the silicon-containing particles,
Figure 5.4, is consistent with rapid cooling, which would be experienced during
atomization. Other investigators [55,200,201] have found Alumix 123 to contain silicon
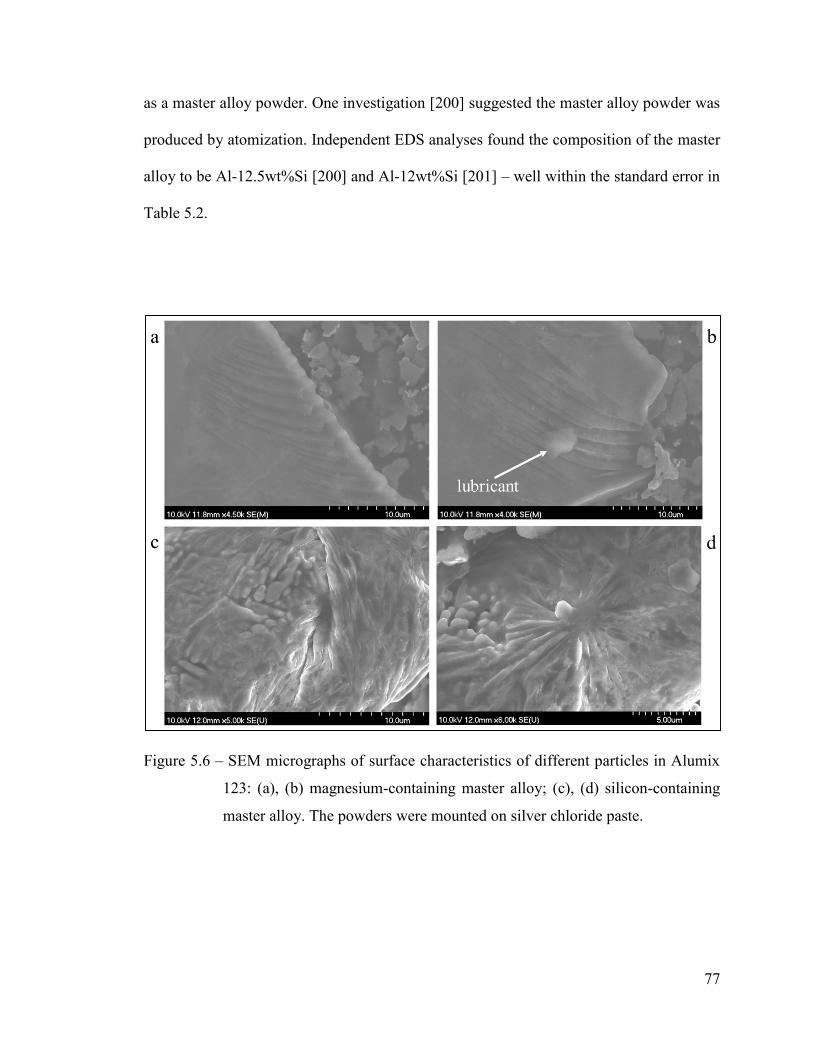
77
as a master alloy powder. One investigation [200] suggested the master alloy powder was
produced by atomization. Independent EDS analyses found the composition of the master
alloy to be Al-12.5wt%Si [200] and Al-12wt%Si [201] – well within the standard error in
Table 5.2.
Figure 5.6 – SEM micrographs of surface characteristics of different particles in Alumix
123: (a), (b) magnesium-containing master alloy; (c), (d) silicon-containing
master alloy. The powders were mounted on silver chloride paste.
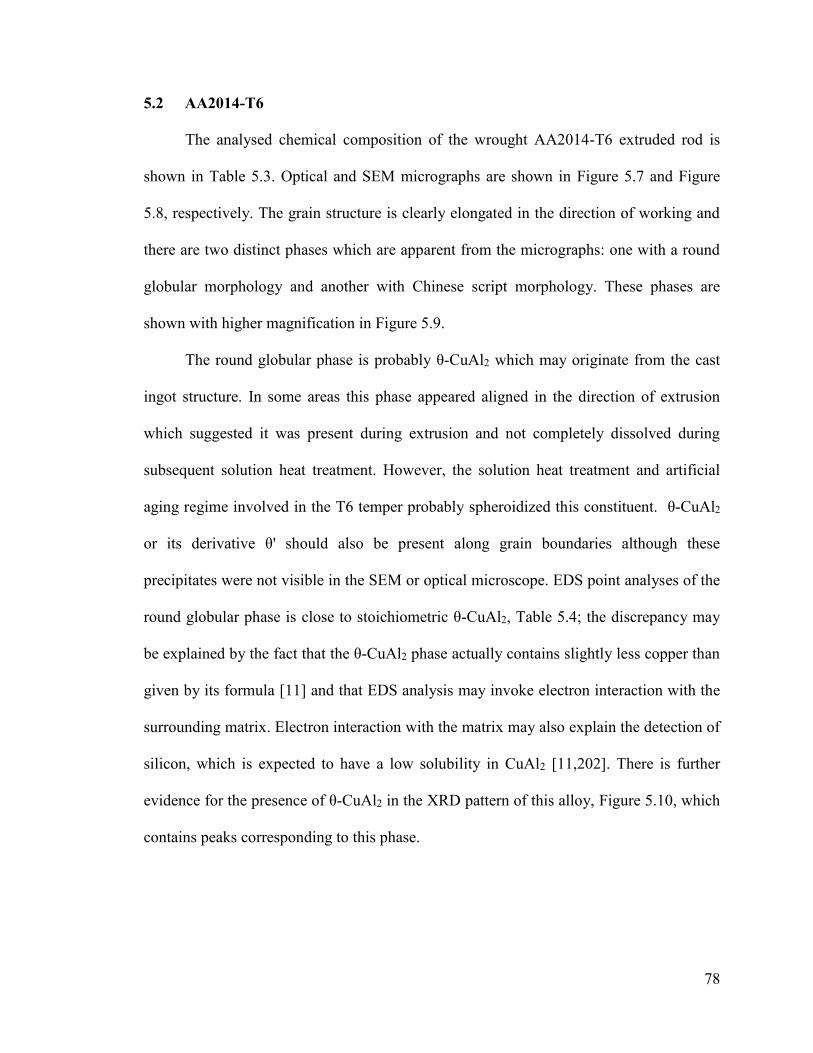
78
5.2 AA2014-T6
The analysed chemical composition of the wrought AA2014-T6 extruded rod is
shown in Table 5.3. Optical and SEM micrographs are shown in Figure 5.7 and Figure
5.8, respectively. The grain structure is clearly elongated in the direction of working and
there are two distinct phases which are apparent from the micrographs: one with a round
globular morphology and another with Chinese script morphology. These phases are
shown with higher magnification in Figure 5.9.
The round globular phase is probably θ-CuAl2 which may originate from the cast
ingot structure. In some areas this phase appeared aligned in the direction of extrusion
which suggested it was present during extrusion and not completely dissolved during
subsequent solution heat treatment. However, the solution heat treatment and artificial
aging regime involved in the T6 temper probably spheroidized this constituent. θ-CuAl2
or its derivative θ' should also be present along grain boundaries although these
precipitates were not visible in the SEM or optical microscope. EDS point analyses of the
round globular phase is close to stoichiometric θ-CuAl2, Table 5.4; the discrepancy may
be explained by the fact that the θ-CuAl2 phase actually contains slightly less copper than
given by its formula [11] and that EDS analysis may invoke electron interaction with the
surrounding matrix. Electron interaction with the matrix may also explain the detection of
silicon, which is expected to have a low solubility in CuAl2 [11,202]. There is further
evidence for the presence of θ-CuAl2 in the XRD pattern of this alloy, Figure 5.10, which
contains peaks corresponding to this phase.

79
Table 5.3 – Chemical analysis of AA2014-T6 by ICP-OES (wt%). Balance Al.
Composition Cu Mg Si Mn Fe Cr Zn Ti Others
(each)
Others
(total)
Nominala 3.9-5.0 0.20-0.8 0.50-1.2 0.40-1.2 0.7 0.10 0.25 0.15 0.05 0.15
Analysed 4.73 0.49 0.56 1.15 0.36 0.07 0.20 0.02 –b 0.12
aMaximum unless shown as a range bBi: 0.03; Ca: 0.01; Ga: 0.01; K: <0.01; Na: 0.01; Ni: 0.03; P: <0.01; Pb: 0.01; V: 0.01
Figure 5.7 – Optical micrographs of AA2014-T6 (etched): (a) transverse plane; (b)
longitudinal plane.

80
Figure 5.8 – SEM micrographs of AA2014-T6: (a) transverse plane; (b) longitudinal
plane.

81
Figure 5.9 – SEM micrographs of constituents in AA2014-T6 (transverse plane): (a)
round, globular constituent; (b) Chinese script constituent.

82
Table 5.4 – Summary of EDS point analyses of major phases in AA2014-T6 (wt%).
Phase
EDS Point Analysis (wt%)a
Al Cu Mg Si Mn Fe Cr No. of
points
Matrix 93.2±0.9 5.0±0.1 0.4±0.0 0.7±0.3 0.7±0.6 – – 7
Round,
globularb 48.7±2.2 51.0±2.1 – 0.3±0.1 – – – 9
Chinese
scriptc,d 61.2±3.9 7.5±0.7 – 6.4±0.5 10.2±1.7 14.4±1.6 0.3±0.1 12
aValues are given as mean ± standard deviation
bCuAl2 formula: Al: 45.9; Cu: 54.1 c(CuFeMn)3Si2Al15 formula: Al: 62.1-64.7; Si: 8.6-9.0; (CuFeMn): 26.3-29.3 d(CuMnFe)3SiAl12 formula: Al: 59.7-62.7; Si: 5.2-5.4; (CuFeMn): 31.9-35.1
Figure 5.10 – XRD pattern of AA2014-T6 (transverse plane): (a) full pattern; (b) close-up
of smaller peaks.

83
The Chinese script phase appears to be fragmented and aligned in the direction of
working, Figure 5.8, indicating this phase was present during extrusion and its
morphology was not significantly affected by subsequent heat treatment – suggesting the
presence of elements which have low solubility in aluminum. This phase was found by
EDS analyses, Table 5.4, to consist of aluminum, copper, iron, manganese, silicon, and a
small amount of chromium. The phase relations involving these elements are complex
and convoluted by the ability of intermetallics to take other elements in to solution. There
are no universally agreed upon formulae and compositional information for these
intermetallics, so a conclusive identification of the Chinese script phase is beyond the
scope of this work. Based on the available evidence a probable candidate is the α-
AlFeMnSi phase which has been described by the formula (FeMn)3Si2Al15 or
(FeMn)3SiAl12 [11,202], and is the result of some miscibility between the α-AlFeSi
(Fe2SiAl8) and α-AlMnSi (Mn3Si2Al15 or Mn3SiAl12) phases. The α-AlFeMnSi phase may
contain chromium in place of iron and manganese, and may also absorb copper into
solution as (CuFeMn)3Si2Al15 or (CuMnFe)3SiAl12 [11]. These formulae are in
approximate agreement with the EDS analyses of the Chinese script phase, Table 5.4.
Copper may also replace silicon in α-AlFeMnSi [11] which may partly explain the
discrepancy between the analysed silicon and that given by the formulae in Table 5.4.
Referring to the XRD pattern, Figure 5.10, there is a good match in the powder
diffraction database for an intermetallic of the formula (Fe3.2Mn0.8)Si2Al17 which has a
composition closely corresponding to α-AlFeMnSi (i.e. (FeMn)3Si2Al15 or
(FeMn)3SiAl12), the same crystal structure as α-AlFeMnSi (cubic) [11], and a lattice
parameter within the possible confines for α-AlFeMnSi given by [11]. The only
inconsistency from the powder diffraction file then is the presence of copper and
84
chromium in the Chinese script. In their amounts detected by EDS both of these elements
have been found to stabilize the cubic structure of α-AlFeMnSi [203] and presumably
would not drastically alter the diffraction pattern of this intermetallic.
The matrix was found by EDS point analyses, Table 5.4, to contain a large amount
copper, in fact an amount exceeding the bulk content of the alloy, Table 5.3, indicating
there must be electron interaction with surrounding copper-rich constituents during
analysis. In addition to θ' and θ-CuAl2, there is expected to be Q-phase (Cu2Mg8Si6Al5)
precipitates present in this alloy [11,202] which could be distributed throughout the
matrix as finer precipitates and contributed to the excess copper detection. Upon close
examination of Figure 5.9 there seems to be lighter-coloured areas in contrast with the
matrix that are of smaller size than the round, globular θ-CuAl2 and may possibly be
another type of precipitate, for instance Q-phase. This would also explain the detection of
silicon and magnesium in the matrix, Table 5.4, although these elements may be present
as Mg2Si as well or in the case of magnesium in solid solution with aluminum. There was
also manganese detected in the matrix, Table 5.4, which may not be the result of electron
interaction with the Chinese script phase as iron was not simultaneously detected. A
source of manganese is potentially Cu2Mn3Al20 or (CuMn)Al6 dispersoids which are
expected to be present in this alloy [202], however it is not clear if this would contribute
manganese X-ray peaks to the extent observed. It is worth pointing out that these
particular products contained manganese and silicon contents near the maximum and
minimum permissible values, respectively, Table 5.3, which may have influenced the
amount of manganese-containing dispersoids formed.

85
CHAPTER 6 P/M PROCESSING OF ALUMIX 123
The effect of compaction pressure on the green and sintered density of Alumix 123 is
shown in Figure 6.1. Laboratory sintered specimens were prepared using a variety of
compaction pressures in order to study the effect of this parameter on green density,
sintered density, and corrosion behaviour. The highest practical green and sintered
density is achieved with a compaction pressure of 300MPa, Figure 6.1; higher
compaction pressures lead to no practical increase in green or sintered density and only
serve to increase die wear. With this information, and recommendations from industry, all
industrially sintered specimens were prepared using a compaction pressure of 300MPa.
The industrially sintered material possessed a superior sintered density compared to the
laboratory sintered material, Figure 6.1, which was probably due to the use of pre-heated
nitrogen in the sinter zone or better control and uniformity of temperature in the industrial
furnace.
Under the usual sintering conditions, the highest sintered density attainable for
Alumix 123 was approximately 92% theoretical density, Figure 6.1, which is comparable
to other laboratory findings [55,199,200,204] where Alumix 123 was sintered at 590-
600°C for 20-30 minutes. Extending the isothermal sintering time to 60 or 120 minutes
does not significantly increase densification [199,200]. The low sintered density of
Alumix 123 can be interpreted in terms of the swelling of compacts as a result of
sintering, Figure 6.2, which has been attributed to expansion and phase transformations in
the lubricant [55] and formation of transient liquids of the Al-Mg, Al-Cu-Mg, and Al-Cu-
Mg-Si systems [200] during heating to the isothermal sintering temperature.

86
Figure 6.1 – Green and sintered density of Alumix 123 as a function of compaction
pressure.
Figure 6.2 – Sintering-induced dimensional and mass changes measured for green
compacts of Alumix 123 as functions of compaction pressure.
87
The swelling of compacts occurred principally along the axis of uniaxial pressing,
Figure 6.2, which could have been related to the contact area between metallic particles
and their preferential orientation along the axis perpendicular to uniaxial pressing [55].
Expansion and phase transformations of the lubricant in the gap between contacting
metallic particles would then lead to the preferential expansion of compacts along the axis
of uniaxial pressing [55]. In a similar manner, if the contact area between the elemental
alloy or master alloy additions and the base elemental aluminum powder was larger along
the axis perpendicular to uniaxial pressing, then liquid phases may have preferentially
formed and spread in this direction, leading to the increased swelling of compacts along
the axis of uniaxial pressing. This mechanism is supported by Al-Cu pressed wire model
experiments [86] where pure copper wire was uniaxially compacted amongst pure
aluminum wire while oriented along the axis perpendicular to uniaxial pressing. During
sintering, the Al-Cu eutectic penetrated rapidly along the axis perpendicular to uniaxial
pressing but caused a much larger swelling along the axis of uniaxial pressing [86].
The distribution of porosity in Alumix 123-T1 was highly non-uniform, Figure 6.3;
there was less porosity in the center of the compacts and along the face which was
adjacent to the mesh belt during sintering. This is postulated to be related to the local
sintering atmosphere in the area. The oxygen partial pressure near the exterior of
compacts was probably higher than in the centre of compacts due to the continuous flow
of fresh nitrogen which contained oxygen and water vapour contaminants that led to
oxidation and disturbed the sintering and densification mechanisms of Alumix 123 in
these areas.
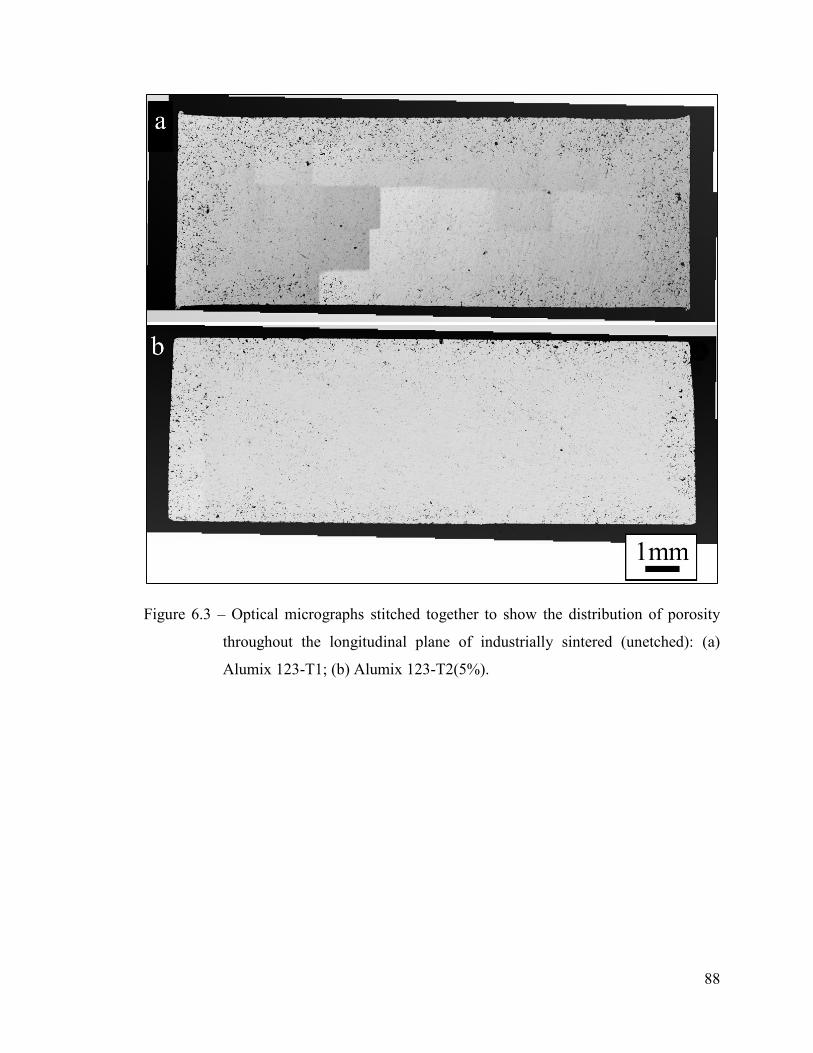
88
Figure 6.3 – Optical micrographs stitched together to show the distribution of porosity
throughout the longitudinal plane of industrially sintered (unetched): (a)
Alumix 123-T1; (b) Alumix 123-T2(5%).

89
As expected, the sizing operation reduced the total amount of porosity in Alumix
123-T2, Figure 6.3. The effect of sizing pressure on reduction in thickness is shown in
Figure 6.4. It should be pointed out that the sizing operation here was analogous to open
die forging. Due to dimensional instability as a result of sintering, specimens were sized
in a larger diameter die (30mm) than used for powder compaction meaning no force was
exerted on specimens in the radial direction during sizing. This explains the large amount
of plastic deformation in specimens at high sizing pressures, Figure 6.4. The sizing
pressures in Figure 6.4 are reported with respect to the original compact diameter
(15mm).
The surface of Alumix 123-T1 and Alumix 123-T2(5%) in the ‘as-sintered’ and ‘as-
sized’ condition, which was the condition of these materials in subsequent
electrochemical testing, are shown in Figure 6.5. The surfaces were rough, highly non-
planar, and contained areas which appeared of darker contrast in the SEM, Figure 6.5.
These darker areas were found to contain significant carbon, oxygen, and sometimes
nitrogen by EDS analyses and are believed to be remnants from the ethylene
bisstearamide (EBS) lubricant which may have redeposited on the surface of compacts
during the de-lubrication stage of sintering.
The surface of Alumix 123 compacts was found by EDS analyses to be enriched with
carbon (ca. 6wt%), oxygen (ca. 8wt%), and magnesium (ca. 2wt%), as compared to EDS
analyses of polished compacts. The carbon and oxygen concentration may have been due
to the continuous flow of fresh nitrogen over the exterior of compacts during sintering.
The fresh nitrogen contains a small amount of contaminants such as carbon dioxide,
oxygen, and water vapour which may have reacted with the compacts and incorporated
into a refractory layer.

90
Figure 6.4 – Sizing curve for industrially sintered Alumix 123 specimens. All specimens
were initially compacted at 300MPa.
The magnesium on the surface of compacts was probably in the oxidized state and its
concentration could be related to its high vapour pressure or affinity for oxygen in
aluminum P/M systems. The first liquid phase to form during sintering of Alumix 123
corresponds to the fusion of the magnesium-containing master alloy particles to a
magnesium-rich liquid phase [200] and the evaporation and transport of magnesium in the
vapour phase may have led to its eventual oxidation and deposition near the surface of
compacts. Magnesium also acts as a local oxygen getter and disrupts the aluminum oxide
layer via formation of Al2MgO4 [1] and the flow of fresh nitrogen over the exterior of
compacts continually introduces more oxygen to the area and may have led to the
continued migration and oxidation of magnesium on the surface of compacts.
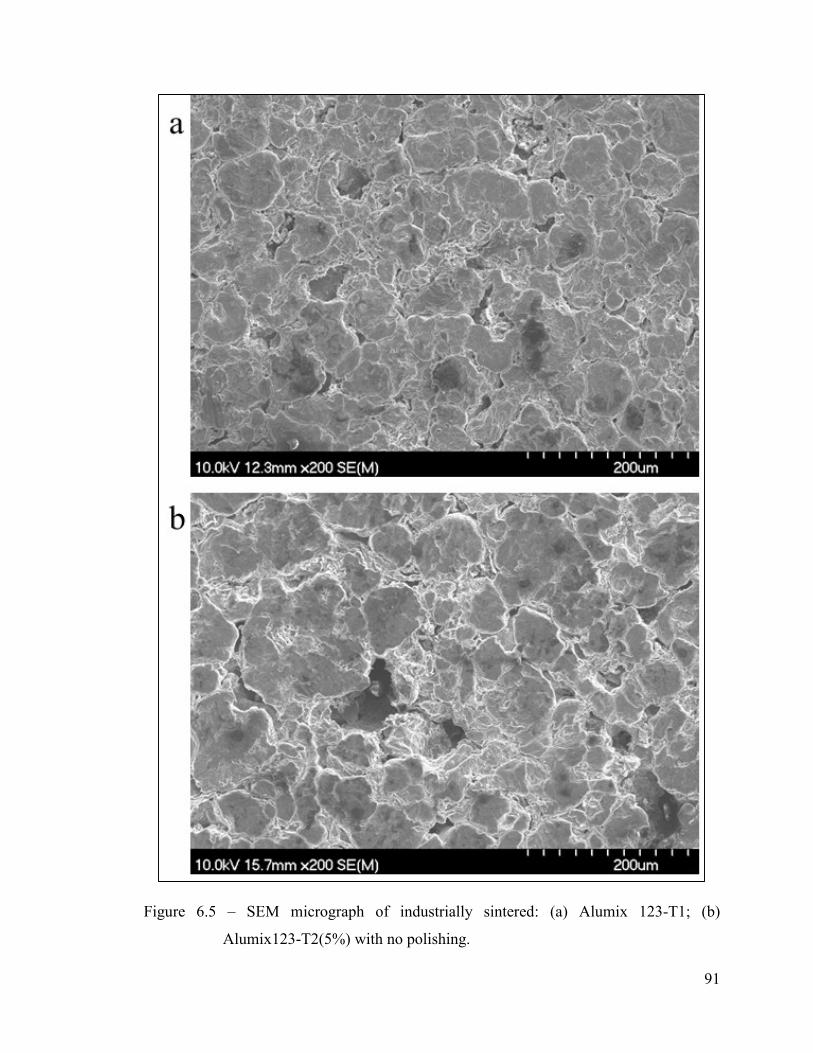
91
Figure 6.5 – SEM micrograph of industrially sintered: (a) Alumix 123-T1; (b)
Alumix123-T2(5%) with no polishing.
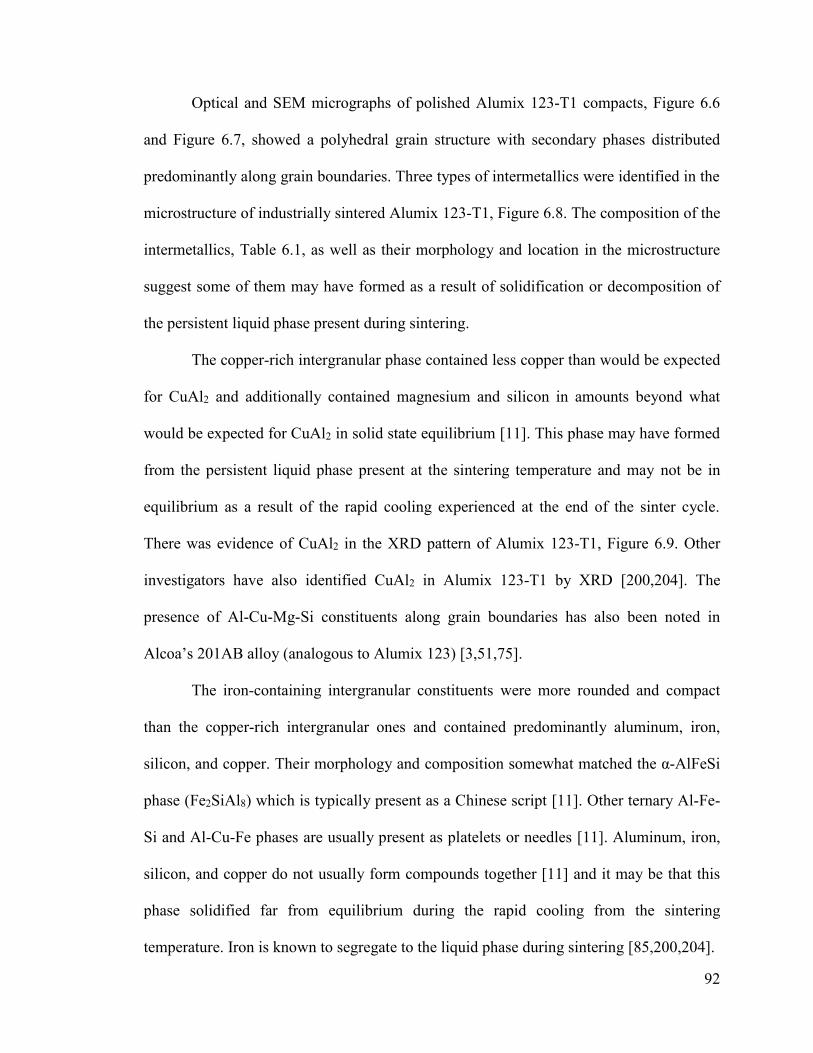
92
Optical and SEM micrographs of polished Alumix 123-T1 compacts, Figure 6.6
and Figure 6.7, showed a polyhedral grain structure with secondary phases distributed
predominantly along grain boundaries. Three types of intermetallics were identified in the
microstructure of industrially sintered Alumix 123-T1, Figure 6.8. The composition of the
intermetallics, Table 6.1, as well as their morphology and location in the microstructure
suggest some of them may have formed as a result of solidification or decomposition of
the persistent liquid phase present during sintering.
The copper-rich intergranular phase contained less copper than would be expected
for CuAl2 and additionally contained magnesium and silicon in amounts beyond what
would be expected for CuAl2 in solid state equilibrium [11]. This phase may have formed
from the persistent liquid phase present at the sintering temperature and may not be in
equilibrium as a result of the rapid cooling experienced at the end of the sinter cycle.
There was evidence of CuAl2 in the XRD pattern of Alumix 123-T1, Figure 6.9. Other
investigators have also identified CuAl2 in Alumix 123-T1 by XRD [200,204]. The
presence of Al-Cu-Mg-Si constituents along grain boundaries has also been noted in
Alcoa’s 201AB alloy (analogous to Alumix 123) [3,51,75].
The iron-containing intergranular constituents were more rounded and compact
than the copper-rich intergranular ones and contained predominantly aluminum, iron,
silicon, and copper. Their morphology and composition somewhat matched the α-AlFeSi
phase (Fe2SiAl8) which is typically present as a Chinese script [11]. Other ternary Al-Fe-
Si and Al-Cu-Fe phases are usually present as platelets or needles [11]. Aluminum, iron,
silicon, and copper do not usually form compounds together [11] and it may be that this
phase solidified far from equilibrium during the rapid cooling from the sintering
temperature. Iron is known to segregate to the liquid phase during sintering [85,200,204].

93
Figure 6.6 – Optical micrograph of industrially sintered Alumix 123-T1 (etched). The
micrograph was taken in longitudinal plane near the edge of the sample.
Figure 6.7 – SEM micrograph of industrially sintered Alumix 123-T1.

94
Figure 6.8 – SEM micrographs of constituents in industrially sintered Alumix 123-T1: (a)
copper-rich intergranular; (b) iron-containing intergranular; (c) iron-
containing needles.
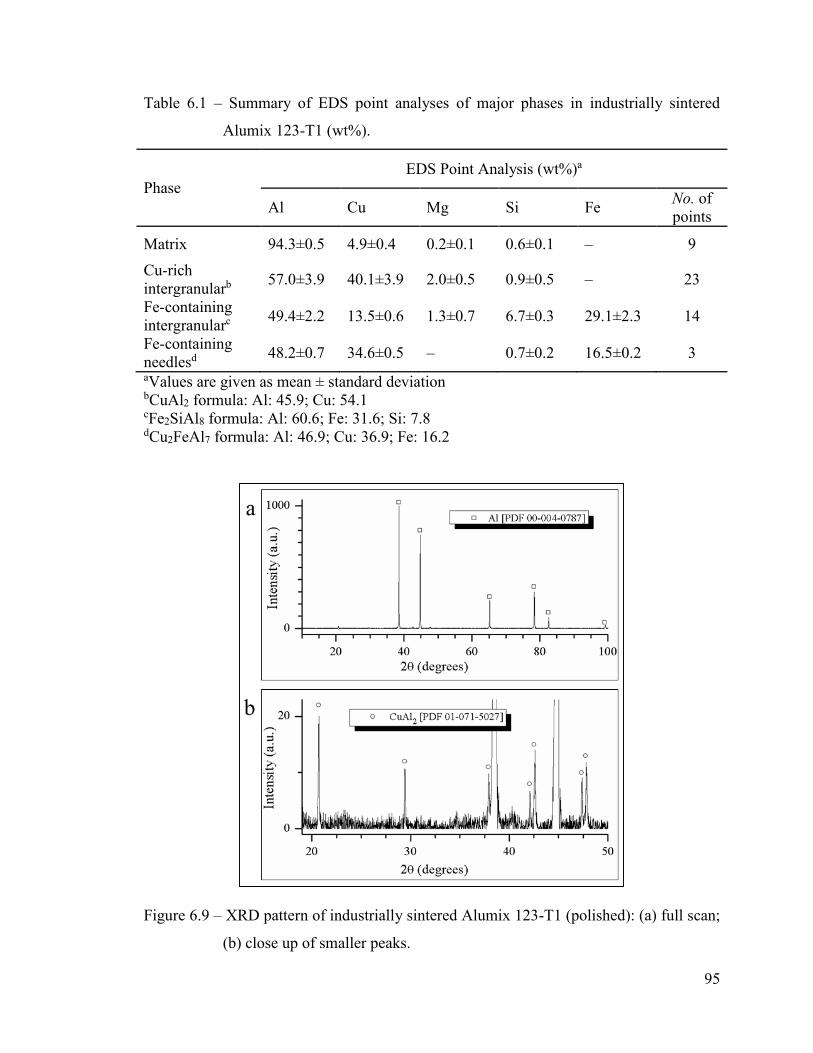
95
Table 6.1 – Summary of EDS point analyses of major phases in industrially sintered
Alumix 123-T1 (wt%).
Phase
EDS Point Analysis (wt%)a
Al Cu Mg Si Fe No. of
points
Matrix 94.3±0.5 4.9±0.4 0.2±0.1 0.6±0.1 – 9
Cu-rich
intergranularb 57.0±3.9 40.1±3.9 2.0±0.5 0.9±0.5 – 23
Fe-containing
intergranularc 49.4±2.2 13.5±0.6 1.3±0.7 6.7±0.3 29.1±2.3 14
Fe-containing
needlesd 48.2±0.7 34.6±0.5 – 0.7±0.2 16.5±0.2 3
aValues are given as mean ± standard deviation
bCuAl2 formula: Al: 45.9; Cu: 54.1 cFe2SiAl8 formula: Al: 60.6; Fe: 31.6; Si: 7.8 dCu2FeAl7 formula: Al: 46.9; Cu: 36.9; Fe: 16.2
Figure 6.9 – XRD pattern of industrially sintered Alumix 123-T1 (polished): (a) full scan;
(b) close up of smaller peaks.

96
The iron-containing needle-like constituents had a morphology and composition
closely matching that of the β(FeCu) phase (Cu2FeAl7) [11]. This phase may have formed
in areas which were isolated from magnesium and silicon during sintering or in areas of
the compact that experienced slower cooling rates after sintering. These constituents were
scarcely found and are not considered to be a major phase present in Alumix 123-T1.
Other investigators have noticed needle-like iron-containing constituents in Alumix 123,
however only after solution heat treatment [200,204].
The matrix was found by EDS point analyses to contain copper, magnesium, and
silicon, Table 6.1, in amounts which could be related to their solubilities in solid
aluminum at the isothermal sintering temperature. The amount of copper detected exceeds
the bulk copper content of the alloy which may indicate there was electron interaction
with surrounding copper-rich phases during EDS analyses.

97
CHAPTER 7 CORROSION BEHAVIOUR OF ALUMIX 123 P/M
ALLOY AND AA2014-T6. PART I: OCP AND
POTENTIODYNAMIC POLARIZATION
W.D. Judge1, D.P. Bishop1, and G.J. Kipouros2,*
1Materials Engineering, Process Engineering and Applied Science, Dalhousie University,
1360 Barrington Street, Room F201, Halifax, Nova Scotia, Canada, B3H 4R2
2Chemical Engineering, College of Engineering, University of Saskatchewan, 57 Campus
Drive, Saskatoon, Saskatchewan, Canada, S7N 5A9
(*Corresponding author: [email protected])
Status: To be submitted to Journal of the Electrochemical Society
The following experimental procedures, results, and discussions were completed by W.D.
Judge with reviewer and editorial roles played by D.P. Bishop and G.J. Kipouros.

98
ABSTRACT
The corrosion behaviour of the commercial aluminum powder metallurgy (P/M)
alloy ‘Alumix 123’ and a compositionally similar wrought alloy, AA2014-T6, has been
studied in naturally aerated 3.5wt% NaCl through open circuit potential (OCP), cathodic
polarization, and cyclic potentiodynamic polarization experiments, and the corrosion
morphology at open circuit conditions characterized by scanning electron microscopy
(SEM) and energy dispersive X-ray spectroscopy (EDS). The P/M alloy was sintered in
an industrial setting and was tested in either the ‘as-sintered’ condition (T1 temper) or
after a standard sizing operation (T2 temper). The OCP of Alumix 123-T1 stabilized at
more negative values, which is believed to be a reaction to a reduction in cathode area or
depassivation induced by propagating crevice corrosion within residual porosity. In this
state, the corrosion of Alumix 123-T1 was partially under anodic control and proceeded
with the cathodic evolution of hydrogen. The OCP of Alumix 123-T2 and AA2014-T6
stabilized at the pitting potential where corrosion was mostly under cathodic control and
proceeded with the cathodic reduction of oxygen. In the P/M materials pitting was not
associated with copper- or iron-rich intermetallics, this was attributed to the refractory
layer formed as a result of the sintering process.
Keywords: aluminum alloy; corrosion; electrochemistry; powder metallurgy; crevice
corrosion; intermetallics; Alumix 123; AA2014
99
7.1 INTRODUCTION
The ‘press-and-sinter’ powder metallurgy (P/M) process is a net- or near-net-shape
technology which enables the mass production of small and complex parts on an
economic scale superior to conventional die casting and machining operations. The
process typically involves the uniaxial die compaction of a powder pre-mix in to a friable
‘green compact’ of net- or near-net-shape, which is then sintered at elevated temperature
to form a metallurgically coherent body and may be subject to additional secondary
operations such as heat treatment, coining, or sizing. Sizing, in which a sintered body is
repressed in a die to improve dimensional tolerances, is a common secondary operation in
commercial P/M due to slight dimensional changes which are induced by the sintering
process.
In aluminum P/M alloys, the processing history is indicated by temper designations
in a similar manner to conventional aluminum alloys, however with slight modifications
to temper definitions [7]. The T1 temper, which traditionally represents wrought
aluminum product which has been cooled from hot working, is used to denote P/M
aluminum product which has been cooled from the sintering temperature. Likewise, the
T2 temper, which traditionally represents wrought aluminum product which has been
cooled from hot working and subsequently cold worked, is used to denote P/M aluminum
product which has been cooled from the sintering temperature and sized.
Commercial P/M aluminum has been utilized in a variety of products including
business machines, consumer appliances, portable power tools, and audio-visual
equipment [1,2]; sometimes with production rates in excess of 1 million parts per month
[2]. However, the most notable applications have been in the automotive industry
[1,27,28,73,205]. In particular, the camshaft bearing caps for consumer automobiles

100
[27,73], where over 50 million have been produced since production began in 1991 [205]
– in some instances resulting in 35% cost savings over traditionally produced caps [28].
In the 2000s, automotive P/M production declined due to financial and energy crises
which saw North American automobile manufacturers lose market share to importers
which do not utilize as many P/M parts [206]. Even in North America, P/M aluminum is
produced in tonnages below that of P/M ferrous, cuprous, and nickelous alloys [206]
which is arguably not representative when considering the prevalence of aluminum as a
cast or wrought material. The aluminum P/M industry has great potential for growth,
especially in foreign markets such as China and India, but this is dependent upon the
improvements in material properties and process design generated by current research and
development efforts [1]. Most efforts have focused on improving established material
properties including tensile strength, wear resistance, and fatigue [1]. The corrosion
resistance of P/M aluminum has received much less attention yet is an important
consideration for design engineers and should not be considered analogous to the
behaviour of conventional aluminum alloys. For example, in ferrous P/M alloys there are
unique corrosion mechanisms operating which are absent in wrought materials of the
same composition [207-209].
In this work the corrosion behaviour of the commercial P/M aluminum alloy
‘Alumix 123’ has been studied by electrochemical methods in naturally aerated 3.5wt%
NaCl electrolyte. With the exception of recent work from this laboratory [4], prior
corrosion evaluations of P/M aluminum have been restricted to salt spray tests [5-7],
which only assign a letter rating of ‘A’ through ‘E’ based on specimen appearance. The
aim of the electrochemical investigations is to identify fundamental corrosion
mechanisms, and to provide quantitative thermodynamic and kinetic information which

101
can be used to predict material performance and design systems of corrosion prevention
and inhibition. The corrosion behaviour of a compositionally similar wrought alloy,
AA2014-T6, has been studied simultaneously to provide a comparison to the P/M
material and point of reference with the open literature.
7.2 EXPERIMENTAL
7.2.1 Materials
Alumix 123 pre-mix was obtained from ECKA Granules Germany GmbH (Fürth,
Bavaria, Germany). The pre-mix contained 1.5wt% admixed ‘Licowax C’ solid lubricant
and was certified to quality control standards for particle size distribution, apparent
density, flowability, and chemical composition by the manufacturer. Compositional
chemical analysis of Alumix 123 by ICP-OES performed by the Minerals Engineering
Centre, Dalhousie University is shown in Table 7.1. Its cumulative size distribution was
also measured by laser particle size analysis, performed by the Minerals Engineering
Centre, Dalhousie University, and its D10, D50, and D90 determined to be 27.1, 95.4, and
196µm, respectively. AA2014-T6 was obtained from Kaiser Aluminum (Jackson,
Tennessee, U.S.A.) as a 3.25 inch diameter extruded rod certified to ASTM B211
standard. Compositional chemical analysis of AA2014 by ICP-OES, performed by the
Minerals Engineering Centre, Dalhousie University, is included in Table 7.1.

102
Table 7.1 – Chemical analyses of Alumix 123 and AA2014 by ICP-OES (wt%).
Material Al Cu Mg Si Mn Fe Others
Alumix 123a Balance 4.57 0.52 0.80 <0.01 0.11 –b
AA2014 Balance 4.73 0.49 0.56 1.15 0.36 –c
aAnalysis was performed on a sintered compact bZn: 0.05; Remaining: 0.16(total), <0.05(each) cCr: 0.07; Ti: 0.02; Zn: 0.20; Remaining: 0.12(total), <0.05(each)
7.2.2 P/M Processing
Green compacts were prepared by uniaxially compacting 2.5g of powder pre-mix
at 300MPa in a 15mm diameter tungsten carbide floating die assembly using an Instron
SATEC Series 5594-200HVL load frame (1MN capacity). The average green density was
2.623±0.004gcm–3 (94.5±0.2% theoretical) determined in accordance with Metal Powder
Industries Federation (MPIF) Standard 42.
Green compacts were sintered at GKN Sinter Metals (Conover, North Carolina,
U.S.A.) under a nitrogen atmosphere in a continuous wire mesh belt conveyor furnace
employing standard operating procedures for industrial sintering of Alumix 123. Here, the
green compacts were placed on a shallow tray which was then placed on the wire mesh
belt of the furnace amongst other industrial product. The green compacts were oriented on
the tray so that the flat circular face of the compact which was in contact with the lower
punch during powder compaction was adjacent to the tray. The average change in height,
diameter, and mass as a result of sintering was +2.41±0.40%, –0.23±0.09%, and –
1.55±0.08% respectively. The average sintered density was 2.561±0.008gcm–3
(92.2±0.3% theoretical) determined in accordance with MPIF Standard 42. The

103
processing response here was typical for industrial product and consistent with other
laboratory investigations [55,199,200,204].
Sintered compacts were sized with the same load frame used for powder
compaction but in a larger diameter (30mm) die in order to accommodate the dimensional
changes that resulted from the sintering process. Prior to sizing, sintered compacts were
carefully deburred by hand against SiC paper. Sizing fluid was provided by GKN Sinter
Metals (Conover, North Carolina, U.S.A.). Sintered compacts were fully submersed in
sizing fluid and then sized at 310MPa which corresponded to a 5% reduction in height.
During sizing, the compacts were oriented so that the flat circular face of the compact that
was in contact with the lower punch during powder compaction was in contact with the
lower punch during sizing.
7.2.3 Materials Preparation
Alumix 123 was tested in the ‘as-sintered’ or ‘as-sized’ states which are herein
denoted by the T1 and T2 temper, respectively. Prior to testing Alumix 123-T1 compacts
had to be carefully deburred by hand against SiC paper so that a satisfactory seal and
electrical contact could be maintained in the electrode assembly. During testing, compacts
were oriented so that the flat circular face that was in contact with the upper punch during
powder compaction was in contact with the electrolyte. In the case of Alumix 123-T2,
this face also corresponded to that which was in contact with the upper punch during
sizing.
AA2014-T6 specimens were prepared by sectioning the extruded rod along the
transverse plane in to 4mm thick slices, from which 16mm diameter specimens were
extracted using a hole-saw drilled in the longitudinal direction. Hence, during testing, the

104
transverse plane was in contact with the electrolyte. AA2014-T6 specimens were polished
using standard metallographic techniques immediately prior to testing. They were
abraded on successively finer grits of wet SiC paper, polished using successively finer
oil-based diamond suspensions (to 1μm), degreased ultrasonically in acetone, thoroughly
rinsed in deionized water, and dried with a blow dryer.
7.2.4 Electrochemical Testing
All electrochemical tests were conducted at ambient temperature in naturally
aerated 3.5wt% NaCl electrolyte which was prepared immediately prior to testing using
analytical-grade NaCl (>99.0% assay) and ultrapure ‘Type 1’ deionized water
(>18MΩ∙cm). The electrochemical instrumentation consisted of a standard three electrode
glass bulb cell (1L capacity) connected to a Princeton Applied Research (PAR) Model
273A EG&G Potentiostat/Galvanostat which incorporated a grounded electrometer and
was connected to a desktop computer and controlled via Scribner Associates CorrWare®
software. The potentiostat was calibrated by the use of a laboratory-made ‘dummy cell.’
The glass bulb cell contained a working electrode assembly that exposed a nominal area
of 1cm2 of the test specimen, two high purity fully dense 6.35mm diameter graphite
counter electrodes, and a saturated calomel reference electrode (SCE) brought in close
proximity to the working electrode via a Luggin capillary. The reference electrode was
from Fisher Scientific – the rest of the electrochemical cell was comprised of the PAR
Model K0047 ‘Corrosion Cell System’ and Model K0105 ‘Flat Specimen Holder.’
The open circuit potential (OCP) of the working electrode was monitored versus
time for a period of 2 hours for Alumix 123-(T1, T2) and 1 hour for AA2014-T6. The
P/M samples were monitored for a longer period of time because they were highly non-

105
planar and took longer to equilibrate with the electrolyte. The potential at the conclusion
of the test was taken to be the OCP of the specimen. Prior to all potentiodynamic testing,
the OCP was monitored and allowed to stabilize for the times indicated above.
During cathodic potentiodynamic polarization the potential of the working
electrode was varied continuously at a rate of 0.1667mVs–1 from the OCP to –2.0VSCE.
During cyclic potentiodynamic polarization the potential of the working electrode was
varied continuously at a rate of 0.1667mVs–1 from –1.25VSCE for Alumix 123-T1 or –
0.875VSCE for Alumix 123-T2 and AA2014-T6 until an anodic current density of
0.01Acm–2 was reached, upon which the direction of the scan was reversed until a
potential of –1.0VSCE.
The polarization diagrams were analysed using Scribner Associates CorrViewTM
software. The corrosion current (icorr) and corrosion potential (Ecorr) were found by Tafel
extrapolation, the passive current (ipass) was taken as the current density immediately prior
to breakdown at the pitting potential (Epit), and the repassivation potential (Erepass) was
taken as the potential where the anodic current density reached a value of 1μA on the
reverse scan. The corrosion rate was calculated from icorr in accordance with ASTM
G102. The equivalent weight of both alloys was calculated to be 9.29 gram equivalents.
The sintered density of Alumix 123-T1 was used for P/M calculations. The density of
AA2014-T6 was taken as 2.80gcm–3 as per the Aluminum Association.
7.2.5 Materials Characterization
Micrographs were captured using a Hitachi Model S-4700 cold field emission
scanning electron microscope (SEM) containing an integrated Oxford INCA X-MaxN
80mm silicon drift detector for energy dispersive X-ray spectroscopy (EDS). The SEM
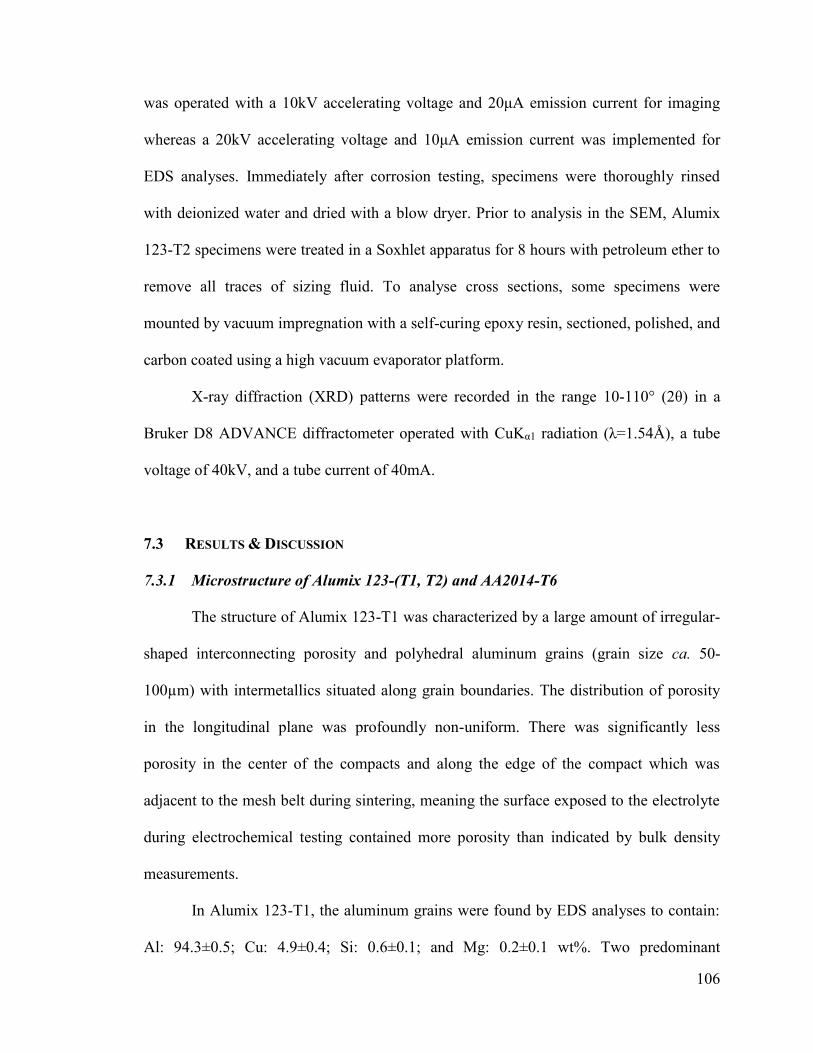
106
was operated with a 10kV accelerating voltage and 20μA emission current for imaging
whereas a 20kV accelerating voltage and 10μA emission current was implemented for
EDS analyses. Immediately after corrosion testing, specimens were thoroughly rinsed
with deionized water and dried with a blow dryer. Prior to analysis in the SEM, Alumix
123-T2 specimens were treated in a Soxhlet apparatus for 8 hours with petroleum ether to
remove all traces of sizing fluid. To analyse cross sections, some specimens were
mounted by vacuum impregnation with a self-curing epoxy resin, sectioned, polished, and
carbon coated using a high vacuum evaporator platform.
X-ray diffraction (XRD) patterns were recorded in the range 10-110° (2θ) in a
Bruker D8 ADVANCE diffractometer operated with CuKα1 radiation (λ=1.54Å), a tube
voltage of 40kV, and a tube current of 40mA.
7.3 RESULTS & DISCUSSION
7.3.1 Microstructure of Alumix 123-(T1, T2) and AA2014-T6
The structure of Alumix 123-T1 was characterized by a large amount of irregular-
shaped interconnecting porosity and polyhedral aluminum grains (grain size ca. 50-
100µm) with intermetallics situated along grain boundaries. The distribution of porosity
in the longitudinal plane was profoundly non-uniform. There was significantly less
porosity in the center of the compacts and along the edge of the compact which was
adjacent to the mesh belt during sintering, meaning the surface exposed to the electrolyte
during electrochemical testing contained more porosity than indicated by bulk density
measurements.
In Alumix 123-T1, the aluminum grains were found by EDS analyses to contain:
Al: 94.3±0.5; Cu: 4.9±0.4; Si: 0.6±0.1; and Mg: 0.2±0.1 wt%. Two predominant

107
intermetallics were identified by SEM and EDS: a copper-rich intergranular phase
containing: Al: 57.0±3.9; Cu: 40.1±3.9; Mg: 2.0±0.5; and Si: 0.9±0.5 wt%, and an iron-
rich intergranular phase containing: Al: 49.4±2.2; Fe: 29.1±2.3; Cu: 13.5±0.6; Si:
6.7±0.3; and Mg: 1.3±0.7 wt%. Both of these intermetallics were probably the result of
the solidification of a liquid phase under conditions far from equilibrium. Iron, which is
present as an impurity, may have segregated to the liquid phase during sintering. There
were no obvious peaks in the XRD trace of Alumix 123-T1 corresponding to any iron-
rich intermetallics. The copper-rich intergranular phase may be a metastable variant of θ-
CuAl2 – the XRD trace of Alumix 123-T1 showed several clear peaks corresponding to
this phase. More detailed information on structure formation during sintering is given by
[1,55,80,199,200,204].
A high surface roughness and non-planarity existed in Alumix 123-T1, Figure 7.1,
probably due to the sintering process and original surface characteristics of the air-
atomized aluminum present in the pre-mix. Across the surface of Alumix 123-T1 were
areas which were in stark contrast to the aluminum grains, Figure 7.1, and by EDS
analyses were found to largely consist of carbon, oxygen, and sometimes nitrogen. These
are believed to be remnants from the ethylene bisstearamide (EBS) lubricant present in
the pre-mix which may have been redeposited on the surface of compacts during the de-
lubrication stage of sintering.

108
Figure 7.1 – SEM micrographs of Alumix 123-T1: a) general microstructure; b) close up
of an aluminum grain; c) close up of a carbon-rich area which is believed to
be a remnant from the EBS lubricant.
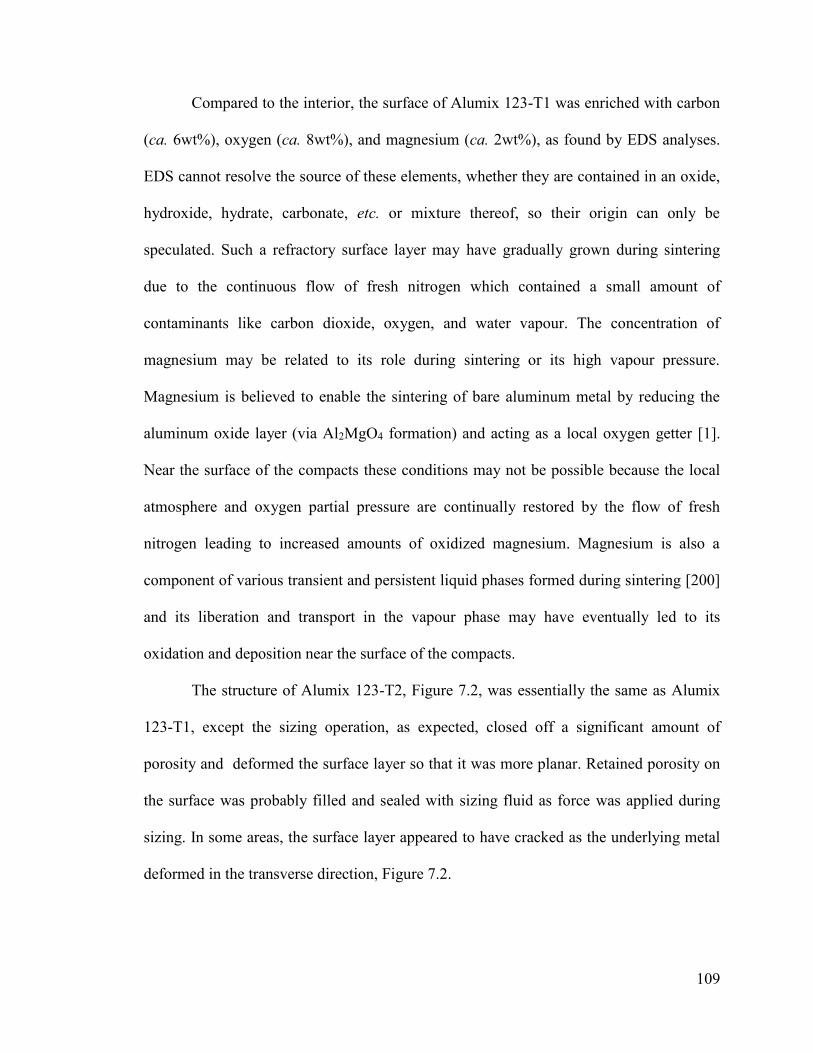
109
Compared to the interior, the surface of Alumix 123-T1 was enriched with carbon
(ca. 6wt%), oxygen (ca. 8wt%), and magnesium (ca. 2wt%), as found by EDS analyses.
EDS cannot resolve the source of these elements, whether they are contained in an oxide,
hydroxide, hydrate, carbonate, etc. or mixture thereof, so their origin can only be
speculated. Such a refractory surface layer may have gradually grown during sintering
due to the continuous flow of fresh nitrogen which contained a small amount of
contaminants like carbon dioxide, oxygen, and water vapour. The concentration of
magnesium may be related to its role during sintering or its high vapour pressure.
Magnesium is believed to enable the sintering of bare aluminum metal by reducing the
aluminum oxide layer (via Al2MgO4 formation) and acting as a local oxygen getter [1].
Near the surface of the compacts these conditions may not be possible because the local
atmosphere and oxygen partial pressure are continually restored by the flow of fresh
nitrogen leading to increased amounts of oxidized magnesium. Magnesium is also a
component of various transient and persistent liquid phases formed during sintering [200]
and its liberation and transport in the vapour phase may have eventually led to its
oxidation and deposition near the surface of the compacts.
The structure of Alumix 123-T2, Figure 7.2, was essentially the same as Alumix
123-T1, except the sizing operation, as expected, closed off a significant amount of
porosity and deformed the surface layer so that it was more planar. Retained porosity on
the surface was probably filled and sealed with sizing fluid as force was applied during
sizing. In some areas, the surface layer appeared to have cracked as the underlying metal
deformed in the transverse direction, Figure 7.2.
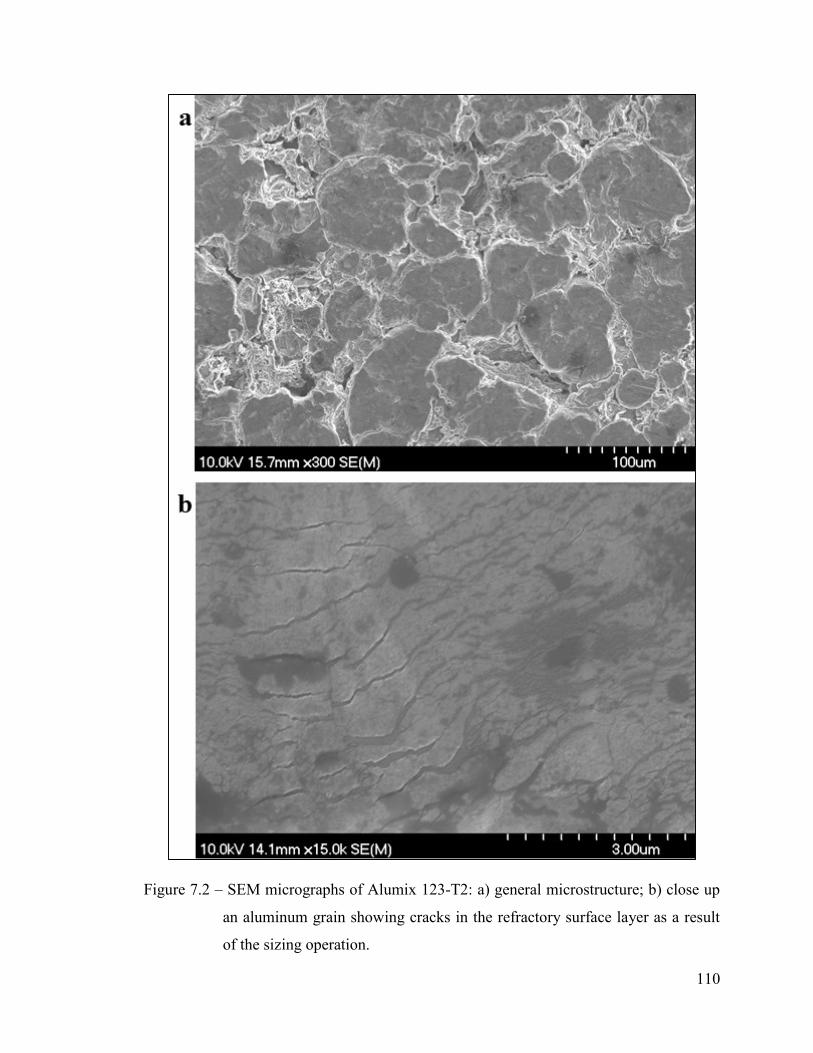
110
Figure 7.2 – SEM micrographs of Alumix 123-T2: a) general microstructure; b) close up
an aluminum grain showing cracks in the refractory surface layer as a result
of the sizing operation.

111
In AA2014-T6, two types of intermetallics were readily identifiable, as seen in
Figure 7.3. The intermetallic with a round, globular morphology was believed to be θ-
CuAl2 – its morphological and compositional characteristics were a close match to those
of θ-CuAl2, given by [11], and there were found to be peaks which corresponded to θ-
CuAl2 in the XRD trace of AA2014-T6. By EDS analyses, the composition of the round,
globular phase was found to be: Cu: 51.0±2.1; Al: 48.7±2.2; and Si: 0.3±0.1 wt%; again
consistent with the θ phase. The intermetallic with a Chinese script morphology was
believed to be α-AlFeMnSi ((CuFeMn)3Si2Al15) – its morphology and composition were
consistent with the descriptions of α-AlFeMnSi given by [11,203], and there were found
to be peaks which corresponded to α-AlFeMnSi in the XRD trace of AA2014-T6. By
EDS analyses, the composition of the Chinese script phase was found to be: Al: 61.2±3.9;
Fe: 14.4±1.6; Mn: 10.2±1.7; Cu: 7.5±0.7; Si: 6.4±0.5; and Cr: 0.3±0.1 wt%. In addition to
those phases previously discussed, it is conceivable that Q-phase (Cu2Mg8Si6Al5)
precipitates and Cu2Mn3Al20 or (CuMn)Al6 dispersoids may have been present in the
alloy [11,202]. However, neither phase was positively detected with the methods
employed. In some SEM micrographs there appeared to be a distribution of micron and
sub-micron areas of lighter contrast which could be some other type of precipitate,
however these may also be fine θ' or θ-CuAl2 precipitates which are expected to be
present along grain boundaries.

112
Figure 7.3 – SEM micrograph of AA2014-T6. The phase with the round, globular
morphology is believed to be θ-CuAl2 and the phase with the Chinese script
morphology is believed to be α-AlFeMnSi.
7.3.2 Electrochemistry
Typical plots during the attainment of the OCP of Alumix 123-(T1, T2) and
AA2014-T6 are presented in Figure 7.4. For the sake of comparison, the OCP of
AA2014-T6 in Figure 7.4 was monitored for 2 hours instead of the usual 1 hour. No
significant changes in electrode potential for Alumix 123-T2 and AA2014-T6 were
observed throughout the duration of the test, which means that dynamic equilibrium was
quickly established and maintained by these electrodes. The slight ennoblement of the
113
electrode potential of Alumix 123-T2 could be a result of the strain induced in the
microstructure by the sizing operation and the small, consistent fluctuations in the OCP
are probably related to surface roughness. Initially, the electrode potential of Alumix 123-
T1 was similar to Alumix 123-T2 and AA2014-T6, however after a short incubation
period the OCP began to shift to more negative values with the deviation eventually
becoming quite substantial. The most obvious difference between these materials was the
presence of a large amount of deep, interconnected porosity in Alumix 123-T1. It is
hypothesized that the transience in the OCP of Alumix 123-T1 was related to the
initiation and propagation of crevice corrosion in these areas.
Crevice corrosion, which has been studied extensively [210-214], initiates by a
differential aeration mechanism which differentiates the electrode into macro-cells where
creviced areas behave as anodes. In the case of Alumix 123-T1, the shift in electrode
potential to more negative values may be a reaction to the reduced cathodic area, or the
result of a breakdown of passivity in creviced areas caused by the migration of chloride
ions and hydrolyses of anodic reaction products. The return of the electrode potential to
slightly more noble values after the initial negative shift, Figure 7.4, could be related to a
change in the composition of the creviced electrolyte due to the onset of hydrogen
evolution or a gradual approach towards equilibrium dependent upon the ionic mobility
and diffusivity of corrosion products and reactants to and from creviced areas.

114
Figure 7.4 – Attainment of the open circuit potential (OCP) of Alumix 123-(T1, T2) and
AA2014-T6 as a function of time: (a) full transient; (b) close up of initial
transient.

115
To verify if the electrode potential of Alumix 123-T1 was controlled by the onset
of hydrogen evolution the cathodic polarization diagrams in Figure 7.5 were constructed.
All current densities presented were based off a nominal geometric area exposed to the
electrolyte which for the P/M materials, especially Alumix 123-T1, was a gross
underestimation. The cathodic process in the corrosion of Alumix 123-T1 at open circuit
appears to be under more activation-control and this, in conjunction with its highly-
negative OCP, suggests the corrosion of Alumix 123-T1 proceeded with a cathodic
process involving hydrogen evolution [102-108]. Eventually, at sufficiently negative
potentials, the current passed becomes substantial, and is usually attributed to the total
hydration of the oxide layer which renders it ionically conductive and allows hydrogen
evolution to take place directly on aluminum metal [110,125,127]. It is difficult to
compare this feature in Figure 7.5 as the true current densities are not available.
The cathodic polarization of Alumix 123-T2 and AA2014-T6 appears to be under
more diffusion-control near open circuit which is characteristic for a cathodic process
involving the reduction of oxygen [102-108]. The limiting diffusion current for Alumix
123-T2 is about an order of magnitude larger than that of AA2014-T6, which is thought
to be primarily due to the increased surface roughness and electrochemically active area
of Alumix 123-T2, although the P/M materials were believed to have a unique refractory
layer which may behave differently than the usual oxide layer present on aluminum.

116
Figure 7.5 – Cathodic polarization diagrams of Alumix 123-(T1, T2) and AA2014-T6
using a scan rate of 0.1667mVs–1.
It would appear that, based on the diffusion-limited nature of the cathodic process,
the corrosion of Alumix 123-T2 and AA2014-T6 at open circuit should be under more
cathodic control than Alumix 123-T1, and this was observed to be the case with the cyclic
polarization diagrams presented in Figure 7.6. It seems that at open circuit conditions,
Alumix 123-T2 and AA2014-T6 are polarized to their pitting potential and their corrosion
current is predominantly limited by the amount of charge which can be consumed in
cathodic reactions. On the other hand, the corrosion of Alumix 123-T1 at open circuit
appears to be at least partially under anodic control.
There were two distinct regions in the anodic polarization of Alumix 123-T1: one
where the current passed was essentially independent of the applied potential and one

117
where considerable active dissolution took place that was largely dependent on the
applied potential. The behaviour in the first region was characteristic of passivity while
the behaviour in the second region was characteristic of breakdown or pitting. The
situation here, however, was not so explicit because in the crevice corrosion model most
of the anodic current was generated in the creviced areas where passivity is questionable.
It should be pointed out that the active dissolution of aluminum metal is
thermodynamically possible at all potentials noble to its standard electrode potential, –
1.90VSCE [108], regardless of its relation to the pitting potential which represents the
stability of the oxide layer.
Figure 7.6 – Polarization diagrams of Alumix 123-(T1, T2) and AA2014-T6 using a scan
rate of 0.1667mVs–1. The reverse scans have been excluded from the figure
for clarity.
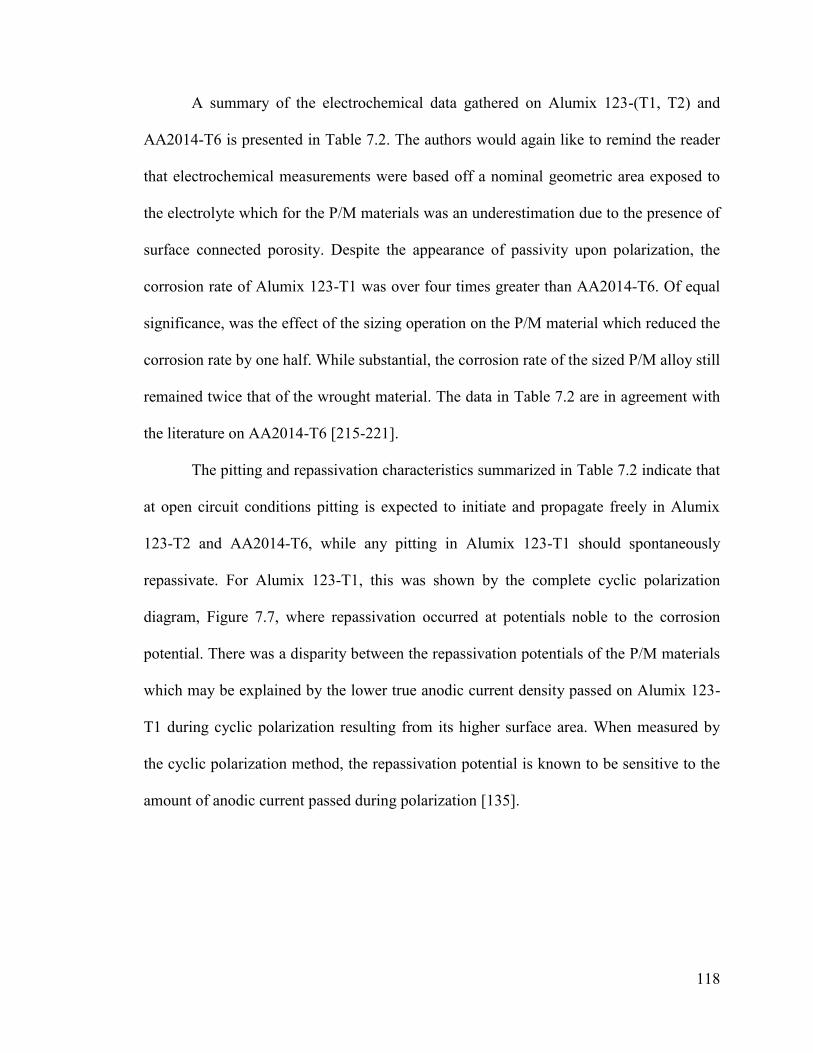
118
A summary of the electrochemical data gathered on Alumix 123-(T1, T2) and
AA2014-T6 is presented in Table 7.2. The authors would again like to remind the reader
that electrochemical measurements were based off a nominal geometric area exposed to
the electrolyte which for the P/M materials was an underestimation due to the presence of
surface connected porosity. Despite the appearance of passivity upon polarization, the
corrosion rate of Alumix 123-T1 was over four times greater than AA2014-T6. Of equal
significance, was the effect of the sizing operation on the P/M material which reduced the
corrosion rate by one half. While substantial, the corrosion rate of the sized P/M alloy still
remained twice that of the wrought material. The data in Table 7.2 are in agreement with
the literature on AA2014-T6 [215-221].
The pitting and repassivation characteristics summarized in Table 7.2 indicate that
at open circuit conditions pitting is expected to initiate and propagate freely in Alumix
123-T2 and AA2014-T6, while any pitting in Alumix 123-T1 should spontaneously
repassivate. For Alumix 123-T1, this was shown by the complete cyclic polarization
diagram, Figure 7.7, where repassivation occurred at potentials noble to the corrosion
potential. There was a disparity between the repassivation potentials of the P/M materials
which may be explained by the lower true anodic current density passed on Alumix 123-
T1 during cyclic polarization resulting from its higher surface area. When measured by
the cyclic polarization method, the repassivation potential is known to be sensitive to the
amount of anodic current passed during polarization [135].
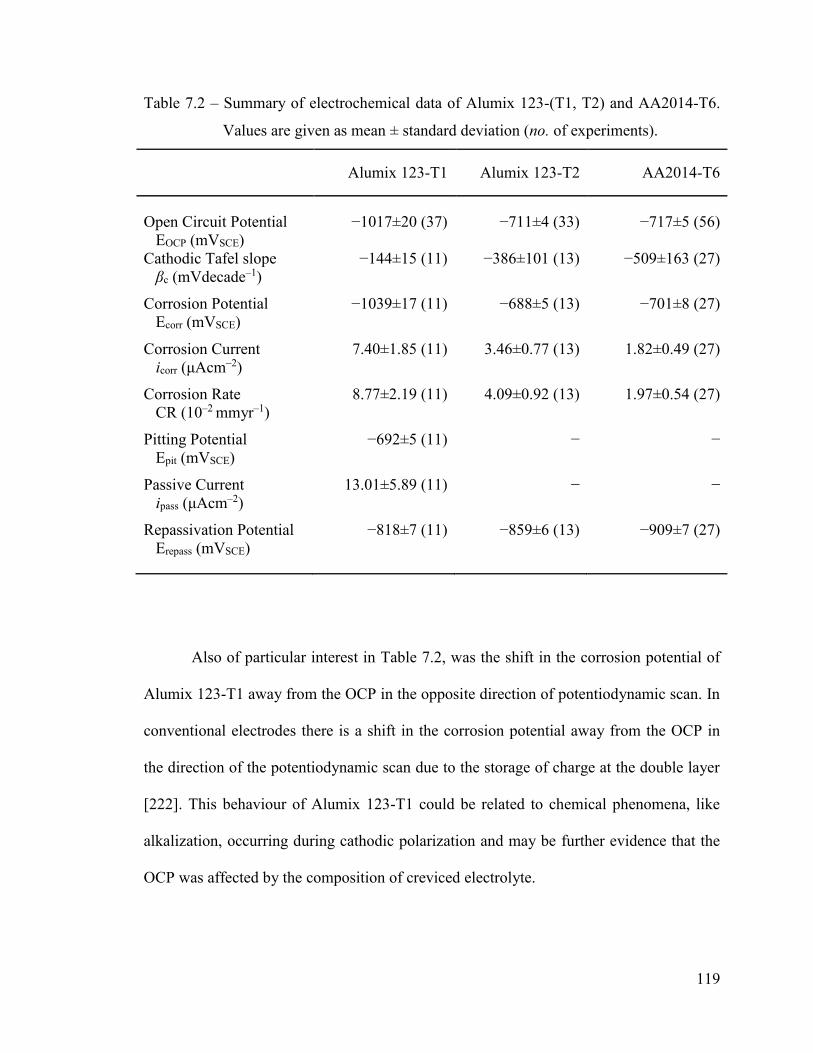
119
Table 7.2 – Summary of electrochemical data of Alumix 123-(T1, T2) and AA2014-T6.
Values are given as mean ± standard deviation (no. of experiments).
Alumix 123-T1 Alumix 123-T2 AA2014-T6
Open Circuit Potential
EOCP (mVSCE)
−1017±20 (37) −711±4 (33) −717±5 (56)
Cathodic Tafel slope
βc (mVdecade–1)
−144±15 (11) −386±101 (13) −509±163 (27)
Corrosion Potential
Ecorr (mVSCE)
−1039±17 (11) −688±5 (13) −701±8 (27)
Corrosion Current
icorr (μAcm–2)
7.40±1.85 (11) 3.46±0.77 (13) 1.82±0.49 (27)
Corrosion Rate
CR (10–2 mmyr–1)
8.77±2.19 (11) 4.09±0.92 (13) 1.97±0.54 (27)
Pitting Potential
Epit (mVSCE)
−692±5 (11) − −
Passive Current
ipass (μAcm–2)
13.01±5.89 (11) − −
Repassivation Potential
Erepass (mVSCE)
−818±7 (11) −859±6 (13) −909±7 (27)
Also of particular interest in Table 7.2, was the shift in the corrosion potential of
Alumix 123-T1 away from the OCP in the opposite direction of potentiodynamic scan. In
conventional electrodes there is a shift in the corrosion potential away from the OCP in
the direction of the potentiodynamic scan due to the storage of charge at the double layer
[222]. This behaviour of Alumix 123-T1 could be related to chemical phenomena, like
alkalization, occurring during cathodic polarization and may be further evidence that the
OCP was affected by the composition of creviced electrolyte.

120
Figure 7.7 – Cyclic polarization diagram of Alumix 123-T1 using a scan rate of
0.1667mVs–1.
7.3.3 Microstructure after Open Circuit Corrosion
The electrode face of Alumix 123-T1 after 2 hours exposure at open circuit
conditions is shown in Figure 7.8. In some areas, particularly around pores, there
appeared to be a fine, speckled distribution of corrosion product, Figure 7.8, which upon
viewing under high magnification was revealed to be fine nano-scale nodules. The main
constituent of such nodules is usually Bayerite (α-Al(OH)3) [113], but this should not be
assumed for Alumix 123-T1 because of the enrichment of the surface with magnesium. If
these nodules were directly involved in the corrosion process, their location around some
pores could be indicative of a macro-cell in the area since the half-cell reactions would be
expected to occur in close proximity to one another.

121
Figure 7.8 – SEM micrograph of Alumix 123-T1 after 2 hours at OCP.
Pitting was observed in Alumix 123-T1, Figure 7.9, but the pits did not seem to be
associated with any copper- or iron-rich intermetallics. This probably means the
refractory layer formed during sintering retained integrity over these intermetallics, unlike
in traditional aluminum alloys. It remains unclear if the film breakdown was more
stochastic in nature or was partial to local heterogeneities in the refractory layer, such as
magnesium aggregation or lubricant residues. Electrochemical measurements indicated
that any pitting in Alumix 123-T1 should spontaneously repassivate at open circuit
conditions. Therefore, any pitting observed must be either ‘cathodic pitting’ caused by
local alkalinity generated at cathodic sites or pitting which initiated in the short

122
incubation period before the deviation of the OCP to more negative values. Regardless of
the mechanism, the location of the pits probably signified weak or thin points in the
refractory layer where electrons or chloride ions preferentially migrated.
In the cross section of Alumix 123-T1, Figure 7.10, there appeared to be corrosion
product accumulated within some porosity which was found by EDS analyses to consist
primarily of aluminum and oxygen. If the oxidation of aluminum occurred within the
vicinity of the corrosion product deposit it would suggest the anodic process has been
occurring within certain areas of pores. However, there is also the possibility that
occluded electrolyte remained in some areas after washing and drying of the specimen.
Regardless, it is apparent the electrolyte was able to penetrate the compacts through
porosity.
In the corrosion morphology of Alumix 123-T2, Figure 7.11, blistering was quite
apparent and seemed to be associated with the areas around specific pores. Fine corrosion
product nodules were incorporated in to the surface of some blisters, Figure 7.12.
Blistering is normally a consequence of a pitting mechanism involving the penetration of
chloride through the oxide layer followed by the localized dissolution of aluminum and
hydrogen generation at the metal/oxide interface [142]. In the present case, there may also
be partial chloride penetration through cracks introduced in the refractory layer from the
sizing operation. Electrochemical measurements indicated that at open circuit conditions
Alumix 123-T2 was polarized to the pitting potential so instability of the refractory layer
is expected.

123
Figure 7.9 – SEM micrographs of pitting in Alumix 123-T1 after 2 hours at OCP: a)
cluster of pits which are not associated with copper-rich phases in the area; b)
high magnification micrograph showing interior structure of some pits
(indicated by arrows).

124
Figure 7.10 – SEM micrograph of the cross sectional microstructure of Alumix 123-T1
after 2 hours at OCP. The corrosion product indicated by the arrows was
found by EDS analyses to consist primarily of aluminum and oxygen.
Figure 7.11 – SEM micrograph of Alumix 123-T2 after 2 hours at OCP.

125
Figure 7.12 – SEM micrograph of blistering in Alumix 123-T2 after 2 hours at OCP.
The reason for the association of blistering with areas surrounding some residual
porosity was not immediately clear. The residual porosity may be a preferential site for
evolving gas bubbles to form which may have occluded the surrounding electrolyte and
intensified film breakdown in the area. This was supported by the observation that the
circumference of all blistered regions were quite circular, Figure 7.11. The presence of
sizing fluid in these areas was also expected which may somehow create favourable
conditions for the adsorption or penetration of chlorine.
In the corroded microstructure of AA2014-T6, Figure 7.13, pitting was observed
in the matrix, adjacent to intermetallic particles, and along grain boundaries. Virtually all

126
pits in the matrix and along grain boundaries appeared to be associated with small
intermetallic particles, Figure 7.14. It was not possible to identify these small
intermetallics by the methods employed here; however, the particles along grain
boundaries are believed to be θ' or θ-CuAl2 while the particles in the matrix are not so
discernible. The absence of an intermetallic particle in some pits, Figure 7.14, was
believed to be caused by attack which was so extensive that a once-present intermetallic
was dislodged from the matrix.
The attack around θ-CuAl2 was believed to be due to the anodic trenching
mechanism outlined by [149,152], where the pitting potential of the surrounding copper-
depleted matrix is exceeded at open circuit conditions leading to its active dissolution.
Evidently, the θ-CuAl2 intermetallic was subjected to selective dealloying of aluminum
[123,160,166,223], as it was confirmed by EDS analyses that the particles consisted of
about 25% Al, 64% Cu, and 11% O (in wt%) after 1 hour at open circuit. Some of the
aluminum detected by EDS was probably due to electron interaction with underlying
areas which were not subject to corrosion. The presence of either metallic copper or
cuprous oxide on the electrode surface could not be confirmed by XRD due to the small
concentration present. Since the OCP of AA2014-T6 was much more negative than the
oxidation potential of copper, it was likely that any cuprous oxide which may have been
detected by EDS was formed in the air before analyses. Electrochemical measurements
indicated that the stability of the OCP was maintained despite dealloying and enrichment
of the electrode surface with copper. At open circuit, AA2014-T6 was polarized to the
pitting potential so such enrichment cannot further ennoble the corrosion potential, but
probably increased the corrosion current, which was under cathodic control, due to the
high cathodic efficiency of copper and the large surface area of the dealloyed structure.

127
Figure 7.13 – SEM micrograph of AA2014-T6 after 1 hour at OCP.
Figure 7.14 – SEM micrograph of pits formed in the matrix of AA2014-T6 after 1 hour at
OCP.

128
The attack around α-AlFeMnSi was also believed to be due to a cathodic
trenching mechanism outlined by [149,152], where chemical dissolution of the
surrounding matrix is a consequence of the hydroxide ions generated by cathodic
reactions occurring on the intermetallic. The high iron-content of α-AlFeMnSi probably
enhanced its efficiency as a cathode and stability against local alkalization. The only
compositional change after corrosion was a selective dealloying of aluminum, which has
also been observed by [161]. In the present work the EDS analyses showed that the
aluminum content decreased to about 54wt% after 1 hour at open circuit from 61wt%
before corrosion. The sporadic nature of the trenching around α-AlFeMnSi, Figure 7.13,
may imply that its role as a cathode was affected by the presence of other intermetallics in
the vicinity.
7.4 CONCLUSIONS
After a short incubation period, the OCP of Alumix 123-T1 deviated and stabilized
to highly negative values (ca. –1.0VSCE). This was postulated to be due to a reaction
leading to a reduction in cathode area or depassivation induced by propagating crevice
corrosion within residual porosity. The sizing operation in Alumix 123-T2 effectively
reduced surface porosity through plastic deformation and sealed a portion of the residual
porosity with sizing fluid to an extent that crevice corrosion did not initiate in the
material.
At open circuit conditions the corrosion of Alumix 123-T1 was partially under
anodic control and proceeded with hydrogen evolution, while the corrosion of Alumix
123-T2 and AA2014-T6 were predominantly under cathodic control and proceeded with
oxygen reduction. The corrosion rate of Alumix 123-T1 was two times greater than

129
Alumix 123-T2 and four times greater than AA2014-T6. The disparity was partially due
to the high surface area of the P/M materials which could not be accounted for.
In the P/M materials pitting was not associated with copper- or iron-rich
intermetallics. This was attributed to the unique refractory layer formed as a result of the
sintering process. In AA2014-T6 pitting was associated with θ-CuAl2, α-AlFeMnSi
((CuFeMn)3Si2Al15), and other small unidentifiable intermetallic particles. The attack
involving θ-CuAl2 was attributed to the anodic trenching mechanism whereas the attack
involving α-AlFeMnSi was attributed to the cathodic trenching mechanism.
7.5 ACKNOWLEDGEMENTS
The authors gratefully acknowledge the National Sciences and Engineering
Research Council of Canada (NSERC) and AUTO21 Network of Centers of Excellence
for providing financial support during this work. The authors would also like to thank the
Minerals Engineering Centre (MEC) at Dalhousie University for chemical and particle
size analyses, the Institute for Research in Materials (IRM) at Dalhousie University for
use of the SEM/EDS system, ECKA Granules for supply of the P/M pre-mix, and GKN
Sinter Metals for sintering the P/M material.
130
CHAPTER 8 CORROSION BEHAVIOUR OF ALUMIX 123 P/M
ALLOY AND AA2014-T6. PART II:
POTENTIOSTATIC POLARIZATION
W.D. Judge1, D.P. Bishop1, and G.J. Kipouros2,*
1Materials Engineering, Process Engineering and Applied Science, Dalhousie University,
1360 Barrington Street, Room F201, Halifax, Nova Scotia, Canada, B3H 4R2
2Chemical Engineering, College of Engineering, University of Saskatchewan, 57 Campus
Drive, Saskatoon, Saskatchewan, Canada, S7N 5A9
(*Corresponding author: [email protected])
Status: To be submitted to Journal of the Electrochemical Society
The following experimental procedures, results, and discussions were completed by W.D.
Judge with reviewer and editorial roles played by D.P. Bishop and G.J. Kipouros.

131
ABSTRACT
The corrosion behaviour of the commercial aluminum powder metallurgy (P/M)
alloy ‘Alumix 123’ and a compositionally similar wrought alloy, AA2014-T6, has been
studied in naturally aerated 3.5wt% NaCl by potentiostatic polarization at a variety of
characteristic potentials and the subsequent corrosion morphology characterized by
scanning electron microscopy (SEM) and energy dispersive X-ray spectroscopy (EDS). In
the P/M materials, which were studied in the ‘as-sintered’ condition (T1 temper) or after a
standard sizing operation (T2 temper), cathodic hydrogen evolution and oxygen reduction
was associated with film breakdown in the matrix and on copper- and iron-rich
intermetallics. Below the pitting potential, the majority of anodic current passed on
Alumix 123-T1 was generated from creviced areas within residual porosity which
eventually repassivated when the concentration of anodic reaction products exceeded the
solubility limit. Above the pitting potential, the majority of attack in the P/M materials
was intergranular in nature. SEM observations of AA2014-T6 suggested that cathodic
deposition of copper occurs on copper- and iron-rich intermetallics and that cathodic
trenching around iron-rich intermetallics may have liberated copper from the matrix in a
non-Faradaic process. Above the pitting potential, extensive attack of AA2014-T6
occurred via crystallographic pitting and intergranular corrosion.
Keywords: aluminum alloy; corrosion; electrochemistry; powder metallurgy; crevice
corrosion; intermetallics; Alumix 123; AA2014

132
8.1 INTRODUCTION
The ‘press-and-sinter’ aluminum powder metallurgy (P/M) alloys were first
commercialized in the 1960s by Alcoa [15] and have since remained in large scale
production for a variety of applications, the most prominent being in the automotive
industry, consumer durables, and business machinery [1]. Despite the proven commercial
successes, there remains hesitation to specify P/M aluminum in new designs and most
P/M aluminum is used in non-critical applications which require only low-grade
properties [1]. This is in part due to the limited information on the performance of P/M
aluminum alloys in some environments involving, for example, conditions of dynamic
stress, high temperature, or corrosive media [1]. Recently, our laboratory has undertaken
extensive investigations on the corrosion behaviour of commercial P/M aluminum alloys
which provide thermodynamic and kinetic data that can be used to predict material
performance [4,224].
We have previously investigated the corrosion behaviour of the commercial P/M
aluminum alloy ‘Alumix 123’ and a compositionally similar wrought alloy, AA2014-T6,
by open circuit potential (OCP), cathodic polarization, and cyclic potentiodynamic
polarization experiments in naturally aerated 3.5wt% NaCl [224]. The P/M alloy was
studied in either the ‘as-sintered’ condition or after a standard sizing operation, which are
generally denoted by the T1 and T2 temper, respectively. Sizing is a cold forming process
used industrially to improve dimensional tolerances after sintering. The OCP of Alumix
123-T1 was initially found to be transient but eventually stabilized at more negative
values which was attributed to the initiation and propagation of crevice corrosion within
residual porosity. The sizing operation effectively reduced and sealed a fraction of surface
porosity such that crevice corrosion did not initiate in Alumix 123-T2. Cathodic and

133
cyclic potentiodynamic polarization then showed the OCP of Alumix 123-T1 was
stabilized at potentials near the onset of hydrogen evolution where corrosion was partially
under anodic control and proceeded via cathodic hydrogen evolution, while the OCP of
Alumix 123-T2 and AA2014-T6 was stabilized at the pitting potential where corrosion
was predominantly under cathodic control and proceeded via cathodic oxygen reduction.
Through these observations, in conjunction with microstructural analyses, the
electrochemical characteristics of some microstructural features, particularly residual
porosity, and their role in the corrosion process was hypothesized.
In the present work, we continue our investigations on the corrosion behaviour of
Alumix 123-(T1, T2) and AA2014-T6 by potentiostatic polarization in naturally aerated
3.5wt% NaCl and characterize the subsequent corrosion morphology. The characteristic
potentials were generated from previous OCP and potentiodynamic plots. The
microstructural analyses aim to further investigate the electrochemistry of some
microstructural features and their role in the overall corrosion process.
8.2 EXPERIMENTAL
8.2.1 Materials and Materials Preparation
Alumix 123 pre-mix was obtained from ECKA Granules Germany GmbH (Fürth,
Bavaria, Germany); its chemical and particle size analyses, and detailed P/M processing,
processing response, and preparation are presented elsewhere [224]. Green compacts
15mm in diameter were made by uniaxially compacting 2.5g of pre-mix at 300MPa,
yielding a green density of 2.623±0.004gcm–3 (94.5±0.2% theoretical), and were sintered
amongst industrial production at GKN Sinter Metals (Conover, North Carolina, U.S.A.)
yielding a sintered density of 2.561±0.008gcm–3 (92.2±0.3% theoretical). After sintering,

134
a portion of the compacts were sized at 310MPa, which corresponded to a 5% reduction
in height, using sizing fluid provided by GKN Sinter Metals. The P/M material was tested
in the ‘as-sintered’ or ‘as-sized’ conditions which are denoted by the T1 and T2 temper,
respectively.
AA2014-T6 extruded rod was obtained from Kaiser Aluminum (Jackson,
Tennessee, U.S.A.); its chemical analysis and detailed preparation were presented
elsewhere [224]. Specimens were extracted so that during electrochemical testing the
transverse plane was in contact with the electrolyte. Immediately prior to testing,
AA2014-T6 specimens were abraded on wet SiC paper, polished with oil-based diamond
suspensions (to 1μm), degreased ultrasonically in acetone, thoroughly rinsed with
deionized water, and dried using a hand drier.
8.2.2 Electrochemical Testing
All electrochemical tests were conducted at ambient temperature in naturally
aerated 3.5wt% NaCl electrolyte which was prepared immediately prior to testing using
analytical-grade NaCl (>99.0% assay) and ultrapure ‘Type 1’ deionized water
(>18MΩ∙cm). The electrochemical instrumentation, whose detailed description is given
elsewhere [224], consisted of a standard three electrode bulb cell connected to a Princeton
Applied Research (PAR) Model 273A EG&G Potentiostat/Galvanostat. The
electrochemical cell contained a working electrode which exposed a nominal area of 1cm2
of the test specimen, two high-purity fully dense graphite counter electrodes, and a
saturated calomel reference electrode (SCE) brought in close proximity to the working
electrode via a Luggin capillary.
135
Prior to potentiostatic polarization, the OCP of the working electrode was
monitored versus time for a period of 2 hours for Alumix 123-(T1, T2) and 1 hour for
AA2014-T6. During potentiostatic polarization, the potential of the working electrode
was held constant at either –1.50VSCE, –1.10VSCE, –0.75VSCE, –0.70VSCE, or –0.50VSCE
and current transients were recorded at a rate of one point per second. Potentiostatic
polarization at –1.10VSCE, –0.75VSCE, and –0.70VSCE was maintained for 6 hours, while
polarization at –1.50VSCE and –0.50VSCE was maintained for 3 hours. The corrosion
convention for current polarity was used where net cathodic current was indicated by
negative current and net anodic current was indicated by positive current. Immediately
after testing, specimens were thoroughly washed with deionized water and dried using a
hand drier.
8.2.3 Materials Characterization
Micrographs were captured using a Hitachi Model S-4700 cold field emission
scanning electron microscope (SEM) containing an integrated unit for energy dispersive
X-ray spectroscopy (EDS). The SEM was operated with a 10kV accelerating voltage for
imaging and a 20kV accelerating voltage for EDS analyses. Prior to analyses, Alumix
123-T2 specimens were treated in a Soxhlet apparatus for 8 hours with petroleum ether to
remove all traces of sizing fluid. To analyse cross sections, some specimens were
mounted by vacuum impregnation with a self-curing epoxy resin, sectioned, polished, and
carbon coated using a high vacuum evaporator platform.

136
8.3 RESULTS AND DISCUSSION
8.3.1 Electrochemistry
Current transients during the potentiostatic polarization of the three electrodes,
Alumix 123-(T1, T2) and AA2014-T6, at –1.50VSCE are presented in Figure 8.1. The
relatively large current densities observed may be expected from the cathodic polarization
diagrams that showed the efficiency of hydrogen evolution was increased in this domain
[224], which was related to the hydration of the oxide layer and resembled the passive-
active transition encountered near the passivation potential of a metal [110,125,127].
Figure 8.1 – Current transients during potentiostatic polarization at –1.50VSCE.
In solution, the passive layer on aluminum has a duplex structure consisting of a
porous partially hydrated outer layer comprised of aluminum hydroxides and an inner

137
barrier layer comprised of mostly amorphous alumina [113], which upon polarization to
sufficiently negative potentials becomes totally hydrated and ionically conductive,
allowing hydrogen evolution to take place directly on aluminum metal [125,127].
Complete hydration did not occur immediately however, as shortly after polarization the
current passed on all three electrodes went through a minimum, Figure 8.1, which was
caused by the generation of an anodic current related to barrier film formation prior to
film hydration [119,124]. Eventually, the current passed on all three electrodes increased
as the hydrated portion of the duplex film penetrated towards the metal and a stable oxide
layer could no longer be maintained [125,127]. Under these conditions, intense
alkalization led to the chemical dissolution of aluminum [125,127] which may be
responsible for gradual changes in current after film hydration, as the surface area was
increased from the alkaline etching or the film composition and conductivity was changed
as alloying elements which do not oxidize were accumulated within the film.
When comparing the three electrodes, the current passed on AA2014-T6 appeared
to increase faster and was maintained at a higher magnitude than the P/M materials which
suggested that the total hydration of the passive film on AA2014-T6 occurs at a more
noble potential than the P/M materials. These observations could be related to the surface
state and composition of the P/M materials which, as a result of the sintering process,
were found to possess a thicker refractory layer enriched with magnesium [224]. The
concentration of magnesium on the surface of the P/M materials was believed to be in the
oxidized state, and its presence could have affected the formation, growth, and ionic
conductivity of the hydrated layer due to the stability of magnesium in alkaline
conditions.

138
The refractory layer on the P/M materials may also be expected to exhibit lower
electronic conductivity due to its increased thickness compared to the wrought material.
This was somewhat alluded to by observations of the corrosion morphology at open
circuit conditions [224] where localized attack in the P/M materials was not associated
with copper- or iron-rich intermetallics which suggested the thick refractory layer
retained integrity over these intermetallics which are not readily accessible for cathodic
processes. Some characteristics of the refractory layer were revealed by the current
transients at –1.10VSCE, Figure 8.2, which corresponded to the potential domain where a
stable oxide film was maintained and cathodic hydrogen evolution was the predominant
cathodic process [102-108].
Figure 8.2 – Current transients during potentiostatic polarization at –1.10VSCE.

139
The current passed on all three electrodes during potentiostatic polarization at –
1.10VSCE was comparable in magnitude, despite the significantly larger surface area of
the P/M materials, particularly Alumix 123-T1. It is hypothesized that on a true per
surface area basis AA2014-T6 can support more cathodic hydrogen evolution than the
P/M materials, and that this was due to the greater accessibility of copper- and iron-rich
intermetallics in AA2014-T6 to support such processes.
The net current passed on Alumix 123-T1 during potentiostatic polarization at –
1.10VSCE increased gradually with time which suggested that the cathodic component of
the net current was increasing with time or the anodic component of the net current was
decreasing with time. The former would imply the surface area available for cathodic
hydrogen evolution or the efficiency of cathodic hydrogen evolution was increasing with
time and could mean the refractory layer was gradually succumbing to breakdown in
some areas. The possibility that the anodic current was decreasing may be equally
significant due to the close relation of –1.10VSCE to the OCP of Alumix 123-T1 [224],
and in fact it can be seen in the current transients at –0.75VSCE, Figure 8.3, that the anodic
current of Alumix 123-T1 displayed a decaying transient which could be responsible for
the behaviour in Figure 8.2.
The current transient for Alumix 123-T1 in Figure 8.3 corresponded to a region in
the potentiodynamic polarization diagram where the current passed on Alumix 123-T1
was largely independent of applied potential [224] – this behaviour was characteristic of
an electrode in the passive state and the current transient in Figure 8.3 would then be
associated with the growth of a passive film. However, the growth of a passive film was
not assumed for Alumix 123-T1 because of the presence of residual porosity which may
be a site for propagating crevice corrosion, generating most of the anodic current. In the

140
case of crevice corrosion, the decaying transient in Figure 8.3 could be related to the
repassivation of some creviced areas as the solubility product of the hydroxide in some
areas was exceeded from the accumulation of anodic reaction products.
Figure 8.3 – Current transients during potentiostatic polarization at –0.75VSCE.
The current transients for Alumix 123-T2 and AA2014-T6 at –0.75VSCE, Figure
8.3, corresponded to a potential region which was marginally more negative than the OCP
and cathodic oxygen reduction was the predominant cathodic process [102-108]. Both
Alumix 123-T2 and AA2014-T6 displayed fairly steady current densities which were of
comparable magnitude. In potentiodynamic polarization diagrams [224] the limiting
diffusion current for oxygen reduction on Alumix 123-T2 was significantly larger than
AA2014-T6, however in potentiostatic current transients the two current densities became

141
comparable soon after polarization, Figure 8.3. This behaviour was particularly
interesting for Alumix 123-T2 considering the OCP stabilized at the pitting potential
where the corrosion was under cathodic control [224] and a reduction in cathodic current
would correspond to a reduction in the corrosion rate.
Above the pitting potential considerable active dissolution of Alumix 123-(T1,
T2) and AA2014-T6 is possible, as shown by the current transients for –0.70VSCE, Figure
8.4. Initially, the current passed on Alumix 123-T1 went through a pronounced minimum
which can be interpreted as the growth of a barrier film prior to the adsorption of chlorine
on the oxide layer [111,147]. On all three electrodes, there was an incubation period
before the current became substantial. This rise in current could be related to the
adsorption of chloride on the oxide surface which affects the electric field in the double
layer in a manner that accelerates the transport of aluminum ions into solution [111,142].
The current passed on the P/M materials during potentiostatic polarization at –
0.70VSCE increased rapidly to pronounced maxima which were only maintained
momentarily before the current then decreased to a point where it then remained largely
static for the duration of the polarization, Figure 8.4. The observation of the current peak
in Alumix 123-T2, whose sizing operation reduced total surface porosity through plastic
deformation and sealed residual porosity with sizing fluid, indicated that residual porosity
did not play a major role in determining the current transients of the P/M materials in
Figure 8.4. It is possible that the current peak for the P/M materials was related to the
unique refractory layer formed as a result of the sintering process that was found to be
enriched with magnesium [224]. The refractory layer on the P/M materials appeared to
lose stability rapidly which would indicate that these materials were more affected by the
adsorption of chlorine than the wrought material.

142
Figure 8.4 – Current transients during potentiostatic polarization at –0.70VSCE.
The current passed on AA2014-T6 during potentiostatic polarization at –0.70VSCE
gradually increased to a maximum where it remained constant for the duration of
polarization, Figure 8.4. The gradual increase in current was due to an increase in the total
number of pits or the growth of existing pits, and a limiting current density per pit may
result from ohmic control at the pit entrance or mass transfer control within them
[111,141]. The attainment of a steady state maximum current density indicated that the
current density at individual pits was decreasing and/or that some pits were eventually
repassivating [111].
The current transients for polarization at –0.50VSCE, Figure 8.5, corresponded to a
potential region where breakdown occured rapidly and the steady state dissolution of
aluminum was limited by convective diffusion. At this potential, vigorous gas evolution

143
and grain fallout was apparent on all three electrode materials. The evolving gas was
probably hydrogen produced from the reaction of subvalent aluminum ions with water at
the oxide/solution interface, usually referred to as the ‘negative difference effect’ (NDE)
[108,111]. The NDE occurs at smaller anodic overpotentials, but is more apparent at –
0.50VSCE because the flux of subvalent aluminum ions to the oxide/solution interface is
increased in proportion to anodic polarization. This hydrogen evolution during anodic
polarization prevents the formation of a salt film on aluminum even at high rates of
dissolution [130].
Figure 8.5 – Current transients during potentiostatic polarization at –0.50VSCE.

144
8.3.2 Microstructure after Potentiostatic Polarization
8.3.2.1 Alumix 123-(T1, T2)
Prior examinations of the microstructure of Alumix 123-(T1, T2) showed a unique
refractory layer is formed on the surface of the compacts as a result of the sintering
process, which by EDS analyses was found to consist of oxygen (ca. 8wt%), carbon (ca.
6wt%), and magnesium (ca. 2wt%) [224]. Lubricant residues which redeposited during
the sintering process were identified by SEM and EDS analyses in discrete areas on the
surface of Alumix 123-(T1, T2) [224]. SEM, EDS, and XRD analyses identified two
major intermetallic phases in Alumix 123-(T1, T2) [224] which were distributed
predominantly along grain boundaries: one an aluminum-based intermetallic rich in
copper (ca. 40wt%) and containing minor amounts of magnesium (ca. 2wt%) and silicon
(ca. 1wt%); and the other an aluminum-based intermetallic rich in iron (ca. 30wt%) but
also containing copper (ca. 14wt%) and silicon (ca. 7wt%). After 2 hours corrosion at
open circuit conditions, microstructural analyses of Alumix-(T1, T2) showed that
localized corrosion did not initiate at copper- or iron-rich intermetallics which was
attributed to the high integrity of the refractory layer over these intermetallics [224].
During potentiostatic polarization at –1.50VSCE the refractory layer on Alumix
123-(T1, T2) could not be maintained and the intense alkalization etched the electrode
face. SEM and EDS analyses showed some copper- and iron-rich remnants of
intermetallics remained embedded in the surface film after polarization at –1.50VSCE,
which demonstrated the stability of these intermetallics in highly alkaline conditions. The
surface film was found by EDS analyses to be enriched with copper, magnesium, and
silicon, which suggested that the copper- and iron-rich phases are subject to dealloying of
magnesium and silicon in alkaline conditions. Copper originating from the matrix was
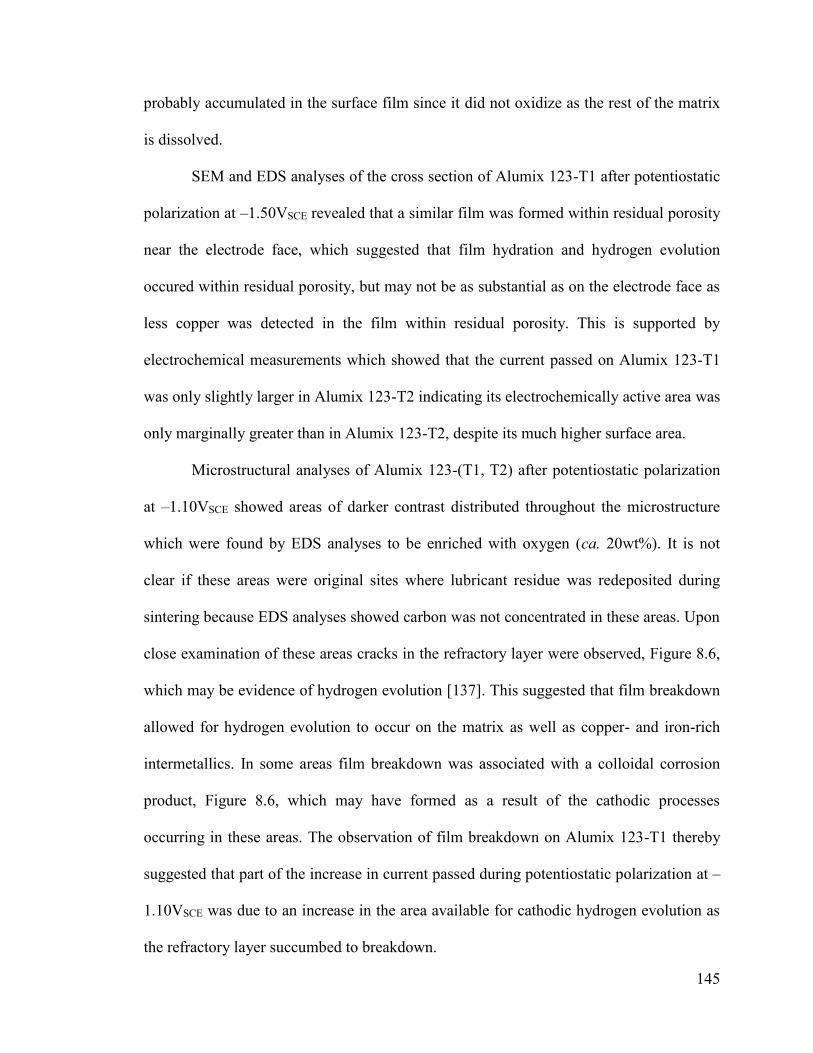
145
probably accumulated in the surface film since it did not oxidize as the rest of the matrix
is dissolved.
SEM and EDS analyses of the cross section of Alumix 123-T1 after potentiostatic
polarization at –1.50VSCE revealed that a similar film was formed within residual porosity
near the electrode face, which suggested that film hydration and hydrogen evolution
occured within residual porosity, but may not be as substantial as on the electrode face as
less copper was detected in the film within residual porosity. This is supported by
electrochemical measurements which showed that the current passed on Alumix 123-T1
was only slightly larger in Alumix 123-T2 indicating its electrochemically active area was
only marginally greater than in Alumix 123-T2, despite its much higher surface area.
Microstructural analyses of Alumix 123-(T1, T2) after potentiostatic polarization
at –1.10VSCE showed areas of darker contrast distributed throughout the microstructure
which were found by EDS analyses to be enriched with oxygen (ca. 20wt%). It is not
clear if these areas were original sites where lubricant residue was redeposited during
sintering because EDS analyses showed carbon was not concentrated in these areas. Upon
close examination of these areas cracks in the refractory layer were observed, Figure 8.6,
which may be evidence of hydrogen evolution [137]. This suggested that film breakdown
allowed for hydrogen evolution to occur on the matrix as well as copper- and iron-rich
intermetallics. In some areas film breakdown was associated with a colloidal corrosion
product, Figure 8.6, which may have formed as a result of the cathodic processes
occurring in these areas. The observation of film breakdown on Alumix 123-T1 thereby
suggested that part of the increase in current passed during potentiostatic polarization at –
1.10VSCE was due to an increase in the area available for cathodic hydrogen evolution as
the refractory layer succumbed to breakdown.
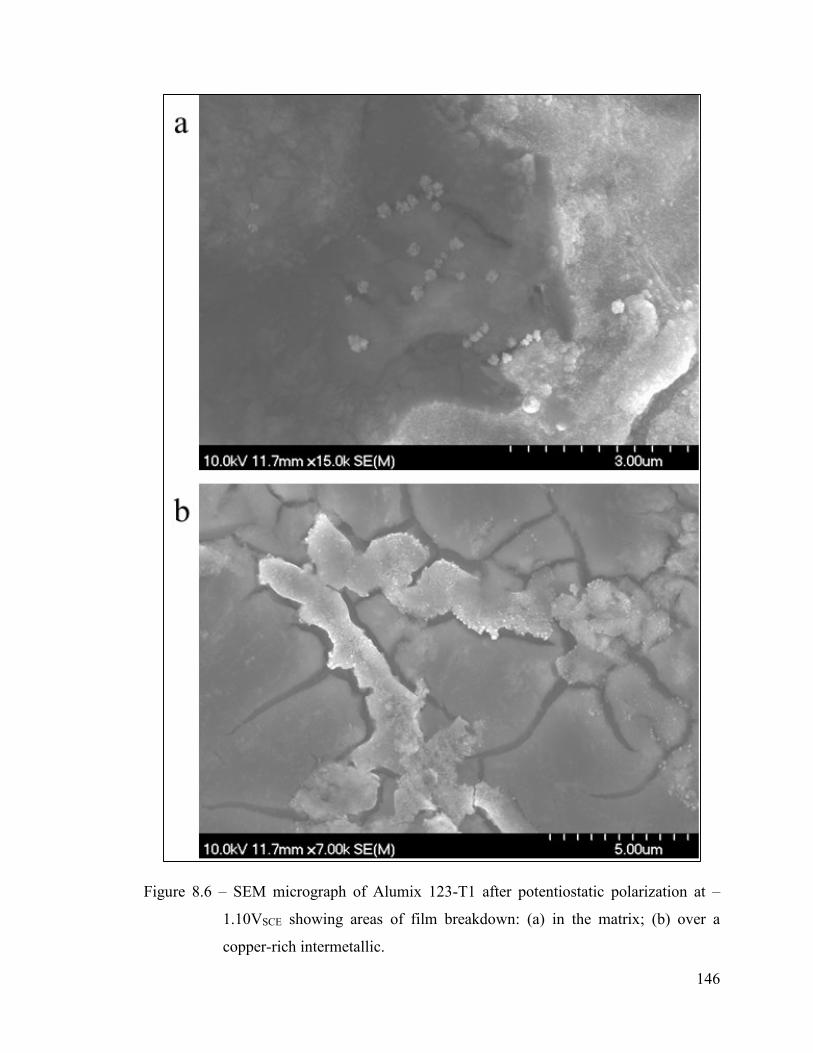
146
Figure 8.6 – SEM micrograph of Alumix 123-T1 after potentiostatic polarization at –
1.10VSCE showing areas of film breakdown: (a) in the matrix; (b) over a
copper-rich intermetallic.

147
Microstructural analyses of Alumix 123-T2 after potentiostatic polarization at –
0.75VSCE, Figure 8.7, has shown film breakdown also occurs in the domain of cathodic
oxygen reduction. The hemispherical pit shape, Figure 8.7, is characteristic of cathodic
pitting [124] and suggested that oxygen reduction was capable of occurring on the matrix.
Figure 8.7 – SEM micrograph of Alumix 123-T2 after potentiostatic polarization at –
0.75VSCE showing two hemispherical cathodic pits.

148
Potentiostatic polarization of Alumix 123-T1 at –0.75VSCE yielded a net anodic
current which is hypothesized to be generated from creviced areas within residual
porosity. The structure of residual porosity in Alumix 123-T1 after potentiostatic
polarization at –0.75VSCE is shown in Figure 8.8 and Figure 8.9. There was a large
nodular corrosion product around some porosity, Figure 8.8. This feature appeared as
though it originated from within the porosity, and in some instances it had evolved to a
point that reduced the area of the pore entrance. The cross section of Alumix 123-T1,
Figure 8.9, shows that there were significant amounts of corrosion product accumulated
within some porosity. These observations are consistent with the crevice corrosion model
where the anodic current at open circuit conditions is primarily generated from creviced
areas within residual porosity. Electrochemical measurements indicated that as the anodic
reaction proceeded the current generated gradually decayed which could be the result of
some creviced areas repassivating as the solubility product of aluminum hydroxide was
exceeded leading to precipitation within creviced areas, Figure 8.9, and flocculation in
areas immediately surrounding them, Figure 8.8.
The intermetallics on the electrode face of Alumix 123-T1 may have also played a
role in the corrosion process at –0.75VSCE, as shown in Figure 8.10. In some areas there
was an acicular corrosion product, Figure 8.10. EDS analyses suggested it was formed
preferentially over copper-rich intermetallics. EDS analyses of the areas of lighter
contrast in Figure 8.10 yielded an approximate composition of 5wt% Cu, 2wt% Si, and
1wt% Mg, which was a similar level of copper detected in the matrix. It is not
immediately clear if these were intermetallics that existed prior to corrosion but could not
be detected previously or were a direct consequence of corrosion.

149
Figure 8.8 – SEM micrograph of Alumix 123-T1 after potentiostatic polarization at –
0.75VSCE showing the deposition of corrosion product near residual porosity.
Figure 8.9 – SEM micrograph of the cross section of Alumix 123-T1 after potentiostatic
polarization at –0.75VSCE showing corrosion product accumulated in residual
porosity.

150
Figure 8.10 – SEM micrograph of Alumix 123-T1 after potentiostatic polarization at –
0.75VSCE showing an acicular corrosion product in some areas.
Above the pitting potential, the oxide layer loses stability and active dissolution of
Alumix 123-(T1, T2) was expected. This was evident by the significant amount of
nodular corrosion product generated on the electrode face of Alumix 123-T1 after
polarization at –0.70VSCE, Figure 8.11. The morphology of the nodular corrosion product
and its composition by EDS analyses were consistent with Bayerite [113]. Although –
0.70VSCE is noble to the pitting potential of Alumix 123-(T1, T2) [224], there was no
obvious pitting in matrix grains and the distribution of corrosion product on the electrode
face was more characteristic of uniform corrosion. However, in the cross section of
Alumix 123-(T1, T2) intergranular corrosion was very prevalent, Figure 8.12, in some
areas having penetrated over 200µm inward from the electrode face. Since most
intermetallics were located along grain boundaries, they probably contributed to the
extensive amount of intergranular corrosion observed. The current peak during
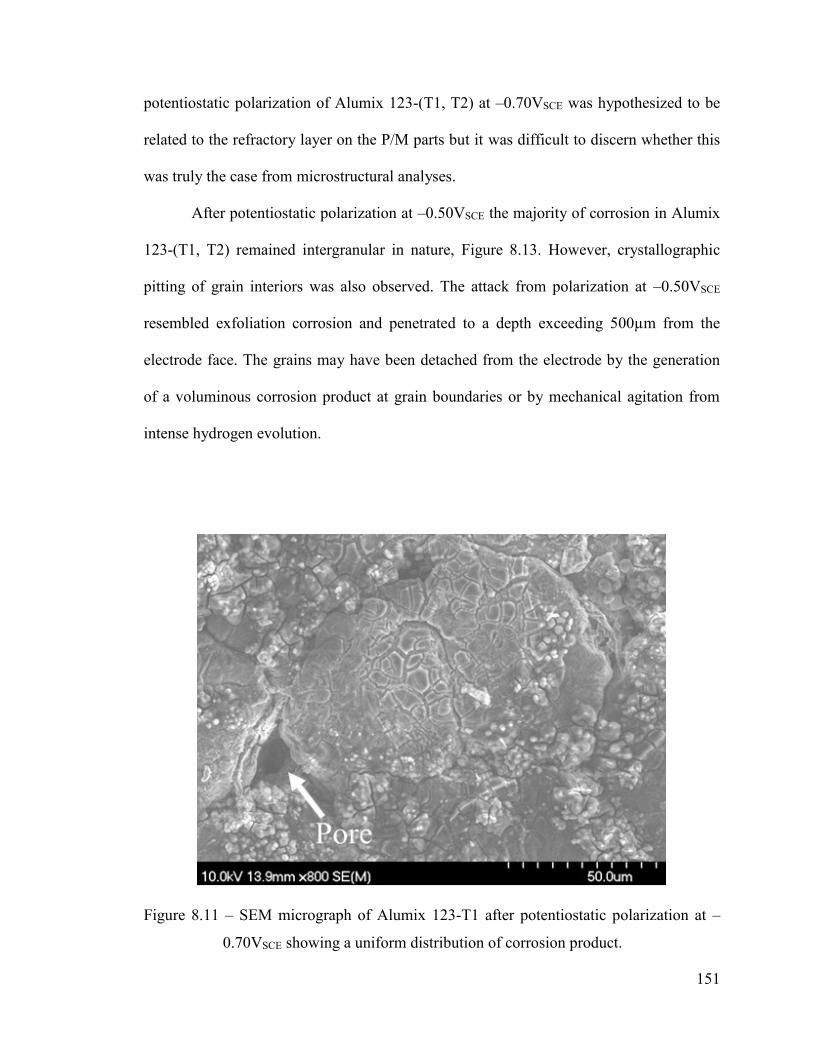
151
potentiostatic polarization of Alumix 123-(T1, T2) at –0.70VSCE was hypothesized to be
related to the refractory layer on the P/M parts but it was difficult to discern whether this
was truly the case from microstructural analyses.
After potentiostatic polarization at –0.50VSCE the majority of corrosion in Alumix
123-(T1, T2) remained intergranular in nature, Figure 8.13. However, crystallographic
pitting of grain interiors was also observed. The attack from polarization at –0.50VSCE
resembled exfoliation corrosion and penetrated to a depth exceeding 500µm from the
electrode face. The grains may have been detached from the electrode by the generation
of a voluminous corrosion product at grain boundaries or by mechanical agitation from
intense hydrogen evolution.
Figure 8.11 – SEM micrograph of Alumix 123-T1 after potentiostatic polarization at –
0.70VSCE showing a uniform distribution of corrosion product.

152
Figure 8.12 – SEM micrograph of the cross section of Alumix 123-T1 after potentiostatic
polarization at –0.70VSCE showing intergranular corrosion (indicated by
arrows).
Figure 8.13 – SEM micrograph of the cross section of Alumix 123-T1 after potentiostatic
polarization at –0.50VSCE showing sporadic crystallographic pitting
(indicated by arrows) and extensive intergranular corrosion.

153
8.3.2.2 AA2014-T6
In a companion manuscript [224], θ-CuAl2 and α-AlFeMnSi ((CuFeMn)3Si2Al15)
intermetallics were identified in the microstructure of AA2014-T6 by SEM, EDS, and
XRD analyses. Smaller intermetallic particles which were distributed throughout the
matrix could not be identified but were hypothesized to be Q-phase (Cu2Mg8Si6Al5)
precipitates or small θ' and θ-CuAl2 precipitates along grain boundaries. Part of the role of
intermetallics in the corrosion of AA2014-T6 was revealed by SEM and EDS
observations of the localized corrosion associated with these intermetallics at open circuit
conditions [224]. Both θ-CuAl2 and α-AlFeMnSi were believed to have behaved as high
efficiency cathodes in the corrosion of AA2014-T6 [224].
SEM and EDS analyses of AA2014-T6 after potentiostatic polarization at –
1.50VSCE are consistent with these hypotheses. A significant amount of the electrode face
was etched away by the intense alkalization at –1.50VSCE. However, a copper-rich
dealloyed structure of θ-CuAl2 and an iron-rich dealloyed structure of α-AlFeMnSi
remained embedded in the surface film, thereby demonstrating the stability of these
intermetallics under intense alkalization. The cross section of the electrode showed the
surface film to be approximately 25µm thick and EDS analyses showed enrichment with
copper, manganese, magnesium, silicon, and zinc as compared to the underlying matrix.
It appeared that under these highly alkaline conditions manganese and silicon were
dealloyed from α-AlFeMnSi while iron was not, undoubtedly due to the stability of iron
in alkaline conditions. The concentration of copper, magnesium, and zinc in the film
probably originated from the matrix as it was etched away from the intense alkalization.
154
The efficiency of the intermetallics for hydrogen evolution, under conditions
where the oxide layer remained stable, can be construed from the microstructural
observations after potentiostatic polarization at –1.10VSCE, Figure 8.14. The matrix in the
immediate vicinity of most intermetallic particles appeared to have been removed, Figure
8.14, yet this was expected to have occurred during the 1 hour stabilization at open circuit
conditions prior to potentiostatic polarization [224]. There was cracking in the matrix
surrounding some intermetallic particles, Figure 8.14, that can be considered to be
evidence of hydrogen evolution [137]. Most cracking was observed surrounding θ-CuAl2,
which may indicate that the majority of cathodic current for hydrogen evolution was
supported by θ-CuAl2.
Figure 8.14 – SEM micrograph of AA2014-T6 after potentiostatic polarization at –
1.10VSCE showing cracking in the matrix surrounding θ-CuAl2, possibly a
result of hydrogen evolution.

155
In addition, there appeared to be a fine nano-scale deposit on θ-CuAl2 and α-
AlFeMnSi after potentiostatic polarization at –1.10VSCE, Figure 8.15, that preferentially
nucleated along polishing lines. The scale of the deposit was too small to be accurately
analysed by EDS, however, copper- and iron-rich intermetallics are known to be cathodic
sites for the redeposition of copper ions which have been liberated during corrosion
[155,160,163,177]. The mechanism of copper redistribution during corrosion of the 2xxx
series aluminum alloys has been studied extensively [123,159,166], yet the role of θ-
CuAl2 in the liberation of copper remains controversial. In Ref. [166] a mechanism was
proposed for the redistribution of copper from S-phase (CuMgAl2) and θ-CuAl2, where
the intermetallics were selectively dealloyed of active elements leaving copper-rich
remains which coarsened to a crystalline nanoporous structure and were subject to the
non-Faradaic liberation of copper clusters by mechanical means (e.g. convection of the
electrolyte, hydrogen evolution). Once the copper clusters were electrically isolated from
the electrode, they attained their own OCP and were able to oxidize [166]. However, it is
unclear whether this mechanism is significant in alloys which do not contain the S-phase
intermetallic [123], such as AA2014. In the work of Ref. [123], during in situ atomic
emission spectroelectrochemistry (AESEC) analysis of corroding AA2214, copper
clusters were not detected in the electrolyte. Another potential source of copper may be
the small intermetallics distributed throughout the matrix and along grain boundaries, as
the attack around these intermetallics was frequently so extensive that the particle became
dislodged or electrically isolated from the matrix, which allowed for the oxidation of
copper.

156
Figure 8.15 – SEM micrographs of AA2014-T6 after potentiostatic polarization at –
1.10VSCE showing: (a) θ-CuAl2 and (b) α-AlFeMnSi. The fine, nodular
deposit on the intermetallics is postulated to be rich in copper.

157
The α-AlFeMnSi intermetallic may have also played a role in the redistribution of
copper during the corrosion of AA2014-T6, as suggested by microstructural analyses
after potentiostatic polarization at –0.75VSCE, Figure 8.16. Around the periphery of α-
AlFeMnSi there appeared areas of lighter contrast which were too small for accurate
analyses by EDS but were postulated to be rich in copper given their bright atomic
contrast. If these deposits were rich in copper, their location around the periphery of α-
AlFeMnSi suggested that copper may have been liberated from the matrix during
cathodic trenching, oxidized, and then redeposited on the α-AlFeMnSi cathodes in the
immediate vicinity. As the aluminum matrix was dissolved chemically, any copper
present in solid solution should not oxidize, so long as it remains electrically connected to
the bulk electrode. However, due to the small amount of copper in the matrix (ca.
4.5wt%) it cannot be selectively dealloyed of aluminum in the same way as copper-rich
intermetallics. Therefore, copper, or copper-rich fragments, may simply pass into the
electrolyte without oxidizing, and the liberation of copper in this manner may be
considered non-Faradaic in nature. Once electrically isolated from the bulk electrode, the
fragments attain their own OCP, which allows copper to oxidize. The close proximity of
–0.75VSCE to the OCP of AA2014-T6 [224] suggested that the deposition of copper may
play a role in the cathodic process at open circuit conditions.

158
Figure 8.16 – SEM micrographs of AA2014-T6 after potentiostatic polarization at –
0.75VSCE showing: (a, b) α-AlFeMnSi and (c) θ-CuAl2. It is postulated that
cathodic trenching around α-AlFeMnSi liberated copper from the matrix in a
non-Faradaic process.
159
Deposition on θ-CuAl2 was less apparent after potentiostatic polarization at –
0.75VSCE, Figure 8.16, and there was only minor cracking in the matrix surrounding θ-
CuAl2, probably due to the lower amount of hydrogen evolution occurring at this
potential. The dealloyed structure of θ-CuAl2 was especially apparent in Figure 8.16 and
in some areas platelets were observed on the surface of the dealloyed structure. The
platelets may have formed from occluded electrolyte remaining in the highly porous
structure even after thorough washing, from which a salt is precipitated during drying.
The microstructure of AA2014-T6 after potentiostatic polarization at –0.70VSCE,
Figure 8.17, shows that above the pitting potential the matrix is subject to dissolution via
crystallographic pitting and intergranular corrosion was able to propagate deep within the
electrode, in some areas observed to extend to depths over 200µm from the electrode
face. The fact that existing pits appeared to have growth to a substantial size, Figure 8.17,
suggested that at least part of the increasing anodic current during potentiostatic
polarization at –0.70VSCE was due to the growth of this feature.
As may be expected, the amount of matrix dissolution increased from
potentiostatic polarization at –0.50VSCE, Figure 8.18. At this noble potential, intergranular
corrosion was much less apparent and crystallographic pitting initiated on virtually the
entire electrode face with the depth of attack having extended to approximately 500µm
below the surface. Pitting appeared to undercut some grains which may eventually detach
from continued pitting or from mechanical agitation during intense hydrogen evolution.

160
Figure 8.17 – SEM micrograph of the cross section of AA2014-T6 after potentiostatic
polarization at –0.70VSCE showing crystallographic pitting and intergranular
corrosion.
Figure 8.18 – SEM micrograph of the cross section of AA2014-T6 after potentiostatic
polarization at –0.50VSCE showing extensive crystallographic pitting.

161
8.4 CONCLUSIONS
In Alumix 123-(T1, T2), cathodic hydrogen evolution and oxygen reduction were
associated with film breakdown occurring on the matrix as well as copper- and iron-rich
intermetallics. Under highly alkaline conditions these intermetallics were selectively
dealloyed of active elements leaving copper- and iron-rich remains.
At potentials more negative than the pitting potential, the majority of anodic
current passed on Alumix 123-T1 was generated from creviced areas within residual
porosity. The creviced areas eventually repassivated when the concentration of anodic
reaction products exceeded the solubility limit and precipitation occurred.
At potentials noble to the pitting potential, Alumix 123-(T1, T2) display unusual
current transients and the vast majority of attack was intergranular in nature.
Crystallographic pitting was scarcely observed even at highly anodic potentials. The high
tendency for intergranular corrosion could be related to the preferential location of
intermetallics in these areas.
In AA2014-T6, cathodic hydrogen evolution and oxygen reduction primarily
occurred on θ-CuAl2 and α-AlFeMnSi intermetallics. Under highly alkaline conditions
these intermetallics were selectively dealloyed of active elements leaving copper- and
iron-rich remains.
SEM observations of AA2014-T6 suggest that cathodic deposition of copper
occurred on θ-CuAl2 and α-AlFeMnSi particles and that cathodic trenching around α-
AlFeMnSi particles may have liberated copper from the matrix in a non-Faradaic process.
At potentials noble to the pitting potential, extensive attack of AA2014-T6 by
crystallographic pitting and intergranular corrosion was observed.
162
8.5 ACKNOWLEDGEMENTS
The authors gratefully acknowledge the National Sciences and Engineering
Research Council of Canada (NSERC) and AUTO21 Network of Centers of Excellence
for providing financial support during this work. The authors would also like to thank the
Institute for Research in Materials (IRM) at Dalhousie University for use of the
SEM/EDS system, ECKA Granules for supply of the P/M pre-mix, and GKN Sinter
Metals for sintering the P/M material.

163
CHAPTER 9 EFFECT OF COMPACTION PRESSURE ON
CORROSION BEHAVIOUR OF ALUMIX 123
Intuitively, compaction pressure would be expected to have an effect on corrosion
behaviour due to its influence on sintered density, surface area, and the size/shape of
residual pores. Sintered density is of concern as it has a direct influence on the calculation
of corrosion rate. Likewise, surface area presumably affects the kinetics of corrosion by
changing the magnitude of the electrochemically active area and, due to roughness
factors, may also affect the characteristics of the static diffusion layer.
The influence of pore morphology is expected to be particularly acute as it can
influence corrosion response through several means. For instance, the electrochemically
active area may also be affected by wettability which, in occluded areas, could depend
partially on pore morphology. In another scenario pore morphology may also influence
certain aspects of the initiation and propagation of crevice corrosion, wherein a galvanic
macro-couple is formed between the creviced area within pores and the external electrode
surface. Crevice corrosion typically initiates via a differential aeration mechanism whose
incubation time could be affected by the volume of electrolyte in the crevice (i.e. pore
size) and the capacity for oxygen transport within it (i.e. pore shape). Once crevice
corrosion is propagating, pore size and shape should then have a direct influence on the
ratio of cathodic to anodic area (i.e. the ratio of creviced to exterior area) which may in
turn affect electrode kinetics and potential. Finally, pore morphology should also have an
influence on the transport of corrosion products and reactants which control the
composition of the crevice electrolyte so as to effect on electrode kinetics and potential.

164
In the present work, experimental results on the effect of compaction pressure on
corrosion behaviour of laboratory sintered Alumix 123-T1 were only partially successful;
selected results are shown in Figure 9.1 through Figure 9.5. Quantitative relationships
were clearly observed for kinetic properties, Figure 9.3, however some thermodynamic
properties, namely the open circuit potential (OCP) and corrosion potential (Ecorr), were
complicated by especially poor reproducibility. Since the value of these thermodynamic
parameters were hypothesized to be related to the propagation of crevice corrosion in
residual porosity, it is possible that their poor reproducibility was due to inconsistent
sintered density at the electrode face between individual specimens, which may have been
affected by temperature heterogeneity during sintering in the laboratory furnace or the
polishing procedure of the specimens prior to electrochemical testing. Polishing may have
led to smearing over some porosity and inadvertently polishing to inconsistent depths
may have exposed slightly different sintered densities at the electrode face between
different specimens (cf. Figure 6.3). There is, however, some qualitative behaviour that
can be discerned about the effect of compaction pressure on the OCP and corrosion
potential, as illustrated in Figure 9.1 and Figure 9.2.
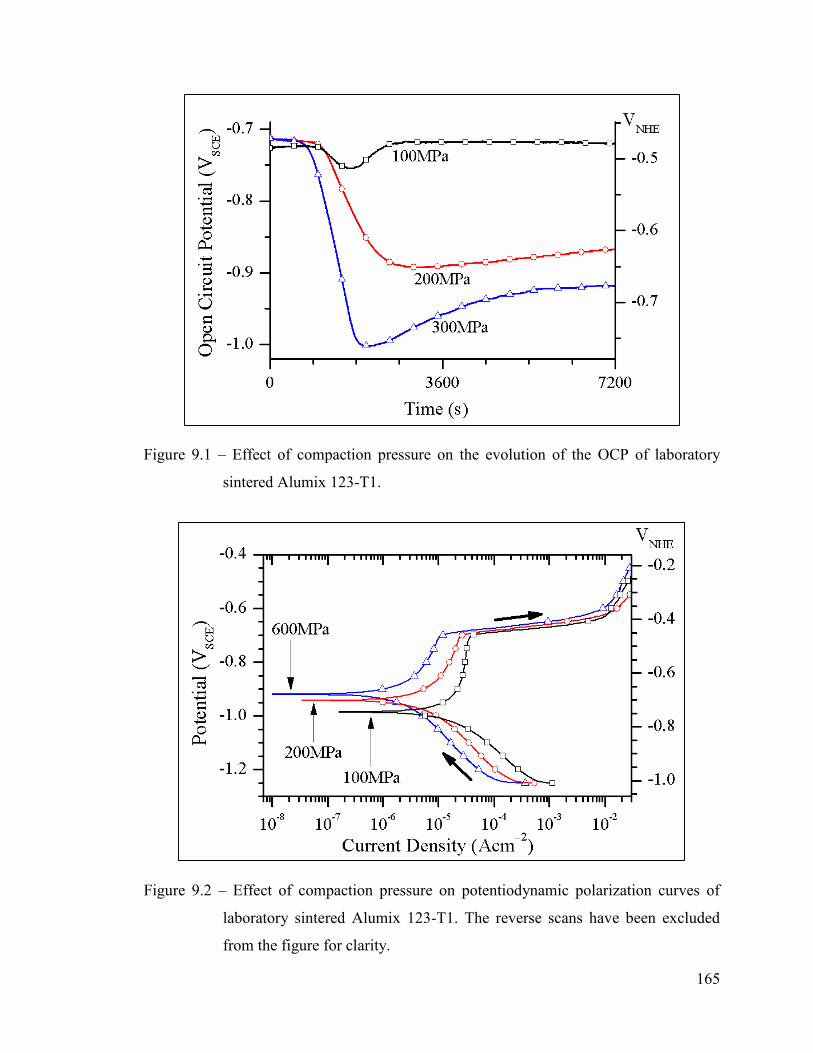
165
Figure 9.1 – Effect of compaction pressure on the evolution of the OCP of laboratory
sintered Alumix 123-T1.
Figure 9.2 – Effect of compaction pressure on potentiodynamic polarization curves of
laboratory sintered Alumix 123-T1. The reverse scans have been excluded
from the figure for clarity.
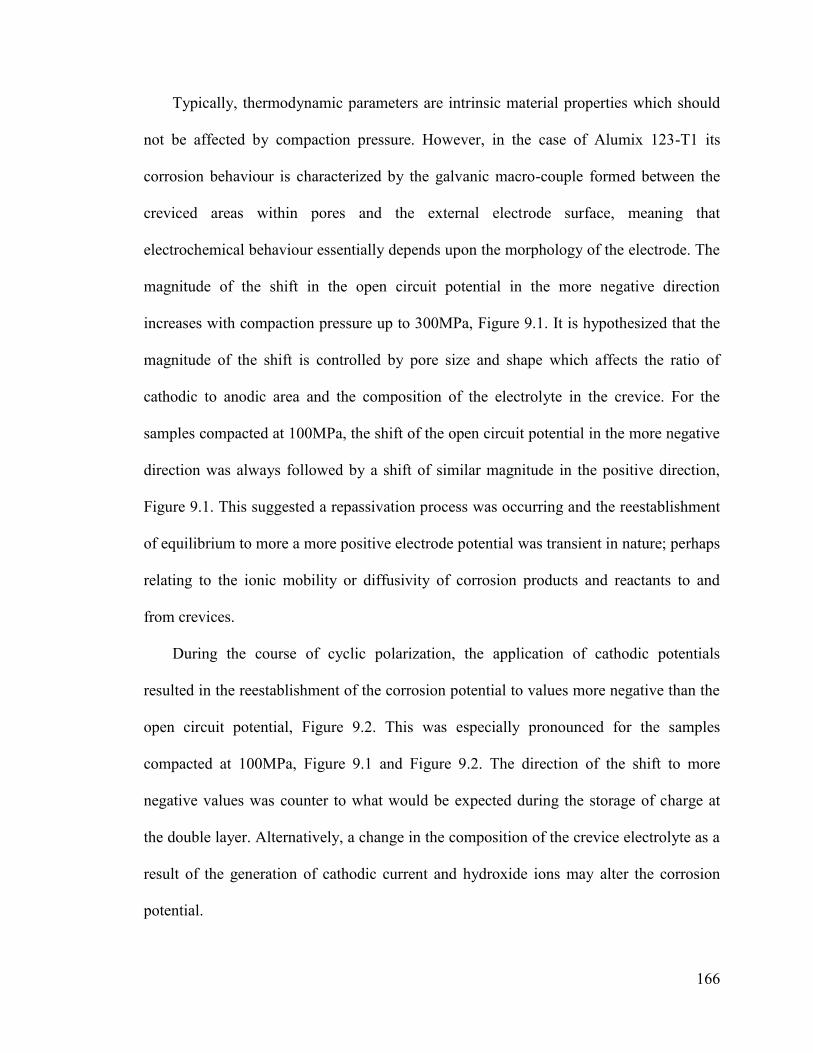
166
Typically, thermodynamic parameters are intrinsic material properties which should
not be affected by compaction pressure. However, in the case of Alumix 123-T1 its
corrosion behaviour is characterized by the galvanic macro-couple formed between the
creviced areas within pores and the external electrode surface, meaning that
electrochemical behaviour essentially depends upon the morphology of the electrode. The
magnitude of the shift in the open circuit potential in the more negative direction
increases with compaction pressure up to 300MPa, Figure 9.1. It is hypothesized that the
magnitude of the shift is controlled by pore size and shape which affects the ratio of
cathodic to anodic area and the composition of the electrolyte in the crevice. For the
samples compacted at 100MPa, the shift of the open circuit potential in the more negative
direction was always followed by a shift of similar magnitude in the positive direction,
Figure 9.1. This suggested a repassivation process was occurring and the reestablishment
of equilibrium to more a more positive electrode potential was transient in nature; perhaps
relating to the ionic mobility or diffusivity of corrosion products and reactants to and
from crevices.
During the course of cyclic polarization, the application of cathodic potentials
resulted in the reestablishment of the corrosion potential to values more negative than the
open circuit potential, Figure 9.2. This was especially pronounced for the samples
compacted at 100MPa, Figure 9.1 and Figure 9.2. The direction of the shift to more
negative values was counter to what would be expected during the storage of charge at
the double layer. Alternatively, a change in the composition of the crevice electrolyte as a
result of the generation of cathodic current and hydroxide ions may alter the corrosion
potential.

167
Despite the poor reproducibility of the OCP and corrosion potential, there was still a
clear trend of the corrosion current (icorr) and passive current (ipass) with compaction
pressure, Figure 9.3. Both parameters decreased steadily as compaction pressure
increased to 400MPa, at which point steady state was attained, Figure 9.3. The corrosion
rate, which takes in to account sintered density, displayed a similar trend to the other
kinetic parameters, Figure 9.5. Such behaviour may be expected solely based off surface
area considerations, however this is contrary to studies on P/M stainless steels which
found corrosion resistance reached a minimum at 87-90% theoretical density – an area
termed the ‘crevice sensitive region’ [209]. The results here were also contrary to other
work from this laboratory on Alumix 321-T1 P/M alloy [4] which found that above
100MPa, corrosion rate increased with increasing compaction pressure. However, Alumix
321 has a low copper content of 0.25wt% and sinters to 96-98% theoretical density [4].
Hence, its corrosion behaviour may not be comparable to Alumix 123 which only sinters
to 83-91% theoretical density and is a copper-rich formulation (~4.5wt%).
The corrosion current and corrosion rate of laboratory sintered Alumix 123-T1
samples compacted at 300MPa was about one half of that for industrially sintered Alumix
123-T1 samples (Chapter 7, Table 7.2) which were also compacted at 300MPa and
exhibited a similar bulk density. The industrially sintered Alumix 123-T1 samples
probably possessed a much lower sintered density and higher surface area at the electrode
face because they were not polished prior to electrochemical testing (cf. Figure 6.3).
The pitting potential (Epit) and repassivation potential (Erepass), Figure 9.4, were for
the most part not affected by compaction pressure. The pitting potential is related to the
stability of the oxide layer in the electrolyte and is therefore not expected to vary with
compaction pressure. The repassivation potential was also seemingly independent of

168
compaction pressure with the exception of samples pressed at the lowest pressure
considered, 100MPa. The repassivation potential of these samples is hypothesized to be
the result of their low density and high surface area which means the true anodic current
density passed was probably significantly less than other compaction pressures. The
repassivation potential is sensitive to the amount of anodic current passed, which may
explain the more noble value for the samples compacted at 100MPa. It is for this same
reason that it is sometimes debated whether the repassivation potential is or is not a true
material property since its measurement is to a large degree dependent upon experimental
parameters.
Figure 9.3 – Effect of compaction pressure on corrosion current (icorr) and passive current
(ipass) of laboratory sintered Alumix 123-T1.

169
Figure 9.4 – Effect of compaction pressure on pitting potential (Epit) and repassivation
potential (Erepass) of laboratory sintered Alumix 123-T1.
Figure 9.5 – Effect of compaction pressure on corrosion rate of laboratory sintered
Alumix 123-T1.

170
CHAPTER 10 CONCLUSIONS
During sintering, Alumix 123 compacts swelled which limited the sintered density
to about 92% theoretical density. As a result of sintering, SEM and EDS analyses showed
compacts possessed a thick refractory layer containing carbon, oxygen, and magnesium,
and areas of redeposited lubricant residues.
The microstructure of Alumix 123-T1 was characterized by a large amount of
irregularly shaped porosity and polyhedral aluminum grains with intermetallics primarily
situated along grain boundaries. Two predominant intermetallics were identified by SEM
and EDS; both were aluminum-based, but one was rich in copper and one was rich in
iron.
The OCP of Alumix 123-T1 deviated to more negative values after a short
incubation period and stabilized at potentials near the onset of hydrogen evolution (ca. –
1.0VSCE), where corrosion was partially under anodic control and proceeded via cathodic
hydrogen evolution. This is postulated to be due to a reduction in cathode area or
depassivation induced by propagating crevice corrosion within residual porosity.
The OCP of Alumix 123-T2 stabilized at the pitting potential where corrosion was
predominantly under cathodic control and proceeded via cathodic oxygen reduction. The
sizing operation of Alumix 123-T2 reduced the amount of residual porosity through
plastic deformation and sealed surface porosity with sizing fluid so that crevice corrosion
did not initiate.
At open circuit conditions, pitting in Alumix 123-(T1, T2) was not associated with
copper- or iron-rich intermetallics, which was postulated to be due to the refractory layer
formed as a result of the sintering process retaining integrity over these intermetallics.

171
The corrosion rate of Alumix 123-T1 was two times greater than Alumix 123-T2
and four times greater than AA2014-T6. Part of this disparity may be attributed to
differences in surface area.
During cathodic potentiostatic polarization of Alumix 123-(T1, T2), cathodic
hydrogen evolution and oxygen reduction occurred on the matrix as well as on copper-
and iron-rich intermetallics, and was associated with film breakdown in these areas. Local
alkalinity generated from cathodic processes can selectively de-alloy intermetallics in
Alumix 123-(T1, T2) of active elements leaving copper- and iron-rich remains.
During anodic potentiostatic polarization of Alumix 123-T1 at potentials more
negative than the pitting potential, the majority of anodic current passed was generated
from creviced areas within residual porosity which eventually repassivated as the
concentration of anodic reaction products exceeded the solubility limit and precipitation
occurred.
During anodic potentiostatic polarization of Alumix 123-(T1, T2) at potentials
noble to the pitting potential, unconventional current transients were observed and the
majority of attack was intergranular in nature. Crystallographic pitting was scarcely
observed, even at highly anodic potentials. The high tendency for intergranular corrosion
was probably related to the location of intermetallics in these areas.
Compaction pressure affected the corrosion behaviour of Alumix 123-T1 – when
increased from 100MPa through 400MPa a steady decrease in corrosion rate was
observed. However, the pitting potential and repassivation potential of Alumix 123-T1
were essentially independent of compaction pressure.

172
In the microstructure of AA2014-T6 the θ-CuAl2 and α-AlFeMnSi
((CuFeMn)3Si2Al15) intermetallics were identified by SEM, EDS, and XRD analyses.
Small micron and sub-micron intermetallics were also distributed throughout the matrix
of AA2014-T6 which could not be identified.
The OCP of AA2014-T6 stabilized at the pitting potential, where corrosion was
predominantly under cathodic control, and proceeded via cathodic oxygen reduction. At
open circuit conditions, pitting in AA2014-T6 was associated with θ-CuAl2, α-AlFeMnSi,
and other small intermetallic particles. The attack involving θ-CuAl2 was attributed to the
anodic trenching mechanism and the attack involving α-AlFeMnSi was attributed to the
cathodic trenching mechanism.
During cathodic potentiostatic polarization of AA2014-T6, cathodic hydrogen
evolution and oxygen reduction occurred predominantly on θ-CuAl2, α-AlFeMnSi, and
other small intermetallics. Local alkalinity generated from cathodic processes can
selectively de-alloy intermetallics in AA2014-T6 of active elements leaving copper- and
iron-rich remains.
After cathodic potentiostatic polarization of AA2014-T6, SEM observations
suggested that cathodic deposition of copper can occur on θ-CuAl2 and α-AlFeMnSi
particles, and that cathodic trenching around α-AlFeMnSi particles may have liberated
copper from the matrix in a non-Faradaic process.
During anodic potentiostatic polarization of AA2014-T6, the current passed
gradually increased until a steady state was reached and there was extensive attack by
crystallographic pitting and intergranular corrosion.

173
10.1 FUTURE WORK
The corrosion behaviour of aluminum P/M alloys is much less understood and
characterized than that of the wrought and cast aluminum alloys. In the present work, the
understanding of corrosion mechanisms in aluminum P/M alloys has been expanded, but
has also raised further questions which warrant continued investigations. The following
list is a suggestion of areas of work which, in the author’s opinion, should eventually be
addressed and would serve to advance the understanding of corrosion mechanisms in
aluminum P/M alloys:
1. The surface state of aluminum P/M alloys should be characterized prior to
corrosion testing; ideally the real surface area and real sintered density at the
electrode face would be quantified.
2. The refractory layer of ‘as-sintered’ aluminum P/M alloys should be better
characterized, particularly its composition, structure, and thickness, and its
response to differing electrolyte conditions, including bulk pH and chloride ion
concentration, should be quantified.
3. The corrosion behaviour of aluminum P/M alloys should be studied in deaerated
electrolyte to mitigate difficulties encountered from the initiation and propagation
of crevice corrosion in residual porosity.
4. Aspects of the initiation and propagation of crevice corrosion in residual porosity
should be further studied in an attempt to identify mechanisms behind the shift in
electrode potential and whether depassivation occurs in some creviced areas.

174
5. The behaviour of aluminum P/M alloys under conditions of stress corrosion and
corrosion fatigue should be examined considering their high susceptibility to
intergranular corrosion.
6. The effect of heat treatment on the corrosion behaviour of aluminum P/M alloys,
including response to stress corrosion and corrosion fatigue, should be studied.
Heat treatment may change the distribution of intermetallics and reduce the
tendency for intergranular corrosion.
7. The role of aluminum nitride (AlN), which is largely responsible for the enhanced
densification during sintering under nitrogen atmospheres, in the corrosion
behaviour of aluminum P/M alloys should be determined.
One last general recommendation regards the standardization of aluminum P/M alloys.
The existing system defining P/M aluminum standards is much less rigorous than for cast
or wrought aluminum, and furthermore the P/M process introduces numerous variables
which may need to be addressed, including characteristics of powder and powder
production methods (e.g. particle size, alloying method), powder compaction (e.g.
compaction pressure, type of lubricant), sintering (e.g. time, temperature, heating rate,
atmosphere), cooling (e.g. cooling rate, atmosphere), and secondary processing (e.g.
sizing, heat treatment). In order to reconcile results between different investigations, it is
recommended to thoroughly characterize aluminum P/M material prior to corrosion
testing in an attempt to discern whether any differences in corrosion behaviour may be
ascribed to a different alloy structure as a result of differences in the powder pre-mix or
processing conditions.

175
REFERENCES
[1] M. Qian and G.B. Schaffer. "Sintering of Aluminium and its Alloys" in Sintering of
Advanced Materials. Woodhead Publishing Limited, Cambridge (2010): 291-323.
[2] J.D. Draper, M.K. Gala and C.B. Thompson. "Al P/M Parts Fabrication." Modern
Developments in Powder Metallurgy 10: 305-323, (1977).
[3] E.M. Daver, W.J. Ullrich and K.B. Patel. "Aluminum P/M Parts - Materials,
Production and Properties." Key Engineering Materials 29-31: 401-428, (1989).
[4] A.M. Ibrahim. Processing of Alumix 321 PM Alloy and its Corrosion Behaviour in 3.5
wt% Saline Solution. Ph.D. Thesis. Dalhousie University, (2013)
[5] J.H. Dudas and K.J. Brondyke. "Aluminum P/M Parts - Their Properties and
Performance." Society of Automotive Engineers Report No. 700141. (1970).
[6] J.H. Dudas. "Aluminum Powder-Metal Alloys Offer Unique Property Mix." SAE
Journal 78(6): 40-42, (1970).
[7] R.E. Roesel. "Aluminum Powder Metallurgy–Production, Properties and Potential."
Powder Metallurgy International 5(2): 89-93, (1973).
[8] The Aluminum Association. "International Alloy Designations and Chemical
Composition Limits for Wrought Aluminum and Aluminum Alloys." (2009).
[9] J.G. Kaufman. Introduction to Aluminum Alloys and Tempers. ASM International,
Materials Park, O.H. (2000): 16-20,24,31,57-59,65-73.
[10] J.T. Stanley. "History of Wrought-Aluminum-Alloy Development" in Aluminum
Alloys: Contemporary Research and Applications. Academic Press, Boston, M.A.
(1989): 3-31.
[11] L.F. Mondolfo. Aluminum Alloys: Structure and Properties. Butterworths, London
(1976).
[12] Alloying: Understanding the Basics. J.R. Davis (Ed.). ASM International, Materials
Park, O.H. (2001): 360,371,379.
[13] G.J. Hildeman and M.J. Koczak. "Powder-Metallurgy Aluminum Alloys" in
Aluminum Alloys–Contemporary Research and Applications. Academic Press,
Boston (1989): 323-364.
[14] J.H. Dudas and W.A. Dean. "The Production of Precision Aluminum P/M Parts."
Progress in Powder Metallurgy 25: 101-130, (1969).

176
[15] J.H. Dudas and W.A. Dean. "The Production of Precision Aluminum P/M Parts."
International Journal of Powder Metallurgy 5(2): 21-36, (1969).
[16] Anonymous. "New P/M Advances Focus on Aluminum." Materials Engineering
70(1): 59,73, (1969).
[17] Anonymous. "Progress in Aluminum Powder Metallurgy." Precision Metal 27(6):
41-44,77, (1969).
[18] R. Khol. "At Last... Parts from Aluminum Powder." Machine Design 41(16): 110-
114, (1969).
[19] B.D. Wakefield. "Aluminum PM Parts: A Good Start." Iron Age 205(12): 60-61,
(1970).
[20] Anonymous. "Application Outlook for Aluminum P/M Parts." Metal Progress 99(4):
60-64,66, (1971).
[21] K.H. Miska. "Aluminum P/M Parts are Strong, Economical and they Save Weight."
Materials Engineering 81(4): 32-36, (1975).
[22] J.D. Generous. "The Quiet Success of Aluminum P/M." Metal Progress 116(6): 52-
54, (1979).
[23] Anonymous. "Aluminium Powders in Powder Metallurgy." Metal Powder Report
35(5): 187-191, (1980).
[24] Anonymous. "Aluminum Powder Parts Pay Off in Business Machines." Modern
Metals 36(10): 76,78,80, (1980).
[25] J.D. Generous. "Aluminum P/M Applications in Business Machines." Modern
Developments in Powder Metallurgy 13: 501-510, (1981).
[26] J.D. Generous and W.C. Montgomery. "Aluminum P/M – Properties and
Applications" in Powder Metallurgy: Applications, Advantages and Limitations.
American Society for Metals, Metals Park, Ohio (1983): 211-234.
[27] J.E. Foss and D. DeFranco. "The Northstar Cam Bearing Caps: A New Application
for Aluminum P/M." Society of Automotive Engineers Report No. 940429. (1994).
[28] L.F. Pease III and W.G. West. Fundamentals of Powder Metallurgy. Metal Powder
Industries Federation, Princeton, New Jersey (2002): 340.
[29] K.J. Brondyke and T.F. McCormick. "Melting, Remelting, Degassing, Fluxing and
Handling" in Aluminum: Vol. III Fabrication and Finishing. American Society for
Metals, Metals Park (1967): 1-42.

177
[30] D.A. Granger. "Ingot Casting in the Aluminum Industry" in Aluminum Alloys–
Contemporary Research and Applications. Academic Press, Inc., San Diego (1989):
109-135.
[31] S.J. Paterson and T. Sheppard. "Structural Changes Occuring during Thermal
Treatments during Extrusion of Al-Cu-Mg-Mn-Si (AA2014) Alloy." Metals
Technology 9(1): 389-398, (1982).
[32] L. Bäckerud, E. Król and J. Tamminen. Solidification Characteristics of Aluminium
Alloys. Volume 1: Wrought Alloys. Tangen Trykk A/S, Norway (1986).
[33] R.E. Sanders Jr. "Technology Innovation in Aluminum Products." Journal of Metals
53(2): 21-25, (2001).
[34] T. Sheppard. "On the Relationship between Extrusion Conditions, Mechanical
Properties, and Surface Acceptibility in some Hard Aluminum Alloys" in
Proceedings of the Seventh International Aluminum Extrusion Technology Seminar:
Shaping the Future. May 16-19 2000, Chicago. (2000): 307-322.
[35] ASTM International. "ASTM B918. Standard Practice for Heat Treatment of
Wrought Aluminum Alloys." (2009).
[36] H.C. Neubing and J. Gradl. "Quality Aspects during the Manufacturing and Testing
of Aluminium-Premixes" in P/M in to the 1990's: International Conference on
Powder Metallurgy, Wembley Conference Centre, London, UK, 2-6 July 1990. The
Institute of Metals, (1990): 252-257.
[37] J.D. Edwards. "Comminuted Forms of Aluminum" in Powder Metallurgy. J. Wulff
(Ed.). American Society for Metals, (1942): 124-131.
[38] L.W. Kempf. "Properties of Compressed and Heated Aluminum Alloy Powder
Mixtures" in Powder Metallurgy. J. Wulff (Ed.). American Society for Metals,
Cleveland (1942): 314-316.
[39] G.D. Cremer and J.J. Cordiano. "Recent Developments in the Formation of
Aluminum and Aluminum Alloys by Powder Metallurgy." Transactions of the
American Institute of Mining and Metallurgical Engineers 52: 152-165, (1943).
[40] R.L. Bickerdike. "Aluminium Components" in Symposium on Powder Metallurgy.
Iron & Steel Institute, (1947): 185-191.
[41] J.B. Haertlein and J.F. Sachse. "Review of Aluminum Powder Metallurgy."
Proceedings of the Metal Powder Association: 83-94, (1953).
[42] E.M. Daver. "Process and Material Considerations for Aluminum Powder
Metallurgy" Society of Manufacturing Engineers Report No. EM71-276. (1971).

178
[43] C.G. Goetzel. Treatise on Powder Metallurgy. Volume I: Technology of Metal
Powders and their Products. Interscience Publishers, Inc., New York (1949):
36,37,39,70,195,196,217,225-229,682-685.
[44] S. Özbilen, A. Ünal and T. Sheppard. "Influence of Oxygen on Morphology and
Oxide Content of Gas Atomized Aluminium Powders" in Physical Chemistry of
Metal Powders. The Minerals, Metals & Materials Society, Warrendale, P.A. (1989):
489-505.
[45] J.S. Thompson. "A Study of Process Variables in the Production of Aluminium
Powder by Atomization." Journal of the Institute of Metals 74: 101-132, (1948).
[46] A.V. Ramana Rao. "Preparation of Aluminium Powder by Atomisation."
Transactions of the Powder Metallurgy Association of India 3: 20-25, (1976).
[47] B. Williams. "Aluminium Powder Production at ALPOCO." Metal Powder Report
41(1): 43-44, (1985).
[48] A.P. Savitskii, O.B. Afanas'ev, V.G. Gopienko, L.S. Martsunova, G.N. Romanov
and T.L. Zayats. "Effect of Aluminum Particle Size on the Volume Changes
Experienced by Compacts from a Mixture of Aluminum and Copper Powders during
Liquid-Phase Sintering." Soviet Powder Metallurgy and Metal Ceramics 25(9): 721-
725, (1986).
[49] D.P. Bishop, B. Hofmann and K.R. Couchman. "Properties and Attributes of
Commercially Available AC2014-Type Aluminum P/M Alloys" in Proceedings of
the 2000 International Conference on Powder Metallurgy & Particulate Materials.
(2000): 1-14.
[50] I. Amato, S. Corso and E. Sgambetterra. "Sintering Procedures for Aluminium P/M
Parts and Metallographic Examination during the Process." Powder Metallurgy
19(3): 171-176, (1976).
[51] J.H. Dudas, R.H. Stevens and B.K. Gildersleeve. "Metallography and Structure
Interpretation of Aluminum P/M Parts." International Journal of Powder Metallurgy
& Powder Technology 10(4): 285-293, (1974).
[52] T. Watanabe and K. Yamada. "Effects of Copper-Adding Methods on the Strength of
Sintered Aluminum-Copper Alloys." Report of the Castings Research Laboratory,
Waseda University (19): 21-29, (1968).
[53] T. Watanabe and K. Yamada. "Effects of Methods of Adding Copper on the Strength
of Sintered Aluminum Copper Alloys." International Journal of Powder Metallurgy
4(3): 37-47, (1968).
[54] S. Storchheim. "Aluminum Powder Metallurgy Finally made Commercially
Practical." Progress in Powder Metallurgy 18: 124-130, (1962).

179
[55] W. Kehl, M. Bugajska and H.F. Fischmeister. "Internal Or Die Wall Lubrication for
Compaction of Al Powders?" Powder Metallurgy 26(4): 221-227, (1983).
[56] R.N. Lumley and G.B. Schaffer. "The Effect of Additive Particle Size on the
Mechanical Properties of Sintered Aluminium-Copper Alloys." Scripta Materialia
39(8): 1089-1094, (1998).
[57] F.J. Esper and G. Leuze. "The Influence of the Powder Particle Size on the
Properties of Aluminum P/M Parts." Powder Metallurgy International 3(3): 123-126,
(1971).
[58] W. Kehl and H.F. Fischmeister. "Liquid-Phase Sintering of Al-Cu Compacts."
Powder Metallurgy 23(3): 113-119, (1980).
[59] E. Mehl. "Production of Metal Powders: Electrolytic Deposition from Aqueous
Solution." Metal Treatment 17(62): 118-122,124,126,128, (1950).
[60] F. Wills and E.J. Clugston. "Production of Electrolytic Copper Powder." Journal of
the Electrochemical Society 106(4): 362-366, (1959).
[61] C.G. Goetzel. Treatise on Powder Metallurgy. Volume III: Classified and Annotated
Bibliography. Interscience Publishers, Inc., New York, N.Y. (1952): 470-475.
[62] W.W. Moss Jr. "Magnesium Powder Fabrication." Light Metal Age 2(1, 2): 10-
13,17-19,24,30,38, (1944).
[63] D.J. Brown. "Powder Metallurgy of Magnesium" in Symposium on Powder
Metallurgy, Pre Print, Group III. Iron & Steel Institute, (1954): 100-104.
[64] Anonymous. "Aluminium Powder." Metal Industry 66(2): 22, (1945).
[65] J.A. Gann. "Metallic Powder and Method of Making." U.S. Patent 1,871,450. (1932).
[66] F. Farzin Nia and B.L. Davies. "Production of Al-Cu and Al-Cu-Si Alloys by PM
Methods." Powder Metallurgy 25(4): 209-215, (1982).
[67] B.L. Davies and F. Farzin Nia. "Precipitation Hardening of P/M Aluminum-Copper
Alloys." International Journal of Powder Metallurgy & Powder Technology 19(3):
197-209, (1983).
[68] C.G. Goetzel. Treatise on Powder Metallurgy. Volume II: Applied and Physical
Powder Metallurgy. Interscience Publishers, Inc., New York (1950): 489-
500,598,722-727.

180
[69] A.Y. Kem. "Effect of the Compacting Conditions on the Structure and Properties of
Powdered Aluminum Alloys Containing Copper and Magnesium." Soviet Powder
Metallurgy and Metal Ceramics 31(8): 675-679, (1992).
[70] H.G. Taylor. "The Influence of Tooling Methods on the Density Distribution in
Complex Metal-Powder Parts." Powder Metallurgy 3(6): 87-124, (1960).
[71] L.S. Martsunova, A.P. Savitskii, ÉN. Ushakova and B.I. Matveev. "Sintering of
Aluminum with Copper Additions." Soviet Powder Metallurgy and Metal Ceramics
12(12): 956-959, (1973).
[72] P.E. Matthews. "Effects of Processing Variables on the Properties of Sintered
Aluminum Compacts." International Journal of Powder Metallurgy 4(4): 39-46,
(1968).
[73] D.P. Bishop, R.L. McNally Jr. and T.E. Geiman. "Metallurgical Considerations in
the Manufacturer and Development of Aluminum P/M Camshaft Bearing Caps" in
Proceedings of the 2nd International Conference on Powder Metallurgy Aluminum
& Light Alloys for Automotive Applications. W.F. Jandeska and R.A. Chernenkoff
(Eds.). Metal Powder Industries Federation, (2000): 177-185.
[74] A.P. Savitskii and G.N. Romanov. "Effect of Porosity on the Volume Changes
Experienced by Al-Cu Compacts during Liquid-Phase Sintering." Soviet Powder
Metallurgy and Metal Ceramics 26(7): 532-536, (1987).
[75] J.H. Dudas and C.B. Thompson. "Improved Sintering Procedures for Aluminum P/M
Parts." Modern Developments in Powder Metallurgy 5: 19-36, (1971).
[76] Anonymous. "Sintering Practices for Aluminum Powdered Metal Parts Affect
Properties." Industrial Heating 37(9): 1654-1656, (1970).
[77] W.C. Dimon. "Sintering Furnaces: A New Breed Coming." Precision Metal 28(4):
54-57, (1970).
[78] T. Watanabe and M. Kanazawa. "Observations on the Melt-Off Pores of Sintered
Aluminum-5%Copper Alloy Compacts made from Mixed Powder by the use of
Scanning Electron Microscope." Report of the Castings Research Laboratory,
Waseda University 24: 13-16, (1973).
[79] T. Watanabe and M. Kanazawa. "Observations on the Melt-Off Pores of Sintered Al-
5%Cu Alloy Compacts by the use of Scanning Electron Microscope." Journal of the
Japan Society of Powder and Powder Metallurgy 20(3): 87-88, (1973).
[80] A.P. Savitskii. Sintering of Systems with Interacting Components. Trans Tech
Publications, (2009): 175-210.

181
[81] A.P. Savitskii, G.N. Romanov, L.S. Martsunova and V.V. Zhdanov. "Nature of the
Growth of Al-Cu Powder Compacts during Liquid-Phase Sintering." Soviet Powder
Metallurgy and Metal Ceramics 27(5): 348-351, (1988).
[82] A.P. Savitskii and G.N. Romanov. "Structure Formation during the Sintering of
Aluminum-Copper Alloys." Soviet Powder Metallurgy and Metal Ceramics 25(3):
184-187, (1986).
[83] A.P. Savitskii and G.N. Romanov. "Prevention of Compact Swelling during Liquid
Phase Sintering of the Al-Cu System." Science of Sintering 22(2): 73-77, (1990).
[84] A.P. Savitskii, G.N. Romanov and L.S. Martsunova. "Deformation of Aluminum-
Copper Powder Solids during Liquid-Phase Sintering." Soviet Powder Metallurgy
and Metal Ceramics 24(8): 617-621, (1985).
[85] V.A. Brodov, S.V. Belov, A.V. Zhil'tsov, Y.V. Levinskii and G.V. Malakhov.
"Formation of the Structure in Sintering and the Strength Properties of Al-Cu P/M
Alloys." Soviet Powder Metallurgy and Metal Ceramics 29(10): 808-812, (1990).
[86] H. Mitani and H. Nagai. "On the Sintering Process of Al-Cu Binary Mixed Powder
Compacts." Journal of the Japan Society of Powder and Powder Metallurgy 20(6):
178-183, (1973).
[87] A.P. Savitskii and L.S. Martsunova. "Effect of Solid-State Solubility on the Volume
Changes Experienced by Aluminum during Liquid-Phase Sintering." Soviet Powder
Metallurgy and Metal Ceramics 16(5): 333-337, (1977).
[88] R.N. Lumley and G.B. Schaffer. "The Effect of Solubility and Particle Size on
Liquid Phase Sintering." Scripta Materialia 35(5): 589-595, (1996).
[89] S. Storchheim. "Aluminum Powder Metallurgy Now Feasible." Precision Metal
26(6): 67-68,73, (1968).
[90] A. Kimura, M. Shibata, K. Kondoh, Y. Takeda, M. Katayama, T. Kanie and H.
Takada. "Reduction Mechanism of Surface Oxide in Aluminum Alloy Powders
Containing Magnesium Studied by X-Ray Photoelectron Spectroscopy using
Synchrotron Radiation." Applied Physics Letters 70(26): 3615-3617, (1997).
[91] G.B. Schaffer, J.-. Yao, S.J. Bonner, E. Crossin, S.J. Pas and A.J. Hill. "The Effect of
Tin and Nitrogen on Liquid Phase Sintering of Al-Cu-Mg-Si Alloys." Acta
Materialia 56: 2615-2624, (2008).
[92] V.A. Brodov, A.V. Zhil'tsov, N.M. Ionova and I.P. Melashenko. "Effect of Alloying
Method on Sintering and Physico-Mechanical Properties of Al-4.4%Cu-0.5%Mg
Powder Alloy." Soviet Powder Metallurgy and Metal Ceramics 27(10): 790-794,
(1988).

182
[93] A.B. Al'tman, V.A. Brodov, A.V. Zhil'tsov and I.P. Melashenko. "Effect of Sintering
Conditions on the Structure and Mechanical Properties of P/M Aluminum Base
Alloys." Soviet Powder Metallurgy and Metal Ceramics 26(9): 713-717, (1987).
[94] G.S. Upadhyaya and P. Thareja. "Activated Sintering of Aluminium-Copper Alloys
with Boron Addition." Transactions of the Powder Metallurgy Association of India
2: 22-26, (1975).
[95] T.B. Sercombe and G.B. Schaffer. "The Effect of Trace Elements on the Sintering of
Al-Cu Alloys." Acta Materialia 47(2): 689-697, (1999).
[96] A.P. Savitskii, G.N. Romanov and V.G. Gopienko. "Influence of Solubility in the
Solid Phase on Volume Changes in Liquid-Phase Sintering of Aluminum-Base
Powder Metallurgy Specimens." Soviet Powder Metallurgy and Metal Ceramics
27(7): 568-571, (1988).
[97] G.B. Schaffer and B.J. Hall. "The Influence of the Atmosphere on the Sintering of
Aluminum." Metallurgical and Materials Transactions A 33(10): 3279-3284, (2002).
[98] P.E. Matthews. "The Mechanical Properties of Brass and Developmental Nonferrous
P/M Materials." International Journal of Powder Metallurgy 5(4): 59-69, (1969).
[99] P.E. Matthews. "The Mechanical Properties of Brass and Developmental Non-
Ferrous P/M Materials." Progress in Powder Metallurgy 25: 15-27, (1969).
[100] P.E. Matthews. "Mechanical Properties of Brass and Developmental Non-Ferrous
Powder Compacts." American Society of Tool and Manufacturing Engineers Report
No. EM69-558. (1969).
[101] K.E. Buchovecky and M.R. Rearick. "Aluminum P/M Forgings." Metal Progress
101(2): 74-78, (1972).
[102] N.D. Tomashoff. "Corrosion of Metals with Oxygen Depolarization [I.]." Light
Metals 10(119): 637-645, (1947).
[103] N.D. Tomashoff. "Corrosion of Metals with Oxygen Depolarization [II.]." Light
Metals 11(120): 8-14, (1948).
[104] N.D. Tomashoff. "Corrosion of Metals with Oxygen Depolarization [III.]." Light
Metals 11(121): 104-112, (1948).
[105] N.D. Tomashoff. "Corrosion of Metals with Oxygen Depolarization [IV.]." Light
Metals 11(122): 155-160, (1948).
[106] N.D. Tomashoff. "Corrosion of Metals with Oxygen Depolarization [V.]." Light
Metals 11(126): 388-396, (1948).

183
[107] N.D. Tomashoff. "Corrosion of Metals with Oxygen Depolarization [VI.]." Light
Metals 11(128): 503-509, (1948).
[108] N.D. Tomashov. Theory of Corrosion and Protection of Metals. Translated by B.H.
Tytell, I. Geld and H.S. Preiser. The Macmillan Company, New York, N.Y. (1967).
[109] M.J. Pryor and D.S. Keir. "The Nature of Aluminum as a Cathode." Journal of the
Electrochemical Society 102(10): 605-607, (1955).
[110] G.A. DiBari and H.J. Read. "Electrochemical Behavior of High Purity Aluminum
in Chloride Containing Solutions." Corrosion 27(11): 483-493, (1971).
[111] A. Despić and V.P. Parkhutik. "Electrochemistry of Aluminum in Aqueous
Solutions and Physics of its Anodic Oxide" in Modern Aspects of Electrochemistry
No. 20. Plenum Press, New York, N.Y. (1989): 401-503.
[112] K.F. Lorking. "Initiation and Inhibition of Corrosion of Aluminium in Aqueous
Solutions." Journal of the Australian Institute of Metals 7(2): 136-140, (1962).
[113] H.P. Godard. "Aluminum" in The Corrosion of Light Metals. John Wiley & Sons,
Inc., New York, N.Y. (1967): 1-218.
[114] A.I. Krasil'shchikov. "Electrochemical Ionization of Oxygen." Protection of Metals
1(6): 547-557, (1965).
[115] B. Bianchi, F. Mazza and T. Mussini. "Electrochemical Processes of Oxygen and
Hydrogen Peroxide in Metal Corrosion and Protection" in 2nd International
Congress on Metallic Corrosion; New York, N.Y., March 11-15, 1963. National
Association of Corrosion Engineers, (1966): 893-904.
[116] R. Grauer and E. Wiedmer. "Investigations into the Behaviour of Aluminium Under
Cathodic Polarization." Werkstoffe und Korrosion 24(2): 128-130, (1973).
[117] Y.N. Mikhailovskii, V.A. San'ko and V.M. Popova. "Dissolution of Aluminum and
Alloy D-16 during Polarization by External Current in Media with Different Degrees
of Aeration." Protection of Metals 12(6): 564-568, (1976).
[118] E.P.G.T. van de Ven and H. Koelmans. "The Cathodic Corrosion of Aluminum."
Journal of the Electrochemical Society 123(1): 143-144, (1976).
[119] K. Nis¸ancioǦlu and H. Holtan. "Cathodic Polarization of Aluminium in Acetate-
Buffered Chloride Media." Electrochimica Acta 24(12): 1229-1235, (1979).
[120] K. Nis¸ancioǦlu and H. Holtan. "Corrosion of Aluminum in Aqueous Chloride
Media" in 7th Scandinavian Corrosion Congress. (1975): 418-433.

184
[121] I.L. Rozenfel'd, V.P. Persiantseva and V.E. Zorina. "Anodic Solution of Aluminum
in Neutral Media." Protection of Metals 15(1): 69-72, (1979).
[122] E.M. Khairy and M.K. Hussein. "The Static Electrode Potential Behavior of
Aluminum and the Anodic Behavior of the Pure Metal and its Alloys in Chloride
Media." Corrosion 13(12): 27-32, (1957).
[123] K. Ogle, M. Serdechnova, M. Mokaddem and P. Volovitch. "The Cathodic
Dissolution of Al, Al2Cu, and Al Alloys." Electrochimica Acta 56(4): 1711-1718,
(2011).
[124] K. Nisancioglu and H. Holtan. "Cathodic Polarization of Commercially Pure
Aluminium." Corrosion Science 19(8): 537-552, (1979).
[125] J. Radošević, M. Kliškić, P. Dabić, R. Stevanović and A. Despić. "Processes on
Aluminium on the Negative Side of the Open-Circuit Potential." Journal of
Electroanalytical Chemistry and Interfacial Electrochemistry 277(1/2): 105-119,
(1990).
[126] K.G. Cowan and J.A. Harrison. "Automation of Electrode Kinetics−V. the
Dissolution of Al in Cl− and F− Containing Aqueous Solutions." Electrochimica Acta
25(9): 1153-1163, (1980).
[127] A.R. Despić, D.M. Dražić, J. Balakšina, L. Gajić-Krstajić and R.M. Stevanović.
"Investigation of Oxidation Potentials of Substances Accumulated during Cathodic
Polarization of Aluminium." Electrochimica Acta 35(11/12): 1747-1755, (1990).
[128] K. Minakawa, M. Izu, E. Sato and Y. Itoi. "Anodic Polarization Behavior of High
Purity Aluminum in Sodium Chloride Aqueous Solution Adjusted to various pH's."
Journal of Japan Institute of Light Metals 34(3): 182-189, (1984).
[129] D.M. Dražić and A.R. Despić. "Electrochemistry of Aluminium in Aqueous
Solutions." Documenta Chemica Yugoslavica 48(Supplement): S5-S36, (1983).
[130] T.R. Beck. "Salt Film Formation during Corrosion of Aluminum." Electrochimica
Acta 29(4): 485-491, (1984).
[131] V.F. Lazarev, L.S. Sukhanova and A.I. Levin. "Mechanism of the Anodic
Dissolution of Aluminum." Soviet Electrochemistry 11(5): 784, (1975).
[132] E. Deltombe and M. Pourbaix. "The Electrochemical Behavior of Aluminum:
Potential pH Diagram of the System Al-H2O at 25 C." Corrosion 14(11): 16-20,
(1958).

185
[133] D.M. Dražić, S.K. Zečević, R.T. Atanasoski and A.R. Despić. "The Effect of
Anions on the Electrochemical Behaviour of Aluminium." Electrochimica Acta
28(5): 751-755, (1983).
[134] W. Lynes. "The Oxygen Concentration Cell as a Factor in the Localized Corrosion
of Metals." Journal of the Electrochemical Society 103(8): 467-474, (1956).
[135] K. Nis¸ancioǦlu and H. Holtan. "Correlation of the Open-Circuit and
Electrochemical Measurements for the Pitting Corrosion of Aluminium in Chloride
Media." Werkstoffe und Korrosion 30(2): 105-113, (1979).
[136] K. Sugimoto, Y. Sawada and S. Morioka. "Effects of Matrix Purity and
Environment Factors on the Anodic Pitting Dissolution Behaviours of Aluminium."
Journal of the Japan Institute of Metals 32(9): 842-848, (1968).
[137] T. Suter and R.C. Alkire. "Microelectrochemical Studies of Pit Initiation at
Inclusions in Al 2024-T3." Journal of the Electrochemical Society 148(1): B36-B42,
(2001).
[138] I.G. Murgulescu, O. Radovici and S. Ciolac. "Potentio-Kinetic Studies on some
Aluminum Binary Alloys" in 2nd International Congress on Metallic Corrosion;
New York, N.Y., March 11-15, 1963. National Association of Corrosion Engineers,
(1966): 942-952.
[139] P.L. Bonora, G.P. Ponzano and V. Lorenzelli. "Contribution to the Study of
Localised Corrosion of Aluminium and its Alloys II. Influence of the Environment."
British Corrosion Journal 9(2): 112-115, (1974).
[140] A.R. Despić, D.M. Dražić, S.K. Zečević and R.T. Atanasoski. "Abnormal
Polarization Change in Anodic Dissolution of Aluminium at High Current
Densities." Electrochimica Acta 26(1): 173-177, (1981).
[141] B.N. Stirrup and N.A. Hampson. "Pit Propagation in Aluminium Under Anodic
Polarization in Aqueous Chloride Electrolyte." Journal of Applied Electrochemistry
7(1): 91-92, (1977).
[142] E. McCafferty. "Sequence of Steps in the Pitting of Aluminum by Chloride Ions."
Corrosion Science 45(7): 1421-1438, (2003).
[143] W. Beck, F.G. Keihn and R.G. Gold. "Corrosion of Aluminum in Potassium
Chloride Solutions. I. Effects of Concentrations of KCl and Dissolved Oxygen."
Journal of the Electrochemical Society 101(8): 393-399, (1954).
[144] N. Birbilis and R.G. Buchheit. "Electrochemical Characteristics of Intermetallic
Phases in Aluminum Alloys: An Experimental Survey and Discussion." Journal of
the Electrochemical Society 152(4): B140-B151, (2005).

186
[145] K. Sugimoto, Y. Sawada and S. Morioka. "Anodic Polarization Behaviour of Pure
Aluminum and SAP (Sintered Aluminum Powder) in Halide Solutions." Journal of
the Japan Institute of Metals 30(10): 971-977, (1966).
[146] K. Tohma and K. Yamada. "Change of Corrosion Potentials of Aluminum and
Aluminum Alloys with Pit Growth." Journal of Japan Institute of Light Metals
30(2): 85-91, (1980).
[147] R.M. Stevanovic, A.R. Despić and D.M. Dražić. "Activation of Aluminium in
Chloride Containing Solutions." Electrochimica Acta 33(3): 397-404, (1988).
[148] G.O. Ilevbare, O. Schneider, R.G. Kelly and J.R. Scully. "In Situ Confocal Laser
Scanning Microscopy of AA 2024-T3 Corrosion Metrology. I. Localized Corrosion
of Particles." Journal of the Electrochemical Society 151(8): B453-B464, (2004).
[149] O. Schneider, G.O. Ilevbare, J.R. Scully and R.G. Kelly. "In Situ Confocal Laser
Scanning Microscopy of AA 2024-T3 Corrosion Metrology. II. Trench Formation
Around Particles." Journal of the Electrochemical Society 151(8): B465-B472,
(2004).
[150] J.R. Scully, T.O. Knight, R.G. Buchheit and D.E. Peebles. "Electrochemical
Characteristics of the Al2Cu, Al3Ta and Al3Zr Intermetallic Phases and their
Relevancy to the Localized Corrosion of Al Alloys." Corrosion Science 35(1-4):
185-195, (1993).
[151] N. Birbilis and R.G. Buchheit. "Investigation and Discussion of Characteristics for
Intermetallic Phases Common to Aluminum Alloys as a Function of Solution pH."
Journal of the Electrochemical Society 155(3): C117-C126, (2008).
[152] R.P. Wei, C.M. Liao and M. Gao. "A Transmission Electron Microscopy Study of
Constituent-Particle-Induced Corrosion in 7075-T6 and 2024-T3 Aluminum Alloys."
Metallurgical and Materials Transactions A 29(4): 1153-1160, (1998).
[153] P. Leblanc and G.S. Frankel. "A Study of Corrosion and Pitting Initiation of
AA2024-T3 using Atomic Force Microscopy." Journal of the Electrochemical
Society 149(6): B239-B247, (2002).
[154] J.F. Li, Z. Ziqiao, J. Na and T. Chengyu. "Localized Corrosion Mechanism of
2×××-Series Al Alloy Containing S(Al2CuMg) and Θ′(Al2Cu) Precipitates in 4.0%
NaCl Solution at pH 6.1." Materials Chemistry and Physics 91(2): 325-329, (2005).
[155] M. Bethencourt, F.J. Botana, M.J. Cano, M. Marcos, J.M. Sánchez-Amaya and L.
Gonzalez-Rovira. "Behaviour of the Alloy AA2017 in Aqueous Solutions of NaCl.
Part I: Corrosion Mechanisms." Corrosion Science 51(3): 518-524, (2009).

187
[156] R.G. Buchheit, L.P. Montes, M.A. Martinez, J. Michael and P.F. Hlava. "The
Electrochemical Characteristics of Bulk-Synthesized Al2CuMg." Journal of the
Electrochemical Society 146(12): 4424-4428, (1999).
[157] S.J. Ketcham. "Polarization and Stress-Corrosion Studies of an Al-Cu-Mg Alloy."
Corrosion Science 7(6): 305-314, (1967).
[158] T. Aburada, J.M. Fitz-Gerald and J.R. Scully. "Pitting and Dealloying of Solute-
Rich Al-Cu-Mg-Based Amorphous Alloys: Effect of Alloying with Minor
Concentrations of Nickel." Journal of the Electrochemical Society 158(9): C253-
C265, (2011).
[159] M.B. Vukmirovic, N. Dimitrov and K. Sieradzki. "Dealloying and Corrosion of Al
Alloy 2024-T3." Journal of the Electrochemical Society 149(9): B428-B439, (2002).
[160] B. Mazurkiewicz and A. Piotrowski. "The Electrochemical Behaviour of the Al2Cu
Intermetallic Compound." Corrosion Science 23(7): 697-707, (1983).
[161] K. Nis¸ancioǦlu. "Electrochemical Behavior of Aluminum-Base Intermetallics
Containing Iron." Journal of the Electrochemical Society 137(1): 69-77, (1990).
[162] F. Keller and J.D. Edwards. "Composition and Properties of the Natural Oxide Film
on Aluminum." Metal Progress 54(2): 195-200, (1948).
[163] A.C. Fraker and A.W. Ruff Jr. "Observations of Hot Saline Water Corrosion of
Aluminum Alloys." Corrosion 27(4): 151-156, (1971).
[164] S.W. Smith Jr. and R.W. Latanision. "The Redistribution of Cathodic Activity on
an Aluminum Surface in Seawater upon the Introduction of Copper Ions" in
Corrosion 81. (1981): 1-15.
[165] N. Dimitrov, J.A. Mann and K. Sieradzki. "Copper Redistribution during Corrosion
of Aluminum Alloys." Journal of the Electrochemical Society 146(1): 98-102,
(1999).
[166] R.G. Buchheit, M.A. Martinez and L.P. Montes. "Evidence for Cu Ion Formation
by Dissolution and Dealloying the Al2CuMg Intermetallic Compound in Rotating
Ring-Disk Collection Experiments." Journal of the Electrochemical Society 147(1):
119-124, (2000).
[167] M. Whitaker. "A Review of Information on the Effect of Impurities on the
Corrosion Resistance of Aluminium. Part I: General Considerations." Metal Industry
80(10): 183-186, (1952).

188
[168] M. Whitaker. "A Review of Information on the Effect of Impurities on the
Corrosion Resistance of Aluminium. Part II: Aluminium." Metal Progress 80(11):
207-212, (1952).
[169] W.O. Kroenig. "Corrosion of Cast Aluminium Alloys." Transactions of the Central
Aero-Hydrodynamical Institute 91: 1-32, (1931).
[170] W.O. Kroenig. "The Corrosion of Duralumin as Affected by its Chemical
Composition." Transactions of the Central Aero-Hydrodynamical Institute 72: 1-99,
(1931).
[171] D.C.G. Lees. "Effect of Alloying Elements on Corrosion Resistance of Casting
Alloys: A Summary of Recent Investigations." Light Metals 14(162): 494-502,
(1951).
[172] A.M. Zossi, A.M. Torres, S.M. de De Micheli and H. Biloni. "Effect of
Solidification Microstructure on Corrosion Behavior of the Chill Zone in Aluminum
Binary Alloys." Metallurgical Transactions A 7(10): 1489-1496, (1976).
[173] V.S. Agarwala and Y.V.V.R.S. Murty. "Selective Corrosion Behavior of Al-4.5 Cu
Alloy in Sodium Chloride Solution" in Corrosion 75. (1975): 1-12.
[174] I.L. Muller and J.R. Galvele. "Pitting Potential of High Purity Binary Aluminium
Alloys. I. Al-Cu Alloys. Pitting and Intergranular Corrosion." Corrosion Science
17(3): 179-193, (1977).
[175] K. Sugimoto, Y. Sawada and S. Morioka. "Effects of Alloying Elements on the
Pitting Corrosion of Aluminum." Transactions of the Japan Institute of Metals 13(5):
345-351, (1972).
[176] N.D. Tomashov. "Behaviour of a Separate Local Cathode Under Conditions of
Oxygen Depolarization." Comptes Rendus (Doklady) de l'Académie des Sciences de
l'URSS 27(9): 983-986, (1940).
[177] H.M. Obispo, L.E. Murr, R.M. Arrowood and E.A. Trillo. "Copper Deposition
during the Corrosion of Aluminum Alloy 2024 in Sodium Chloride Solutions."
Journal of Materials Science 35(14): 3479-3495, (2000).
[178] M. Whitaker. "A Review of Information on the Effect of Impurities on the
Corrosion Resistance of Aluminium. Part III: Wrought Aluminium-Copper-
Magnesium Alloys (Al-Cu-Mg)." Metal Industry 80(12): 227-230, (1952).
[179] M. Whitaker. "A Review of Information on the Effect of Impurities on the
Corrosion Resistance of Aluminium. Part VIII: Cast Aluminum-Copper-Silicon and
Aluminium-Magnesium Alloys." Metal Industry 80(17): 331-332, (1952).

189
[180] L. Priester. Métaux: Corrosion-Industries 44(527/528): 259-260, (1969).
[181] L. Priester. "Influence of Impurities in Aluminium on its Behaviour in Cathodic
Polarization." Metals Abstracts 3: 35 0161, (1970).
[182] K. Nis¸ancioǦlu, K.Y. Davanger, O. Strandmyr and H. Holtan. "Cathodic Behavior
of Impure Aluminum in Aqueous Media." Journal of the Electrochemical Society
128(7): 1523-1526, (1981).
[183] T. Morinaga and H. Nagasawa. "Effect of various Elements on the Properties of
Duralumin. (the 4th Report.)." Journal of the Japan Institute of Metals 6(1): 45-56,
(1942).
[184] W. Bungardt and H. Grober. Metall (13/14): 217-220, (1948).
[185] W. Bungardt and H. Grober. "On the Influence of Zinc on some of the Properties of
Commercial Aluminium-Copper-Magnesium Wrought Alloys." Metallurgical
Abstracts 16: 538, (1949).
[186] K. Tohma, N. Takahashi and Y. Takeuchi. "Compound Effects of Additional Zn,
Cu and Mn on Electrochemical Properties and Corrosion Resistance of Aluminum."
Journal of Japan Institute of Light Metals 33(9): 518-526, (1983).
[187] K. Tohma, N. Takahashi and Y. Takeuchi. "Compound Effects of Additional Zn,
Cu and Mn on the Electrochemical Properties and Corrosion Resistance of
Aluminium." Aluminium 61(4): 277-279, (1985).
[188] M.V. Bhat and K.I. Vasu. "Stress Corrosion Characteristics of Al-5%Zn and Al-
5%Cu Alloys; Effect of Ti Addition." Journal of the Electrochemical Society of
India 30(3): 258, (1981).
[189] M.V. Bhat and K.I. Vasu. "Effect of Titanium Addition on the Activation
Parameters of Stress Corrosion Cracking in Al-5%Cu and Al-5%Zn Alloys." Journal
of the Electrochemical Society of India 31(3): 65-71, (1982).
[190] M.V. Bhat and K.I. Vasu. "Relevance of Microstructure to Stress Corrosion
Cracking in Al-5%Zn and Al-5%Cu Alloys Containing Titanium." Praktische
Metallographie 20(3): 130-137, (1983).
[191] M.V. Bhat and K.I. Vasu. "Electrochemical Aspects of Stress Corrosion Cracking
in Al-5%Zn and Al-5%Cu Alloys Containing Added Ti." Journal of the
Electrochemical Society of India 32(3): 245-251, (1983).
[192] M.V. Bhat and K.I. Vasu. "Strain Rate Sensitivity of Stress Corrosion Cracking in
Al-5%Cu and Al-5%Zn Alloys Containing Titanium." Transactions of the Indian
Institute of Metals 36(2): 101-105, (1983).

190
[193] T.Z. Kattamis. "Solidification Microstructure of Aluminium Alloys and its Effects
on Mechanical and Corrosion Behaviours" in Seventh International Light Metals
Congress, Leoben/Vienna, 22-26 June 1981. Aluminium-Verlag GmbH, (1981): 100-
102.
[194] J.R. Davis. Corrosion of Aluminum and Aluminum Alloys. ASM International,
Materials Park, O.H. (1999): 36-38,63,64,67-69,74,102-105,108-111.
[195] R.B. Mears, R.H. Brown and E.H. Dix Jr. "A Generalized Theory of Stress
Corrosion of Alloys" in Special Technical Publication 64: Symposium on Stress-
Corrosion Cracking of Metals. American Society for Testing Materials, Philadelphia,
P.A. (1945): 323-344.
[196] A. Garner and D. Tromans. "Direct Observation of Intergranular Corrosion in Al-
4wt% Cu Alloy." Corrosion 35(2): 55-60, (1979).
[197] P. Doig and J.W. Edington. "Use of Microelectrodes in the Study of Stress
Corrosion in Aged Al-7.2wt% Mg and Al-4.4wt% Cu Alloys." British Corrosion
Journal 9(2): 88-90, (1974).
[198] M. Tanaka, G. Girard, R. Davis, A. Peuto and N. Bignell. "Recommended Table for
the Density of Water between 0 °C and 40 °C Based on Recent Experimental
Reports." Metrologia 38(4): 301-309, (2001).
[199] M.L. Delgado, E.M. Ruiz-Navas, E. Gordo and J.M. Torralba. "Enhancement of
Liquid Phase Sintering through Al-Si Additions to Al-Cu Systems." Journal of
Materials Processing Technology 162-163: 280-285, (2005).
[200] J.M. Martin and F. Castro. "Sintering Response & Microstructural Evolution of an
Al-Cu-Mg-Si Premix." International Journal of Powder Metallurgy 43(6): 59-69,
(2007).
[201] L. Meluch. Warm Compaction of Aluminium Alloy Alumix 123. Ph.D. Thesis.
University of Birmingham, (2009).
[202] Aluminum: Properties and Physical Metallurgy. J.E. Hatch (Ed.). ASM
International, Materials Park, O.H. (1984): 70.
[203] D. Munson. "A Clarification of the Phases Occurring in Aluminium-Rich
Aluminium-Iron-Silicon Alloys, with Particular Reference to the Ternary Phase α-
AlFeSi." Journal of the Institute of Metals 95(7): 217-219, (1967).
[204] J.M. Martin and F. Castro. "Liquid Phase Sintering of P/M Aluminium Alloys:
Effect of Processing Conditions." Journal of Materials Processing Technology 143-
144: 814-821, (2003).
191
[205] S. Huo, B. Heath and D. Ryan. "Applications of Powder Metallurgy Aluminums for
Automotive Valve-Trains." SAE International Journal of Materials Manufacturing
1(1): 511-515, (2009).
[206] J.M. Capus. Metal Powders: A Global Survey of Production, Applications and
Markets 2001–2010. Elsevier, (2005): 127.
[207] L. Fedrizzi, J. Crousier, P.-L. Bonora and J.-P. Crousier. "Corrosion Mechanisms of
an AISI Type 316L Sintered Stainless Steel in Sodium Chloride Solution."
Werkstoffe und Korrosion 42(8): 403-409, (1991).
[208] M.C. Baran and B.A. Shaw. "Understanding Corrosion Modes of P/M Ferritic
Stainless Steels Encountered in Automotive Applications" in Corrosion 98. (1998):
1-15.
[209] E. Klar and P.K. Samal. Powder Metallurgy Stainless Steels: Processing,
Microstructures, and Properties. ASM International, Materials Park, O.H. (2007).
[210] I.L. Rosenfeld and I.K. Marshakov. "Mechanism of Crevice Corrosion." Corrosion
20(4): 115t-125t, (1964).
[211] A.I. Golubev, I.B. Ulanovskii and Y.M. Korovin. "Corrosion of Aluminum and
Titanium in Fissures" in Corrosion of Metals and Alloys (Korroziya Metallov i
Splavov) Collection No. 2. Israel Program for Scientific Translation, Jerusalem
(1967): 298-304.
[212] F.P. IJsseling. "Electrochemical Methods in Crevice Corrosion Testing." British
Corrosion Journal 15(2): 51-69, (1980).
[213] D.W. Siitari and R.C. Alkire. "Initiation of Crevice Corrosion. I. Experimental
Investigations on Aluminum and Iron." Journal of the Electrochemical Society
129(3): 481-487, (1982).
[214] O.V. Kurov. "Chloride Solution pH in Cracks during the Corrosion of Metals."
Protection of Metals 18(4): 517-518, (1982).
[215] R. Ambat and E.S. Dwarakasa. "The Influence of pH on the Corrosion of Medium
Strength Aerospace Alloys 8090, 2091 and 2014." Corrosion Science 33(5): 681-
690, (1992).
[216] R. Ambat and E.S. Dwarakasa. "Studies on the Influence of Chloride Ion and pH on
the Electrochemical Behaviour of Aluminium Alloys 8090 and 2014." Journal of
Applied Electrochemistry 24(9): 911-916, (1994).

192
[217] K.G. Watkins, Z. Liu, M. McMahon, R. Vilar and M.G.S. Ferreira. "Influence of
the Overlapped Area on the Corrosion Behaviour of Laser Treated Aluminium
Alloys." Materials Science and Engineering A 252(2): 292-300, (1998).
[218] D.P. Bishop, J.R. Cahoon, M.C. Chaturvedi, G.J. Kipouros and W.F. Caley. "On
Enhancing the Mechanical Properties of Aluminum P/M Alloys." Materials Science
and Engineering A 290(1-2): 16-24, (2000).
[219] P.H. Chong, Z. Liu, P. Skeldon and G.E. Thompson. "Large Area Laser Surface
Treatment of Aluminium Alloys for Pitting Corrosion Protection." Applied Surface
Science 208: 399-404, (2003).
[220] Z. Liu, P.H. Chong, A.N. Butt, P. Skeldon and G.E. Thompson. "Corrosion
Mechanism of Laser-Melted AA 2014 and AA 2024 Alloys." Applied Surface
Science 247(1): 294-299, (2005).
[221] Z. Liu, P.H. Chong, P. Skeldon, P.A. Hilton, J.T. Spencer and B. Quayle.
"Fundamental Understanding of the Corrosion Performance of Laser-Melted Metallic
Alloys." Surface & Coatings Technology 200(18): 5514-5525, (2006).
[222] X.L. Zhang, Z.H. Jiang, Z.P. Yao, Y. Song and Z.D. Wu. "Effects of Scan Rate on
the Potentiodynamic Polarization Curve obtained to Determine the Tafel Slopes and
Corrosion Current Density." Corrosion Science 51(3): 581-587, (2009).
[223] A.I. Golubev. Zhurnal Fizicheskoi Khimii 22: 591-601, (1948).
[224] W.D. Judge, D.P. Bishop and G.J. Kipouros. "Corrosion Behaviour of Alumix 123
P/M Alloy and AA2014-T6. Part I: OCP and Potentiodynamic Polarization."
Unpublished manuscript, (2015).

193
APPENDIX A FULL RESULTS OF CHEMICAL ANALYSES
Table A.1 – Full results of chemical analysis of AA2014.
Element Analysed (ppm)
Ag <5
Al (Difference) 923075
As <10
Ba <5
Be 0.1
Bi 321
Ca 60
Cd <5
Ce <5
Co <10
Cr 651
Cu 47339
Fe 3635
Ga 124
Ge <10
In <50
K <100
La <5
Li <10
Mg 4896
Mn 11458
Element Analysed (ppm)
Mo <10
Na 108
Nb <50
Ni 287
P <100
Pb 134
S <50
Sb <50
Se <50
Si 5602
Sn <50
Sr <5
Ta <50
Te <50
Ti 209
Tl <50
V 109
W <50
Zn 1958
Zr 36

194
Table A.2 – Full results of chemical analysis of Alumix 123.
Element Analysed (ppm)
Ag <2
Al 917097
As <50
Ba 10.5
Be 0.1
Bi <50
Ca 314
Cd <5
Ce <10
Co <5
Cr 11
Cu 45685
Fe 1116
Ga 86
Ge <100
In <100
K <50
La <5
Li <10
Mg 5211
Mn 28
Element Analysed (ppm)
Mo <10
Na 152
Nb <50
Ni 78
P 277
Pb 104
S 158
Sb <50
Se <50
Si 7955
Sn 173
Sr 1.0
Ta <25
Te <50
Ti 49
Tl <50
V 95
W <100
Zn 454
Zr 5

195
APPENDIX B FULL RESULTS OF PARTICLE SIZE ANALYSIS
Table B.1 – Full results of particle size analysis of Alumix 123.
Size (μm)
Volume
Density
(%)
Cumulative
Volume
(%)
1.13 0 0
1.28 0.07 0.07
1.45 0.09 0.16
1.65 0.09 0.25
1.88 0.11 0.36
2.13 0.10 0.46
2.42 0.12 0.58
2.75 0.14 0.72
3.12 0.15 0.87
3.55 0.18 1.05
4.03 0.20 1.25
4.58 0.23 1.48
5.21 0.27 1.75
5.92 0.31 2.06
6.72 0.37 2.43
7.64 0.43 2.86
8.68 0.52 3.38
9.86 0.62 4.00
11.2 0.71 4.71
12.7 0.79 5.50
14.5 0.85 6.35
16.4 0.86 7.21
18.7 0.83 8.04
21.2 0.75 8.79
24.1 0.66 9.45
Size (μm)
Volume
Density
(%)
Cumulative
Volume
(%)
27.4 0.60 10.05
31.1 0.65 10.70
35.3 0.89 11.59
40.1 1.36 12.95
45.6 2.12 15.07
51.8 3.17 18.24
58.9 4.41 22.65
66.9 5.73 28.38
76.0 6.98 35.36
86.4 7.96 43.32
98.1 8.57 51.89
111 8.70 60.59
127 8.34 68.93
144 7.57 76.50
163 6.51 83.01
186 5.30 88.31
211 4.06 92.37
240 2.95 95.32
272 2.00 97.32
310 1.29 98.61
352 0.75 99.36
400 0.40 99.76
454 0.18 99.94
516 0.06 100
586 0 100
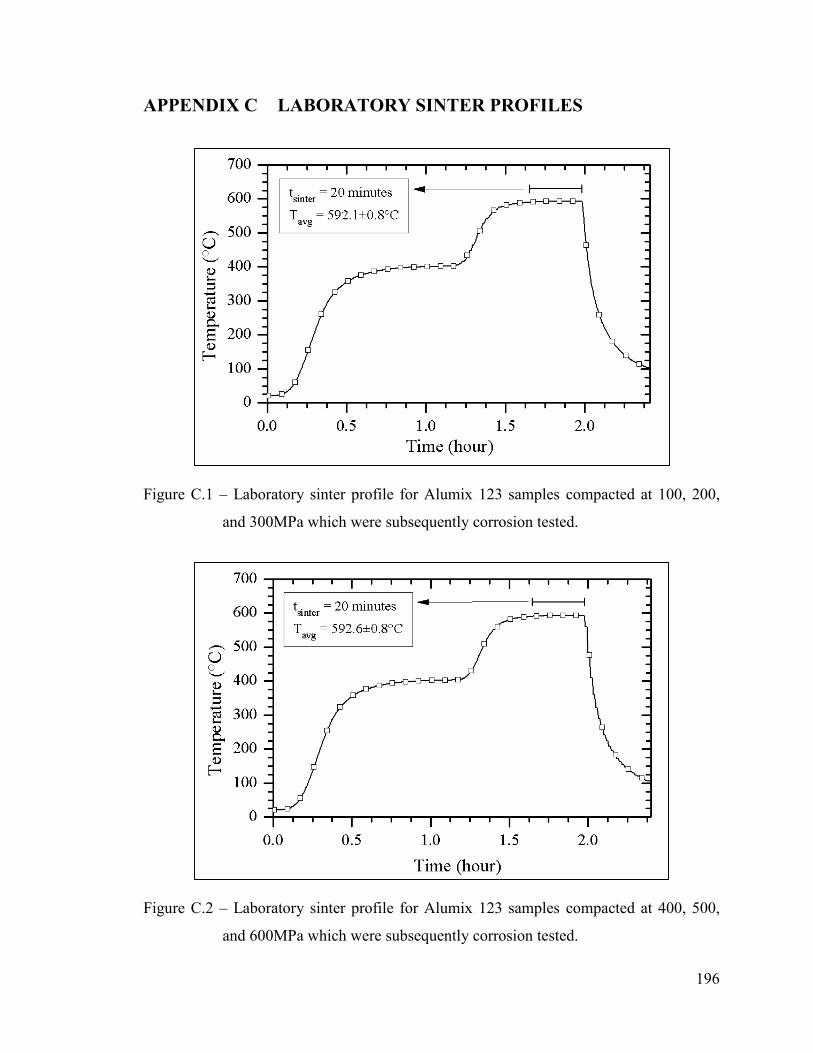
196
APPENDIX C LABORATORY SINTER PROFILES
Figure C.1 – Laboratory sinter profile for Alumix 123 samples compacted at 100, 200,
and 300MPa which were subsequently corrosion tested.
Figure C.2 – Laboratory sinter profile for Alumix 123 samples compacted at 400, 500,
and 600MPa which were subsequently corrosion tested.

197
APPENDIX D FULL RESULTS OF DENSITY, DIMENSION, AND
MASS CHANGE
Table D.1 – Green density of Alumix 123.
Compaction Pressure
(MPa)
Green Densitya No. of determinations
gcm–3 % theoreticalb
100 2.335±0.010 84.1±0.4 4
200 2.551±0.008 91.9±0.3 4
300 2.623±0.004 94.5±0.2 27
400 2.654±0.007 95.6±0.3 4
500 2.662±0.008 95.9±0.3 4
600 2.673±0.005 96.3±0.2 4 aValues are given as mean ± standard deviation bTheoretical density calculated as 2.777gcm–3
Table D.2 – Density of laboratory sintered Alumix 123.
Compaction Pressure
(MPa)
Sintered Densitya No. of determinations
gcm–3 % theoreticalb
100 2.303±0.012 82.9±0.4 2
200 2.448±0.031 88.2±1.1 2
300 2.522±0.030 90.8±1.1 5
400 2.526±0.045 91.0±1.6 2
500 2.537±0.033 91.4±1.2 2
600 2.533±0.035 91.2±1.3 2 aValues are given as mean ± standard deviation
bTheoretical density calculated as 2.777gcm–3
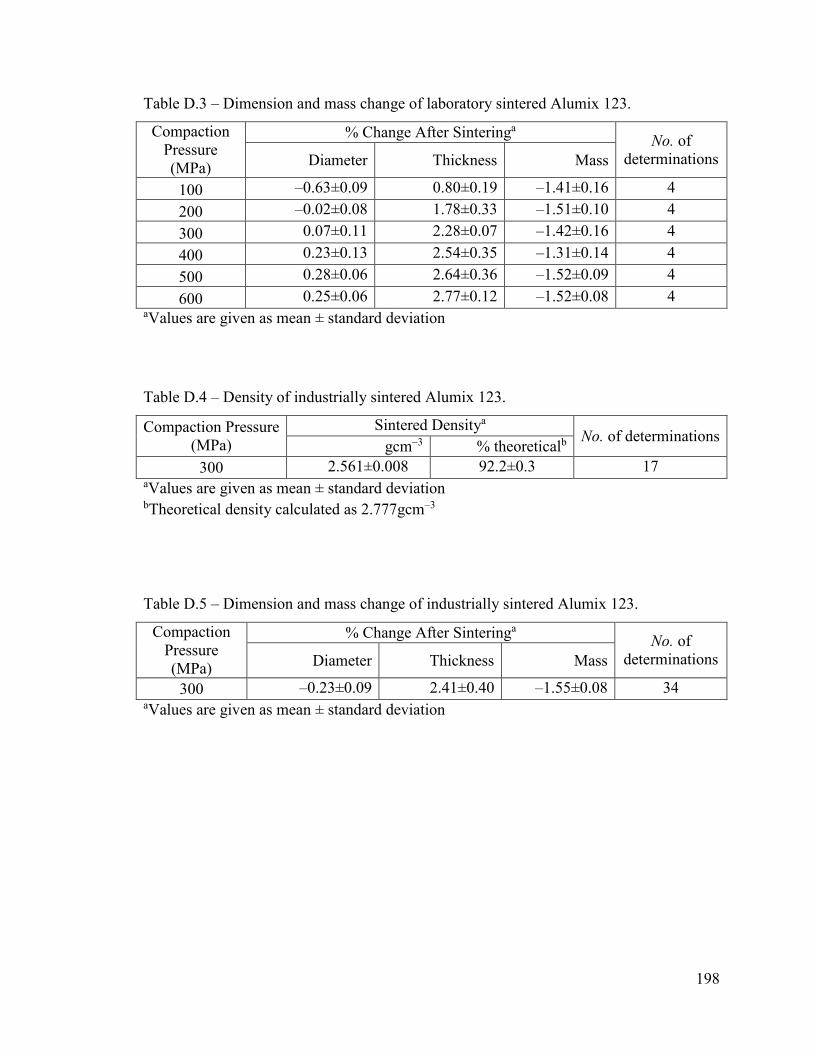
198
Table D.3 – Dimension and mass change of laboratory sintered Alumix 123.
Compaction
Pressure
(MPa)
% Change After Sinteringa No. of
determinations Diameter Thickness Mass
100 –0.63±0.09 0.80±0.19 –1.41±0.16 4
200 –0.02±0.08 1.78±0.33 –1.51±0.10 4
300 0.07±0.11 2.28±0.07 –1.42±0.16 4
400 0.23±0.13 2.54±0.35 –1.31±0.14 4
500 0.28±0.06 2.64±0.36 –1.52±0.09 4
600 0.25±0.06 2.77±0.12 –1.52±0.08 4 aValues are given as mean ± standard deviation
Table D.4 – Density of industrially sintered Alumix 123.
Compaction Pressure
(MPa)
Sintered Densitya No. of determinations
gcm–3 % theoreticalb
300 2.561±0.008 92.2±0.3 17 aValues are given as mean ± standard deviation
bTheoretical density calculated as 2.777gcm–3
Table D.5 – Dimension and mass change of industrially sintered Alumix 123.
Compaction
Pressure
(MPa)
% Change After Sinteringa No. of
determinations Diameter Thickness Mass
300 –0.23±0.09 2.41±0.40 –1.55±0.08 34 aValues are given as mean ± standard deviation

199
Table D.6 – Effect of sizing pressure on reduction in height of industrially sintered
Alumix 123.
Sizing Pressure
(MPa)
Reduction in Heighta
(%) No. of determinations
100 0.6±0.2 2
200 1.7±0.1 3
300 4.2±0.2 2
310 5.3±0.5 8
390 10.0±0.6 2
400 10.4±0.2 2
460 15.3±0.5 2
500 18.2±0.6 2
600 24.8±0.4 2 aValues are given as mean ± standard deviation

200
APPENDIX E FULL RESULTS OF EFFECT OF COMPACTION
PRESSURE ON CORROSION BEHAVIOUR OF
ALUMIX 123
Table E.1 – Effect of compaction pressure on electrochemical parameters of laboratory
sintered Alumix 123-T1.
Compaction
Pressure
(MPa)
Electrochemical Parametera
No. of
experiments Corrosion
Current
(μAcm–2)
Passive
Current
(μAcm–2)
Pitting
Potential
(mVSCE)
Repassivation
Potential
(mVSCE)
100 14.81±4.38 34.57±7.23 –699±4 –799±8 5
200 7.14±1.07 28.63±10.90 –693±3 –860±3 6
300 3.80±0.45 19.05±3.37 –693±6 –862±6 5
400 2.29±0.76 12.87±4.81 –699±3 –867±5 6
500 2.17±0.31 9.02±1.58 –695±5 –866±7 6
600 2.28±0.61 9.98±1.14 –699±4 –861±9 6 aValues are given as mean ± standard deviation
Table E.2 – Effect of compaction pressure on corrosion rate of laboratory sintered Alumix
123-T1.
Compaction Pressure
(MPa)
Corrosion Ratea,b,c
(mmyr–1)
100 0.1954±0.0578
200 0.0887±0.0133
300 0.0458±0.0055
400 0.0276±0.0092
500 0.0260±0.0037
600 0.0273±0.0074 aCalculated using sintered density bValues are given as mean ± standard deviation cThe propagated error from sintered density and corrosion current measurements is given


![T6 Locali nord-centro-sud [3780x594] Tavola T6 · Title U:\Rome\Projects \9\27\01\Outputs\Reports\110919_Consegna_Finale\Tavole DWG\T6 Locali nord-centro-sud [3780x594] Tavola T6](https://img.dokumen.tips/doc/110x75/605cc8f6174acb1ae71316a3/t6-locali-nord-centro-sud-3780x594-tavola-t6-title-uromeprojects-92701outputsreports110919consegnafinaletavole.jpg)