Embed Size (px)
Citation preview
Corrosion Behavior of Duplex StainlessSteels in Acidic-Chloride Solutions Studied
with Micrometer Resolution
Marc Femenia i Nobell
Doctoral Thesis
Department of Materials Science and EngineeringDivision of Corrosion ScienceRoyal Institute of Technology
SE- 100 44 Stockholm, Sweden
Stockholm 2003
ISRN KTH/MSE--03/08--SE+KORR/AVH
ISBN 91-7283-459-5
Doktorsavhandling
som med tillstånd av Kungliga Tekniska Högskolan i Stockholm framlägges till offentlig
granskning för avläggande av teknisk doktorsexamen, fredagen den 28 mars 2003, kl. 13:00 i
Kollegiesalen, Valhallavägen 79, Kungliga Tekniska Högskolan.
Fakultetsopponent är Dr. Roland Oltra, Laboratoire de Recherches sur la Réactivité des
Solides, UMR 5613, BP 47 870, 21078 Dijon Cedex, France.
Marc Femenia i Nobell (2003)
Corrosion Behavior of Duplex Stainless Steels in Acidic-Chloride SolutionsStudied with Micrometer Resolution
Department of Materials Science and Engineering, Division of Corrosion ScienceRoyal Institute of Technology, SE-100 44, Stockholm, Sweden
Abstract
The local corrosion behavior of duplex stainless steel (DSS) is affected by a wide
variety of factors. Localized corrosion of DSS frequently starts at micrometer scale inclusions
or precipitates, which are often segregated in the austenite-ferrite boundary regions.
Moreover, due to the partitioning of the key alloying elements of ferrite (Cr and Mo) and
austenite (N and Ni), the local interactions between the phases must also be considered.
The aim of this doctoral study was to increase the knowledge about the local
dissolution behavior of DSS in acidic-chloride environments. The recent developments of
new local probing techniques have opened a new frontier in corrosion science, providing
valuable local information not accessible in the past. The local techniques used include
electrochemical scanning tunneling microscopy (EC-STM), scanning probe force microscopy
(SKPFM), magnetic force microscopy (MFM), and scanning Auger electron Spectroscopy
(SAES), all with micrometer or sub-micrometer resolution.
With EC-STM, it was possible to monitor local dissolution processes on DSS in situ,
and in real time. MFM was capable of imaging the phase distribution in DSS without the need
of the traditional surface etching, while SKPFM revealed that the Volta potential difference
between the two phases was measurable and significant. SAES showed that the composition
gradient at the phase boundaries is narrower than 2 µm.
Different types of DSSs have been studied, from low-alloyed DSS to superduplex.
Higher contents of Cr, Mo and N strengthened both phases as well as the phase boundaries,
resulting in phases having similar corrosion resistance that showed a more uniform
dissolution behavior. However, the Volta potential difference between the phases proved to be
of the same order for all the DSSs studied. Austenite was in general associated to regions
displaying a more noble Volta potential than ferrite, resulting in a higher dissolution rate of
the ferrite next to the austenite phase.
Key words: In situ, local dissolution, electrochemical, STM, SKPFM, MFM, SAES, duplex
stainless steel, acidic-chloride solution.
PREFACE
The thesis includes the following papers, referred to in the text by their roman numerals.
I. In Situ Study of Selective Dissolution of Duplex Stainless Steel 2205 by
Electrochemical Scanning Tunnelling Microscopy
M. Femenia, J. Pan, C. Leygraf, and P. LuukkonenCorrosion Science, 43, 1939 (2001)
II. Corrosion Behavior of a Duplex Stainless Steel Studied by STM/AFM Based
Scanning Electrochemical Microscopy
J. Pan, M. Femenia, and C. LeygrafLocalized In Situ Methods for Investigating Electrochemical Interfaces, S. R.Taylor, A. C. Hillier, and M. Seo, Editors, PV 99-28 p. 131, The ElectrochemicalSociety Proceedings Series, Pennington, NJ (1999).
III. In Situ Local Dissolution of Duplex Stainless Steels in 1M H2SO4+ 1M NaCl by
Electrochemical Scanning Tunneling Microscopy
M. Femenia, J. Pan, and C. LeygrafJournal of The Electrochemical Society, 149, B187 (2002)
IV. Scanning Kelvin Probe Force Microscopy and Magnetic Force Microscopy for
Characterization of Duplex Stainless Steels
M. Femenia, C. Canalias, J. Pan, and C. LeygrafJournal of The Electrochemical Society, in press.
V. Characterization of Ferrite-Austenite Boundary Region of Duplex Stainless Steels
by Scanning Auger Electron Spectroscopy
M. Femenia, J. Pan, and C. LeygrafManuscript to be submitted
In addition, there is a conference contribution that has not been included in thethesis
In Situ Electrochemical STM Study of Dissolution Behavior of Duplex Stainless
Steels in Aggressive Solutions
M. Femenia, P. Luukkonen, J. Pan, and C. Leygraf
Proceedings of Duplex Stainless 2000, Venice, Italy, pp. 261-270, AssociazioneItaliana di Metallurgia (2000).

Table of contents
1. Introduction 1
2. Experimental 5
2.1. Materials and Solutions 5
2.2. Conventional Electrochemical Techniques 6
2.3. Electrochemical Scanning Tunneling Microscopy and
Scanning Electrochemical Microsocopy 7
2.4. Ex situ Microstructure Characterization 10
2.5. Magnetic Force Microscopy and
Scanning Kelvin Probe Force Microscopy 11
2.6. Scanning Auger Electron Spectroscopy 14
3. Summary of Results 16
3.1. Electrochemical Scanning Tunneling Microscopy 16
3.2. Scanning Kelvin Probe Force Microscopy 24
3.3. Scanning Auger Electron Spectroscopy 30
3.4. Scanning Electrochemical Microsocopy 33
4. Discussion 34
4.1. Local vs. Global Experiments 34
4.2. Combination of Local Probing Techniques 36
4.3. Influence of the Alloying Elements 39
4.4. Influence of the Phase Boundary Regions 41
5. Concluding Remarks 44
6. Considerations for the Future 46
7. Acknowledgements 47
8. References 50

1
1. INTRODUCTION
In the early 20th century, simultaneous research in USA, England and Germany lead
to the development of stainless steel. Monnard and Strauss in Germany, and Brearley in
England are often regarded as three of the most important pioneers.1, 2, 3 The first two-phase
microstructure was reported by Bain and Griffiths in 1927,4, 5 and shortly afterwards the first
duplex stainless steels (DSSs) were already commercially available.6 However, it was not
until the 1980’s, when the advent of AOD (Argon-oxygen decarburization) allowed the
fabrication of low-carbon stainless steels, that DSS found widespread industrial application.7
A steel is considered to be stainless when it contains more than 12% Cr,* which
makes possible the formation of a protective Cr-based passive film on the surface. DSS is
composed of two phases that are stainless, and present in relatively large separate volumes
and in approximately equal volume fractions.4, 5 The term DSS has become a synonym for the
ferritic-austenitic steels due to their extensive use in industrial applications, although it
technically also comprises other types of steels, such as the ferritic-martensitic.
DSS solidifies as ferrite, part of which transforms to austenite during subsequent
cooling, yielding the prescribed mix of the two phases at room temperature.8 The exact
volume fraction of each phase depends on the alloying composition and the heat treatment.
However, most alloys are designed to contain similar amounts of each phase at room
temperature.
Due to its small grain size, DSS possesses higher yield strength than both ferritic and
austenitic stainless steel. However, it is not the attractive mechanical properties that have
increased the interest for DSS in the past two decades, but the superior corrosion resistance,
especially in chloride-containing environments, compared to austenitic steel of comparable
cost.4, 5 Thus, DSS has been increasingly used in marine environments, and in oil and gas,
pulp and paper, chemical, petrochemical, and power industries. 4, 5, 8 This type of environments
* All compositions in this thesis are in wt%, unless noted
2
pose a challenge in terms of localized corrosion resistance, which has become one of the most
important issues for DSS. The resistance to localized corrosion is strongly dependent on the
chemical composition of the steel,4 Cr, Mo, and N being the most beneficial alloying
elements.
Localized corrosion often starts at small sites such as inclusions, precipitates, or
cracks that can be on a micrometer or sub-micrometer scale. Thus, the size and distribution of
precipitates and inclusions in the microstructure may play a crucial role in the corrosion
resistance of the material.9 This is especially important in the case of DSS, because the duplex
structure introduces anomalies in the distribution of impurities and precipitates, and as a
result, phase boundaries frequently become preferential sites for the segregation of impurities
or precipitations. 4, 5, 8 Moreover, the partitioning of the alloying elements between the phases
(Cr and Mo partition to ferrite, and N and Ni to austenite) 4, 5, 8, 10-18 further complicates the
corrosion behavior of DSS, since local interactions between the phases must also be taken into
account.10, 14-16 Consequently, it is easy to realize that a deeper knowledge of the local
electrochemical activity and the corrosion processes taking place on micrometer and sub-
micrometer scales would help to improve the understanding of the mechanisms behind
localized corrosion, leading to the development of better stainless steels.
Corrosion studies often involve the application of conventional electrochemical
techniques (potentiostatic, potentiodynamic, impedance, etc.) followed by subsequent ex situ
characterization by means of optical microscopy, scanning electron microscopy (SEM) or
surface analysis. These electrochemical methods are usually based on exposed electrode areas
of the order of one cm2, and are therefore not capable of providing direct information about
the local corrosion processes taking place on the sample. However, during the last decade or
so, numerous high-resolution experimental techniques have been developed for corrosion
studies, and many of them permit the characterization of the solid-liquid interface in situ.
Techniques used for local in situ studies of corrosion of stainless steels include
microelectrodes,19 microcells,18, 20, 21 localized electrochemical impedance spectroscopy
(LEIS),22, 23 scanning vibrating electrode technique (SVET)24, scanning reference electrode
3
technique (SRET),25, 26 scanning tunneling microscopy (STM),27, 28 atomic force microscopy
(AFM),29-33 scanning electrochemical microscopy (SECM),34-38 and scanning Kelvin probe
(SKP).39-41 Combinations of these techniques have also been reported.42-45 The SRET and
SVET techniques are capable of mapping the current density over the surface of the electrode,
and of distinguishing local potential differences with a lateral resolution of a few tens of
micrometers. The AFM/STM techniques can monitor changes in topography (3D) of the
sample with sub-micron resolution. The SECM technique can provide information about
surface species present, or map the local faradaic current over the surface of the sample, also
with sub-micron resolution. The SKP technique measures the Volta potential variation over
the surface of the electrode under a thin electrolyte layer with a resolution of 50-100 µm. An
AFM-based variation of this technique, scanning Kelvin probe force microscopy (SKPFM),
has recently been applied to corrosion studies,46-50 but, to our knowledge, nothing has yet been
reported on stainless steel. The main advantage of this technique over the standard SKP is its
high lateral resolution (in the sub-micron range), but the problem is that it cannot be used in
situ. In all, the information that can be obtained with local techniques is quite comprehensive,
and a combination of such techniques might be of invaluable importance for gaining
additional knowledge about corrosion processes.
Acidic-chloride environments are present in many commercial applications of DSS,
such as marine environments or chloride-bearing pressure vessels. Moreover, in localized
corrosion processes such as pitting and crevice corrosion, local environments inside the pits or
crevices often become acidified and enriched in chloride ions. Therefore, it seemed a highly
relevant medium in which to study the local corrosion behavior of DSS.
The primary aim of this project was to gain deeper understanding of the local
processes -electrochemical, chemical or physical- that may affect the corrosion resistance of
DSS in acidic-chloride environments. These processes are of vital importance for the
dissolution, passivation, and localized corrosion behavior of DSS, because they influence the
level of performance of these steels in real-life applications. Hence, there are obvious
technical and industrial interests; this project was implemented as a collaboration with our
4
industrial partners, AB Sandvik Steel and Avesta Polarit AB, in January 1998. An important
prerequisite was also the joint decision made by KTH and the Swedish Institute for Metals
Research, Stockholm, to purchase an AFM and a modification package for electrochemical
STM and SECM facilities to be shared by both parts.
This thesis surveys the work performed during the five years that have past since
these doctoral studies commenced. Section 2 provides the most significant technical details
about the materials and techniques used in these investigations. Section 3 gives an overview
of the results obtained with each technique, highlighting the most important findings. Section
4 integrates the results by discussing them from different perspectives. Finally, section 5 lists
the most important conclusions obtained from these investigations. More detailed information
can be found in the different publications that resulted from this work, which are annexed at
the end of the thesis. Papers I to III deal with in situ EC-STM measurements, Paper IV shows
the combination of MFM and SKPFM, and Paper V contains the results obtained by the
SAES measurements.

5
2. EXPERIMENTAL
2.1 Materials and Solutions
In the course of these studies, four different DSSs were investigated: 2205 (Paper I),
UNS S32750 (Papers II, III, IV and V), UNS S32304 (Papers III, IV and V), and UNS
S31803 (Papers III, IV and V). From Table I it is possible to see that these steels present a
broad variation of alloying elemental concentrations, ranging from the low-alloyed UNS
S32304 to the super duplex UNS S32750. The 2205 DSS in Paper I was a commercial alloy,
with the same nominal composition as UNS S31803, that had undergone a heat treatment in
order to obtain a coarser grain size (10-30 µm). For the other three steels, no further heat
treatment was needed because of the high resolution offered by the EC-STM.
Table I. Chemical composition of the DSSs investigated (wt%).*
Steel Cr Ni Mo N C Si Mn P S
UNS S32304 22.7 4.78 0.21 0.10 0.020 0.36 1.48 0.022 0.001
2205 22.1 5.59 2.99 0.13 0.025 0.41 1.51 0.020 0.001
UNS S31803 22.0 5.36 3.20 0.17 0.015 0.50 0.78 0.003 0.001
UNS S32750 24.8 6.95 3.84 0.27 0.014 0.27 0.44 0.003 0.001
These steels are commercially available and widely used in industrial applications
where high mechanical and corrosion resistance are needed. Important applications include
heat exchangers, refineries, and process systems in oil and gas industries. The steels belong to
the modern generation of low-carbon DSSs that have been designed so that the austenite re-
formation in the heat-affected zone adjacent to the weld occurs quickly, yielding welded
* UNS S32304, UNS S31803, and UNS S32750 were supplied by AB Sandvik Steel AB Sandvik Steel, and 2205
was supplied by Avesta Polarit AB.
6
joints with good mechanical and corrosion properties.51 In addition, UNS S32750 undergoes a
solution treatment that leads to equal PRE† values for the austenite and ferrite.44
The choice of acidic-chloride solutions was based on the relevance of this medium in
many commercial applications of DSS. In Paper I, two solutions were used; a 0.05 M H2S04 +
1M NaCl in order to simulate a relatively mild environment, and a 4M H2S04 + 1M HCl
solution (also used in Paper II) for simulating aggressive environments, or the type of solution
that might be found inside pits or crevices. In Papers III and IV, 1M H2SO4 + 1M NaCl was
chosen because the polarization curves of the three DSSs investigated showed clear active
peaks, and it was not too aggressive for the lower-alloyed steels.
2.2 Conventional Electrochemical Techniques
In parallel to the local measurements, conventional potentiostatic and
potentiodynamic measurements were carried out in order to characterize the global behavior
of the different materials in the solutions tested. Potentiostatic experiments are used for
assessing the corrosion behavior of a sample at a given potential. In this type of
measurements, a potential is applied to the sample and held constant, while the resulting
current is measured as a function of time (e.g. Figure 4, Paper I). On the other hand,
potentiodynamic measurements show the behavior of the sample over a whole range of
potentials (e.g. Figure 3, Paper I). In this case, the potential is swept at a fixed sweep rate,
while the resulting current is measured continuously. In these studies, the sweep was started at
cathodic potentials (i.e., negative to the open-circuit potential) and increased until a preset
limit was reached. The sweep rate is an important parameter in potentiodynamic polarization
measurements, because it influences the resulting current. Slower sweep rates yield usually
lower current values at all potentials of the polarization curve, especially in the passive
region.52 In this thesis, all potentiodynamic measurements were carried out with a sweep rate
of 20 mV/min.
† Pitting Resistance Equivalent, PRE = %Cr + 3.3 %Mo + k %N, where 10<k<30.
7
The conventional electrochemical experiments were performed using an EG&G
273A Potentiostat-Galvanostat system controlled by a Model 352 Corrosion Software. The
electrochemical cell used represented a standard three-electrode configuration, with a Pt
counter electrode and an Ag/AgCl reference electrode.
2.3 Electrochemical Scanning Tunneling Microscopy
and Scanning Electrochemical Microscopy
The instrument used for the main body of EC-STM measurements was originally an
AFM (Quesant Resolver). Modifications of this instrument permitting STM and SECM
measurements had been reported in literature, for which it seemed an optimal choice.36-38 The
AFM scanning-head was replaced by another head modified for STM and SECM
measurements, and controlled by an additional control unit and software. The advantage of
this set-up is that STM and SECM measurements can be performed on the same area and with
the same tip by just switching some software parameters. The change of the instrumental
mode can even be performed in situ during the course of an experiment, which permits an
easy combination of the two techniques.
The system was placed inside a steel-cased refrigerator standing on thick rubber
plates. This configuration isolates the system from electrical and acoustic noise as well as
from thermal variations and mechanical vibrations, for which all scanning probe microscopy
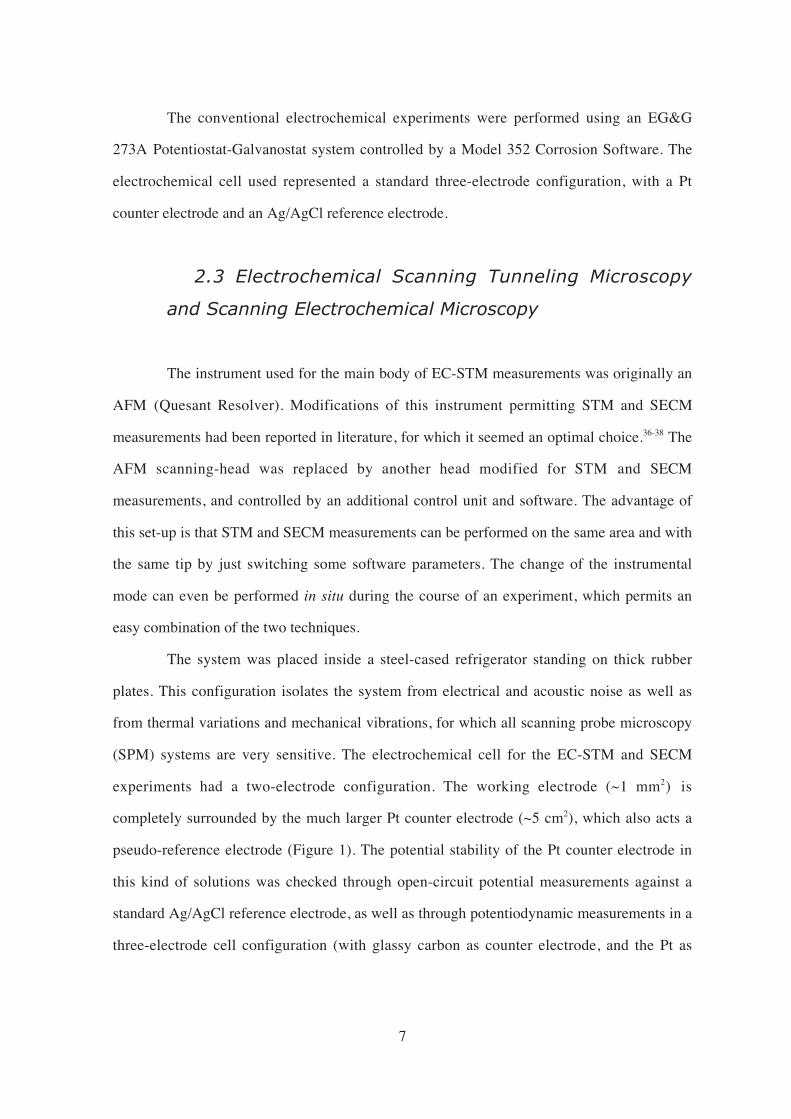
(SPM) systems are very sensitive. The electrochemical cell for the EC-STM and SECM
experiments had a two-electrode configuration. The working electrode (~1 mm2) is
completely surrounded by the much larger Pt counter electrode (~5 cm2), which also acts a
pseudo-reference electrode (Figure 1). The potential stability of the Pt counter electrode in
this kind of solutions was checked through open-circuit potential measurements against a
standard Ag/AgCl reference electrode, as well as through potentiodynamic measurements in a
three-electrode cell configuration (with glassy carbon as counter electrode, and the Pt as

8
working electrode). The results were considered satisfactory and legitimated the use of Pt as
pseudo reference electrode in the EC-STM experiments.
Figure 1. EC-STM/SECM cell configuration.
In this system, the tip is electrically connected to the counter electrode, therefore, the
bias voltage between the tip and the surface is equal to the potential difference between the
working and counter electrodes. The bias voltage is regulated through the software and
controlled by the additional control unit.
The tips were made from a Ø 0.25 mm Pt-20%Ir wire. The wire was first cut and
soldered to a tip holder, after which it was electrochemically etched in a saturated CaCl2
solution by applying 30 V AC. The tip could be sharpened further by etching it in a saturated
NaHSO4 solution and applying 7 V AC. After the sharpening process, the tip was insulated
with lacquer so that only the very end was exposed to solution.

9
2.3.1 Scanning Tunneling Microscopy
STM is based on quantum mechanical tunneling, a phenomenon that occurs when
electrons pass between solids without having to cross an activation energy barrier.53 In STM,
tunneling occurs when a sharp conductive tip is brought close enough (0.3-1 nm) to a
conducting surface, and a bias voltage is applied between them.54, 55 The topographic
information is obtained when the tip is scanned over the surface of the sample and a feedback
circuit adjusts the vertical position of the tip, so that the tunneling current (and therefore the
tip-sample distance) is maintained constant (Figure 2a).
In the EC-STM experiments the cell was filled with solution so that the sample
surface was covered by a solution layer approximately 3 mm thick. Then, the sample was left
one hour in order to allow the stabilization of Ecorr, which was measured and entered in the
software as the bias voltage. After connecting the cell to the STM system, the imaging of the
surface could begin. The samples were imaged from Ecorr to higher anodic potentials,
acquiring three images at each potential. Since the acquisition time for each image was 5
minutes, the sample was held 15 minutes at each potential.
Figure 2. Diagram of the working principle of (a) STM and (b) SECM.

10
2.3.2 Scanning Electrochemical Microscopy
In SECM, an ultramicroelectrode tip is scanned over the surface of the sample, and
the current collected can be used in a variety of ways. In fact, almost any type of
electrochemical measurement can be performed with SECM, with the advantage of a greatly
improved lateral resolution.34, 56
In this system, the tip is electrically connected to the counter electrode so that it is
possible to image, with sub-micron resolution, the electrochemical current originating from
the local corrosion processes taking place on the electrode surface. Another advantage of this
set up is that the current signals from both the tip and the large counter electrode are recorded.
Hence, it is possible to simultaneously obtain both local and global information about the
electrochemical activity of the sample.
The SECM experiments were usually performed in combination with EC-STM
measurements by just changing the instrument mode in the software. This disabled the
feedback system (Figure 2b), which had the advantage of making possible higher scan rates.
In SECM mode, the acquisition time for each image was only 30 seconds.
2.4 Ex situ Microstructure Characterization
EC-STM provides very interesting information about the corrosion processes taking
place on a local scale, but its ability to estimate the global corrosion behavior of the sample is
limited. Therefore, it is important to characterize the sample by complementary techniques
after the in situ experiments have been finished. Subsequent ex situ characterization of the
sample not only permits a more certain identification of the phases, but also yields
complementary information about the processes that might have taken place on the overall
surface during the experiment. This information can then be used as a link between the global
information given by the conventional electrochemical techniques and the local information
yielded by EC-STM.

11
After the EC-STM experiments, the sample was investigated by means of optical
microscopy and SEM in order to identify the phases observed and to confirm the observations
made during the local experiments. Samples that had undergone potentiodynamic polarization
were also characterized ex situ for comparison with the samples that had been used for EC-
STM. The microstructure of non-exposed samples was used as a reference for these
characterizations.
2.5 Magnetic Force Microscopy and Scanning Kelvin
Probe Force Microscopy
The MFM and SKPFM measurements in Paper IV were performed with a
commercial AFM, MultiMode Nanoscope IV (Digital Instruments) located at the Division
of Nanostructure Physics, Royal Institute of Technology, KTH. The versatility of this
instrument allows, in a two-pass procedure, to measure a second signal in addition to AFM
surface topography. For MFM and SKPFM measurements, this is possible by using CoCr-
coated tips. This set-up allows a very easy combination of the two techniques by simply
changing some software parameters.
2.5.1 Magnetic Force Microscopy
MFM is a member of the large family of SPMs derived from the invention of STM.
In MFM, the magnetic fields adjacent to a sample are detected with sub-micron resolution by
scanning a magnetic probe over the surface and recording the changes in its phase or resonant
frequency.57 In these studies, the CoCr-coated tip was magnetized in the direction
perpendicular to the sample surface.
Once set in place in the instrument, the tip is oscillated at its resonant frequency by a
piezoelectric element, and scanned over the sample surface. The topography of the sample
12
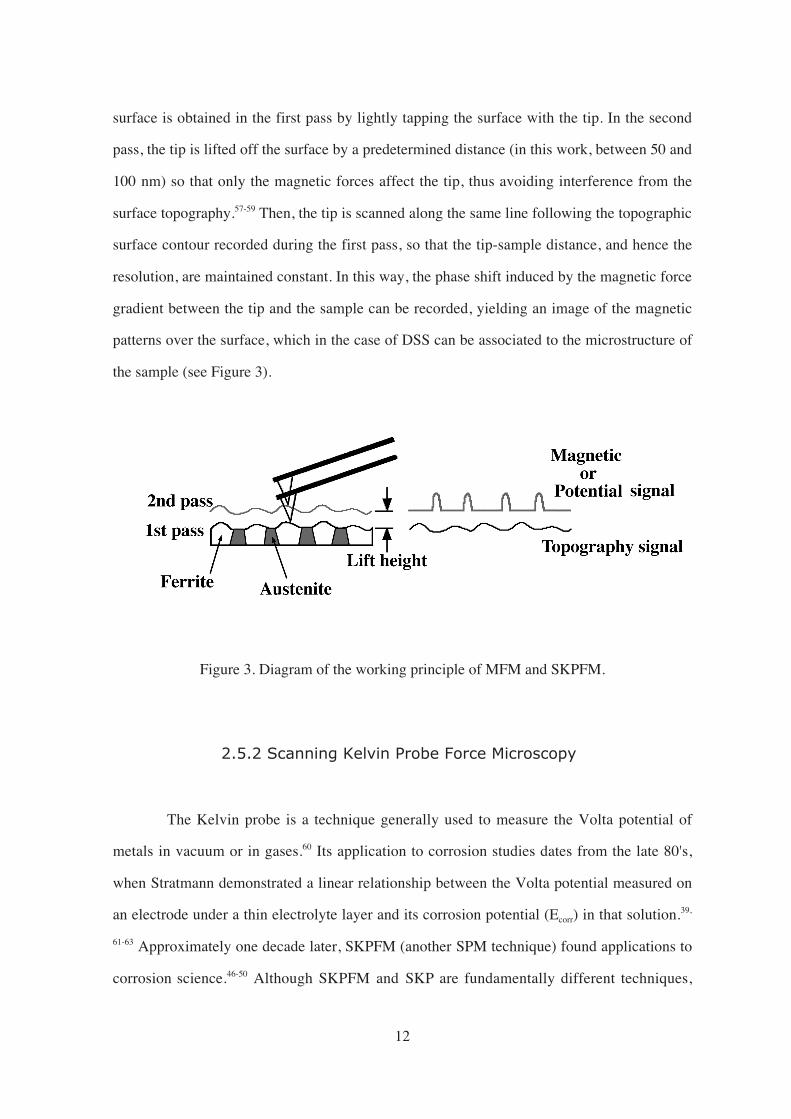
surface is obtained in the first pass by lightly tapping the surface with the tip. In the second
pass, the tip is lifted off the surface by a predetermined distance (in this work, between 50 and
100 nm) so that only the magnetic forces affect the tip, thus avoiding interference from the
surface topography.57-59 Then, the tip is scanned along the same line following the topographic
surface contour recorded during the first pass, so that the tip-sample distance, and hence the
resolution, are maintained constant. In this way, the phase shift induced by the magnetic force
gradient between the tip and the sample can be recorded, yielding an image of the magnetic
patterns over the surface, which in the case of DSS can be associated to the microstructure of
the sample (see Figure 3).
Figure 3. Diagram of the working principle of MFM and SKPFM.
2.5.2 Scanning Kelvin Probe Force Microscopy
The Kelvin probe is a technique generally used to measure the Volta potential of
metals in vacuum or in gases.60 Its application to corrosion studies dates from the late 80's,
when Stratmann demonstrated a linear relationship between the Volta potential measured on
an electrode under a thin electrolyte layer and its corrosion potential (Ecorr) in that solution.39,
61-63 Approximately one decade later, SKPFM (another SPM technique) found applications to
corrosion science.46-50 Although SKPFM and SKP are fundamentally different techniques,

13
Frankel et al. proved that the signal measured by SKPFM on an emersed electrode can also be
related to its Ecorr in that solution.46, 48 However, the interpretation of the measured Volta
potential is not straightforward, since it is difficult to relate the Volta potential measured in air
to the Ecorr measured in solution because of their different physical origins. In these studies,
the focus has been on using the Volta potential variation as a qualitative measure of the
practical nobility, rather than trying to obtain absolute values for quantitative evaluations of
the corrosion processes.
In the SKPFM measurements, the topography of the sample is obtained in the first
pass, as described above for MFM. In the second pass, however, the tip is lifted 100 nm so
that it is placed in the region where the Volta potential is independent of the tip-sample
distance,46, 48 which also prevents the interference of topographic features on the potential
image.64 In this case, the mechanical oscillation of the tip is suppressed by turning off the
piezoelectric element that usually drives it, and instead an oscillating AC voltage (± 3V) is
applied to the tip. Consequently, if there is a potential difference between the tip and the
sample (Vts), an oscillating electric force will act on the tip, causing it to vibrate. If a DC
voltage equal in magnitude (but opposite in sign) to Vts is applied to the tip, the potential
difference will be cancelled and the tip will stop oscillating. This DC voltage is then recorded
and used to construct a map of the surface potential. Since this is a nulling technique, the
output signal from the instrument needs to be inverted in order to obtain the right polarity of
the potential measured. The potential values obtained are referred to the tip, and since its
potential may vary with changes in the metal coating, it cannot be used as an absolute
reference electrode. 46, 48, 65 Therefore, the values obtained can only be used to make
quantitative comparisons within the same image.
The main disadvantage of this technique is that the large voltages applied to the tip
do not permit measurements in aqueous environments, because they would trigger
electrochemical reactions. Thus, all SKPFM measurements presented in this thesis were
carried out in air.

14
2.6 Scanning Auger Electron Spectroscopy
In SAES, the sample is bombarded by an electron beam that ejects electrons from a
core level of the surface atoms. The core hole is then filled by an electron from a higher
energy level. The energy liberated by this de-excitation is taken by a third electron, which is
ejected from the atom with a characteristic energy. The ejected electron, known as Auger
electron, is surface specific, giving chemical information only from the outermost atom
layers.66
The equipment used in these studies was a Perkin-Elmer Physical Electronics PHI
590, located at the Department of Physics, Chalmers University of Technology in
Gothenburg. The primary beam energy used was 3 kV, with a primary electron beam current
of 50 nA, which yielded a spot size (resolution) of approximately 1 µm. The electron gun
bombarded the surface at 45°. In order to remove surface contamination, an Ar+ gun was
operated at 3 kV with a beam current of 0.5 µA.
Before the measurements, a sputter depth profile was obtained for each sample by
sputtering a region of approximately 1 x 1 mm until the oxygen signal had completely
disappeared. In this way, it was possible to determine the thickness of the oxide film,
considered to be the sputter depth at which the concentration of oxygen drops to half of its
value at the surface.67 The time needed to sputter away the air-formed oxide film was noted,
and another region of the sample was sputtered during the same amount of time. In this way,
the subsequent SAES measurements could be performed on the surface alloy layer at the
oxide/metal interface.
The results from the SAES measurements presented in this thesis consist of
concentration line-profiles for Cr, Ni, Mo and N obtained across the ferrite-austenite phase
boundary. The line-profiles performed were 12 µm long, containing 30 measuring points
evenly spaced every 0.4 µm. The measuring time for each line-profile was approximately one
hour. In order to decrease the statistic uncertainty, the line-profile measurements were
repeated three times for each sample and their result was averaged. Due to background noise,

15
the line-profiles of some elements with low concentration (N and Mo for UNS S32304, and N
for UNS S31803), yielded negative concentration values despite the fact that the difference in
concentration of the element between the phases was detectable.
16
3. SUMMARY OF RESULTS
3.1 Electrochemical Scanning Tunneling Microscopy
3.1.1 UNS S32750 and 2205 in 4M H2S04 + 1M HCl
The dissolution behavior of a coarse-grained 2205 DSS (Paper I) and of UNS
S32750 (Paper II) was investigated in 4M H2S04 + 1M HCl. The main difference in
composition between these steels lies in their Cr, Mo and N contents (see Table I). It is known
that the addition of these elements to stainless steels depresses active dissolution and reduces
the passive current density.68 In this solution, however, the effect of the alloying elements in
the active potential region could not be discerned when comparing their potentiodynamic
polarization curves (Figure 1, Paper II).
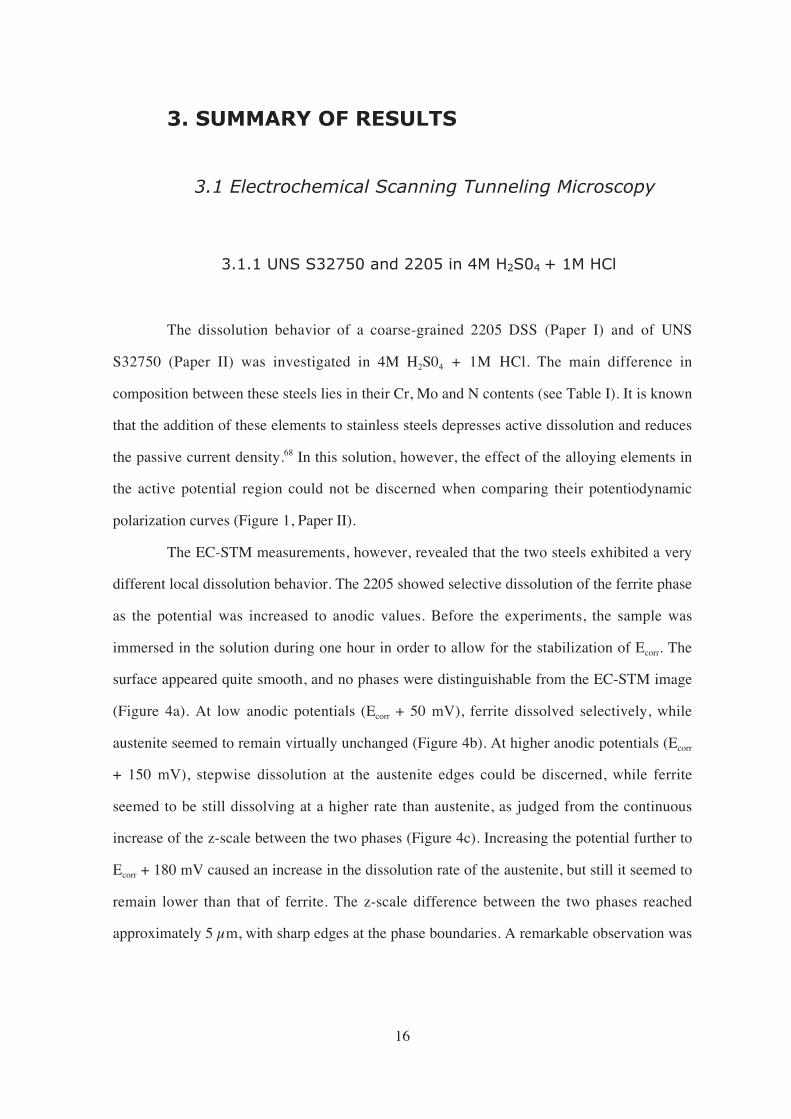
The EC-STM measurements, however, revealed that the two steels exhibited a very
different local dissolution behavior. The 2205 showed selective dissolution of the ferrite phase
as the potential was increased to anodic values. Before the experiments, the sample was
immersed in the solution during one hour in order to allow for the stabilization of Ecorr. The
surface appeared quite smooth, and no phases were distinguishable from the EC-STM image
(Figure 4a). At low anodic potentials (Ecorr + 50 mV), ferrite dissolved selectively, while
austenite seemed to remain virtually unchanged (Figure 4b). At higher anodic potentials (Ecorr
+ 150 mV), stepwise dissolution at the austenite edges could be discerned, while ferrite
seemed to be still dissolving at a higher rate than austenite, as judged from the continuous
increase of the z-scale between the two phases (Figure 4c). Increasing the potential further to
Ecorr + 180 mV caused an increase in the dissolution rate of the austenite, but still it seemed to
remain lower than that of ferrite. The z-scale difference between the two phases reached
approximately 5 µm, with sharp edges at the phase boundaries. A remarkable observation was
17
that the ferrite at the phase boundary region seemed to dissolve at a greater rate than the
ferrite in the bulk.
Figure 4. In situ EC-STM images of 2205 in 4M H2S04 + 1M HCl.
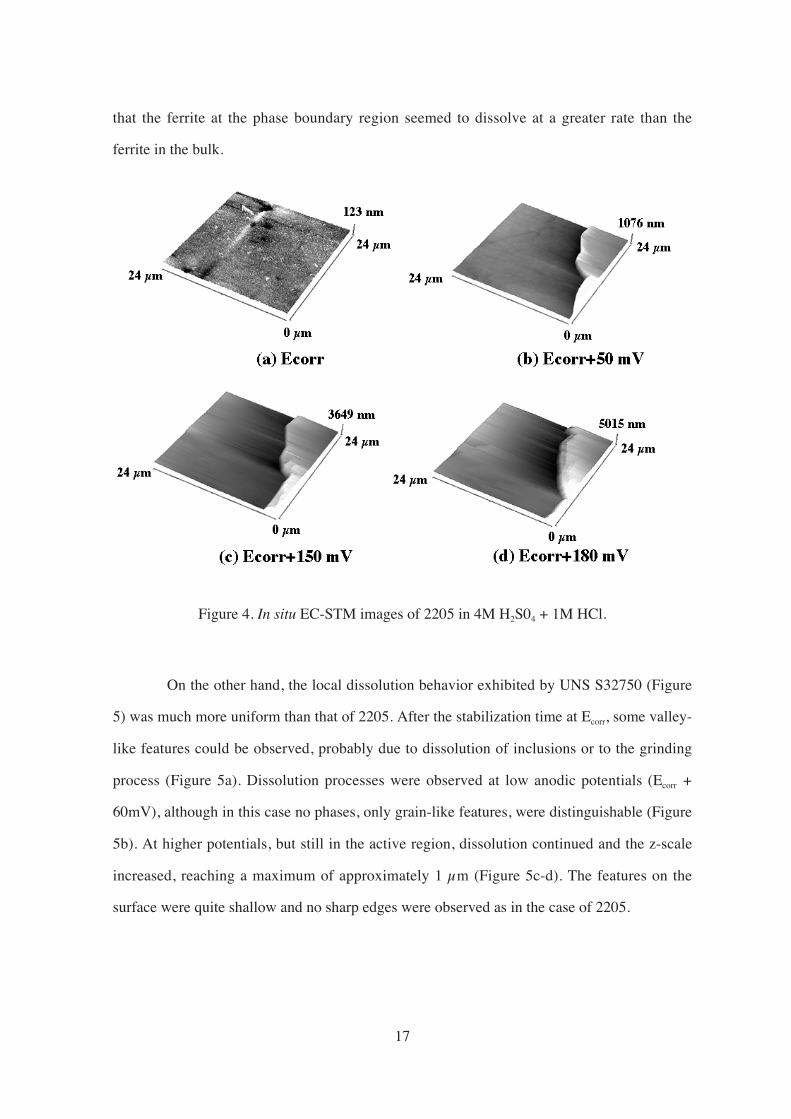
On the other hand, the local dissolution behavior exhibited by UNS S32750 (Figure
5) was much more uniform than that of 2205. After the stabilization time at Ecorr, some valley-
like features could be observed, probably due to dissolution of inclusions or to the grinding
process (Figure 5a). Dissolution processes were observed at low anodic potentials (Ecorr +
60mV), although in this case no phases, only grain-like features, were distinguishable (Figure
5b). At higher potentials, but still in the active region, dissolution continued and the z-scale
increased, reaching a maximum of approximately 1 µm (Figure 5c-d). The features on the
surface were quite shallow and no sharp edges were observed as in the case of 2205.

18
Figure 5. In situ EC-STM images of UNS S32750 in 4M H2S04 + 1M HCl.
3.1.2 UNS S32304, UNS S31803, and UNS S32750 in
1M H2S04 + 1M NaCl
The local dissolution behavior of UNS S32304, UNS S31803, UNS S32750 in 1M
H2S04 + 1M NaCl was studied in Paper III. The polarization curve of each steel showed a
clear active current peak at low anodic potentials, and a passive region at higher potentials. In
this case, the polarization curves of the steels did reflect the variation in the content of
alloying elements (Figure 3, Paper III). As the content of alloying elements increased in the

19
steel, the Ecorr shifted to more noble potentials, and the critical and passive current densities
decreased, indicating a significant increase in corrosion resistance.
The three steels exhibited also a different dissolution behavior at the local scale, and
the EC-STM experiments provided additional information about how the dissolution
processes actually took place. During the EC-STM measurements, the UNS S32304 samples
exhibited pitting-like dissolution from potentials as low as Ecorr + 110 mV, still in the active
region. This phenomenon was not seen in the potentiodynamic measurements, probably
because of the shorter measurement times, whereby pitting-like dissolution would not have
time to develop.
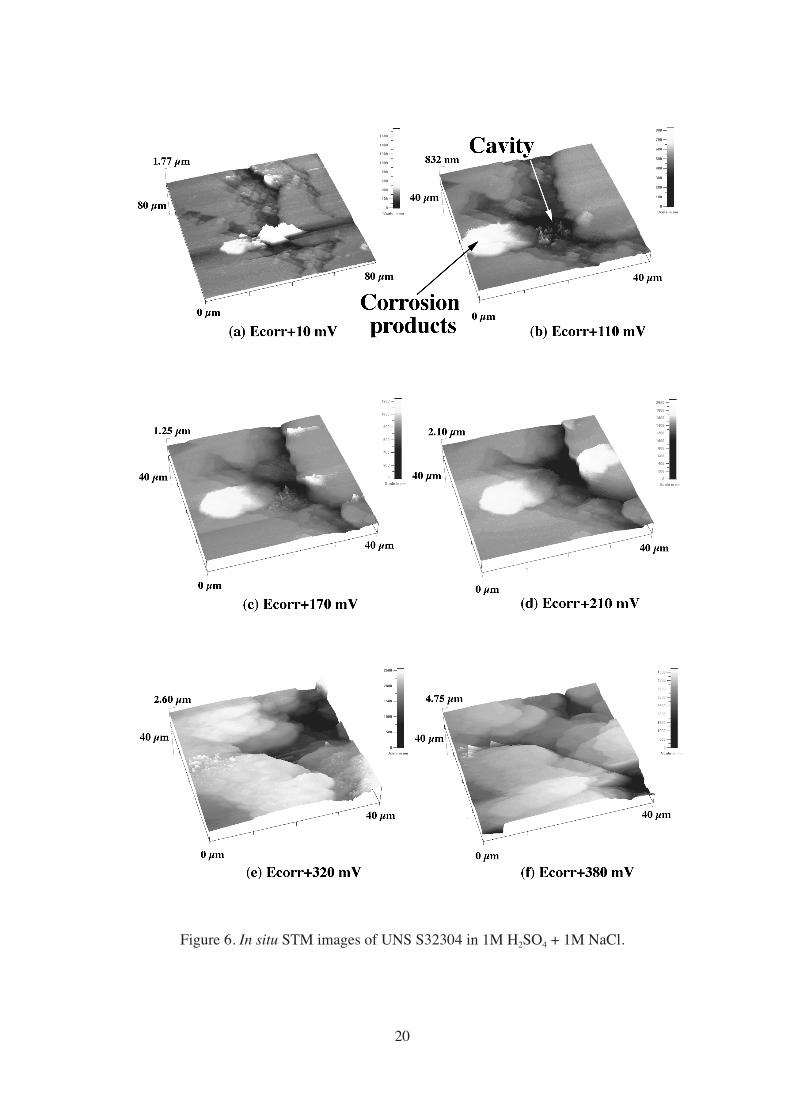
Figure 6 shows a series of in situ images of UNS S32304 at increasing anodic
potentials in the active range. In order to let Ecorr stabilize, the sample was immersed during
one hour in the solution, after which selective dissolution of the ferrite phase could be clearly
seen. At Ecorr + 10 mV, the dissolution of a non-metallic inclusion yielded a cavity, and re-
deposited dissolution products could be distinguished on its left edge (Figure 6a). The cavity
remained stable until Ecorr + 110 mV (Figure 6b), when it began growing both laterally and in
depth (Figure 6c-d). At Ecorr + 320 mV the cavity drastically expanded, and at higher
potentials the surface roughened considerably due to the nucleation and growth of pits (Figure
6e-f). Once the measurement was terminated, the surface appeared heavily corroded, being
impossible to identify the phases through ex situ characterization. This was probably because
the sample remained polarized at high potentials for a few hours, which enabled the
nucleation and growth of numerous pits over almost the whole surface.
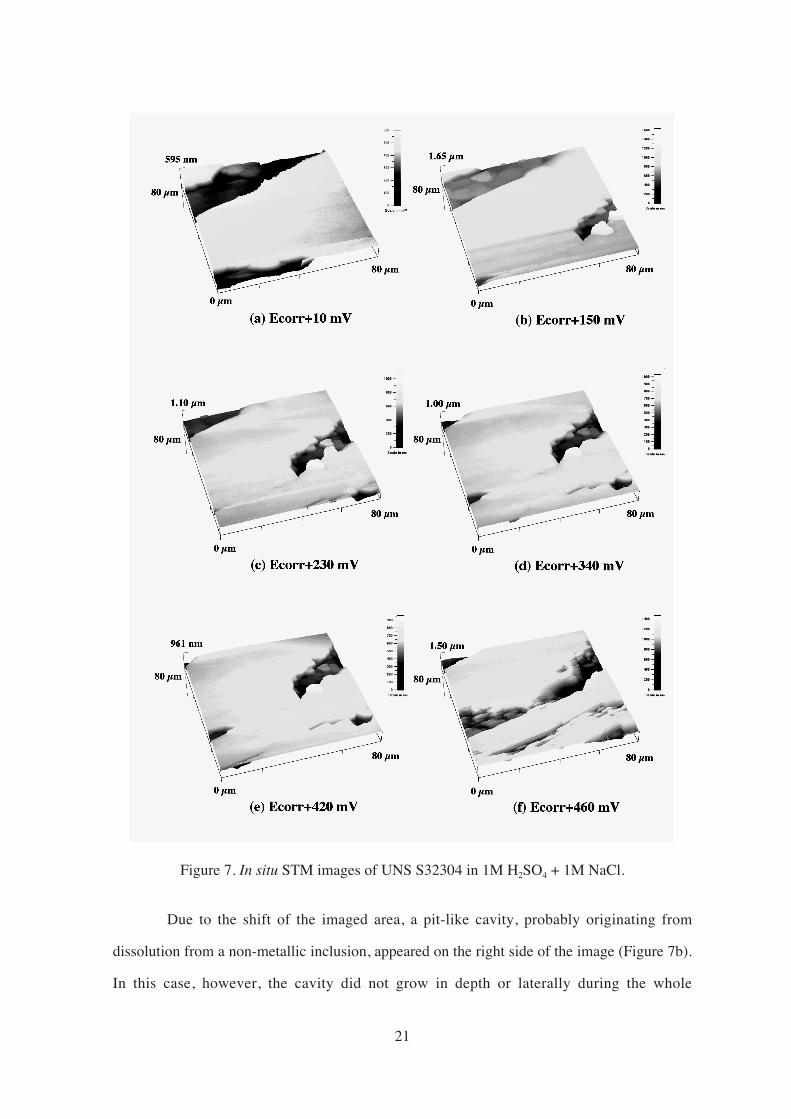
In another experiment series, a quite different local behavior of UNS S32304 was recorded.
After immersion for one hour at Ecorr, it was possible to distinguish the two phases due to the
selective dissolution of ferrite (Figure 7a). For some unknown reason, the images in this series
drifted from the starting area, i.e. not exactly the same area was imaged during the whole
experiment, although some features were recognizable in all the images. At low anodic
potentials, up to Ecorr + 90 mV, the ferrite phase seemed to be dissolving at a slightly higher
rate than austenite, which remained virtually unchanged.
20
Figure 6. In situ STM images of UNS S32304 in 1M H2SO4 + 1M NaCl.
21
Figure 7. In situ STM images of UNS S32304 in 1M H2SO4 + 1M NaCl.
Due to the shift of the imaged area, a pit-like cavity, probably originating from
dissolution from a non-metallic inclusion, appeared on the right side of the image (Figure 7b).
In this case, however, the cavity did not grow in depth or laterally during the whole
22
experiment. At higher anodic potentials, up to Ecorr + 420 mV, the z-scale difference decreased
slightly, suggesting that in this potential range austenite was dissolving at a somewhat higher
rate than ferrite (Figure 7b-e). At Ecorr + 460 mV, the topography of the surface experienced a
sudden modification, which may have been related to the active-passive transition (Figure 7f).
Subsequent ex situ examination revealed selective dissolution of ferrite and of the phase
boundaries, as well as significant pitting-like attacks at other locations over the surface.
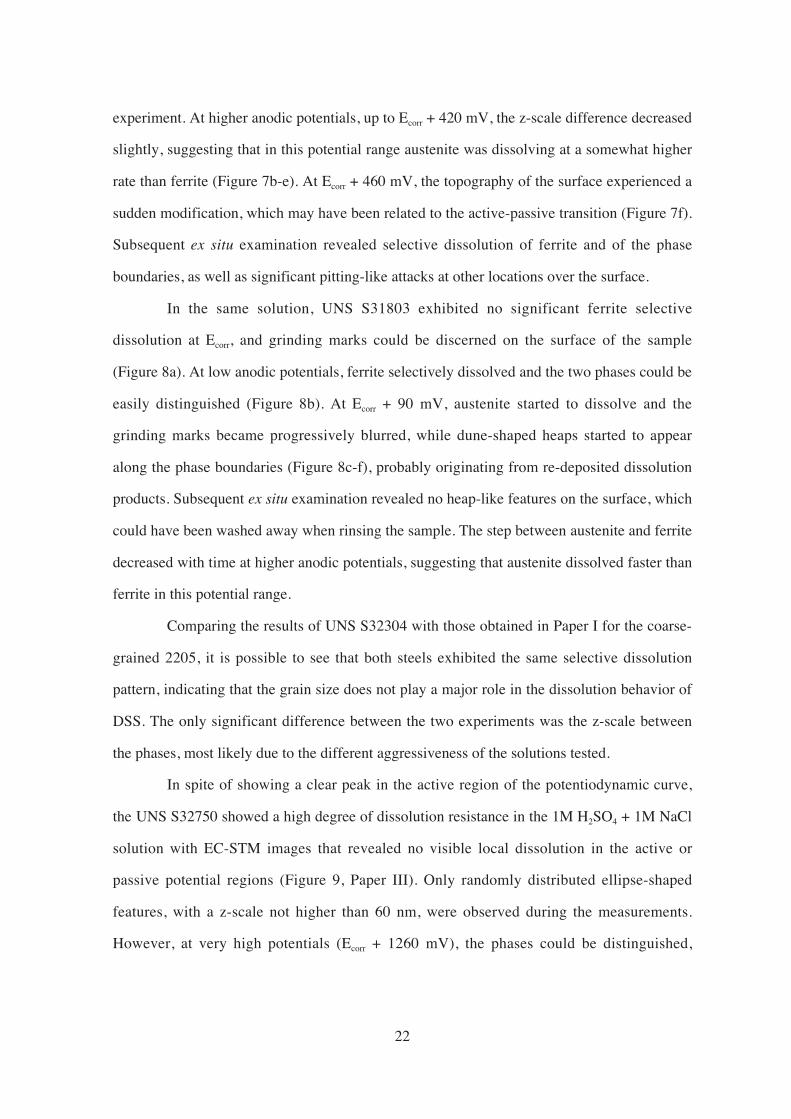
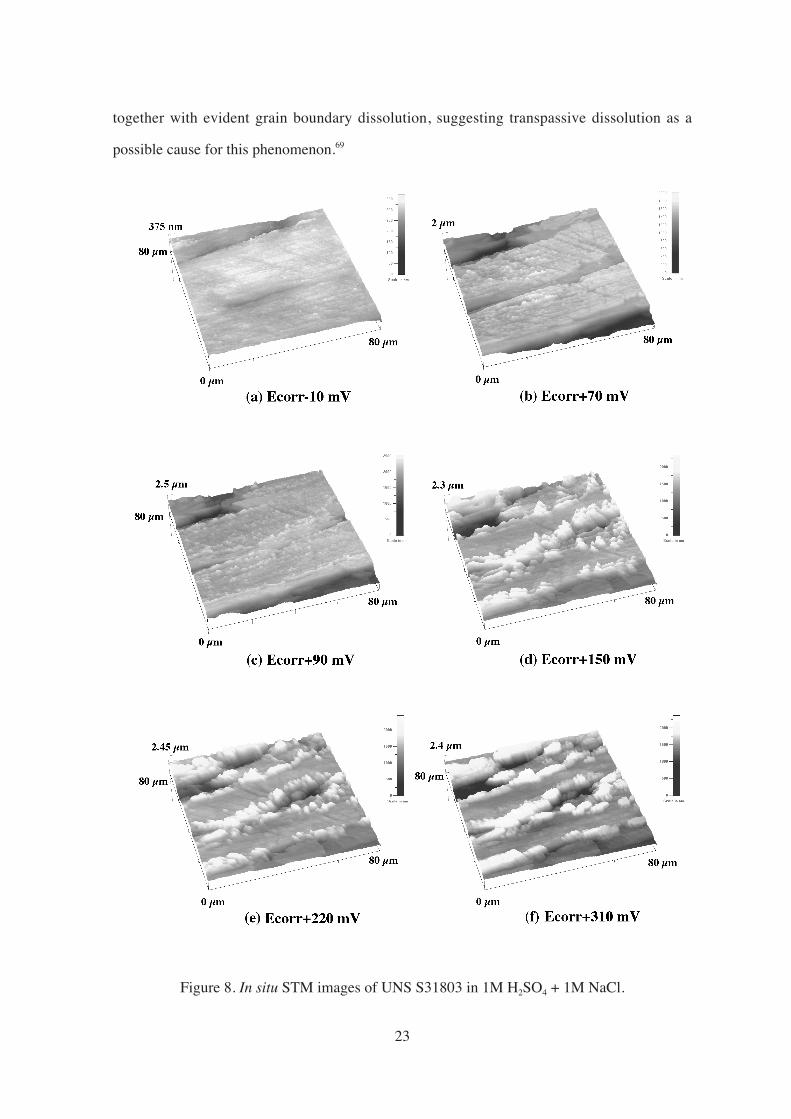
In the same solution, UNS S31803 exhibited no significant ferrite selective
dissolution at Ecorr, and grinding marks could be discerned on the surface of the sample
(Figure 8a). At low anodic potentials, ferrite selectively dissolved and the two phases could be
easily distinguished (Figure 8b). At Ecorr + 90 mV, austenite started to dissolve and the
grinding marks became progressively blurred, while dune-shaped heaps started to appear
along the phase boundaries (Figure 8c-f), probably originating from re-deposited dissolution
products. Subsequent ex situ examination revealed no heap-like features on the surface, which
could have been washed away when rinsing the sample. The step between austenite and ferrite
decreased with time at higher anodic potentials, suggesting that austenite dissolved faster than
ferrite in this potential range.
Comparing the results of UNS S32304 with those obtained in Paper I for the coarse-
grained 2205, it is possible to see that both steels exhibited the same selective dissolution
pattern, indicating that the grain size does not play a major role in the dissolution behavior of
DSS. The only significant difference between the two experiments was the z-scale between
the phases, most likely due to the different aggressiveness of the solutions tested.
In spite of showing a clear peak in the active region of the potentiodynamic curve,
the UNS S32750 showed a high degree of dissolution resistance in the 1M H2SO4 + 1M NaCl
solution with EC-STM images that revealed no visible local dissolution in the active or
passive potential regions (Figure 9, Paper III). Only randomly distributed ellipse-shaped
features, with a z-scale not higher than 60 nm, were observed during the measurements.
However, at very high potentials (Ecorr + 1260 mV), the phases could be distinguished,
23
together with evident grain boundary dissolution, suggesting transpassive dissolution as a
possible cause for this phenomenon.69
Figure 8. In situ STM images of UNS S31803 in 1M H2SO4 + 1M NaCl.
24
3.2 Scanning Kelvin Probe Force Microscopy
The results presented in this thesis are, to our best knowledge, the first application of
SKPFM to the study of DSS. The goal of these experiments was to establish if there was a
measurable Volta potential difference between ferrite and austenite that could give direct
evidence of galvanic interactions between the two phases. In order to accomplish this, it was
necessary to know the distribution of the phases, so that the Volta potential features in the
SKPFM images could then be correlated to the microstructure of the steel. However, the
traditional method used for the identification and characterization of the ferritic and austenitic
phases in DSSs, surface etching, did not seem adequate in this case because it would have
modified the surface oxide layer, and thereby the measured Volta potential. Thus, MFM
appeared as the optimal technique to use because without the need for surface etching, it was
capable of rendering a map of the phase distribution with sub-micron resolution. In addition,
it was very easy to combine MFM with SKPFM by just changing some software parameters.
In general, the MFM images of DSSs are easy to interpret, although in some cases
the magnetic domains of the ferrite phase can exhibit such different appearances, that the
identification of the phases may become difficult. Therefore, some aspects should be taken
into account in order to avoid misinterpretation of the images. One of the most important
factors in MFM imaging is the actual orientation of the magnetic domains of the sample,
which, in turn, depends on the crystallographic orientation of the ferrite. Therefore, it should
be expected that ferrite grains with different crystallographic orientations yield different
magnetic patterns in the MFM images. Other factors that can affect the contrast in the MFM
images are the geometry of the magnetic domains, and the fact that even domains that are
underneath the surface (i. e. non-superficial) can be detected, which may render different
contrast than the superficial ones.
25
3.2.1 Non-exposed UNS S32304, UNS S31803, and
UNS S32750.
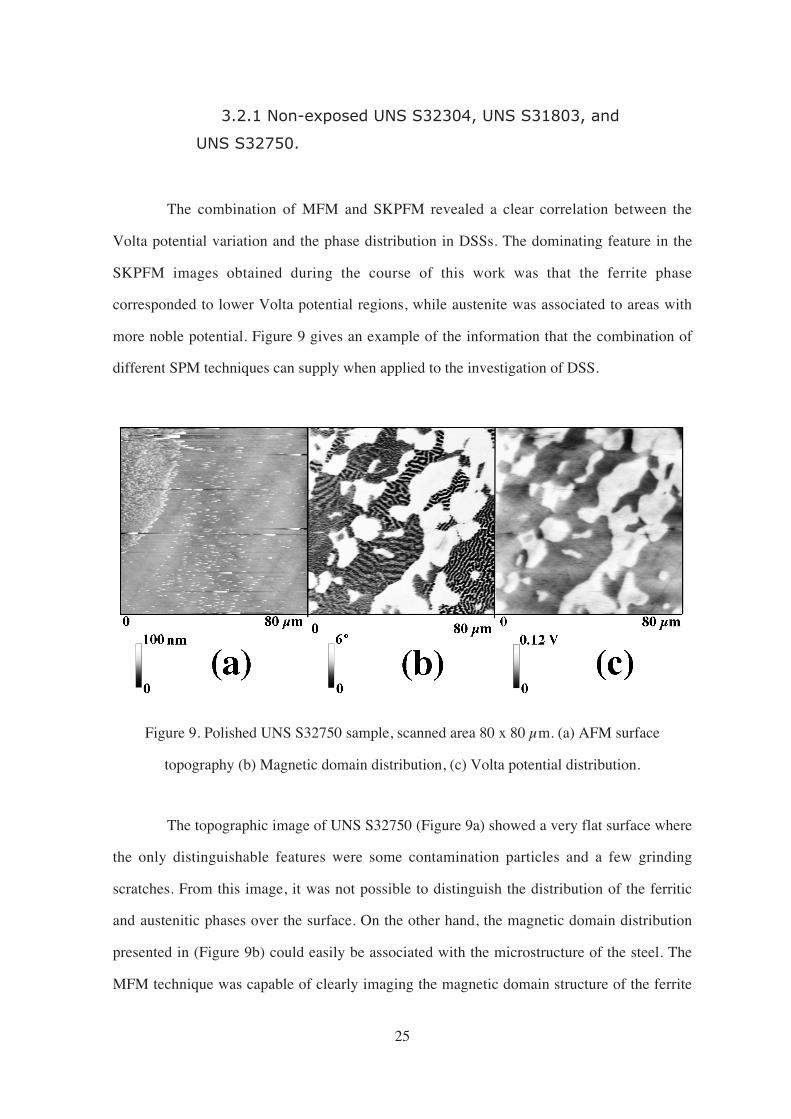
The combination of MFM and SKPFM revealed a clear correlation between the
Volta potential variation and the phase distribution in DSSs. The dominating feature in the
SKPFM images obtained during the course of this work was that the ferrite phase
corresponded to lower Volta potential regions, while austenite was associated to areas with
more noble potential. Figure 9 gives an example of the information that the combination of
different SPM techniques can supply when applied to the investigation of DSS.
Figure 9. Polished UNS S32750 sample, scanned area 80 x 80 µm. (a) AFM surface
topography (b) Magnetic domain distribution, (c) Volta potential distribution.
The topographic image of UNS S32750 (Figure 9a) showed a very flat surface where
the only distinguishable features were some contamination particles and a few grinding
scratches. From this image, it was not possible to distinguish the distribution of the ferritic
and austenitic phases over the surface. On the other hand, the magnetic domain distribution
presented in (Figure 9b) could easily be associated with the microstructure of the steel. The
MFM technique was capable of clearly imaging the magnetic domain structure of the ferrite
26
phase that surrounds the “islands” of austenite, appearing flat and uniform due to their
paramagnetic properties. The correlation between the Volta potential variation (Figure 9c) and
the phase distribution in the UNS S32750 sample (Figure 9b) was so clear, that the SKPFM
image could almost be taken for a microstructure image of the surface. The highest Volta
potential difference between the phases measured was approximately 80mV, but the recorded
potential within the phases was far from uniform, with variations of up to 40 mV within both
austenite and ferrite.
The other two steels studied, UNS S32304 and UNS S31803, exhibited the same type
of features as UNS S32750. The only remarkable difference was that the ferrite phase near the
boundary to austenite for these two steels often displayed a lower Volta potential than the
bulk ferrite. This could imply that these regions were more prone to local dissolution.
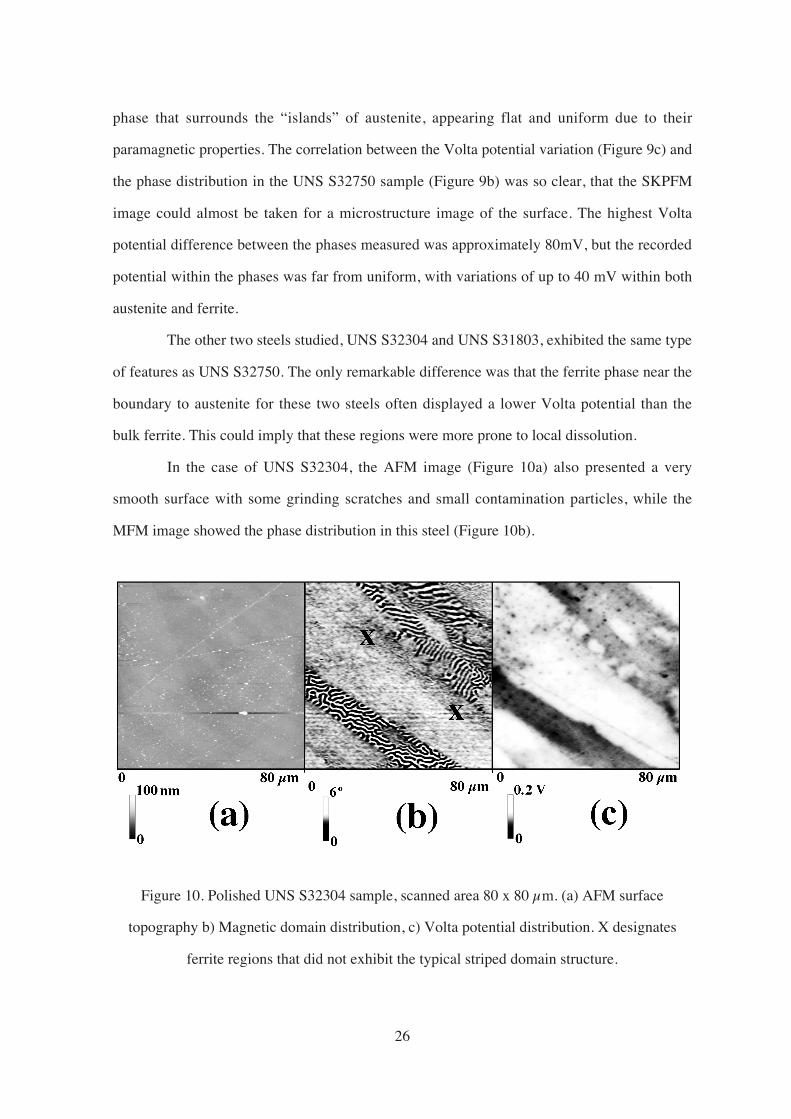
In the case of UNS S32304, the AFM image (Figure 10a) also presented a very
smooth surface with some grinding scratches and small contamination particles, while the
MFM image showed the phase distribution in this steel (Figure 10b).
Figure 10. Polished UNS S32304 sample, scanned area 80 x 80 µm. (a) AFM surface
topography b) Magnetic domain distribution, c) Volta potential distribution. X designates
ferrite regions that did not exhibit the typical striped domain structure.

27
Clear bands of ferrite could be easily distinguished, but a closer look revealed other
regions of ferrite (marked with X) that did not exhibit the more typical striped magnetic
domain configuration, similar to the ferrite regions on the left part of Figure 9b. In this steel,
the Volta potential distribution (Figure 10c) was also highly correlated to the phase
distribution, with ferrite displaying lower Volta potential than austenite. The maximum Volta
potential differences recorded were very similar to those of UNS S32750, approximately 80
mV between the phases and around 40 mV within the ferrite, but somewhat lower within the
austenite (25 mV). In Figure 10c, several lines that remind of grinding scratches could be
noticed, but it was remarkable that not all of these lines could be seen in the topographic
image (Figure 10a). This could indicate that they were caused by defects on the surface due to
the grinding process.
In the case of the polished UNS S31803 sample, it was also possible to identify the
two phases, but in this case the correlation was not as straightforward as for the other two
steels (Figure 11b).
Figure 11. Polished UNS S31803 sample, scanned area 80 x 80 µm. (a) AFM surface
topography (b) Magnetic domain distribution, (c) Volta potential distribution. * marks the
region identified as ferrite in (b) that showed a Volta potential similar to austenite in (c).
28
The general correlation ferrite-low potential and austenite-high potential was
maintained in the SKPFM image (Figure 11c), but the maximum Volta potential differences
recorded were slightly lower than for the other two steels (approximately 50 mV between the
phases). Within the phases, the variation could be just as high, which implied that in some
places the potential of the austenite was indistinguishable from that of the ferrite (marked with
* in Figure 11c). A possible explanation for this lack of correlation could be that the ferrite
domains imaged by the MFM might actually have been non-superficial, so that the Volta
potential measured would in fact correspond to the austenite phase.
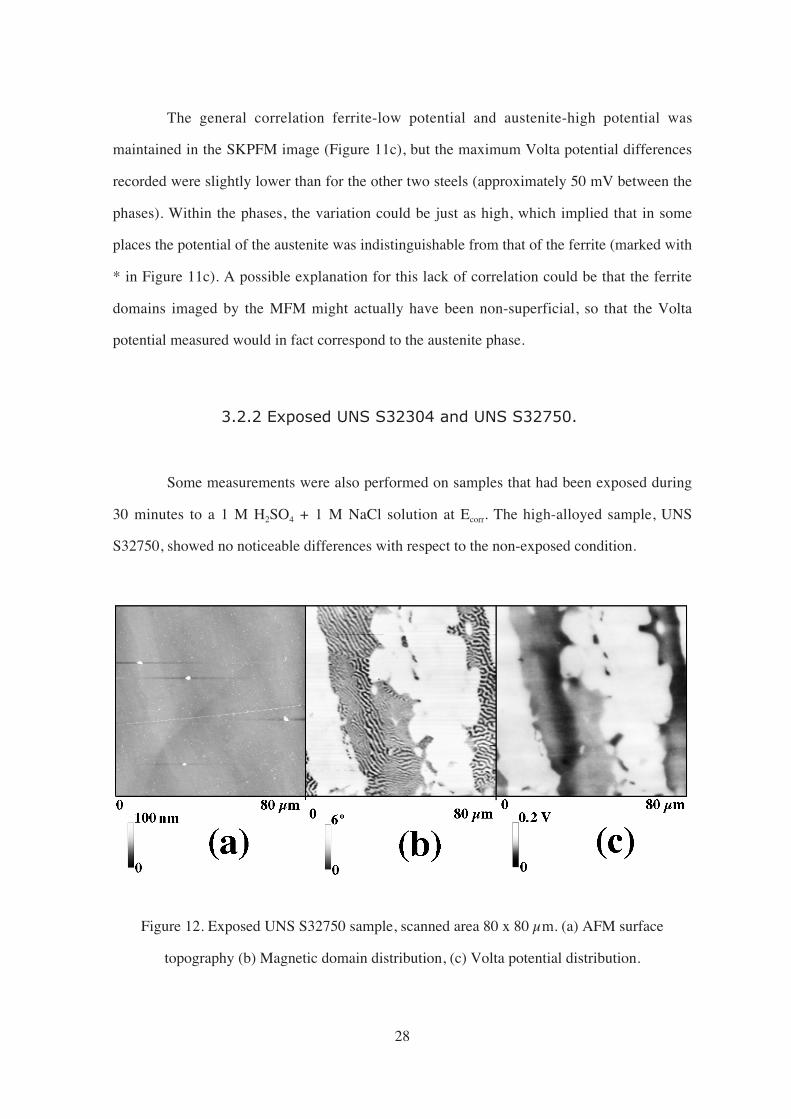
3.2.2 Exposed UNS S32304 and UNS S32750.
Some measurements were also performed on samples that had been exposed during
30 minutes to a 1 M H2SO4 + 1 M NaCl solution at Ecorr. The high-alloyed sample, UNS
S32750, showed no noticeable differences with respect to the non-exposed condition.
Figure 12. Exposed UNS S32750 sample, scanned area 80 x 80 µm. (a) AFM surface
topography (b) Magnetic domain distribution, (c) Volta potential distribution.

29
From the topography image (Figure 12a), it was possible to see that the exposure to
solution caused no measurable corrosion attack on this steel. The surface appeared very flat,
showing only a few contamination particles and some grinding scratches. The MFM image
(Figure 12b) distinctly brought out the phase distribution in the steel, which showed an
excellent correlation to the Volta potential variation displayed in Figure 12c. As in the non-
exposed sample, the ferrite phase corresponded to the low potential regions, and the austenite
to more noble potential regions. The highest potential difference measured between the two
phases was about 80 mV, and the variation within the ferrite was up to 40 mV, both values
very similar to the non-exposed sample. The austenite, however, presented a somewhat more
uniform potential, with the highest variation being around 25 mV.
On the contrary, the exposed sample of UNS S32304 presented a great deal of
differences compared to the non-exposed sample. The topography image showed, as
expected, evident signs of corrosion (Figure 13a), with a z-height scale significantly higher
than that of the non-exposed sample. It was more difficult to distinguish the phase distribution
from the MFM image in this case than for the non-exposed sample (Figure 13b).
Figure 13. Exposed UNS S32304 sample, scanned area 80 x 80 µm. (a) AFM surface
topography (b) Magnetic domain distribution, (c) Volta potential distribution.

30
Despite this, some magnetic domains could still be discerned, making possible a
rough identification of the phases. Comparing the AFM and MFM images, it was possible to
state that the ferrite phase had been selectively dissolved, which was in accordance with
earlier EC-STM observations. The Volta potential variation (Figure 13c) showed a weaker
correlation with the phase distribution than the non-exposed sample. Still, most of the non-
corroded parts that were associated with austenite presented a higher Volta potential than the
regions identified as ferrite. It was remarkable that the Volta potential variation, with a
maximum recorded potential difference of approximately 40 mV over the whole surface, was
significantly more uniform than for the non-corroded sample.
3.3 Scanning Auger Electron Spectroscopy
In the literature, a few studies have been reported using Auger Electron Spectroscopy
(AES) to study the chemical composition of the passive film of DSSs.14, 70 These studies,
however, included no information related to the phase boundary region. Therefore, it seemed
interesting to investigate the elemental distribution through the austenite-ferrite interface with
a high-resolution technique in order to see if it differed from that of the bulk phases. In this
way, it could be possible to elucidate if there was depletion of certain alloying elements at the
phase boundary region that could account for the EC-STM observations that the ferrite near
the phase boundary tends to dissolve at a faster rate than bulk ferrite. Moreover, it seemed
relevant to perform the SAES line-profiles on the alloy surface layer at the oxide/metal
interface, where N and Ni have been reported to show enrichment compared to the bulk
concentration. 14, 70 In this way, more knowledge could be gained about this layer, which
seems to be of key importance for the corrosion properties of stainless steels.
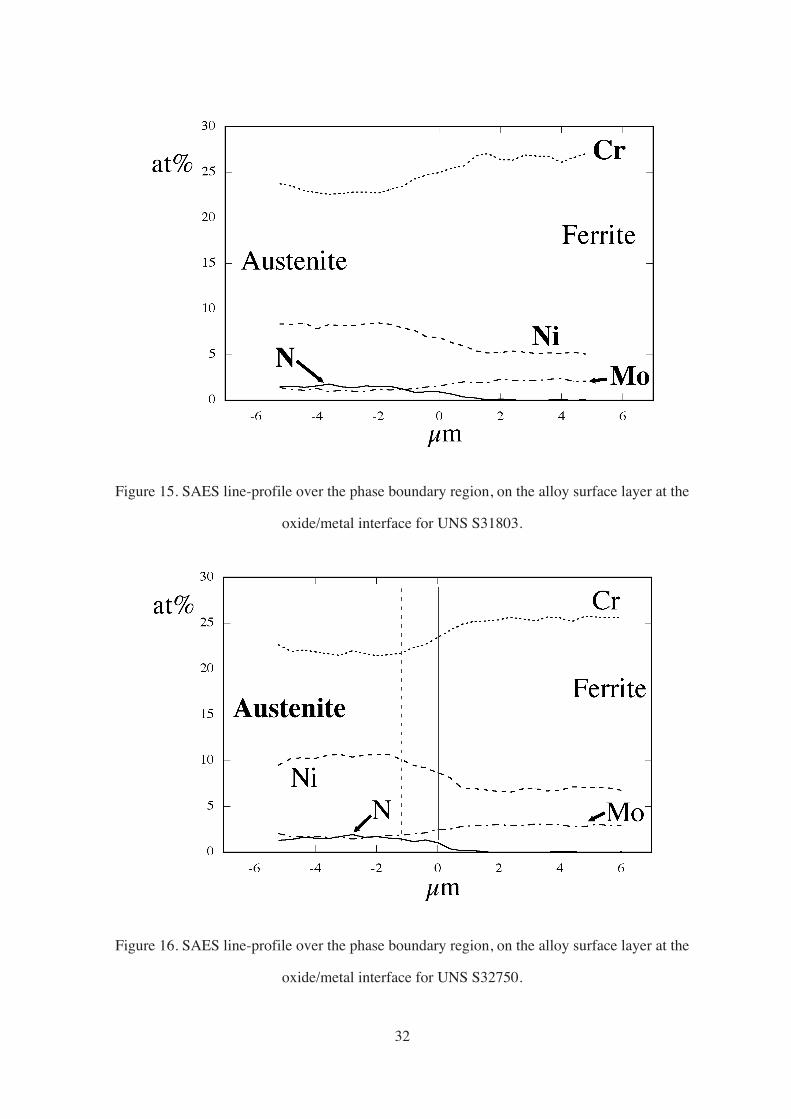
As can be seen from Figure 14, Figure 15, and Figure 16, the line-profiles for the
three DSSs presented, qualitatively, the same type of general features. The ferrite stabilizers,
Cr and Mo, were partitioned to the ferrite phase, while the austenite stabilizers, Ni and N,
were partitioned to the austenite. The transition at the phase boundary was quite smooth for

31
all the elements investigated in all the steels, and no visible depletion or enrichment of any
element could be distinguished. The mean values obtained of each element on the ferrite and
austenite were averaged, and the resulting value was compared to the bulk concentration,
which confirmed the enrichment of Ni at the alloy surface layer on both austenite and ferrite,
and of N on the austenite.
Figure 14. SAES line-profile over the phase boundary region, on the alloy surface layer at the
oxide/metal interface for UNS S32304.
Comparing the line-profiles of the different DSSs, it could be seen that Cr and Mo
were more partitioned, i.e. there was a larger difference in concentration between the phases,
in the lower alloyed steels. The line-profiles of UNS S31803 and UNS S32750 could be
compared to the concentration values obtained at the alloy surface layers by other
researchers.14, 70 The profile for UNS S32750 agreed quite well with the reported values,
however, the profile for UNS S31803 showed consistently higher Cr and lower Ni
concentration values than those reported in literature. Insufficient sputtering of the passive
film was the suggested explanation for this observation because of the expected Cr-
enrichment and Ni-depletion in the passive film.
32
Figure 15. SAES line-profile over the phase boundary region, on the alloy surface layer at the
oxide/metal interface for UNS S31803.
Figure 16. SAES line-profile over the phase boundary region, on the alloy surface layer at the
oxide/metal interface for UNS S32750.

33
3.4 Scanning Electrochemical Microscopy
In the course of these studies, a great deal of effort was dedicated to the SECM
technique. Unfortunately, due to considerable experimental difficulties, it was not possible to
obtain relevant results with this technique despite the same instrument had been successfully
used for the EC-STM measurements. In the SECM measurements, three factors significantly
increased the experimental difficulty compared to EC-STM: the need for optimal insulation of
the tip, the lack of feedback circuit, and the requirement of a background noise in the pA
range.
In order to detect the faradaic current from the corrosion processes occurring at the
surface, the tip needed a more accurate insulation than for the EC-STM measurements.
Although this caused a certain amount of extra-work, it was relatively easy to obtain an
optimal tip insulation. The lack of feedback circuit required the surface of the sample to be
almost completely horizontal, which meant a very flat surface with very low tilt. With a
polishing-aid, a tilt-stage and a great deal of practice, it was possible to obtain extremely flat
surfaces, with a tilt lower than 1 nm per µm. However, the background noise proved to be too
difficult to control. The noise level was in the nA range, and only in a couple of isolated
occasions it was possible to discern some electrochemical signal, probably originating from
the corrosion processes taking place on the surface.
The SECM experiments were interrupted due to lack of time, but it was felt that once
the cause of the high background noise was found and controlled, it should finally be possible
to use this technique to its full capacity.

34
4. DISCUSSION
4.1 Local vs. Global Experiments
Corrosion science is a discipline that is spread over a broad range of length scales
that are often closely related. For example, the corrosion resistance of engineering materials
(macroscopic) is strongly dependent on their microstructural properties (microscopic).
Therefore, it seems evident that the macroscopic corrosion behavior of engineering materials
will be better understood if the underlying chemical, physical and electrochemical phenomena
involved can be investigated on a micrometer or nanometer scale. Thus, it is easy to see that
parallel microscopic and macroscopic investigations are necessary in order to gain deeper
understanding about the corrosion behavior of engineering materials.71 The recent
development in the field of local probing techniques has opened the microscopic frontier for
corrosion investigations, providing a great quantity of new information about the corrosion
processes at a local scale. The interconnection of the microscopic and macroscopic scales will
be of utmost importance in future investigations of complex technological systems,9 although
unfortunately, very few studies have been reported that emphasize the relation between effects
measured at different scales.71
All this is especially relevant in the case of DSS, where the corrosion behavior of the
individual phases is a key factor for understanding the corrosion properties of the whole
material. During the course of this work (Papers I through III), conventional electrochemical
techniques were used in combination with EC-STM in an attempt to gain further insight into
the corrosion behavior of DSS in acidic-chloride solutions. In this work, the main difficulty in
correlating the local and global information was mainly due to the difference in time and
length scales, and from the inherently different type of data obtained from each technique.
The conventional electrochemical techniques employed during the course of these
studies gave information about the electrochemical activity of the sample in the form of
current density. EC-STM, on the other hand, showed the evolution of the surface topography
35
of the electrode. Thus, the parameters to be correlated were current density over a large
surface area and topography changes over a small area which, although lacking a direct
comparison, still could be connected to each other.
The difference in time scale of the experiments added further complication to the
interconnection of results. Potentiodynamic polarization curves were obtained over a period
of the order of one hour, whereas EC-STM experiments could last over 10 hours in order to
cover the same potential range. This inherent difference in time scale turned out to be of
special relevance in processes where induction time was an important factor, such as in the
pitting-like dissolution observed on UNS S32304 in Paper III. In this case, fast
potentiodynamic scans seemed not to allow sufficient time for the growth of pits, whereas
during the long potentiostatic polarization measurements in the EC-STM measurements, pits
had time to grow and heavily corrode the sample.
The conventional electrochemical techniques used in this work measured surfaces of
~1 cm2, therefore yielding only global information about the corrosion behavior of the sample.
On the other hand, the EC-STM system probed surfaces of the order of ~10-5 to 10-4 cm2,
yielding localized information about the dissolution processes. Such small-scale
measurements were needed for monitoring the local electrochemical behavior of the
individual phases of DSS. This local information is of great value, but caution must be taken
when extrapolating the local results to describe global processes occurring over the whole
surface, because there is a risk of overestimating the importance of the imaged events. For
example, when studying localized corrosion phenomena with EC-STM, repeated
measurements of different single events may give quite different results, as seen for UNS
S32304 in Paper III, making necessary a global picture of the corrosion behavior for their
understanding.
Thus, the comparison between local and global experiments is not immediate, but the
experimental differences can be overcome if the appropriate measures are taken. For instance,
it is of supreme importance to repeat as many different local measurements as possible on the
same material, so that it is possible to monitor the whole range of particularities and local

36
events that can take place on the surface. Careful subsequent ex situ examination should be
able to give an approximation to the general behavior of the sample as well as indicating the
possible singularities present, such as non-metallic inclusions or precipitates. All this should
give solid grounds for successfully relating the global and local methods, which is of key
importance, especially when studying highly heterogeneous materials, such as DSS.
In all, the new localized techniques in general, and EC-STM in particular, represent a
powerful tool capable of producing images of events never directly observed before, which
may lead to improved hypotheses of the underlying mechanisms behind them.9 Moreover, in
certain cases, these observations can even result in quantitative observations that can be useful
in the development of mathematical models that can validate those hypotheses.9 However,
only when this local information is considered within the context of the global processes can
the full potential of these techniques be attained.
4.2 Combination of Local Probing Techniques
In corrosion investigations, different techniques are often used in order to cover
different aspects of the corrosion behavior of a sample in a certain solution. The information
obtained by means of these techniques can be regarded as pieces of a jigsaw puzzle that, when
put together, can lead to a deeper understanding of the investigated phenomena. Thus, the
combination of these different techniques can become an important factor for gaining a more
comprehensive understanding of the corrosion processes involved. Moreover, the combination
of different techniques might be especially helpful when using a novel technique with
insufficient amount of background data. Considering that the interpretation of the new results
might not always be straightforward, their comparison with results from more established
techniques or from literature might be necessary for their understanding.
During the course of these studies, several high-resolution techniques with
comparable lateral resolution (~ 1µm) have been used in order to investigate the corrosion
behavior of DSS in acidic-chloride solutions. The EC-STM results presented in this thesis

37
show how localized in situ techniques can contribute to the elucidation of corrosion
mechanisms on a local scale, by permitting single events to be monitored while on-going. By
means of EC-STM, it was possible to follow in detail processes such as the growth of a single
pit (Paper III) or the selective dissolution of a single phase in a DSS (Papers I and III). On the
other hand, SKPFM was used in Paper IV to measure the Volta potential variation over the
surface of DSS with the aim of correlating it to the phase distribution visualized by MFM. In
this way, a significant Volta potential difference between ferrite and austenite was measured.
In Paper V, SAES was used for studying the chemical composition across the phase boundary
at the alloy surface layer. The concentration line-profiles obtained showed the partitioning of
the alloying elements between the two phases, as well as the enrichment of N and Ni at the
alloy surface layer.
The fact that all these techniques possess the same range of lateral resolution
facilitates their combination and makes possible a direct comparison between them. The most
obvious example of the advantages of combining different techniques is probably Paper IV,
where the combination of the topographic, magnetic and potential data was done directly with
the same instrument, resulting in very important information. But as a matter of fact, the
comparison of results can be extended also to other techniques rather directly. For example, in
Paper IV, UNS S32304 was investigated before and after exposure to a 1 M H2SO4 + 1 M
NaCl solution at Ecorr for 30 minutes. The AFM-topography image of the exposed sample
showed that one of the phases had selectively corroded during exposure. The MFM image
identified this phase as ferrite, which showed a lower Volta potential in the SKPFM image.
These measurements not only confirmed the behavior monitored in situ by EC-STM, but also
gave a direct account for the possibility of galvanic interaction between phases that had been
suggested in Paper III. The galvanic interaction between the phases had been previously
reported by Symniotis72-74 who had measured it indirectly with conventional electrochemical
techniques. Hence, an excellent example of the importance of complementing the global
investigations with localized studies.
38
The comparison of results obtained by means of different techniques can easily be
extended to other local probing methods, as long as the results are compatible. For instance,
Perren et al.18 used a microelectrochemical method that made possible the measurement of
individual potentiodynamic polarization curves of the single phases of DSS. Their results
showed that when the two phases of a DSS had similar PRE values, their individual
polarization curves presented the same type of features, which would be an indication of
overall uniform corrosion behavior. However, measurements at the phase boundary region
showed how the galvanic interactions between phases might alter this uniform behavior.
These results can be compared to those obtained through the course of this thesis because they
monitor the same type of phenomena, and they do it on the same length scale. The chemical
composition information obtained by SAES in Paper V showed that UNS S32750 had the
smallest composition difference between the phases. This was reflected in the EC-STM
measurements, where this steel showed a quite uniform dissolution behavior, with no
evidence of selective dissolution (Paper II). Although no indications of galvanic interactions
were monitored by EC-STM for this steel, significant Volta potential differences between
ferrite and austenite were measured by SKPFM, both before and after exposure to solution
(Paper IV). This might seem contradictory at a first glance, but it has to be taken into account
that although the Volta potential is a measure of the driving force for galvanic corrosion, it is
not capable of giving quantitative kinetic information about corrosion rates. Thus, even if
there is a Volta potential difference between the phases, galvanic interactions like those
reported by Perren et al. can only take place if all the necessary conditions are fulfilled.
Thus, the combination of the different local probing techniques used in this doctoral
thesis and their comparison to other techniques of similar lateral resolution found in literature
have been proven to be extremely useful. Each technique has made its little contribution and
helped rendering this immense jigsaw puzzle of the corrosion behavior of DSS a bit more
intelligible. Due to experimental difficulties encountered, the only regret has been the
unsuccessful attempts to perform SECM measurements on the same system. It is clear that the
information yielded by this technique, electrochemical current distribution over the surface of

39
the sample with sub-micron resolution, would have been of great value, and easily
comparable to the other techniques used in these studies.
4.3 Influence of the Alloying Elements
The use of DSSs with different alloying contents in these studies has made possible a
comparison of their dissolution behavior in acidic-chloride solutions in terms of their alloying
elements. However, the variation of alloying elements in these DSSs is not systematic, which
makes it difficult to attribute a certain modification in the corrosion behavior to a particular
alloying element. Nevertheless, it is still possible to point towards certain tendencies in how
the addition of certain alloying elements affects the corrosion behavior of the steels.
The principal differences regarding the alloying elements between the three types of
DSSs investigated are due to differences in their alloying contents of Mo and N, and to a
lesser extent, Cr and Ni (Table I). From this compositional difference, the steels are expected
to show a varying degree of corrosion resistance as the alloying contents change. Although
the results presented in this thesis indeed show such a tendency, the corrosion behavior of
DSS is more complicated than just a cause-effect relationship between corrosion resistance
and the content of alloying elements, because the partitioning of the alloying elements
between the phases also plays an important role.
N affects the corrosion behavior of DSS in a twofold way. On the one hand it is in
itself a beneficial element against corrosion, and on the other hand it reduces the partitioning
of Cr and Mo between the phases by allowing a higher content of Cr and Mo in the
austenite.10, 13, 16-18, 75 Since N is almost insoluble in ferrite, practically all N is concentrated in
the austenite. Therefore, it is easy to see that N improves mainly the corrosion resistance of
the austenite phase. This is a way of leading towards DSSs of well-balanced composition, i.e.
with phases of comparable corrosion resistance, which is of key importance since the
corrosion resistance of DSS is governed by that of its weakest phase.10-12, 16-18 The partition
coefficients calculated from the SAES line-profiles (Table III, Paper V) corroborate this

40
behavior, with UNS S32750, the highest alloyed DSS, showing the smallest difference in
composition between phases.
Quantifying the corrosion resistance of stainless steel is a difficult task because there
are many factors involved that must be taken into account. The PRE is an empirical
expression that was developed for ranking the resistance of austenitic stainless steel against
pitting corrosion in terms of its Cr, Mo and N contents. Due to its simplicity, the PRE value
has found widespread application among corrosion scientists, even when pitting is not the
main form of corrosion studied. This might not necessarily be wrong, as long as it is used with
caution. For example, in the present studies the phenomenon studied has been active
dissolution, but since Cr, Mo and N are known to depress active dissolution,68 the PRE values
may still be used qualitatively as a rough measure of resistance against active dissolution. In
fact, an expression very similar to the PRE formula has been reported to correlate the active
dissolution rates of DSS in acidic-chloride solutions to the Cr, Mo and N contents.72
Due to the partitioning of the alloying elements between the phases, it has been
suggested that separate PRE values for DSS should be calculated for each phase. 10-12, 16-18
However, confusion may arise when choosing the factor for N to be used in the PRE formula,
because the use of different values may lead to contradictory conclusions about which phase
is more resistant in a certain DSS. Besides, no influences from other alloying elements or
synergisms between them are taken into account by the PRE formula. Therefore, even if the
application of the PRE to DSS is quite widespread, it must be done with great caution and
bearing in mind all its limitations.
Of all the DSSs investigated, only UNS S32750 is manufactured to have equal PRE
values for both phases, implying that the alloying elements are partitioned in such a way that
both phases exhibit equal corrosion resistance. This seemed to be corroborated by the EC-
STM measurements, where the phases of UNS S32750 exhibited a fairly uniform dissolution
behavior (Paper II). On the other hand, all the other DSSs investigated exhibited selective
dissolution in the acidic-chloride solutions tested. In general, the dissolution behavior of these
DSSs followed the same pattern; preferential dissolution of ferrite at low anodic potentials,

41
and activation of austenite at higher anodic potentials in the active region. In the case of UNS
S32304, ferrite dissolved selectively already at Ecorr, probably due to the low Mo content of
this steel. Since Mo partitions to ferrite, the addition of Mo affects this phase to a larger
degree than austenite. Indeed, the increase to 3% of the Mo concentration in UNS S31803
seemed to significantly strengthen the ferrite phase of this steel, which was capable of
resisting selective dissolution at Ecorr even in very aggressive solutions (Paper I). But it is not
only the ferrite phase that seemed stronger in UNS S31803 with respect to UNS S32304, the
phase boundaries in general also seemed to be less selectively attacked. A possible
explanation for this phenomenon might be found in the Mo-N interaction. Several theories
have been proposed to explain the mechanism of this synergism,76-80 but more knowledge is
still needed to formulate a comprehensive theory. Clayton et al. proposed the possibility that
Mo, Ni and N, enriched at the alloy surface layer adjacent to the passive film, could form a
mixed nitride phase that would preferentially nucleate at high-energy sites.76-78 The SAES
measurements in Paper V showed no enrichment of Mo at the alloy surface layer, suggesting
that the Mo content would be too low to form a continuous nitride phase. However, if small
clusters of this nitride phase would nucleate at weaker sites, such as phase boundaries, these
would be considerably strengthened, which could account for the EC-STM observations of
UNS S31803.
4.4 Influence of the Phase Boundary Regions
The singularity of the phase boundaries is a factor that must be seriously considered
when studying DSS. Within a distance of a few micrometers, large variations in alloying
element concentration and Volta potential arise, which may lead to a locally different
dissolution behavior compared to the bulk phase region. Besides, the phase boundaries are
preferential sites for the precipitation of secondary phases, which usually decreases the
corrosion resistance of the steel by providing starting points for localized corrosion.4-6, 10, 81 The
small investigated surface area offered by the local techniques used in these studies makes it
42
difficult to obtain representative observations. Nevertheless such a tendency was indeed
observed. Non-metallic inclusions and elongated cavities in the phase boundary region of
UNS S32304 and UNS S31803 were imaged by EC-STM in Paper III. Subsequent ex situ
examinations revealed that UNS S32304 showed a certain degree of phase boundary
dissolution, while UNS S31803 exhibited significantly less. On the other hand, SKPFM
measured lower Volta potential values at the phase boundary than in the bulk phase,
suggesting stronger susceptibility to corrosion attacks.
During the EC-STM measurements, a remarkable phenomenon was repeatedly
observed. In the course of selective dissolution, the ferrite phase nearest to the phase
boundary seemed to dissolve at a higher rate than the bulk ferrite (Figure 17). This sort of
behavior has also been reported by other authors,45 but the reason behind is not clear. Local
galvanic interactions or local depletion of alloying elements were proposed as possible causes
in Paper I.
The SAES line-profiles from Paper V showed no depletion of alloying elements in
the phase boundary region. However, in order to be able to discard this possibility with more
certainty, new SAES measurements with improved resolution should be performed.
Moreover, these measurements should be carried out with a lower level of background noise,
so that it is possible to obtain reliable readings of the N concentration.
On the other hand, the SKPFM measurements in Paper IV showed, for UNS S32304
and UNS S31803, that the Volta potential of the ferrite adjacent to the phase boundary was
often lower than that of the bulk ferrite. In fact, the resemblance of the EC-STM and SKPFM
profiles shown in Figure 17 is quite remarkable, suggesting that the phenomenon observed
with EC-STM might be caused by local galvanic interactions at the phase boundary. It is
noteworthy that the SKPFM profiles for UNS S32750 showed no such features, possibly
because the phase boundaries in this steel might no longer be weaker points.
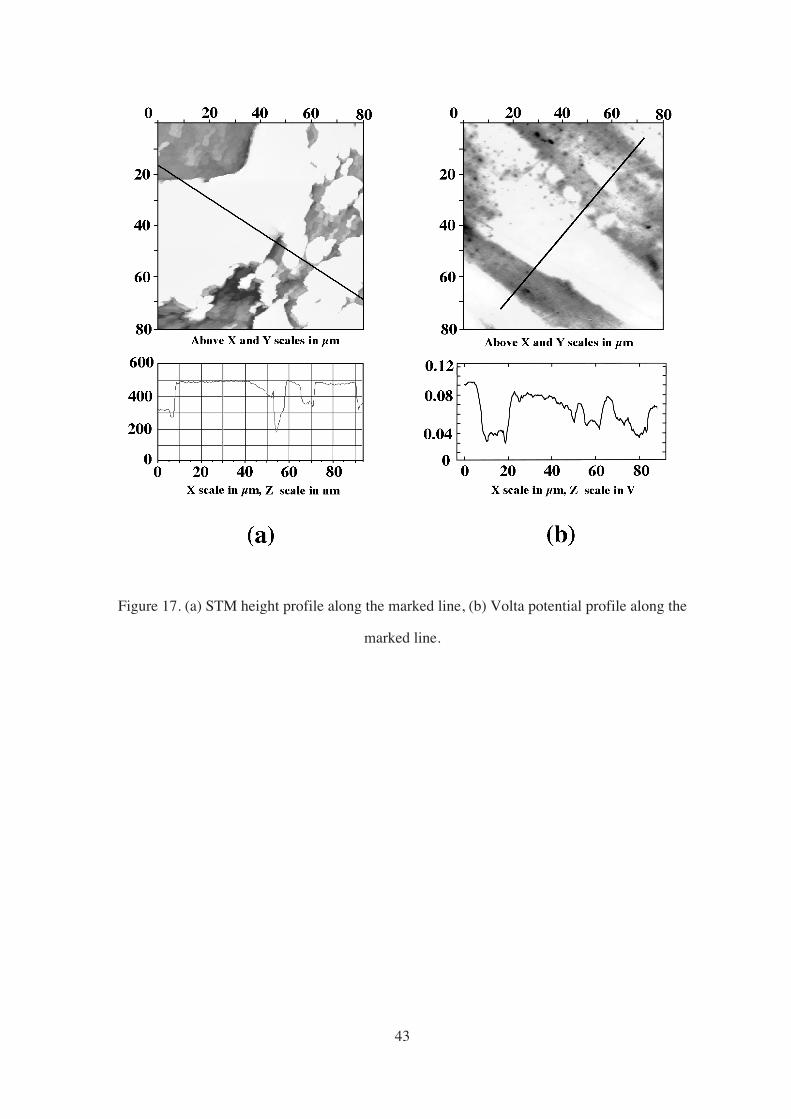
43
Figure 17. (a) STM height profile along the marked line, (b) Volta potential profile along the
marked line.
44
5. CONCLUDING REMARKS
The results presented in this thesis clearly demonstrate the local nature of corrosion
processes. Therefore, it is easy to realize the benefits of using high-resolution local probing
techniques for corrosion science studies. Each technique has been used to investigate a
different aspect of the corrosion behavior of DSS in acidic-chloride solutions, and the
combination of the results has been an important factor for gaining a more comprehensive
understanding of the processes involved. The most important techniques used within this
doctoral thesis, together with the experienced capabilities, are summarized below:
• In situ EC-STM permits direct monitoring of electrochemical processes with sub-micron
resolution, which, in the best case, only can be resolved indirectly by conventional
electrochemical techniques. Dissolution processes in commercial DSS can be followed in
real time, thanks to the adequate lateral and time resolution offered by this technique.
• MFM is capable of imaging the phase distribution in DSS with sub-micron resolution, and
without the need for the traditional surface etching.
• SKPFM measures the Volta potential distribution over the surface of DSS with sub-
micron resolution. The Volta potential gives a measure of the relative nobility of the
phases, and has been related to Ecorr.
• SAES has shown that the composition gradient at the phase boundaries is narrower than 2
µm. New measurements with higher resolution and lower background noise would be
desirable for a better characterization of the chemical composition across the phase
boundary.
• SECM might provide extremely useful information about the local electrochemical
processes occurring on the surface. Once the experimental difficulties have been
overcome, it would be most interesting to apply SECM to the study of DSS.
45
The connection between macroscopic and microscopic information is extremely
important, especially for localized processes like local dissolution or pitting corrosion.
Parallel macroscopic experiments, combined with ex situ characterization will always be
necessary in order to complement the information obtained with local techniques. In this way,
a more comprehensive understanding of the processes involved can be gained.
The partitioning behavior of the alloying elements is of key importance for
understanding the corrosion behavior of DSSs. The phases of higher alloyed steels exhibited
smaller differences in corrosion resistance and in composition. Higher contents of Cr, Mo and
N strengthened both phases as well as the phase boundaries. DSSs with phases having similar
corrosion resistance showed a more uniform dissolution behavior.
In the literature, several theories have been proposed to explain the beneficial role of
Mo and N for the corrosion resistance of stainless steels. The results presented in this thesis
suggest that explanations of the synergism between Mo and N in DSS have to consider their
influence on weaker sites, such as phase boundaries.
The Volta potential variation is strongly correlated to the phase distribution. The
Volta potential difference between ferrite and austenite has been found to be measurable and
significant. Ferrite is in general associated with lower Volta potential regions, and austenite to
more noble potential regions.
Ferrite adjacent to the phase boundary showed lower Volta potential values than bulk
ferrite, suggesting that the higher dissolution rate of this region in acidic-chloride solutions
could be due to local galvanic interactions between the phases.
46
6. CONSIDERATIONS FOR THE FUTURE
It is clear that there are still many topics related to DSS to be investigated with local
probing techniques. If this project were to continue, there are several lines of work where it
might be worth going deeper into.
One of them is the further application of SKPFM to DSS, where it would be
especially interesting to study in greater depth how the exposure to solution affects the Volta
potential variation over the surface, for both corroding and non-corroding DSSs.
It is clear that the use of SECM in combination with EC-STM could yield extremely
valuable information about the local electrochemical activity and the corrosion processes
taking place on the surface of DSS.
Additional studies, with higher resolution, of the chemical composition distribution
in DSS should give a deeper understanding of role of the alloying elements in the corrosion
resistance of DSS. It would be of special importance to investigate the synergism between Mo
and N.
The study of other types of processes, different from active dissolution, should also
be the focus of future local investigations. The application of local techniques to the study of
pitting corrosion would be highly relevant for industrial applications, especially pit nucleation
and evolution, which for example, could be monitored in situ by EC-STM and SECM.

47
7. ACKNOWLEDGEMENTS
I want to thank Prof. Christofer Leygraf for offering me the opportunity of joining
this group. Thank you for sharing your vast experience, for your useful advices, and for
giving me a deeper insight into Swedish culture and traditions.
I also want to thank my daily supervisor Dr. Jinshan Pan, for always being available
and ready to give your competent advice. Thank you for your patience, for caring, and for
showing me the way.
I wish to thank Doc. Inger Odnevall for great help with many bureaucratic matters.
Ted, Erik, Daniel, and Clara are also thanked for helping me with my much-hated
computers.
I feel obliged to thank my present and former room-mates, Sergei, Kaz, Sofia, Anna,
Bent, Peter, Andreas, and Gunilla for putting up with me, I hope it wasn't too hard....
I want to express my gratitude to the rest of the Division of Corrosion Science at
KTH, Camilla, Wenle, Annika, Johan T, Jonas, Jianshu, Magnus, Staffan, Gunnar, Johan Ö,
Qian, Bosse, and Xueyuan for creating an atmosphere where it is very easy to work in.
Thanks to Ulf Kivisäkk (AB Sandvik Steel), Dr. Lena Wegrelius, Tekn. Lic. Anna
Iversen, and Elisabet Alfonsson (at Avesta Polarit AB) and Dr. Rachel Pettersson (Swedish
Institute for Metals Research) for valuable comments and constructive criticism of my work.
Ulf and Lena also are thanked for arranging all the practical details during my pleasant stays
at Sandviken and Avesta.
Warm thanks to Dr. Janusz Kanski and Dr. Lars Ilver, whose hospitality and
generosity made my stays in Gothenburg most fruitful.
We are grateful to Prof. David B. Haviland for permitting us the use of the
Nanoscope IV, which made possible the SKPFM measurements during last summer.

48
We are obliged to Dr. Yufan He at the Institute for Corrosion and Protection of
Metals, Shenyang, China, for his kind help with the initial EC-STM studies. The ICPM is also
thanked for a memorable stay in China.
I am grateful to the Institute for Metals Research for our joint purchase of the STM-
AFM facility. It was also a pleasure to share some hours in front of the microscope with
Patrik Luukkonen.
AB Sandvik Steel, Avesta Sheffield AB, and the Brinell Centre at KTH are
acknowledged for the financial support to this work.
I also wish to thank Dr. Ying Yang Zhu for teaching us the practical aspects of EC-
STM. Although the SECM did not work as we wished, it was a pleasure and a great help
when you were here.
My parents deserve special thanks for about everything. They brought me up (thanks
to you I am what I am), and made it possible for me to come to Sweden in the first
place…Thanks for still being at my side, and I hope you are satisfied with this work because
it was you who made it possible.
My grandmother and Pim have been a constant support during these last years with
the Europe 15 plan, calling me almost everyday for 15 minutes. My brother Jordi was also an
important connection in that plan, and I hope that he will finish his Brittish adventure with the
best luck.
I want to thank my new relatives, the Canalias and the Gómez, for making me feel so
welcome when I visit Sabadell, and for all support received.
Thanks also to the Garcia-Persson family, my closest relatives in Sweden. Guacimara
too, for the good moments.
Then there are all the CCE friends from Barcelona… thanks for keeping me up to
date, and even if we are not going anymore to cheap Chinese restaurants, I still enjoy “the
almond tree” dinners…
I want to thank Aina for giving me great moral support every time I have needed it, I
hope you got some back too.

49
Juan Antonio has always been like a second brother to me, and I hope that your new
life is going to be as you have always wanted. Marta, you should take good care of him…
It has also been great fun to keep in touch with Roger and Pepa, and having them
visiting Sweden… I hope that you will come again. Tina and Bita, some of the last friends left
in Mallorca, thanks for helping me with the exhibitions, and I hope you come soon too.
Also I want to remember the people who shared some time with me in Sweden, but
who are no longer here, Julien (it was great having you back last December). Also all the
former French Legion members Blaize, David, tiJej, François, Tophe-blond, Fanchon,
Karolina, Tophe-brun, Lucien, Jej, Nico that helped me amusing myself during off-work
hours, with memorable football matches and pleasant evenings in town.
The remains of the French Legion, Rémi and the Swedish mercenary Malin, thank
you for not leaving, and I hope that we will continue to do all kinds of fun things together…
I also want to thank Michael, Mathieu and Nicolas for pleasant lunches during these
last months, I will visit you sometimes…
I want to thank Héctor for many amusing chats about almost everything, it has been a
great pleasure… it is easier to be a Barça supporter when you have someone to share the
sorrow…
I have also enjoyed the company of my Durito friends Erik and Rasmus, thank you
for all the pleasant and interesting moments and for your help.
Arnaud deserves a special mention, after more than two years of sharing flat, he flew
away from the nest to his own place. At least you did not leave Stockholm…
And finally, Carlota, who has not only put up with me daily for three years now, you
also saved this thesis by proposing the SKPFM measurements. It has been really fun, thank
you for all the laughs and support… I hope I managed to give some back too, let’s see what
the future has prepared for us…
50
8. REFERENCES
1. J. Beddoes and J. G. Parr, Introduction to Stainless Steels, 3rd ed., ASM International, p.
27 (1999).
2. M. L. Erbing, Materialkunskap, Avesta Sheffield AB, Lecture in the course Konstruera
och Arbeta i Rostfritt, p. 1 (1998).
3. F. Falkenberg, Initiation and Repassivation of Austenitic Stainless Steel, Doctoral Thesis,
Chalmers University of Technology, Gothenburg, Sweden, p. 1 (2000).
4. J. O. Nilsson, Super Duplex Stainless Steel, Mat. Sci and Tech., 8, 685 (1992).
5. H. D. Solomon and T. M. Devine, Duplex Stainless Steels- A Tale of Two Phases, Duplex
Stainless Steels, Conf. Proc., ASM, p. 693 (1983).
6. J. Charles, Super Duplex Stainless Steel: structure and properties, Duplex Stainless Steels
‘91, Conf. Proc., Beaune, France, p. 3 (1991).
7. R.A. Lula, Duplex Stainless Steels, Conf. Proc., ASM, p. iii, (1983).
8. A. J. Sedriks, Corrosion of Stainless Steels, John Wiley & Sons, Inc., p. 49 (1996).
9. R. Alkire and M. Verhoff, The Bridge from Nanoscale Phenomena to Macroscopic
Processes, Electrochim. Acta, 43, 2733 (1998).
10. P. Combrade and J.-P.Audouard, Duplex Stainless Steels and Localized Corrosion
Resistance, Duplex Stainless Steels ‘91, Conf. Proc., Beaune, France, p. 257 (1991).
11. C.D.S Tuck, J.M. Sykes, and L.F. Garfias-Mesias, The Influence of Specific Alloying
Elements in the Control of Pitting Mechanisms of 25% Cr Duplex Steels, Duplex Stainless
Steels, Glasgow, 1994, paper 15.
12. L.F. Garfias-Mesias, J.M. Sykes, and C.D.S Tuck, The Effect of Phase Compositions on
the Pitting Corrosion of 25 Cr Duplex Stainless Steel in Chloride Solutions, Corros. Sci.,
38, 1319 (1996).
13. A. P. Bond and H. J. Dundas, Resistance of Stainless Steel to Crevice Corrosion in
Seawater, Mater. Performance, 23, 39 (1984).
51
14. C. O. A. Olsson, The Influence of Nitrogen and Molybdenum on Passive Films Formed on
the Austeno-Ferritic Stainless Steel 2205 Studied by AES and XPS, Corros. Sci., 37, 467
(1995).
15. J. Foct, T. Magnin, P. Perrot, and J. B. Vogt, Nitrogen Alloying of Duplex Stainless Steels,
Duplex Stainless Steels ‘91, Conf. Proc., Beaune, France, p. 49 (1991).
16. S. Bernhardsson, The Corrosion Resistance of Duplex Stainless Steels, Duplex Stainless
Steels ‘91, Conf. Proc., Beaune, France, p.185 (1991).
17. L. Weber and P. J. Uggowitzer, Partitioning of Chromium and Molybdenum in Super
Duplex Stainless Steel with Respect to Nitrogen and Nickel Content, Mater. Sci. Eng., A,
242, 222 (1998).
18. R. A. Perren, T. A. Suter, P.J. Uggowitzer, L. Weber, R. Magdowski, H. Böhni, and M. O.
Speidel, Corrosion Resistance of Super Duplex Stainless Steels in Chloride Ion
Containing Environments: Investigations by Means of a New Microelectrochemical
Method I. Precipitation-free States, Corros. Sci, 43, 707 (2001).
19. L.F. Garfias-Mesias and J. M. Sykes, Metastable Pitting in 25 Cr Duplex Stainless Steel,
Corros. Sci, 41, 959 (1999).
20. Y. Kobayashi, S. Virtanen, and H. Böhni, Microelectrochemical Studies on the Influence
of Cr and Mo on Nucleation Events of Pitting Corrosion, J. Electrochem. Soc., 147, 155
(2000).
21. H. Böhni, T. Suter, and F. Assi, Micro-electrochemical Techniques for Studies of
Localized Processes in the Nanometer Range, Surf. Coatings Tech., 130, 80 (2000).
22. I. Annergren, Electrochemical Impedance Spectroscopy for In-Situ Studies of Anodic
Dissolution and Pitting Corrosion of Iron-Chromium Alloys, Doctoral Thesis, Royal
Institute of Technology, Stockholm, Sweden, (1996).
23. E. Bayet, F.Huet, M. Keddam, K. Ogle, and H. Takenouti, Adaptation of the Scanning
Vibrating Electrode Technique to AC Mode: Local Electrochemical Impedance
Measurement, Mater. Sci Forum, 289-292, 57 (1998).
52
24. H. Uchida, M. Yamashita, S. Inoue, and K. Koterazawa, In-situ Observations of Crack
Nucleation and Growth During Stress Corrosion by Scanning Vibrating Electrode
Technique, Mater. Sci. Eng. A, 319-321, 496 (2001).
25. D.A. Sargeant and G. I. Ronaldson, Quantitative Measurements of Localized Corrosion
Using the Scanning Reference Electrode Technique on Type 316 Stainless Steel,
Microscopy & Analysis, 52, 21 (1996).
26. C. J. Lin, J. L. Luo, X. D. Zhuo, and Z. W. Tian, Scanning Microelectrode Studies of
Early Pitting Corrosion of 18/8 Stainless Steel, Corrosion (Houston), 54, 265 (1998).
27. A. Miyasaka and H. Ogawa, In-Situ Observation of a Stainless Steel Surface in Aqueous
Solutions Using Scanning Tunneling Microscope, Corros. Sci., 31, 99 (1990).
28. F. R. F. Fan and A. J. Bard, In-Situ Scanning Tunneling Microscopic Study of the
Corrosion of Type 304L Stainless Steel in Aqueous Chloride Media, J. Electrochem. Soc.,
136, 166 (1989).
29. R. M. Rynders, C.-H. Paik, R. Ke, and R. C. Alkire, Use of In-Situ Atomic Force
Microscopy to Image Corrosion at Inclusions, J. Electrochem. Soc., 141, 1439 (1994).
30. I. Reynaud-Laporte, M. Vayer, J. P. Kauffman, and R. Erre, An Electrochemical-AFM
Study of the Initiation of the Pitting Corrosion of a Martensitic Stainless Steel, Microsc.
Mircroanal. Microstruct., 8, 175 (1997).
31. R. E. Williford, C. F. Windisch Jr., and R. H. Jones, In-situ Observations of the Early
Stages of Localized Corrosion Using the Electrochemical Atomic Force Microscope, Mat.
Sci & Eng. A, 288, 54 (2000).
32. L.F. Garfias-Mesias and D. J.Siconolfi, In-situ High-Resolution Microscopy on Duplex
Stainless Steels, J. Electrochem. Soc., 147, 2525 (2000).
33. G. Gugler, J. D. Neuvecelle, P. Mettraux, E. Rosset, and D. Landolt, In- Situ AFM
Investigation of Pitting, The Inst. of Materials, London, Book no 577, 274 (1994).
34. H. Tanabe, K. Togashi, T. Misawa, U. Kamachi Mudali, In-situ pH Measurements During
Localised Corrosion of Type 316LN Stainless Steel Using Scanning Electrochemical
Microscopy, J. Mater. Sci. Letters, 17, 551 (1998).
53
35. C. H. Paik, H. S. White, and R. C. Alkire, Scanning Electrochemical Microscopy of
Dissolved Sulfur Species from Inclusions in Stainless Steel, J. Electrochem. Soc., 147,
4120 (2000).
36. Y. Zhu and D. E. Williams, Scanning Electrochemical Microscopic Observation of a
Precursor State To Pitting Corrosion of Stainless Steel, J. Electrochem. Soc., 144, L43
(1997).
37. D. E. Williams, T. F. Mohiuddin, and Y. Zhu, Elucidation of a Trigger Mechanism for
Pitting Corrosion of Stainless Steels Using Submicron Resolution Scanning
Electrochemical and Photoelectrochemical Microscopy, J. Electrochem. Soc., 145, 2664
(1998).
38. Y. Zhu and D. E. Williams, Explanation for Initiation of Pitting Corrosion of Stainless
Steels at Sulfide Inclusions, J. Electrochem. Soc., 147, 1763 (2000).
39. M. Stratmann, The Investigation of the Corrosion Properties of Metals, Covered with
Adsorbed Electrolyte Layers - A New Experimental Technique, Corr. Sci. 27, 869 (1987).
40. L. T. Han and F. Mansfeld, Scanning Kelvin Probe Analysis of Welded Stainless Steel,
Corr. Sci. 39, 199 (1997).
41. C. Chen, C. B. Breslin, and F. Mansfeld, Scanning Kelvin Probe Analysis of the Potential
Distribution under Small Drops of Electrolyte, Mat. Sci. Forum, 289-292, 181 (1998).
42. H. Böhni, T. Suter, and A. Schreyer, Micro- and Nanotechniques to Study Localized
Corrosion, Electrochim. Acta, 40, 1361 (1995).
43. S. Virtanen, A. Schreyer, and H. Böhni, In-Situ STM and AFM Characterization of
Passivity on Stainless Steels, in Proc. 12th Int. Corr. Congr., Houston, p. 2142 (1993).
44. J. H. W. de Wit, D. H. van der Weijde, and A. J. de Jong, Local Measurements in
Electrochemistry and Corrosion Technology, Mater. Sci Forum, 289-292, 69 (1998).
45. E. Schmitt-Rieder, X. Q. Tong, J. P. G. Farr, and M. Aindow, In- Situ SPM Observations
of Corrosion Processes on a Duplex Stainless Steel in Saline Solutions, in Proc. Electron
Microscopy and Analysis, Birmingham, 247 (1995).

54
46. P. Schmutz and G. S. Frankel, Characterization of AA2024-T3 by Scanning Kelvin Probe
Force Microscopy, J. Electrochem. Soc., 145, 2285 (1998).
47. P. Schmutz and G. S. Frankel, Corrosion Study of AA2024-T3 by Scanning Probe Force
Microscopy and In situ Atomic Force Microscopy Scratching, J. Electrochem. Soc., 145,
2295 (1998).
48. V. Guillaumin, P. Schmutz, and G. S. Frankel, Characterization of Corrosion Interfaces
by the Scanning Probe Force Microscopy Technique, J. Electrochem. Soc., 148, B163
(2001).
49. P. Campestrini, E. P. M. Van Westing, H. W. van Rooijen, and J. H. W. de Wit, Relation
Between Microstructural Aspects of AA2024 and its Corrosion Behaviour Investigated
Using AFM Scanning Potential Technique, Corros. Sci., 42, 1853 (2000).
50. H. Masuda, Effect of Magnesium Chloride Liquid Thickness on Atmospheric Corrosion of
Pure Iron, Corrosion (Houston), 57, 99 (2001).
51. Sandvik Steel Corrosion Handbook-Stainless Steels, AB Sandvik Steel and Avesta
Sheffield AB, p. 16 (1994).
52. D. A. Jones, Principles and Prevention of Corrosion, Macmillan Publishing Company, p.
125 (1992).
53. J. Castle, Survey of SPM Methods and their Comparison with other Microscopical
Techniques, Lecture 1 in the course Scanning Probe Microscopy: Principles and Practice,
University of Surrey, 18-22 January 1999.
54. R. Guckenberger, STM, in R. J. Colton, A. Engel, J. E. Frommer, H. E. Gaub, A. A.
Gewirth, R. Guckenberger, W. M. Heckl, B. Parkinson, J. Rabe, Editors, Procedures in
Scanning Probe Microscopes, Wiley & Sons, p. 50 (1998).
55. P.A. Christensen and A. Hamnett, Techniques and Mechanisms in Electrochemistry.
Blackie Academic & Professional, p. 67 (1994).
56. M. Virkin, High Resolution Studies of Heterogeneous Processes with the Scanning
Electrochemical Microscope, Mikrochimica Acta, 130, 127 (1999).

55
5 7 . J. Wittborn, Nanoscale Studies of Functional Materials using Scanning Probe
Microscopy, Doctoral thesis. Royal Institute of Technology, Stockholm, Sweden, p. 10
(2000).
58. A. Dias and M. S. Andrade, Atomic Force and Magnetic Force Microscopies Applied to
Duplex Stainless Steels, Appl. Surf. Sci., 161, 109 (2000).
59. B. R. A. Neves and M. S. Andrade, Identification of two Patterns in Magnetic Force
Microscopy of Shape Memory Alloys, Appl. Phys. Lett., 74, 2090 (1999).
60. C. Chen and F. Mansfeld, Potential Distribution in the Evans Drop Experiment, Corr. Sci.
39, 409 (1997).
61. M. Stratmann and H. Streckel, On the Atmospheric Corrosion of Metals which are
Covered with Thin Electrolyte Layers- I. Verification of the Experimental Technique,
Corros. Sci., 30, 681 (1990).
62. M. Stratmann and H. Streckel, On the Atmospheric Corrosion of Metals which are
Covered with Thin Electrolyte Layers-II. Experimental Results, Corros. Sci., 30, 697
(1990).
63. M. Stratmann and H. Streckel, On the Atmospheric Corrosion of Metals which are
Covered with Thin Electrolyte Layers-III. The Measurement of Polarisation Curves on
Metal Surfaces which are Covered by Thin Electrolyte Layers, Corros. Sci., 30, 715
(1990).
64. H. O. Jacobs, H. F. Knapp, S. Müller, and A. Stemmer, Surface Potential Mapping: A
Qualitative Material Contrast in SPM, Ultramicroscopy, 69, 39 (1997).
65. H. O. Jacobs, H. F. Knapp, and A. Stemmer, Practical Aspects of Kelvin Probe Force
Microscopy, Rev. Sci. Instrum., 70, 1756 (1999).
66. M. P. Seah and D. Briggs, A Perspective on the Analysis of Surfaces and Interfaces,
Chapter 1 in Practical Surface Analysis, 2nd Edition, M. P. Seah and D. Briggs Editors,
John Wiley & Sons, New York, USA, p. 5 (1990).
67. S. Mischler, H. J. Mathieu, and D. Landolt, Investigation of a Passive Film on an Iron-
Chromium Alloy by AES and XPS, Surf. Interface. Anal., 11, 182 (1998).

56
68. R. F. A. Jargelius-Pettersson, The Influence of N, Mo and Mn on the Microstructure and
Corrosion Resistance of Austenitic Stainless Steels, Doctoral Thesis, Royal Institute of
Technology, Stockholm, Sweden, p. 10 (1998).
69. R. Qvarfort, Transpassive Corrosion of High Alloy Stainless Steels. Part 2: Investigations
of the Secondary Transpassive Range, CITU Hda Research Report 1998/003-R, ISSN
1401-5935 p. 10 (1998).
70. E. Schmitt-Rieder, M. Ashworth, and J. P. G. Farr, The Effect of Nitrogen on the Stability
of the Passive Film on a Zeron 100 Super Duplex Stainless Steel, Electrochem. Solid-State
Lett., 2, 19 (1999).
71. J. W. Schultze and M. Schweinsberg, From pm to Km: Scaling Up and Scaling Down of
Electrochemical Systems with TiO2 and ZrO2 Passive Films as an Example, Electrochim.
Acta, 43, 2761 (1998).
72. E. Symniotis, Galvanic Effects on the Active Dissolution of Duplex Stainless Steels,
Corrosion (Houston), 46, 2 (1990).
73. E. Symniotis, The Influence of the Phase-Area Ratio and Microstructure on the
Dissolution Rate of Duplex Stainless Steels in Acids, in Proc. 11th Int. Corr. Congr.,
Florence, p. 5.203 (1990).
74. E. Symniotis, Dissolution Mechanism of Duplex Stainless Steels in the Active-to-Passive
Transition Range and the Role of Microstructure, Corrosion (Houston), 51, 8 (1995).
75. S. Hertzman, W. Roberts, and M. Lindenmo, Microstructure and Properties of Nitrogen
Alloyed Duplex Stainless Steel After Welding, in Proceedings of the DSS conference, The
Hague, Netherlands, p. 257 (1986).
76. Y. C. Lu, M. B. Ives, and C. R. Clayton, Synergism of Alloying Elements and Pitting
Corrosion Resistance of Stainless Stainless Steels, Corros. Sci, 35, 89 (1993).
77. G. P. Halada, D. Kim, and C. R. Clayton, Influence of Nitrogen on Electrochemical
Passivation of High-Nickel Stainless Steels and Thin Molybdenum-Nickel Films,
Corrosion (Houston), 52, 36 (1996).

57
78. I. Olefjord and C. R. Clayton, Surface Composition of Stainless Steel during Active
Dissolution and Passivation, ISIJ International, 31, 134 (1991).
79. L. Wegrelius and I. Olefjord, Dissolution and Passivation of Stainless Steels Exposed to
Hydrochloric Acid, Mater. Sci Forum, 185-188, 347 (1995).
80. L. Wegrelius and I. Olefjord, Influence of N on Passivation of Stainless Steels, Corros.
Sci, 38, 1203 (1996).
81. A. J. Sedriks, Corrosion of Stainless Steels, John Wiley & Sons, Inc., p. 142 (1996).