Embed Size (px)
Citation preview

CorrelationsCorrelations

OutlineOutline What is a correlation?What is a correlation? What is a scatterplot?What is a scatterplot? What type of information is provided by a What type of information is provided by a
correlation coefficientcorrelation coefficient Pearson correlationPearson correlation How is pearson calculatedHow is pearson calculated Hypothesis testing with pearsonHypothesis testing with pearson Correlation & causationCorrelation & causation Factors affecting correlation coefficientFactors affecting correlation coefficient Coefficient of determinationCoefficient of determination Correlation in research articlesCorrelation in research articles Other types of correlationOther types of correlation

Distinguishing Distinguishing Characteristics of Characteristics of CorrelationCorrelation Correlational procedures involve Correlational procedures involve
one sample containing all pairs of one sample containing all pairs of X and Y scoresX and Y scores
Neither variable is called the IV or Neither variable is called the IV or DVDV
Use the individual pair of scores Use the individual pair of scores to create a scatterplotto create a scatterplot

Correlation CoefficientCorrelation Coefficient
Describes three characteristics of Describes three characteristics of the relationship:the relationship:
1.1.DirectionDirection
2.2.FormForm
3.3.DegreeDegree

What Is A Large What Is A Large Correlation? Correlation?
Guidelines:Guidelines:– 0.00 to <±.30 – low0.00 to <±.30 – low– ±.30 to <±.50 – moderate±.30 to <±.50 – moderate– >±.50 – high>±.50 – high
While 0 means no correlation at all, While 0 means no correlation at all, and 1.00 represents a perfect and 1.00 represents a perfect correlation, we cannot say that .5 is correlation, we cannot say that .5 is half as strong as a correlation of half as strong as a correlation of 1.01.0

Pearson CorrelationPearson Correlation
Used to describe the linear Used to describe the linear relationship between two variables relationship between two variables that are both interval or ratio variablesthat are both interval or ratio variables
The symbol for Pearson’s correlation The symbol for Pearson’s correlation coefficient is coefficient is rr
The underlying principle of The underlying principle of rr is that it is that it compares how consistently each Y compares how consistently each Y value is paired with each X value in a value is paired with each X value in a linear mannerlinear manner

Calculating Pearson Calculating Pearson rr
The degree to which X & Y vary together (covary)
The degree to which X & Y vary apart
The degree to which X & Y vary together (covary)
Variability due to error and chance

Calculating Pearson rCalculating Pearson r
There are 3 main steps to r:There are 3 main steps to r:1.1. Calculate the Sum of Products (SP)Calculate the Sum of Products (SP)
2.2. Calculate the Sum of Squares for X Calculate the Sum of Squares for X (SS(SSXX) and the Sum of Squares for Y ) and the Sum of Squares for Y (SS(SSYY))
3.3. Divide the Sum of Products by the Divide the Sum of Products by the combination of the Sum of Squarescombination of the Sum of Squares

Pearson Correlation - Pearson Correlation - FormulaFormula
yxSSSS
SPr

1) Sum of Products1) Sum of Products To determine the degree to which To determine the degree to which
X & Y X & Y covarycovary (numerator) (numerator)– We want a score that shows all of the We want a score that shows all of the
deviation X & Y have deviation X & Y have in commonin common– Sum of ProductsSum of Products (also known as the (also known as the
Sum of the Sum of the Cross-productsCross-products))– This score reflects the This score reflects the shared shared
variabilityvariability between X & Y between X & Y– The degree to which X & Y deviate The degree to which X & Y deviate
from the meanfrom the mean together together
SP = ∑(X – MX)(Y – MY)

Sums of Product Sums of Product DeviationsDeviations Computational FormulaComputational Formula
n
YXXYPS
n in this formula refers to the number of pairs of scores
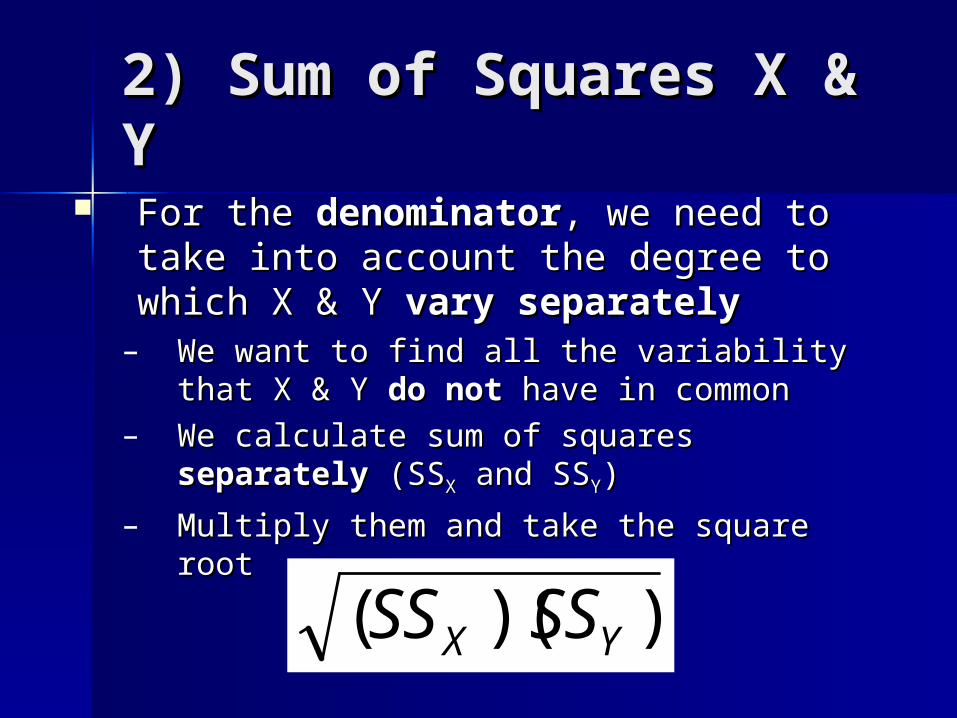
2) Sum of Squares X & 2) Sum of Squares X & YY
For the For the denominatordenominator, we need to take , we need to take into account the degree to which X & Y into account the degree to which X & Y vary separatelyvary separately
– We want to find all the variability that X & Y We want to find all the variability that X & Y do notdo not have in common have in common
– We calculate sum of squares We calculate sum of squares separatelyseparately (SS(SSXX and SS and SSYY))
– Multiply them and take the square rootMultiply them and take the square root
))(( YX SSSS
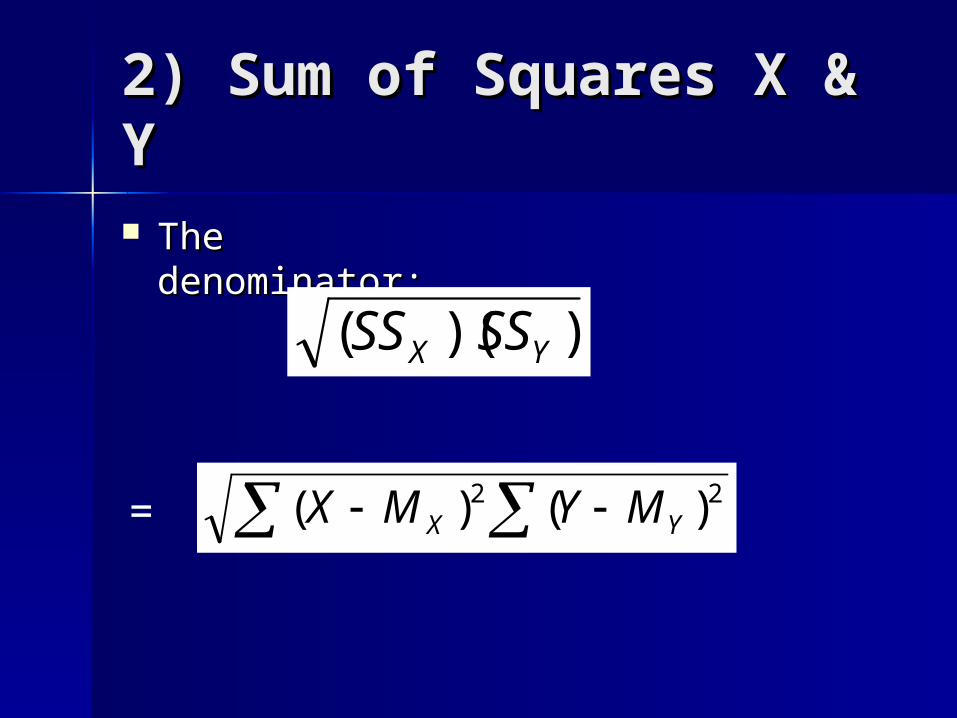
2) Sum of Squares X & 2) Sum of Squares X & YY The denominator:The denominator:
=
))(( YX SSSS
22 )()( YX MYMX

Hypothesis testing Hypothesis testing with rwith r Step 1) Set up your hypothesisStep 1) Set up your hypothesis
– Ho: Ho: ρρ = 0; There is no correlation in = 0; There is no correlation in the population between the number the population between the number of errors and the number of drinksof errors and the number of drinks
– H1: H1: ρρ ≠ 0; There is a correlation in ≠ 0; There is a correlation in the population between the number the population between the number of errors and the number of drinksof errors and the number of drinks

Hypothesis testing Hypothesis testing with rwith r Step 2) Find your critical r-scoreStep 2) Find your critical r-score
– Alpha and degrees of freedomAlpha and degrees of freedom αα = .05, two-tailed = .05, two-tailed Degrees of freedom: n – 2Degrees of freedom: n – 2

Hypothesis testing Hypothesis testing with rwith r Step 3) Calculate your r-obtainedStep 3) Calculate your r-obtained Step 4) Compare the r-obtained to r-Step 4) Compare the r-obtained to r-
critical, and make a conclusioncritical, and make a conclusion– If r-obtained < r-critical = fail to reject If r-obtained < r-critical = fail to reject
HoHo– If r-obtained > r-critical = reject HoIf r-obtained > r-critical = reject Ho

Correlation and Correlation and CausalityCausality A statistical relationship can exist A statistical relationship can exist
even though one variable does even though one variable does not cause or influence the othernot cause or influence the other
Correlational research CANNOT Correlational research CANNOT be used to infer causal be used to infer causal relationships between two relationships between two variablesvariables

Correlation and Correlation and CausalityCausality
When two variables are When two variables are correlated, three correlated, three possible directions of possible directions of causalitycausality– 1st variable causes 2nd1st variable causes 2nd– 2nd variable causes 1st2nd variable causes 1st– Some 3rd variable Some 3rd variable
causes both the 1st and causes both the 1st and the 2ndthe 2nd
There is inherent There is inherent ambiguity in ambiguity in correlationscorrelations

Factors Affecting Factors Affecting Correlation:Correlation:Watch out for “outliers”Watch out for “outliers”
r = -.08r2 = .016
r = .85r2 = .72
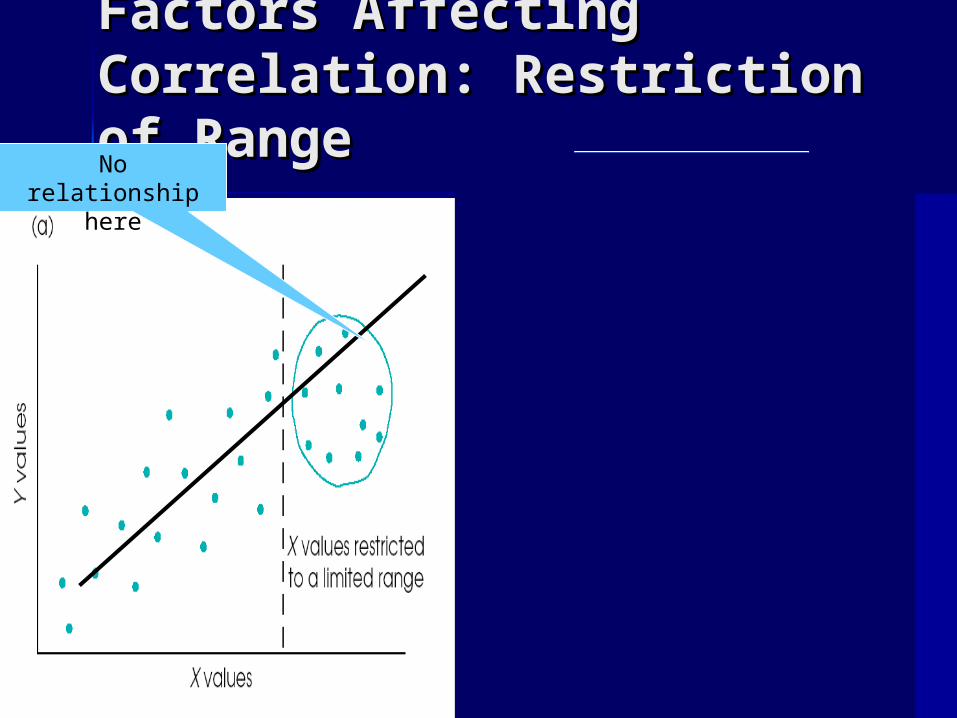
Factors Affecting Factors Affecting Correlation: Restriction of Correlation: Restriction of RangeRange
No relationship here
Strong relationship here

Coefficient Of Coefficient Of DeterminationDetermination
The squared correlation (rThe squared correlation (r22) measures the proportion of variability in the data that is explained by the relationship between X and Y
Coefficient of Non-Determination (1-Coefficient of Non-Determination (1-rr22): percentage of variance not ): percentage of variance not accounted for in Yaccounted for in Y

Correlation in Correlation in Research ArticlesResearch Articles
Coleman, Casali, & Wampold (2001). Adolescent strategies for coping with cultural diversity. Journal of Counseling and Development, 79, 356-362

Other Types of Other Types of CorrelationCorrelation
Spearman’s Rank CorrelationSpearman’s Rank Correlation– variable X is ordinal and variable Y is ordinalvariable X is ordinal and variable Y is ordinal
Point-biserial correlationPoint-biserial correlation– variable X is nominal and variable Y is variable X is nominal and variable Y is
intervalinterval Phi-coefficientPhi-coefficient
– variable X is nominal and variable Y is also variable X is nominal and variable Y is also nominal nominal
Rank biserialRank biserial– variable X is nominal and variable Y is ordinalvariable X is nominal and variable Y is ordinal

Example #2Example #2
Hours (X)Hours (X) Errors (Y)Errors (Y)
00 1919
11 66
22 22
44 11
44 44
55 00
33 33
55 55

Create ScatterplotCreate Scatterplot

n
YXXYPS

n
XXSS X
22 )(

n
YYSS Y
22 )(

Step 1- Set Up Your Step 1- Set Up Your HypothesisHypothesis
Ho:Ho:
H1: H1:

Step 2 - Find critical r-Step 2 - Find critical r-scorescore
Alpha and degrees of freedomAlpha and degrees of freedomαα = .05, two-tailed = .05, two-tailedDegrees of freedom: n – 2Degrees of freedom: n – 2

Step 3 - Calculate r-Step 3 - Calculate r-obtainedobtained
yxSSSS
SPr

Step 4 - Compare R-obtained Step 4 - Compare R-obtained To R-critical, & Make A To R-critical, & Make A ConclusionConclusion
Step 4 – Compute rStep 4 – Compute r22