Embed Size (px)
Citation preview

Pergamon
OOOl-4575(93)E0007-T
Accid. Anal. and Prev., Vol. 26, No. 3, pp. 277-286, 1994 Copyright 0 1994 Elsevier Science Ltd Printed in the USA. All rights reserved
OOOl-4575/94 $6.00 + .OO
CORRELATION OF OCCUPANT INJURIES IN
TRAFFIC ACCIDENTS AND DUMMY RESPONSES IN
MATHEMATICAL SIMULATIONS*
HANS NORIN
Traffic Accident Research, Volvo Car Corporation, Gothenburg, Sweden
(Received 9 October 1992; in revised form 10 June 1993)
Abstract-This report describes a method of evaluating the real safety of a car or a design feature by correlating data from mathematical simulations and occupant data from accidents. Extensive accident material with a certain car model is used to describe facial injuries for belted drivers in frontal impacts. In a carefully validated model, simulations are carried out at different crash test speeds and for different dummy sizes. The data from the accident material and from the simulations are correlated with special attention to crash severity, occupant size, trajectory, and contact speed.
Keywords-Simulation, Facial injury, Accident data, Correlation
INTRODUCTION
When developing passive safety in a car, it is desir- able that the safety potential of different design solu- tions be assessed before the car is released in traffic. To do this is an effective manner, it is necessary to combine injury data from traffic accidents with data from crash tests or mathematical simulations.
The evaluation of the design in question must be done in several crash modes, taking into account the distribution of essential parameters. One such significant parameter is crash severity. In many re- ports (Lowne and Wall 1976; Mills and Hobbs 1984; Horsch 1987; Jones and Whitfield 1988; Korner 1989; Norin et al. 1991) the risk of receiving a certain injury as a function of the crash severity is discussed. Crash severity can be expressed in different ways.
In this report, crash severity in laboratory tests or mathematical simulations is termed “crash test speed”. “Contact speed” is the relative speed be- tween some part of the occupant/dummy and some part of the car interior at the time of contact.
Another essential parameter is occupant size. Depending on the occupant size, the occupant will possibly hit different parts of the interior during the collision phase. This has differing degrees of influ- ence on the risk of injury.
*Presented at the 36th Annual Meeting of the Association for Advancement of Automotive Medicine, October 5-7, 1992, Portland, Oregon.
277
In a previous report (Norin and Isaksson-Hell- man 1992), a method was presented that combined injury data for belted drivers in frontal collisions directly with dummy responses from mathematical simulations or crash tests, taking into account the distribution of crash severity and occupant size.
The level of a dummy response, e.g. head injury criterion (HIC) depends on many factors: if, when, and where the head impact occurs; the energy ab- sorbing characteristics of the impacted object; con- tact’speed; the impact location on the head, etc. These factors vary depending on other factors such as crash test speed, occupant size, the movement of the occupant in relation to the occupant compart- ment, etc.
In this report a method is described where, by mathematical MADYMO simulation (TN0 1990a, 1990b), the movement of an occupant in relation to the occupant compartment is described. These simulations will give an idea of the contact area and the contact speed between the head of an occupant and the interior (e.g. the steering wheel) during a front-end impact.
These data are directly correlated to accident material, which will give a relation between injury risk and contact speed. Facial injuries to belted driv- ers in front-end impacts are often caused by contact with the steering wheel (Rogers, Hill, and Mackay 1992; Yoganandan et al. 1988; Zuby 1987). This re- port concentrates on facial injuries to drivers and relates these injuries to contact speed and impact location on the steering wheel.

278 H. NORIN
Fig. 1. Flowchart for calculation procedure.
METHOD
The method is based on a combination of data from mathematical simulations and data from traffic accidents. The idea is to determine head contacts with different parts of the vehicle interior. Also, the contact speed will be estimated and used as a new measurement of crash severity. The injury risk as a function of the contact speed will be determined.
Below a brief description of the model proce- dure is first presented (Fig. 1) and then a more thor- ough description of each step is given. Each new section refers to the boxes in Fig. 1, indicating which part of the calculation procedure the chapter will discuss.
From the accident material [l]*, crash severity distribution [2] and distribution of occupant height [3] are obtained.
These two parameters are now put together to get their combined distribution [4]. (See also Fig. 2.)
Using mathematical simulations [5], the trajec- tory of three different dummies (5,50, and 95 percen-
‘Numerals in brackets refer to the boxes in Fig. 1.
Fig. 2. Combination of driver height distribution and EBS distri- bution, f(cs, h).
tile) at four different crash test speeds are computed. (See also Fig. 3.)
From the dummies’ trajectories, the crash test speed interval within which a certain part of the dummy hits a certain part of the interior can be estimated [6]. (See also Fig. 4.)
The crash test speed interval (with defined inte- rior contact) for each dummy size is now used and the area (interpolated between the dummies) that represents all cases where there is relevant interior contact is determined 171. (See also Fig. 5.) With the knowledge from [4] the proportion of all cases in this contact situation is obtained.
From the simulations, the contact speeds for the three dummy sizes at different crash test speeds are computed [8]. (See also Fig. 6.)
Using the result in [8], the contact speed for each possible combination of crash test speed and occupant height, within the defined area [7], is calcu- lated [9]. (See also Fig. 7.)
From the accident material [I], all cases where the occupant height and the crash speed are within the area described in [7] are selected and checked to see whether the occupants have any injury (ac- cording to any definition). From 191 the contact
Fig. 3. The MADYMO 3D model of the female 5th percentile Hybrid 111 dummy in the driver position of a Volvo 240.

Occupant injury data correlated with dummy response data 279
Fig. 4. Determination of crash test speed intervals where impact between head and steering wheel occurs.
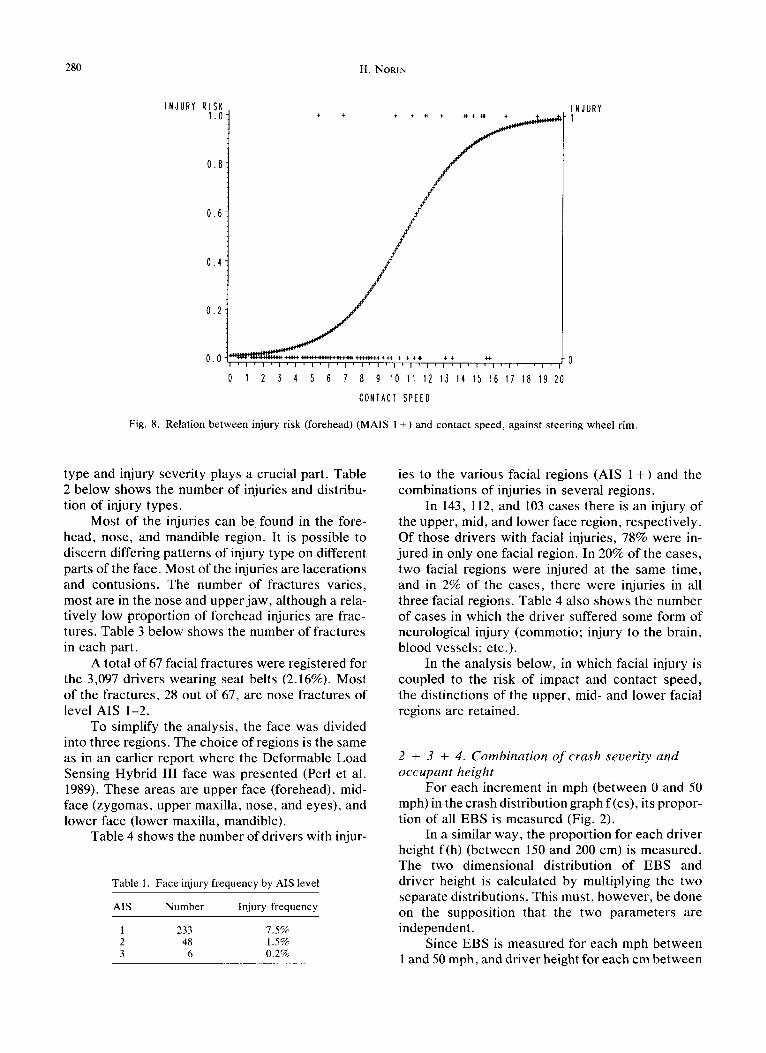
speed for each of these occupants is obtained and from this data the injury risk as a function of contact speed can be determined [lo]. (See also Fig. 8.)
By multiplying the combined distribution of crash test speed/occupant height [4] and the relevant injury risk [lo], the relative injury frequency for the injury in question is obtained [ 111.
The procedure described above will be used when combining accident data for a specific vehicle type with mathematical simulations for an identical product. From this, a relation between injury risk and contact speed is obtained. This relation will be used later when the safety level of a proposed design change of a product, e.g. a steering wheel, is evalu- ated. (See the section, “Calculation of injury fre- quency”.)
To simplify the illustration of the method the fol- lowing presentation will focus on belted drivers in frontal impacts. Driver injuries to the face and head (AISI+ , AIS2+) (Committee on Injury Scaling 1980) sustained on impact with the steering wheel rim and the steering wheel centre are studied. Equiv- alent barrier speed (EBS) is used as a crash severity parameter in the accident material. EBS is calcu-
Fig. 5. Contact between the forehead and the upper steering wheel rim.
Contact speed
(mph)
95 percentile I-
50 percentrle 2
5 percentile 3 ~-~~~~
5 10 15 20 25 30 35 40 45 50 (mph)
Fig. 6. Contact speeds for each dummy size as a function of crash test speed.
lated according to a method developed at Volvo (Nilsson-Ehle, Norin, and Gustafsson 1982; Mag- nusson and Jorgensson 1987). The size of the occu- pant is represented by the driver height.
Other types of accidents and/or injuries can be analysed in a similar way, as long as relevant acci- dent material is available and there is a possibility of simulating the accident types and injury mecha- nisms in a laboratory or in a simulation model.
1. Accident data The accident material used in this report is
based on 3,097 frontal accidents with belted drivers in Volvo 240 cars. In this example, only facial injur- ies are considered. For each accident there are data about the configuration, the car, and the occupants and their injuries. For each case, EBS is calculated. The highest face injury severity in the material is AIS3. The total face injury frequencies (MAIS) are presented below in Table 1.
Of the drivers, 9.2 percent had an injury to the face. Most of these injuries were at level AISl (7.5%).
In the following analysis, the choice of injury
Driver herght (cm) rash Seventy (mph)
Fig. 7. Contact speed between forehead and steering wheel rim.
280 H. NORIN
INJURY INJURY -1
0 1 2 3 4 5 6 7 8 9 IO 11 12 13 14 15 If, 17 18 19 20
CONTACT SPEED
Fig. 8. Relation between injury risk (forehead) (MAIS 1 +) and contact speed, against steering wheel rim.
type and injury severity plays a crucial part. Table 2 below shows the number of injuries and distribu- tion of injury types.
Most of the injuries can be, found in the fore- head, nose, and mandible region. It is possible to discern differing patterns of injury type on different parts of the face. Most of the injuries are lacerations and contusions. The number of fractures varies, most are in the nose and upper jaw, although a rela- tively low proportion of forehead injuries are frac- tures. Table 3 below shows the number of fractures in each part.
A total of 67 facial fractures were registered for the 3,097 drivers wearing seat belts (2.16%). Most of the fractures, 28 out of 67, are nose fractures of level AIS l-2.
To simplify the analysis, the face was divided into three regions. The choice of regions is the same as in an earlier report where the Deformable Load Sensing Hybrid III face was presented (Per1 et al. 1989). These areas are upper face (forehead), mid- face (zygomas, upper maxilla, nose, and eyes), and lower face (lower maxilla, mandible).
Table 4 shows the number of drivers with injur-
Table 1. Face injury frequency by AIS level
AIS Number Injury frequency
1 233 7.5% 2 48 1.5% 3 6 0.2%
ies to the various facial regions (AIS 1 +) and the combinations of injuries in several regions.
In 143, 112, and 103 cases there is an injury of the upper, mid, and lower face region, respectively. Of those drivers with facial injuries, 78% were in- jured in only one facial region. In 20% of the cases, two facial regions were injured at the same time, and in 2% of the cases, there were injuries in all three facial regions. Table 4 also shows the number of cases in which the driver suffered some form of neurological injury (commotio; injury to the brain, blood vessels; etc.).
In the analysis below, in which facial injury is coupled to the risk of impact and contact speed, the distinctions of the upper, mid- and lower facial regions are retained.
2 + 3 + 4. Combination of crash severity and
occupant height For each increment in mph (between 0 and 50
mph) in the crash distribution graph f (cs), its propor- tion of all EBS is measured (Fig. 2).
In a similar way, the proportion for each driver height f(h) (between 150 and 200 cm) is measured. The two dimensional distribution of EBS and driver height is calculated by multiplying the two separate distributions. This must, however, be done on the supposition that the two parameters are independent.
Since EBS is measured for each mph between 1 and 50 mph, and driver height for each cm between

Occupant injury data correlated with dummy response data 281
Facial area
Table 2. Number of injuries and distribution of injury types
Number of injuries Distribution of type of injury for each facial area (%)
No AIS 1 AIS 2 AIS 3 Laceration Abrasion Contusion Fracture info
Forehead 125 13 4 44 16 36 4 -
Up maxilla and 8 7 2 18 12 35 29 6 zygomas region
Eyes 23 1 33 - 63 - 4 Nose 64 19 13 10 43 34 - Low maxilla 24 7 32 6 26 36 -
region Mandible region 46 12 1 46 3 27 22 2 Mouth 25 - 28 8 36 20 8
150 and 200 cm, this will give a distribution with a driver’s and passenger’s positions. The crash test total of 50 x 51 = 2550 points (Fig. 2). speeds chosen were: IS, 25, 35, and 40 mph.
The bar at each point of intersection in Fig. 2 consequently shows how often this combination of driver height and EBS occurs in relation to all possi- ble combinations.
In addition to the full-scale tests, two Hyge sled test series were run to further study the movement of the dummy and the protection criteria during a crash. These tests were carried out with 50th percen- tile and 5th percentile Hybrid III dummies. The tests were run at only two crash speeds, 25 and 35 mph, but in general with the same conditions as in the full-scale tests, i.e. the same vehicle type, crash pulse, belts, etc.
5. Simulation data Accidents can be reconstructed in crash test
laboratories or in mathematical simulation models. Crash tests in the form of full-scale impact tests and Hyge tests were run in the laboratory in order to achieve the required input data to validate the simu- lation model. A large quantity of data was recorded and used for the validation. To connect the labora- tory tests with the greatest possible amount of data from real crashes in the field, the Volvo 240 model was chosen for the crash tests.
Four cars were crashed in frontal collisions against a fixed barrier. The crashed cars were equipped with three-point retractor belts and were as nearly identical as possible in all other aspects.
Two 50 percentile Hybrid III (Part 572E) dum- mies were placed in the cars according to FMVSS (Federal Motor Vehicle Safety Standard) 208, in the
Table 3. Number of fractures for each facial region
Region AIS 1 AIS 2 AIS 3 Frequency (%)
The compatibility between the full-scale tests and the sled tests is judged as being very good. A MADYMO model (TN0 1990a) of the crashing Volvo 240 car and its restrained occupants was set up. Three different occupant sizes were modelled.
M50, the male 50th percentile Hybrid III dummy. Data according to (TN0 1990b) was used. F5, the female 5th percentile Hybrid III dummy. Data were based partly on a scaling of the M50 dummy and partly on data ob- tained by measurements on one of Volvo’s dummies (Fig. 3). M95, the male 95th percentile Hybrid III dummy. Data were based on a scaling of the M50 dummy.
Forehead 1 4 0.16 Up maxilla and 4 1 0.16
zygomas region
Nose 10 18 0.90 Low maxilla region 5 6 0.36 Mandible 3 10 0.42
region Mouth 5 0.16
Total 23 39 5 2.16
Table 4. Injuries to the upper, mid, and lower face
Region No. of injured Frequency (%) Neurological
u 97 34 15 M 61 21 13 L 66 23 11 U+M 27 9 5 u+L 13 5 8 M+L 18 6 4 U+M+L 6 2 6

282 H. NORIN
Table 5. Proportion of cases with and with- out contact
Proportion of all combination
X0 X 1,max
Contact speed
No impact Max. contact speed
Xl.min
100%
Min. contact speed
The quality of the model validation is important for this type of simulation where the movement of the dummy strongly influences important parame- ters such as contact location and contact speed.
In this validation, where full-scale tests and Hyge sled tests were run at different speeds, some important parameters were seating position, seat belt characteristics, and movement of body regions during impact. The validation is better described in reference (Norin et al. 1991).
To increase the accuracy of future simulations, the model needs to be continuously refined. Simu- lated crash tests were performed in the MADYMO model for the standard belt system.
6. Determination of crash test speed intervals in the case of interior contact
From the mathematical simulations, the head trajectories for different crash test speeds and for different dummy sizes are known. So is the angle of the head in relation to the vertical plane during the crash interval.
The approximate position of the dummy’s head at the moment of steering wheel contact, i.e. which part(s) of the face hit which part(s) of the steering wheel, can now be determined, as can the contact speed for each combination.
This is done for each simulated crash speed and for the three dummy sizes used. From these data
Table 6. Calculation of injury frequency
Proportion of all cases with contact Injury risk (R) Injury freq. (Xl) per contact per contact per contact speed speed speed
XI (max) X Rl(max) 3 P (max)
Xl(min) X Rl(min) 3 P (mm)
Total injury frequency per injury type: F = Z(fl).
and from trajectory plots, the EBS intervals within which certain parts of the head will hit the steering wheel rim and centre can be determined, Fig. 4.
Each of the four curves represents the location of certain parts of the face in relation to the steering wheel, for different impact speeds.
The head’s position at contact with the steering wheel (50th percentile dummy) in relation to the steering wheel at the four simulated crash test speeds is shown in Fig. 4. The position of different parts of the face/head in relation to the steering wheel at the first head contact with the wheel can be determined graphically. By projecting the steering wheel rim and its centre to the head position during contact with the steering wheel, the crash test speed interval in which each specific point on the face/head will hit the rim/steering wheel centre can be determined.
7. Proportion of occupants with head/interior contacts
To simplify the presentation, we chose a spe- cific head-to-steering wheel contact, namely contact between the upper face (forehead) and the upper steering wheel rim. In accordance with Fig. 4, the crash test speed intervals are determined for all three dummy sizes.
In Fig. 5 the highest and lowest crash test speed values where an upper face contact occurs (with the upper steering wheel rim) are plotted for each dummy size. Interpolation is made between the high- est crash test speed values of the 50th percentile and the 95th percentile dummies, and extrapolation is made to a driver height of 200 cm.
Correspondingly, interpolation is made be- tween the 50th percentile dummy and the 5th percen- tile dummy, and extrapolation is made out to the driver height of 150 cm. The procedure is repeated for the lowest crash severity values.
Now an area can be created which approxi- mately covers the points of intersection at which different drivers, according to the simulation, are likely to hit their foreheads against the upper rim of the steering wheel (Fig. 5).
The shaded area in Fig. 5 represents the combi- nations of driver height and crash test speed where impact takes place between the forehead and the steering wheel rim.
Each point of intersection, however, represents only a certain proportion of the total number of collisions.
The sum of proportions for each point of inter- section within the shaded area now constitutes the proportion of collisions where impact takes place between the forehead and the steering wheel rim.

Occupant injury data correlated with dummy response data 283
The proportion of cases with impact is designated X, and the proportion of cases without impact X,,.
8. Determination of contact speed From the mathematical simulations, the dummy
head speed at the moment of contact with the fixed steering wheel is known for the three dummy sizes and for the four crash test speeds. The contact speed between the forehead and the upper steering wheel rim is plotted for each crash test speed and for each dummy size (Fig. 6).
The contact speed varies, with both driver height and crash test speed levels. A difference can be seen in the trend for the 5th percentile dummy compared to the 50th percentile and the 95th percen- tile dummies. One reason for this difference might be that the validation of the 5th percentile dummy in the model was not based on a scaling of the 50th percentile dummy only, but also on data obtained from one of Volvo’s 5th percentile Hybrid III dummies.
9. Contact speed as a function of crash severity1 driver height
In Fig. 7 calculated contact speeds from Fig. 6 are plotted on the z-axis for upper and lower crash test speed values for each dummy size. A plane that passes through the apex of each value is now determined (SPLINE-procedure).
This gives a plane that gives the assumed con- tact speeds for all combinations of crash severity and driver height, within the defined area (Fig. 7). According to this procedure, it is now easy to deter- mine how X, (the proportion of cases with contact) is distributed among contact speeds.
1 + 9 + 10. Determination of injury risk as a function of contact speed
Injury risk as a function of contact speed, can now be determined. This is done by using the acci- dent material from which the population included in the area according to Fig. 5 is selected. These are the drivers who, according to the simulation results, would have experienced impact between forehead and steering wheel rim. Based on the knqwledge of the EBS value and driver height, the contact speed is determined for each of the drivers selected (Fig. 7).
For each driver, the assumed contact speed be- tween forehead and steering wheel rim is known as are the injuries sustained by the driver in the crash. Using logistic regression (Walker and Duncan 1967; Hosmer and Lemeshow 1989), injury risk as a func- tion of contact speed can now be determined (Fig. 8).
This new relationship, i.e. injury risk as a func- tion of contact speed, can be used to calculate the total injury frequency of forehead injuries in the type of vehicle represented by the accident material. This injury frequency should, of course, correspond to the relative injury frequency of the corresponding injury, which can be measured directly from the accident material.
4 + 10 + 11. Calculation of injury frequency When the proportion of all cases with contact
and injury risk for each contact speed are known, it is possible to calculate the injury frequency for each contact speed. These are then added together to a total injury frequency for the injury type in question.
When evaluating a product that has been modi- fied in some way, there are two alternatives.
First, when only the interior has been modified with regard to the location of the impact object, or if the crash pulse has been changed, the relationship between the contact speed and the injury risk that was calculated for the base variant is used directly. In this case, a new simulation can be run with the changed design and from this, another population with forehead/wheel rim contact and other values of contact speed will be receive-d. With these new values and the earlier obtained relation between in- jury risk and contact speed, a new injury frequency can be calculated.
Second, if the new variant of the vehicle has been modified with regard to the properties of the interior impact object (e.g. the energy absorption), a new relationship between contact speed and injury risk must be created. This can be done using compo- nent testing and applying a variant of a method de- scribed by Korner (1989).
It is here assumed that the relationship applies regardless of the size of the occupant. This means that it is sufficient to perform laboratory tests to obtain the new relationship, with one dummy size only. One possibility for such a component testing is to use a dummy head with a load sensitive face and let this strike, at different speeds, against the impact object of the base variant. In this way a relationship between the contact speed and the dummy response (force, etc.) is obtained.
We have the relationship of injury risk vs. con- tact speed for the base variant (Fig. 9). From compo- nent tests we obtain the relationship between con- tact speed and dummy response. We can now directly determine the relationship between injury risk and dummy response.
The new variant of the product is tested in a corresponding manner and we obtain new dummy

284 H. NORIN
Injury risk (R)
Dummy response (d)
Zontact peed (s)
Fig. 9. Relationship of injury risk vs. contact speed for the base variant.
responses. We now use the relationship we obtained between injury risk and dummy response, to deter- mine the new relationship between injury risk and contact speed (Fig. IO).
This relationship between injury risk (for a cer- tain part of the head) and contact speed (against a certain part of the interior) is a generally applicable risk function provided that:
(a) the criteria for measuring dummy response are valid for the injuries analysed;
(b) the type of accident analysed is sufficiently similar to the simulation chosen;
(c) the crash severity (not contact speed) is measured equivalently for the accidents and the simulations;
(d) for a given crash severity and occupant height, the contact speed measured in the simulations is equivalent to the correspond- ing situation in a traffic accident.
DISCUSSION
Dummy responses vary between similar crash tests. There are many reasons for this-for example, differences in vehicle retardation; dummy position-
Iniurv risk (R)
Contact speed (s)
bummy response (d)
Fig. 10. Relationship of injury risk vs. contact speed for the base variant and for the “new” variant.
ing; where, when, and how the actual impact takes place between the dummy’s head and the interior. Using one sole crash test to verify a product’s char- acteristics may therefore be very misleading. A se- ries of identical tests must be undertaken in order to reduce the uncertainty of assessment. The scope of the test will expand rapidly if corresponding tests are carried out for various occupant sizes (dummy size) and various impact forces. If any modifications are subsequently made, which is fairly normal during a car’s development phase, then a corresponding test series must be carried out once again.
With a properly validated simulation model, it is possible to increase the complexity of the tests at an earlier stage of the development process. It is vital that validation of the simulation model is based on a sufficiently comprehensive test programme so as to reduce the risk that “abnormal” test data is validated. Once validation is completed there is no dispersion; instead, every run based on identical preconditions offers the same result.
It is especially important that the pattern of movement of the mathematical dummy resembles dummy movement in the majority of crash tests for a given vehicle model and given crash type, for vari- ous occupant sizes and various crash speeds.
To assess which factors affect injury risk in various crash situations, it is necessary to be thor- oughly familiar with the various mechanisms in- volved during the crash sequence. For instance, it is important to understand the way in which the dummy’s pattern of movement affects contact risks, contact points, contact speeds, etc.
Crash tests and crash simulations make use of different types of dummy response to represent the risk of injury to occupants in corresponding situa- tions. However, there are many areas of uncertainty in the connection between personal injuries and dummy measurement data, for example, the degree to which a specific measurement variable correlates to various types of injury. When correlating accident data and laboratory data where comparisons are made between dummy responses and personal in- jury, it is therefore vital to make a precise and careful selection of the types of injury to be represented by a given measurement variable.
This report presents a means of replacing or supplementing assessments of injury risks via dummy responses with a direct connection of injury risk to a crash severity parameter assessed as having a reliable connection to injury risk. The crash sever- ity parameter selected is contact speed, in this exam- ple between the driver’s face and the steering wheel. The risk of injury for a given impact speed depends on which part of the face/head strikes the steering

Occupant injury data correlated with dummy response data 285
wheel and on the steering wheel’s properties with ties (stiffness, upholstery, etc.), type of restraint, regard to energy absorption, deformation, etc. etc.
This report analyses if, when, and how various parts of a driver’s face strike various parts of the steering wheel. This naturally requires that the dum- my’s simulated pattern of movement is sufficiently similar to the accident group covered by the simula- tion. There are naturally several potential pitfalls to be taken into account, such as the vehicle’s retarda- tion pulse, dissimilarities between various occupant sizes, the actual posture of the occupant, etc.
It is vital to choose the correct crash severity parameter. In the method presented, EBS was cho- sen. EBS is the speed at which a vehicle must hit a barrier in order to absorb the same amount of energy as that absorbed by a corresponding vehicle’s defor- mation in a traffic accident. EBS is a fairly unsophis- ticated crash severity parameter, and it does not take into account differences in retardation pulse, for instance. Retardation pulse can be easily deter- mined in crash tests at various speeds, and it is used as an initial parameter in the mathematical simula- tion model. In real traffic accidents, however, it is more difficult to determine the retardation pulse. The retardation pulse is unique in each accident. One important question, which should be further investigated, is the actual effect of dissimilarity in retardation pulse on the occupants’ pattern of movement.
It is essential that any simulations that are un- dertaken and that are to collectively represent the overall accident profile, must be undertaken with sufficient accuracy and in sufficient detail. It is of course important to ensure the correct degree of detail; i.e. bearing in mind the uncertainties and vari- ations inherent in both the accident data and the crash tests and simulations, it is very difficult to try to simulate the mechanisms at too detailed a level. To reduce the risk of faulty reconstructions, it is essential that all parameters from accident data be reconstructed as faithfully as possible in the simulations.
One crucial ingredient of the analysis is, of course, the simulation result in which crash configu- ration and crash speed are determined for a given crash test speed and given dummy size. This result should represent at least those accident situations that, from the points of view of impact and size, are close to the simulation preconditions. Even if there are natural variations in accident data, which affect the reliability of this connection, assessment reliabil- ity with regard to personal injury is improved com- pared with the situation in which no account is taken of impact and occupant parameters.
It is unrealistic to try to simulate in detail all the possible pulse characteristics. It is perhaps pos- sible for accident data to be split up into a number of pulse characteristics, .which can then be used as initial parameters in a more comprehensive simula- tion programme. There is no doubt that far more work is necessary in order to identify crash severity parameters that increase the reliability of analyses in which accident data and simulation data are re- lated to each other.
This report has chosen to examine the connec- tion between simulation and accident data on impact of upper face against the steering wheel rim. A simi- lar analysis is carried out for the mid face and lower face and for multiple injuries in several parts of the face. The analysis may be expanded by making a corresponding connection analysis involving impact against the steering wheel hub, for example. Once all the analyses are completed, the results are com- piled to obtain an overall facial injury risk profile.
The same applies to occupant size. A lot of accident data include information about the occu- pant’s total height. However, even people of the same total height have quite considerable variations in the proportions of the various parts of their bod- ies. The proportion of leg length to torso length may differ considerably. This means that the occupants sit in different positions. The seating height is proba- bly a better parameter for carrying out an analysis such as that described in the report.
CONCLUSIONS
By paying even greater attention to injury mech- anisms in the analytical process, more knowledge is gained about which factors are of importance for various injury results and which requirements must be applied to the connection of accident data and laboratory data/simulation data.
In addition to these parameters there are many others that have a greater or lesser effect on the occupants’ pattern of movement inside the car. Other parameters of importance are the weight of the occupant, occupant mobility (stiffness ofjoints, etc.), muscle activity, seating posture, seat proper-
The system presented in this report is easy to handle and can, with a little effort, help in assessing changes in injury risk, even if minor adjustments have been made to the product.
This system requires a thoroughly validated simulation model for a given product, and it also requires that changes, which accurately represent the changes made to a product, can be implemented simply and with proper validation.

286 H. NORIN
Further work is necessary to identify crash se- verity parameters that increase the reliability of anal- yses in which accident data and simulation data are related to each other.
With thorough knowledge of crash severity and injury mechanisms, and with the possibility of using simulation models to reliably reconstruct various sequences, the method described above can also be adopted for injury analyses of other accident types, occupant categories, and injury types.
REFERENCES
Committee on Injury Scaling of the American Medical Association (AMA), American Association for Auto- motive Medicine (AAAM), and the Society of Automo- tive Engineers (SAE). The abbreviated injury scale (1980 revision). Morton Grove, IL: AAAM; 1980.
Horsch, J. D., Evaluation of occupant protection from responses measured in laboratory tests. SAE Technical Report no. 870222. Warrendale, PA: Society of Auto- motive Engineers (SAE); 1987.
Hosmer, D. W., Jr.; Leneshow, S. Applied logistic regres- sion. New York: John Wiley & Sons, Inc.; 1989.
Jones, I. S.; Whitfield, R. A. Predicting injury risk with “New Car Assessment Program” crashworthiness rat- ings. Accid. Anal. Prev. 20:411-419; 1988.
Korner, J. A method for evaluating occupant protection by correlating accident data with laboratory test data. SAE Technical Report no. 90747. Warrendale, PA: SAE; 1989.
Lowne, R. W.; Wall, J. G. A procedure for estimating injury tolerance levels for car occupants. Proceedings of the 20th Stapp Car Crash Conference, Wayne State University, Detroit, MI, Oct. 24-26, 1976.
Magnusson, L.; Jorgensson, M. Violence in frontal im- pacts. Master’s thesis, Chalmers Technical University/ Volvo; 1987.
Mills, P. J.; Hobbs, C. A. The probability of injury to car occupants in frontal and side impacts. Proceedings of the 28th Stapp Car Crash Conference, 1984.
Nilsson-Ehle, A.; Norin, H.; Gustafsson, C. Evaluation of a method for determining the velocity change in traffic accidents. Presented at the 9th ESV Conference, Kyoto, 1982.
Norin, H.; Jernstrom, C.; Koch, M.; Svensson, S.-E.; Ghlund, A. Avoiding suboptimized occupant safety by multiple speed impact testing. Paper no. 91-S9-O-89. 13th ESV Conference, Paris, Nov. 4-7, 1991.
Norin, H.; Isaksson-Hellman, I. Injury potential predic- tion of a safety design feature. A theoretical method based on simulations and traffic accident data. Pre- sented at the IRCOBI Conference, Sept. 9-l 1. Verona, Italy, 1992.
Perl, T. H.; Nilsson, S.; Planath, I.; Willie, M. G. De- formable load sensing hybrid III face. SAE Technical Report no. 892427. Warrendale, PA: SAE; 1989.
Rogers, S.; Hill, J. R.; Mackay, G. M. Maxillofacial injur- ies following steering wheel contact by drivers using seat belts. Br. J. Oral Maxillofac. Surg. 30(1):24-30; 1992.
TN0 Crash Safety Research Center. MADYMO users manual 3D, version4.3. Delft, The Netherlands: 1990a.
TN0 Crash Safety Research Center. MADYMO, data- bases, version 4.3. Delft, The Netherlands: 1990b.
Walker, S. H.; Duncan, D. B. Estimation of the probabil- ity of an event as a function of several independent variables. Biometrika 54: 167-179; 1967.
Yoganandan, N.; Pintar, F.; Sances, A.; Harris, G.; Chin- tapalli, K.; Myklebust, J.; Schmaltz, D.; Reinartz, J.; Kalbfleisch, J.; Larson, S. Steering wheel induced fa- cial trauma. SAE Paper no. 881712. Warrendale. PA: SAE: 1988
Zuby, D. Steering assembly induced facial injury. Paper 87-WAiSAF-3. New York: American Society of Me- chanical Engineers; 1987.