Embed Size (px)
Citation preview

Soil Dynamics & Earthquake Engineering (2005, in print)
Correlation of cyclic preloading with the liquefaction resistance
T. Wichtmanni), A. Niemunis, Th. Triantafyllidis, M. Poblete
Institute of Soil Mechanics and Foundation Engineering, Ruhr-University Bochum, Universitatsstraße 150, 44801 Bochum, Germany
Abstract
The compactivity of sand due to cyclic loading with a a high number (N > 103) of small cycles (εampl ≤ 10−3)cannot be described by void ratio and stress alone. It depends strongly on the soil fabric usually described as ”cyclicpreloading”. The cyclic preloading cannot be measured directly in situ but correlates well with the liquefactionresistance. This paper demonstrates this correlation on the basis of laboratory tests. Practical applications can bederived from this work.
Key words: Cyclic preloading; liquefaction resistance; correlation; cyclic undrained triaxial tests; sand
1 Introduction
Under drained conditions a cyclic loading leads to anaccumulation of settlements. Even small amplitudescan significantly contribute if the number of cycles ishigh (N > 103). The settlements (and excess porewater pressures in the undrained case) may endangerthe serviceability of foundations, e.g. of transportationstructures, tanks, watergates, wind power plants.
Our aim is the numerical prediction of the residualsettlements under high-cyclic loading. A special accu-mulation model was developed for this purpose (Niemu-nis et al. [1]). It is based on numerous cyclic laboratorytests performed on freshly pluviated specimens (Wicht-mann et al. [2,3,4]).
These tests show, that a cyclic preloading signifi-cantly affects the accumulation rate, Fig. 1. Threecyclic triaxial tests at an identical stress and void ratio(in Fig. 1 marked by the horizontal line at e = 0.629)have different densification rates e = ∂e/∂N . A freshlypluviated specimen densifies much faster compared toa preloaded specimen (= after several thousand loadcycles). Thus, apart of stress and void ratio the accu-mulation rate depends on cyclic preloading. Possiblecauses of cyclic preloading in situ can be a seismic ac-tivity in the past, repeated sedimentation and erosionprocesses, an oscillating ground water level, etc.
i)Corresponding author. Tel.: + 49-234-3226080; fax: +49-234-3214150; e-mail adress: [email protected]
0.61
0.62
0.63
0.64
0.65
0
Number of cycles N [-]
Voi
d ra
tio e
[-]
identical void ratio identical stresse1 e2 e3
1052 104 4 104 6 104 8 104
e1 > e2 > e3
Test No 1: e0 = 0.629Test No 2: e0 = 0.636Test No 3: e0 = 0.644
all tests: pav = 100 kPa, qav = 77 kPa, qampl = 55 kPa
Fig. 1: Impact of a cyclic preloading on the accumulationrate e = ∂e/∂N (drained cyclic triaxial tests)
The cyclic preloading is generally unknown in situand no methods for its assessment are established sofar. The in-situ fabric cannot be measured directly.Laboratory testing on undisturbed intact specimens ofhigh quality (e.g. obtained by means of ground freez-ing, Yoshimi et al. [5], Hofmann et al. [6]) is technicallydifficult and expensive. It is thus necessary to developa simple and economic method for the determinationof the cyclic preloading.
We have studied various manifestations of the evo-lution of fabric under cyclic loading. Our first attempt
1

Soil Dynamics & Earthquake Engineering (2005, in print) 2
was to observe spatial fluctuations of contact forces(force chains) in an oedometer before and after cyclicloading (Humme [7]). No clear change of the offprintscould be detected. Next we have studied the fluctua-tion of the strain field (accumulative or in a single cy-cle) by means of the particle image velocimetry (PIV)method, Niemunis [8]. However, the fluctuation didnot significantly change during cyclic loading. We havealso studied a correlation of cyclic preloading with smallstrain stiffness. The small strain stiffness was expectedto increase with an abation of the spatial stress fluctu-ations. Unfortunately, the performed resonant columntests and cyclic triaxial tests with P- and S-wave mea-surements did reveal that such a correlation is not clearenough for a practical application, Wichtmann and Tri-antafyllidis [9,10].
This paper presents the experimental evidence thatcyclic preloading strongly correlates with the liquefac-tion resistance. A practical application of this corre-lation seems promising, since one can make advantageof the data from numerous studies on the liquefactionresistance in the literature, Sec. 2.
2 Literature review
The development of research on the field of porewater pressure accumulation and liquefaction due toundrained cyclic loading may be tracked in severalstate-of-the-art publications, e.g. Yoshimi et al. [11],Seed [12], Dobry [13], Ishihara [14], Robertson and Fear[15]. An overview of the actual standard of knowledgemay be also found in Triantafyllidis (ed.) [16]. Thefollowing literature review concentrates on the effect offabric or cyclic preloading on the liquefaction resistanceand possibilities to assess the liquefaction resistance insitu.
It is well known, that varying sample preparationtechniques lead to different initial soil fabrics (inherent
anisotropy). Slightly elongated grains e.g. tend to liewith their longer axes in the horizontal plane if they aredry pluviated, whereas a random distribution of the ori-entations is achieved by layering and tamping of moistsand (Nemat-Nasser and Takahashi [17]). The initialfabric affects the liquefaction resistance. Ladd [18] ob-served that sand specimens which were prepared bymoist tamping could sustain around four times morecycles to liquefaction than specimens that were drypluviated and compacted by vibration. Similar ten-dencies could be conformed by the tests of Mulilis etal. [19,20]. Porcino et al. [21] reported that air plu-viation leads to a significantly lower liquefaction resis-tance than water pluviation. Oda et al. [22] pointedout the significance of the direction of deposition com-pared to the polarization of cyclic loading. Specimens
that were loaded perpendicular to the direction of de-position exhibited a higher cyclic liquefaction resistancethan the ones loaded parallel. Many authors found thesensitivity to liquefaction of high-quality undisturbedspecimens to be significantly lower than the one ofre-constituted specimens, irrespectively of the methodof preparation (Mulilis et al. [19,20], Tokimatsu andHosaka [23], Hatanaka et al. [24], Porcino et al. [21]).
Pioneer work on the effect of an undrained cyclicpreloading on the liquefaction resistance was done byFinn et al. [25]. In triaxial tests they applied a cyclicundrained loading followed by a re-consolidation anda second cyclic undrained test phase. The preload-ing was stopped when liquefaction already occuredafter the generation of a certain axial strain ampli-tude εampl
1 . Large strain amplitudes (e.g. 2εampl1 =
5 · 10−2) decreased the liquefaction resistance in thesubsequent phase dramatically. If the first test phasewas stopped already at relative small strain amplitudes(2εampl
1 < 2 · 10−3) the re-liquefaction resistance washigher than the resistance of a virgin specimen. Thus,small to medium strain amplitudes increase the lique-faction resistance while large amplitudes lead to a re-duced undrained cyclic strength.
The effect of small cycles was also studied by Seedet al. [26], who performed shaking table tests undersimple shear conditions. Packages with a small num-ber of cycles N (smaller than N causing liquefaction)were applied in succession to the saturated sand eachsimulating an earthquake of low intensity. After eachpackage the sand layer was re-consolidated. Seed etal. observed that the pore water pressure rise becameslower with each succeeding package, i.e. with in-creasing cyclic preloading. Other experimental studies(Seed et al. [27], Teachavoransinskun et al. [28]) sup-port the increase of the liquefaction resistance due tocyclic preloading with small amplitudes.
Ishihara and Okada [29,30] distinguished betweensmall prestraining with effective stress paths that donot surpass the phase transformation (PT) line andlarge prestraining where the stress path goes beyond thePT line. Small prestraining increases the liquefactionresistance. On the other hand, if a soil was subjectede.g. to a large prestraining on the triaxial compressionside, in a subsequent cyclic loading with reversing shearstresses less pore water pressure was generated on thecompression side but a larger one developed on the ex-tension side (compared to non-presheared specimens).
Suzuki and Toki [31] found a peak in the curves of thenumber of cycles required to cause liquefaction plottedversus the maximum shear strain during prestraining.The strain at this peak was called threshold strain andlay between 4 · 10−3 and 10−2 depending on the typeof preshearing (e.g. drained or undrained cycles, cycles
Soil Dynamics & Earthquake Engineering (2005, in print) 3
towards the compression or the extension side or cycleswith reversing directions). Smaller prestraining ampli-tudes improved the liquefaction resistance while largerones caused a reduction. The decrease of the liquefac-tion resistance for higher shear strains was evoked with-out liquifying during prestraining. Surprisingly, Suzukiand Toki did not find any difference in the liquefactionresistance for a preloading with one or with ten cycles(contrary to our tests, see Section 4).
Emery et al. [32] found a loosening of the upperpart of the specimen due to liquefaction and attributedthe decrease in the re-liquefaction resistance at higherstrains to this non-uniformity of the specimens. How-ever, Oda et al. [22] demonstrated, that although looselayers within a specimen affect its cyclic undrained be-haviour the effects are not significant enough to ex-plain the strong reduction of the liquefaction resistancedue to large cyclic prestraining. Oda et al. supposedchanges in the soil fabric to be responsible.
Although several authors studied the influence ofcyclic preloading on the liquefaction resistance, noquantitative correlation has been formulated so far.
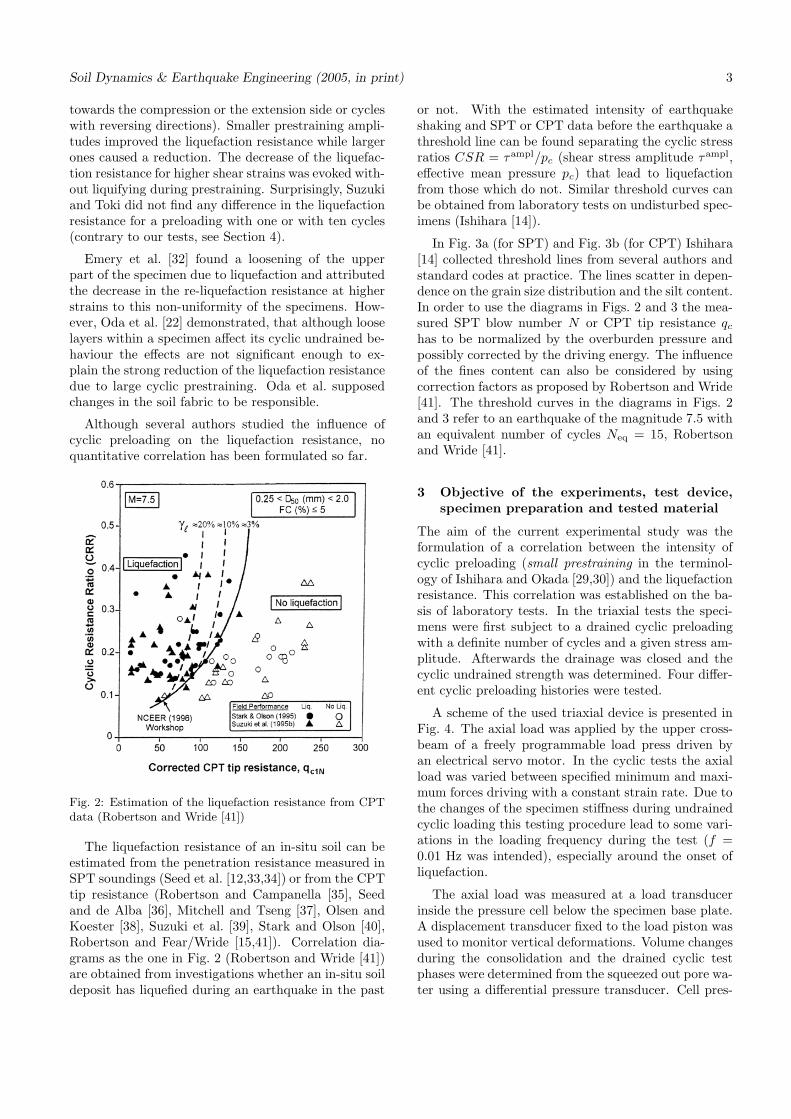
Fig. 2: Estimation of the liquefaction resistance from CPTdata (Robertson and Wride [41])
The liquefaction resistance of an in-situ soil can beestimated from the penetration resistance measured inSPT soundings (Seed et al. [12,33,34]) or from the CPTtip resistance (Robertson and Campanella [35], Seedand de Alba [36], Mitchell and Tseng [37], Olsen andKoester [38], Suzuki et al. [39], Stark and Olson [40],Robertson and Fear/Wride [15,41]). Correlation dia-grams as the one in Fig. 2 (Robertson and Wride [41])are obtained from investigations whether an in-situ soildeposit has liquefied during an earthquake in the past
or not. With the estimated intensity of earthquakeshaking and SPT or CPT data before the earthquake athreshold line can be found separating the cyclic stressratios CSR = τampl/pc (shear stress amplitude τampl,effective mean pressure pc) that lead to liquefactionfrom those which do not. Similar threshold curves canbe obtained from laboratory tests on undisturbed spec-imens (Ishihara [14]).
In Fig. 3a (for SPT) and Fig. 3b (for CPT) Ishihara[14] collected threshold lines from several authors andstandard codes at practice. The lines scatter in depen-dence on the grain size distribution and the silt content.In order to use the diagrams in Figs. 2 and 3 the mea-sured SPT blow number N or CPT tip resistance qc
has to be normalized by the overburden pressure andpossibly corrected by the driving energy. The influenceof the fines content can also be considered by usingcorrection factors as proposed by Robertson and Wride[41]. The threshold curves in the diagrams in Figs. 2and 3 refer to an earthquake of the magnitude 7.5 withan equivalent number of cycles Neq = 15, Robertsonand Wride [41].
3 Objective of the experiments, test device,
specimen preparation and tested material
The aim of the current experimental study was theformulation of a correlation between the intensity ofcyclic preloading (small prestraining in the terminol-ogy of Ishihara and Okada [29,30]) and the liquefactionresistance. This correlation was established on the ba-sis of laboratory tests. In the triaxial tests the speci-mens were first subject to a drained cyclic preloadingwith a definite number of cycles and a given stress am-plitude. Afterwards the drainage was closed and thecyclic undrained strength was determined. Four differ-ent cyclic preloading histories were tested.
A scheme of the used triaxial device is presented inFig. 4. The axial load was applied by the upper cross-beam of a freely programmable load press driven byan electrical servo motor. In the cyclic tests the axialload was varied between specified minimum and maxi-mum forces driving with a constant strain rate. Due tothe changes of the specimen stiffness during undrainedcyclic loading this testing procedure lead to some vari-ations in the loading frequency during the test (f =0.01 Hz was intended), especially around the onset ofliquefaction.
The axial load was measured at a load transducerinside the pressure cell below the specimen base plate.A displacement transducer fixed to the load piston wasused to monitor vertical deformations. Volume changesduring the consolidation and the drained cyclic testphases were determined from the squeezed out pore wa-ter using a differential pressure transducer. Cell pres-

Soil Dynamics & Earthquake Engineering (2005, in print) 4
a) b)
Fig. 3: Estimation of the liquefaction resistance from a) SPT and b) CPT data (Ishihara [14])
force transducer mobile cross beam
ball bearing
displ. transducer
cell + pore pressure transd.
differential pressure transducer
cell pressure
back pressure
soil specimen (d = 10 cm, h = 20 cm)
plexiglas cylinder water in the cell
ball bearing
load piston
inner rods outer rods
membrane
Volume measuring unit force transducer
drainage
Fig. 4: Triaxial test device
sure and back pressure were measured by means of pres-sure transducers.
Specimens were prepared by pluviating air-dry sandout of a funnel into a mould. After that they were fullysaturated with de-aired water (Wichtmann et al. [4]).All tests were performed on a uniform medium coarsequartz sand (mean grain diameter d50 = 0.55 mm,uniformity index U = d60/d10 = 1.8, emin = 0.577,emax = 0.874) with subangular grains, which was alsoused to develop the high-cycle accumulation model,Wichtmann et al. [2,3,4]. The grain size distribution
is given e.g. in [4].
In the following the total stress is σi = σ′
i + u (u =pore water pressure) and soil density is described bythe density index ID = (emax − e)/(emax − emin).
4 Experimental results
The cyclic tests were preceded by undrainedmonotonous tests in order to determine the phasetransformation (PT) and the failure lines (FL). Eighttests with triaxial compression and extension wereperformed with isotropic consolidation stresses 50 kPa≤ pc = (σ′
1c + 2σ′
3c)/3 ≤ 200 kPa (the subscript tc
denotes ”consolidation”) and with an axial strain rate|ε1| = 0.05 %/min. The specimens had densities in therange 0.54 ≤ ID ≤ 0.60. The resulting stress paths inthe p-q-plane and the failure lines are shown in Fig. 5.
In the cyclic tests specimens were prepared with ini-tial densities 0.63 ≤ ID0 ≤ 0.68. They were consoli-dated under isotropic conditions with pc = 100 kPa.Thereafter, a drained cyclic preloading was appliedstress-controlled. The axial stress σ1 was cyclicallyvaried with an amplitude σampl
1,preload = qamplpreload while
the lateral stress σ3 was maintained constant. Fourcyclic histories with different amplitudes qampl
preload anddifferent numbers of cycles Npreload were tried out,Table 1, where ”cyclic preloading No. 1” means nocyclic preloading, i.e. the freshly pluviated sample.The stress amplitudes qampl
preload = 30 kPa and qamplpreload
= 50 kPa correspond to shear strain amplitudes ofγampl ≈ 3.7 · 10−4 and γampl ≈ 7.0 · 10−4, respectively.
Soil Dynamics & Earthquake Engineering (2005, in print) 5
0 100 200 300-300
-200
-100
0
100
200
300
400
q =
� 1'-
� 3' [k
Pa]
p = ( � 1'+2 � 3')/3 [kPa]
ME,PT = -0.83
ME,FL = -1.00
MC,PT = 1.151
1
1
1
MC,FL = 1.35
all tests: ID = 0.54 - 0.60
Fig. 5: Stress paths in the p-q-plane during monotonousundrained shear
Table 1: Tested cyclic preloadings
Cyclic qamplpreload
Npreload
preloading [kPa] [-]
1 - 02 30 103 50 104 50 100
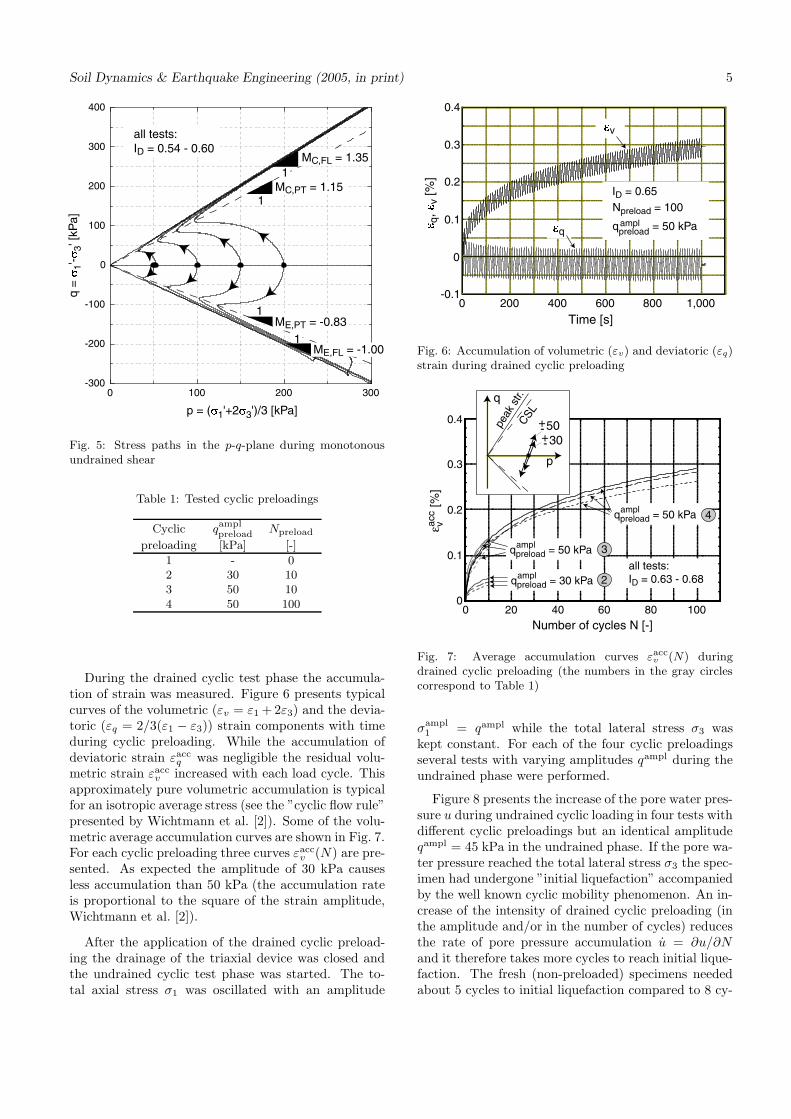
During the drained cyclic test phase the accumula-tion of strain was measured. Figure 6 presents typicalcurves of the volumetric (εv = ε1 + 2ε3) and the devia-toric (εq = 2/3(ε1 − ε3)) strain components with timeduring cyclic preloading. While the accumulation ofdeviatoric strain εacc
q was negligible the residual volu-metric strain εacc
v increased with each load cycle. Thisapproximately pure volumetric accumulation is typicalfor an isotropic average stress (see the ”cyclic flow rule”presented by Wichtmann et al. [2]). Some of the volu-metric average accumulation curves are shown in Fig. 7.For each cyclic preloading three curves εacc
v (N) are pre-sented. As expected the amplitude of 30 kPa causesless accumulation than 50 kPa (the accumulation rateis proportional to the square of the strain amplitude,Wichtmann et al. [2]).
After the application of the drained cyclic preload-ing the drainage of the triaxial device was closed andthe undrained cyclic test phase was started. The to-tal axial stress σ1 was oscillated with an amplitude
-0.1
0
0.1
0.2
0.3
0.4
0 200 400 600 800 1,000
Time [s]
� q,
� v [%
]
�v
�q
ID = 0.65
qpreload = 50 kPa
Npreload = 100ampl
Fig. 6: Accumulation of volumetric (εv) and deviatoric (εq)strain during drained cyclic preloading
0 20 40 60 80 1000
0.1
0.2
0.3
0.4
Number of cycles N [-]
ε v
[%
]ac
c
qpreload = 50 kPaampl
qpreload = 50 kPaampl
qpreload = 30 kPaamplall tests: ID = 0.63 - 0.68
p
q
CSL
peak
str.
50+-30+-
2
3
4
Fig. 7: Average accumulation curves εaccv (N) during
drained cyclic preloading (the numbers in the gray circlescorrespond to Table 1)
σampl1 = qampl while the total lateral stress σ3 was
kept constant. For each of the four cyclic preloadingsseveral tests with varying amplitudes qampl during theundrained phase were performed.
Figure 8 presents the increase of the pore water pres-sure u during undrained cyclic loading in four tests withdifferent cyclic preloadings but an identical amplitudeqampl = 45 kPa in the undrained phase. If the pore wa-ter pressure reached the total lateral stress σ3 the spec-imen had undergone ”initial liquefaction” accompaniedby the well known cyclic mobility phenomenon. An in-crease of the intensity of drained cyclic preloading (inthe amplitude and/or in the number of cycles) reducesthe rate of pore pressure accumulation u = ∂u/∂Nand it therefore takes more cycles to reach initial lique-faction. The fresh (non-preloaded) specimens neededabout 5 cycles to initial liquefaction compared to 8 cy-

Soil Dynamics & Earthquake Engineering (2005, in print) 6
cles in the case of the specimen preloaded with qamplpreload
= 30 kPa and Npreload = 10. The preloading with
qamplpreload = 50 kPa and Npreload = 10 delayed the initial
of liquefaction to occur after 43 cycles and 205 cycleswere needed for the specimen preloaded with qampl
preload =50 kPa and Npreload = 100.
While the amplitude of the vertical strain εampl1 was
small during the first cycles it increased strongly dur-ing the cycle that lead to initial liquefaction (Fig. 9)and grew with each subsequent cycle. The generatedstrain amplitudes were nearly symmetric in triaxial ex-tension and compression. From Fig. 9 it is obvious,that independent of the cyclic preloading full liquefac-tion (defined as the time when a double amplitude of
vertical strain 2εampl1 = 10 % was reached) and the fail-
ure of the sample occured within four or five cycles afterinitial liquefaction. In each test failure occured in theextension regime of the p-q-plane.
Figure 10 presents the stress-strain hysteresis andthe stress paths in the p-q-plane are shown in Fig. 11.There is no principal difference in the shape of thehysteresis or the run of the stress paths for the dif-ferent cyclic preloadings except that the number of cy-cles to liquefaction increases with the intensity of cyclicpreloading.
In Fig. 12 for each test the cyclic stress ratio CSR =qampl/(2pc) is plotted versus the cycle number N that
was necessary to generate a double amplitude 2εampl1
= 10 %. For a given cyclic preloading it is obviousthat higher stress amplitudes qampl in the undrainedtest phase caused an earlier liquefaction. Due to cyclicpreloading the curves CSR(N) are shifted upwards inFig. 12. It is therefore obvious that a cyclic preload-ing may considerably increase the cyclic undrainedstrength. For the non-preloaded specimen full liq-uefaction in 15 cycles is reached with a stress ratioCSRN=15 = 0.189. For cyclic preloadings No. 2, 3 and4 this value is CSRN=15 = 0.208, CSRN=15 = 0.259and CSRN=15 = 0.295, respectively.
In drained cyclic triaxial tests (Wichtmann et al. [4])the rate of total strain accumulation εacc = ∂εacc/∂N(with ε =
√
(ε1)2 + 2(ε3)2) was found proportional tothe square of the total strain amplitude εampl. In theaccumulation model (Niemunis et al. [1]) this is cap-tured by the function
fampl = (εampl/εamplref )2 (1)
with the reference amplitude εamplref = 10−4. The resid-
ual strain rate decreases with N according to
εacc ∼ fN =CN1CN2
1 + CN2N+ CN1CN3 (2)
The material constants are CN1 = 3.4 · 10−4, CN2 =0.55 and CN3 = 6.0 · 10−5 for the tested sand (Wicht-
10010 15
non-preloaded0.15
0.20
0.25
0.30
CS
R =
qam
pl /
(2 p
c) [-
]
10 / 50 kPa
10 / 30 kPa
qpreload
Npreload ampl
/
=100 / 50 kPa
Number of cycles N to reach 2 � 1 = 10 % [-]ampl
all tests: ID = 0.63 - 0.68 1
2
3
4
Fig. 12: Relationship between the cyclic stress ratio CSR =qampl/(2pc) and the number of cycles N to cause a double
amplitude 2εampl1 = 10 % for different cyclic preloadings
mann et al. [4]). The first term of the rate fN is de-pendent on the number of cycles. A state variable forcyclic preloading should consider the number of cyclesand their amplitude. For this purpose the state variablegA has been defined (Niemunis et al. [1]). It weightsthe number of preloading cycles with their total strainamplitudes εampl:
gA =
∫
fampl
CN1CN2
1 + CN2NdN (3)
For εampl = constant Eq. (3) simplifies to
gA = fampl CN1 ln(1 + CN2N) (4)
The state variable gA was calculated for the four cyclicpreloadings and in Fig. 13 the cyclic stress ratio causingliquefaction in 15 cycles CSRN=15 is plotted versus gA.CSRN=15 increases with gA according to
CSRN=15 = CSRN=15,0 f(gA) with
f(gA) = 1 + Cg1 ln (1 + Cg2 gA) (5)
with the material constants Cg1 = 0.46 and Cg2 = 51.6.CSRN=15,0 = 0.189 is the cyclic stress ratio for thereference state gA = 0 (non-preloaded soil) and a voidratio eref = 0.681 (ID = 0.65).
5 Prospective application of the correlation
Having performed SPT or CPT soundings in situ, aprofile with depth of CSRN=15 can be obtained fromthreshold curves as those in Figs. 2 and 3. An exampleof a profile of CSRN=15 with depth z (after Robertsonand Campanella [35]) is shown in Fig. 14.
If correlation diagrams as those in Figs. 2 and 3 areunavailable (e.g. in regions with little seismic activity)

Soil Dynamics & Earthquake Engineering (2005, in print) 7
0
100
200
300
400
500
Str
esse
s σ 3
, u, σ
3' [k
Pa]
σ3 = const.
ID = 0.64
qpreload = 50 kPa
Npreload = 100ampl
qampl = 45 kPa
u
σ3'
0 10,000 15,000 20,0005,000
Time [s]
0 1,000 2,000 3,000 4,000 5,000 6,000
Time [s]
0
100
200
300
400
500
Str
esse
s σ 3
, u, σ
3' [k
Pa]
u
σ3'
σ3 = const.
ID = 0.66
qpreload = 50 kPa
Npreload = 10ampl
qampl = 45 kPa
0 1,000 2,000
Time [s]
0
100
200
300
400
500
Str
esse
s σ 3
, u, σ
3' [k
Pa]
σ3 = const.
u
σ3'
ID = 0.65
qpreload = 30 kPa
Npreload = 10ampl
qampl = 45 kPa
0 1,000 2,000
Time [s]
ID = 0.63
qampl = 45 kPa
no preloading
0
100
200
300
400
500
Str
esse
s σ 3
, u, σ
3' [k
Pa]
σ3 = const.
u
σ3'
1 2
3 4
Fig. 8: Development of the pore pressure u and effective lateral stress σ3′ during undrained cyclic loading in four tests on
specimens with varying cyclic preloading (all tests: qampl = 45 kPa)
Ver
tical
str
ain
ε 1 [%
]
-10
-5
0
5
10
0 10,000 15,000 20,0005,000
Time [s]
205
211
N =
Ver
tical
str
ain
ε 1 [%
]
-10
-5
0
5
10
0 1,000 2,000 3,000 4,000 5,000 6,000
Time [s]
4344
4546
47
N =
Ver
tical
str
ain
ε 1 [%
]
-10
-5
0
5
10
0 1,000 2,000
Time [s]
9
10
N =
11
8
Ver
tical
str
ain
ε 1 [%
]
-10
-5
0
5
10
0 1,000 2,000
Time [s]
78
65N =
ID = 0.64
qpreload = 50 kPa
Npreload = 100ampl
qampl = 45 kPa
ID = 0.66
qpreload = 50 kPa
Npreload = 10ampl
qampl = 45 kPa
ID = 0.65
qpreload = 30 kPa
Npreload = 10ampl
qampl = 45 kPa
ID = 0.63
qampl = 45 kPa
no preloading
1 2
3 4
Fig. 9: Development of the vertical strain ε1 during undrained cyclic loading in four tests on specimens with varying cyclicpreloading (all tests: qampl = 45 kPa)

Soil Dynamics & Earthquake Engineering (2005, in print) 8
-60
-40
-20
0
20
40
60
-10 -8 -6 -4 -2 0 2 4 6 8 10Vertical strain ε1 [%]
Dev
iato
ric s
tres
s q
[kP
a]
-60
-40
-20
0
20
40
60
-10 -8 -6 -4 -2 0 2 4 6 8 10Vertical strain ε1 [%]
Dev
iato
ric s
tres
s q
[kP
a]
-60
-40
-20
00
20
40
60
-10 -8 -6 -4 -2 0 2 4 6 8 10Vertical strain ε1 [%]
Dev
iato
ric s
tres
s q
[kP
a]
-60
-40
-20
20
40
60
-10 -8 -6 -4 -2 0 2 4 6 8 10Vertical strain ε1 [%]
Dev
iato
ric s
tres
s q
[kP
a]
8
4
9
5
10
6
11
7
N =
N =
1-7
N =
5 6 7 8N = 1-4
1-3
ID = 0.64
qpreload = 50 kPa
Npreload = 100ampl
qampl = 45 kPaID = 0.66
qpreload = 50 kPa
Npreload = 10ampl
qampl = 45 kPa
ID = 0.65
qpreload = 30 kPa
Npreload = 10ampl
qampl = 45 kPa
ID = 0.63
qampl = 45 kPa
no preloading
78910 1-6
43 4544 46
47
N = 1-42 N =
N = 4546N = 43 4244 1-41
207 209
211
1-205
206208210
1 2
3 4
Fig. 10: Stress-strain hysteresis for different cycle numbers N during undrained cyclic loading in four tests on specimens withvarying cyclic preloading (all tests: qampl = 45 kPa)
0
0
20
20
40
40
60
-20
-40
-60
60 80 100
p [kPa]
q [k
Pa]
ID = 0.65
ID = 0.64ID = 0.66
Npreload = 10 qpreload = 30 kPaampl
Npreload = 10 qpreload = 50 kPaampl Npreload = 100 qpreload = 50 kPaampl
0
0
20
20
40
40
60
-20
-40
-60
60 80 100p [kPa]
0 20 40 60 80 100
p [kPa] 0 20 40 60 80 100
p [kPa]
q [k
Pa]
0
20
40
60
-20
-40
-60
q [k
Pa]
0
20
40
60
-20
-40
-60
q [k
Pa]
no preloading1 2
3 4
ID = 0.63
Fig. 11: Stress paths in the p-q-plane during undrained cyclic loading in four tests on specimens with varying cyclic preloading(all tests: qampl = 45 kPa)

Soil Dynamics & Earthquake Engineering (2005, in print) 9
0 0.01 0.02 0.03 0.04 0.060.050.18
0.22
0.26
0.30
0.34
CS
RN
=15
[-]
Cyclic preloading gA [-]
Eq. (5)
Fig. 13: Cyclic undrained strength CSRN=15 in dependenceof cyclic preloading gA
0 0.1 0.2 0.3 0.416
14
12
10
8
6
4
2
0
Dep
th [m
]
CSR to cause liquefaction in 15 cycles [-]
Fig. 14: Example of a profile CSRN=15(z) after Robertsonand Campanella [35]
a curve from the literature has to be chosen based onsimilar grain characteristics and fines content. Unfor-tunately, there is some scatter between the curves ofseveral researchers or codes of practice.
From a few tests performed on re-constituted dis-turbed specimens a curve CSR(N) similar to curveNo. 1 in Fig. 12 corresponding to the non-preloadedspecimens is established and CSRN=15,0 is determined.The tests should be performed with the in-situ den-sity. However, if this density varies strongly it may bemore appropriate to determine CSRN=15,0 for a con-stant void ratio eref and to introduce a void ratio cor-rection function f(e) with f(e) = 1 for e = eref. Thefunction f(e) = 1 + eref − e would be suitable for thedata presented by Seed and Lee [42], Fig. 15. AssumingEq. (5) to be valid independent of the fines content andthe grain size distribution (which has to be checked infuture) cyclic preloading gA for a certain depth can be
obtained from
CSRN=15 = CSRN=15,0 f(gA) f(e) (6)
Note that Eq. (6) neglects the influence of stress on theliquefaction resistance (similarly as Seed and Lee [42]do). The SPT blow number and the CPT tip resistanceare increased also by aging. Following the above pro-cedure aging effects are equivalent to cyclic preloading.This is in accordance with experiments of Seed [12],which show a decrease of the cyclic accumulation ratedue to aging.
0.6 0.7 0.8 0.90.1
0.2
0.3
0.4
0.5
CS
RN
=15
[-]
Void ratio e [-]
11
Fig. 15: CSRN=15 as a function of void ratio after Seed andLee [42]
6 Summary and conclusions
Our aim is the prediction of residual settlements ina non-cohesive soil under cyclic loading with many(N > 103) small (εampl ≤ 10−3) cycles. Beside stressand void ratio the accumulation rate is significantly in-fluenced by cyclic preloading. Since the cyclic preload-ing of an in-situ soil cannot be measured directly, ithas to be determined from simple correlations. In or-der to study a correlation of cyclic preloading with theliquefaction resistance undrained cyclic triaxial testswere performed on specimens which were subject toa drained cyclic preloading. These tests reveal a strongcorrelation between cyclic preloading and the liquefac-tion resistance. A prospective application of the corre-lation using SPT or CPT data was proposed.
Acknowledgements
This study was conducted as a part of the project A8”Influence of the fabric change in soil on the lifetime ofstructures”, supported by the German Research Coun-cil (DFG) within the Centre of Excellence SFB 398”Lifetime oriented design concepts”. The authors aregrateful to DFG for the financial support.

Soil Dynamics & Earthquake Engineering (2005, in print) 10
References
[1] Niemunis A, Wichtmann T, Triantafyllidis T. Ahigh-cycle accumulation model for sand. Computers andGeotechnics (in print).
[2] Wichtmann T, Niemunis A, Triantafyllidis T. Strainaccumulation in sand due to drained uniaxial cyclic loading.In Triantafyllidis (ed.) Cyclic Behaviour of Soils and Lique-faction Phenomena, Proc. of CBS04, Bochum, 2004:233-46.Balkema.
[3] Wichtmann T, Niemunis A, Triantafyllidis T. The ef-fect of volumetric and out-of-phase cyclic loading on strainaccumulation under cyclic loading. In Triantafyllidis (ed.)Cyclic Behaviour of Soils and Liquefaction Phenomena,Proc. of CBS04, Bochum, 2004:247-56. Balkema.
[4] Wichtmann T, Niemunis A, Triantafyllidis T. Strainaccumulation in sand due to cyclic loading: drained triax-ial tests. Soil Dynamics and Earthquake Engineering (inprint).
[5] Yoshimi Y, Hatanaka M, Oh-Oka H. Undisturbedsampling of saturated sands by freezing. Soils Foundations1978;18(3):105–11.
[6] Hofmann BA. In-situ ground freezing to obtain undis-turbed samples of loose sand for liquefaction assessment.PhD thesis. University of Alberta, Edmonton; 1997.
[7] Humme B. Struktur von granularen Medien und derenAnderung infolge zyklischer Belastung. Diploma thesis.Institute of Foundation Engineering and Soil Mechanics,Ruhr-University Bochum; 1999.
[8] Niemunis A. Extended hypoplastic models for soils.Habilitation. Institute of Foundation Engineering and SoilMechanics, Ruhr-University Bochum, Issue No. 34; 2003.
[9] Wichtmann T, Triantafyllidis Th. Influence of a cyclicand dynamic loading history on dynamic properties of drysand, part I: cyclic and dynamic torsional prestraining. SoilDynamics and Earthquake Engineering 2004;24(2):127-47.
[10] Wichtmann T, Triantafyllidis Th. Influence of acyclic and dynamic loading history on dynamic propertiesof dry sand, part II: cyclic axial preloading. Soil Dynamicsand Earthquake Engineering 2004;24(11):789-803.
[11] Yoshimi Y, Richart FE, Prakash S, Balkan DD,Ilyichev YL. Soil dynamics and its application to founda-tion engineering. In: Proceedings of the 9th InternationalConference on Soil Mechanics and Foundation Engineering,Tokyo; 2:605-50.
[12] Seed HB. Soil liquefaction and cyclic mobility evalu-ation for level ground during earthquakes. J Geotech EngngDiv, ASCE 1979;105(GT2):201-55.
[13] Dobry R, Ladd RS, Yokel FY, Chung RM, Pow-ell D. Prediction of pore pressure buildup and liquefactionof sands during earthquakes by the cyclic strain method.Report No. 138, U.S. Department of Commerce, Nationalbureau of standards, NBS Building science series; 1982.
[14] Ishihara K. Liquefaction and flow failure duringearthquakes. The 33rd Rankine Lecture. Geotechnique1993;43(3):351-415.
[15] Robertson PK, Fear CE. Liquefaction of sands andits evaluation. Keynote Lecture. In: IS Tokyo’95, Pro-ceedings of the 1st International Conference on EarthquakeGeotechnical Engineering, 1995.
[16] Triantafyllidis Th (ed). Cyclic Behaviour of Soilsand Liquefaction Phenomena, Proc. of CBS04, Bochum,March/April 2004. Balkema.
[17] Nemat-Nasser S, Takahashi K. Liquefaction anddensification of sand. J Geotech Engng, ASCE1984;110(9):1291-306.
[18] Ladd RS. Specimen preparation and liquefaction ofsands. J Geotech Engng Div, ASCE 1974;100(GT10):1180-84.
[19] Mulilis JP, Chan CK, Seed HB. The effects of methodof sample preparation on the cyclic stress-strain behavior ofsands. Report No. EERC 75-18, Earthquake EngineeringResearch Center, University of California, Berkeley, 1975.
[20] Mulilis JP, Seed HB, Chan CK, Mitchell JK, Aru-lanandan K. Effects of sample preparation on sand liquefac-tion. J Geotech Engng Div, ASCE 1977;103(GT2):91-108.
[21] Porcino D, Cicciu G, Ghionna VN. Laboratory in-vestigation of the undrained cyclic behaviour of a naturalcoarse sand from undisturbed and reconstituted samples.In Triantafyllidis (ed.) Cyclic Behaviour of Soils and Lique-faction Phenomena, Proc. of CBS04, Bochum, 2004:187-92.Balkema.
[22] Oda M, Kawamoto K, Suzuki K, Fujimori H, SatoM. Microstructural interpretation on reliquefaction of satu-rated granular soils under cyclic loading. J Geotech Geoen-viron Engng, ASCE 2001;127(5):416-23.
[23] Tokimatsu K, Hosaka Y. Effects of sample distur-bance on dynamic properties of sand. Soils Foundations1986;26(1):53-64.
[24] Hatanaka M, Suzuki Y, Kawasaki T, Endo M. Cyclicundrained shear properties of high quality undisturbedTokyo gravel. Soils Foundations 1988;28(4):57-68.
[25] Finn WDL, Bransby PL, Pickering DJ. Effect ofstrain history on liquefaction of sand. J Soil Mech Foun-dations Div, ASCE 1970;96(SM6):1917-34.
[26] Seed HB, Mori K, Chan CK. Influence of seismichistory on liquefaction of sands. J Geotech Engng Div1977;103(GT4):257-70.
[27] Seed RB, Lee SR, Jong HL. Penetration and lique-faction resistances: prior seismic history effects. J GeotechEngng 1988;114(6):691-97.
[28] Teachavoransinskun S, Tatsuoka F, Lo Presti DCF.Effects of cyclic prestraining on dilatancy characteristicsand liquefaction of sand. In Shibuya, Mitachi, Miura (eds)Pre-failure deformation of geomaterials 1994:75-80.
[29] Ishihara K, Okada S. Effects of stress history oncyclic behavior of sands. Soils Foundations 1978;18(4):31-45.

Soil Dynamics & Earthquake Engineering (2005, in print) 11
[30] Ishihara K, Okada S. Effects of large preshearing oncyclic behavior of sand. Soils Foundations 1982;22(3):109-25.
[31] Suzuki T, Toki S. Effects of preshearing of lique-faction characteristics of saturated sand subjected to cyclicloading. Soils Foundations 1984;24(2):16-28.
[32] Emery JJ, Finn WDL, Lee KW. Uniformity ofsaturated sand specimen. ASTM, Report No. STP523,1973:182-94.
[33] Seed HB, Idriss IM. Simplified procedure for evalu-ating soil liquefaction potential. J Soil Mech FoundationsDiv 1971;97(SM9):1249-73.
[34] Seed HB, Arango I, Chan CK. Evaluation of soil liq-uefaction potential during earthquakes. Report No. EERC75-28, Earthquake Engineering Research Center, Universityof California, 1975.
[35] Robertson PK, Campanella RG. Liquefaction po-tential of sands using the cone penetration test. J GeotechEngng 1985;22(3):298-307.
[36] Seed HB, de Alba P. Use of SPT and CPT tests forevaluating the liquefaction resistance of sands. In ClemenceSP (ed) Use of in situ tests in geotechnical engineering,Geotechnical Special Publication, ASCE 1986;6:281-302.
[37] Mitchell JK, Tseng DJ. Assessment of liquefactionpotential by cone penetration resistance. In Duncan JM(ed) Proc. of the H. Bolton Seed Memorial Symposium,Berkeley, California 1990;2:335-50. Bitech Publishers.
[38] Olsen RS, Koester JP. Prediction of liquefaction re-sistance using the CPT. In: Proc. of the International Sym-posium on Cone Penetration Testing, CPT’95, Linkoping,Sweden 1995;2:251-56.
[39] Suzuki Y, Tokimatsu K, Koyamada K, Taya Y,Kubota Y. Field correlation of soil liquefaction based onCPT data. In: Proc. of the International Symposiumon Cone Penetration Testing, CPT’95, Linkoping, Sweden1995;2:583-88.
[40] Stark TD, Olson SM. Liquefaction resistance us-ing CPT and field case histories. J Geotech Engng1995;121(12):856-69.
[41] Robertson PK, Wride CE. Evaluating cyclic liquefac-tion potential using the cone penetration test. Can GeotechJ 1998;35:442-59.
[42] Seed HB, Lee KL. Studies of liquefaction of sandsunder cyclic loading conditions. Report No. TE-65-65,Dept. of Civil Engineering, University of California, Berke-ley, 1965.