Embed Size (px)
Citation preview

10
1
0.55 7 9
IM fatal et non-fatal
Niv
eau
de r
isqu
ep<0.0001
14% réduction du risque par 1% de diminution en HbA1c
5 7 9
Endpoints microvasculaires
Niv
eau
de r
isqu
e
10
1
0.5
p<0.0001
37% réduction du risque par 1% de diminution en HbA1c
IM = Infarctus du Myocarde .Stratton I, et al. BMJ 2000;321:405―12.
HbA1c (%)
Corrélation épidémiologique entre le contrôle glycémique et le risque de complications
HbA1c (%)

Glycaemic targets for the management of type 2 diabetes
• Glycaemic targets for the management of people with type 2 diabetes as recommended by various organisations1–5
1. Nathan DM, et al. Diabetologia. 2009;52:17-30. 2. IDF. Global Guidelines 2005. 3. Rodbard HW, et al. Endocr Pract. 2007;13(Suppl. 1):1-68. 4. NICE clinical guideline 87. Quick reference guide. May 2009. 5. Matthaei S, et al. German Diabetes Association guidelines. October 2008.
Organisation HbA1c (%) FPG (mmol/L) PPG (mmol/L)
ADA-EASD1 <7 — —
IDF-Europe2 <6.5 <6.0 (<110*) <8.0 (<145*)
AACE3 ≤6.5 <6.1 (<110*) <7.8 (<140*)
NICE4 <6.5** — <8.5 (<153*)
DDG5 <6.5 — —
*mg/dL
**<7.5% for people receiving ≥2 oral glucose-lowering drugs or those requiring insulin
FPG, fasting plasma glucose; PPG, postprandial glucose; ADA, American Diabetes Association; IDF, International Diabetes Federation; AACE, American Association of Clinical Endocrinologists; NICE, National Institute of Clinical Excellence; DDG, Deutschen Diabetes-Gesellschaft (German Diabetes Association)

HbA1c : 7.9 ±1.6 %
Patients avec HbA1c < 7% : 30%
Acta Clinica Belgica, 2005

HbA1c: 8.8 ±2.3%
Acta Clinica Belgica,2006

5BY/ELB/11/209/462
Key challenge of type 2 diabetes: outcome
43% of patients do not
achieve glycaemic targets (HbA1c<7%)
Ford et al (NHANES). Diabetes Care 2008;31:102–4

6BY/ELB/11/209/462
Distribution of Risk Factors for Microvascular and Macrovascular Complications among U.SDistribution of Risk Factors for Microvascular and Macrovascular Complications among U.S. . Adults with Diabetes, 1999–2010.Adults with Diabetes, 1999–2010.
Ali MK et al. N Engl J Med 2013;368:1613-1624Ali MK et al. N Engl J Med 2013;368:1613-1624

Barrières pour un bon contrôle
PatientPatient-Effets indésirables-Effets indésirables
-Polymédication-Polymédication-Hypoglycémie-Hypoglycémie-Prise de poids-Prise de poids
MaladieMaladie-Chronique -Chronique
-Asymptomatique-Asymptomatique--Epuisement progressif Epuisement progressif
des cellules bêtades cellules bêta
MédecinMédecin-Inertie clinique-Inertie clinique
-Suivi & monitoring-Suivi & monitoring-Augmentation de la -Augmentation de la
médicationmédication

Réduction de la masse Beta-cellulaire chez les patients DT2
Matveyenko Matveyenko et al. DOMet al. DOM 2008;10(Suppl. 4):23–31 2008;10(Suppl. 4):23–31
ND, non diabetic; IFG, impaired fasting glucoseND, non diabetic; IFG, impaired fasting glucose

HOMA = homeostasis model assessment.UKPDS Group. Diabetes 1995;44:1249―58. D’après Holman RR. Diabetes Res Clin Pract 1998;40(suppl 1):S21―5.
Le déclin de la fonction des cellules détermine la nature progressive du DT2
Fonct
ion d
es c
ellu
les
(
% v
s nor
mal
sel
on H
OM
A)
Temps (années)
0
20
40
60
80
100
―10 ―8 ―6 ―4 ―2 0 2 4 6
Moment du diagnostic
?
Fonction pancréatique= 50% de la normale

Barrières pour un bon contrôle
PatientPatient-Effets indésirables-Effets indésirables
-Polymédication-Polymédication-Hypoglycémie-Hypoglycémie-Prise de poids-Prise de poids
MaladieMaladie-Chronique -Chronique
-Asymptomatique-Asymptomatique--Epuisement progressif Epuisement progressif
des cellules bêtades cellules bêta
MédecinMédecin-Inertie clinique-Inertie clinique
-Suivi & monitoring-Suivi & monitoring-Augmentation de la -Augmentation de la
médicationmédication

Barrières pour un bon contrôle
• Environ un tiers des patients diabétiques, recevant des AD oraux, ont mentionné avoir ressenti des effets indésirables liés au traitement.
• Cette perception était significativement associée à une non-adhérence aux antidiabétiques.
Revue adaptée d’après Chao J, et al. Clin Ther. 2007;29:177-180. *Paquot N Rev Med Liège 2010; 65: 326-310.Revue adaptée d’après Chao J, et al. Clin Ther. 2007;29:177-180. *Paquot N Rev Med Liège 2010; 65: 326-310.
PatientPatient
Variable Β Valeur p
Âge < 0,05
Comorbidité
Durée de la maladie
Score de symptôme de dépression < 0,001
Multi-thérapie
Facteur ethnique
Revenus
Effets indésirables ressentis < 0,01
Analyse de régression linéaire Analyse de régression linéaire (n = 445)(n = 445)Méthodologie : questionnaire remis aux patients diabétiques de type 2 sous antidiabétiques orauxMéthodologie : questionnaire remis aux patients diabétiques de type 2 sous antidiabétiques oraux
-0,2-0,2 -0,1-0,1 00 0,10,1 0,20,2
Moins compliantMoins compliant Plus compliantPlus compliant
Un patient diabétique de type 2 prend en moyenne 6,3 médicaments différents*Un patient diabétique de type 2 prend en moyenne 6,3 médicaments différents*
Les effets indésirables ont un impact négatif sur la Les effets indésirables ont un impact négatif sur la compliancecompliance

Barrières pour un bon contrôle
Wright AD et al (2006) J Diabetes Complicat 20; 395-401.Wright AD et al (2006) J Diabetes Complicat 20; 395-401.
PatientPatient
- % patients ayant, par an, au moins 1 hypoglycémie liée au traitement.% patients ayant, par an, au moins 1 hypoglycémie liée au traitement.- Patients diabétiques de type 2 de l’étude UKPDS.Patients diabétiques de type 2 de l’étude UKPDS.- Les épisodes hypoglycémiques rapportés ont été classés comme transitoires, temporairement invalidants, besoin Les épisodes hypoglycémiques rapportés ont été classés comme transitoires, temporairement invalidants, besoin
d’aide d’une tierce personne, besoin d’assistance médicale.d’aide d’une tierce personne, besoin d’assistance médicale.- Pour tous les traitements, la différence significative se situe au niveau < 0,0001.Pour tous les traitements, la différence significative se situe au niveau < 0,0001.
Régime seulRégime seul MetformineMetformine SUSU Uniquement insuline Uniquement insuline basalebasale
Insuline basale + Insuline basale + bolusbolus
0,8 %0,8 % 1,7 %1,7 %
7,9 %7,9 %
21,2 %21,2 %
32,6 %32,6 %
Pou
rcen
tag
e d
es p
atie
nts
qui
ont
P
ourc
enta
ge
des
pa
tient
s q
ui o
nt
rapp
orté
≥ 1
hyp
ogl
ycé
mie
/ an
(%
)ra
ppor
té ≥
1 h
ypo
glyc
ém
ie /
an (
%)
Hypoglycémies associées au traitementHypoglycémies associées au traitement

13
Asymptomatic Episodes of HypoglycemiAsymptomatic Episodes of Hypoglycemia a MayMay Go UnreportedGo Unreported
In a cohort of patients with In a cohort of patients with diabetes, more than 50% had diabetes, more than 50% had asymptomatic (unrecognized) asymptomatic (unrecognized) hypoglycemia, as identified by hypoglycemia, as identified by continuous glucose monitoringcontinuous glucose monitoring11
Other researchers have Other researchers have reported similar findingsreported similar findings2,32,3
1. 1. Copyright © 2003 American Diabetes Association.Copyright © 2003 American Diabetes Association. Chico A et al. Chico A et al. Diabetes Care.Diabetes Care. 2003;26(4):1153–1157. Reprinted with permission from 2003;26(4):1153–1157. Reprinted with permission from TheThe American American Diabetes Association. Diabetes Association.
2. 2. Weber KK et al. Weber KK et al. Exp Clin Endocrinol DiabetesExp Clin Endocrinol Diabetes. 2007;115:491–494. . 2007;115:491–494. 3. 3. Zick R et al. Zick R et al. Diab Technol TherDiab Technol Ther. 2007;9:483–492.. 2007;9:483–492.
00
2525
5050
7575
100100
AllAll patientspatientswith diabeteswith diabetes
TypeType 1 1 diabetesdiabetes
Pat
ient
s, %
Pat
ient
s, %
TypeType 22diabetesdiabetes
55.755.762.562.5
46.646.6
Patients With ≥1 Patients With ≥1 UnrecognizedUnrecognized
Hypoglycemic Event, Hypoglycemic Event, %%
n=70n=70 n=40n=40 n=30n=30

1. Whitmer RA et al JAMA 2009, 301:1565; 2. Zammitt NN et al Diabetes Care 2005, 28:2948; 3. Canadian Diabetes Association’s Clinical Practice Guidelines for 1. Whitmer RA et al JAMA 2009, 301:1565; 2. Zammitt NN et al Diabetes Care 2005, 28:2948; 3. Canadian Diabetes Association’s Clinical Practice Guidelines for Diabetes and Private and Commercial Driving. Canadian Journal Of Diabetes. 2003;27:128; 4. Jönsson L et al. Cost of Hypoglycemia in Patients with Type 2 Diabetes in Diabetes and Private and Commercial Driving. Canadian Journal Of Diabetes. 2003;27:128; 4. Jönsson L et al. Cost of Hypoglycemia in Patients with Type 2 Diabetes in Sweden. Value In Health. 2006; 9: 193-198; 5. Barnett AH, CMRO 2010;26: 1333; 6. Foley J & Jordan J, Vascular Health Risk Management, 2010 6:541-548Sweden. Value In Health. 2006; 9: 193-198; 5. Barnett AH, CMRO 2010;26: 1333; 6. Foley J & Jordan J, Vascular Health Risk Management, 2010 6:541-548
CV complicationsCV complications55CV complicationsCV complications55
DeathDeath22DeathDeath22
HypoglycemiaHypoglycemiaHypoglycemiaHypoglycemia
Hypoglycemia – understimated consequences

McCoy et al, Diabetes Care, 2012McCoy et al, Diabetes Care, 2012
3.3813.381

Antidiabétiques oraux disponibles
Inzucchi et al. Diabetes Care. 2012;35:1364-1379.Inzucchi et al. Diabetes Care. 2012;35:1364-1379.ADA Standards of medical care, Dabetes care 35, S11-S63, 2012ADA Standards of medical care, Dabetes care 35, S11-S63, 2012
Effet sur l’insulino-résistance
Effet sur l’insulino-sécrétion
Metformine ↓ ↔
Sulfamidés ↔ ↑
Glinides ↔ ↑
Thiazolidinediones ↓ -
Inhibiteurs de la DPP-4 ↔ ↑
Effet sur le poids
Risque d’hypo-
glycémiesImportants effets indésirables
↔ - Troubles GI
↑ ↑ Hypoglycémie,prise de poids
↑ ↑ Hypoglycémie,prise de poids
↑ - Prise de poids,rétention aqueuse
↔ - Pas de tendance significative

Range of weight change (kg) in responseRange of weight change (kg) in responseto diabetes medicationsto diabetes medications
Mitri J, Hamdy O. Expert Opin Drug Saf. 2009;8:573-84Mitri J, Hamdy O. Expert Opin Drug Saf. 2009;8:573-84
Diabetes medicationsDiabetes medications
Ran
ge
of w
eight
chan
ge
(kg)
Ran
ge
of w
eight
chan
ge
(kg)
1010
88
66
44
22
00
-2-2
-4-4
-6-6
SulphonylureasSulphonylureas GlinidesGlinides ThiazolidinedionesThiazolidinediones InsulinInsulin DPP-4 DPP-4 inhibitor inhibitor (gliptin)(gliptin)
MetforminMetformin GLP-1 GLP-1 receptor receptor agonist agonist
(exenatide)(exenatide)
Amylin agonist Amylin agonist (pramlintide)(pramlintide)
OTHER CONSIDERATIONSOTHER CONSIDERATIONS

Barrières pour un bon contrôle
PatientPatient-Effets indésirables-Effets indésirables
-Polymédication-Polymédication-Hypoglycémie-Hypoglycémie-Prise de poids-Prise de poids
MaladieMaladie-Chronique -Chronique
-Asymptomatique-Asymptomatique--Epuisement progressif Epuisement progressif
des cellules bêtades cellules bêta
MédecinMédecin-Inertie clinique-Inertie clinique
-Suivi & monitoring-Suivi & monitoring-Augmentation de la -Augmentation de la
médicationmédication

7
6
9
8Hb
A1c
(%
)
10
OAD* monotherapy
Diet andexercise
OAD combination
OAD + basal insulin
OAD monotherapyup-titration
Duration of diabetes
OAD + multiple daily
insulin injections
Conservative management of glycemia:traditional stepwise approach
HbA1c = 6.5%
Campbell IW. Br J Cardiol 2000; 7:625–631.
HbA1c = 7%
*OAD = oral antidiabetic

Barrières pour un bon contrôle MédecinMédecin
Adapté d’après Brown JB, et al. Diabetes Care. 2004;27:1535-1540.Adapté d’après Brown JB, et al. Diabetes Care. 2004;27:1535-1540.
14,5 mois14,5 mois
20,5 mois20,5 mois
Uniquement Uniquement MetformineMetformine
n = 513n = 513
Uniquement Sulfamidé Uniquement Sulfamidé n = 3.394n = 3.394
Mo
is a
vec
un
e H
bA
Mo
is a
vec
un
e H
bA
1c1c >
8,0
% >
8,0
%
Inertie clinique fréquente entre monothérapie et Inertie clinique fréquente entre monothérapie et association association
Délai entre la monothérapie initiale avec une HbADélai entre la monothérapie initiale avec une HbA1c1c > 8,0 % > 8,0 %
et passage / ajout d’une thérapie (mois)et passage / ajout d’une thérapie (mois)


Diabetes Care,Diabetes Care, Diabetologia. Diabetologia. 1919 April 2012 [Epub ahead of print]April 2012 [Epub ahead of print](Adapted with permission from: IsmailBeigi F, et al. (Adapted with permission from: IsmailBeigi F, et al. Ann Intern MedAnn Intern Med 2011;154:554) 2011;154:554)

DPP-4 comme 2DPP-4 comme 2ee choix après la metformine choix après la metformineDPP-4 comme 2DPP-4 comme 2ee choix après la metformine choix après la metformine
Adapté d’après Inzucchi et al. Diabetes Care 2012;35:1364-1379Adapté d’après Inzucchi et al. Diabetes Care 2012;35:1364-1379..
Two drug Two drug combinationscombinations
Efficacy (↓ HbAEfficacy (↓ HbA1c1c))HypoglycemiaHypoglycemiaWeightWeightMajor side effect(s)Major side effect(s)CostsCosts
MetforminMetformin
+ Sulfonylurea+ Sulfonylurea
HighHighModerate riskModerate riskGainGainHypoglycemiaHypoglycemiaLowLow
MetforminMetformin
+ Thiazolidinedione+ Thiazolidinedione
HighHighLow riskLow riskGainGainEdema, HF, fx’sEdema, HF, fx’sHighHigh
MetforminMetformin
+ DDP-4 inhibitor+ DDP-4 inhibitor
IntermediateIntermediateLow riskLow riskNeutralNeutralRareRareHighHigh
MetforminMetformin
+ + GLP-1 receptor GLP-1 receptor agonistagonist
HighHighLow riskLow riskLossLossGIGIHighHigh
MetforminMetformin
++ Insulin Insulin (usually basal)(usually basal)
HighestHighestHigh riskHigh riskGainGainHypoglycemiaHypoglycemiaVariableVariable
If needed to reach individualized HbAIf needed to reach individualized HbA1c1c target after ~3 months, proceed to 3-drug combination target after ~3 months, proceed to 3-drug combination (order not meant to denote any specific preference):(order not meant to denote any specific preference):
HEALTHY EATING, WEIGHT CONTROL, INCREASED PHYSICAL ACTIVITYHEALTHY EATING, WEIGHT CONTROL, INCREASED PHYSICAL ACTIVITYInitial drug Initial drug monotherapymonotherapy
Efficacy (↓ HbAEfficacy (↓ HbA1c1c))HypoglycemiaHypoglycemiaWeightWeightSide effectsSide effectsCostsCosts
HighHighLow riskLow riskNeutral / lossNeutral / lossGI / lactic acidosisGI / lactic acidosisLowLow
If needed to reach individualized HbAIf needed to reach individualized HbA1c1c target after ~3 months, proceed to 2-drug combination target after ~3 months, proceed to 2-drug combination (order not meant to denote any specific preference):(order not meant to denote any specific preference):
MetforminMetformin
More complex More complex insulin strategiesinsulin strategies
InsulinInsulin(multipe daily doses)(multipe daily doses)
Three drug Three drug combinationscombinations MetforminMetformin
+ Sulfonylurea+ Sulfonylurea
MetforminMetformin
+ Thiazolidinedione+ Thiazolidinedione
MetforminMetformin
+ DDP-4 inhibitor+ DDP-4 inhibitor
MetforminMetformin
+ + GLP-1 receptor GLP-1 receptor agonistagonist
MetforminMetformin
+ + Insulin Insulin (usually basal)(usually basal)
TZDTZD
DDP-4-iDDP-4-i
GLP-1-RAGLP-1-RA
InsulinInsulin
++ ++ ++ ++ ++
oror oror oror oror oror
oror oror oror oror oror
oror oror
SUSU
DDP-4-iDDP-4-i
GLP-1-RAGLP-1-RA
InsulinInsulin
SUSU
TZDTZD
InsulinInsulin
SUSU
TZDTZD
InsulinInsulin
TZDTZD
DDP-4-iDDP-4-i
GLP-1-RAGLP-1-RA
If combination therapy that includes basal insulin has failed to achieve HbAIf combination therapy that includes basal insulin has failed to achieve HbA1c1c target after 3-6 months, target after 3-6 months,proceed to a more complex insulin strategy, usually in combination with 1-2 non-insulin agents:proceed to a more complex insulin strategy, usually in combination with 1-2 non-insulin agents:
Recommandations ADA/ EASD 2012
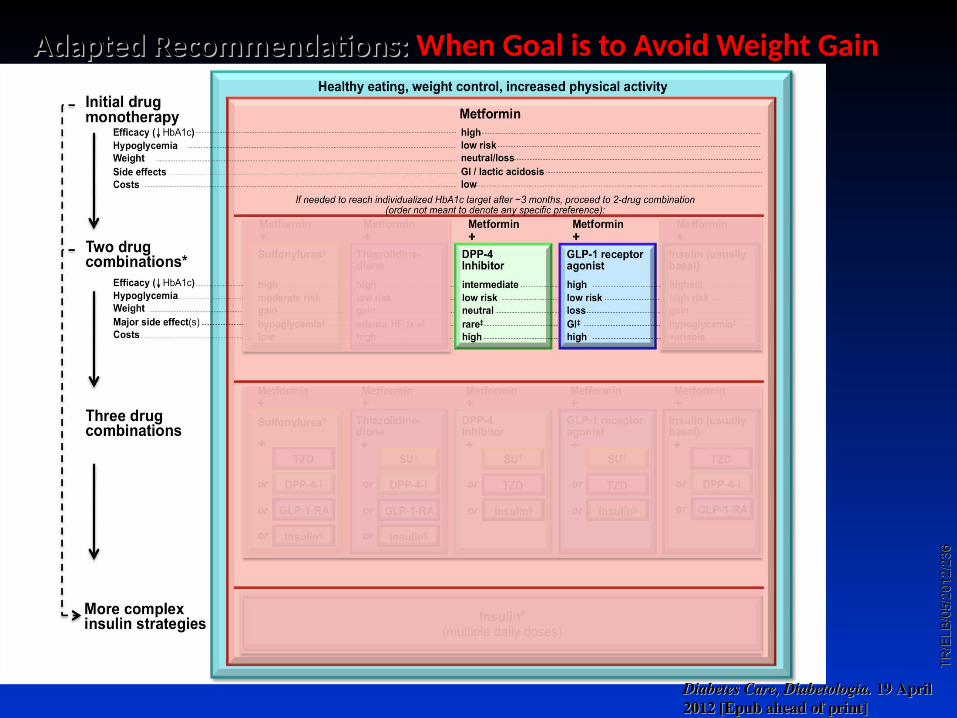
Adapted Recommendations: Adapted Recommendations: When Goal is to Avoid Weight GainWhen Goal is to Avoid Weight Gain
Diabetes Care,Diabetes Care, Diabetologia. Diabetologia. 1919 April April 2012 [Epub ahead of print]2012 [Epub ahead of print]
TR
/ELB
/05/
2012
/23
6T
R/E
LB/0
5/20
12/2
36

Time (min)
The Incretin Effect Demonstrates the Response to Oral vs IV Glucose1
Mean ± SE; n = 6; *p0.05; 01-02 = glucose infusion time.1. Nauck MA, et al. J Clin Endocrinol Metab. 1986;63:492–498.
Ven
ou
s P
lasm
a G
luco
se (
mm
ol/L
)
C-p
epti
de
(nm
ol/L
)
11
5.5
001 60 120 180 01 60 120 180
0.0
0.5
1.0
1.5
2.0
Time (min)02 02
Incretin Effect
Oral Glucose IV Glucose
*
*
*
**
**
La Barre La Barre « Sur les possibilités d’un traitement du diabète par l’incrétine », « Sur les possibilités d’un traitement du diabète par l’incrétine », Bulletin de Bulletin de l’Académie Royale de Médecine de Belgiquel’Académie Royale de Médecine de Belgique, 1932, 12, 620-634, 1932, 12, 620-634

INCRETINS
Glucagon-like peptide 1[GLP-1]
Gastric inhibitory polypeptide [GIP]
L cells
Glucose dependantInactivation by DPP-4Reduced secretion in
diabetes
K cellsGlucose dependant
Inactivation by DPP-4Normal secretion and
reduced effect in diabetes

GLP-1 Effects in Humans: Understanding the Glucoregulatory Role of Incretins1–4
Promotes satiety and reduces appetite
Beta cells:Enhances glucose-dependent insulin
secretion
1. Adapted from Flint A, et al. J Clin Invest. 1998;101:515–520. 2. Adapted from Larsson H, et al. Acta Physiol Scand. 1997;160:413–422. 3. Adapted from Nauck MA, et al. Diabetologia. 1996;39:1546–1553. 4. Adapted from Drucker DJ. Diabetes. 1998;47:159–169.
Liver: ↓ Glucagon reduces
hepatic glucose output
Alpha cells:↓ Postprandial
glucagon secretion
Stomach: Helps regulate
gastric emptying

09A
ug2
008
JAN
200
7BE
126
3SS
GLP1 Preserved Morphology of Human Islet Cells In Vitro
Day 1
GLP1–treated cellsControl
Day 3
Day 5
Adapted from Farilla L et al Endocrinology 2003;144:5149–5158.
Islets treated with GLP1 in culture were able to maintain their integrity for a longer period of time.

GLP-1 actions in the heart
CELL METABOLISM 3, 153–165, MARCH 2006. The biology of incretin hormones ReviewDaniel J. Drucker


Preumont, Baeck, Dumoutier et Buysschaert, SFD,2013Preumont, Baeck, Dumoutier et Buysschaert, SFD,2013

09A
ug2
008
JAN
200
7BE
126
3SS
** *
*
**
*p<0.05, type 2 diabetes vs. NGT Meal started at time 0 and finished at 10–15 minutes.Adapted from ToftNielsen MB et al J Clin Endocrinol Metab 2001;86:3717–3723.
GLP1 Levels Decreased in Type 2 Diabetes
NGT (n=33)Type 2 diabetes (n=54)
0
5
10
15
20
0 60 120 180 240
Time (minutes)
GLP
1 (
pm
ol/L
)
*
Meal Test Study

33BY/ELB/11/2009/462
Incretin Effect
Intravenous glucose
T2DControl Subjects
Glu
cose
† [m
mo
l/L
]
Glu
cose
† [
mm
ol/
L]
Insu
lin
† [
pm
ol/
L]
Insu
lin
† [
pm
ol/
L]
**
*
* * * * * *
5
0
10
15
20
5
0
10
15
20
0
100
200
300
400
500
Time (min)60 120 1800
0
100
200
300
400
500
60 120 1800
Time (min)60 120 1800
Time (min)60 120 1800
Time (min)
Oral glucose
Incretin Effect The incretin effect is diminished in patients
with type 2 diabetes (T2D)
*p<.05; †PlasmaAdapted from Nauck MA, et al. Diabetologia. 1986;29:46-52.

Rapid Inactivation (1–2 minutes) of GLP-1
DPP-4: Dipeptidyl peptidase-4.Adapted from Drucker DJ Expert Opin Invest Drugs 2003;12(1):87–100; Ahrén B Curr Diab Rep 2003;3:365–372.
IntestinalGLP-1release
GLP-1 (9-36)inactive
Mixed meal
GLP-1 (7-36)Active
(half-life <2 mins)
DPP-4inhibitor
DPP-4

Sitagliptine
Glycémie à jeunGlycémie à jeunHbAHbA11CC
Diabète de type 2 sans traitementDiabète de type 2 sans traitement
Sitagliptine 100/200 mg Sitagliptine 100/200 mg vsvs.. placebo placebo24 semaines24 semaines
– – 0.79 %0.79 % (100mg) (100mg) p≤0.001 vsp≤0.001 vs. placebo. placebo
– – 17.1 mg/dl (100 mg)17.1 mg/dl (100 mg) p<0.001 vsp<0.001 vs. placebo. placebo
Glycémie PPGlycémie PP
Aschner Aschner et alet al. Diabetes Care 2006; 29: 2632-2637. Diabetes Care 2006; 29: 2632-2637

Sitagliptine + MetformineSitagliptine + Metformine
HbA1C
Placebo (n=224)
Sitagliptine 100 mg (n=453)
0 6 12 18 24
8.0
8.5
9.0
9.5
10.0
10.5
Semaines
Placebo (n=226)
Sitagliptine 100 mg (n=454)
Glycémie à jeun
Sitagliptine + Metformine vs. Metformine + Placebo
24 semaines
Charbonnel et al. Diabetes Care 2006; 29: 2368-2643
- 0.65 %p<0.001
- 0.9 mmol/Lp<0.001

Initial Combination Therapy With Sitagliptin Plus Metformin Provided HbA1c Reductions at
24 Weeks1
37
APT=all-patients-treated; bid=twice daily; LS=least-squares; qd=once daily.APT=all-patients-treated; bid=twice daily; LS=least-squares; qd=once daily.aaPP≤0.001 vs placebo. ≤0.001 vs placebo. bbLS mean change from baseline without adjustment for placebo.LS mean change from baseline without adjustment for placebo.1. 1. GGoldstein BJ et al. oldstein BJ et al. Diabetes CareDiabetes Care. 2007;30(8):1979–1987.. 2007;30(8):1979–1987. Please note: Dr. Goldstein is currently a Merck employee but was not at the time Please note: Dr. Goldstein is currently a Merck employee but was not at the time this study was conducted or when the publication was written. this study was conducted or when the publication was written.
LS
Mea
n H
bA
LS
Mea
n H
bA
1c1c
Ch
an
ge
Fro
m
Ch
an
ge
Fro
m
Ba
selin
e, %
Ba
selin
e, %
––3.53.5
––3.03.0
––2.52.5
––2.02.0
––1.51.5
––1.01.0
––0.50.5
0.00.0
0.50.5
––0.80.8aa
––1.01.0aa
––1.31.3aa
––1.61.6aa
––2.12.1aa
24-Week placebo-adjusted results24-Week placebo-adjusted resultsMean baseline HbAMean baseline HbA1c1c = 8.8% = 8.8%
Placebo group results at 24 weeks: +0.2%Placebo group results at 24 weeks: +0.2%
n=178n=178 n=177n=177 n=183n=183 n=178n=178n=175n=175
24-Week open-label results24-Week open-label results Mean baseline HbAMean baseline HbA1c1c = 11.2% = 11.2%
––2.92.9bb
n=117n=117
Sitagliptin 50 mg bid + metformin 1000 mg Sitagliptin 50 mg bid + metformin 1000 mg bidbid
Metformin 1000 mg Metformin 1000 mg bidbid
Sitagliptin 50 mg bid + metformin 500 mg Sitagliptin 50 mg bid + metformin 500 mg bidbid
Metformin 500 mg Metformin 500 mg bid bid
Sitagliptin 100 mg qd Sitagliptin 100 mg qd

38
Initial Combination Therapy With Sitagliptin Plus Metformin
Week –2Week –2 Day 1Day 1
ScreeningScreening periodperiod
If on OHA, If on OHA, discontinue discontinue
therapytherapy
Single-blind Single-blind placeboplacebo
run-in periodrun-in period
Diet and Diet and exercise exercise
run-in periodrun-in period
HbAHbA1c1c 7.5%–11%Eligible 7.5%–11%Eligible
ifif
Week 54Week 54
PatientsPatients with with T2DM not on T2DM not on therapy or on therapy or on mono- or low-mono- or low-dose combo-dose combo-
OHAOHA
RR
Metformin 500 mg bidMetformin 500 mg bid
Metformin 1,000 mg bidMetformin 1,000 mg bid
Sitagliptin 100 Sitagliptin 100 mg mg qdqd
Week 104Week 104
50-week50-weekextension study extension study 33
24-week phase24-week phase11 with with 30-week continuation phase30-week continuation phase22
Sitagliptin 50 mg bid + metformin 1,000 mg Sitagliptin 50 mg bid + metformin 1,000 mg bidbid
Sitagliptin 50 mg bid + metformin 500 mg bidSitagliptin 50 mg bid + metformin 500 mg bid
6–12 weeks6–12 weeks
Glycemic rescue criteriaGlycemic rescue criteriaWeek 24Week 24
FPG criteria FPG criteria to week 24to week 24
HbAHbA1c1c >8% >8% to week 54to week 54
HbAHbA1c1c >7.5% >7.5% to week 104to week 104
PlaceboPlacebo Metformin 1,000 mg bidMetformin 1,000 mg bid
bid=twice daily; FPG=fasting plasma glucose; OHA=oral antihyperglycemic agent; qd=once daily; R=randomization; T2DM=type 2 diabetes mellitus.bid=twice daily; FPG=fasting plasma glucose; OHA=oral antihyperglycemic agent; qd=once daily; R=randomization; T2DM=type 2 diabetes mellitus.1.1. Goldstein B et al. Goldstein B et al. Diabetes CareDiabetes Care. 2007;30(8):1979–1987.. 2007;30(8):1979–1987.2.2. Williams-Herman D et al. Williams-Herman D et al. Curr Med Res OpinCurr Med Res Opin. 2009;25(3):569–583.. 2009;25(3):569–583.3.3. Williams-Herman D et al. Williams-Herman D et al. Diabetes Obes MetabDiabetes Obes Metab. 2010;12(5):442–451. 2010;12(5):442–451..

Initial Combination Therapy With Sitagliptin Plus Metformin Provided HbA1c Reductions Through
104 Weeks1
39APT=all-patients-treated; bid=twice daily; LS=least-squares; qd=once daily. APT=all-patients-treated; bid=twice daily; LS=least-squares; qd=once daily. 1. 1. Used with permission: Williams-Herman D et al. Used with permission: Williams-Herman D et al. Diabetes Obes MetabDiabetes Obes Metab. 2010;12(5):442–451.. 2010;12(5):442–451.
Sitagliptin 100 mg qd Sitagliptin 100 mg qd (n=50)(n=50)Metformin 500 mg bid Metformin 500 mg bid ((n=64)n=64) Sitagliptin 50 mg bid + metformin 1000 mg bid Sitagliptin 50 mg bid + metformin 1000 mg bid
(n=105)(n=105)Metformin 1000 mg bid (n=87)Metformin 1000 mg bid (n=87)
Sitagliptin 50 mg bid + metformin 500 mg Sitagliptin 50 mg bid + metformin 500 mg bid (n=96)bid (n=96)
ExtensionExtensionStudyStudy
24-Week24-WeekPhasePhase
ContinuationContinuationPhasePhase
LS
Mea
n H
bA
LS
Mea
n H
bA
1c1c C
han
ge
Fro
m B
asel
ine
, % C
han
ge
Fro
m B
asel
ine
, %
––1.21.2
––1.11.1
––1.31.3
––1.41.4
––1.71.7
Mean baseline HbAMean baseline HbA1c1c = 8.5%–8.7% = 8.5%–8.7%
00 66 1212 1818 2424 3030 3838 4646 5454 6262 7070 7878 9191 1041046.06.0
6.56.5
7.07.0
7.57.5
8.08.0
8.58.5
9.09.0
WeeksWeeks
APT Population (Extension Study)APT Population (Extension Study)

Initial Combination Therapy With Sitagliptin Plus Metformin: Body Weight at 104 Weeks1,a
40
Sitagliptin 100 mg qd
n=50
Metformin 500 mg bid
n=59
Metformin 1000 mg bid n=81
Sitagliptin 50 mg bid + Metformin 500 mg bid
n=94
Sitagliptin 50 mg bid + Metformin 1000 mg
bid n=100
LS mean change in weight from baseline, kg (95% CI)
0.5 (–0.7, 1.7)
–0.8 (–1.9, 0.3)
–2.4b
(–3.3, –1.5) 0.0
(–0.8, 0.9) –1.2b
(–2.0, –0.3)
APT=all-patients-treated; bid=twice daily; CI=confidence interval; LS=least-squares; qd=once daily. APT=all-patients-treated; bid=twice daily; CI=confidence interval; LS=least-squares; qd=once daily. aaResults include only randomized patients who entered the extension study, had not received glycemic rescue therapy through week 54, Results include only randomized patients who entered the extension study, had not received glycemic rescue therapy through week 54, took at least 1 dose of study medication after week 54, and had at least 1 post-54-week A1C measurement.took at least 1 dose of study medication after week 54, and had at least 1 post-54-week A1C measurement.
bb95% confidence interval for LS mean change from baseline excluded “0.”95% confidence interval for LS mean change from baseline excluded “0.”1. 1. Williams-Herman D et al. Williams-Herman D et al. Diabetes Obes MetabDiabetes Obes Metab. 2010;12(5):442–451.. 2010;12(5):442–451.
APT Population (Extension Study)APT Population (Extension Study)

The AE Profile of Sitagliptin Plus Metformin Therapy
Was Similar to Those of Either Agent Alone Over 104 Weeks1,a
41
Patients, n (%)
Sitagliptin 100 mg qd
(n=179)
Metformin 500 mg bid
(n=182)
Metformin 1000 mg bid
(n=182)
Sitagliptin 50 mg +
metformin 500 mg bid
(n=190)
Sitagliptin50 mg +
metformin 1000 mg bid
(n=182)
One or more AEs 108 (60) 117 (64) 135 (74) 135 (71) 137 (75)
Drug-related AEs 17 (10) 27 (15) 35 (19) 33 (17) 37 (20)
Serious AEs 13 (7) 7 (4) 9 (5) 12 (6) 11 (6)
Discontinued due to AEs 5 (3) 8 (4) 7 (4) 6 (3) 4 (2)
Discontinued due to serious AEs 4 (2) 5 (3) 1 (1) 1 (1) 0 (0)
Deaths 0 (0) 1 (1) 0 (0) 1 (1) 1 (1)
AE=adverse event; bid=twice daily; qd=daily. AE=adverse event; bid=twice daily; qd=daily. aaResults include all study-blind randomized patients who took at least 1 dose of study medication. Results include all study-blind randomized patients who took at least 1 dose of study medication. 1. 1. Williams-Herman D et al. Williams-Herman D et al. Diabetes Obes MetabDiabetes Obes Metab. 2010;12(5):442–451.. 2010;12(5):442–451.

Sitagliptine Sitagliptine vsvs. Sulfamides. SulfamidesH
bA
1c
(% ±
SE
)
Nauck et al. Diabetes Obes Metab 2007; 9: 194–205
Semaines
5.8
6.0
6.2
6.4
6.6
6.8
7.0
7.2
7.4
7.6
7.8
0 6 12 18 24 30 38 46 52
Sulfamide + metformine (n=411)
Sitagliptine + metformine (n=382)
Sitagliptine + Metformine vs.Glipizide + Metformine
52 semaines
- 0.67 %
Poids:Poids:-1.5 kg -1.5 kg SitagliptineSitagliptine+ 1.1 kg + 1.1 kg GlipizideGlipizide
Hypoglycémies:Hypoglycémies:5 % 5 % SitagliptineSitagliptine32 % 32 % GlipizideGlipizide

Comparative efficacy of DPP4i’s vs oral antidiabetic drugs Comparative efficacy of DPP4i’s vs oral antidiabetic drugs Head to head trials in drug naive and metformin-treated patientsHead to head trials in drug naive and metformin-treated patients
• MetforminMetformin : greater reduction in HbA1c and weight : greater reduction in HbA1c and weight
• SUSU : no significant difference in HbA1c but : no significant difference in HbA1c but greater weight gain and higher incidence of greater weight gain and higher incidence of hypo’s, more “escape” with secondary increase in HbA1chypo’s, more “escape” with secondary increase in HbA1c
•TZD TZD : slightly greater reduction in HbA1c but : slightly greater reduction in HbA1c but greater weight gaingreater weight gain
• DPP4i’s DPP4i’s : No expected differences in efficacy in the class (shown for saxa vs sitagliptin): No expected differences in efficacy in the class (shown for saxa vs sitagliptin)
Mean changes in HbA1cMean changes in HbA1c
Mean changes in body weightMean changes in body weight
Scheen AJ, Diabetes & Metabolism, available on line, march 2012Scheen AJ, Diabetes & Metabolism, available on line, march 2012 TR/ELB/04/2012/169TR/ELB/04/2012/169
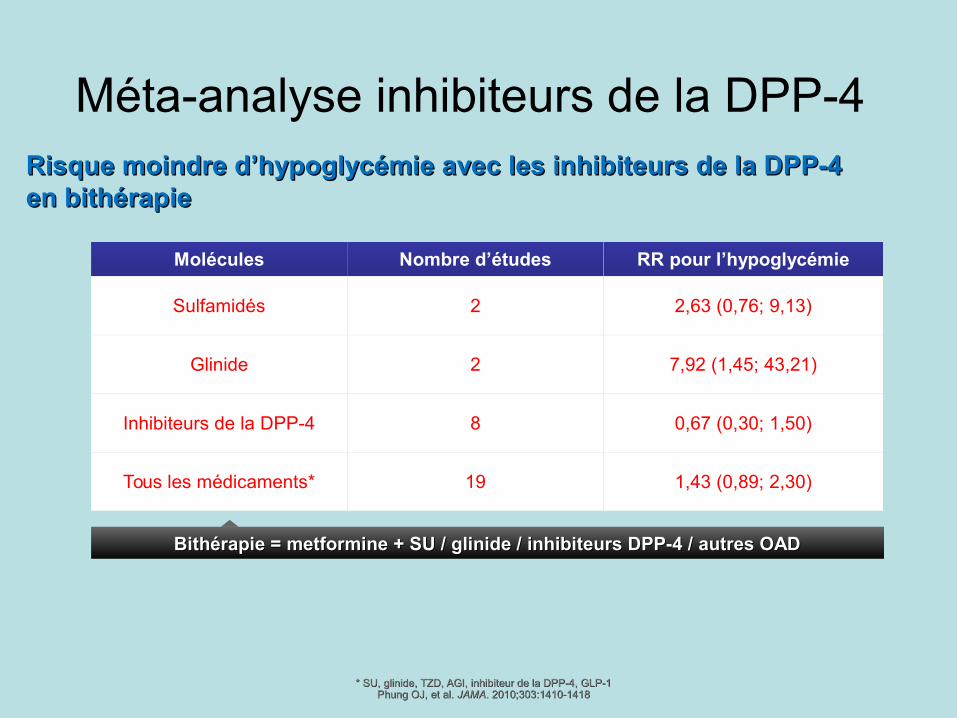
Méta-analyse inhibiteurs de la DPP-4 Risque moindre d’hypoglycémie avec les inhibiteurs de la DPP-4 Risque moindre d’hypoglycémie avec les inhibiteurs de la DPP-4 en bithérapieen bithérapie
Molécules Nombre d’études RR pour l’hypoglycémie
Sulfamidés 2 2,63 (0,76; 9,13)
Glinide 2 7,92 (1,45; 43,21)
Inhibiteurs de la DPP-4 8 0,67 (0,30; 1,50)
Tous les médicaments* 19 1,43 (0,89; 2,30)
* SU, glinide, TZD, AGI, inhibiteur de la DPP-4, GLP-1* SU, glinide, TZD, AGI, inhibiteur de la DPP-4, GLP-1Phung OJ, et al. Phung OJ, et al. JAMAJAMA. 2010;303:1410-1418. 2010;303:1410-1418
Bithérapie = metformine + SU / glinide / inhibiteurs DPP-4 / autres OADBithérapie = metformine + SU / glinide / inhibiteurs DPP-4 / autres OAD

Summary: A Case for Use of Sitagliptin as Add-on to Metformin in Place of Sulfonylureas
• Use of DPP-4 inhibitors following metformin therapy is supported by the ADA /EASD algorithm as an option for patient treatment.1
• Hypoglycemia is a barrier to glycemic control.2,3
• In comparison to sulfonylureas, sitagliptin provided similar efficacy in reducing HbA1c in patients uncontrolled on metformin, but with no weight gain and fewer reported hypoglycemic episodes.4-7
45
1. 1. Rodbard HW et al. Rodbard HW et al. Endocr Pract. Endocr Pract. 2009;15(6):540–559.2009;15(6):540–559.2. 2. Pollack MF et al. Pollack MF et al. Diabetes Res Clin PractDiabetes Res Clin Pract. 2010;87: 204–210. 2010;87: 204–210..3. 3. Álvarez Guisasola F et al. Álvarez Guisasola F et al. Diabetes Obes MetabDiabetes Obes Metab.. 2008;10(suppl 1):25–32.2008;10(suppl 1):25–32.4. 4. Nauck MA et al. Nauck MA et al. Diabetes Obes MetabDiabetes Obes Metab. 2007;9(2):194–205. . 2007;9(2):194–205. 5. 5. Seck T et al. Seck T et al. Int J Clin PractInt J Clin Pract. 2010;64(5):562–576. . 2010;64(5):562–576. 6. 6. Seck TL et al. Seck TL et al. Diab Res Clin PractDiab Res Clin Pract. 2011;doi:10.1016/j.diabres.2011.03.006.. 2011;doi:10.1016/j.diabres.2011.03.006.7. 7. Arechavaleta R et al. Arechavaleta R et al. Diabetes Obes MetabDiabetes Obes Metab. 2011;13:160–168. . 2011;13:160–168.


Sitagliptin Pooled Safety Analysis: Design1 19 double-blind, randomized, controlled clinical studies up to 2 years in
duration• Sitagliptin as monotherapy • Sitagliptin in initial combination with metformin (MET) or pioglitazone
(PIO)• Sitagliptin in combination with MET, PIO, sulfonylurea (SU) (±MET),
MET + rosiglitazone (ROSI), or insulin (±MET)• Patients included in the non-exposed group received the following:
placebo, MET, PIO, SU (±MET), ROSI (±MET), or insulin (±MET)Population (N=10,246)• Sitagliptin 100 mg/day group (n=5429)
– 1805 patients were treated for at least 1 year– 584 patients were treated for 2 years– Mean duration of exposure was 282 days
• Non-exposed group (n=4817)– 1320 patients were treated for at least 1 year– 470 patients were treated for 2 years– Mean duration of exposure was 259 days
aaStudies with results available as of July 2009.Studies with results available as of July 2009.1. 1. Williams-Herman D et al. Williams-Herman D et al. BMC Endocr DisordBMC Endocr Disord. 2010;10:7. . 2010;10:7.

Sitagliptin Pooled Safety Analysis: Summary of Adverse Experiences1
Incidence Rate per 100 Patient-Years
Sitagliptin n=5429
Non-exposedn=4817
Between-Groups Difference (95% CI)a
1 or more AEs 153.5 162.6 –7.6 (–15.6, 0.3)
Drug-related AEsb 20.0 26.8 –6.4 (–8.7, –4.1)
Serious AEs 7.8 7.9 –0.1 (–1.3, 1.1)
Serious drug-related AEsb 0.4 0.3 0.1 (–0.1, 0.4)
Died 0.3 0.5 –0.2 (–0.5, 0.1)
Discontinued due to AEs 4.8 5.2 –0.5 (–1.5, 0.4)
Discontinued due to drug-related AEsb 1.7 2.3 –0.5 (–1.1, 0.1)
Discontinued due to serious AEs 1.7 1.7 –0.0 (–0.6, 0.5)
Discontinued due to serious drug-related AEsb 0.2 0.1 0.1 (–0.1, 0.3)
AE=adverse experience; CI=confidence interval.AE=adverse experience; CI=confidence interval.aaBetween-groups difference and 95% CI based on stratified analysis. Positive differences indicate that the incidence rate for the sitagliptin group was higher than the incidence rate for the Between-groups difference and 95% CI based on stratified analysis. Positive differences indicate that the incidence rate for the sitagliptin group was higher than the incidence rate for the
non-exposed group. "0.0" and "–0.0" represent rounding for values that were slightly greater and slightly less than zero, respectively.non-exposed group. "0.0" and "–0.0" represent rounding for values that were slightly greater and slightly less than zero, respectively.bbConsidered by the investigator to be drug related.Considered by the investigator to be drug related.1. 1. Williams-Herman D et al. Williams-Herman D et al. BMC Endocr DisordBMC Endocr Disord. 2010;10:7. . 2010;10:7.

Sitagliptin Pooled Analysis: No Difference in Incidence of Pancreatitis Between Sitagliptin and
Non-exposed Groups1
Incidence Rate per 100 Patient-Years
Adverse ExperienceSitagliptin
n=5,429Non-exposed
n=4,817Between-Groups
Difference, (95% CI)a
Pancreatitis 0.08 0.10 –0.02 (–0.20, 0.14)
Chronic pancreatitis 0.04 0.03 0.02 (–0.11, 0.13)
• Preclinical and clinical trial dataa with sitagliptin to date do not indicate an increased risk of pancreatitis in patients with type 2 diabetes treated with sitagliptin.
CI=confidence interval.CI=confidence interval.aaData available through July 2009.Data available through July 2009.1.1. Engel SS et al. Engel SS et al. Int J Clin PractInt J Clin Pract. 2010;6497):984–990.. 2010;6497):984–990.

Sitagliptin Pooled Safety Analysis: Malignant and Non-malignant Neoplasms1
Adverse Experience
n / Patient-Years of Exposure (incidence rate per 100 patient-years)
Sitagliptin n=5429
Non-exposedn=4817
Between-Groups Difference (95% CI)a
Any malignancy 46/4690 (1.0) 40/3930 (1.0) –0.0 (–0.5, 0.4)
50
• Incidences of malignancies were similarly low for both treatment groups.– The most common malignancies were basal cell carcinoma, breast cancer
(women), and prostate cancer (men).
• The incidence of non-malignant neoplasms was higher in the sitagliptin group than in the non-exposed group (1.3 per 100 PY vs 0.7 per 100 PY).– The most common non-malignant events were uterine leiomyoma and lipoma
(women).
CI=confidence interval; PY=patient years.CI=confidence interval; PY=patient years.aaBetweedence and 95% CI based on stratified analysis. Positive differences indicate that the incidence rate for the sitagliptin group was higher than the incidence rate for the non-Betweedence and 95% CI based on stratified analysis. Positive differences indicate that the incidence rate for the sitagliptin group was higher than the incidence rate for the non-
exposed group. "0.0" and "–0.0" represent rounding for values that were slightly greater and slightly less than zero, respectively.exposed group. "0.0" and "–0.0" represent rounding for values that were slightly greater and slightly less than zero, respectively.1. 1. Williams-Herman D et al. Williams-Herman D et al. BMC Endocr DisordBMC Endocr Disord. 2010;10:7. . 2010;10:7.
Data from D Cohen, BMJ, june 2013…Data from D Cohen, BMJ, june 2013…

Sitagliptin CV Pooled Safety Analysis: No Difference in MACEa Between Sitagliptin and Nonexposed Groups1,b
Sitagliptin (n=7,726)
Nonexposed (n=6,885)
Cumulative exposure, PY 6,157 5,114
MACE, n 40 38
Incidence rate per 100 PY 0.65 0.74
RR (95% CI) 0.83 (0.53, 1.30)
5151
aaMACE was comprised of ischemic events and cardiovascular deaths.MACE was comprised of ischemic events and cardiovascular deaths.bb13,462 of the 14,611 patients contributed to the primary analysis after exclusion of 4 studies with no events.13,462 of the 14,611 patients contributed to the primary analysis after exclusion of 4 studies with no events.CI=confidence interval; MACE=major adverse cardiovascular events; PY= patient-years; RR=adjusted incidence rate ratio. CI=confidence interval; MACE=major adverse cardiovascular events; PY= patient-years; RR=adjusted incidence rate ratio. 1. 1. Engel S et al. Engel S et al. Cardiovascular Diabetology. Cardiovascular Diabetology. 2013;12:3. 2013;12:3.
A total of 78 patients experienced at least 1 MACE-related eventA total of 78 patients experienced at least 1 MACE-related event

Meta-analysis performed including all randomized clinical trials with a duration of ≥24 weeks, enrolling patients with type 2 diabetes, comparing DPP-4 inhibitors with either
placebo or active drugsa.
Meta-analysis of Clinical Trials With DPP-4 Inhibitors: No Evidence of Increased Risk of MACE Associated With Treatment1
AE=adverse event; CI=confidence interval; DPP-4=dipeptidyl peptidase-4; MH-OR=Mantel–Haenzel odds ratio.AE=adverse event; CI=confidence interval; DPP-4=dipeptidyl peptidase-4; MH-OR=Mantel–Haenzel odds ratio.aaComparators were: acarbose, GLP-1R agonists, metformin, sulfonylureas, thiazolidinediones, and placebo.Comparators were: acarbose, GLP-1R agonists, metformin, sulfonylureas, thiazolidinediones, and placebo.1. Monami M et al. 1. Monami M et al. Curr Med Res OpinCurr Med Res Opin. 2011; 27:57–64.. 2011; 27:57–64.
5252
DrugsDrugs
OVERALLOVERALL
AlogliptinAlogliptin
SaxagliptinSaxagliptin
SitagliptinSitagliptinVildaglptinVildaglptin
Major Cardiovascular EventsMajor Cardiovascular Events
0.689 [0.528, 0.899] 0.006 430.689 [0.528, 0.899] 0.006 43
0.666 [0.428, 1.036] 0.072 120.666 [0.428, 1.036] 0.072 12
0.740 [0.479, 1.147] 0.173 180.740 [0.479, 1.147] 0.173 180.655 [0.382, 1.123] 0.124 80.655 [0.382, 1.123] 0.124 8
0.630 [0.012, 33.048] 0.819 20.630 [0.012, 33.048] 0.819 2
MH-OR (95% CI)MH-OR (95% CI) PP # Trials# Trials 0.0010.001 0.10.1 1.01.0 1010 100100
MH-OR, 95% CIsMH-OR, 95% CIs
This meta-analysis has several limitations. Cardiovascular events were not primary endpoints in the trials used in this analysis and were This meta-analysis has several limitations. Cardiovascular events were not primary endpoints in the trials used in this analysis and were only reported as AEsonly reported as AEs. . Also, the short duration of trials included in this analysis do not allow for any conclusions about the long-term Also, the short duration of trials included in this analysis do not allow for any conclusions about the long-term
safety of DPP-4 inhibitors to be madesafety of DPP-4 inhibitors to be made. .

Gæde P. et al. New Eng J Med 2008, 358 (6): 580-591.
STENO-2 FOLLOW-UP: résultats après 13.3 années