Embed Size (px)
Citation preview

Correlation between Laboratory and Plant Produced High RAP/RAS Mixtures
NEAUPG 2015 Annual MeetingOct. 22, 2015
Burlington, VT
Reyhaneh Rahbar Rastegar

Motivation• Specification limitation on using recycled
material
• Asphalt Recycling Advantagesü Economicü Environmentally friendly
• Lab vs. Plantü Performance- based designü Comparison of PMPC and LMLC mixtures
performance
10/22/15 2

Project Overview
§ Project No. 15680R, funded by NHDOT
§ Objectives:
o To evaluate the properties of mixtures with RAP and RAS in HMA
o To revise NHDOT existing specificationo To compare laboratory and plant produced mixes
• Lab produced specimens, and binder extraction and recovery by NHDOT
• Plant produced specimens by Pike Industries, Inc.
310/22/15

Summary of Mixtures
o Lebanonü 11 Mixtures (Plant), 8 Mixtures (Lab)ü Binder PG Grade (PG 58-28, PG 52-34)ü Two sources for each binder gradeü NMAS (12.5 and 19 mm)ü Recycled Material (20% RAP, 20% RAP/RAS, 30% RAP)
o Hooksettü 4 Mixtures (Plant)ü Binder PG Grade (PG 58-28, PG 64-28)ü NMAS (9.5 and 12.5 mm)ü Recycled Material (20% RAP, 25% RAP)
410/22/15

Mixture Properties• Target Air Void (test specimen): 6% ± 0.5• RAP Binder Grade: 81.3-19.3• Tear off Shingles
5
0
20
40
60
80
100
0.01 0.1 1 10 100
Perc
ent P
assi
ng
Seive Size (mm)
9.5 mm12.5 mm19 mm
GradationsMixture
NMAS (mm)%AC
Design Total
19.0 4.7- 4.8
12.5 5.3
9.5 5.8- 6.0
10/22/15

Testing
• Binder Testing (by NHDOT)üExtraction and RecoveryüPG Gradingü4mm DSR (by Gerry Reinke, Mathy Construction)
• Mixture Testing (by UNH)üComplex ModulusüSVECD FatigueüDCT testing
610/22/15

Testing
• Complex Modulus (AASHTO TP-62)ü 3 replicatesü Different Temperatures and Frequenciesü Dynamic Modulus and Phase Angle Mastercurves
• SVECD Fatigue Testing (AASHTO TP-107)ü 4 replicatesü C-S and GR-Nf
ü Simplified Viscoelastic Continuum DamageApproach
710/22/15

Summary of the Results
810/22/15

Binder Results
10/22/15 9
12.5 mm
46.0
52.0
58.0
64.0
70.0
76.0
82.0
88.0
Aver
y La
ne
Mc
Asph
alt
Mc
Asph
alt
Sunc
or
RAP
20%
RAP
20%
RAP
/RAS
30%
RAP
20%
RAP
20%
RAP
/RAS
30%
RAP
20%
RAP
20%
RAP
/RAS
30%
RAP
20%
RAP
/RAS
30%
RAP
PG 58-28 PG 52-34 Mc Asphalt 58-28 Mc Asphalt 52-34 Mc Asp.
58-28
Avery Lane 58-28
Suncor 52-34
Virgin Binder RAP 12.5 mm 12.5 mm 19 mm 19 mm
Hig
h Te
mpe
ratu
re P
G G
rade
(°C
) LMLC PMPC
19 mm

Binder Results
10/22/15 10
-34.0
-28.0
-22.0
-16.0
Aver
y La
ne
Mc
Asph
alt
Mc
Asph
alt
Sunc
or
RAP
20%
RAP
20%
RAP
/RAS
30%
RAP
20%
RAP
20%
RAP
/RAS
30%
RAP
20%
RAP
20%
RAP
/RAS
30%
RAP
20%
RAP
/RAS
30%
RAP
PG 58-28 PG 52-34 Mc Asphalt 58-28 Mc Asphalt 52-34
Mc Asp.
58-28Avery Lane 58-
28 Suncor 52-34
Virgin Binder RAP 12.5 mm 12.5 mm 19 mm 19 mm
Low
Tem
pera
ture
PG
Gra
de (°
C)
LMLC PMPC12.5 mm19 mm

10/22/15 11
Binder Rheological Parameters
• Tcr (Stiffness) = Critical low temp. where S(60) = 300• Tcr (m-slope) = Critical low temp. where m(60) = 0.3• ΔTcr = Tcr (Stiffness) – Tcr (m-slope)

Binder Results
10/22/15 12
0.00
6.00
12.00
18.00
Aver
y La
ne
Mc
Asph
alt
Mc
Asph
alt
Sunc
or
RAP
20%
RAP
20%
RAP
/RAS
30%
RAP
20%
RAP
20%
RAP
/RAS
30%
RAP
20%
RAP
20%
RAP
/RAS
30%
RAP
20%
RAP
/RAS
30%
RAP
PG 58-28 PG 52-34 Mc Asphalt 58-28 Mc Asphalt 52-34 Mc Asp.
58-28
Avery Lane 58-28
Suncor 52-34
Virgin Binder RAP 12.5 mm 12.5 mm 19 mm 19 mm
∆Tc
LMLC
PMPC
12.5 mm 19 mm

Dynamic Modulus (12.5 mm)
13
100
1000
10000
100000
0.001 0.01 0.1 1 10 100 1000 10000
Dyn
amic
Mod
ulus
(MPa
)
Reduced Frequency (Hz)
PMPC Mixtures, 12.5 mm
PG 52-34, 30% RAP
PG 52-34, 20% RAP
PG 52-34, 20% RAP/RAS
PG 58-28, 30% RAP
PG 58-28, 20% RAP
PG 58-28, 20% RAP/RAS
100
1000
10000
100000
0.001 0.01 0.1 1 10 100 1000 10000
Dyn
amic
Mod
ulus
(MPa
)
Reduced Frequency (Hz)
LMLC Mixtures, 12.5 mm
PG 52-34, 30% RAP
PG 52-34, 20% RAP
PG 58-28, 30% RAP
PG 58-28, 20% RAP
10/22/15
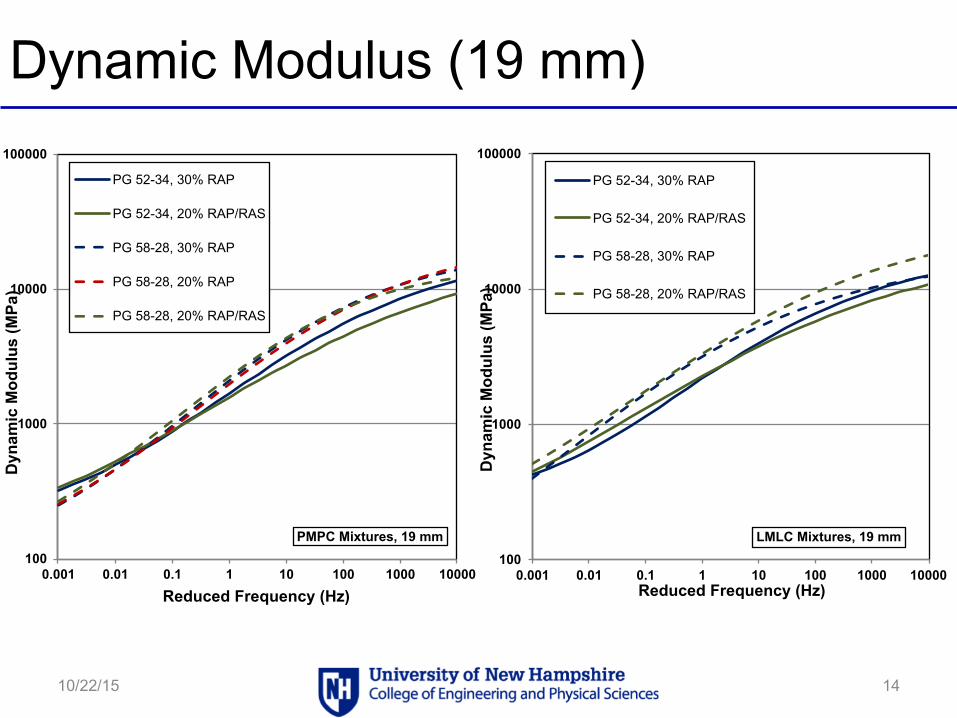
Dynamic Modulus (19 mm)
14
100
1000
10000
100000
0.001 0.01 0.1 1 10 100 1000 10000
Dyn
amic
Mod
ulus
(MPa
)
Reduced Frequency (Hz)
PMPC Mixtures, 19 mm
PG 52-34, 30% RAP
PG 52-34, 20% RAP/RAS
PG 58-28, 30% RAP
PG 58-28, 20% RAP
PG 58-28, 20% RAP/RAS
100
1000
10000
100000
0.001 0.01 0.1 1 10 100 1000 10000
Dyn
amic
Mod
ulus
(MPa
)
Reduced Frequency (Hz)
LMLC Mixtures, 19 mm
PG 52-34, 30% RAP
PG 52-34, 20% RAP/RAS
PG 58-28, 30% RAP
PG 58-28, 20% RAP/RAS
10/22/15

Dynamic Modulus, Plant vs. Lab, 12.5 mm
10/22/15 15
100
1000
10000
100000
0.001 0.01 0.1 1 10 100 1000 10000
Dyn
amic
Mod
ulus
(MPa
)
Reduced Frequency (Hz)
PG 52-34, 12.5 mm, 30% RAPPlant
Lab
100
1000
10000
100000
0.001 0.01 0.1 1 10 100 1000 10000
Dyn
amic
Mod
ulus
(MPa
)
Reduced Frequency (Hz)
PG 58-28, 12.5 mm, 30% RAP Plant
Lab
100
1000
10000
100000
0.001 0.01 0.1 1 10 100 1000 10000
Dyn
amic
Mod
ulus
(MPa
)
Reduced Frequency (Hz)
PG 52-34, 12.5 mm, 20% RAPPlant
Lab
100
1000
10000
100000
0.001 0.01 0.1 1 10 100 1000 10000
Dyn
amic
Mod
ulus
(MPa
)
Reduced Frequency (Hz)
PG 58-28, 12.5 mm, 20% RAPPlant
Lab

Dynamic Modulus, Plant vs. Lab, 19 mm
10/22/15 16
100
1000
10000
100000
0.001 0.01 0.1 1 10 100 1000 10000
Dyn
amic
Mod
ulus
(MPa
)
Reduced Frequency (Hz)
PG 52-34, 19 mm, 30% RAPPlant
Lab
100
1000
10000
100000
0.001 0.01 0.1 1 10 100 1000 10000
Dyn
amic
Mod
ulus
(MPa
)
Reduced Frequency (Hz)
PG 58-28, 19 mm, 30% RAPPlant
Lab
100
1000
10000
100000
0.001 0.01 0.1 1 10 100 1000 10000
Dyn
amic
Mod
ulus
(MPa
)
Reduced Frequency (Hz)
PG 52-34, 19 mm, 20% RAP/RASPlant
Lab
100
1000
10000
100000
0.001 0.01 0.1 1 10 100 1000 10000
Dyn
amic
Mod
ulus
(MPa
)
Reduced Frequency (Hz)
PG 58-28, 19 mm, 20% RAPRASPlant
Lab

Black Space, Plant vs. Lab, (12.5 mm)
10/22/15 17
100
1000
10000
100000
10 20 30 40 50
Dyn
amic
Mod
ulus
(MPa
)
Phase Angle (Degree)
PG 52-34, 12.5 mm, 30% RAP PlantLab
100
1000
10000
100000
10 20 30 40 50
Dyn
amic
Mod
ulus
(MPa
)
Phase Angle (Degree)
PG 58-28, 12.5 mm, 30% RAP PlantLab
100
1000
10000
100000
10 20 30 40 50
Dyn
amic
Mod
ulus
(MPa
)
Phase Angle (Degree)
PG 52-34, 12.5 mm, 20% RAP PlantLab
100
1000
10000
100000
10 20 30 40 50
Dyn
amic
Mod
ulus
(MPa
)
Phase Angle (Degree)
PG 58-28, 12.5 mm, 20% RAP Plant
Lab

Black Space, Plant vs. Lab, (19 mm)
10/22/15 18
100
1000
10000
100000
10 20 30 40 50
Dyn
amic
Mod
ulus
(MPa
)
Phase Angle (Degree)
PG 52-34, 19 mm, 30% RAP PlantLab
100
1000
10000
100000
10 20 30 40 50
Dyn
amic
Mod
ulus
(MPa
)
Phase Angle (Degree)
PG 58-28, 19 mm, 30% RAP PlantLab
100
1000
10000
100000
10 15 20 25 30 35 40
Dyn
amic
Mod
ulus
(MPa
)
Phase Angle (Degree)
PG 52-34, 19 mm, 20% RAP/RAS PlantLab
100
1000
10000
100000
10 20 30 40 50
Dyn
amic
Mod
ulus
(MPa
)
Phase Angle (Degree)
PG 58-28, 19 mm, 20% RAPRAS Plant
Lab

Fatigue Failure Criterion
10/22/15 19
1
10
100
1000
1000 10000 100000 1000000
GR
Number of cycles (Nf)
Better Performance

Fatigue Failure (12.5 mm mixtures)
20
1
10
100
1000
1000 10000 100000 1000000
GR
Number of Cycles (Nf)
12.5 mm, PMPC
52-34, 30% RAP 52-34, 20% RAP
52-34, 20% RAP/RAS 58-28, 30% RAP
58-28, 20% RAP 58-28, 20% RAP/RAS
0.1
1
10
100
1000
10000
100 1000 10000 100000 1000000
GR
Number of Cycles (Nf)
12.5 mm, LMLC
52-34, 30% RAP
52-34, 20% RAP
58-28, 30% RAP
58-28, 20% RAP
10/22/15

Fatigue Failure (19 mm mixtures)
21
1
10
100
1000
1000 10000 100000 1000000
GR
Number of Cycles (Nf)
19 mm, PMPC
52-34, 30% RAP
52-34, 20% RAP/RAS
58-28, 30% RAP
58-28, 20% RAP
58-28, 20% RAP/RAS
1
10
100
1000
1000 10000 100000 1000000
GR
Number of Cycles (Nf)
19 mm, LMLC
52-34, 30% RAP
52-34, 20% RAP/RAS
58-28, 30% RAP
58-28, 20% RAP/RAS
10/22/15

Fatigue Failure (Plant vs. Lab), 12.5 mm
22
R² = 0.80094
R² = 0.77578
0.1
1
10
100
1000
1000 10000 100000 1000000
GR
Number of cycles (Nf)
PG 52-34, 12.5 mm, 30% RAP
Plant
Lab
R² = 0.94799
R² = 0.99143
1
10
100
1000
10000
100 1000 10000 100000
GR
Number of cycles (Nf)
PG 58-28, 12.5 mm, 30% RAP
PlantLab
R² = 0.96596
R² = 0.98816
0.1
1
10
100
1000
1000 10000 100000 1000000
GR
Number of cycles (Nf)
PG 52-34, 12.5 mm, 20% RAP
Plant
LabR² = 0.87692
R² = 0.99745
0.1
1
10
100
1000
1000 10000 100000 1000000
GR
Number of cycles (Nf)
PG 58-28, 12.5 mm, 20% RAP
PlantLab
10/22/15

Fatigue Failure (Plant vs. Lab), 19 mm
23
R² = 0.98874
R² = 0.86312
1
10
100
1000
1000 10000 100000 1000000
GR
Number of cycles (Nf)
PG 52-34, 19 mm, 30% RAP
PlantLab
R² = 0.99879
R² = 0.99798
1
10
100
1000
1000 10000 100000 1000000
GR
Number of cycles (Nf)
PG 58-28, 19 mm, 30% RAP
PlantLab
R² = 0.41902
R² = 0.96996
1
10
100
1000
1000 10000 100000
GR
Number of cycles (Nf)
PG 52-34, 19 mm, 20% RAP/RAS
PlantLab
R² = 0.97716
R² = 0.70869
1
10
100
1000
1000 10000 100000 1000000
GR
Number of cycles (Nf)
PG 58-28, 19 mm, 20% RAP/RAS
Plant
Lab
10/22/15

Conclusion
• Binder resultso LMLC have warmer high and low PG temperature.
o The binders extracted from the 19 mm mixtures have warmer temperatures than those extracted from 12.5 mm mixtures.
o ΔTcr of 19 mm and PG 52-34 mixtures are generally higher than 12.5 mm and PG 58-28, respectively.
o Generally, ΔTcr of the mixtures containing RAS are larger than those for the mixtures with RAP only.
2410/22/15

Conclusion
• Complex Moduluso Dynamic Modulus of lab produced mixtures are higher than
plant produced mixtures.o In most cases, lab produced mixtures show slightly more
elastic behavior, less relaxation capability.o The variation of mixtures stiffness are as expected in terms of
stiffer binder, higher recycled materials and coarser aggregate.
o Inclusion of higher RAP increases dynamic modulus, while incorporating RAS does not follow a consistent trend.
2510/22/15

Conclusion
• Fatigue Crackingo There is no consistent trend between Lab and plant produced
mixtures, but:• There is larger difference between PG 58-28 plant and lab
mixes than PG 52-34 mixes.o The fatigue performance (fatigue life) of 20% RAP and 30%
RAP mixtures are similar.o Most 20% RAP/RAS mixes show higher GR, but lower Nf.
2610/22/15

Future Work
• Additional Testing and MixturesüDCT testingüBinder test resultsüHooksett mixtures
• Evaluate impact of long term aging
2710/22/15

Acknowledgement
§ Dr. J. Daniel, Professor, University of New Hampshire
§ Dr. E. Dave, Assistant Professor, University of New Hampshire
§ New Hampshire Department of Transportation§ Pike Industries, Inc.§ Asphalt Research Group, University of New
Hampshire
2810/22/15

29
Thank You!Questions?
10/22/15

Mixtures
Binder PG Grade Binder Source (mm) NMSA%Total Binder Replacement
% RAP Binder
% RAS Binder
PMPC (Pike)LMLC
(NHDOT)
58-28(2013)
McAsphalt 12.5 18.9 18.9 0McAsphalt 12.5 18.5 7.4 11.1 -
McAsphalt 12.5 28.3 28.3 0McAsphalt 19 20.8 20.8 0 -
Avery Lane 19 20.4 8.2 12.2Avery Lane 19 31.3 31.3 0
52-34(2013)
McAsphalt 12.5 18.9 18.9 0McAsphalt 12.5 18.5 7.4 11.1 -
McAsphalt 12.5 28.3 28.3 0Suncor 19 20.4 8.2 12.2Suncor 19 31.3 31.3 0
58-28(2014)
9.5 21.3 21.3 012.5 21.3 21.3 0
64-28(2014)
9.5 16.4 16.4 012.5 - - 0
3010/22/15

Damage Characteristic Curve (12.5 mm)
3110/22/15
0
0.2
0.4
0.6
0.8
1
0 50000 100000 150000 200000 250000
C (P
seud
o St
iffne
ss)
S (Damage)
12.5 mm, PG 52-34
Plant, 30% RAP
Plant, 20% RAP
Plant, 20% RAP/RAS
Lab, 30% RAP
Lab, 20% RAP
0
0.2
0.4
0.6
0.8
1
0 50000 100000 150000 200000 250000C
(Pse
udo
Stiff
ness
)
S (Damage)
12,5 mm, PG 58-28
Plant, 30% RAP
Plant, 20% RAP
Plant, 20% RAP/RAS
Lab, 30% RAP
Lab, 20% RAP

Damage Characteristic Curve (19 mm)
3210/22/15
0
0.2
0.4
0.6
0.8
1
0 50000 100000 150000 200000 250000
C (P
seud
o St
iffne
ss)
S (Damage)
19 mm, PG 52-34
Plant, 30% RAP
Plant, 20% RAP/RAS
Lab, 30% RAP
Lab, 20% RAP/RAS
0
0.2
0.4
0.6
0.8
1
0 50000 100000 150000 200000 250000C
(Pse
udo
Stiff
ness
)
S (Damage)
19 mm, PG 58-28
Plant, 30% RAP
Plant, 20% RAP
Plant, 20% RAP/RAS
Lab, 30% RAP
Lab, 20% RAP/RAS