Embed Size (px)
Citation preview

Proceedings of the World Congress on Civil, Structural, and Environmental Engineering (CSEE’16)
Prague, Czech Republic – March 30 – 31, 2016
Paper No. ICGRE 105
DOI: 10.11159/icgre16.105
ICGRE 105-1
Correction of Mechanical CPT Data for Liquefaction Resistance Evaluation
Johann Facciorusso, Claudia Madiai, Giovanni Vannucchi University of Florence
Via di S.Marta, 3, Florence, Italy
[email protected]; [email protected]; [email protected]
Abstract - For more than 30 years, there has been considerable interest in using CPT also to evaluate the liquefaction resistance of
soils. Unfortunately, most of the simplified methods used for liquefaction resistance evaluation only require in situ measurements from
electrical cone penetrometers even if they are frequently applied using measurements from mechanical CPTs that are still preferred by
current engineering practice in many countries. Erroneous estimates of liquefaction resistance and relevant non-conservative results are
obtained by applying electrical CPT-based methods to mechanical CPT data without any form of correction. This study focuses on the
developing of an appropriate procedure for correcting mechanical CPT data and provides modified equations for liquefaction resistance
estimation by means of electrical CPT-based simplified methods. A dataset of more than 3900 pairs of measurements of cone tip
resistance and sleeve friction were obtained from 44 sites selected in Northern and Central Italy and processed by means of statistical
analyses. Suitable adjustments to CPT mechanical data were proposed for determining corrected liquefaction potential.
Keywords: Liquefaction; penetrometers; in situ testing, CPT, liquefaction potential
1. Introduction Since 1932, cone penetration testing systems have developed into different equipment and interpretation criteria.
Two major types of cone penetrometers may be identified: mechanical and electrical cone penetrometers. More advanced
apparatus has been developed over time within this latter group for specific applications (piezocone, seismic cone and
environmental penetrometers).
The electric cone penetrometer represented a significant improvement over the mechanical system with greater
accuracy, repeatability and reliability of local measurements and, therefore, its use is rapidly growing and spreading.
Nevertheless, in several countries, including Italy, the mechanical cone penetrometer is still used in engineering practice
and the geotechnical databases provided by regional and national public institutions still mainly contain results from
mechanical CPT tests.
For more than 30 years, there has been considerable interest in using CPT to evaluate the liquefaction resistance of
soils and several simplified methods have been based on CPT results following both deterministic and probabilistic
approaches (e.g., among the most recent, [1], [2], [3] and [4]). It cannot be excluded that some early work on liquefaction
is based on data collected using a mechanical cone ([5]). However, the most recently compiled and widely used CPT-based
methods mainly refer to data obtained from electrical cone penetrometers or piezocones following the International
Reference Test and ASTM procedure ([6]).
Electrical CPT-based methods applied to mechanical CPT data without any form of correction lead to erroneous
estimates of liquefaction resistance and relevant non-conservative results ([5]). In fact, the sleeve friction, fs, is affected by
the greatest error when the mechanical penetrometer is used ([7], [8]). At the same time, it has the greatest influence on the
fine content and plasticity index assessment and, consequently, on soil classification and liquefaction susceptibility
estimation.
This study aims at developing an appropriate procedure for correcting mechanical CPT data and providing modified
equations for liquefaction resistance estimation by means of electrical CPT-based simplified methods. For this purpose,
forty-four pairs of neighbouring electrical (CPTe) and mechanical (CPTm) tests were financed by the Regional
Governments of Emilia-Romagna and Tuscany and performed in Northern and Central Italy and a dataset of more than
ICGRE 105-2
3900 pairs of measurements of cone tip resistance and sleeve friction pertaining to the same soil layers was appropriately
selected.
2. Mechanical and Electrical CPT Data Comparisons The two CPT tests of each pair were generally located within a distance ranging between 1 and 3 m. The minimum
distance was chosen to avoid the natural soil disturbance induced by the tests; the maximum distance was selected to
minimize as far as possible the influence of the horizontal inherent soil variability.
The first step in processing CPT measurements for implementing the dataset for statistical analyses consisted of
correctly coupling cone tip resistance, qc, and sleeve friction, fs, from both mechanical and electrical tests for each explored
soil layer. A depth correction of CPTm measurements was needed since mechanical cone penetrometers are not equipped
with an inclinometer, and measurements may not correspond to the actual depth. Moreover, a moving average filter, with a
span of 20 cm, was applied to CPTe readings that were later resampled at the same corrected depth of CPTm
measurements, since CPTm and CPTe measurements generally refer to a volume of soil with different thickness (20 cm in
CPTm; 1 or 2 cm in CPTe). When significant differences between the coupled mechanical and electrical qc values were
encountered, they were excluded by regressing raw data and diagnosing residuals to find the outliers that may be due to the
inherent horizontal soil variability.
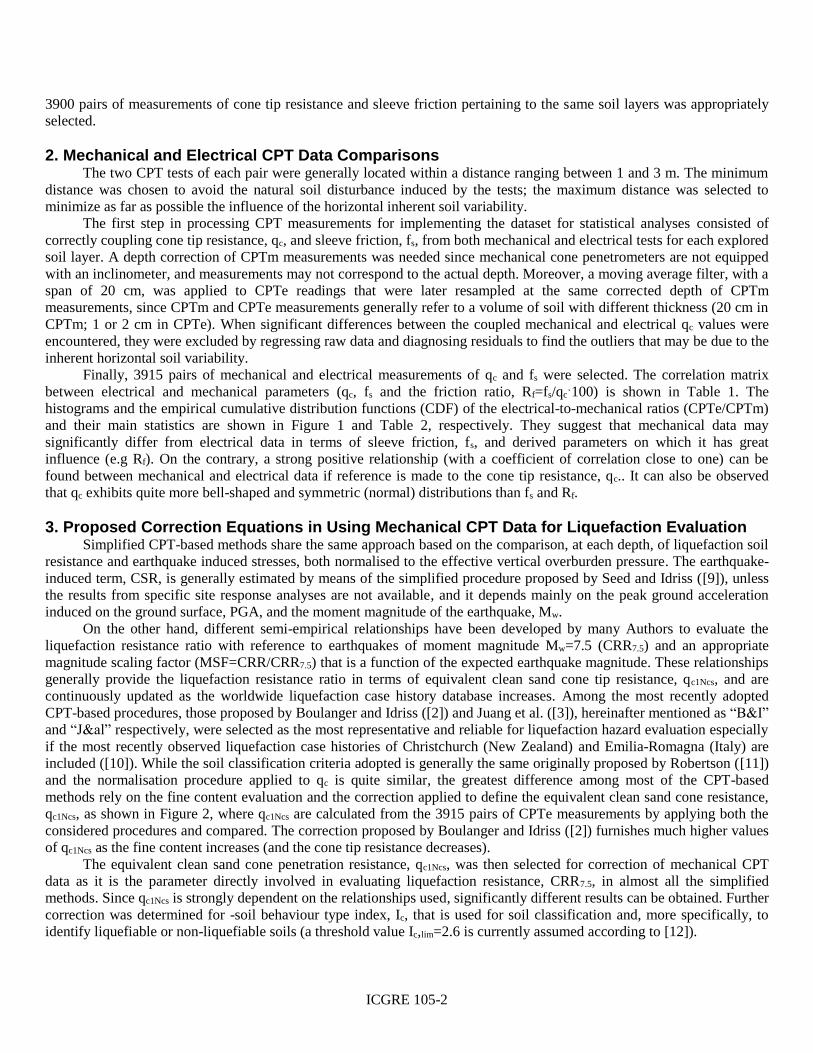
Finally, 3915 pairs of mechanical and electrical measurements of qc and fs were selected. The correlation matrix
between electrical and mechanical parameters (qc, fs and the friction ratio, Rf=fs/qcˑ100) is shown in Table 1. The
histograms and the empirical cumulative distribution functions (CDF) of the electrical-to-mechanical ratios (CPTe/CPTm)
and their main statistics are shown in Figure 1 and Table 2, respectively. They suggest that mechanical data may
significantly differ from electrical data in terms of sleeve friction, fs, and derived parameters on which it has great
influence (e.g Rf). On the contrary, a strong positive relationship (with a coefficient of correlation close to one) can be
found between mechanical and electrical data if reference is made to the cone tip resistance, qc.. It can also be observed
that qc exhibits quite more bell-shaped and symmetric (normal) distributions than fs and Rf.
3. Proposed Correction Equations in Using Mechanical CPT Data for Liquefaction Evaluation Simplified CPT-based methods share the same approach based on the comparison, at each depth, of liquefaction soil
resistance and earthquake induced stresses, both normalised to the effective vertical overburden pressure. The earthquake-
induced term, CSR, is generally estimated by means of the simplified procedure proposed by Seed and Idriss ([9]), unless
the results from specific site response analyses are not available, and it depends mainly on the peak ground acceleration
induced on the ground surface, PGA, and the moment magnitude of the earthquake, Mw.
On the other hand, different semi-empirical relationships have been developed by many Authors to evaluate the
liquefaction resistance ratio with reference to earthquakes of moment magnitude Mw=7.5 (CRR7.5) and an appropriate
magnitude scaling factor (MSF=CRR/CRR7.5) that is a function of the expected earthquake magnitude. These relationships
generally provide the liquefaction resistance ratio in terms of equivalent clean sand cone tip resistance, qc1Ncs, and are
continuously updated as the worldwide liquefaction case history database increases. Among the most recently adopted
CPT-based procedures, those proposed by Boulanger and Idriss ([2]) and Juang et al. ([3]), hereinafter mentioned as “B&I” and “J&al” respectively, were selected as the most representative and reliable for liquefaction hazard evaluation especially
if the most recently observed liquefaction case histories of Christchurch (New Zealand) and Emilia-Romagna (Italy) are
included ([10]). While the soil classification criteria adopted is generally the same originally proposed by Robertson ([11])
and the normalisation procedure applied to qc is quite similar, the greatest difference among most of the CPT-based
methods rely on the fine content evaluation and the correction applied to define the equivalent clean sand cone resistance,
qc1Ncs, as shown in Figure 2, where qc1Ncs are calculated from the 3915 pairs of CPTe measurements by applying both the
considered procedures and compared. The correction proposed by Boulanger and Idriss ([2]) furnishes much higher values
of qc1Ncs as the fine content increases (and the cone tip resistance decreases).
The equivalent clean sand cone penetration resistance, qc1Ncs, was then selected for correction of mechanical CPT
data as it is the parameter directly involved in evaluating liquefaction resistance, CRR7.5, in almost all the simplified
methods. Since qc1Ncs is strongly dependent on the relationships used, significantly different results can be obtained. Further
correction was determined for -soil behaviour type index, Ic, that is used for soil classification and, more specifically, to
identify liquefiable or non-liquefiable soils (a threshold value Ic,lim=2.6 is currently assumed according to [12]).
ICGRE 105-3
1st and 2nd grade polynomial and power laws were tested to fit mechanical to electrical data. Results of regression
analyses are shown in Figures 3a and 4a with reference to the equivalent clean sand cone resistance, qc1Ncs, following the
procedure proposed by [2] (B&I) and [3] (J&al), respectively. Further comparisons between corrected mechanical
(estimated) values and electrical (target) values are shown in Figures 3b and 4b, for “B&I” and “J&al” approach
respectively, where it is evident how the estimate errors are independent from the regressed variable, qc1Ncs.
Fig. 1: Histograms and empirical cumulative distribution functions (CDF) of CPTe/CPTm ratios.
Table 1: Correlation matrix between mechanical (CPTm) and electrical (CPTe) data.
Mechanical CPT data
(CPTm)
Electrical CPT data
(CPTe)
qc,m fs,m Rf,m qc,e fs,e Rf,e
CPTm qc,m 1
fs,m 0.53 1
Rf,m 0.52 0.06 1
CPTe qc,e 0.96 0.49 -0.52 1
fs,e 0.49 0.58 -0.08 0.43 1
Rf,e 0.44 0.01 0.50 0.53 0.32 1

ICGRE 105-4
Table 2: Main statistics of ratios between electrical and mechanical data (CPTe/CPTm).
qc,e/qc,m fs,e/fs,m Rf,e/Rf,m
Mean 1.01 0.62 0.69
Standard deviation 0.45 0.72 0.89
Median 0.93 0.51 0.56
10th percentile 0.59 0.22 0.20
90th percentile 1.50 1.03 1.21
Skewness 2.75 22.46 25.98
Fig. 2: qc1Ncs values calculated from CPTe measurements by following the procedure proposed by [2] (B&I) and [3] (J&al).
Fig. 3: Mechanical, uncorrected (a) and corrected (b), versus electrical qc1ncs values following “B&I” procedure.
Results of regression analyses and comparisons between mechanical (corrected) and electrical values with reference
to the soil behaviour type index, Ic, are shown in Figure 5.

ICGRE 105-5
Fig. 4: Mechanical, uncorrected (a) and corrected (b), versus electrical qc1ncs values following “J&al” procedure.
Fig. 5: Mechanical, uncorrected (a) and corrected (b), versus electrical Ic values.
The equations proposed for correcting mechanical qc1Ncs and Ic values in adopting electrical CPT-based approaches
are as follows:
qc1Ncs,m(c)= qc1Ncs] ± qc1Ncs] = 0.0260 qc1Ncs,m1.5611 + 49.6590 ± 10.00 ; R2 = 0.8651 (1)
qc1Ncs,m(c) = qc1Ncs] ± qc1Ncs] = 0.8714 qc1Ncs,m + 4.3138 ± 10.80; R2 = 0.8964 (2)
Ic,m(c)= c] ± c] = 0.9464 Ic,m ± 0.28; R2 = 0.7829 (3)
Where R2 is the coefficient of determination. Equations 1 and 2 refer to the approach proposed by Boulanger and
Idriss ([2]) and by Juang et al. ([3]), respectively.
Histograms of residual errors of qc1Ncs and Ic estimate are also reported in Figures 6 and 7, respectively, with their
main statistics listed in Table 3. The residual distributions of qc1Ncs are symmetric and bell-shaped and they can be
approximately represented by normal distributions with mean, qc1Ncs] 0 and standard deviation, qc1Ncs] 10.

ICGRE 105-6
Fig. 6: Histogram of residual errors, , from qc1ncs estimate by means of Eq. 1 (B&I) and 2 (J&al).
Fig. 7: Histogram of residual errors, , from Ic estimate by means of Eq. 3.
Table 3: Main statistics of residual errors, , from qc1Ncs and Ic estimate (Eqs. (1)-(3)).
qc1Ncs Ic
B&I J&al.
Mean 1.36 -0.0025 0.0008
Standard deviation 10.03 10.80 0.31
Median -0.53 -0.75 0.025
10th percentile -8.12 -13.29 -0.39
90th percentile 15.59 14.34 0.36
Skewness 0.64 0.28 -0.48
4. Effects of Corrections on Liquefaction Potential Index (LPI) Evaluation The liquefaction potential index (LPI) proposed by Iwasaki ([13]) was adopted both to quantify the effects of using
mechanical CPT results instead of electrical CPTs when liquefaction simplified methods are applied and to test the
reliability of the proposed correction procedure.

ICGRE 105-7
LPI is a cumulative index, ranging from 0 to 100, which is obtained by summing the appropriately weighted
liquefaction potential of each layer of a vertical soil profile within a critical depth, zcr (15 ÷ 20 m):
critz
dzzWzF0
)()(LPI (4)
Where W(z)=200ˑ(1-z/zcr)/zcr is a weighting function that gives increasing influence to layers at decreasing depths
and F(z) is the liquefaction potential function (ranging from 0 to 1). F(z) is proportional to the safety factor against
liquefaction, FSL=CRR/CSR. F(z) calculation is limited to layers susceptible to liquefaction, that is layers lying under the
water table depth (z > zw), with a certain lithological composition (Ic < Ic,lim) and mechanical resistance (qc1Ncs < 160).
Firstly, LPI was determined on both the mechanical (LPIm) and the electrical (LPIe) CPT profiles collected from all
the selected sites using both the procedures suggested by Boulanger and Idriss ([2]) and Juang et al. ([3]). Three reference
earthquakes of different severity (named SS1, SS2 and SS3) characterised by different moment magnitude, Mw, and peak
ground acceleration on the ground surface, PGA (SS1: Mw=6; PGA=0.15g; SS2: Mw=6.5; PGA=0.30g; SS3: Mw=7;
PGA=0.45g) were considered. The same water level depth (zw=1m) was assumed for all forty-four pair of CPTs and a cut-
off value Iclim=2.6 was used to detect soils susceptible to liquefaction according to [12].
Secondly, corrected LPI values (LPIm(c)) were evaluated by applying to mechanical qc1Ncs values the corrections
proposed by means of Eq. (1) and (2) (if the “B&I” or the “J&al“ method is considered, respectively) and by adopting a
corrected cut-off value of Ic, as obtained from Eq. 3.
LPIe values are plotted against LPIm (empty symbols) or LPIm(c) (solid symbols) values on Figure 8 for all the
considered reference earthquakes (SS1, SS2 and SS3) and following the procedures suggested by Boulanger and Idriss
([2]) and Juang et al. ([3]). Some considerations must be made: (1) empty symbols fall mainly below the line Y=X with
increasing distances as the earthquake severity increases, it follows that electrical LPI values are almost always greater
than mechanical values, so the use of mechanical CPT data to evaluate the liquefaction potential can lead to very non-
conservative results especially if the “B&I” method is applied and high severity earthquakes occur (e.g. SS3) ; (2) solid
symbols lie across the Y=X line with an increasing dispersion as the earthquake severity decreases (e.g. SS1) for both
methods. It follows that suggested corrections for mechanical CPT data provide better estimates of LPI especially for the
largest values.
Fig. 8: LPI values from CPTe (LPIe) and CPTm data assessed by means of “B&I” and “J&al” procedures for different seismic
scenarios (SS1, SS2, SS3). Solid symbols refer to CPTm corrected data (LPIm(c)), empty symbols refer to CPTm uncorrected data
(LPIm).
ICGRE 105-8
5. Conclusions This study aims to develop an appropriate procedure for correcting mechanical CPT parameters and for providing
modified equations for liquefaction resistance estimation by means of electrical CPT-based simplified methods. For this
purpose, forty-four pairs of neighbouring electrical (CPTe) and mechanical (CPTm) tests were performed in Northern and
Central Italy and a set of more than 3900 pairs of measurements of cone tip resistance and sleeve friction pertaining to the
same soil layers was appropriately prepared. The results of the statistical analyses carried out suggest that mechanical data
may significantly differ from electrical data in terms of sleeve friction, fs, and derived parameters on which it has great
influence (e.g Rf). On the contrary, a strong positive relationship can be found between mechanical and electrical data if
reference is made to the cone tip resistance, qc. The equivalent clean sand cone penetration resistance, qc1Ncs and the soil
behaviour type index, Ic were selected for correction of mechanical CPT data. Polynomial and power laws were tested to fit
mechanical to electrical data with good correlation (R2 ≥ 0.8). The residual distributions of qc1Ncs resulted symmetric and
bell-shaped and they can be approximately represented by normal distributions with mean, qc1Ncs]0 and standard
deviation, qc1Ncs]10. The effects of the correction proposed were tested on the liquefaction potential evaluation, LPI
calculated by applying to each pair of CPTm and CPTe profile the simplified procedures proposed by Boulanger and Idriss
([2]) and Juang et al. ([3]) and by considering three different seismic scenarios. It resulted that the electrical LPI values are
systematically greater than mechanical values, so the use of mechanical CPT data to evaluate the liquefaction potential can
lead to very non-conservative results especially if the Boulanger and Idriss method is applied and high severity earthquakes
occur, and the suggested corrections for mechanical CPT data provide better estimates of LPI especially for the largest
values.
Acknowledgements This study was supported by Emilia-Romagna and Tuscany Regional Governments, DPC-ReLUIS Research Project
2015, Ente Cassa di Risparmio di Firenze. CPT data used were provided by the Emilia-Romagna and Tuscany Regional
Governments.
References [1] P. K. Robertson and K. L. Cabal, “Guide to Cone Penetration Testing,” 6th Ed. Signal Hill, California: Gregg Drilling
& Testing Inc., 2015.
[2] R. W. Boulanger and I. M. Idriss, “CPT and SPT based liquefaction triggering procedures,” Report No. UCD/CGM-
14/01, Department of Civil and Environmental Engineering, University of California Davis, California. 2014.
[3] C. H. Juang, S. Y. Fang., and E. H. Khor, “First-order reliability method for probabilistic liquefaction triggering
analysis using CPT,” J. Geotech. Geoenviron. Eng., vol. 132, no. 73, pp. 337-350, 2006.
[4] R. E. S. Moss, R. B. Seed, R. E. Kayen, J. P. Stewart, D. Kiureghian, and K. O. Cetin, “CPT-based probabilistic and
deterministic assessment of in situ seismic soil liquefaction potential,” J. Geotech. Geoenviron. Eng., vol. 132, no. 8,
pp. 1032‐1051, 2006.
[5] J. A. Farrar, “Study of in situ testing for evaluation of liquefaction resistance,” Report N. R-90-06, Denver, CO: U.S.
Bureau of Reclamation, geotechnical service branch, Denver office. 1990.
[6] ASTM D5778-12. (2012). Standard Test Method for Electronic Friction Cone and Piezocone Penetration Testing of
Soils. [Online]. ASTM International, West Conshohocken, PA. Available: www.astm.org.
[7] J. De Ruiter, “Current Penetrometer Practice,” in Proceedings of Cone Penetration testing and Experience, Ed. G. M.
Norris and R.D. Holtz, American Society of Civil Engineers, New York, NY, 1981, pp. 1-48.
[8] F. P. Smits, “Cone penetration tests in dry sand,” in Proceedings of the 2nd European Symposium on Penetration
testing, Amsterdam, 1982, pp. 877-881.
[9] H. B. Seed and I. M. Idriss, “Ground motions and soil liquefaction during earthquakes,” Oakland, Calif.: Earthquake
Engineering Research Institute Monograph, 1982.
[10] J. Facciorusso, C. Madiai, and G. Vannucchi, “CPT-Based Liquefaction Case History from the 2012 Emilia
Earthquake in Italy,” J. Geotech. Geoenviron. Eng., vol. 141, no. 12, 2015.
[11] P. K. Robertson, “Soil classification using CPT,” Can. Geot. J., vol. 27, no. 1, pp. 151-158, 1990
[12] T. L. Youd, I. M. Idriss, R. D. Andrus, I. Arango, G. Castro, J. T. Christian, R. Dobry, W. D. Liam Finn, L. F. Harder
Jr., M. E. Hynes, K. Ishihara, J. P. Koester, S. S. C. Laio, W. F. Marcuson III, G. R. Martin, J. K. Mitchell, Y.

ICGRE 105-9
Moriwaki, M. S. Power, P. K. Robertson, R. B. Seed, and K. H. Stokoe II, “Liquefaction resistance of soils: Summary
report from the 1996 NCEER and 1998 NCEER/NSF workshops on evaluation of liquefaction resistance of soils,”
2001.
[13] T. Iwasaki, K, Tokida, F. Tatsuoka, S, Watanabe, S. Yasuda, and H. Sato, “Microzonation for soil liquefaction potential using simplified methods,” in Proceedings of the 3rd Int. Conf. on Microzonation, Seattle, WA., USA, 1982,
vol. 3, pp. 1319.