Embed Size (px)
Citation preview

Corporate UpdateFEBRUARY 2019

Corporate Update
Forward Looking Statements
The information in this presentation has been prepared as at February 15, 2019. Certain statements contained in this presentation constitute "forward-looking statements" within the
meaning of the United States Private Securities Litigation Reform Act of 1995 and "forward-looking information" under the provisions of Canadian provincial securities laws and are referred
to herein as "forward-looking statements". When used in this presentation, the words "anticipate", "could", "estimate", "expect", "forecast", "future", "plan", "potential", "will" and similar
expressions are intended to identify forward-looking statements. Such statements include, without limitation: the Company's forward-looking production guidance, including estimated ore
grades, recovery rates, project timelines, drilling results, metal production, life of mine estimates, total cash costs per ounce, all-in sustaining costs per ounce, minesite costs per tonne,
other expenses, cash flows and free cash flow; the estimated timing and conclusions of technical studies and evaluations; the methods by which ore will be extracted or processed;
statements concerning the Company's plans to build operations at Meliadine, Amaruq and Akasaba West and the Company's expansion plans at Kittila, including the timing, funding,
completion and commissioning thereof; statements concerning other expansion projects, recovery rates, mill throughput, optimization and projected exploration, including costs and other
estimates upon which such projections are based; statements regarding timing and amounts of capital expenditures and other expenditures; estimates of future mineral reserves, mineral
resources, mineral production, optimization efforts and sales; estimates of future capital expenditures and other cash needs, and expectations as to the funding thereof; future dividend
amounts and payment dates; the projected development of certain ore deposits, including estimates of exploration, development and production and other capital costs and estimates of
the timing of such exploration, development and production or decisions with respect to such exploration, development and production; estimates of mineral reserves and mineral
resources and the effect of drill results on future mineral reserves and mineral resources; statements regarding the Company's ability to obtain the necessary permits and authorizations in
connection with its proposed or current exploration, development and mining operations and the anticipated timing thereof; statements regarding anticipated future exploration; the
anticipated timing of events with respect to the Company's mine sites; statements regarding the sufficiency of the Company's cash resources and other statements regarding anticipated
trends with respect to the Company's operations, exploration and the funding thereof; and statements regarding the outcome of discussions with First Nations groups. Such statements
reflect the Company's views as at the date of this presentation and are subject to certain risks, uncertainties and assumptions, and undue reliance should not be placed on such
statements. Forward-looking statements are necessarily based upon a number of factors and assumptions that, while considered reasonable by Agnico Eagle as of the date of such
statements, are inherently subject to significant business, economic and competitive uncertainties and contingencies. The material factors and assumptions used in the preparation of the
forward looking statements contained herein, which may prove to be incorrect, include, but are not limited to, the assumptions set forth herein and in management's discussion and
analysis ("MD&A") and the Company's Annual Information Form ("AIF") for the year ended December 31, 2017 filed with Canadian securities regulators and that are included in its Annual
Report on Form 40-F for the year ended December 31, 2017 ("Form 40-F") filed with the U.S. Securities and Exchange Commission (the "SEC") as well as: that there are no significant
disruptions affecting operations; that production, permitting, development and expansion at each of Agnico Eagle's properties proceeds on a basis consistent with current expectations and
plans; that the relevant metal prices, foreign exchange rates and prices for key mining and construction supplies will be consistent with Agnico Eagle's expectations; that Agnico Eagle's
current estimates of mineral reserves, mineral resources, mineral grades and metal recovery are accurate; that there are no material delays in the timing for completion of ongoing growth
projects; seismic activity at the Company's operations at LaRonde, which reach more than three kilometres below the surface where there are few resources available to model the
geomechanical conditions, is as expected by the Company; that the Company's current plans to optimize production are successful; and that there are no material variations in the current
tax and regulatory environment. Many factors, known and unknown, could cause the actual results to be materially different from those expressed or implied by such forward looking
statements. Such risks include, but are not limited to: the volatility of prices of gold and other metals; uncertainty of mineral reserves, mineral resources, mineral grades and mineral
recovery estimates; uncertainty of future production, project development, capital expenditures and other costs; foreign exchange rate fluctuations; financing of additional capital
requirements; cost of exploration and development programs; seismic activity at the Company's operations, including the LaRonde mine; mining risks; community protests, including by
First Nations groups; risks associated with foreign operations; the unfavorable outcome of litigation involving the Canadian Malartic General Partnership; governmental and environmental
regulation; the volatility of the Company's stock price; and risks associated with the Company's currency, fuel and by-product metal derivative strategies. For a more detailed discussion of
such risks and other factors that may affect the Company's ability to achieve the expectations set forth in the forward-looking statements contained in this presentation, see the AIF and
MD&A filed on SEDAR at www.sedar.com and included in the Form 40-F filed on EDGAR at www.sec.gov, as well as the Company's other filings with the Canadian securities regulators
and the SEC. Other than as required by law, the Company does not intend, and does not assume any obligation, to update these forward-looking statements.
Currency
All amounts in this presentation are expressed in U.S. dollars except as otherwise noted.
Further Information
For further details on Agnico Eagle’s fourth quarter 2018 results, please see the Company's news release dated February 14, 2019.
2

Corporate Update
Notes to Investors
Note Regarding the Use of Non-GAAP Financial Measures
This presentation discloses certain measures, including "total cash costs per ounce“ and "all-in sustaining costs per ounce" that are not standardized measures under IFRS. These
data may not be comparable to data reported by other issuers. For a reconciliation of these measures to the most directly comparable financial information reported in the
consolidated financial statements prepared in accordance with IFRS and for an explanation of how management uses these measures, see "Non-GAAP Financial Performance
Measures" in the MD&A filed on SEDAR at www.sedar.com and included in the Form 6-K filed on EDGAR at www.sec.gov, as well as the Company's other filings with the Canadian
securities regulators and the SEC.
The total cash costs per ounce of gold produced is reported on both a by-product basis (deducting by-product metal revenues from production costs) and co-product basis (without
deducting by-product metal revenues). Unless otherwise specified total cash costs per ounce of gold produced is reported on a by-product basis in this presentation. The total cash
costs per ounce of gold produced on a by-product basis is calculated by adjusting production costs as recorded in the consolidated statements of income for by-product revenues,
unsold concentrate inventory production costs, smelting, refining and marketing charges and other adjustments, and then dividing by the number of ounces of gold produced. The
total cash costs per ounce of gold produced on a co-product basis is calculated in the same manner as the total cash costs per ounce of gold produced on a by-product basis except
that no adjustment is made for by-product metal revenues. Accordingly, the calculation of total cash costs per ounce of gold produced on a co-product basis does not reflect a
reduction in production costs or smelting, refining and marketing charges associated with the production and sale of by-product metals. The total cash costs per ounce of gold
produced is intended to provide information about the cash-generating capabilities of the Company's mining operations. Management also uses these measures to monitor the
performance of the Company's mining operations. As market prices for gold are quoted on a per ounce basis, using the total cash costs per ounce of gold produced on a by-product
basis measure allows management to assess a mine's cash-generating capabilities at various gold prices.
All-in sustaining costs per ounce ("AISC") is used to show the full cost of gold production from current operations. The Company calculates all-in sustaining costs per ounce of gold
produced on a by-product basis as the aggregate of total cash costs per ounce on a by-product basis, sustaining capital expenditures (including capitalized exploration), general and
administrative expenses (including stock options) and reclamation expenses. The all-in sustaining costs per ounce of gold produced on a co-product basis is calculated in the same
manner as the all-in sustaining costs per ounce of gold produced on a by-product basis, except that the total cash costs per ounce on a co-product basis are used, meaning no
adjustment is made for by-product metal revenues. Management is aware that these per ounce measures of performance can be affected by fluctuations in foreign exchange rates
and, in the case of total cash costs per ounce of gold produced on a by-product basis, by-product metal prices. Management compensates for these inherent limitations by using
these measures in conjunction with other data prepared in accordance with IFRS.
The Company calculates mine operating profit for a given period by taking the amount equal to the Company’s gold production from its mines multiplied by the differential in the price
of gold over the total cash costs per ounce. Management uses mine operating profit as a means of assessing the cash flow generation of the business. Estimates of mine operating
profit in future periods are based on the Company's production guidance, total cash cost guidance and internal forecasts as of the date hereof.
Note Regarding Production Guidance
The gold production guidance is based on the Company's mineral reserves but includes contingencies and assumes metal prices and foreign exchange rates that are different from
those used in the mineral reserve estimates. These factors and others mean that the gold production guidance presented in this presentation does not reconcile exactly with the
production models used to support these mineral reserves.
The Company's production guidance at Meliadine is based, in part, on the results of preliminary economic assessments. These preliminary economic assessments include inferred
mineral resources that are considered too speculative geologically to have the economic considerations applied to them that would enable them to be categorized as mineral
reserves, and there is no certainty that the production guidance set out in this presentation will be realized. The preliminary economic assessment used in respect of the Meliadine
mine project included 3.6 million contained ounces of inferred mineral resource, 3.3 million contained ounces of measured and indicated mineral resource and 3.4 million contained
ounces of proven and probable mineral reserve. For further information on the Company's production guidance at Meliadine, including the qualifications and assumptions made in
connection with the preparation of the assessments, please see the Company's press release dated February 14, 2018 and the Company's AIF, as well as the Company's other
filings with the Canadian securities regulators and the SEC.
3

Corporate Update
Building A Long Term, Sustainable, Self Funding Business
➢ Record gold production expected in 2019 with 2.0Moz anticipated in 2020 and beyond
• Completing large expansion in Nunavut in 2019
• Capital spending expected to decline significantly as the Company moves to a cash
"harvest" mode
➢ Operating in low-political risk, pro-mining jurisdictions
➢ Longer term project pipeline provides additional opportunities to add value
➢ Deep "bench strength" – broad range of technical skills and experience
➢ Target is to be a self-funded business with steady growth in production per share and
cash flow per share
4

Corporate Update
AEM US Equity XAU Index Gold Spot
AEM US Equity
CAGR
12.02%
Gold Spot CAGR
7.79%
XAU Index CAGR
1.00%
Superior Share Performance Since 1998
Agnico Eagle has Consistently Outperformed Gold and Gold Equities
Source: Bloomberg – August 3, 1998 to February 15, 2019
5
10%
100%
1000%
10000%

Corporate Update
Agnico Eagle’s Long-Term Strategy
6
➢ Regional Focus
• Politically safe, long-term potential
• Leverage off of synergies
• Best in regions we operate
➢ Early-Stage Focus
• Buy early – value-add through the drill-bit
• Buy small, think big
➢ Technical Focus
• Broad range of technical skills and
experience
• Build own mines
➢ Per Share Focus
• Low share count at ~235M fully diluted
shares outstanding after 61 years
Consistent Disciplined Approach that
Delivers Value

Corporate Update
Strong Operating Platform Drives Outperformance
Guidance Exceeded for Seven Consecutive Years
7
1.031.06
1.40
1.65
1.60
1.68
1.53
1.04
1.10
1.43
1.67 1.66
1.71
1.63
2012 2013 2014 2015 2016 2017 2018
Production Guidance Versus Actual (in Millions)
Initial Production Guidance Production Actual
$500
$550
$600
$650
$700
$750
$800
2012 2013 2014 2015 2016 2017 2018
Total Cash Cost Per Ounce Guidance Versus Actual
Cost Guidance Cost Actual

Corporate Update
Focused on Growing Value on a per Share Basis
Consistent Strategy that Works
8
➢ 11% NAVPS CAGR* from 2005 to 2017
versus 2% NAVPS CAGR of peers
11%
3%3% 2%
2%
0%
-1%-2%
-5%
0%
5%
10%
15%
NAVPS Compound Annual Growth Rate (2005 – 2017)
-
1.0
2.0
3.0
4.0
5.0
6.0
7.0
8.0
9.0
10.0
Source: Scotiabank Global Banking and Markets, Bloomberg
➢ Production per 1000 Shares CAGR from
2005 to 2021E of 8%
* Compound Annual Growth Rate ("CAGR")
Production per 1000 shares
Source: Company reports

Corporate Update
➢ Mined below reserve grade in 2018
➢ 1.86 grams per tonne ("g/t") gold, compared to reserve grade of 2.49 g/t gold*
➢ Large percentage of current mineral reserves are mineable at total cash costs below $900/oz
➢ 2018 gold mineral reserves increased by 7.2% to 22.0Moz of gold (average reserve grade 2.70 g/t)
➢ Mineral reserve sensitivity to gold price:
➢ $100/oz increase/decrease in the gold price assumption results in +4%/-6% change
Focused on Maintaining Quality Gold Reserves
Successfully Replaced Gold Reserves in 2018 with Higher Grades
Detailed information on mineral reserves and mineral resources can be found in the February 14, 2019 news release
9* Reserve grade at December 31, 2017
As of December 31, 2017 As of December 31, 2018
CategoryTonnes
(000s)
Gold Grade
(g/t)
Contained Gold
(000 oz)
Tonnes
(000s)
Gold Grade
(g/t)
Contained Gold
(000 oz)
Mineral Reserves
Proven 42,232 1.86 2,523 38,987 1.81 2,268
Probable 214,464 2.62 18,031 214,833 2.86 19,771
Total Proven & Probable 256,696 2.49 20,554 253,820 2.70 22,039
Mineral Resources
Measured 115,429 0.81 3,014 193,615 0.79 4,916
Indicated 194,115 2.07 12,940 204,946 1.89 12,475
Total Measured & Indicated 309,544 1.60 15,954 398,562 1.36 17,390
Inferred 164,319 2.87 15,170 209,232 2.69 18,122

Corporate Update
Nunavut Strategy
Nunavut Assets Provide Production Growth in 2019 and Beyond
10
Detailed information on mineral reserves and mineral resources can be found in the February 14, 2019
press release
➢ 20% of Canada’s land mass (~2.0M km2) with a
population of ~35,000
➢ Agnico Eagle in Nunavut➢ Acquired Meadowbank in 2007, operating since
2010
➢ Upwards of ~700koz-800koz potential annual
production from Meliadine and Amaruq satellite
deposit to Meadowbank
➢ Competitive Advantage➢ Over 10 years experience in the region
➢ Logistics from Abitibi/Montreal
➢ Infrastructure
➢ Relationships with governments, permitting,
community and suppliers

Corporate Update
Transitioning to Higher Production and Lower Costs in 2020;
Pipeline Expected to Drive Future Production Growth
Expect to Produce Approximately 2.0 Million Ounces of Gold in 2020
2018
TCC*: $637
AISC**: $877 2020E
TCC*: $625
AISC**: $865
* TCC = total cash costs
** AISC = all-in sustaining costs
11
Near-Term Pipeline Projects
LaRonde
Complex
Evaluating phased development of LaRonde 3
(below a depth of 3.1 km) where recent drilling has
resulted in significant mineral resource conversion.
Also, other production opportunities such as
Bousquet Zone 11-3 are also being evaluated
LaRonde Zone 5
("LZ5")
Potential to mine additional ozs from LZ5 and other
nearby satellite zones
Goldex
Potential for increased throughput from Deep Zone
1 and potential for advanced development of Deep
Zone 2. Also potential for increased gold
production from the South Zone and Akasaba West
Canadian Malartic
(50%)
Potential production from Odyssey and East
Malartic underground zones
Meadowbank
Complex
Potential to develop the higher grade underground
deposits at Amaruq
MeliadineAdvancement of Phase 2 pit implementation and
testing the depth and lateral extensions of the
Wesmeg, Normeg and Tiriganiaq zones
KittilaExpansion to 2.0M tonnes per annum including
optimization of the Rimpi and Sisar zones via the
new shaft currently under construction
Pinos
Altos/Creston
Mascota
Potential development of the Cubiro, and Reyna de
Plata satellite zones
La IndiaPotential development of the El Realito and El
Cochi satellite zones
1.63
1.75
2.002.05
0.00
0.50
1.00
1.50
2.00
2.50
2018A 2019E 2020E 2021E 2022E - 2023E
Go
ld O
un
ces (
in M
illio
ns)
Pipeline
Projects

Corporate Update
Project Pipeline Expected to Provide Additional Production Growth Beyond 2023
Minesite/Region Opportunity
Goldex Evaluation of the Deep 3 Zone (below 1,500 metres)
Canadian Malartic (50%)Evaluation of the potential for production from deeper portions of the Odyssey and East Malartic
underground zones
Kittila Further optimization of underground mine and development of the lower mine with shaft access
Meadowbank Complex Continued evaluation of the regional potential at Amaruq
Meliadine Further drill testing of known zones and gold occurrences on the 80-kilometre-long greenstone belt
Barsele Testing additional mineralized zones and evaluation of production potential
Santa GertrudisEvaluation of known mineralized trends with a view to potentially restart operations at this past
producing heap leach mine
Kirkland LakePotential production scenario at Upper Beaver and potential synergies from development of other
properties such as Upper Canada
Hammond Reef Potential for production in a higher gold price environment
Agnico Eagle has a strong pipeline of development projects that could provide further production growth
beyond 2023. These opportunities are typically at an earlier stage than those outlined in the previous slide
12

Corporate Update
Growing Business Positioned to Generate
Net Free Cash Flow – Self-Funding Business Model
$-
$100,000
$200,000
$300,000
$400,000
$500,000
$600,000
$700,000
$800,000
$900,000
$1,000,000
$1,100,000
$1,200,000
$1,300,000
$1,400,000
$1,500,000
$1,600,000
$1,700,000
2014 2015 2016 2017 2018 2019E 2020E 2021E 2022E
(In
Th
ou
san
ds)
Sustaining Capex Growth Capex Mine Operating Profit*
Potential total capex (mid-point)
* Mine Operating Profit = ounces x (gold price – total cash costs per ounce). Estimated Mine Operating Profit was based on a gold price of $1300.
For further details on growth capex guidance related to the Amaruq, Meliadine and the Kittila Expansion projects for 2019 and onwards, please refer to the news release dated February 14, 2019.
13
Potential uses of rising cash flow:
• Funding pipeline projects
• Re-pay debt
• Increase dividends

Corporate Update
Financial Position
Strong Financial Liquidity Underpins Current Growth Phase
Strong Available Liquidity - $1.5B*
*As at December 31, 2018, excluding accordion
➢ As at December 31, 2018, the
Company had strong liquidity with
$307.9M in cash and cash
equivalents and $1.2B (excluding
$300 million accordion) in undrawn
credit lines available
➢ Low share count of ~235M fully
diluted shares after 61 years of
operating history
**As at December 31, 2018
$308
$1,200
Cash and cash equivalents Undrawn credit facilities
Debt Maturities**
$360
$225
$100 $100 $90
$200
$100 $95
$150
$55
$10
$250
$-
$50
$100
$150
$200
$250
$300
$350
$400
2020 2022 2023 2024 2025 2026 2027 2028 2029 2030 2032 2033
14

Corporate Update
Self-Funding Business Positioned to Potentially Grow Dividends
Long History of Returning Value to Shareholders
$-
$200
$400
$600
$800
$1,000
$1,200
$1,400
$1,600
$1,800
$-
$20,000
$40,000
$60,000
$80,000
$100,000
$120,000
$140,000
$160,000
$180,000
$200,000
2008 2009 2010 2011 2012 2013 2014 2015 2016 2017 2018
(In
Th
ou
san
ds)
Total Annual Dividend Average Gold Price
$961M in cumulative
dividends over
the last 36 years
15

Corporate Update
Agnico Eagle – A High Quality Low Risk Growth Story
Competitive Position: Growing Production Base, High Quality Long Life Assets and
Proven Value Creating Strategy
➢ Strong operational performance, meeting or exceeding targets and generating significant
cash flow with strong safety performance
➢ Gold reserves growing and gold reserve grade improving
➢ Expect ongoing conversion of M&I mineral resources into mineral reserves at key operations
➢ Anticipated growth in gold production to 2.0Moz in 2020 drives rising free cash flow
➢ Upside beyond 2.0Moz of gold
➢ Growth from assets we currently own, in areas we currently operate
➢ Funded by cash on hand, operating cash flow and, if needed, drawing on line of credit
➢ Low political risk in stable, pro-mining jurisdictions
➢ Project pipeline provides additional opportunities to add value longer term
➢ Broad range of technical skills and experience to deliver on plan with achievable targets
16

Click to edit Master title style
Corporate Update
Appendix

Corporate Update
Fourth Quarter and Full Year 2018 Operational Highlights
➢Strong quarterly operational performance; annual production and costs better than forecast for 7th
consecutive year - Payable gold production in Q4 2018 was 411kozs at production costs/oz of $693, total
cash costs/oz of $608 and AISC of $852/oz. Payable gold production in 2018 was 1.63Mozs at production
costs/oz of $713, total cash costs/oz of $637 and AISC of $877/oz
➢ Increased gold production guidance in 2019 with gold production forecast to grow through 2021 -
The production forecast for 2019 is now 1.75Mozs, compared to the most recent guidance of 1.70Mozs.
The mid-point of gold production guidance for 2020 is unchanged at 2.0Mozs and the mid-point of gold
production guidance for 2021 is 2.05Mozs
➢Meliadine project ahead of schedule and under budget with commissioning of the mill underway;
Amaruq deposit remains on track for production start-up in Q3 2019 - Commercial production at
Meliadine is now expected to be achieved early in Q2 2019 (previous guidance was late Q2 2019).
Development activities at Amaruq are progressing as planned. Open pit mining has commenced at the
Whale Tail pit and commissioning of the long-haul truck fleet is underway
➢Dividend increased by 14% - A quarterly dividend of $0.125/share has been declared (previous quarterly
dividend was $0.11/share)
18

Corporate Update
Operating Results
Gold production and costs better than forecast for seventh consecutive year
Q4 2018 Total Operating Margin – $253.3MQ4 2018 Revenue by Metal
LaRonde, 23%
Canadian Malartic, 24%
Pinos Altos, 14%Meadowbank,
11%
Goldex, 8%
La India, 5%
Kittila, 9%
Lapa, 2%
Creston Mascota, 2%
LaRonde Zone 5, 2%
Gold96%
Silver3%
Base Metals1%
19
Q4 2018 Full Year 2018
Production (Gold oz)
Total Cash Costs ($/oz)
Operating Margin($000’s)
Production (Gold oz)
Total Cash Costs ($/oz)
Northern Business
LaRonde 81,022 $441 $58,697 343,686 $445
LaRonde Zone 5 10,196 $641 $5,600 18,620 $732
Lapa 7,307 $713 $3,868 34,026 $872
Goldex 31,508 $624 $19,318 121,167 $646
Canadian Malartic (50%) 84,732 $562 $60,346 348,600 $559
Kittila 49,353 $787 $22,516 188,979 $853
Meadowbank 59,664 $734 $27,985 248,997 $814
323,782 $610 $198,330 1,304,075 $639
Southern Business
Pinos Altos 49,170 $518 $36,582 181,057 $548
Creston Mascota 11,452 $736 $4,794 40,180 $841
La India 26,308 $694 $13,643 101,357 $685
86,930 $600 $55,019 322,594 $628
Total 410,712 $608 $253,349 1,626,669 $637

Corporate Update
Diversified Operations
Robust Production in Premier Mining Jurisdictions in North America and Europe
Kittila, Finland
Producing (100%)
Northern Business
Production (Koz) 189.0
P&P (Moz) 4.4
M&I (Moz) 1.6
Meliadine, Canada
Development (100%)
Northern Business
Production (Koz) -
P&P (Moz) 3.8
M&I (Moz) 3.2
Meadowbank and Amaruq, Canada
Producing and Development (100%)
Northern Business
Production (Koz) 249.0
P&P (Moz) 3.0
M&I (Moz) 1.3LaRonde Complex, Canada
Producing (100%)
Northern Business
Production (Koz) 362.3
P&P (Moz)1 3.8
M&I (Moz) 1.0
Goldex, Canada
Producing (100%)
Northern Business
Production (Koz) 121.2
P&P (Moz) 1.1
M&I (Moz) 1.7
Canadian Malartic, Canada
Producing (50%)
Northern Business
Production (Koz) 348.6
P&P (Moz) 2.8
M&I (Moz) 0.4
La India, Mexico
Producing (100%)
Southern Business
Production (Koz) 101.4
P&P (Moz) 0.6
M&I (Moz) 0.3
Pinos Altos, Mexico
Producing (100%)
Southern Business
Production (Koz) 181.1
P&P (Moz) 1.2
M&I (Moz) 1.1Creston Mascota, Mexico
Producing (100%)
Southern Business
Production (Koz) 40.2
P&P (Moz) 0.01
M&I (Moz) 0.02
Finland
Source: Company filings.Note: Production is for fiscal year 2018; Mineral Reserves and Mineral Resources as of December 31, 2018.
1. LaRonde Complex Production and mineral reserves and mineral resources are inclusive of LaRonde Zone 5.2. Totals are indicative of total producing, developing and exploration assets.
Total2
Production (Koz) 1,627
P&P (Moz) 22.0
M&I (Moz) 17.4
Producing MineDevelopment Project
20

Corporate Update
17%
24%
31%33%
41% 41%44%
51%
59%
86%
0%
10%
20%
30%
40%
50%
60%
70%
80%
90%
100%
AEM NEM ABX GG AUY NGD KGC IMG EGO CG
Fra
ser
Insti
tute
Co
mp
an
y S
co
re
Source: Bloomberg, Fraser Institute
Low Political Risk, Mining Friendly Jurisdictions
21

Corporate Update
Successful M&A and Exploration Strategy
Significant Value Added, Key Deposits Still Open and Positioned to Deliver More Value
For a full detailed description of mineral reserves and mineral resources please see the Company’s news release dated February 14, 2018.
Kittila
2005 2018
Mined through 2018 (koz) Proven & Probable (koz) Measured & Indicated (koz) Inferred (koz) Cost per Oz ($)
$54
$14
Purchase Discovery
2,800 koz
8,884 koz
+217%
Meadowbank(Including Amaruq)
2007 2018
$173
$29
Purchase Discovery
3,830 koz
9,617 koz
+151%
Meliadine
2010 2018
$121
$33
Purchase Discovery
5,020 koz
9,530 koz
+90%
Pinos Altos
2006 2017
$43
$16
Purchase Discovery
2,100 koz
5,012 koz
+139%
La India
2011 2017
$186
$63
Purchase Discovery
1,266 koz
1,999 koz
+58%
22

Click to edit Master title style
Corporate Update
Northern Business

Corporate Update
Production 2018 Production and
Costs
Highlights
LaRonde
343,686 ozs
at a production cost of
$664/oz and total
cash costs of $445/oz
• Gold production in Q4 2018 decreased when compared to the prior-year period due to lower tonnage resulting from the mining
sequence
• Following the successful deployment of the LTE network at LaRonde Zone 5, an LTE network was deployed at the LaRonde
mine below level 269 in Q4 2018. The LTE network will facilitate the integration of automation technologies to allow the
Company to maintain similar historical productivity levels at LaRonde 3
• After performing a geological and engineering review of Zone 11-3 (at depth in the past producing Bousquet 2 mine), the
Company has added ~140koz of gold (1.2M tonnes grading 3.77 g/t gold) into mineral reserves included with the LZ5 property.
The zone will provide production flexibility to the LaRonde Complex
Canadian Malartic (50%)
348,600 ozs
at a production cost of
$573/oz and total
cash costs of $559/oz
• Gold production for the full year 2018 increased when compared to the prior-year period due to record annual mill throughput levels and
higher grades
• Work on the Barnat extension project is on budget and on schedule. Work is primarily focused on the Highway 117 road deviation,
overburden stripping and tailings expansion. The highway deviation is expected to be completed in late 2019. Production activities at
Barnat are expected to begin in late 2019 (after completion of the highway deviation)
• Exploration programs are ongoing to evaluate several deposits to the east of the Canadian Malartic open pit, including the Odyssey, East
Malartic, Sladen and Sheehan zones. These opportunities have the potential to provide new sources of ore for the Canadian Malartic mill
Goldex
121,167 ozs
at a production cost of
$648/oz and total
cash costs of $646/oz
• Drilling and development is ongoing in the South Zone, which is accessible from the Deep 1 Zone infrastructure
• The Company is evaluating the potential for the South Zone to provide incremental ore feed to the Goldex mill. Additional development
continued at level 106, as a result of better than expected grades. The Company believes that there is potential to increase mining
throughput from the South Zone. A longitudinal test stope in the South Zone was mined in Q4 2018
• The Company continues to review the timeline for the integration of the Akasaba West project into the Goldex production profile
Lapa
34,026 ozs*
at a production cost of
$819/oz and total
cash costs of $872/oz
• In the Q4 2018, the Lapa mill processed ore for 37 days as the mining operations were finally completed
• Mining and processing operations at Lapa ended in December 2018 and, as a result, the Lapa mill circuit at LaRonde is now fully
available to process LZ5 ore. Closure activities for the underground infrastructure are currently underway with surface work expected to
begin in Q2 2019
Abitibi Region
24For a full detailed description of mineral reserves and mineral resources please see the Company’s news release dated February 14, 2019.
*172 days of milling

Corporate Update
NunavutProduction 2018 Production and
Costs
Highlights
Meadowbank
248,997 ozs
at a production cost of
$848/oz and total cash
costs of $814/oz
• During Q4 2018, mining activities were carried out at both the Vault and Portage deposits and in addition, ore was sourced from the
marginal stockpile
• Gold production in Q4 2018 decreased when compared to the prior-year period as expected due to anticipated lower grades from
processing the marginal ore stockpile
• Gold production at Meadowbank is expected to end late in Q2 2019 and gold production is forecast to be higher in Q1 2019
Production 2018 Production and
Costs
Highlights
LaRonde Zone 5 (LZ5)
18,620 ozs*
at a production cost of
$698/oz and total cash
costs of $732/oz
• In Q4 2018, mining continued at LZ5 with ore processed from October to November and ore stockpiled at surface in December as the
mill processed ore from Lapa. Mining and processing operations at Lapa ended in December 2018 and, as a result, the Lapa mill circuit
at LaRonde is now fully available to process LZ5 ore
• In its first year of operation, the mine achieved its designed production rate of 1,975 tonnes per day with lower than expected dilution
and slightly higher than expected mill recoveries. The Company is evaluating scenarios to integrate additional mineral resources down
plunge of the LZ5 deposit into the mine plan along with the potential to process additional daily tonnage through the LaRonde complex
• Integration and pilot testing of automated mining equipment (two trucks and one scoop tram) began in Q4 2018 at LZ5 and will
continue in 2019
FinlandProduction 2018 Production and
Costs
Highlights
Kittila
188,979 ozs
at a production cost of
$831/oz and total cash
costs of $853/oz
• In October 2018, an anticipated 10-day mill shutdown was completed ahead of schedule. Despite the shutdown, Q4 2018 production
increased when compared to the prior-year period due to strong mill throughput, partially offset by lower grades and recoveries. The
lower grade was primarily due to the mining sequence
• The mill expansion is advancing as planned with Phase 1 construction work completed in Q4 2018. The shaft project continues to
progress with detailed engineering started
• A mill shutdown is currently scheduled to take place in Q2 2019 for a 60-day period to allow for autoclave relining
• There was an increase of 0.3Moz of gold in mineral reserves at Kittila (to 4.4Moz) as a result of the shaft expansion program
Abitibi Region
25For a full detailed description of mineral reserves and mineral resources please see the Company’s news release dated February 14, 2019.
*116 days of milling

Corporate Update 26
Amaruq Project – Open Pit Mineral Reserves Increased; Project on Schedule for
Production Startup Early in Q3 2019; Underground Potential Continues to Grow
➢ Construction activities in Q4 2018 include:
▪ Completion of the secant wall at the Whale Tail dyke
▪ Continuation of Whale Tail pit stripping activities with the first
ore being mined and stockpiled
▪ Widening of the production road was completed in Q4 2018
and commissioning of the long haul truck fleet is ongoing
➢ The Whale Tail Expansion permitting process for V
Zone (open pit) and Whale Tail (underground) is
ongoing with permits expected in late 2020
➢ Drilling at Amaruq resulted in the addition of 0.5Mozs of
gold reserves at open pit depths. Exploration also
continued to demonstrate the extension of high-grade
mineralization below the proposed open pits at both the
Whale Tail and V Zone deposits
➢ The Company continues to evaluate the potential for an
underground operation at Amaruq, which could run
partially concurrent with the open pit mine that is
currently under development. A production decision for
the Amaruq underground project is expected to be
made later this year
See AEM February 14, 2019 press release and appendix for detailed breakdown of mineral reserves and mineral resources

Corporate Update 27
Meliadine Project - Mill Commissioning Underway; Commercial Production
Expected Early in Q2 2019; Drilling continues to Extend Mineralization
➢ At the end of Q4 2018, site construction was 97% complete
and commercial production is now expected to occur in
early Q2 2019
➢ Recent project highlights include:
▪ The mill began processing waste rock in December resulting in
successful commissioning of the grinding and filtration circuits
▪ Commissioning of the carbon stripping, gravity circuits and oxygen
plant are expected to be carried out in mid-February, coinciding
with the processing of higher grade ore feed
▪ The crusher will be completed in mid-February and the paste plant
is expected to be in full operation beginning in March 2019
▪ Three underground stopes have been blasted and mucked out. At
present, there are approximately 180,000 tonnes of stockpiled ore
grading 6.0 g/t gold
➢ Drilling has encountered mineralization outside the known
mineral resource areas at Tiriganiaq. Highlights include:
29.1 g/t gold over 3.8m at 626m depth and 40.0 g/t gold
over 2.8m at 748m depth. These new areas are expected
to increase inferred mineral resources in 2019 with
additional diamond drilling

Click to edit Master title style
Corporate Update
Southern Business

Corporate Update
Production 2018 Production and
Costs
Highlights
Pinos Altos
181,057 ozs
at a production cost of
$764/oz and total
cash costs of $548/oz
• Gold production in Q4 of 2018 increased when compared to the prior-year period due to higher grades and higher throughput
• Development of the Sinter and Cubiro satellite deposits at Pinos Altos continued to advance in Q4 2018. At Sinter, 757m of underground
development was completed. At Cubiro, which could potentially supply high-grade ore, 300m of underground ramp development was
completed at the end of Q4 2018
• The Company completed the installation of an ore sorting pilot plant at Pinos Altos in Q4 2018. The goal of this plant is to improve feed
grades to the processing facilities. Commissioning activities commenced in January 2019 and testing is expected to continue for
approximately six months. Similar ore sorting pilot testing is being considered at the Company's other operating regions
Creston Mascota
40,180 ozs
at a production cost of
$928/oz and total
cash costs of $841/oz
• In Q4 2018, the Phase V heap leach pad expansion was completed and the Calera waste rock dump was developed close to the Bravo
pit to reduce waste haulage costs
• Studies are underway to evaluate the viability of processing higher grade ore from the Bravo deposit at the Pinos Altos mill to improve
recoveries and generate additional cash flow
• 2019 is expected to be the last year of mining activities. Mining is expected to continue until early in Q4 2019 with leaching activities
expected to continue through 2020. Costs are expected to decline once mining activities have ceased
La India
101,357 ozs
at a production cost of
$682/oz and total
cash costs of $685/oz
• Detailed engineering on the heap leach expansion was completed in November and earthworks were started in December. Liner
installation is currently underway with completion expected in April 2019
• Studies are underway to optimize the crushing circuit with a goal of potentially increasing capacity from 16,000 to 17,000 tonnes-per-day
• An initial mineral reserve of 84koz of gold and 418koz of silver (3.3M tonnes grading 0.8 g/t gold & 3.96 g/t silver) was declared at the El
Realito deposit
• At Chipriona, results from the latest program have demonstrated the continuity of mineralization in the main veins identified in 2017, as
well as the consistency in thickness of the individual veins in the corridor. Highlights include 1.2 g/t gold & 94 g/t silver over 76m and 2.8
g/t gold and 205 g/t silver over 21m
Mexico Operations
29For a full detailed description of mineral reserves and mineral resources please see the Company’s news release dated February 14, 2019.

Corporate Update
Exploration and
Development
Highlights
El Barqueno
• Agnico Eagle acquired its 100% interest in the El Barqueno project in November 2014. The 79,746-hectare property is in the Guachinango gold-silver mining district
of Jalisco State in west-central, Mexico, approximately 150 kilometres west of the state capital of Guadalajara
• El Barqueno is estimated to contain 318,000 ounces of gold and 1.2 million ounces of silver in indicated mineral resources (8.1 million tonnes grading 1.22 g/t gold
and 4.63 g/t silver) and 322,000 ounces of gold and 4.6 million ounces of silver in inferred mineral resources (8.2 million tonnes grading 1.22 g/t gold and 17.45 g/t
silver).
• In 2018, 28,000 metres of drilling was completed at the El Barqueno project, with a principal focus on testing new target areas. Although the exploration results were
geologically encouraging, current development studies indicate that the project does not meet the Company's investment criteria. As a result, the carrying value of
the property has been reduced while exploration activity continues in 2019
Santa Gertrudis
• Agnico Eagle holds a 100% interest in the 42,000-hectare Santa Gertrudis gold property. Three favorable geological trends with a potential strike length of 18 km
have been identified with limited drilling between deposits
• An initial mineral resource of 962,000 ozs of gold was declared at year end 2018 and drilling has outlined high grade mineralization with values up to 9.7 g/t Au over
15m
• Work in 2019 will focus on expanding the mineral resources, testing the extension of high-grade structures and evaluating the economic potential of the project
Mexico Exploration and Development Projects
30For a full detailed description of mineral reserves and mineral resources please see the Company’s news release dated February 14, 2019.

Click to edit Master title style
Corporate Update
Innovation

Corporate Update
Innovation Is an Area of Long Term Strategic Focus at Agnico Eagle
➢ Collaborating with industry to advance innovative solutions
➢ Examining and implementing multiple new (for Agnico Eagle) technologies
➢ LTE (Long Term Evolution) network: Improved wireless communication
• Currently deployed at LZ5 and automated mining equipment is
currently being tested
• LTE network was installed at LaRonde below level 269
– potential to test automated equipment by 2020
➢ Rail-Veyor: Lower cost ore transportation
• Deployed at Goldex, evaluating use at other mines
➢ Ore sorting: Improve quality of low-grade ore, convert waste to ore
• Pilot plant testing at Pinos Altos
➢ Mechanical cutting: Improve development rates at lower costs
• Closely following technology pilot to assess fit
➢ Energy management: Reduce cost and environmental footprint
• Examining renewable energy solutions in Nunavut and Mexico
32

Corporate Update
Agnico Eagle’s Global Approach to Energy Management
33
Areas of Study
Developing a global approach for energy
management across Agnico Eagle’s operations to
reduce energy costs at select regions by up to
30% and lower greenhouse gas emissions
➢ Nunavut
‒ Wind/Solar
‒ Liquefied Natural Gas (LNG)
‒ Hydro
‒ Southern power link
➢ Mexico
‒ Examining solutions (i.e. solar power) to
increase renewable sources of energy in
Mexico

Click to edit Master title style
Corporate Update
ESG Initiatives

Corporate Update
Committed to Being a Leader in Sustainable Development
Active participation in leading management and disclosure initiatives
35
Recognized by independent ESG ratings agencies for our leading industry practices
ENVIRONMENTAL SOCIAL GOVERNANCE
We focus on limiting our
environmental impacts by:
• using natural resources
efficiently
• preventing or limiting emissions
• reducing waste
We identify, analyze and manage
our environmental risks
We act in a socially responsible
manner and contribute to the
communities in which we
operate
We are committed to working
with our employees and other
stakeholders to create growth
and prosperity
We work in a transparent
manner with local stakeholders
We act in an ethically
responsible manner and uphold
our core values using our
• Code of Business Conduct
• Ethics & anti-corruption,
anti-bribery policy
• Our supplier code of
conduct
• Our SD policy
• Our Indigenous Peoples
Engagement Policy
Corporate Update 36
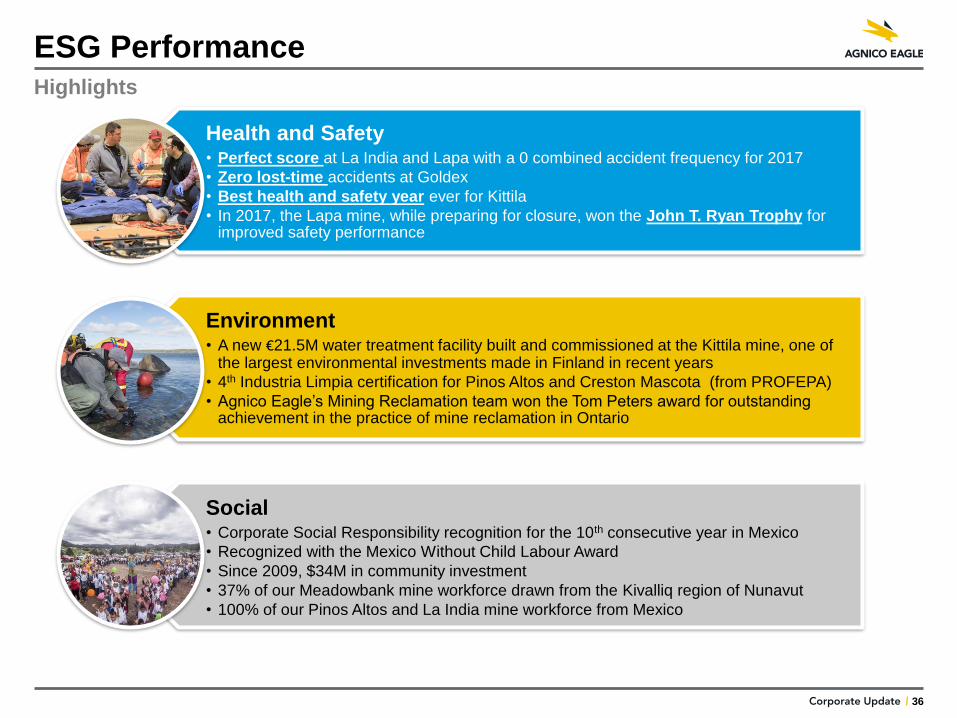
ESG Performance
Health and Safety• Perfect score at La India and Lapa with a 0 combined accident frequency for 2017
• Zero lost-time accidents at Goldex
• Best health and safety year ever for Kittila
• In 2017, the Lapa mine, while preparing for closure, won the John T. Ryan Trophy for improved safety performance
Environment• A new €21.5M water treatment facility built and commissioned at the Kittila mine, one of
the largest environmental investments made in Finland in recent years
• 4th Industria Limpia certification for Pinos Altos and Creston Mascota (from PROFEPA)
• Agnico Eagle’s Mining Reclamation team won the Tom Peters award for outstanding achievement in the practice of mine reclamation in Ontario
Social• Corporate Social Responsibility recognition for the 10th consecutive year in Mexico
• Recognized with the Mexico Without Child Labour Award
• Since 2009, $34M in community investment
• 37% of our Meadowbank mine workforce drawn from the Kivalliq region of Nunavut
• 100% of our Pinos Altos and La India mine workforce from Mexico
Highlights

Click to edit Master title style
Corporate Update
Mineral Reserves and Mineral Resources

Corporate Update
Mineral Reserves - December 31, 2018
38

Corporate Update
Mineral Resources - December 31, 2018
Mineral reserves are not a subset of mineral resources. Tonnage amounts and contained metal amounts presented in this table have been rounded to the nearest thousand, so aggregate amounts may differ from column totals.
39

Corporate Update
Cautionary Note to Investors Concerning Estimates of Measured and Indicated Mineral Resources
This presentation uses the terms "measured mineral resources" and "indicated mineral resources". Investors are advised that while those terms are recognized and required by
Canadian regulations, the SEC does not recognize them. Investors are cautioned not to assume that any part or all of mineral deposits in these categories will ever be
converted into mineral reserves.
Cautionary Note to Investors Concerning Estimates of Inferred Mineral Resources
This presentation also uses the term "inferred mineral resources". Investors are advised that while this term is recognized and required by Canadian regulations, the SEC does not
recognize it. "Inferred mineral resources" have a great amount of uncertainty as to their existence, and great uncertainty as to their economic and legal feasibility. It cannot be
assumed that all or any part of an inferred mineral resource will ever be upgraded to a higher category. Under Canadian rules, estimates of inferred mineral resources may not form
the basis of feasibility or pre-feasibility studies, except in rare cases. Investors are cautioned not to assume that any part or all of an inferred mineral resource exists, or is
economically or legally mineable.
Scientific and Technical Data
Cautionary Note To U.S. Investors - The SEC permits U.S. mining companies, in their filings with the SEC, to disclose only those mineral deposits that a company can economically
and legally extract or produce. Agnico Eagle reports mineral reserve and mineral resource estimates in accordance with the Canadian Institute of Mining, Metallurgy and Petroleum
Best Practice Guidelines for Exploration and Best Practice Guidelines for Estimation of Mineral Resources and Mineral Reserves in accordance with the Canadian securities regulatory
authorities' (the "CSA") National Instrument 43-101 Standards of Disclosure for Mineral Projects ("NI 43-101"). These standards are similar to those used by the SEC's Industry Guide
No. 7, as interpreted by Staff at the SEC ("Guide 7"). However, the definitions in NI 43-101 differ in certain respects from those under Guide 7. Accordingly, mineral reserve
information contained herein may not be comparable to similar information disclosed by U.S. companies. Under the requirements of the SEC, mineralization may not be classified as a
"reserve" unless the determination has been made that the mineralization could be economically and legally produced or extracted at the time the reserve determination is made. A
"final" or "bankable" feasibility study is required to meet the requirements to designate mineral reserves under Industry Guide 7. Agnico Eagle uses certain terms in this presentation,
such as "measured", "indicated", "inferred" and "resources" that the SEC guidelines strictly prohibit U.S. registered companies from including in their filings with the SEC.
Assumptions used for the December 31, 2018 mineral reserves estimate at all mines and advanced projects reported by the Company
Metal prices Exchange rates
Gold (US$/oz) Silver (US$/oz) Copper (US$/lb) Zinc (US$/lb) C$ per US$1.00Mexican peso per
US$1.00US$ per €1.00
Long-life operations and
projects
$1,150 $16.00 $2.50 $1.00
C$1.20 MXP16.00 US$1.15
Short-life operations –
Meadowbank mine, Sinter
and Creston Mascota (Bravo)
satellite operation at Pinos
Altos
C$1.25 MXP17.00 Not applicable
Upper Canada, Upper
Beaver*, Canadian Malartic
mine**
$1,200 Not applicable $2.75 Not applicable C$1.25 Not applicable Not applicable
*The Upper Beaver project has a C$125/tonne net smelter return (NSR)
**The Canadian Malartic mine uses a cut-off grade between 0.37 g/t and 0.38 g/t gold (depending on the deposit)
NI 43-101 requires mining companies to disclose mineral reserves and mineral resources using the subcategories of "proven mineral reserves", "probable mineral reserves",
"measured mineral resources", "indicated mineral resources" and "inferred mineral resources". Mineral resources that are not mineral reserves do not have demonstrated economic
viability.
Notes to Investors Regarding The Use of Mineral Resources
40
Corporate Update
A mineral reserve is the economically mineable part of a measured and/or indicated mineral resource. It includes diluting materials and allowances for losses, which may occur when
the material is mined or extracted and is defined by studies at pre-feasibility or feasibility level as appropriate that include application of modifying factors. Such studies demonstrate
that, at the time of reporting, extraction could reasonably be justified. The mineral reserves presented in this presentation are separate from and not a portion of the mineral resources.
Modifying factors are considerations used to convert mineral resources to mineral reserves. These include, but are not restricted to, mining, processing, metallurgical, infrastructure,
economic, marketing, legal, environmental, social and governmental factors.
A proven mineral reserve is the economically mineable part of a measured mineral resource. A proven mineral reserve implies a high degree of confidence in the modifying factors. A
probable mineral reserve is the economically mineable part of an indicated and, in some circumstances, a measured mineral resource. The confidence in the modifying factors
applying to a probable mineral reserve is lower than that applying to a proven mineral reserve.
A mineral resource is a concentration or occurrence of solid material of economic interest in or on the Earth's crust in such form, grade or quality and quantity that there are reasonable
prospects for eventual economic extraction. The location, quantity, grade or quality, continuity and other geological characteristics of a mineral resource are known, estimated or
interpreted from specific geological evidence and knowledge, including sampling.
A measured mineral resource is that part of a mineral resource for which quantity, grade or quality, densities, shape and physical characteristics are estimated with confidence
sufficient to allow the application of modifying factors to support detailed mine planning and final evaluation of the economic viability of the deposit. Geological evidence is derived from
detailed and reliable exploration, sampling and testing and is sufficient to confirm geological and grade or quality continuity between points of observation. An indicated mineral
resource is that part of a mineral resource for which quantity, grade or quality, densities, shape and physical characteristics are estimated with sufficient confidence to allow the
application of modifying factors in sufficient detail to support mine planning and evaluation of the economic viability of the deposit. Geological evidence is derived from adequately
detailed and reliable exploration, sampling and testing and is sufficient to assume geological and grade or quality continuity between points of observation. An inferred mineral
resource is that part of a mineral resource for which quantity and grade or quality are estimated on the basis of limited geological evidence and sampling. Geological evidence is
sufficient to imply but not verify geological and grade or quality continuity.
Investors are cautioned not to assume that part or all of an inferred mineral resource exists, or is economically or legally mineable.
A feasibility study is a comprehensive technical and economic study of the selected development option for a mineral project that includes appropriately detailed assessments of
applicable modifying factors together with any other relevant operational factors and detailed financial analysis that are necessary to demonstrate, at the time of reporting, that
extraction is reasonably justified (economically mineable). The results of the study may reasonably serve as the basis for a final decision by a proponent or financial institution to
proceed with, or finance, the development of the project. The confidence level of the study will be higher than that of a Pre-Feasibility Study.
The effective date for all of the Company's mineral resource and mineral reserve estimates in this presentation is December 31, 2018. Additional information about each of the mineral
projects that is required by NI 43-101, sections 3.2 and 3.3 and paragraphs 3.4 (a), (c) and (d) can be found in the Technical Reports filed by Agnico Eagle, which may be found at
www.sedar.com. Other important operating information can be found in the Company's AIF and Form 40-F.
The scientific and technical information relating to Agnico Eagle's mineral reserves and mineral resources contained herein (other than the Canadian Malartic mine) has been approved
by Daniel Doucet, Eng., Senior Corporate Director, Reserve Development; and relating to mineral reserves and mineral resources at the Canadian Malartic mine contained herein has
been approved by Donald Gervais, P.Geo., Director of Technical Services at Canadian Malartic Corporation. Each of them is a "Qualified Person" for the purposes of NI 43-101.
Notes to Investors Regarding The Use of Mineral Resources
41


![Corporate Presntation [Company Update]](https://img.dokumen.tips/doc/110x75/577c7b771a28abe05497d59c/corporate-presntation-company-update.jpg)