Embed Size (px)
Citation preview
CORPORATE RESEARCH REPORTAn independent study, written for and developed with the help of client-side marketing research and insights professionals
A supplement to Quirk’s Marketing Research Review
Media partners:

Corporate Research Report // www.quirks.com/CorporateResearchReport4
WWelcome to the second annual Quirk’s Corporate Research Report!
The purpose of the report is to give corporate researchers (those whose job it is to gather, analyze and disseminate insights about their organizations’ customers, products and services) an in-depth look into their world, helping them learn more about what their peers and colleagues are doing and also benchmark themselves and their departments.
The report covers two main areas: work life and compensation.
The work life articles are drawn from the findings of our survey on the views and opinions of corporate researchers in the context of the current state of the marketing research process. The survey covered budgets, outsourcing, techniques in use and under consideration, how insights are delivered inside the organization, internal perceptions of the insights function and working with vendors.
The compensation articles are drawn from the results of our survey of corporate researcher salaries. Respondents answered questions on their job satisfaction, their compensation packages and their level of experience. (We’ve also included tables showing compensation by industry, level of annual sales, region and other variables.)
In our view, what makes this publication stand out from other trend studies in the research industry is that it is completely independent. The questions were formulated with the help of corporate researchers, not research suppliers. There is no hidden agenda, no sale of or sponsorship of survey questions. Advertising was sold only after the study was complete. In other words, the study is not about research suppliers or even Quirk’s – it’s about you, the corporate researcher!
We want to thank all of our client-side readers who took the time to complete the surveys and share their candid thoughts and also thank ESOMAR for contributing content. A big shout-out as well to the companies and organizations whose financial support helped make the Corporate Research Report possible.
We hope you find this report useful. Please let us know how we can make next year’s edition more informative and valuable to you.
Sincerely,Joe Rydholm [email protected]
Download the Quirk’s magazine app to view this report.
CONTENTS6 Work Life
Corporate researchers weigh in on the highs and lows of their day-to-day jobs
16 Vendor Relationships Respondents offer candid thoughts on working with suppliers
20 Salary and Compensation The sixth annual salary survey finds job satisfaction holding steady
31 The Evolving Corporate Researcher ESOMAR examines the global trends affecting the insights function
34 Partnering Organizations
An interactive downloadable PDF copy of this report is avail-able at www.quirks.com/pdf/CorporateResearchReport.
Follow us on Twitter @QuirksMR.
Quirk’s Marketing Research Media 4662 Slater Road | Eagan, MN 55122 651-379-6200 | www.quirks.com
Publisher • Steve Quirk [email protected] | x202
Editor • Joseph Rydholm [email protected] | x204
Digital Content Editor • Emily Koenig [email protected] | x210
Circulation Manager • Ralene Miller [email protected] | x201
V.P. Product Development • Dan Quirk [email protected] | x203
V.P. Sales • Evan Tweed [email protected] | x205
Sales • Lance Streff [email protected] | x211

Survey Solutions with a Human Touch
@criticalmixers Critical MixCriticalMix
Whenever and however you need us.
We make it easier and faster for companies to access high-quality survey data because our experienced team is always there for you.
1-800-651-8240You can reach us anytime including after hours and on weekends
[email protected] | www.criticalmix.com
Survey Programming
Global Sample
Data Visualization

Corporate Research Report // www.quirks.com/CorporateResearchReport6
CORPORATE RESEARCHERS: WORK LIFE
FFielded in the summer of 2015, this edition of our corporate researcher work life survey tackled a range of topics identified in consultation with some wonderfully helpful Quirk’s readers: budgets; techniques in use and under consideration; how they seek buy-in for new MR tools; how they deliver results; outsourcing; internal views of the insights function; vendors; and the impact of big data and other non-MR-gathered data sources. We received 691 usable responses.
As you might guess, the vendor-related responses ended up meriting their own section (see p. 16; kind of opened up the floodgates there!) but let’s dive into the data on the other topics.
Budgets appear to have held steady for 2015, with 44 percent saying their spends stayed the same as in 2014 and about equal numbers reporting some sort of decrease (25 percent) or some sort of increase (30 percent).
The story is similar for the amount allocated for outsourcing marketing research, with 46 percent saying things have stayed the same in 2015 and an aggregate 22 percent citing a decrease and 31 percent citing an increase.
As we have found with previous Quirk’s reader surveys, while the omnipresence of terms like disruption and innovation at industry gatherings makes it
seem like the use of longstanding research methods is (or should be) declining, results from this year’s study show stalwarts like traditional focus groups and secondary research as still in wide use. Even telephone interviewing makes a respectable showing, with 61 percent saying they currently use it. At 97 percent currently using, online surveys are clearly a go-to method. Up-and-coming methods like big data analytics, text analytics, mobile ethnography and gamification all garnered respectable (30 percent or above) percentages of respondents considering using them while non-conscious methods like neuromarketing research, facial coding and biometrics have consideration percentages in the 20s. 1
The seemingly least-popular method is the telephone focus
group, with 79 percent of respondents saying they neither use the method nor plan to use it. The aforementioned non-conscious methods come next: biometrics (74 percent); facial coding (70 percent); and neuromarketing (68 percent).
While the death knell for focus groups has been louder than ever in recent years, someone forgot to tell the respondents to our survey: a combined 91 percent cited traditional focus groups as effective or very effective at delivering actionable insights. Also clocking in with high combined effectiveness numbers are online surveys, in-person interviewing, secondary data, panels, in-person interviewing, in-person ethnography and telephone interviewing. Again, the non-conscious methods have the highest “not sure” percentages. 2
To add some color to the questions about usage levels and perceived value and impact, we asked an open-end about the technology, tool or technique that has had the biggest impact on respondents’ deliverables in the past year. Some sample responses:
Should we add ‘context provider’ to the list of new MR job titles?

www.quirks.com/CorporateResearchReport // Corporate Research Report 7
CORPORATE RESEARCHERS: WORK LIFE
“ I would say techniques in the communication of outputs, rather than research techniques alone. We’ve done a lot more with visual deliverables – quotes, videos, stories, magazines, etc., rather than traditional market research deliverables. It helps spark and engage attention and discussion.”
“ Structural equation modeling is not new but was new to me this past year. It allowed us to understand our customer subgroups and their differences in a way I had not done before.”
“ Data synthesis – moving from a ‘study mind-set’ to one that leverages multiple primary studies and a host of other sources to provide deeper insight.”
“ Utilizing in-software reporting instead of developing customized reports from analyzing data outside of the survey software (for basic frequencies). We [used to] spend a bunch of time formatting and inserting data from analysis software into reports and that took time away from seeing the story. We want to spend time finding the insights, not checking numbers.”
“ Biometrics – enabling better diagnosis of content and optimized media.”
“ Combining information from qualitative, quantitative and secondary to form a coherent picture.”
Can’t do it allAs multifaceted as most researchers are, they can’t do it all and when asked about outsourcing, most (85 percent) respondents said they outsource some of the work involved with the MR and insights function. Not surprisingly, data collection (90 percent) is the most-cited part to be outsourced,
1. Which of these techniques (if any) do you currently use or are considering using?
Currently use Considering using Neither using nor considering
Online surveys
Secondary data
Traditional focus groups
Panels
In-person interviewing
Social media research
Online focus groups
Mobile-specific surveys
Big data analytics
Text analytics
Telephone interviewing
In-person ethnography
Mobile qualitative
Mobile ethnography
Predictive markets
Gamification
Crowdsourcing
Paper-based surveys
Neuromarketing
Facial coding
Biometrics
Telephone focus groups
0% 10% 20% 30% 40% 50% 60% 70% 80% 90% 100% 0% 10% 20% 30% 40% 50% 60% 70% 80% 90% 100%
followed by respondent recruitment (82 percent) and data analysis/tabulation (75 percent). As to why they outsource, a lack of internal staff (81 percent) was most-cited, followed by being able to provide an expertise that isn’t available in-house (66 percent) and
a desire for faster turnaround (41 percent). 3a 3b 4 5
An analysis of responses to an open-end about the reasons for outsourcing uncovers several themes. Many of those who completed the survey are one- or two-person teams who are beyond busy (“We support a several-

Corporate Research Report // www.quirks.com/CorporateResearchReport8
CORPORATE RESEARCHERS: WORK LIFE
billion-dollar biz so we can’t do everything in-house.”) but smart enough to know that outsourcing frees them up to do more valuable work (“We can create value at a different place and see ourselves much more as business partners and not as pure researchers.”), gets them out of the political crosshairs
(“[By outsourcing] sometimes we benefit from the ‘consultant effect,’ where if someone external says something, management may be more likely to believe it.”) and often saves time and money (“Much faster and cheaper to have an external firm handle this for us.”).
Many strategies being usedWhile the buzz around new research methodologies may be out of proportion to their uptake, they certainly hold promise and for the researchers who want to secure internal buy-in for trying them, the study shows many strategies are being used. Asked about the
2. How effective do you think these techniques are at providing actionable insights?
Traditional focus groups
In-person interviewing
Telephone interviewing
Mobile-specific surveys
Online focus groups
Neuromarketing
Crowdsourcing
Biometrics
Predictive markets
Facial coding
Big data analytics
Social media research
Text analytics
Gamification
Mobile qualitative
Online surveys
Paper-based surveys
In-person ethnography
Mobile ethnography
Panels
Telephone focus groups
Secondary data
Very Ineffective Ineffective Not Sure Effective Very Effective
0.0 56.5 113.0 169.5 226.0 282.5 339.0 395.5 452.0 508.5 565.0 0% 10% 20% 30% 40% 50% 60% 70% 80% 90% 100%
[email protected] | surveysampling.comPeople | Panels | Technology | Global
Since 1977, the last I in SSI has stood for International
We have the largest global footprint of anyone in our industry segment with offices in 21 countries and sample in over 100. Today, a significant and growing portion of our work is multi-country. And we can do this because we operate our proprietary panels and manage
our projects on a single, integrated technology platform.
Our global scale and seamless operations, means that SSI can deliver high quality B2B and B2C product and services, with local expertise, consistency and speed all over the world. No one
gets how to conduct global research better than SSI.
Learn more and request a quote at surveysampling.com
SSI Gets GLobal.

Corporate Research Report // www.quirks.com/CorporateResearchReport10
CORPORATE RESEARCHERS: WORK LIFE
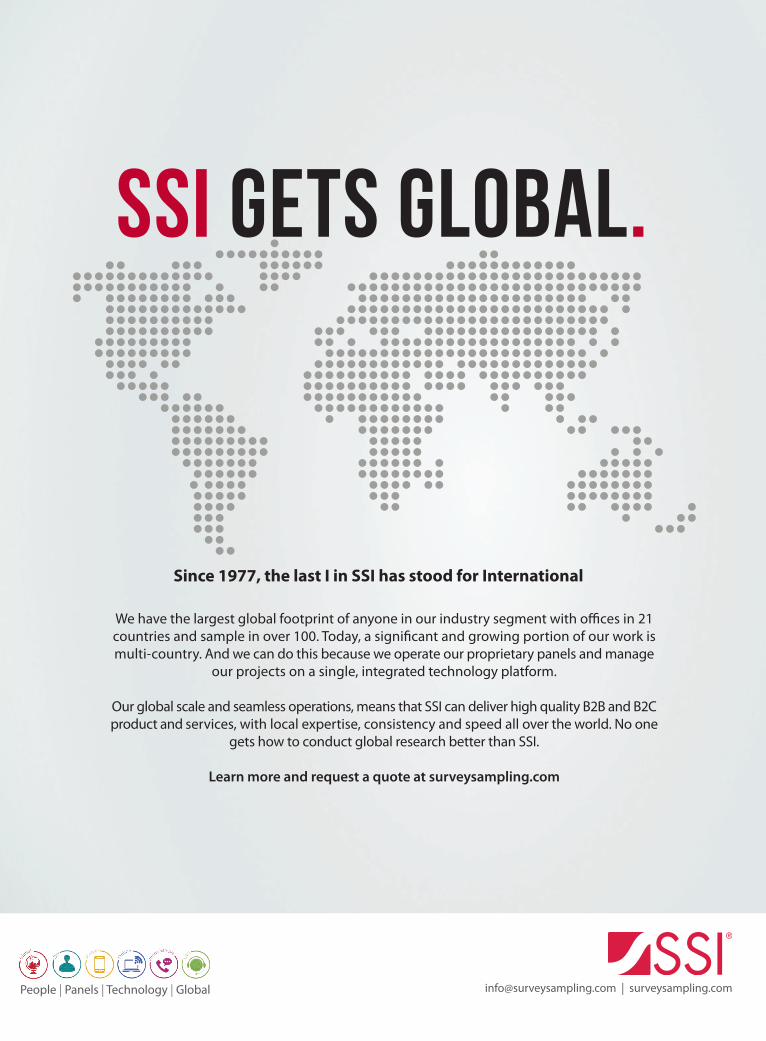
effectiveness of various ways to make a case for using new methods, respondents cited things such as a track record of past success with new tools and techniques or a case study from another firm using the tool or technique as effective. 6
When it’s time to deliver research results, written and in-person approaches are most popular, through small- and large-group presentations and informal meetings, with far lower percentages for infographics (36 percent), using the company intranet (34 percent) or an enterprise-wide dashboard system (21 percent). 7
“ Our reporting varies by internal stakeholder group. For IT collaborators and select product line owners it may be a video report with PowerPoint slides to serve as a later punch list for developers. In some cases, it is PowerPoint only with heavy images for TV-like monitors. Sometimes due to verbatims, it is back to the good ol’ Word document. We are
15%
85%
Yes
No
3a. Do you outsource any aspects of your marketing research or insights function?
43%
23%
34%
Partially outsourced
Fully outsourcedConducted
in-house
3b. What percentage of your research projects are conducted in-house vs. outsourced?
METHOD NOTEVerbatim insights from this year’s survey
“The incorporation of brain science techniques
into some of our studies has given us
another way to capture insights and get to the emotional response.”
4. What parts of the insights or marketing research functions do you outsource?
Data collection
Respondent recruitment
Data analysis/tabulation
Project management
Project development
Other
0% 20% 40% 60% 80% 100%
90%
82%
75%
40%
24%
9%
0% 20% 40% 60% 80% 100%
5. Why do you outsource?
Lack of internal staff
To provide an expertise we don’t have in-house
It is faster
It is cheaper
Other (elaborate below)
Management prefers outsourcing 8%
11%
18%
41%
66%
81%
MR

Panel Members Verif ied By
mindfieldonline.com/[email protected]
Behind every project is the power of MindField technology and 35 years of market research experience.
shop
pin
g
cosm
etic
sgr
ocer
y
heal
th &
bea
uty
child
ren
heal
th &
wel
lnes
s
teen
s
phy
sici
ans
trav
el &
leis
ure
hom
eow
ners
ente
rtai
nmen
t
mot
hers
elec
tron
ics
pet
ow
ners
The PremierOnline Consumer
Panel
auto
mot
ive
A M c M I L L I O N C O M P A N Y
Mobile Optimized, Online Programmingwith Beacon by Decipher
• Software/Panel Integration
for Superior Sample Management •
IQD Electronic Countermeasures for Realtime Data Quality Assurance
•Social and Mobile Enhanced Panel
Engagement for Superior Performance
Corporate Research Report // www.quirks.com/CorporateResearchReport12
CORPORATE RESEARCHERS: WORK LIFE
trying to do more eight-to-12-minute video-based reports for all stakeholder groups.”
“ We like to send super-brief (one-minute) summaries to all senior leaders when we derive useful insights, which can spur additional questions (and requests for new research engagements).”
“ We’ve found it best to use any and all ways to deliver insights. Depending upon the intended audience, one way may work better than another and therefore we need to be flexible.”
“ Our company does open-invitation events and we have had the opportunity to present at several of these. The events are open to anyone who wants to attend and so it is a
good way to provide information across the enterprise without having to go through management-chain dissemination.”
“ We also incorporate business strategies into the research findings to provide both the learnings and what to do about it.”
Very Ineffective Ineffective Neither Effective nor Ineffective
Effective Very Effective
0 10 20 30 40 50 60 70 80 90 100
A case study from another firm using the tool or technique
Articles about the technique
Ability to demonstrate cost savings
Ability to demonstrate ROI
Ability to demonstrate time savings
Vendor information/presentation
Ability to demonstrate statistical validity
Track record of past success with new tools and techniques
6. When seeking internal buy-in for using new research tools or techniques, how effective are the following in aiding the process?
0% 10% 20% 30% 40% 50% 60% 70% 80% 90% 100%
METHOD NOTEVerbatim insights from this year’s survey
“Social listening and text analytics are new for us and have driven
some action.”
7. How do you deliver and report insights within your organization?
Small-group presentations
Written reports
Informal, ad hoc meetings
Large-group presentations
Infographics
Company intranet
Enterprise-wide dashboard system
Video or multimedia
Other (specify below)
0% 20% 40% 60% 80% 100%
3%
21%
24%
34%
36%
78%
78%
94%
95% MRMR
www.quirks.com/CorporateResearchReport // Corporate Research Report 13
CORPORATE RESEARCHERS: WORK LIFE
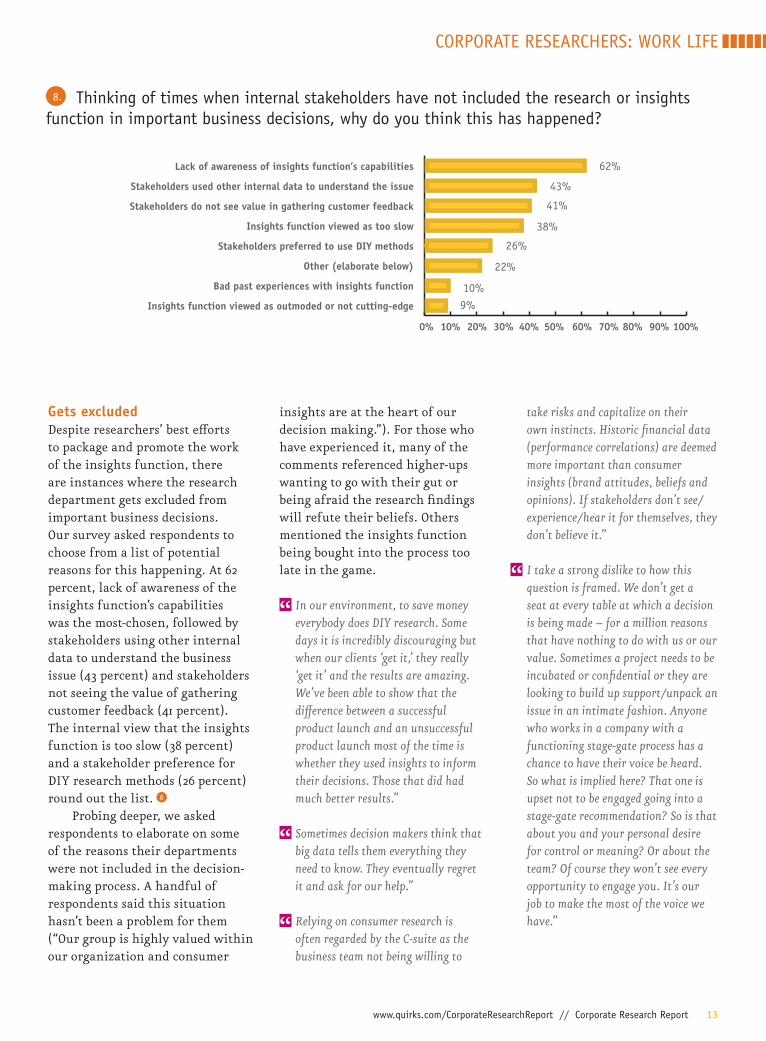
Gets excludedDespite researchers’ best efforts to package and promote the work of the insights function, there are instances where the research department gets excluded from important business decisions. Our survey asked respondents to choose from a list of potential reasons for this happening. At 62 percent, lack of awareness of the insights function’s capabilities was the most-chosen, followed by stakeholders using other internal data to understand the business issue (43 percent) and stakeholders not seeing the value of gathering customer feedback (41 percent). The internal view that the insights function is too slow (38 percent) and a stakeholder preference for DIY research methods (26 percent) round out the list. 8
Probing deeper, we asked respondents to elaborate on some of the reasons their departments were not included in the decision-making process. A handful of respondents said this situation hasn’t been a problem for them (“Our group is highly valued within our organization and consumer
insights are at the heart of our decision making.”). For those who have experienced it, many of the comments referenced higher-ups wanting to go with their gut or being afraid the research findings will refute their beliefs. Others mentioned the insights function being bought into the process too late in the game.
“ In our environment, to save money everybody does DIY research. Some days it is incredibly discouraging but when our clients ‘get it,’ they really ‘get it’ and the results are amazing. We’ve been able to show that the difference between a successful product launch and an unsuccessful product launch most of the time is whether they used insights to inform their decisions. Those that did had much better results.”
“ Sometimes decision makers think that big data tells them everything they need to know. They eventually regret it and ask for our help.”
“ Relying on consumer research is often regarded by the C-suite as the business team not being willing to
take risks and capitalize on their own instincts. Historic financial data (performance correlations) are deemed more important than consumer insights (brand attitudes, beliefs and opinions). If stakeholders don’t see/experience/hear it for themselves, they don’t believe it.”
“ I take a strong dislike to how this question is framed. We don’t get a seat at every table at which a decision is being made – for a million reasons that have nothing to do with us or our value. Sometimes a project needs to be incubated or confidential or they are looking to build up support/unpack an issue in an intimate fashion. Anyone who works in a company with a functioning stage-gate process has a chance to have their voice be heard. So what is implied here? That one is upset not to be engaged going into a stage-gate recommendation? So is that about you and your personal desire for control or meaning? Or about the team? Of course they won’t see every opportunity to engage you. It’s our job to make the most of the voice we have.”
8. Thinking of times when internal stakeholders have not included the research or insights function in important business decisions, why do you think this has happened?
Lack of awareness of insights function’s capabilities
Stakeholders used other internal data to understand the issue
Stakeholders do not see value in gathering customer feedback
Insights function viewed as too slow
Stakeholders preferred to use DIY methods
Other (elaborate below)
Bad past experiences with insights function
Insights function viewed as outmoded or not cutting-edge
0% 10% 20% 30% 40% 50% 60% 70% 80% 90% 100%
9%10%
22%
26%
38%
41%
43%
62%

Corporate Research Report // www.quirks.com/CorporateResearchReport14
CORPORATE RESEARCHERS: WORK LIFE
Incorporate other types of data Another hot-button issue in our industry is whether the proliferation of non-research-generated data sources will end up complementing, subsuming or eliminating the traditional insights-gathering function. The survey asked respondents how often they were being asked to incorporate other types of data (transactional, operational, social media-generated, etc.) into their projects and nearly half (45
percent) said “sometimes” and 27 percent said “most of the time.” 9
Next, they were asked how likely they felt it was that these data sources would render the research function unnecessary. Forty percent said they felt it was very unlikely and 43 percent said it was unlikely. 10
Again, the comments accompanying this topic are illuminating, showing a belief in and confidence around the role that research plays within
10. How likely do you feel it is that those non-marketing research data sources will render the marketing research function unnecessary?
50%
40%
30%
20%
10%
0% Very Unlikely Unlikely Undecided Likely Very Likely
40%43%
12%
3% 2%
9. How often are you being asked to incorporate data from other, non-marketing research sources into your projects? This could include data such as transactional data, operational data, consumer comments from social media, Web metrics, etc.
50%
40%
30%
20%
10%
0% Never Rarely Sometimes Most of the Time Always
4%
18%
45%
27%
6%
their organizations (with a few exceptions!).
“ My internal stakeholders don’t have research expertise – nor do they want to. That’s what I was hired for and they trust that I know what valid sources of data are available.”
“ We incorporate those data sources gladly. It only makes our reports and insights more actionable and informed.”
“ This is a great question. We’ve felt the pendulum start to swing in the direction of big data – however we’ve made a concerted effort to provide insights even when they haven’t been requested and by doing so have kept custom research relevant. A video clip of a consumer saying the same thing that thousands of transactional records will prove still has breakthrough power and weight. Proactively providing what we haven’t been asked for has helped us stay relevant to the point where the pendulum appears to have swung back to its midpoint.”
“ The world is definitely moving toward behavioral information or big data because it’s already available and it’s cheaper. While we haven’t mastered the analysis of it yet, I do worry that management is moving toward using that more than primary opinion data from the consumer. This is a battle that I fight every single day – why behavioral data does not tell the full story of the consumer mind-set and we need both data sources to fully understand our business. I don’t feel that research companies are fully aware of this change. It’s getting more and more difficult to fight this battle against the obstacles of falling budgets and the easy availability of other data sources.”

www.quirks.com/CorporateResearchReport // Corporate Research Report 15
CORPORATE RESEARCHERS: WORK LIFE
11. In what capacity are you involved in marketing research and/or insights at your company?
I am not involved — I manage the process
I am part of a group that manages the process
0%
41%
59%
12. How has your overall budget or spend on marketing research changed in 2015 compared to 2014?
50%
40%
30%
20%
10%
0%Decreased by more
than 10%
Decreased by
between 5% and
10%
Decreased by less
than 5%
Stayed the same
Increased by less
than 5%
Increased by
between 5% and
10%
Increased by more
than 10%
11%9%
5%
44%
11% 11% 9%
13. How has your budget or spend for outsourcing marketing research changed in 2015 compared to 2014?
50%
40%
30%
20%
10%
0%Decreased by more
than 10%
Decreased by
between 5% and
10%
Decreased by less
than 5%
Stayed the same
Increased by less
than 5%
Increased by
between 5% and
10%
Increased by more
than 10%
10%11%11%
46%
3%8%
11%
“ The problem is when transactional data contradicts the market research conclusions. Or the research data comes to the same conclusions at a higher cost and much later. Funding will increasingly favor big data solutions.”
“ There are certain questions that you can only answer if you ask. These other data sources can only approximate the answers.”
“ Big data can tell us WHAT but it can rarely tell us WHY. Big data tells us a user spends 2.5 minutes on a Web page but is it because the page is so compelling or because the page is so confusing? That’s where marketing research wins: It adds the context. And in a day and age of abundant data, context has never been more important than it is now. Perhaps MR practitioners need to rename themselves: context providers (ha).”
Context providers, eh? That actually has a nice ring to it.
Note: The corporate research report work life survey was conducted online from June 25 to July 14, 2015 among pre-qualified corporate marketing research (client-side) subscribers of Quirk’s. In total we received 810 responses from which we had 691 usable qualified responses. An interval (margin of error) of 3.7 at the 95 percent confidence level was achieved. (Not all respondents answered all questions.)

CORPORATE RESEARCHERS: VENDOR RELATIONSHIPS
Corporate Research Report // www.quirks.com/CorporateResearchReport16
AAs part of the corporate researcher work life survey we of course had to pose some questions about vendors.
Ah yes, vendors. You love them. You hate them. You can’t live without them.
One open-ended question asked researchers to elaborate on a part of their job that they wished their vendors had a better understanding of and the other asked them to describe a time when a vendor came up short.
What did respondents wish vendors knew about their work?
“ The last-minute nature of corporate life. I feel super unorganized when I come to them last-minute asking for a change. I wish they knew it wasn’t me but rather [due to] requests coming from elsewhere in the organization.”
“ The political complexity of my organization and the impact that has on the design, development, deployment, interpretation and reporting of research.”
“ I think most of our research vendors understand that it comes down to time/scope/cost and that we are accountable to our clients and when things get messed up, it’s not just me or my team that is impacted.”
“ I wish that all of our vendors had a better understanding of our business and the issues we face. We strive to develop strong ongoing relationships with vendors so that they can develop a better understanding in this area.”
“ That there are hundreds/thousands of them out [selling] the same tools. That they have five minutes to impress me but as part of that five minutes, there better be a discussion on pricing.”
“ I don’t care if they are full-service. Quit trying to cram absolutely everything they can do into a presentation or phone call. Pick a focus for the meeting/call/Webinar and demonstrate expertise and ability to transition a case study to other industries.”
“ That I don’t have time to field their ‘toss a noodle against a wall and see what sticks’ cold-calls. I get 5-8 cold-calls/e-mails a day with vendors wanting to set up a meeting so I can tell them all about our business needs and they can tell me how they can do everything. Cold-call voice mails are a complete waste of their time.”
“ All the red tape and layers to do ANYTHING or get anything approved to move forward.”
“ I wish I would receive two reports – one for me, the client research, with all the detail including crosstabs, and one for presenting that REALLY boils down the learning to an easily-digestible story that we can take action on.”
“ That I am busy, so don’t waste my time casting big nets for business. The worst are suppliers who cold-call with e-mail and ‘proactively’ choose a date and time for a meeting that they would like to have right off the bat, without asking if I would like to meet.
The psycho sales VP and other vendor-related tales

CORPORATE RESEARCHERS: VENDOR RELATIONSHIPS
www.quirks.com/CorporateResearchReport // Corporate Research Report 17
That requires me to respond and waste time trying to figure out who they are.”
“ Young, inexperienced project directors on the supplier side go unsupervised and make too many rookie mistakes.”
“ Really understanding the struggles we have internally when trying to get management approval for new techniques or getting additional budget. Some of our vendors have this understanding because they’ve worked with us for years but others struggle with this.”
“ The complexity of the markets we operate in. Very few research vendors take the time to do research on the company and this makes them unable
to tailor their offering to meet our needs. When we come across research vendors who go the extra mile, it’s almost always guaranteed that we will do business with them.”
“ That the business doesn’t always care about the ‘pureness’ of the research.”
“ That I am knowledgeable on research techniques. Wish they would stop talking to me like I’m a newbie and don’t know what is going on.”
“ As a government agency, our needs are very different from a for-profit organization. The insights we’re looking for are all about what customers really want and how we can offer the best possible service for all our customers. [Their] insights
about ‘return business’ and being ‘top of mind’ are evidence that the vendors are merely repeating phrases they often use for other customers, rather than really giving thought to the business and research objectives we have provided.”
Dropped the ball For the section on vendors coming up short, the questionnaire offered some response choices to help give a shape to some of the ways providers had dropped the ball.
At 56 percent, vendors over-promising and under-delivering was chosen the most, followed by a project being handled by low-level staffers (51 percent), the vendor not taking the time to understand the client’s business (50 percent), poor
Our local staff, including on-site call center, is here to ensure quality from proposal to final report or any service in between (data collection, moderating, auditing, facility rental, etc.)
CRC is the highest rated Overall as well as for the categories of Personnel, Facility and Value (among Top Rated facilities in Columbus: Impulse Survey).
Four suites plus a large, multi-purpose room to serve any data collection need.
We manage local and national projects with partners around the country.
One call really does it all.
$250 off
(any project that includes room rental
and recruiting [incidence of 10% +] or
moderating).
Your Complete Connection for Market Research
2323 W. Fifth Avenue | Suite 150 | Columbus, OH 43204614.220.4120 | [email protected] | www.crcmr.com
One per customer, per study.

CORPORATE RESEARCHERS: VENDOR RELATIONSHIPS
Corporate Research Report // www.quirks.com/CorporateResearchReport18
communication (39 percent), not taking the time to understand the project’s needs (36 percent) and, at 35 percent, a tie between vendors missing deadlines and perceived data integrity issues.
Asked to elaborate on problems they have experienced with research suppliers, our respondents didn’t hold back.
“Psychotic sales VP at a major research house is apparently never checked on or managed and just BS’s her way through her job. The worst.”
“ Copying key sections of a report to us from a report to a different client and not realizing that the lead brand manager had worked at both companies.”
“ Where to start? I honestly cannot tell you how many times I’ve been disappointed in my primary external vendor in the past two years (for a large-scale tracking study). Issues with their project management and deliverables have moved them
from handling about 90 percent of the project (from data collection to reporting, to management) to about 10 percent. They have offered up ‘special analyses.’ When we’ve taken them up on it, it takes 12-16 weeks to provide results, which is simply too late to have an impact.”
“ Vendor tried to talk me into being non-compliant in a heavily regulated industry. Um, no.”
“ This past year I had a vendor show up for a presentation of research results without having copies of the presentation or something to project the presentation on. She didn’t bring her laptop. She looked at me and asked me how we were going to present the information. I had to run back to my desk and get my laptop, set it up in the room and, in doing so, start the presentation late. My whole team was wondering why there was this delay. This was not a new person; she is an experienced researcher. Needless to say, I haven’t done anymore research with this company. They don’t seem to
understand why not, even though I’ve explained.”
“ There is a very strong tendency to say yes early on and then force-fit an off-the-shelf solution when a more customized, nuanced approach is needed. Also, sending in the smart VP new business development guy who knows all about retail and then offloading the project to lower-level, less-experienced staff right after the project is sold in.”
“ Researchers on the client side have had to become a lot more nimble in how we get things done but the bigger research vendors haven’t followed suit. They continue to be constrained by their legacy siloed processes where the client team needs to pass off a simple request to the data analytics team, who will get to our request when the conveyor belt of other client requests are fulfilled.”
“ A few years ago, I worked with a start-up company that has an amazing new technology for research. They had
Vendor over-promised and under-delivered
Project handled by low-level staff
The vendor didn’t take the time to understand our business
The vendor had poor communication
The vendor didn’t take the time to understand the project needs
Data integrity issues
The vendor missed deadlines
The tools the vendor suggested weren’t right for the project
Other
1. Thinking of times when your research vendors have come up short on a project, what have been some of the main problem areas?
0% 10% 20% 30% 40% 50% 60%
56%
51%
50%
39%36%
35%
35%
14%
12%

CORPORATE RESEARCHERS: VENDOR RELATIONSHIPS
www.quirks.com/CorporateResearchReport // Corporate Research Report 19
invested a lot in their technology but hadn’t invested in hiring experienced marketing research professionals. It was obvious from the data issues and the poorly-written research report that the study had been conducted by a low-level staff member. They had cut corners by hiring researchers fresh out of college who didn’t fully understand how to properly execute the research.”
“ Vendors often begin with the line that 80 percent of business is the same. We often debate that about our industry and our business, as we believe we’re a bit unique both as an industry and a business. Even if vendors understood this point, they often miss a critical difference and don’t think to ask
whether something makes sense prior to implementing it in their research. More than once, this has led to inappropriate assumptions and questionable results.”
“ Submitting a low bid for a project up front but then nickel-and-diming on extra costs (tabs, data cuts, getting the right sample) on the back end.”
‘Never had an issue’Still, for all the problems cited above, there were some respondents who found little to complain about.
“ I have never had an issue with our research vendor.”
“ We like to work with the same small group of vendors when possible so that problems don’t happen twice. They learn our business, customers and our complicated organization.”
“ Haven’t really had these problems in quite some time. Vendors don’t get to make these mistakes very often before they become former partners.”
“ When vendors come up short, it can also be the fault of the client side for not concisely articulating their needs.”
Advance your career and open new doors in a fast-growing
field with MSU’s Master of Science in Marketing Research.
Only the Broad School offers both full-time and part-time
MSMR programs. And both offer the same courses, faculty
and rigorous academic standards.
Choose the one that fits your career and your life.
•Interact with leaders in marketing research, including
senior-level executives
•Participate in real-world marketing research and
consulting projects
•Become part of an industry with job needs forecasted to
grow 32 percent through 2022
Be on track to become a member of the next generation
of business and marketing leaders. To learn more, contact
Dr. Richard Spreng, [email protected], or visit
http://marketing.broad.msu.edu/msmr/.
Full-time or part-time to fit your time
Master of Science in Marketing Research
Master of Science in Marketing Research Broad College of Business
Corporate Research Report // www.quirks.com/CorporateResearchReport20
CORPORATE RESEARCHERS: SALARY AND COMPENSATION
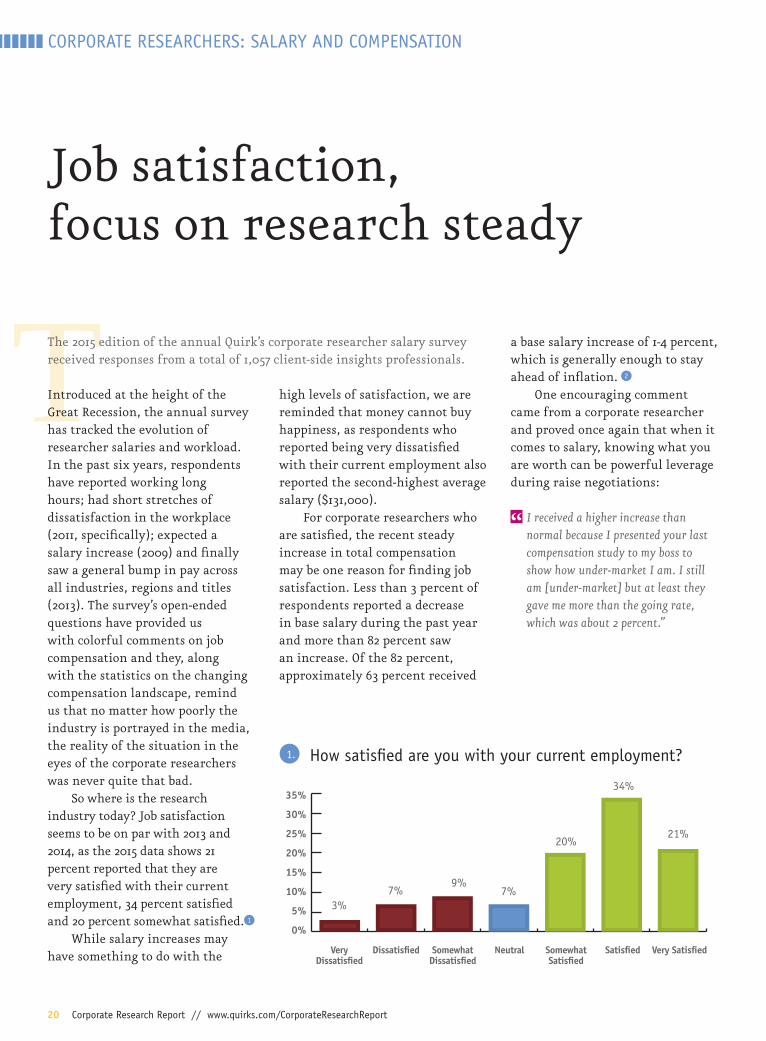
TThe 2015 edition of the annual Quirk’s corporate researcher salary survey received responses from a total of 1,057 client-side insights professionals.
Introduced at the height of the Great Recession, the annual survey has tracked the evolution of researcher salaries and workload. In the past six years, respondents have reported working long hours; had short stretches of dissatisfaction in the workplace (2011, specifically); expected a salary increase (2009) and finally saw a general bump in pay across all industries, regions and titles (2013). The survey’s open-ended questions have provided us with colorful comments on job compensation and they, along with the statistics on the changing compensation landscape, remind us that no matter how poorly the industry is portrayed in the media, the reality of the situation in the eyes of the corporate researchers was never quite that bad.
So where is the research industry today? Job satisfaction seems to be on par with 2013 and 2014, as the 2015 data shows 21 percent reported that they are very satisfied with their current employment, 34 percent satisfied and 20 percent somewhat satisfied. 1
While salary increases may have something to do with the
high levels of satisfaction, we are reminded that money cannot buy happiness, as respondents who reported being very dissatisfied with their current employment also reported the second-highest average salary ($131,000).
For corporate researchers who are satisfied, the recent steady increase in total compensation may be one reason for finding job satisfaction. Less than 3 percent of respondents reported a decrease in base salary during the past year and more than 82 percent saw an increase. Of the 82 percent, approximately 63 percent received
a base salary increase of 1-4 percent, which is generally enough to stay ahead of inflation. 2
One encouraging comment came from a corporate researcher and proved once again that when it comes to salary, knowing what you are worth can be powerful leverage during raise negotiations:
“ I received a higher increase than normal because I presented your last compensation study to my boss to show how under-market I am. I still am [under-market] but at least they gave me more than the going rate, which was about 2 percent.”
Job satisfaction, focus on research steady
1. How satisfied are you with your current employment?
35%
30%
25%
20%
15%
10%
5%
0%
Very Dissatisfied
Dissatisfied Somewhat Dissatisfied
Neutral Somewhat Satisfied
Satisfied Very Satisfied
3%7%
9%7%
20%
34%
21%
BUILD
REACH
ANALYZE
[email protected] (866) 872-4006
real-time data & reports
the right audience
your survey

Corporate Research Report // www.quirks.com/CorporateResearchReport22
CORPORATE RESEARCHERS: SALARY AND COMPENSATION
A variety of benefitsWhen it came to bonus or commission change in the past year, more than 85 percent of client-side researchers reported that they enjoyed a bonus increase or that their bonus stayed the same. Although less than 15 percent reported a bonus decrease, we received a number of comments that expressed the disappointment of stagnant or decreased bonuses:
“ Management changed over right before reviews and I got ZERO because I’m not visible enough.”
“ No bonus plan offered. No dividend, profit sharing or stock option that I participate in.”
“ Merit increases have been stagnant. Bonuses have not been paid out at full amount in three-plus years.”
“ Bonus [was] lower than usual due to poor corporate performance and upcoming merger.”
Knowing that company culture and other non-monetary benefits often increase happiness in the workplace, we dug into the comments in the compensation section of the survey. We were inspired by respondents who related the numerous benefits that accompany a positive company culture:
2. By what percent did your total compensation change in the following categories in the past year?
BASE salary change during the past year
BONUS (or commission) increase or decrease during the past year
DIVIDEND, PROFIT SHARING, or STOCK OPTION change in past year
Decrease by more than 10% Decrease by 6 - 10% Decrease by 1 - 5% Stayed the same
Increase by 1 - 5% Increase by 6 - 10% Increase by more than 10%
0% 10% 20% 30% 40% 50% 60% 70% 80% 90% 100%0 10 20 30 40 50 60 70 80 90 100
“ Weekly on-site massage therapist, weekly on-site counselor, sick rooms, a gym, mother rooms, free parking, annual corporate family party, annual Christmas party, daily food delivery service and team-building activities throughout the year (Thanksgiving bake-off, chili cook-off, etc.).”
“ Phone, discretionary bonuses, intangible benefits (dog at work, flexibility, etc.).”
Employment at a different companyAs the economy continues to recover, the likelihood of companies hiring
4. How likely is it that your company will hire additional market research employees in 2015?
25%
20%
15%
10%
5%
0%Very
UnlikelyUnlikely Somewhat
UnlikelyUndecided Somewhat
LikelyLikely Very
Likely
24%
15%
9% 10%
18%
10%
13%
3. How likely are you to seek employment at a different company this year?
25%
20%
15%
10%
5%
0%Very
UnlikelyUnlikely Somewhat
UnlikelyUndecided Somewhat
LikelyLikely Very
Likely
24%
16%
12%
16%14%
8%
11%

Great research. Deep perspective. Committed client service. crresearch.com
There’s a reason we’re a top-rated marketing insights agency.
We’ve been conducting great research for more than 50 years for some of the leading
brands in the world. Our clients know we supply more than just best-in-class data
and insights—we’re an extension of their research team. And, our whatever-it-takes
philosophy gives them the tools and confidence they need to make smarter business
decisions. For us, some things simply transcend numbers.
Emerge smarter.
Rated #1 Full-Service Market Research Provider and #2 Qualitative Market Research Provider2012 and 2013 Market Research Supplier Satisfaction Surveymarketresearchcareers.com

Corporate Research Report // www.quirks.com/CorporateResearchReport24
CORPORATE RESEARCHERS: SALARY AND COMPENSATION
additional market researchers has begun to stabilize. This year approximately 42 percent said it was very likely, likely or somewhat likely that their company would hire additional MR employees. Whether individuals are new to the industry, looking for a higher salary, better overall compensation or just a change of scenery, 11 percent of corporate researcher respondents reported that they are very likely to seek employment at a different company this year, 8 percent reported likely and 14 percent reported somewhat likely. In addition to this, approximately 17 percent of respondents reported being with their company less than a year and just over 30 percent reported being with the company one-to-two years. 3 4
If researchers are looking for new opportunities, they can bring a wealth of experience with them. Approximately 59 percent of respondents reported 11 or more years of experience in marketing research (with 14 percent reporting 25+ years of experience). Master’s degrees are also the order of the day: 53 percent of respondents shared that they are graduates of a master’s program (6 percent reported having a Ph.D.). When asked if they held a marketing research certification (RIVA, Burke Institute, PRC, etc.), 22 percent of respondents said yes. 5 6
Possibly due to the reported job changes and plans for future movement, we saw many comments discussing new jobs resulting in pay and bonus increases. On the flip side, we also found it interesting that a few respondents reported a willingness to take a pay cut or live on a lower salary to get a foot in the door of a specific industry or work within a nonprofit:
“ I changed jobs and took a pay cut. This was necessary because the industry of my new employer [is] reluctant to hire someone mid-career without industry experience.”
“ Working for a nonprofit is equated with low pay.”
“ Lower than industry norm for client-side director but work for nonprofit, so OK with that.”
Focus on researchRespondents work in a variety of industries, from agriculture to utilities and energy, with health care/pharma, consumer goods and banking/financial as the best-represented fields. The most-cited job titles/roles included market research manager (291), market research director/senior director (214), senior research analyst (122), customer insights manager (94) and research analyst (92). 8
7. How much of your work time is spent conducting or coordinating and analyzing marketing research?50%
40%
30%
20%
10%
0%
0% <15% 15%-25% 26%-50% 51%-75% >75%
53%
39%
1%
2%7% 9%
19%22%
42%
6%Ph.D. Graduate
College Graduate
Master’sProgramGraduate
High School Graduate
5. What is the highest level of education you have completed?
77%
23%
Yes
No
6. Do you hold a professional or industry certification related to marketing research?(Riva, Burke Institute, PRC, Principles in Marketing Research, etc.)

www.quirks.com/CorporateResearchReport // Corporate Research Report 25
CORPORATE RESEARCHERS: SALARY AND COMPENSATION
The view from the MR job sidelines As part of the 2015 researcher salary survey, Quirk’s asked respondents who indicated that they were unemployed an open-ended question on what they believe is the greatest difficulty in finding employment in today’s MR job market. While optimism is rising within the marketing research industry and the economy as a whole, the responses prove that department downsizing, ageism and other employment obstacles remain plentiful.
From shifting budgets to downsizing – or eliminating – departments, the comments point to the surplus of highly-experienced researchers pounding the pavement:
“ I thought that a PhD would be the icing on the cake in the marketing research industry but I think it’s actually made many employers think twice about hiring me.”
“ Had made my way up the career ladder, so I had a high income and there are fewer jobs for that level.”
“ Companies have shifted budgets from marketing research to digital and business analytics.”
Location and local economies play a part in the job-search struggle and several respondent comments highlight their desire to move and increase their job prospects, as well as their inability to do so:
“ Over-supply of marketing research talent in the Chicago market. I’m considering relocation.”
“ Economy is not improving and I am unable to move, and the market is not good for market research.”
Of those surveyed who claimed an unemployed status, 62 percent were above the age of 46. Ageism is still rampant in the industry, accompanied by the feared “overqualified” status:
“ Market research is being dominated by Millennial generation workers.”
“ I am senior but looking for work in small start-up agencies as they are doing the interesting new MR work. But – naturally – they’re not so keen to take on the overhead that comes with experienced personnel.”
“ My age, experience and recommendations: No one wants to pay at the top of the pay scale, not that I am asking them to.”
“ I’m about to turn 52, and since I was 49 I’ve been receiving age-related comments from recruiters and during interviews. Within the last two months, two recruiters told me straight out that I have impressive experience but my age is a problem.”
Each year we ask corporate researchers how much work time is spent conducting, coordinating and analyzing marketing research. This year approximately 42 percent of respondents reported spending 75 percent or more of their time dedicated to MR. It is good to see that researchers are able to focus on the research during a time when many claim that the changing economy, big data, new technology and social media have disrupted the industry. Research analysts cited the highest average time spent conducting or coordinating and analyzing MR, followed by senior research analysts, market research managers and customer insights managers. 7
It’s exciting to see corporate researchers flourishing in their positions. We hope our readers continue to find satisfaction – in growing salaries and positive company cultures – in the years to come.
Note: The market research salary and compensation survey was conducted online from May 12 to June 9, 2015 among Quirk’s subscribers. In total we received 3,043 responses. We received 1,057 usable surveys from client-side researchers (corporate market research) and 1,496 usable surveys from provider-side researchers (market research company employees). An interval (margin of error) of 1.7 at the 95 percent confidence level was achieved. (Not all respondents answered all questions.) For complete survey results, including provider-side data, with crosstabs visit: www.quirks.com/salary.

Corporate Research Report // www.quirks.com/CorporateResearchReport26
CORPORATE RESEARCHERS: SALARY AND COMPENSATION
8. Compensation by Industry
Count Base Bonus* Dividends* Other* Total
Advertising/Public Relations 49 $113,163 $3,837 $9,918 $2,041 $128,959
Agriculture 5 $115,000 $20,200 $1,400 $600 $137,200
Automotive 16 $108,063 $13,625 $3,875 $2,188 $127,750
Banking/Financial 89 $114,820 $23,056 $5,225 $2,876 $145,978
Building Materials/Products 4 $102,000 $4,750 $1,500 $500 $108,750
Computer Hardware/Software 14 $117,929 $13,857 $10,643 $2,714 $145,143
Construction/Housing 4 $91,000 $16,000 $15,500 $0 $122,500
Consulting 25 $109,280 $10,080 $6,920 $1,920 $128,200
Consumer Goods 107 $108,178 $10,439 $6,701 $3,589 $128,907
Education 41 $83,951 $4,732 $146 $4,780 $93,610
Entertainment 33 $121,606 $23,939 $22,636 $6,606 $174,788
Food/Beverage 44 $106,864 $12,273 $7,114 $5,977 $132,227
Government 16 $78,625 $1,500 $0 $1,063 $81,188
Health Care/Pharmaceuticals 124 $109,661 $15,887 $5,734 $4,766 $136,048
Hospitality (hotels, restaurants, etc.) 14 $104,429 $8,429 $13,357 $2,143 $128,357
Insurance 74 $102,459 $15,311 $3,081 $473 $121,324
Manufacturing 61 $99,984 $9,902 $4,475 $1,803 $116,164
Media/Publishing/Information 70 $92,471 $9,814 $2,700 $3,471 $108,457
Non-Profits 48 $84,208 $2,500 $6,750 $2,792 $96,250
Retail 54 $97,500 $13,667 $4,093 $926 $116,185
Technology/IT/Web 47 $113,979 $13,574 $12,511 $3,340 $143,404
Telecommunications 19 $99,737 $11,105 $9,263 $17,158 $137,263
Transportation 10 $87,200 $6,400 $300 $700 $94,600
Travel 19 $79,632 $7,579 $3,263 $737 $91,211
Utilities/Energy 24 $98,042 $9,625 $750 $5,417 $113,833
Other 46 $83,957 $9,000 $1,739 $7,587 $102,283
Average 1057 $102,730 $12,133 $5,916 $3,535 $124,314
9. Compensation by Annual Revenue/Sales
Count Base Bonus* Dividends* Other* Total
< $1 Million US dollars 28 $76,000 $3,250 $8,250 $1,607 $89,107
$1M - $3M 26 $82,308 $5,308 $9,308 $6,308 $103,231
$3M - $6M 28 $81,607 $3,679 $4,964 $1,000 $91,250
$6M - $10M 17 $83,588 $5,706 $1,471 $4,412 $95,176
$10M - $50M 79 $90,380 $4,570 $3,835 $2,557 $101,342
$50M - $100M 48 $88,813 $7,271 $1,250 $5,771 $103,104
$100M - $300M 80 $102,500 $9,463 $4,925 $1,463 $118,350
$300M - $500M 65 $95,508 $11,000 $4,477 $1,031 $112,015
$500M - $1 Billion 111 $97,414 $10,171 $1,459 $2,937 $111,982
>$1 Billion US dollars 497 $116,376 $17,535 $8,740 $4,400 $147,052
Average 979 $104,634 $12,722 $6,324 $3,563 $127,243
For a complete breakdown of compensation for client job titles, including crosstabs by age, gender, location and more, along with vendor-side salary data, visit www.quirks.com/salary.
*Bonus defined as bonus or commission for 2014 in U.S. dollars.*Dividends defined as compensation in the form of dividends, stock options or profit sharing in U.S. dollars for 2014.*Other defined as annual value of other compensation (company car, health club membership, mobile phone etc.) in U.S. dollars.

Modern day research deserves modern day solutions. Visit www.Quester.com to learn how artificial intelligence brings the best of quant and the best of qual into a
single survey. You’ll be blown away.
quester.com

Corporate Research Report // www.quirks.com/CorporateResearchReport28
CORPORATE RESEARCHERS: SALARY AND COMPENSATION
10. Compensation by Region
Count Base Bonus* Dividends* Other* Total
North East (CT, MA, ME, NH, RI, VT) 93 $114,215 $13,882 $4,000 $7,043 $139,140
Mid Atlantic (NJ, NY, PA) 149 $124,490 $20,886 $7,208 $4,497 $157,081
East North Central (IL, IN, MI, OH, WI) 190 $100,484 $9,921 $4,874 $3,100 $118,379
West North Central (IA, KS, MN, MO, NE, ND, SD)
111 $95,315 $9,766 $5,721 $4,198 $115,000
South Atlantic (DC, DE, FL, GA, MD, NC, SC, VA, WV)
165 $98,030 $9,885 $4,109 $1,564 $113,588
East South Central (AL, KY, MS, TN) 25 $76,000 $3,520 $200 $6,520 $86,240
West South Central (AR, LA, OK, TX) 54 $106,241 $15,278 $18,630 $1,426 $141,574
Mountain (AZ, CO, ID, MT, NM, NV, UT, WY) 48 $85,583 $6,750 $4,542 $3,167 $100,042
Pacific Coast (AK, CA, HI, OR, WA) 129 $119,884 $13,783 $7,682 $2,767 $144,116
Canada 24 $85,292 $13,333 $2,417 $5,792 $106,833
Mexico 2 $24,000 $13,000 $2,000 $4,500 $43,500
Central and South America 3 $52,333 $1,333 $0 $3,000 $56,667
Eastern Europe 6 $30,500 $1,500 $0 $1,333 $33,333
Western Europe 23 $80,609 $7,609 $2,609 $2,478 $93,304
Asia 19 $59,105 $12,211 $11,368 $4,421 $87,105
Middle East 3 $68,000 $4,000 $0 $6,667 $78,667
Africa 6 $22,167 $2,333 $0 $1,500 $26,000
Australia/New Zealand 7 $87,000 $2,143 $1,429 $2,000 $92,571
Average 1057 $102,730 $12,133 $5,916 $3,535 $124,314
11. Compensation by Years at Current Job
Count Base Bonus* Dividends* Other* Total
< 1 year 178 $94,326 $8,539 $4,011 $2,129 $109,006
1 - 2 311 $100,913 $12,402 $5,640 $3,682 $122,637
3 - 5 263 $106,498 $14,776 $7,582 $3,430 $132,285
6 - 10 166 $106,018 $13,217 $7,910 $3,120 $130,265
11 - 15 55 $111,182 $11,382 $2,982 $9,036 $134,582
16 - 25 37 $131,811 $14,297 $6,811 $7,054 $159,973
>25 7 $86,571 $7,571 $2,429 $571 $97,143
Average 1017 $103,618 $12,453 $6,104 $3,644 $125,820
12. Compensation by Number of Employees Supervised
Count Base Bonus* Dividends* Other* Total
0 (None) 542 $90,506 $7,389 $3,804 $2,530 $104,229
1 - 2 274 $103,022 $11,263 $3,697 $3,215 $121,197
3 - 5 121 $127,810 $22,488 $10,785 $5,942 $167,025
6 - 10 56 $141,214 $32,482 $18,107 $9,679 $201,482
> 10 34 $165,941 $31,559 $24,618 $5,765 $227,882
Average 1027 $103,502 $12,370 $6,067 $3,611 $125,551
METHOD NOTESVerbatim insights from this year’s survey
“This new stuff like gamification, mobile
surveys, facial recognition, etc., is way overblown.
They’re just different ways to do things. I’m more
interested in the thinking that goes into the studies
and the valuable and insightful results.”
*Bonus defined as bonus or commission for 2014 in U.S. dollars.*Dividends defined as compensation in the form of dividends, stock options or profit sharing in U.S. dollars for 2014.*Other defined as annual value of other compensation (company car, health club membership, mobile phone etc.) in U.S. dollars.
MR

I’M NOT SURE WHAT TO DO WITH THIS. THIS IS THE ACTUAL SIZE. IT’S THE WRONG ASPECT RATIO TO EXPAND IT TO FIT THE PAGE AND
THEY DIDN’T LEAVE ANY BLEED SPACE EITHER. HOW DO YOU USUALLY
HANDLE THIS?
RegisteR Now! Call +1-706-542-3537 or 800-811-6640 ◆ principlesofmarketresearch.org
Prepare for success now and in the future.
Comprehensive, self-paced, and affordable online learning from the market leader
Do you have the skills to stand out from the crowd?
The courses are PRC approved.

Corporate Research Report // www.quirks.com/CorporateResearchReport30
CORPORATE RESEARCHERS: SALARY AND COMPENSATION
13. Compensation by Job Title
Count Base Bonus* Dividends* Other* Total
Owner/Partner 10 $99,600 $0 $44,900 $16,400 $160,900
President/CEO/COO 2 $227,500 $37,500 $20,000 $2,500 $287,500
Senior Vice President or Vice President 59 $180,203 $37,729 $22,085 $8,102 $248,119
Market Research Director / Senior Dir. 214 $135,383 $23,458 $11,009 $3,668 $173,519
Market Research Manager 291 $100,230 $10,364 $3,055 $2,986 $116,636
Account Executive / Manager 4 $68,750 $10,250 $0 $0 $79,000
Customer Insights Manager 94 $101,511 $8,713 $6,043 $2,277 $118,543
Director of Marketing 16 $114,500 $12,563 $13,375 $23,625 $164,063
Marketing Manager 14 $69,714 $5,071 $1,643 $8,071 $84,500
Brand Manager or Product Manager 5 $89,400 $6,400 $1,400 $1,000 $98,200
Communications Director / Manager 3 $75,000 $0 $0 $0 $75,000
Project Manager 28 $81,286 $5,786 $1,393 $5,179 $93,643
Business Development 4 $81,250 $7,500 $0 $0 $88,750
Senior Research Analyst 122 $78,180 $4,549 $1,344 $1,287 $85,361
Research Analyst 92 $59,522 $1,457 $717 $3,620 $65,315
Business / Market Analyst 29 $61,759 $3,138 $586 $1,966 $67,448
Statistician 7 $99,143 $2,286 $571 $1,143 $103,143
Research Assistant 5 $36,800 $2,800 $800 $1,200 $41,600
Sales / Account Representative 2 $21,500 $5,000 $0 $0 $26,500
Administrator / Coordinator 11 $56,091 $545 $545 $91 $57,273
Consultant 16 $83,875 $5,563 $1,438 $375 $91,250
Other 29 $95,897 $7,483 $2,793 $414 $106,586
Average 1057 $102,730 $12,133 $5,916 $3,535 $124,314
14. Compensation by Years in Marketing Research
Count Base Bonus* Dividends* Other* Total
< 1 year 27 $59,852 $2,852 $2,815 $185 $65,704
1 - 2 48 $66,958 $3,729 $2,896 $1,542 $75,125
3 - 5 105 $70,571 $4,067 $1,295 $6,067 $82,000
6 - 10 236 $88,644 $7,517 $4,318 $2,665 $103,144
11 - 15 206 $105,718 $12,995 $6,500 $2,267 $127,481
16 - 25 251 $123,056 $16,665 $9,127 $5,932 $154,781
>25 145 $135,179 $23,166 $8,359 $2,779 $169,483
Average 1018 $103,562 $12,452 $6,102 $3,639 $125,754
*Bonus defined as bonus or commission for 2014 in U.S. dollars.*Dividends defined as compensation in the form of dividends, stock options or profit sharing in U.S. dollars for 2014.*Other defined as annual value of other compensation (company car, health club membership, mobile phone etc.) in U.S. dollars.
METHOD NOTESVerbatim insights from this year’s survey
“Predictive analytics has allowed us to
streamline data into manageable/actionable
bursts of activity.”
MR

www.quirks.com/CorporateResearchReport // Corporate Research Report 31
CORPORATE RESEARCHERS: THE EVOLVING CORPORATE RESEARCHER
EESOMAR’s annual Global Market Research (GMR) report, now in its 27th edition, examines market development and performance trends and incorporates interviews with industry insiders and experts to zoom in on specific topics and issues impacting the marketing research industry.
One such issue is the role of the corporate researcher, which is evolving almost as fast as the industry itself. New companies are contributing data to the corporate arena but do not necessarily define themselves as researchers or are presenting and processing data in radically new ways. In the latter cases, some established and traditional companies, who believe research should be done in a certain way,1 view firms such as Sensum as muddying market research waters. As a result, traditional methods and skill sets are not always considered to match up to end-client expectations, leading to questions around the value of research and thus a reduced confidence in research’s ability to make valid and valued contributions.
This is a development, which has (primarily) become evident in the FMCG sector – traditionally
the biggest buyer of research – and the one wherein speed of information and thus speed-to-market is generally accepted as the key competitive advantage. There is evermore pressure upon corporate researchers to provide quick, simple results to clients rather than reaching for more traditional methodological practices.
This particular factor in the evolution of corporate research’s role and value within the industry was elaborated on in a Quirk’s article by Jake Wolff (“The pressure for faster insights in MR”), where he commented that: “The application of technology in the market research industry, coupled with the need for speed and thirst for immediately-actionable insights, means that a large and growing group of MR clients are emerging that do not fit within the traditional MR model.”
There are instances where such research data is utilized to post-validate company performance rather than explore new opportunities or guide corporate decision-making. This reduced value perception of research has led to the corporate researcher position becoming a fragile one – and there are many recent examples of the research function being the first to suffer from layoffs and headcount reduction, when company performance falters. This is somewhat ironic, as one would assume research would be the very vehicle to help such companies in finding ways to reverse their faltering performance. But in this context, researchers do need to “sell” their value proposition in a much more efficient way.
Conservative approaches to the business, combined with the changing nature of the industry and added pressures to evolve quickly, are at the heart of what certain professionals consider to be a crisis in market research today.
As research becomes more global, as legislation becomes
The evolving corporate researcherBy Bel Parnell-Berry, ESOMAR market intelligence analyst

Corporate Research Report // www.quirks.com/CorporateResearchReport32
CORPORATE RESEARCHERS: THE EVOLVING CORPORATE RESEARCHEREsomar
increasingly restrictive across jurisdictions and competitive advantage becomes more prized, and as technology continues to advance, the role of the corporate researcher will actually become more complex – but also significantly more important!
Technological advances do make data more available and allow for quicker, faster, DIY solutions to research but can a machine determine what is “right”? After all, two ways of asking the same question will produce vastly different results; will a salesperson know which one to ask the machine to use? As important and as valuable as big data is, it requires context and saliency to be meaningful; will a marketer understand which data sources are most relevant to the problem at hand?
Many would suggest “yes” and would support the (rather worrying) idea that market research is just a process to be automated, rendering researchers themselves obsolete. But if this were true, then surely we could automate entire accounting departments, as they are only adding numbers, right? In reality, we don’t see entire accounting departments being removed from operating businesses and we DO see a wide variety of new players contributing new methods that record and report consumer and citizen insights. These new players are discovered and introduced to their company by the corporate researcher, as part of their role is now to seek out the latest methods for generating true insight.
Interestingly, the last five GMR reports have shown that qualitative
research has grown as fast as – if not faster than – the overall market, implying that even within an industry that asks for faster, cheaper, automated results, there is still room for complex, exploratory methods. Causality is NOT easy to understand!
It is striking that 11 percent of all market research spending goes to fund qualitative offline group discussions2 and while we should note that not all countries submit their method-split data to the GMR, the consistency of this average is very telling. Furthermore, qualitative research may not be the traditional route for many corporate researchers but it is a route nonetheless that could help them underline their unique importance to a business and remain relevant and compelling within the commercial arena in spite of the rise of the kind of automation that often better suits the tight deadlines of certain firms.
Regionally – while the research communities from emerging markets are literally changing the face, language and culture of corporate research – certain markets remain the bedrock of growth and innovation. The U.S. has been a pioneer of MR in many regards, from the consumerism boom of the 1950s to the huge, aforementioned technological transformations in research due to online developments. The U.S. was the biggest single market in the industry in the last GMR and regained the leading growth position from APAC (specifically China).
Will this year’s report consolidate that performance?
Or will the U.S. growth – as new figures suggest – be slowing down? African and Latin-American regions continue to expand. These regions are becoming increasingly valuable for companies to sustain their growth ambitions and thus corporate researchers will be needed for their expertise in guiding an improved understanding of these markets and their consumers.
These regions have long been high on ESOMAR’s agenda, due to the increasing influence and role they will play in the global arena in the years to come as well as the wealth of diverse perspectives and insights they are sure to provide. Methodologies and analytical processes may differ in certain locations due to limitations on technology, however this only serves to continue to show how important human market research continues to be in a global context.3
Lastly, corporate researchers have an important role to play in fostering the next generation; everyone involved in research is calling out to young researchers
Technological advances do make data more available and allow
for quicker, faster, DIY solutions to research but can a machine determine
what is “right”?
www.quirks.com/CorporateResearchReport // Corporate Research Report 33
CORPORATE RESEARCHERS: THE EVOLVING CORPORATE RESEARCHER
to join the industry and provide new blood, as the 2014 GMR’s Big Opportunities chapter illustrated.4 The chapter showed individuals in their early-to-mid-20s who are enjoying exciting and meaningful careers and appealed to their peers to get in on the action. Recent surveys showcase the market research industry and the best of what it has to offer to students and young professionals.5
From a practical perspective, market research needs young minds to stay on top of the fast-paced technological changes that junior researchers have grown up alongside. We accept that the attraction of working with a brand-name company tends to be favored above working with an agency but the corporate researcher is an important evangelist to extol the benefits of following a research career. Our profession recognizes the necessity of pumping fresh energy into the business in order to maintain momentum, inspiration and relevance. The same could be said with regard to the way we actually approach projects within the industry as well as how we allow ourselves to be viewed externally.
Despite any negative perceptions however, our market research industry itself continues to grow – according to topline figures published in the GMR last year – reiterating that corporate researchers have a uniquely important role and that there is a confirmed place for their skills. As with all professions, however, we should be open to evolving in a way that meets the new demands and approaches being presented to us. We can and should also do more to
seek out the sectors actively valuing our knowledge and tools. In this way, we can continue to show our worth and rejuvenate what we have to offer. We clearly we have so much more to give.
REFERENCES
1. ESOMAR (2014) Global Market Research: An ESOMAR Industry Report. Amsterdam: ESOMAR, page 58.
2. Ibid, pages 122-123. 3. Ibid, pages 41-43. 4. Ibid, pages 64-70. 5. www.wearefringefactory.com/fringe
We’re all talk
We’ve been on the phone for 25 years!
CALL US: 1.800.743.6443 | TELEPOLL.NET
M A R K E T R E S E A R C H
M A R K E T R E S E A R C H

Corporate Research Report // www.quirks.com/CorporateResearchReport34
C+R Research Services, Inc. ............. p. 23312-828-9200 • www.crresearch.com
Clear Seas Research ..................Back Cover248-786-1683 • www.clearseasresearch.com
Complete Research Connection ......... p. 17614-220-4120 • www.crcmr.com
Critical Mix ..................................... p. 5800-651-8240 • www.criticalmix.com
FocusVision ..................................... p. 3800-923-5523 • www.focusvision.com
Instant.ly ..................................... p. 21818-524-1218 • www.instant.ly
Michigan State University ................ p. 19517-432-6389 • www.broad.msu.edu/msmr
MindField Online ............................ p. 11304-343-9650 • www.mindfieldonline.com
Precision Opinion ............Inside Front Cover702-483-4000 • www.precisionopinion.com
Principles of Marketing Research ...... p. 29800-325-2090 www.principlesofmarketingresearch.org
Quester ........................................ p. 27877-232-1005 • www.Quester.com
Research Now ................. Inside Back Cover888-203-6245 • www.researchnow.com
SSI ................................................ p. 9203-567-7200 • www.surveysampling.com
Telepoll Market Research ................. p. 33 416-977-0608 x222 • www.telepoll.net
Quirk’s would like to thank the following companies and organizations whose financial support made the Corporate Research Report possible:

© 2015 Research Now Group, Inc. All rights reserved.
Voted Best Online Sample Provider* in every category for the second year in a row.
See what makes us #1.
Others Talk About Quality.
We Prove It.
ResearchNow.com/quirks
*Source: 2015 Annual Survey of Market Research Professionals. (MarketResearchCareers.com)

www.clearseasresearch.com
C E N T R A L L O C A T I O N T E S T I N G | E X E C U T I V E I N T E R V I E W S | F O C U S G R O U P S | S U R V E Y S
TRUST IN RESEARCHStrategic, full-service market research solutions focused on measuring... • BRAND POSITION — attitudes, awareness, usage, image • CUSTOMER EXPERIENCES — satisfaction, wants/needs, likelihood to recommend, loyalty/advocacy • MARKETING EFFECTIVENESS —target audience reach, message impact, ability to cause action • PRODUCT DEVELOPMENT —concept testing, product needs identifi cation, nomenclature, pricing, marketing
To know what we know, please contact us at 248-786-1683 or [email protected]
• BUILDING ENVELOPE • ARCHITECTURE • PLUMBING
• HVAC • ENGINEERING• ROOFING
• FOOD & BEVERAGE• GAMING• MANUFACTURING
• PACKAGING• SECURITY• DISTRIBUTION/LOGISTICS
BUSINESS-TO-BUSINESS & CONSUMER INDUSTRY EXPERTISE
CSR0715_Ads_8x10.875.indd 1 7/29/15 3:09 PM


![FBO Survey 2019: Facilities serve growing market€¦ · “This includes some standout [increases] of more than 8 percent year-over-year, by nearly 20 percent of the FBOs reporting.”](https://img.dokumen.tips/doc/110x75/5f4e52edbae70503822baaac/fbo-survey-2019-facilities-serve-growing-market-aoethis-includes-some-standout.jpg)