Embed Size (px)
Citation preview

Corporate Social Responsibility and Stakeholder Governance
Around the World
Hoje Jo*, Moon H. Song**, and Albert Tsang***
*Gerald and Bonita Wilkinson Professor of Finance and Department Chair
Leavey School of Business, Santa Clara University
**Professor of Finance
College of Business Administration, San Diego State University
***Assistant Professor of Accounting
School of Accountancy, Chinese University of Hong Kong
October 7, 2014
Abstract In this paper, we examine the impact of stakeholder governance on corporate social
responsibility (CSR) around the world to determine whether CSR is employed as a
mechanism to mitigate conflicts of interest between managers and diverse stakeholders, or
used as managerial perquisites. To examine this relation properly, we not only employ a
large and extensive sample of international firms, but also control for endogeneity by using
dynamic panel generalized method of moments (GMM), propensity score matching, and
difference-in-difference approach. Our results suggest that stakeholder governance
positively influences firms’ CSR engagement with a greater magnitude than board
governance after controlling for endogeneity and other confounding factors of traditional
corporate governance mechanisms, firm characteristics and national factors. Stakeholders’
influence in CSR engagement is more prevalent when investor protections and board
governance are relatively weak.
Keywords: Corporate Social responsibility; Stakeholder Governance; Board
Governance; Conflict resolution; Management Perquisite
* Jo (corresponding author) is in the Department of Finance, Leavey School of Business,
Santa Clara University, 500 El Camino Real, Santa Clara, CA 95053-0388, (408) 554-4779,
(408) 554-5206 (fax), Email: [email protected]. We thank Ye Cai, Sandra Dow, Joseph T.
Mahoney, Niki Den Nieuwenboer, Maretno A. Harjoto, Hellen Jo, Woo Chan Kim, Yongtae
Kim, Tammy Madsen, Jungbien Moon, Carrie Pan, Lawrence C. Rose, Chamu
Sundaramurthy, Lorne Switzer, Yulia Veld-Merleoulova, and Demir Yener and Korea
University Business School (KUBS) for many valuable comments. We also appreciate
Sebastian Brinkmann of MSCI ESG for generously providing us the ESG IVA database and
research assistance provided by Jinhua Cui and Hyunil Lim at Korea University Business
School (KUBS). This study was initiated while Jo was visiting KUBS.

1
Introduction
Corporate governance takes up a central role in many academic disciplines.
Management, accounting, business law, economics, and finance scholars, among others,
examine the relation between parties of interest to corporations. To date, these collective
efforts have centered on agency theory (Dalton et al. 2007), which emphasizes the conflicts
of interest among diverse stakeholders arising from the separation of ownership and control
in corporations (Jensen and Meckling 1976; Eisenhardt 1989). While corporate governance
aims to minimize the conflicts of interest, these agency conflicts cannot be removed
completely by a firm’s governance mechanisms. Thus the debates related to our
understanding and conceptualization of the agency problem and related governance
mechanisms continuously grow.
The theoretical foundations of these debates relate to the primacy of the various
stakeholders 1 in the corporation. First, the so-called shareholder primacy model re-
emphasizes that shareholders, as the legal owners, hold residual claim of the firm, and thus
hold primacy over any other stakeholder in the corporation (Eisenhardt 1989; Bebchuk 2005;
2006). Second, the alternative model, dubbed the stakeholder primacy model (Bainbridge
2003), highlights that all stakeholders join in team production; thus, the objective of the firm
is to maximize the risk-adjusted returns to all participants (Lan and Heracleous 2010). While
the shareholder primacy view advocates value creation for the shareholder, the stakeholder
primacy model promotes value creation for the corporation as a whole.
Well-designed corporate governance systems according to the stakeholder primacy
model should align managers' incentives with those of nonfinancial stakeholders, and reduce the
conflicts of interest between management and stakeholders; not only do good stakeholder
relations help firms to gain performance advantages, but they enable those performance
advantages to persist (Choi and Wang 2009). Kacperczyk (2009) also contends that catering
to non-shareholding stakeholders contributes to the long-term value of the firm. Freeman
(1984) argues that firms can use corporate social responsibility (CSR) as an extension of
1 Mahoney (2012) defines stakeholders as “…those persons and groups who contribute to the wealth-
creating potential of the firm and are its potential beneficiaries and/or those who voluntarily or
involuntarily become exposed to risk from the activities of a firm…Thus, stakeholders include shareholders,
holders of options issued by the firm, debt holders, employees (especially those investing firm-specific
human capital), local communities, environment as latent stakeholders, regulatory authorities, the
government, inter-organizational alliance partners, customers and suppliers”.

2
effective governance mechanisms to resolve conflicts between managers and non-investing
stakeholders, and Mannix (2003) maintains that conflict resolution and conflict management
should be an essential part of a group’s strategic management decision-making process. On
the other hand, Zajac and Westphal (1994) claim that there are costs associated with
governance mechanisms, and top managers prefer to take value in the form of perks. Baron
(2009) asserts that managers can opportunistically invest in CSR as a management perquisite.
In this paper, we examine the relation between stakeholder governance and firms’ CSR
activities across countries to determine whether CSR is employed as a mechanism to mitigate
the conflicts of interest between managers and stakeholders, or used as management perks. To
the best of our knowledge, there is little evidence for an international set of firms on the
significance or economic magnitude of this CSR-stakeholder governance relation. Thus, our
study pertains not only to the literature on how conflict resolution or management perquisite
influences corporate strategy but also provides a novel empirical lens on the increasingly
important context of CSR. Previous studies have empirically examined the role of CSR
across a broad set of countries (e.g., Maignan and Ralston 2002; Chapple and Moon 2005;
Jackson and Apostolakou 2010) or the empirical determinants of CSR based on social and
environmental metrics (Ioannou and Serafeim 2012). Their main focus, however, is not on
stakeholder governance.
While board governance is extensively documented, shareholder governance is
relatively less examined, and there is no universally accepted definition of stakeholder
governance. 2 We define stakeholder governance as the stakeholder orientation of corporate
governance pertaining system of checks and balances that trade off benefits and costs of firm
decisions and that provide various incentives, controls, and regulations to minimize conflicts
of interest between firms and stakeholders, to maintain financial stability, and to prevent
potential corruption and fraud. Despite the lack of a universally agreed-upon definition of
stakeholder governance, we are keenly interested in the impact of incremental contribution of
2 Spitzeck and Hansen (2010) define stakeholder governance mechanisms as the system of how
stakeholders influence corporate decision making and help align the worldviews of those inside and outside
the firm. Böhling (2011) defines stakeholder governance as the system of how multiple stakeholders bring
diverse stakeholders together, negotiate collectively on regulatory arrangements for the provision of
stability, and provide a means to accommodate competing interests in decision-making in the global
economy. We closely follow the MSCI ESG IVA’s definition of stakeholder governance as multi-
stakeholder initiated strategic governance (see more details in data, measurement, and research design
section as well as Appendices I and II).

3
stakeholder governance on CSR engagement after controlling for board governance, CEO
ownership, analysts’ indirect monitoring, institutional investor ownership, auditor monitoring,
and other confounding firm and national factors.3
CSR has continued to be highly popular, but contentious subjects over the previous
thirty-year history of academic research. Corporations across the globe have become more
alert to CSR issues since CSR can be considered important non-financial information
(Dhaliwal et al. 2011, 2012). Although an increasing number of firms are engaged in a
serious effort to define and integrate CSR into various aspects of their businesses, the
discussions pertaining CSR continue to grow without a clear consensus on its meaning or
value to stakeholders. Many studies suggest that while the definitions of CSR vary, it
generally refers to serving people, communities, and the environment in ways that go above
and beyond what is legally required of a firm (McWilliams and Siegel 2001; Margolis and
Walsh 2003; Orlitzky et al. 2003; Ioannou and Serafeim 2012; Jo and Harjoto 2011, 2012,
2014).
Our findings reveal several empirical regularities. First, without controlling for
endogeneity, our empirical results suggest that CSR is significantly and positively associated
with both stakeholder governance and board governance, but stakeholder governance reveals
a much higher significance than board governance after controlling for various firm and
international characteristics, suggesting that stakeholder governance is more important in
engaging CSR activities across countries than board and other governance mechanisms. This
finding is generally supportive of Jensen (1993) who claims that internal board governance is
not the most effective during the last decade, and therefore other external governances
become more important.
Second, the engagement of CSR activities in different countries is also found to be
affected by country-level institutions, especially in countries characterized by weak investor
protections and weak board governance. Stakeholders play a more salient role in CSR
activities when board governance and/or legal environments are relatively weak, presumably
3 While multi-stakeholder initiatives in CSR engagement from NGOs, corporations, scientific communities,
governments and international organizations are quite prolific, there are significant shortcomings in
practices of stakeholder governance. Stakeholder inclusion and governance, unfortunately, is neither
representative nor balanced, decision-making procedures fall short of transparency, and monitoring
mechanisms are largely unexplored (Böhling 2011).

4
because the stakeholder governance complements the weak board governance and investor
protections in international CSR markets.
Third, when we control for endogeneity4 using dynamic GMM, while the positive
association between CSR and stakeholder governance is still preserved, CSR-board
governance relation becomes insignificant. This insignificant relation between CSR and
board governance is supportive of Wintoki et al. (2012) who find that board independence is
insignificantly related to financial performance when they control for endogeneity by
employing dynamic panel GMM. Our results remain robust even after we control for the
endogeneity of the selection between CSR and stakeholder governance using propensity
score matching. Based on the difference-in-difference approach following Bertrand and
Mullainathan (2003), we further find that the impact of stakeholder governance on CSR is
growing after the global financial crisis, indicating more demand for stakeholder governance
after crisis, due to internal governance breakdown.
The remainder of the paper is organized as follows. We briefly discuss related
literature and develop two hypotheses of conflict resolution vs. management perquisite under
resource constraint in Section 2. We discuss the sample and measurement of CSR and CG as
well as our research design in Section 3. Section 4 presents the empirical results and
additional analyses. Section 5 summarizes our conclusions, the limitation of this study and
potential future research avenue.
Hypotheses Development
In this paper, we study the empirical determinants of international CSR engagement
with a particular emphasis on stakeholder governance (hereafter, SGOV). Specifically, we
examine the following hypotheses that relate SGOV and CSR engagement of firms around
the world.
4 Potential sources of cause and effect problems in CSR-governance studies could include the omission of
some important variables, reverse causality, and measurement error in the variables of interest (Roberts and
Whited 2011; Reeb et al. 2012). To examine properly the relation between stakeholder governance and
CSR across countries, we control for endogeneity as well as serial autocorrelation of CSR scores by using
dynamic panel generalized method of moments (GMM) that are known to cure both endogeneity and
autocorrelation problems reasonably well (Reeb et al. 2012; Wintoki et al. 2012). To further control for
endogeneity, we also employ propensity score matching (PSM) method following the seminal work of
Rosenbaum and Rubin (1983) as well as differences-in-differences approach following Bertrand and
Mullainathan (2003).

5
Conflict-Resolution Hypothesis
The stakeholder position that raises the most controversy takes into account the degree
to which firms should allocate limited resources to satisfy the needs and demands of a broad
group of stakeholders beyond and above what is necessary for the normal stakeholder
inclusion and participation (i.e., Harrison and Freeman 1999; Jensen 2001; Harrison et al.
2010). Some firms allocate both firm resources and decision-making influence widely across
diverse stakeholder networks (Sisodia et al. 2007). This sort of firm behavior is called as
‘managing for stakeholders’ (Freeman et al. 2007; Harrison et al. 2010). Mahoney (2012)
summarizes the benefits of stakeholder management and suggests that modern property rights
stakeholder theory recognizes the role each of these stakeholder groups plays in the creation
and distribution of the economic value.5 This stakeholder management approach is in sharp
contrast to the shareholder wealth maximization goal (Friedman 1962; Jensen 2001).
In rapidly changing modern organizations, conflict is an inevitable phenomenon that
hinders performance over the entirety of firm life (Mannix 2003).6 Corporate governance
literature identifies various settings for conflicts within stakeholder groups or intra-
stakeholder conflicts, such as those among owners (Bergloff and von Thadden 1994;
Hoskisson et al. 2002) or creditors. While there are several compelling explanations for inter-
stakeholder conflicts, such as agency theory (Jensen and Meckling 1976; Eisenhardt 1989) or
class politics (Roe 1994, 2003), there is a dearth of intra-stakeholder conflict examined in the
prior literature (Carney et al. 2011).
According to Freeman’s (1984) stakeholder theory, firms could use CSR to resolve
conflicts between managers and non-investing stakeholders. While it may not be completely
possible to satisfy all related stakeholders, there is a growing CSR literature on conflict
resolution based on stakeholder theory (e,g., Jensen 2002; Calton and Payne 2003; Sherer et
al. 2006; Cespa and Cestone 2007; Jo and Harjoto 2011; 2012), in which the role of the
5 Clearly, while there are potential problems in moving towards a stakeholder perspective, such as potential
increased discretion on the part of management and increased costs of corporate decision-making (Tirole
2001), there are potential benefits of moving to the stakeholder view.
6 The field of conflict and conflict resolution stems from a strong theoretical focus, initiated by the
groundwork of Walton and McKersie’s (1965) study on labor relations and bargaining, Deutsch’s (1973)
work on competition and cooperation in the resolution of conflict, and Rubin and Brown’s (1975)
explication of the social psychology of negotiation.

6
corporation is to serve the interests of non-investing stakeholders. Cespa and Cestone (2007),
in particular, propose a theoretical model investigating the conflicts of interest among
managers, shareholders, and other non-investing stakeholders, when managers are not
performing. In addition, management also considers firms’ fiduciary responsibilities toward
stakeholders (Del Guercio 1996; Jensen 2002; Aguilera et al. 2007). From the stakeholder
theory perspective, stakeholder governance needs to give a voice to diverse stakeholders to
secure their contribution to the success of the firm and stakeholder management should lead
to improved shareholder value creation (Hillman and Keim 2001; Ulrich 2008).
Top management also could use CSR to address social pressure that originates from
various stakeholders (Baron 2009). There is a consensus that corporations engage in CSR as
a response to social or stakeholder pressures. Indeed, stakeholder pressures may come from
many different forms, including pressures from investors’ preference for social giving
(DellaVigna et al. 2012), from community stakeholder groups regarding environmental issues
(Kassinis and Vafeas 2006), from consumers (Besley and Ghatak 2007), from the
competitive market structure (Fisman et al. 2008), and from non-governmental organizations
(NGOs) from the society (Baron 2009). Hong and Kacperczyk (2009) find that firms with
products that are considered harmful to the society (alcohol, tobacco and gambling) are
followed by less number of analysts and held less by institutional investors who are norm-
constrained. Thus, those sinful industry firms receive social pressures from reduced analyst
coverage and shrunken institutional ownership.
Resolving conflicts-of-interest and/or relieving stakeholder pressure are consistent with
stakeholder theory in which firms undertake social activities to balance the conflicts-of-
interest or to mitigate competing pressures from stakeholders. CSR undertaken to lessen the
conflicts-of-interest or the threat of social pressure are also strategic (Porter and Krammer,
2002, 2006). For instance, when activists have provided negative coverage on oil spill by
large oil companies such as BP and Exxon, 7 putting indirect, but additional pressure on firms,
7 Nye (2012) suggests that “the U.S. Department of Justice has accused British oil giant BP of gross
negligence, incompetence and a 'culture of corporate recklessness' in the 2010 Gulf of Mexico oil spill - in
a legal filing which could result in a massive $25 billion fine. In a federal court submission last Friday
(August 30, 2012), the Department of Justice (DOJ) offered its clearest signal that it will press for the
maximum possible penalties in a court of law against the British multinational, which is the fourth largest
firm of any company listed on the London Stock Exchange. BP has indicated that it will defend itself
against any action brought by the DOJ, but the threat of larger than anticipated compensation payments
caused BP's shares to drop four percent on Wednesday, wiping more than three percent or $4.77 from its

7
and consequently, firms either attempt to be more careful and reduce their irresponsible
activities or provide strategic CSR. In addition, firms often engage in normative CSR
activities that are not required by laws and regulations. For instance, Johnson and Johnson
strategically launch its Project Phoenix to help cooperatives in Brazil to enhance workers
conditions, although not required by law (Johnson and Johnson Annual Repot 2011).
In accordance with the conflict-resolution hypothesis, to the extent that firms use CSR
engagement as an effective communicative mechanism to resolve conflicts between
managers and stakeholders, CSR engagement should be positively related to SGOV. Because
conflict resolution is considered to be a dynamic part of a group’s interaction process
(Mannix 2003), cross-cultural and/or international settings in conflict resolution could also
provide strategic value of CSR activities. Taken together, we expect the following;
Hypothesis 1: To the extent that CSR is used as a mechanism for conflict resolution between
managers and stakeholders, we expect a positive association between CSR and SGOV around
the world.
Management Perquisites Hypothesis
Scholars have debated the attributes of management perquisites for more than three
decades. Jensen and Meckling (1976) maintain that CEO perks can be viewed as an agency
problem between managers and shareholders, because managers not only have greater
incentive to consume corporate resources for their own personal private benefit, but also have
more inducement to adversely affect the value of the firm through low percentages of
managerial ownership. Fama (1980) suggests that perks can be a motivational tool as a part
of optimal compensation contract to enhance shareholder value. Zajac and Westphal (1994)
claim that executives may prefer to take value in the form of perks. Few scholars, however,
believe that CEO perquisites represent an efficient way to monitor or influence executives.
Recent studies show that the relation between perks and short-run abnormal return is negative
(Rajan and Wulf 2006; Yermack 2006; Grinstein et al. 2011). Grinstein et al. (2011), in
particular, find that perks are positively related to CEO power and free cash flow, while
negatively associated with a firm’s growth opportunities.
market value.” (Read more: http://www.dailymail.co.uk/news/article-2199064/BP-labelled-incompetent-
Gulf-oil-spill-U-S-Department-Justice-threatens-British-firm-25-billion fine.html#ixzz2GZtKkAoj).

8
Baron (2009) similarly argues that managers could undertake CSR activities because of
their own personal interests. That is, social activities could be perquisites for managers based
on their own moral, warm glow, or self-interested preferences. Managers could enjoy the
social accolades that can come from pressure groups and NGOs or receive moral satisfaction
from benefitting others. CSR as a perquisite should depend on the discretion managers have
to serve their own interests and on the resources available to managers; i.e., the financial
resources of the firm.
In addition, managers may have a myopic view and a shorter time horizon (short
termism) than shareholders and in their pursuit of promotion may aim at early returns and
fast rewards even at the cost of shareholders’ as well as stakeholders’ long-term interests
(Jensen & Meckling 1976). Furthermore, although the objective of the firm is to maximize
shareholders’ wealth under the standard shareholder wealth maximization (SWM) model,
managers may use corporate resources to provide themselves with various perquisites.
Obviously, there is a separation between ownership and control, and there is no reason to
believe that managers will always act in the best interest of the shareholders and diverse
stakeholders. Pandher and Currie (2013) argue that the CEO and other firm stakeholders
compete over the firm’s resource surplus as utility-maximizing claimants based on their
relative bargaining power. Consequently, stakeholders will monitor managerial decisions to
make sure that management makes every decision in a way that maximizes firm value and
will put in place incentives that align managerial interests with those of stakeholders. Cheng,
et al. (2014) provide evidence that both better stakeholder engagement and transparency
around CSR performance are important in reducing capital constraints. Because the firms’
financial resources are typically limited in difficult economic period and any returns from
implementing CSR programs usually have a longer time horizon, non-shareholding
stakeholders will be more likely to monitor and enforce managers to focus on the long-term
value of the firm, but not to engage in CSR as a perquisite (Kacperczyk 2009). Thus, the
management perquisite hypothesis based on agency theory will predict the following;
Hypothesis 2: To the extent that CSR is used as a tool for management perquisite, we expect
an inverse association between CSR and SGOV around the world.
Clearly, the null hypothesis for the above two hypotheses is that CSR engagement is not
associated with SGOV mechanisms.

9
Data, Measurement and Research Design
Data
The data set is assembled from MSCI Environmental, Social, and Governance (ESG)
Intangible Value Assessment (IVA) Database. The IVA universe coverage currently
comprises the following: Top 1,500 companies of the MSCI World Index; Top 25 companies
of the MSCI Emerging Markets Index; Top 275 companies by market cap of the FTSE 100
and the FTSE 250 excluding investment trusts; and ASX 200 across 36 countries or districts.
And they provide ratings of 1,859 companies in their active universe and archived ratings for
an additional 658 previously rated companies. From ESG IVA database, we obtain various
measures of CSR as well as BGOV and SGOV. We choose MSCI ESG IVA database
because they specifically provide multi-stakeholder initiated strategic governance ratings.
We obtain the number of analysts following the firm (ANAL) from the I/B/E/S database.
In addition, because we use various accounting and financial information, we require that
sufficient Compustat domestic and global databases and firm risk measured by the standard
deviation of monthly stock price returns from Worldscope/Datastream data are available for our
tests. Other governance and monitoring mechanisms, such as, institutional ownership (IIOWN),
CEO ownership (CEO), and Big four auditor or not (BIG4) are compiled from Capital IQ, and
block holders (BLOCK) are proxied by the number of large shareholders from Compustat
domestic and global databases. This sample procedure produces a combined sample of 5,072
firm-year observations from 2006 to 2011.8 Actual samples used in the analyses are slightly
different because the data availability is different for each regression analysis.
Dependent Variable: CSR Measurement
MSCI ESG database provides three main Intangible value Assessment (IVA) variables
of human capital, environmental issues, and stakeholder capital.9 Our main measure of CSR
8 While MSCI ESG IVA (former Innovest) database is available from 1999, MSCI ESG provided us the
2006-2011 period of sample that are more complete than the earlier period of relatively incomplete 1999-
2005 sample. ESG IVA database is used by several previous studies (see, e.g., Derwall et al. 2005; Aktas et
al. 2011; Vasia and King 2012 to name a few).
9 Human capital is comprised by workplace practices, labor relations, and health and safety issues.
Workplace practices include workforce diversity, policies and programs to promote diversity, work/life
10
index (CSRIDX) is the arithmetic average of all 26 IVA social ratings subsets of human
capital, environmental issues, and stakeholder capital (see appendix I for the details of the 26
CSR dimensions). We compute CSRIDX such that the highest CSRIDX scoring firm gets a 10
while the lowest-scoring company obtains a 0. 10
Main Independent variable: Stakeholder Governance
While collecting firm-level CG information across countries is difficult, mainly due to
differences in the quality of disclosure across countries, ESG IVA provides firm-level
partnership in multi-stakeholder initiatives (SGOV) information across countries. ESG IVA
multi-stakeholder initiated SGOV key issues include four specific areas including (i)
corruption and instability, (ii) financial instability, (iii) business ethics and fraud, and (iv)
anti-competitive practices. 11 Specifically, first, SGOV issues encompass corruption and
instability issues evaluating the extent to which companies are at risk of suffering operational
disruptions or loss of market access due to violence, property destruction or sabotage,
political instability, demands for bribes, and costly litigation related to corrupt practices.
Companies that have programs, guidelines, and clear policies to avoid corrupt business
dealings, that have strong partnerships with local communities, one of important stakeholders,
and that have high level of disclosure and transparency score higher on this key issue.
benefits, discrimination-related controversies. Labor relations contain labor management issues related to
policies, programs, benefits, employee-related controversies, union relations. Health and safety (H&S)
issues include policies and systems, implementation and monitoring of those systems, performance (injury
rate, etc.), safety-related incidents and controversies.
10
Our second measure of CSR index (CSRIDX_I) is the arithmetic average of three main Intangible value
Assessment (IVA) variables of human capital, environmental issues, and stakeholder capital. We also
compute CSRIDX_I such that the highest CSRIDX_I scoring firm gets a 10 while the lowest-scoring
company obtains a 0. Our third measure of CSR index (CSRIDX_II) is the aggregated CSR score coded
directly from CSR rating assigned by Intangible Value Assessment (IVA), CSR rating of AAA, AA, A,
BBB, BB, B, CCC, and CC are coded as 8, 7, 6, 5, 4, 3, 2, and 1, respectively. The results of CSRIDX-
SGOV, and other CSRIDX-independent variable regressions to be presented later in empirical results
section are qualitatively very similar when we use CSRIDX_I and CSRIDX_II as dependent variables. To
conserve the space, we only report results when we use the CSRIDX as dependent variable.
11
One caveat of SGOV scores reported in ESG IVA database is not detailed enough to reveal how each
specific stakeholder initiates the above four particular key issues. Nevertheless, we consider that ESG
IVA’s multiple-stakeholder initiated strategic governance scores provide important first-step SGOV
information to understand the empirical association between CSR and stakeholder initiated strategic
governance because international SGOV information was not empirically available in the prior CSR and
CG literature.

11
Companies with a history of community opposition, that face security problems, and lack
transparency in ESG and financial information score lower on this key issue.
Second, SGOV covers firm-level financial stability that evaluates the extent to which a
company institutes strong governance structures, demonstrates a high level of transparency,
and avoids large scale controversy score well on this key issue. Companies that are large and
deeply interconnected to other financial institutions (as creditors that are other important
stakeholders), but have limited checks and balances in their governance structures and have
incentives for short-term risk-taking at the expense of long-term economic value creation
score poorly on this key issue.
Third, SGOV addresses business ethics and fraud that evaluates the extent to which
companies face regulatory and legal risks or loss of investor confidence due to ethical issues.
Ethics and fraud includes a wide range of ethical and criminal violations, some of which
relate closely to CG issues, including but not limited to insider trading and dealings;
securities and accounting fraud; securities litigation; criminal behavior of directors or top
executives; and options backdating. Notice that Government agencies such as SEC also are a
part of stakeholders. Companies that have avoided controversies in these areas score higher
on this key issue, while companies that have faced moderate or severe controversies over the
past three years score lower. Fourth and last, SGOV contains anti-competitive practices that
evaluate the extent to which companies face regulatory risks relating to anti-competitive
practices. Notice that regulatory agencies also are a part of stakeholders. Companies that
have avoided controversies in this area score higher on this key issue, while companies that
have faced moderate or severe controversies over the past three years score lower (see MSCI
ESG IVA manual, 2012). The highest SGOV scoring firm also receives a 10 while the
lowest-scoring company receives a 0.
To check the robustness of our results, we replace our current SGOV variable with
variable which can be more directly linked to the ex-ante stakeholder commitment rather than
the ex-post measure. ASSET4 database differentiate between the ex-ante measure of CSR
driver and the ex-post measure of CSR outcome across environmental and social dimension,
and the ex-ante CSR driver consists of policy, implementation, monitoring and improvement
(variables measuring the ex-ante stakeholder commitment to certain dimensions). Thus, we
use the ASSET4’s ex-ante measure of CSR driver variables related to stakeholder governance
as a robustness check, which could be more appropriate measure of ex-ante stakeholder
governance (SGOV), to replace our SGOV variables to measure stakeholder governance.

12
Another Important Independent variable: Board Governance
MSCI ESG IVA provides firm-level BGOV information across countries. In particular,
MSCI ESG provides key issue score for corporate governance derived from a combination of
two data sources: the Governance Risk Indicators (GRId) provided by Institutional
Shareholder Services (ISS), an MSCI company, and the MSCI ESG Impact Monitor. The
GRId scores focus on four key areas including (i) board structure, (ii) shareholder rights, (iii)
compensation and remuneration, and (iv) auditing practices and controversies. Among those,
BGOV is based upon board independence, board diversity, compensation practices,
controversies involving executive compensation and governance, and the management of
CSR issues. The highest BGOV scoring firm receives a 10 while the lowest-scoring company
receives a 0.
Other Governance and Monitoring Mechanisms
To control for additional external monitoring, we employ the number of analysts
following the firm (ANAL) as a measure of analyst monitoring from the I/B/E/S database
during the same time period (Chung and Jo 1996; Yu 2008). Since the number of analysts
following the firm is highly skewed to the right (Lim 2001; Bushman et al. 2005), we
measure analyst coverage with the natural logarithm of one plus the number of analysts
following the firm (ANAL).
Monitoring by large shareholders has been considered an important governance
mechanism to mitigate agency problems (Berle and Means 1932; Demsetz 1986; Shleifer and
Vishny 1997). We employ international institutional ownership data compiled from Capital
IQ to measure large shareholder monitoring (Shleifer and Vishny 1986; 1997) by institutional
ownership (IIOWN).12
CEO ownership is also important as another internal governance mechanism in terms
of incentive alignment between managers and stakeholders (Jensen 1993). Previous studies,
12 In addition, as more number of shares outstanding (CSHO compustat variable) and less number of
shareholders (CSHR compustat variable) indirectly represent greater percentage of larger blockholder
holding, we use log(CSHO/CSHR) as a second-best proxy of log(blockholders). Although log(blockholders)
variable is not an accurate measure of large shareholder monitoring, we report the results in our empirical
analyses. Our main results (to be followed in empirical results section) of the positive association between
CSRIDX and SGOV (as well as BGOV) remain intact when we include or exclude the imperfect measure
of log (blockholders) variable (BLOCK) in our analyses.

13
however, typically focus on individual country and the impact of CEO ownership on
international CSR engagement is relatively under explored. Thus, we compile CEO
ownership (CEO) from Capital IQ as additional governance mechanism.
Viewing that major accounting scandals and global financial crisis associated with
massive accounting frauds, strengthening accounting transparency can be an effective way of
alleviating the agency problems. We include the existence of Big 4 auditing as a proxy of
accounting transparency, and measure accounting transparency based on whether the auditor
is one of the Big 4 auditors (BIG4) (PricewaterhouseCoopers (PwC), Ernst & Young, KPMG,
and Delloitte) or not (a dummy variable). Big4 is also compiled from Capital IQ.
Measurement of Firm Control Variables
We obtain financial variables from Compustat domestic as well as Compustat Global
databases, and we compute the firm risk proxied by the standard deviation of monthly stock
price returns from Worldscope/Datastream database. Other firm characteristics as control
variables generally follow Jo and Harjoto (2011, 2012) that include firm size measured by the
natural log of total assets (LOGTA), R&D expenditures divided by sales revenue (RNDR),
total debt divided by total assets (LEV), capital expenditure divided by sales revenue
(CAPXR), firm profitability by return on assets (ROA), sales growth (GROW), growth
opportunities measured by Tobin’s Q (TOBINQ), and firm risk measured by the standard
deviation of monthly stock returns (DEVRET).
Information transparency is known to be important for the development of a sustained
economy as it provides a viable disclosure mechanism for both investors and firms. We
anticipate that firm’s earnings management inversely influences CSR engagement because
information transparency tends to reduce earnings management (Jo and Kim 2007). Thus, we
measure earnings management using performance-adjusted discretionary total accruals
(ACCRUAL) following Kothari et al. (2005).13
Earnings management is also less likely for firms that disclose more information on a
persistent basis because the increased transparency lowers information asymmetry and helps
investors recognize earnings management. Conversely, incentives for earnings management
are likely to be high for firms when information asymmetry is high. Thus, we expect that
13 Our main results remain intact when we measure discretionary accruals based on modified Jones (1991)
model or discretionary total accruals as suggested by Hribar and Collins (2002) or by discretionary current
accruals following Rangan (1998).

14
CSR is an increasing function of information transparency across firms and a decreasing
function of the firm-level earnings management. Thus we proxy firm-level information
transparency based on analyst forecast error (FERROR).
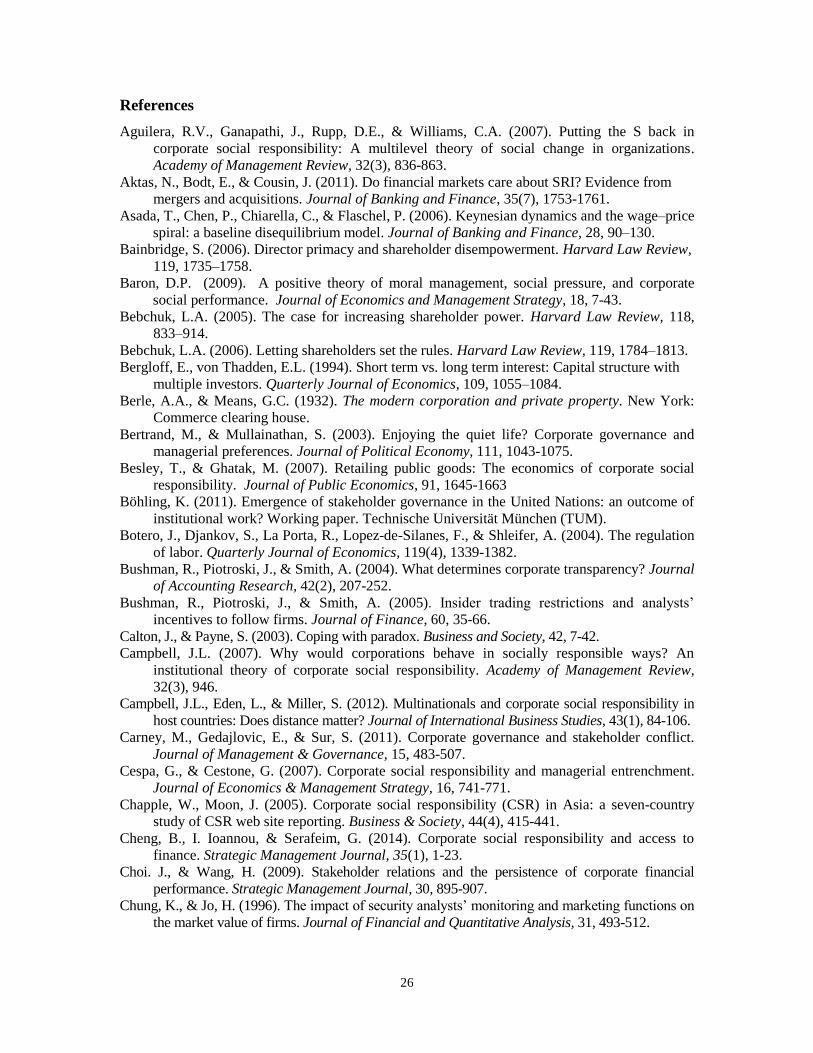
Measurement of National Variables
With respect to national factors, it is well established in prior literature that information
transparency, legal environment, cultural, geographical, and other various types of distance
play important roles in international business, respectively. First, to measure country-level
transparency, existing cross-country research has relied to a larger extent on the Center for
International Financial Analysis Research (CIFAR) index of transparency, introduced by La
Porta et al. (1998). We follow La Porta et al. (1998) and Bushman et al. (2004), and employ
the CIFAR Index created by examining and rating companies’ 1995 annual reports on their
inclusion or omission of 90 items. These items fall into seven categories: general information,
income statements, balance sheets, funds flow statement, accounting standards, stock data,
and special items.
Second, country legality is shown to be an important prerequisite for economic
development in a country and it impacts firm performance in emerging economies. La Porta
et al. (1997, 1998, 1999), in their series of seminal papers, show that the legality of a specific
country, including the following factors: civil versus common law systems, efficiency of
judicial system, rule of law, corruption, risk of expropriation, risk of contract repudiation, and
shareholder rights measure, are important for economic development in a country. We expect
that investor protection is positively related to the better legal system, and therefore, we first
measure the influence of legality using the rule of law (RULELAW) that measures the extent
to which agents have confidence in and abide by the rules of society in year 2000. These
include perceptions of the incidence of both violent and non-violent crime, the effectiveness
and predictability of the judiciary, and the enforceability of contracts (La Porta et al. 2006).
The source for the data on the rule of law is from Kaufmann et al. (2003).
We also assess the legal environment of a country in protecting labor rights based on
the measure of STAKELAW. It is the average rank score of the following four indices, with
the first three from Botero et al. (2004) and the fourth from La Porta et al. (2004):

15
Employment laws, social security laws, collective relations laws, and human rights law. In
addition, we measure the common (COMMON) vs. civil law on CSR engagement.14
While international business researchers have examined various types of distances and
their effects, many international business scholars recognize that distance is not a uni-
dimensional concept, but rather multiple-dimensions construct that captures various types of
distance between countries. For instance, international business scholars have studied various
types of distance and their effects, including cultural distance, geographic distance,
administrative distance, economic distance, psychic distance, and institutional distance.
Following Campbell et al. (2012), we consider that the four distances including the cultural,
geographical, administrative, and economic distances are relevant to our CSR-SGOV context.
Research Design
As we seek to investigate the relation between CSR and SGOV, we first regress the CSR
indices, constructed from ESG IVA data, on the level of stakeholder initiated governance
measures of SGOV, board corporate governance (BGOV), along with other governance and
monitoring mechanisms as well as firm control variables including firm size, profitability,
firm risk, R&D, capital expenditure (measure of investment), growth opportunities, firm’s
earnings management, and country level information transparency, investor protection by
legality, and other international distance factors including culture, geographical,
administration, and economic distance.
CSRit = α0 + α1 SGOVit + α2 BGOVit +
n
j
j
3
CONTROL VARIABLESit + εit (1)
Endogeneity issue arises due to the dynamic nature of the CSR-SGOV relation. Thus,
in order to address the endogeneity issue, we adopt a well-developed dynamic panel
generalized method of moment (GMM) estimator following Wintoki et al. (2012), and
employ the method for the determinants of CSR, and compare the results to those obtained
from traditional OLS.
14 We also measure the legality of a specific country as the weighted average of the above-mentioned seven
factors based on Dai et al. (2012) and find our main results remain intact. A higher value of legality index
indicates a “better” legal system.

16
CSRit = α0 + α1 SGOVit + α2 BGOVit + α3 CSRit-1 + α4 CSRit-2 +
n
j
j
5
CONTROL
VARIABLESit + εit (2)
We also include year dummy and industry dummy variables to control for fluctuations
to macroeconomic and industry conditions, which may affect the incentives of firms’ CSR
engagement. We further conduct propensity score matching (PSM) method as well as the
difference-in-difference approach to address any remaining endogeneity problems.
Results
Descriptive Statistics and Bivariate Correlations
Panel A of Table 1 presents summary statistics by country. The mean CSR indices
(CSRIDX, CSRIDX_I, and CSRIDX_II) for various countries range from 2.985 to 6.17 where
the highest score is 10. International institutional ownership (IIOWN) ranges from 17.27%
(Hong Kong) to 76.28% (U.S.). The mean stakeholder governance, SGOV (board governance,
BGOV) ranges from 3.50 (3.51) to 6.44 (6.75). STAKELAW (RULELAW) scores range from
3.13 (-0.37) to 26.88 (2.22). CIFAR scores range from 56 to 85. Those numbers, in general,
reveal enough variation for empirical analysis. Our data covers more than 5,000 observations
in 31 countries during the 2006-2011 period.
Panel B of Table 1 presents mean, median, standard deviation, 1% and 99% of all
variables that we employ. Three CSR indices show similar mean (around 5.00) and median
(around 5.00) numbers with close standard deviation ranging 1.224 to 1.714. Both the mean
and median scores of SGOV (5.16 and 5.00) and BGOV (5.72 and 6.00) seem closely related
to the mean and median numbers of CSR indices, suggesting the possible positive association.
[Table 1 about here]
Table 2 presents the Spearman correlation matrices among various CSR measures,
governance variables, and firm characteristics. We notice that both SGOV and BGOV are
significantly and positively correlated with both CSR measures. Most notably, SGOV is
mostly highly and positively correlated to CSRIDX_I (0.62) and CSRIDX (0.60) measures,
respectively. BGOV also is highly and positively related to CSRIDX_II (0.31) and CSRIDX
(0.28) measures, respectively. We also notice that other governance variables and firm
characteristics, such as the number of analyst following (ANAL), big four audit company

17
affiliation (BIG4), and firm size variables are positively correlated with CSR indices. Other
firm characteristics, i.e., R&D and volatility (DEVRET) which have been documented to
impact CSR also have significant correlation coefficients with our CSR measures.
We also conduct multicollinearlity diagnostics using a linear regression model and find
that all the individual variable’s variance inflation factor (VIF) values were below 6 (mean
VIF was below 3 for all models), suggesting that multicollinearlity does not significantly
influence our results. Due to the panel structure of our data, we also employ the Hausman
test to select between a fixed-effects and a random-effects model. The test suggests the use of
the random-effects OLS modeling. Below, we proceed to a multivariate test to examine the
incremental effect of SGOV and BGOV on CSR indices.
[Table 2 about here]
Baseline Regression Results
Table 3 presents our baseline regressions results using the ordinary least squares
methodology with clustered (at the firm level) and robust standard errors and year fixed
effects. All t-values are robust to heteroskedasticity and adjusted for two-way clustering at
the firm and year level. Consistent with the bivariate correlation results, we find that the
coefficients on SGOV are significantly and positively associated with CSRIDX with the
highest t-values of 19.68-20.53 among all independent variables, indicating that stakeholder
governance provides the critical role in international CSR market. 15 These results are
supportive of our conflict-resolution. The coefficients on BGOV also are positive and
significant at the one-percent level, but with relatively lower t-values of 4.60-5.09 than those
on SGOV. The positive coefficients on BGOV are also consistent with the conflict-resolution
hypothesis. 16 Our untabulated results using ASSET4’s ex-ante measure of CSR driver
15 When we employ country-effect regressions as well as firm-fixed effect regressions for robustness check,
the results are qualitatively identical to OLS regressions adjusted for two-way clustering at the firm and
year level.
16
Board governance is important because the market reacts based on directors’ characteristics
(Sundarmurthy et al. 1997). Board governance is also crucial because the board’s human and social capital
provides the firm with the critical knowledge and network access (Hillman and Dalziel 2003). When there
are convergent expectations, it is more likely for management to build mutual trust with the board and less
likely to maintain impression management and ingratiation tactics (Forbes and Milliken 1999; Westphal
1998). When the CEO is more receptive of board involvement in strategic CSR development, the board can
develop a more positive attitude and respect for the CEO’s CSR decision. This mutual respect can enhance
the cooperation within the board in a sound way (Forbes and Milliken 1999). It will also encourage the

18
variables related to stakeholder governance reveal qualitatively similar results of the positive
CSR-SGOV association after replacing our SGOV variables by these ASSET4 CSR driver
variables.
CSR engagements are also positively (negatively) associated with firm size (firm
leverage measured by LEV), consistent with U.S. findings of Jo and Harjoto (2011; 2012).
We also find a negative association between CSRIDX and risk measure of DEVRET at the
one percent level, consistent with earlier findings of McGuire et al. (1988), Godfrey et al.
(2009), Oikonomou et al. (2010). Thus, this evidence adds to the validity of our empirical
results.
In addition, we find that the coefficients on STAKELAW, common law (COMMON),
and administrative distance (ADMDIST) are negatively associated with CSR engagement.
Lopez-de-Silanes et al. (1998) suggest that English common law countries tend to offer the
strongest investor protection. Thus, the negative coefficients on COMMON suggest that CSR
engagements are more prevalent in civil law countries where investor protection is relatively
weak. Similarly, the negative coefficients on STAKELAW suggest that CSR engagements are
more rampant when labor rights are relatively weak. If compliance with host-country
regulations is more difficult for firms from more distant home countries, then the costs of
CSR should rise with greater ADMDIST between home and host countries. Thus, observed
inverse association between CSRIDX and ADMDIST is consistent with our anticipation. The
coefficient on economic distance (ECODIST) and RULELAW are positively related to
CSRIDX. The positive coefficients on RULELAW indicate that CSR engagements are more
ubiquitous in countries where the quality of law enforcement, as measured by RULELAW, is
relatively higher. The positive coefficients on ECODIST indicate that CSR engagements are
more prevailing in countries where the real GDP per capita difference between U.S. and a
firm’s home country is higher. This positive CSR-ECODIST association seems a bit puzzling
because the smaller the economic distance, the more similar the countries are in terms of their
income and wealth profiles, and thus, the more likely the non-U.S. firm is to engage in CSR
CEO to feel more comfortable in seeking the board’s input and advice (Westphal 1999). If the board
considers CEO’s CSR decision as a conflict resolution between the firm and stakeholders, we expect a
positive association between CSR engagement and BGOV.

19
in a firm’s home country (Campbell et al. 2012). 17 The coefficients on CULDIST and
GEODIST, however, are insignificant.
[Table 3 about here]
Table 4 presents the results with the effects of various legality issues and BGOV
interacted with SGOV. While the coefficients on SGOV remain highly significant at the one-
percent level, the coefficients on the interaction variables of SGOV*RULELAW and
SGOV*STAKELAW are significantly negative, suggesting that when investor protection is
relatively weak in terms of labor rights and social justice, SGOV plays more important role in
international CSR engagement. In addition, the coefficient on SGOV*BGOV is significantly
negative, suggesting that when corporate board (stakeholder) governance is relatively weak,
SGOV (BGOV) plays pivotal role in international CSR engagement. Other results remain
similar to those reported in Table 3.
[Table 4 about here]
Endogeneity Control
Previous studies suggest that endogeneity problem is quite serious in governance
(Wintoki et al. 2012) and CSR studies (Jo and Harjoto 2011; 2012; Reeb et al. 2012; Ioannou
and Serafeim 2014). Thus, we control for endogeneity using the following two
methodologies. First, we employ a well-developed dynamic panel GMM estimator, which
mitigates the biases of OLS and fixed effect regressions, as well as specification tests of the
validity of our dynamic panel assumptions to control for dynamic endogeneity. 18 This
dynamic panel GMM estimator alleviates endogeneity concerns in the effect of SGOV on
CSR and the determinants of CSR. Second, we use propensity score matching method to
tackle the endogeneity of selection. The method of propensity score matching has been
17 We conjecture that the positive CSR-ECODIST relation is partially because we use GDP per capital
instead of country-level GDP. GDP per capita takes a country's production, as measured by GDP, and
divides it by the country's total population. Hence, it is the output of a country's economy per person. A
country with larger ECODIST may confront with higher pressures from stakeholders, leading to potentially
higher demand for more CSR activities.
18
The term‘‘dynamic endogeneity’’ has been used to refer to the type of endogeneity that arises from the
possibility that a firm’s current actions will affect its control environment and future performance, which
will in turn affect its future control environment; see, for example, Durlauf and Quah (1999) and Asada, et
al. (2006).
20
receiving increasing attention in social studies mainly for dealing with the endogeneity issues
since the seminal work of Rosenbaum and Rubin (1983). Third and last, we perform the
differences-in-differences test for the change in CSR before and after global financial crisis,
following Bertrand and Mullainathan (2003).
First, to deal with any remaining dynamic endogeneity issue, we conduct a dynamic
panel generalized method of moments (GMM) regression following Wintoki et al. (2012).
The dynamic GMM enables us to estimate CSR-SGOV relation while including both past
CSR ratings and fixed-effects to account for the dynamic aspects of the CSR-SGOV relation
and time-invariant unobservable heterogeneity, respectively. Table 5 presents the regression
results of dynamic GMM. Due to our sample availability of 2006-2011, we lose more than
half of our observations because of dynamic GMM’s two lag period requirements.
Nonetheless, the results show that when we include fixed-effects in a dynamic model and
estimate via system GMM, the coefficients on SGOV in CSR regressions are still significant
and positive at the one percent level (t-values range from 4.19 to 4.40). Although statistical
significance gets a bit weaker than those of OLS regressions (t-values range from 19.68 to
20.53), it still seems that firms initiated and/or pressured by diverse stakeholders tend to
engage in more CSR activities, further lending support for our conflict-resolution hypothesis.
Notably, CSR-BGOV relation, however, becomes insignificant. This lack of significance
between CSR and BGOV supports the insignificant board independence of Wintoki et al.
(2012) based on dynamic panel GMM, although their focus is not on CSR.
We also report the results of two specification tests in Table 5—the AR(2) second-
order serial correlation tests and the Hansen J test of over-identification tests. The first AR(2)
test yields a p-value of 0.416-0.445, suggesting that the null hypothesis of no second-order
serial correlation cannot be rejected. The second test also reveals the Hansen J-statistic with a
p-value of 0.361-0.368. Thus, we cannot reject the hypothesis that our instruments are valid.
In addition, we report the results from a test of the exogeneity of a subset of our instruments.
The system GMM estimator makes an additional exogeneity assumption such that any
correlation between our endogenous variables and the unobserved (fixed) effect is constant
over time. This assumption enables us to include the levels equations in our GMM estimates
and use lagged differences as instruments for these levels. Eichenbaum et al. (1988) and
Wintoki et al. (2012) suggest that this assumption can be directly tested based on a
difference-in-Hansen test of exogeneity. This test also yields a J-statistic which is distributed
χ2 under the null hypothesis that the subsets of instruments in the levels equations are

21
exogenous. The results show a p-value of 0.142-0.247 for the J-statistic produced by the
difference-in-Hansen test. This suggests that we cannot reject the null hypothesis that the
additional subset of instruments used in the system GMM estimates is exogenous. Overall,
our dynamic GMM results support the conflict-resolution hypothesis, but not the
management perquisite hypothesis.
[Table 5 about here]
Second, the method of propensity score matching (PSM) has been receiving glowing
attention in social studies mainly for dealing with the endogeneity issues since the seminal
work of Rosenbaum and Rubin (1983). There are several steps involved. The first step is to
estimate the conditional probability of a specific SGOV type given the observable
characteristics with a probit regression. The independent variables we include in the probit
regression are the same firm characteristics and country level control variables at the firm
level. The second step is to estimate the conditional probability or the propensity score for
each observation from the probit model. As a third step, we use various matching techniques,
such as the nearest neighbor matching, radius matching, and the Kernel matching to form
sub-groups of observations with different SGOV type but with equal or close propensity
scores. As a final step, we compute the likelihood of CSR engagements for these sub-groups.
The differences in the likelihood of CSR engagement then reflect the contribution to the CSR
engagement by different SGOV type after controlling for the endogeneity of selection.
As shown in Table 6, firms initiated and/or pressured by stakeholders consistently
outperform those less initiated/pressured by stakeholders no matter which matching
technique we apply. The findings of propensity score matching further underline the results
from our multivariate regression analysis in Tables 3 and 4 without endogeneity control, and
dynamic GMM results with endogeneity control reported in Table 5, implying that
stakeholder governance is an effective mechanism to make firms engage in various CSR
activities when firms explore their CSR opportunities in the international CSR market.
[Table 6 about here]
A remaining potential limitation of the pooled cross-sectional regressions is that the
results may reflect the impact of uncontrolled omitted variables rather than the causal effect
of SGOV on CSR engagement. To further address this concern, we investigate whether CSR
engagement changes around global financial crisis. Specifically, we examine the change in
CSR around financial crisis between banking vs. non-banking industries during our sample
period because banking and financial industries are more seriously affected by financial crisis.

22
Table 7 shows the effect of global financial crisis on CSR engagement. Panel A of
Table 7 presents the differences in CSR for one year before and three years after crisis. To
avoid any confounding effect, the CSRIDX in the crisis years (2007-2008) are not included.19
In banking and financial industries, CSRIDX declines from year t-1 (2006) to year t+1 (2009),
but CSRIDX does not decline during the same period in non-banking industries. The
difference test in Panel A indicates that CSRIDX caused by exogenous shocks results in
differential CSR engagement between bank vs. non-bank industries. Specifically, while
CSRIDX of non-bank industries increases from year t-1 to year (t+1, t+3), CSRIDX of
banking and financial industries are statistically insignificant during the same period.
Next, we perform the differences-in-differences test for the change in CSR before and
after crisis, following Bertrand and Mullainathan (2003). Panel B of Table 7 presents the
results. To investigate the dynamic effect of crisis on CVSIDX, we estimate a regression with
four interaction variables (SGOV*Year(t-1), SGOV*Year(t+1), SGOV*Year(t+2),
SGOV*Year(t+3)) as well as CRISIS (one for 2007-2008 and 0 for other period). The
coefficients on CRISIS are significant and negative as anticipated. As shown in model (2) of
Panel B, the coefficients on SGOV*Year(t+1) and SGOV*Year(t+2) are statistically
indifferent from zero, but the coefficients on SGOV*Year(t-1) and SGOV*Year(t+3) are
significantly negative and positive, respectively. CSR engagements begin to decline one year
before crisis, but increases three years after crisis, suggesting the possibility that post-crash
effects of disciplining managers to reengage in CSR take time. The results shown in model
(3) of Panel B suggest that the impact of SGOV on CSRIDX is less (more) substantial in
non-banking (banking) industries while the overall impact of SGOV on CSRIDX remains
positive. Combined together, both results from the simple difference tests reported in Panel A
and those from the differences-in-differences test reported in Panel B are supportive of the
conflict-resolution hypothesis.
[Table 7 about here]
Additional Tests
To further check the robustness of our main results, we verify whether the positive
CSR-SGOV relation remains intact if we construct CSR index based on other international
19 This result remains intact when we examine the global finance crisis based on 2008-2009 period instead
of 2007-2008.

23
CSR data such as ASSET4 using the same sample period. Table 8 presents the regression
results for the effect of SGOV and BGOV on CSR_ASSET4. The dependent variable
CSR_ASSET4 is measured by the CSR performance data provided by ASSET4 ESG database.
Specifically, CSR_ASSET4 is calculated as the mean performance score of environmental
(EN) and social (SO) pillars. The environmental pillar (EN) measures a company's impact on
living and non-living natural systems, including the air, land, water, and complete ecosystems.
It reflects how well a company uses the best management practices to avoid environmental
risks and capitalize on environmental opportunities in order to generate long-term
shareholder value. It covers three categories including resource reduction, emission reduction,
and product innovation. The social pillar (PO) measures a company's capacity to generate
trust and loyalty with its workforce, customers and society, through its use of best
management practices. It is a reflection of the company's reputation and the health of its
license to operate, which are key factors in determining its ability to generate long term
shareholder value. It covers a total of seven categories including Employment Quality, Health
& Safety, Training and Development, Diversity and Opportunity, Human Rights,
Communities, and Product Responsibility. Both EN and SO are ranged from 0-1 with higher
value for better performance.
Our results reported in Table 8 suggest a significant and positive association between
CSR_ASSET4 and SGOV with t-values of 9.71-10.90, and between CSR_ASSET4 and BGOV
with t-values ranging 1.95-1.98. Thus, CSR_ASSET4-SGOV relation is quite close to our
main results of the positive CSRIDX-SGOV relation. A positive (negative) association
between CSR_ASSET4 and firm size (DEVRET) also remains similar to our previous results.
Based on the above results, we conclude that our main results of a positive association
between CSR indices and stakeholder governance is not primarily driven by our usage of the
same MSCI ESG IVA database both for CSR indices construction and SGOV scores. 20
[Table 8 about here]
20 Due to the non-disclosure agreement (NDA) requirement specifying that we should not combine the
MSCI ESG IVA database with other CSR rating data provided by other CSR rating agency, such as
ASSET4, we cannot combine ASSET4 and ESG IVA in our main analysis. We report Table 8 only for the
robustness cross-check purpose to verify whether our findings of a positive CSR-SGOV relation remains
intact if we construct CSR index based on ASSET4. In addition, we find a positive and significant CSR-
SGOV association when we construct the ex-ante measure of stakeholder governance from CSR driver of
ASSET4 (unreported).

24
In addition, we examine whether there exist any differences in stakeholder influence
on the relation between CSR and SGOV between various regions, i.e., between U.S. and.
non-U.S., between U.S. and Europe, between U.S. and Asia, between Europe and non-
Europe, and between Asia and non-Asia. Our unreported Chow test results suggest that while
the coefficients on SGOV in CSRIDX regressions are all significant at the one percent level,
they are insignificantly different each other, indicating that the impact of stakeholder
governance on CSR are world-wide, but not just region-specific phenomena.
Furthermore, we investigate whether the impact of stakeholder governance and
pressures is less substantial for firms with substantial CEO influence, measured by CEO
ownership. When we examine firms with CEO ownership higher than 10%, our untabulated
results indicate that the coefficients on SGOV become insignificant, suggesting the
possibility that CEO power and stakeholder governance are substitutes in CSR engagement.
Discussion and Conclusion
A few number of prior studies have examined what empirical factors affect
international CSR engagement (e.g. McWilliams and Siegel 2001; Campbell 2007; Ioannou
and Serafeim 2012) yet no empirical studies have investigated the empirical association
between CSR engagement and stakeholder-initiated governance around the world. In this
paper, we provide empirical evidence of the important role that stakeholder governance play
in explaining the CSR variation as measured by our constructed CSR index. In doing so, we
utilize a global MSCI ESG IVA database from MSCI ESG Research covering more than
5,000 observations in 31 countries during the 2006-2011 period.
Drawing from Freeman’s (1984) stakeholder theory, we maintain that conflict-
resolution is one important incentive behind recent CSR movement following Jensen (2002)
and others, and firms are strategically engaging in CSR activities (Porter and Krammer 2002,
2006) or reducing socially irresponsible activities to reduce conflicts of interest between
firms and non-investing stakeholders. Empirically, our paper is the first one that shows a
positive association between CSR and stakeholder-initiated (strategic) governance covering a
large number of CSR observations, countries, industries, and firms. Our empirical models,
with and without controlling for endogeneity, are able to explain 47-53% of the variance in
international CSR engagement with observable characteristics.
International CSR and SGOV are significantly and positively correlated without and
with endogeneity control. The influence of stakeholder governance, however, is less

25
ascendant when investor protection and board governance are relatively strong. While
international CSR and BGOV are positively correlated without endogeneity control, CSR-
BGOV nexus is insignificantly related with endogeneity control. The coefficients and
corresponding t-values of SGOV are, in general, higher than those of BGOV. The
coefficients on the other governance and monitoring variables are mostly insignificant. It
seems that the incremental monitoring effect of SGOV is non-trivial, and greater than that of
BGOV as well as those from other governance and monitoring mechanisms.
Given that there is no prior evidence on the relation between stakeholder governance and
CSR across countries, this study provides the first-step empirical evidence regarding the impact
of stakeholder governance on firms’ CSR after controlling for endogeneity and other
confounding factors. This study is different from Ioannou and Serafeim (2012) who
investigate the empirical determinants of CSR, but do not address corporate governance
issues. Our study is also not particularly limited to specific country or economic region like
Maignan and Ralston (2002) who examine CSR in Europe and the U.S. or Chapple and
Moon (2005) who investigate CSR in Asia. Instead, our study examines the relation between
stakeholder governance and CSR around the world.
One caveat is that a significant relation between international CSR and our SGOV
metrics does not necessarily imply that any managers who choose not to engage in CSR is
behaving irrationally. A majority manager of an international firm can rationally measure
private benefits of CSR engagement versus related costs of CSR. A future study with better
international data may be able to examine the choice against CSR engagement.
26
References
Aguilera, R.V., Ganapathi, J., Rupp, D.E., & Williams, C.A. (2007). Putting the S back in
corporate social responsibility: A multilevel theory of social change in organizations.
Academy of Management Review, 32(3), 836-863.
Aktas, N., Bodt, E., & Cousin, J. (2011). Do financial markets care about SRI? Evidence from
mergers and acquisitions. Journal of Banking and Finance, 35(7), 1753-1761.
Asada, T., Chen, P., Chiarella, C., & Flaschel, P. (2006). Keynesian dynamics and the wage–price
spiral: a baseline disequilibrium model. Journal of Banking and Finance, 28, 90–130.
Bainbridge, S. (2006). Director primacy and shareholder disempowerment. Harvard Law Review,
119, 1735–1758.
Baron, D.P. (2009). A positive theory of moral management, social pressure, and corporate
social performance. Journal of Economics and Management Strategy, 18, 7-43.
Bebchuk, L.A. (2005). The case for increasing shareholder power. Harvard Law Review, 118,
833–914.
Bebchuk, L.A. (2006). Letting shareholders set the rules. Harvard Law Review, 119, 1784–1813.
Bergloff, E., von Thadden, E.L. (1994). Short term vs. long term interest: Capital structure with
multiple investors. Quarterly Journal of Economics, 109, 1055–1084.
Berle, A.A., & Means, G.C. (1932). The modern corporation and private property. New York:
Commerce clearing house.
Bertrand, M., & Mullainathan, S. (2003). Enjoying the quiet life? Corporate governance and
managerial preferences. Journal of Political Economy, 111, 1043-1075.
Besley, T., & Ghatak, M. (2007). Retailing public goods: The economics of corporate social
responsibility. Journal of Public Economics, 91, 1645-1663
Böhling, K. (2011). Emergence of stakeholder governance in the United Nations: an outcome of
institutional work? Working paper. Technische Universität München (TUM).
Botero, J., Djankov, S., La Porta, R., Lopez-de-Silanes, F., & Shleifer, A. (2004). The regulation
of labor. Quarterly Journal of Economics, 119(4), 1339-1382.
Bushman, R., Piotroski, J., & Smith, A. (2004). What determines corporate transparency? Journal
of Accounting Research, 42(2), 207-252.
Bushman, R., Piotroski, J., & Smith, A. (2005). Insider trading restrictions and analysts’
incentives to follow firms. Journal of Finance, 60, 35-66.
Calton, J., & Payne, S. (2003). Coping with paradox. Business and Society, 42, 7-42.
Campbell, J.L. (2007). Why would corporations behave in socially responsible ways? An
institutional theory of corporate social responsibility. Academy of Management Review,
32(3), 946.
Campbell, J.L., Eden, L., & Miller, S. (2012). Multinationals and corporate social responsibility in
host countries: Does distance matter? Journal of International Business Studies, 43(1), 84-106.
Carney, M., Gedajlovic, E., & Sur, S. (2011). Corporate governance and stakeholder conflict.
Journal of Management & Governance, 15, 483-507.
Cespa, G., & Cestone, G. (2007). Corporate social responsibility and managerial entrenchment.
Journal of Economics & Management Strategy, 16, 741-771.
Chapple, W., Moon, J. (2005). Corporate social responsibility (CSR) in Asia: a seven-country
study of CSR web site reporting. Business & Society, 44(4), 415-441.
Cheng, B., I. Ioannou, & Serafeim, G. (2014). Corporate social responsibility and access to
finance. Strategic Management Journal, 35(1), 1-23.
Choi. J., & Wang, H. (2009). Stakeholder relations and the persistence of corporate financial
performance. Strategic Management Journal, 30, 895-907.
Chung, K., & Jo, H. (1996). The impact of security analysts’ monitoring and marketing functions on
the market value of firms. Journal of Financial and Quantitative Analysis, 31, 493-512.

27
Dai, N., Jo, H., & Kassicieh, S. (2012). Cross-border venture capital investments in Asia:
Selection and exit performance. Journal of Business Venturing, 27, 666-684.
Dalton, D.R., Hitt, M.A., Certo, S.T., & Dalton, C.M. (2007). The fundamental agency problem
and its mitigation. Academy of Management Annals, 1, 1–64.
Del Guercio, D. (1996). The distorting effect of the prudent man law on equity investments.
Journal of Financial Economics, 40, 31-62.
DellaVigna, S., List, J., Malmendier, U. (2012), Testing for altruism and social pressure in
charitable giving. Quarterly Journal of Economics, 127, 1-56.
Demsetz, H. (1986). Corporate Control, Insider Trading, and Rates of Return. American
Economic Review, 76, 313-317.
Derwall, J., Guenster, N., Bauer, R., & Koedijk, K. (2005). The eco-efficiency premium puzzle.
Financial Analyst Journal, 61(2), 51-63.
Deutsch, M. (1973). The resolution of conflict. New Haven, CT: Yale University.
Dhaliwal, D., Oliver, L., Tsang, A., & Yang, G.Y. (2011). Voluntary nonfinancial disclosure and
the cost of equity capital: The initiation of corporate social responsibility reporting.
Accounting Review, 86(1), 59-100.
Dhaliwal, D., Radhakrishnan, S., Tsang, A., & Yang, G.Y. (2012). Nonfinancial disclosure and
analyst forecast accuracy: International evidence on corporate social responsibility (CSR)
disclosure. Accounting Review, 87(3), 723-759.
Dharwadkar, R., Goranova, M., Brandes, P., & Khan, R. (2008). Institutional ownership and
monitoring effectiveness: It's not just how much but what else you own. Organization
Science, 19(3), 419-440.
Durlauf, S.N., & Quah, D.T. (1999). The new empirics of economic growth. In: Taylor, J.B.,
Woodford, M. (Eds.), Handbook of Macroeconomics, 1, Elsevier, North Holland, 235–308.
(Chapter 4).
Eichenbaum, M.S., Hansen, L.P., & Singleton. K.J. (1988). A time series analysis of
representative agent models of consumption and leisure choice under uncertainty. Quarterly
Journal of Economics, 103, 51–78.
Eisenhardt, K.M. (1989). Agency theory: An assessment and review. Academy of Management
Review, 14(1), 57–74.
Fama, E.F. (1980). Agency problems and the theory of the firm. Journal of Political Economy, 88,
288-307.
Fisman, R., Geoffrey, H., & Vinay, B.N. (2008). A model of corporate philanthropy. Working
paper. Columbia University.
Forbes, D.P., & Milliken, F.J. (1999). Cognition and corporate governance: Understanding board
of directors as strategic decision-making groups. Academy of Management Review, 24(3),
489-505.
Freeman, R.E. (1984). Strategic management: a stakeholder approach. Massachusetts: Pitman
Publishing Inc.
Freeman, R.E., Harrison, J.S., & Wicks, A.C. (2007). Managing for Stakeholders: Survival,
Reputation and Success. Yale University Press: New Haven, CT.
Friedman, M. (1962). Capitalism and Freedom. University of Chicago Press: Chicago, IL.
Godfrey, P.C., Merrill, C., & Hansen, J. (2009). The relationship between corporate social
responsibility and shareholder value: an empirical test of the risk management hypothesis.
Strategic Management Journal, 30(4), 425–445.
Grinstein, Y., Weinbaum, D., Yehuda, N. (2011). The economic consequences of perk disclosure.
Unpublished working paper, Johnson School, Cornell University.
Harrison, J.S., Bosse, D.A., & Phillips, R. (2010). Managing for stakeholders, stakeholder utility
functions, and competitive advantage. Strategic Management Journal, 31, 58-74.

28
Harrison, J.S., & Freeman, R.E. (1999). Stakeholders, social responsibility, and performance:
empirical evidence and theoretical perspectives. Academy of Management Journal, 42, 479–
485.
Hillman, A.J., & Dalziel, T. (2003). Boards of directors and firm performance: Integrating agency
and resource dependence perspectives. Academy of Management Review, 28(3), 383-396.
Hillman, A.J., & Keim, G. (2001). Shareholder value, stakeholder management, and social issues?
What’s the bottomline? Strategic Management Journal, 22, 125-139.
Hong, H., & Kacperczyk, M. (2009). The price of sin: The effect of social norms on markets.
Journal of Financial Economics, 93, 15-36.
Hoskisson, R.E., Hitt, M.A., Johnson, R.A., & Grossman, W. (2002). Conflicting voices: The
effects of institutional ownership heterogeneity and internal governance on corporate
innovation strategies. Academy of Management Journal, 45(4), 697–716.
Hribar, P., & Collins, D.W. (2002). Errors in estimating accruals: implications for empirical
research. Journal of Accounting Research, 40, 105–134.
Ioannou, I., & Serafeim, G. (2012). What drives corporate social performance? The role of
national-level institutions. Journal of International Business Studies, 43, 1-31.
Ioannou, I., & Serafeim, G. (2014). The impact of corporate social responsibility on investment
recommendations: Analysts’ perceptions and shifting institutional logistics. Strategic
Management Journal (in press), doi:10.1002/smj.2268
Jackson, G., & Apostolakou, A. (2010). Corporate social responsibility in Western Europe: An
institutional mirror or substitute? Journal of Business Ethic, 94(3), 371–394.
Jensen, M.C. (1993). The modern industrial revolution, exit, and the failure of internal control
systems. Journal of Finance, 48, 831- 880.
Jensen, M.C. (2001). Value maximization, stakeholder theory, and the corporate objective
function. European Financial Management, 7, 297–317.
Jensen, M.C. (2002). Value maximization, stakeholder theory, and the corporate objective
function. Business Ethics Quarterly, 12, 235-256.
Jensen, M.C., & Meckling, W. (1976). Theory of firm: Managerial behavior, agency costs, and
capital structure. Journal of Financial Economics, 3, 305-360.
Jo, H., & Harjoto, M.A. (2011). Corporate governance and firm value: The impact of corporate
social responsibility. Journal of Business Ethics, 103(3), 351-383.
Jo, H., & Harjoto, M.A. (2012). The causal effect of corporate governance on corporate social
responsibility. Journal of Business Ethics, 106(1), 53-72.
Jo, H., & Harjoto, M. (2014). Legal vs. normative CSR: Differential impact on analyst dispersion,
stock return volatility, cost of capital, and firm value. Journal of Business Ethics (in press).
Jo, H., & Kim, Y. (2007). Disclosure frequency and earnings management. Journal of Financial
Economics, 84, 561-590.
Johnson & Johnson, 2011. Annual Report 2010. March 2011. Available at
http://www.investor.jnj.com/annual-reports.cfm
Jones, J. (1991). Earnings management during import relief investigations. Journal of
Accounting Research, 29, 193–228.
Kacperczyk, M. (2009). With greater power comes greater responsibility? Takeover protection
and corporate attention to stakeholders. Strategic Management Journal, 30, 261-285.
Kassinis, G., & Vafeas, N. (2006). Stakeholder pressures and environmental performance.
Academy of Management Journal, 49(1), 145-159.
Kaufmann, D., Kraay, A., & Mastruzzi, M. (2003). Governance matters III: Updated governance
indicators for 1996-2002. Working paper. Washington, D.C.: World Bank.
Kothari, S.P., Leone, A.J., & Wasley, C.E. (2005). Performance matched discretionary accrual
measures. Journal of Accounting and Economics, 39, 163–197.
La Porta, R., Lopez-de-Silanes, F., Shleifer, A., & Vishny, R.W.(1997). Legal determinants of
external finance. Journal of Finance, 52 , 1131-1150.

29
La Porta, R., Lopez-de-Silanes, F., Shleifer, A., & Vishny, R.W. (1998). Law and finance.
Journal of Political Economy, 106, 1113-1155.
La Porta, R., Lopez-de-Silanes, F., Shleifer, A., & Vishny, R.W. (1999). Corporate ownership
around the world. Journal of Finance, 54, 471-517.
La Porta, R., Lopez-de-Silanes, F., Pop-Eleches, C., & Shleifer, A. (2004). Judicial checks and
balances. Journal of Political Economy, 112(2), 445-470.
La Porta, R., Djankov, S., Lopez-de-Silanes, F., & Shleifer, A. (2006). The law and economics of
self-dealing. Journal of Financial Economics, 88(3), 430-465.
Lan, L.L., & Heracleous, L. (2010). Rethinking agency theory: the view from law. Academy of
Management Review, 35(2), 294–314.
Lim, T. (2001). Rationality and analysts’ forecast bias. Journal of Finance, 56, 369-385.
Lucey, B., & Zhang, Q. (2010). Does cultural distance matter in international stock market
comovement? Evidence from emerging economies around the world. Emerging Markets
Review, 11(1), 62-78.
Mahoney, J.T. (2012). Towards a stakeholder theory of strategic management. Working paper.
University of Illinois at Urbana-Champaigne.
Maignan, I., & Ralston, D.A. (2002). Corporate social responsibility in Europe and the US:
Insights from businesses' self-presentations. Journal of International Business Studies,
33(3), 497-515.
Mannix, E. (2003). Editor’s comments: Conflict and conflict resolution – a return to theorizing.
Academy of Management Review, 28(4), 543-546.
Margolis, J., & Walsh, J. (2003). Misery loves companies: rethinking social initiatives by
business. Administrative Science Quarterly, 48, 268-305.
McGuire, J.B., Sundgren, A., & Schneeweis, T. (1988). Corporate social responsibility
and firm financial performance. Academy of Management Journal, 31, 854-872.
McWilliams, A., & Siegel, D. (2001). Corporate social responsibility and firm financial
performance: correlation or misspecification? Strategic Management Journal, 21, 603-609.
Nye, J. (2012). BP labelled incompetent over Gulf oil spill as U.S. Department of Justice
threatens British firm with $25 billion fine. Mail Online. September 6.
Oikonomou, I., Brooks, C., & Pavelin, S. (2010). The impact of corporate social performance on
financial risk and utility: A longitudinal analysis. Working paper, University of Reading.
Orlitzky, M., Schmidt, F., & Rynes, S. (2003). Corporate social and financial performance: A
meta analysis. Organizational Studies, 24, 403–441.
Pandher, G.S., & Currie, R.R. (2013). CEO compensation: A resource advantage and stakeholder-
bargaining perspective. Strategic Management Journal, 34, 22-41.
Porter, M., & Kramer, M. (2002). The competitive advantage of corporate philanthropy. Harvard
Business Review, 80(12), 57–68.
Porter, M., & Kramer, M. (2006). Strategy & society. Harvard Business Review, 84(12), 78–92.
Rajan, R., & Wulf, J. (2006). Are perks purely managerial excess? Journal of Financial
Economics, 79, 1-33.
Rangan, S. (1998). Earnings management and the performance of seasoned equity offerings.
Journal of Financial Economics, 50, 101–122.
Reeb, D., Sakakibara, M., & Magmood, I. (2012). From the editors: Endogeneity in international
business research, Journal of International Business Studies, 43, 211-218.
Roe, M.J. (1994). Strong managers, weak owners. Princeton: Princeton University Press.
Roe, M.J. (2003). Political determinants of corporate governance: Political context and
corporate impact. New York: Oxford University Press.
Roberts, M., & Whited, T. (2011). Endogeneity in corporate finance, Working Paper, Wharton.
Rosenbaum, P.R., & Rubin, D.B. (1983). The central role of the propensity score in observational
studies for causal effects. Biometrika,70, 41–55.

30
Rubin, J., & Brown, B. (1975). The social psychology of bargaining and negotiation. San Diego:
Academic Press.
Sherere, A., Palazzo, G., & Baumann, D. (2006). Global rules and private actors, Toward a new
role of the TNC in global governance. Business Ethics Quarterly, 16, 502-532.
Shleifer, A., & Vishny, R.W. (1986). Large shareholders and corporate control. Journal of
Political Economy, 94, 461-48.
Shleifer, A., & Vishny, R.W. (1997). A survey of corporate governance. Journal of Finance, 52
(2), 737–783.
Sisodia, R., Wolfe, D.B., & Sheth, J. (2007). Firms of Endearment: How World-Class Companies
Profit from Passion and Purpose. Wharton School Publishing: Upper Saddle River, NJ.
Spitzeck, H., & Hansen, E. (2010). Stakeholder governance: how stakeholders influence
corporate decision making. Corporate Governance, 10(4), 378-391.
Sundaramurthy, C., Mahoney, J.M., & Mahoney, J.T. (1997). Board structure, antitakeover
provisions and shareholder wealth. Strategic Management Journal, 18 (3), 231-245.
Tirole, J. (2001). Corporate governance. Econometrica, 69, 1-35.
Ulrich, P. (2008). Integrative economic ethics: Foundations of a civilized market economy.
Cambridge University Press, Cambridge.
Vasia, I., & King, B. (2012). Social movements, risk perceptions, and economic outcomes: The
effect of primary and secondary stakeholder activism on firms’ perceived environmental
risk and financial performance. American Sociological Review, 77(4), 573-596.
Walton, R.E., & McKersie, R.B. (1965). A behavioral theory of labor negotiations: An analysis
of a social interaction system. New York: McGraw-Hill.
Westphal, J.D. (1998). Board games: How CEOs adapt to increases in structural board
independence from management. Administrative Science Quarterly, 43, 511-537.
Westphal, J.D. (1999). Collaboration in the boardroom: Behavioral and performance
consequences of CEO-board social ties. Academy of Management Journal, 42(1), 7-24.
Wintoki, M., Linck, J., & Netter, J. (2012). Endogeneity and the dynamics of internal corporate
governance. Journal of Financial Economics, 105, 581-606.
Yermack, D. (2006). Flights of fancy: Corporate jets, CEO perquisites, and inferior shareholder
returns. Journal of Financial Economics, 80, 211-242.
Yu, F. (2008). Analyst coverage and earnings management. Journal of Financial Economics, 88,
245–271.
Zajac, E.J., & Westphal, J.D. (1994). The costs and benefits of managerial incentives and
monitoring in large U.S. corporations: When is more not better? Strategic Management
Journal, 15, 121.

31
Appendix I
MSCI IVA scores
IVA Factor IVA Sub-score Key Metrics
Stratgeic
Governannce (SG)
SG1 Strategy Overall governance; score composed of total
scores of non-Key Issues
SG2 Strategic
Capability/Adaptability
(Stakeholder Governance
(SGOV))
Partnership in multi-stakeholder initiatives.
SGOV key issues cover four specific areas
including (i) corruption and instability, (ii)
financial (in)stability, (iii) business ethics and
fraud, and (iv) anti-competitive practices
SG3 Traditional Board
Governance (BGOV)
Board independence, management of CSR issues,
board diversity, compensation practices,
controversies involving executive compensation
and governance
IVA ESG Factor IVA ESG score Key Metrics
Human Capital
(ESG_HC)
HC1 1 Workplace Practices Workforce diversity, policies and programs to
promote diversity, work/life benefits,
discrimination-related controversies
HC2 2 Labor Relations Policies, programs, benefits, employee-related
controversies, union relations
HC3 3 Health & Safety H&S policies and systems, implementation and
monitoring of those systems, performance (injury
rate, etc.), safety-related incidents and
controversies
Stakeholder Capital
(EGS_SC)
SC1 4 Stakeholder Partnerships Customer initiatives, customer-related
controversies, firm's support for public policies
with noteworthy benefits for stakeholders
SC2 5 Local Communities Policies, systems and initiatives involving local
communities (esp. indigenous peoples),
controversies related to firm's interactions with
communities
SC3 6 Supply Chain Policies and systems to protect supply-chain
workers' and contractors' rights, initiatives toward
improving labor conditions, supply-chain-related
controversies
Products and
Services (ESG_PS)
PS1 7 Intellectual Capital/ Product
Development
Beneficial products and services, including efforts
that benefit the disadvantaged, reduce
consumption of energy and resources, and
production of hazardous chemicals; average of
two scores
PS2 8 Product Safety Product quality, health and safety initiatives,
controversies related to the quality or safety of a
firm's products, including legal cases, recalls,
criticism
Emerging Markets
(ESG_EM)
EM1 9 EM Strategy Default = 5, unless there is company specific
exposure that is highly significant
EM2 10 Human Rights/Child and
Forced Labor
Policies, support for values in Universal
Declaration of Human Rights, initiatives to
promote human rights, human rights controversies
EM3 11 Oppressive regimes Controversies, substantive involvement in
countries with poor HR records

32
Environmental
Risk Factors
(ESG_ERF)
ER1 12 Historic Liabilities Controversies including natural resource-related
cases, widespread or egregious environmental
impacts
ER2 13 Operating Risk Emissions to air, discharges to water, emission of
toxic chemicals, nuclear energy, controversies
involving non-GHG emissions
ER3 14 Leading/ Sustainability
Risk Indicators
Water management and use, use of recycled
materials, sourcing, sustainable resource
management, climate change policy and
transparency, climate change initiatives, absolute
and normalized emissions output, controversies
ER4 15 Industry Specific Risk Default = 5, if no significant industry-specific risk
identified
Environmental
Management
Capacity
(ESG_EMC)
EMC1 16 Environmental Strategy Policies to integrate environmental considerations
into all operations, environmental management
systems, regulatory compliance, controversies
EMC2 17 Corporate Governance Board independence, management of CSR issues,
board diversity, compensation practices,
controversies involving executive compensation
and governance
EMC3 18 Environmental
Management Systems
Establishment and monitoring of environmental
performance targets, presence of environmental
training, stakeholder engagement
EMC4 19 Audit External independent audits of environmental
performance
EMC5 20 Environmental
Accounting/Reporting
Reporting frequency, reporting quality
EMC6 21 Environmental Training &
Development
Presence of environmental training and
communications programs for employees
EMC7 22 Certification Certifications by ISO or other industry- and
country-specific third party auditors
EMC8 23 Products/ Materials Positive and negative impact of products &
services, end-of-life product management,
controversies related to environmental impact of
P&S
Environmental
Opportunity
Factors
(ESG_EOF)
EO1 24 Strategic Competence Policies to integrate environmental considerations
into all operations and reduce environmental
impact of operations, products & services,
environmental management systems, regulatory
compliance
EO2 25 Environmental Opportunity Beneficial products and services that reduce
others' consumption of energy, production of
hazardous chemicals, and overall resource
consumption
EO3 26 Performance Percent of revenue represented by identified
beneficial products & services

33
Appendix II
Variable Definition
Variable Definition
Panel A: ESG variables (from MSCI ESG IVA database)
CSRIDX the average CSR score of all 26 CSR dimensions obtained from IVA social ratings
(see appendix I for the details of the 26 CSR dimensions)
CSRIDX_I the average score of all the three main types of CSR categories obtained from IVA
including (1) Human Capital (ESG_HC), (2) Stakeholder Capital, Products and
Services, and Emerging Markets (average of ESG_SC, ESG_PS, ESG_EM), and (3)
Environmental Issues which comprise Environmental Risk Factors, Environmental
Management, and Environmental Opportunity Factors (average of ESG_ERF,
ESG_EMC, ESG_EOF)
CSRIDX_II aggregated CSR score coded directly from CSR rating assigned by Intangible Value
Assessment (IVA), CSR rating of AAA, AA, A, BBB, BB, B, CCC, and CC are coded
as 8, 7, 6, 5, 4, 3, 2, and 1, respectively
ESG_HC
overall score of Human Capital (average of HC1, HC2, HC3)
ESG_SC overall score of Stakeholder Capital (average of SC1, SC2, SC3)
ESG_PS overall score of Products and Services (average of PS1, PS2)
ESG_EM overall score of Emerging Markets (average of EM1, EM2,EM3)
ESG_ERF overall score of Environmental Risk Factors (average of ER1, ER2,ER3)
ESG_EMC overall score of Environmental Management Capacity (average of EMC1, EMC2,
EMC3, EMC4, EMC5, EMC6, EMC7,EMC8)
ESG_EOF overall score of Environmental Opportunity Factors (average of EO1, EO2, EO3)
Panel B: Governance variables
SGOV (Stakeholder
Governance)
SGOV key issues cover four specific areas including (i) corruption and instability, (ii)
financial system instability, (iii) business ethics and fraud, and (iv) anti-competitive
practices (Data source: MSCI ESG IVA).
BGOV (Board
Governance)
board governance measure obtained from IVA which measures the board
independence, management of CSR issues, board diversity, compensation practices,
controversies involving executive compensation and governance (Data source: MSCI
ESG IVA).
ANAL (Analyst
Following)
total number of analysts following a firm (Data source: IBES)
BIG4 (Big 4 Auditor) 1 if the auditor is a Big4 auditor, and zero otherwise (Data source: Capital IQ)
BLOCK (Block
Holders)
the natural logarithm of number of large shareholders (Data source: Compustat NA
and Global)
IIOWN (Institutional
Ownership)
the percentage of shares held by all types of institutional investors (Data source:
Capital IQ)
CEO (CEO Ownership) the percentage shares held by CEO (Data source: Capital IQ)
Panel C: Other firm characteristics variables (from Compustat NA and Global)
LOGTA the natural logarithm of total assets in millions of U.S. dollars
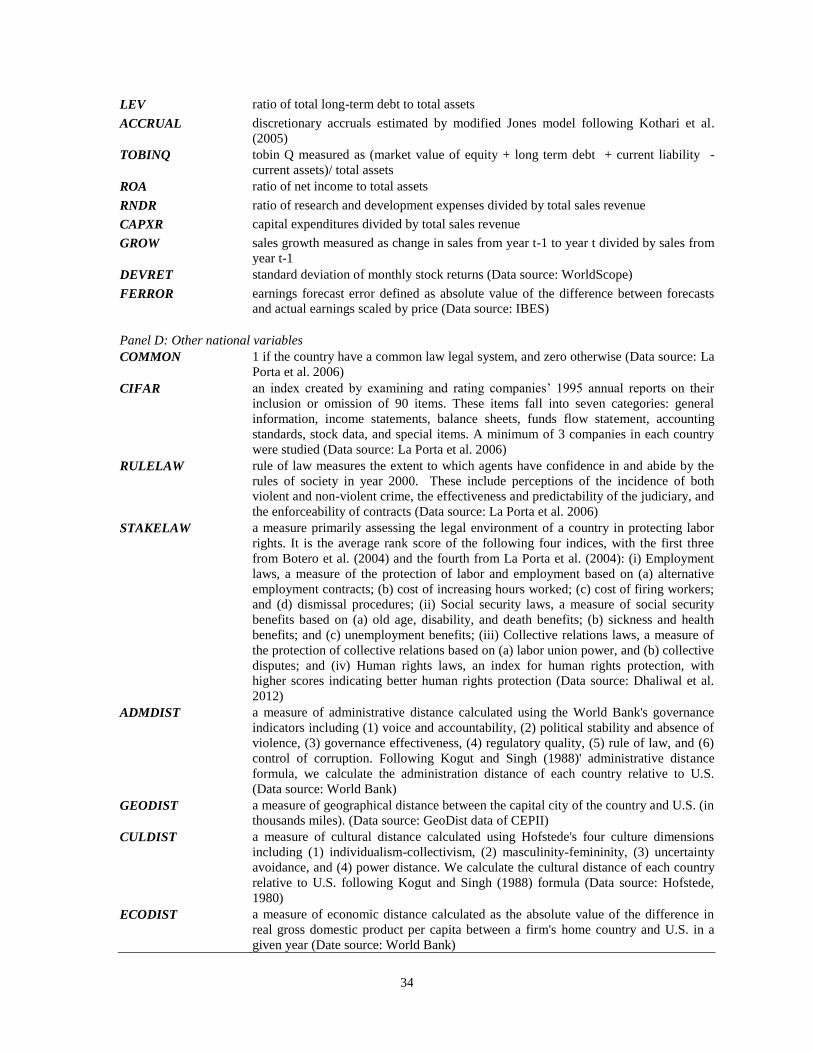
34
LEV ratio of total long-term debt to total assets
ACCRUAL discretionary accruals estimated by modified Jones model following Kothari et al.
(2005)
TOBINQ tobin Q measured as (market value of equity + long term debt + current liability -
current assets)/ total assets
ROA ratio of net income to total assets
RNDR ratio of research and development expenses divided by total sales revenue
CAPXR capital expenditures divided by total sales revenue
GROW sales growth measured as change in sales from year t-1 to year t divided by sales from
year t-1
DEVRET standard deviation of monthly stock returns (Data source: WorldScope)
FERROR earnings forecast error defined as absolute value of the difference between forecasts
and actual earnings scaled by price (Data source: IBES)
Panel D: Other national variables
COMMON 1 if the country have a common law legal system, and zero otherwise (Data source: La
Porta et al. 2006)
CIFAR an index created by examining and rating companies’ 1995 annual reports on their
inclusion or omission of 90 items. These items fall into seven categories: general
information, income statements, balance sheets, funds flow statement, accounting
standards, stock data, and special items. A minimum of 3 companies in each country
were studied (Data source: La Porta et al. 2006)
RULELAW rule of law measures the extent to which agents have confidence in and abide by the
rules of society in year 2000. These include perceptions of the incidence of both
violent and non-violent crime, the effectiveness and predictability of the judiciary, and
the enforceability of contracts (Data source: La Porta et al. 2006)
STAKELAW a measure primarily assessing the legal environment of a country in protecting labor
rights. It is the average rank score of the following four indices, with the first three
from Botero et al. (2004) and the fourth from La Porta et al. (2004): (i) Employment
laws, a measure of the protection of labor and employment based on (a) alternative
employment contracts; (b) cost of increasing hours worked; (c) cost of firing workers;
and (d) dismissal procedures; (ii) Social security laws, a measure of social security
benefits based on (a) old age, disability, and death benefits; (b) sickness and health
benefits; and (c) unemployment benefits; (iii) Collective relations laws, a measure of
the protection of collective relations based on (a) labor union power, and (b) collective
disputes; and (iv) Human rights laws, an index for human rights protection, with
higher scores indicating better human rights protection (Data source: Dhaliwal et al.
2012)
ADMDIST a measure of administrative distance calculated using the World Bank's governance
indicators including (1) voice and accountability, (2) political stability and absence of
violence, (3) governance effectiveness, (4) regulatory quality, (5) rule of law, and (6)
control of corruption. Following Kogut and Singh (1988)' administrative distance
formula, we calculate the administration distance of each country relative to U.S.
(Data source: World Bank)
GEODIST a measure of geographical distance between the capital city of the country and U.S. (in
thousands miles). (Data source: GeoDist data of CEPII)
CULDIST a measure of cultural distance calculated using Hofstede's four culture dimensions
including (1) individualism-collectivism, (2) masculinity-femininity, (3) uncertainty
avoidance, and (4) power distance. We calculate the cultural distance of each country
relative to U.S. following Kogut and Singh (1988) formula (Data source: Hofstede,
1980)
ECODIST a measure of economic distance calculated as the absolute value of the difference in
real gross domestic product per capita between a firm's home country and U.S. in a
given year (Date source: World Bank)

35
Table 1 Summary Statistics
Panel A By country
Country N CSRIDX CSRIDX_I CSRIDX_II SGOV BGOV ANAL BIG4 BLOCK IIOWN CEO COMMON CIFAR RULELAW STAKELAW
1 Australia 564 4.805 5.249 4.897 4.836 6.062 2.375 0.934 5.374 25.799 0.848 1 80 2.00 14.88
2 Austria 29 5.573 5.697 6.172 6.103 6.669 2.685 0.690 0.000 21.761 0.008 0 62 2.10 15.88
3 Belgium 37 5.023 5.175 5.027 5.114 5.470 3.122 0.946 0.258 25.131 0.013 0 68 1.64 16.13
4 Brazil 28 5.128 5.573 4.964 5.679 4.939 2.201 1.000 0.382 23.086 0.000 0 56 -0.15 12.13
5 Canada 116 5.323 5.862 5.672 5.543 6.822 1.915 0.991 2.164 58.735 0.159 1 75 2.01 13.50
6 Chile 14 3.988 4.183 3.786 3.286 3.514 1.825 1.000 3.039 28.027 0.000 0 78 1.33 13.38
7 Denmark 39 5.370 5.651 5.615 5.838 6.123 2.857 1.000 0.958 24.783 0.003 0 75 1.97 23.38
8 Finland 85 5.686 6.023 6.012 6.102 6.752 2.947 1.000 3.512 37.878 0.437 0 83 2.13 22.50
9 France 247 5.753 6.169 6.061 6.439 5.566 3.068 1.000 0.473 28.642 0.616 0 78 1.49 25.63
10 Germany 151 5.800 6.169 6.099 6.188 6.072 3.351 0.987 0.611 32.735 0.475 0 67 1.91 22.75
11 Greece 24 4.590 4.868 4.417 4.858 5.333 2.916 0.875 0.000 19.528 0.000 0 61 0.75 17.63
12 Hong Kong 60 4.644 5.026 4.483 4.703 5.165 2.975 1.000 0.837 17.266 0.013 1 73 1.66 15.83
13 India 22 3.800 4.124 3.455 4.364 4.136 2.841 0.409 1.606 24.780 0.348 1 61 0.23 7.00
14 Italy 89 5.023 5.423 5.022 5.107 5.215 3.075 1.000 0.209 22.754 0.021 0 66 0.94 21.50
15 Japan 451 5.416 5.543 5.091 5.698 4.229 2.518 0.725 8.880 24.560 0.494 0 71 1.82 13.00
16 Malaysia 13 3.880 4.325 3.923 3.688 5.100 2.973 0.846 9.288 39.900 0.164 1 79 0.55 3.13
17 Mexico 21 4.005 4.321 4.048 4.286 4.816 2.357 0.714 0.000 26.014 1.465 0 71 -0.37 15.00
18 Netherlands 77 5.598 6.035 5.844 5.935 6.588 3.137 1.000 0.810 38.823 0.115 0 74 1.97 20.13
19 New Zealand 25 4.785 5.162 5.200 4.720 6.196 1.858 0.960 6.401 31.176 0.007 1 80 1.99 12.63
20 Norway 35 5.559 6.002 5.771 6.643 7.220 3.004 1.000 5.268 33.581 0.060 0 75 2.01 26.63
21 Philippines 4 2.985 3.380 2.250 3.500 6.000 2.635 0.000 2.410 71.375 0.003 0 64 -0.50 12.75
22 Portugal 27 5.419 5.532 5.778 5.819 5.819 2.887 1.000 0.000 31.837 0.029 0 56 1.16 24.25
23 Singapore 38 4.449 4.488 3.947 3.918 5.477 2.588 1.000 11.112 22.747 1.090 1 79 2.12 5.75
24 South Africa 22 5.088 5.462 5.682 6.095 5.576 2.467 1.000 3.360 36.566 0.267 1 79 0.30 10.00
25 South Korea 39 4.793 4.917 4.615 4.803 4.420 1.718 0.974 7.018 38.571 1.270 0 68 0.65 13.25
26 Spain 101 5.665 6.028 5.851 6.243 5.765 3.184 1.000 0.000 19.722 0.355 0 72 1.38 19.75
27 Sweden 86 5.339 5.724 5.767 5.816 6.630 2.997 0.988 3.552 46.499 0.033 0 83 1.98 26.88
28 Switzerland 100 5.585 5.941 5.880 5.930 6.104 2.970 1.000 2.004 28.635 1.051 0 80 2.22 19.75
29 Thailand 10 4.033 4.450 4.200 4.300 5.310 3.114 0.600 0.000 32.183 0.896 1 66 0.43 7.63
30 U.K. 636 5.322 5.786 5.525 5.842 6.039 2.755 0.983 2.777 45.986 0.380 1 85 1.93 10.50
31 U.S.A 1,882 4.708 5.014 4.461 4.438 5.734 2.850 0.990 10.122 76.279 0.690 1 76 1.92 9.13
5,072 5.049 5.391 5.024 5.156 5.720 2.760 0.953 6.038 48.822 0.557
36
Panel B Descriptive Statistics (N= 5,072) Mean Median Std Dev 1% 99%
Panel B1: ESG variables
CSRIDX 5.049 5.119 1.224 1.927 7.842
CSRIDX_I 5.391 5.422 1.340 2.260 8.363
CSRIDX_II 5.024 5.000 1.714 2.000 8.000
SG 5.519 5.400 1.734 1.420 9.500
ESG_HC 5.669 5.700 1.711 1.390 9.500
ESG_SC 5.349 5.333 1.652 1.333 9.000
ESG_PS 5.366 5.500 1.740 1.000 9.000
ESG_EM 5.124 5.333 1.760 1.000 9.000
ESG_ERF 5.085 5.176 1.486 1.300 8.275
ESG_EMC 4.667 4.849 1.862 0.000 8.525
ESG_EOF 4.928 5.000 1.808 0.000 9.000
Panel B2: Governance variables
SGOV 5.156 5.000 2.246 0.000 10.000
BGOV 5.720 6.000 1.980 1.000 10.000
ANAL 2.760 2.833 0.526 1.099 3.664
BIG4 0.953 1.000 0.212 0.000 1.000
BLOCK 6.038 8.442 5.060 0.000 14.214
IIOWN 48.822 45.320 30.568 0.000 97.310
CEO 0.557 0.007 2.665 0.000 18.140
Panel B3: Other firm characteristics variables
LOGTA 8.781 8.755 1.347 5.458 12.022
LEV 0.208 0.189 0.150 0.000 0.675
ACCRUAL -0.412 -0.638 0.596 -1.224 0.500
TOBINQ 1.289 0.985 1.172 0.026 6.600
ROA 0.059 0.051 0.074 -0.209 0.315
RNDR 0.017 0.000 0.039 0.000 0.174
CAPXR 0.057 0.042 0.054 0.000 0.280
GROW 0.098 0.066 0.255 -0.459 1.570
DEVRET 0.329 0.298 0.139 0.136 0.848
FERROR 0.709 0.129 2.664 0.002 17.500
Panel B4: Other national variables
COMMON 0.668 1.000 0.471 0.000 1.000
CIFAR 76.380 76.000 5.474 56.000 85.000
RULELAW 1.819 1.920 0.366 -0.150 2.220
STAKELAW 13.499 10.500 5.453 5.750 26.880
ADMDIST 0.147 0.047 0.322 0.000 2.212
GEODIST 6.063 5.570 5.118 0.548 16.009
CULDIST 0.650 0.068 1.011 0.000 3.245
ECODIST 2.382 3.490 1.863 0.000 4.614
Notes The table presents the descriptive statistics of major variables by country (Panel A) and the descriptive statistics for all variables
(Panel B).

37
Table 2 Correlation Matrix 2 3 4 5 6 7 8 9 10 11 12 13 14 15 16 17 18 19 20 21 22 23 24 25 26 27 28
1 CSRIDX 0.85 0.72 0.60 0.28 0.27 0.06 -0.18 -0.12 -0.13 0.25 -0.05 -0.16 -0.03 -0.02 0.23 -0.02 -0.04 -0.12 -0.01 -0.24 0.00 -0.02 0.25 0.13 0.10 0.22 0.17
2 CSRIDX_I 0.78 0.62 0.28 0.25 0.07 -0.21 -0.10 -0.11 0.22 -0.04 -0.18 0.00 -0.02 0.14 -0.04 -0.05 -0.14 -0.02 -0.18 0.05 0.03 0.24 0.13 0.09 0.18 0.16
3 CSRIDX_II 0.59 0.31 0.22 0.07 -0.23 -0.15 -0.15 0.21 0.02 -0.22 -0.01 -0.04 0.10 0.02 -0.06 -0.15 0.00 -0.21 0.06 0.05 0.28 0.17 0.12 0.21 0.17
4 SGOV 0.26 0.14 0.03 -0.18 -0.15 -0.20 0.18 0.00 -0.20 -0.05 -0.05 0.10 0.03 -0.05 -0.15 0.00 -0.22 0.02 -0.01 0.25 0.16 0.13 0.23 0.18
5 BGOV 0.14 0.11 -0.07 0.06 0.01 0.08 -0.01 0.02 0.11 0.08 0.04 -0.03 0.00 -0.07 -0.07 0.09 0.16 0.23 0.05 0.02 -0.06 -0.09 -0.05
6 ANAL 0.15 -0.05 0.12 0.01 0.52 -0.06 -0.02 0.14 0.13 0.20 -0.01 0.01 -0.07 -0.08 -0.16 -0.10 -0.19 0.05 -0.12 -0.16 -0.02 -0.06
7 BIG4 -0.03 0.13 0.07 0.08 0.05 0.09 0.17 0.06 -0.03 -0.08 -0.02 -0.08 -0.07 0.14 0.17 0.12 -0.03 -0.13 -0.18 -0.19 -0.16
8 BLOCK 0.40 0.24 0.06 -0.06 0.47 0.04 0.03 0.07 -0.08 0.01 0.12 -0.02 0.39 -0.06 -0.01 -0.60 -0.50 -0.36 -0.50 -0.53
9 IIOWN 0.44 0.12 -0.02 0.58 0.17 0.11 0.06 -0.16 0.00 0.00 -0.14 0.45 0.04 0.03 -0.59 -0.61 -0.66 -0.62 -0.61
10 CEO -0.04 -0.05 0.32 0.15 0.11 -0.08 -0.09 0.03 0.12 -0.07 0.36 0.16 0.14 -0.34 -0.31 -0.30 -0.39 -0.34
11 LOGTA 0.00 0.16 0.08 0.17 0.15 0.03 0.06 -0.36 -0.18 -0.11 -0.31 -0.30 -0.11 -0.18 -0.27 -0.04 -0.12
12 LEV -0.12 -0.07 -0.26 -0.14 0.08 -0.10 -0.18 -0.02 -0.05 -0.08 -0.09 0.00 0.00 -0.02 0.03 0.01
13 ACCRUAL 0.11 0.18 0.12 -0.19 0.03 -0.01 -0.17 0.46 -0.11 0.00 -0.65 -0.66 -0.72 -0.68 -0.72
14 TOBINQ 0.52 0.02 0.01 0.16 -0.13 -0.27 0.32 0.32 0.24 -0.15 -0.25 -0.26 -0.37 -0.23
15 ROA 0.07 0.08 0.22 -0.19 -0.35 0.17 0.13 0.12 -0.12 -0.06 -0.12 -0.15 -0.08
16 RNDR -0.15 -0.01 0.01 0.02 -0.19 -0.09 -0.07 0.02 -0.07 -0.02 0.04 -0.05
17 CAPXR 0.08 -0.01 0.07 -0.08 -0.11 -0.01 0.11 0.18 0.15 0.14 0.14
18 GROW 0.06 -0.12 0.07 0.03 0.04 -0.01 0.03 -0.01 -0.03 0.02
19 DEVRET 0.40 0.09 0.09 0.11 -0.01 0.02 0.09 -0.04 0.00
20 FERROR -0.14 -0.05 -0.01 0.16 0.19 0.21 0.18 0.14
21 COMMON 0.45 0.40 -0.72 -0.52 -0.46 -0.77 -0.56
22 CIFAR 0.64 -0.02 -0.05 0.09 -0.23 -0.05
23 RULELAW 0.04 0.20 0.10 -0.23 -0.11
24 STAKELAW 0.74 0.67 0.73 0.67
25 ADMDIST 0.78 0.80 0.79
26 GEODIST 0.68 0.72
27 CULDIST 0.84
28 ECODIST
Notes The table presents the Spearman correlation of all the variables. Bold color indicates the correlation is significant at the 10% level.

38
Table 3 Main Result
I II Dep. Var. CSRIDX CSRIDX
Coef. t-value Coef. t-value
Intercept 1.616*** 4.61 1.773*** 4.58
SGOV 0.310*** 20.53 0.302*** 19.68
BGOV 0.059*** 4.60 0.061*** 5.09
ANAL 0.013 0.39 0.069** 1.99
BIG4 0.108* 1.77 0.079 1.60
BLOCK -0.010** -2.07 -0.002 -0.47
IIOWN -0.001 -1.06 -0.001 -0.18
CEO -0.002 -0.24 -0.001 -0.17
LOGTA 0.099*** 4.07 0.106*** 4.42
LEV -0.435*** -3.34 -0.409*** -3.17
ACCRUAL -0.118 -1.62 0.082 1.05
TOBINQ 0.001 0.05 -0.010 -0.56
ROA -0.498* -1.93 -0.475** -2.01
RNDR 0.610* 1.69 0.709* 1.76
CAPXR -0.493 -0.98 -0.403 -0.80
GROW -0.020 -0.37 -0.021 -0.42
DEVRET -0.594*** -3.97 -0.524*** -3.62
FERROR -0.003 -0.78 -0.005 -1.25
CIFAR 0.005 1.00 0.001 0.34
RULELAW 0.288*** 5.04 0.139* 1.81
STAKELAW -0.015* -1.93 -0.019** -2.10
COMMON -0.336*** -3.40 -0.298*** -2.62
ADMDIST -0.321*** -4.51
GEODIST 0.001 0.01
CULDIST -0.042 -1.29
ECODIST 0.132*** 5.18
Industry Dummies Yes Yes
Year Dummies Yes Yes
Adj. R-Square 52.45 53.17
N 5,072 5,072
Notes The table presents the regression results for the effect of SGOV and BGOV on CSRIDX.
The dependent variable is CSRIDX. The details of definitions of all variables are reported in the
Appendix II. Significance at the 10%, 5%, and 1% levels is indicated by *, **, and ***,
respectively. All t-values are robust to heteroskedasticity and adjusted for two-way clustering at
the firm and year level.
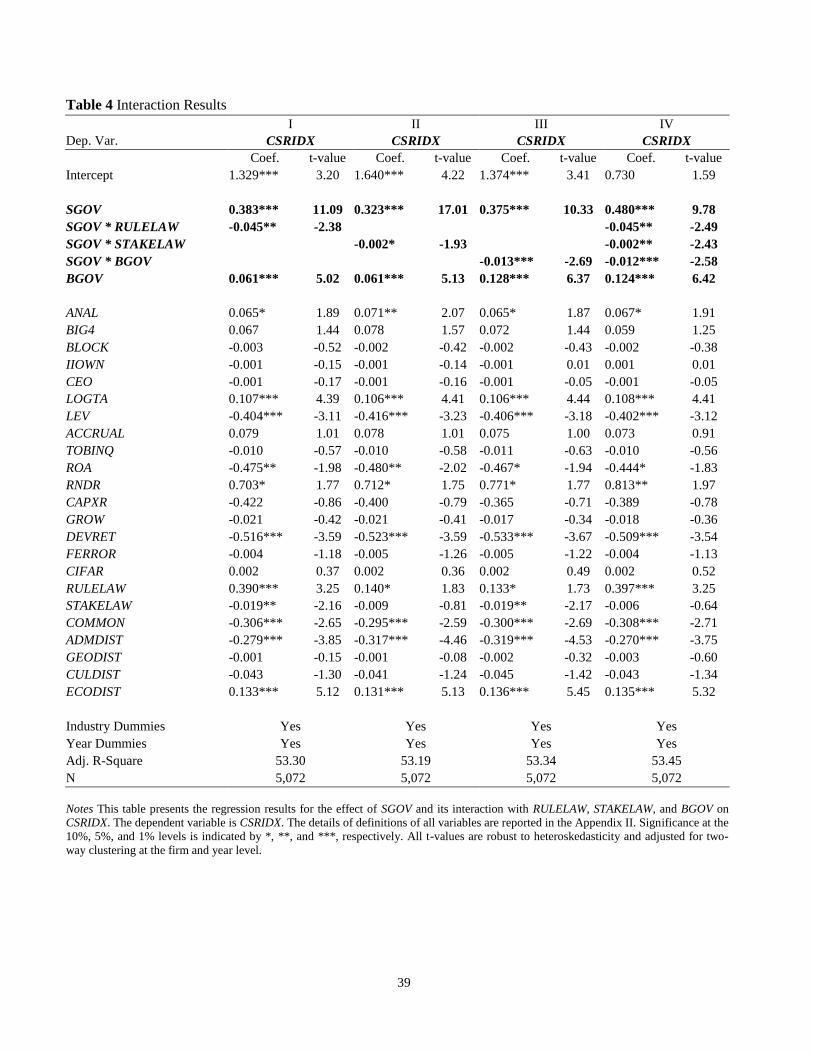
39
Table 4 Interaction Results
I II III IV
Dep. Var. CSRIDX CSRIDX CSRIDX CSRIDX
Coef. t-value Coef. t-value Coef. t-value Coef. t-value
Intercept 1.329*** 3.20 1.640*** 4.22 1.374*** 3.41 0.730 1.59
SGOV 0.383*** 11.09 0.323*** 17.01 0.375*** 10.33 0.480*** 9.78
SGOV * RULELAW -0.045** -2.38 -0.045** -2.49
SGOV * STAKELAW -0.002* -1.93 -0.002** -2.43
SGOV * BGOV -0.013*** -2.69 -0.012*** -2.58
BGOV 0.061*** 5.02 0.061*** 5.13 0.128*** 6.37 0.124*** 6.42
ANAL 0.065* 1.89 0.071** 2.07 0.065* 1.87 0.067* 1.91
BIG4 0.067 1.44 0.078 1.57 0.072 1.44 0.059 1.25
BLOCK -0.003 -0.52 -0.002 -0.42 -0.002 -0.43 -0.002 -0.38
IIOWN -0.001 -0.15 -0.001 -0.14 -0.001 0.01 0.001 0.01
CEO -0.001 -0.17 -0.001 -0.16 -0.001 -0.05 -0.001 -0.05
LOGTA 0.107*** 4.39 0.106*** 4.41 0.106*** 4.44 0.108*** 4.41
LEV -0.404*** -3.11 -0.416*** -3.23 -0.406*** -3.18 -0.402*** -3.12
ACCRUAL 0.079 1.01 0.078 1.01 0.075 1.00 0.073 0.91
TOBINQ -0.010 -0.57 -0.010 -0.58 -0.011 -0.63 -0.010 -0.56
ROA -0.475** -1.98 -0.480** -2.02 -0.467* -1.94 -0.444* -1.83
RNDR 0.703* 1.77 0.712* 1.75 0.771* 1.77 0.813** 1.97
CAPXR -0.422 -0.86 -0.400 -0.79 -0.365 -0.71 -0.389 -0.78
GROW -0.021 -0.42 -0.021 -0.41 -0.017 -0.34 -0.018 -0.36
DEVRET -0.516*** -3.59 -0.523*** -3.59 -0.533*** -3.67 -0.509*** -3.54
FERROR -0.004 -1.18 -0.005 -1.26 -0.005 -1.22 -0.004 -1.13
CIFAR 0.002 0.37 0.002 0.36 0.002 0.49 0.002 0.52
RULELAW 0.390*** 3.25 0.140* 1.83 0.133* 1.73 0.397*** 3.25
STAKELAW -0.019** -2.16 -0.009 -0.81 -0.019** -2.17 -0.006 -0.64
COMMON -0.306*** -2.65 -0.295*** -2.59 -0.300*** -2.69 -0.308*** -2.71
ADMDIST -0.279*** -3.85 -0.317*** -4.46 -0.319*** -4.53 -0.270*** -3.75
GEODIST -0.001 -0.15 -0.001 -0.08 -0.002 -0.32 -0.003 -0.60
CULDIST -0.043 -1.30 -0.041 -1.24 -0.045 -1.42 -0.043 -1.34
ECODIST 0.133*** 5.12 0.131*** 5.13 0.136*** 5.45 0.135*** 5.32
Industry Dummies Yes Yes Yes Yes
Year Dummies Yes Yes Yes Yes
Adj. R-Square 53.30 53.19 53.34 53.45
N 5,072 5,072 5,072 5,072
Notes This table presents the regression results for the effect of SGOV and its interaction with RULELAW, STAKELAW, and BGOV on
CSRIDX. The dependent variable is CSRIDX. The details of definitions of all variables are reported in the Appendix II. Significance at the
10%, 5%, and 1% levels is indicated by *, **, and ***, respectively. All t-values are robust to heteroskedasticity and adjusted for two-
way clustering at the firm and year level.

40
Table 5 Dynamic GMM
I II
Dep. Var. CSRIDX CSRIDX
Coef. t-value Coef. t-value
Intercept 0.091 0.03 0.4440 0.15
CSRIDX t-1 0.532*** 4.18 0.526*** 4.12
SGOV 0.259*** 4.40 0.267*** 4.19
BGOV 0.034 0.49 0.020 0.32
ANAL -0.110 -0.27 -0.017 -0.04
BIG4 -0.453 -0.56 -0.380 -0.43
BLOCK 0.005 0.12 -0.009 -0.16
IIOWN 0.025 1.53 0.023 1.46
CEO -0.036 -0.32 -0.043 -0.52
LOGTA 0.122** 1.98 0.072* 1.86
LEV 1.089 0.83 1.343 1.05
ACCRUAL -1.040 -1.29 -0.531 -0.55
TOBINQ -0.327 -1.52 -0.349 -1.40
ROA 4.737 1.26 4.448 1.06
RNDR 0.646 0.14 1.753 0.37
CAPXR -4.308 -1.16 -4.055 -1.11
GROW -0.202 -0.30 -0.201 -0.31
DEVRET -2.134** -2.24 -2.110** -2.18
FERROR 0.047 0.65 0.054 0.74
CIFAR -0.030 -0.88 -0.014 -1.06
RULELAW 0.283 0.86 -0.046 -0.21
STAKELAW 0.006 0.15 -0.009 -0.34
COMMON 0.234 0.44 -0.279 -0.96
ADMDIST -0.120 -0.44
GEODIST 0.059 0.92
CULDIST -0.122 -0.86
ECODIST -0.052 -0.26
N 2,098 2,098
N (firm) 1,094 1,094
AR(1) test (p-value) 0.000 0.000
AR(2) test (p-value) 0.416 0.445
Hansen test of over-
identification (p-value) 0.368 0.361
Diff-in-Hansen test of
exogeneity (p-value) 0.142 0.247
Notes This table presents the regression results for the effect of SGOV and BGOV on CSRIDX using
dynamic panel generalized method of moments (GMM). The dependent variable is CSRIDX. The
AR(1) and AR(2) tests are tests for first-order and second-order serial correlation in the first-
differenced residuals, under the null of no serial correlation. The Hansen test of over-identifying
restrictions is a test with the joint null hypothesis that instrumental variables are valid, i.e.
uncorrelated with error terms. We use lagged three- and four-periods as instruments. All the
regressors except industry and year dummies are assumed to be endogenous. The difference-in-
Hansen test of exogeneity is a test with the null hypothesis that the subsets of instruments that we
use in the levels equations are exogenous. Robust t-statistics are presented. The details of definitions
of all variables are reported in the Appendix II. Significance at the 10%, 5%, and 1% levels is
indicated by *, **, and ***, respectively.

41
Table 6 Propensity Score Matching
Propensity score matching methods Difference in CSRIDX between high SGOV and low SGOV firms
without BGOV with BGOV
Treated Controls diff (Treated - Controls) t-value Treated Controls diff (Treated - Controls) t-value
Unmatched 6.196 4.732 1.464 45.15*** 6.196 4.732 1.464 45.15***
Nearest neighbor matching 6.196 4.895 1.301 26.60*** 6.197 4.885 1.313 25.81***
Radius matching 6.196 4.864 1.333 38.35*** 6.197 4.934 1.263 33.32***
Kernel matching 6.196 4.867 1.329 38.93*** 6.196 4.927 1.270 34.77***
Notes Significance of t-value at the 10%, 5%, and 1% levels is indicated by *, **, and ***, respectively.
Table 7 Financial Crisis
Panel A: CSRIDX by year
All Year(t-1) Year(t) Year(t+1) Year(t+2) Year(t+3) Diff
(1) (2) (3) (4) (5)
(Year(t+1 to t+3) -
Year(t-1))
Banking/Financial industries Mean 4.52 4.56 4.24 3.94 4.91 5.08 0.13
Median 4.64 4.43 4.20 3.21 4.87 4.98 0.43
N=198 N=46 N=60 N=27 N=30 N=35
Non-Banking/Financial industries Mean 5.07 4.96 5.01 5.15 5.05 5.31 0.20***
Median 5.14 5.02 5.05 5.21 5.12 5.26 0.18***
N=4,874 N=1,111 N=1,414 N=812 N=873 N=664
Total N=5,072 N=1,157 N=1,474 N=839 N=903 N=699

42
Panel B: Differences-in-differences test I II III Dep. Var. CSRIDX CSRIDX CSRIDX Coef. t-value Coef. t-value Coef. t-value Intercept 1.386*** 4.74 1.425*** 4.92 1.419*** 4.62 CRISIS -1.023*** -11.35 -1.016*** -11.36 -1.021*** -10.27 SGOV 0.273*** 11.68 0.278*** 11.59 0.269*** 11.23 SGOV* Year(t-1) -0.013** -2.34 -0.015*** -2.62 SGOV* Year(t+1) -0.002 -0.22 SGOV* Year(t+2) -0.009 -0.85 SGOV* Year(t+3) 0.037*** 2.62 SGOV* Year(t+1 to t+3) 0.003 0.46 SGOV* Non_Fin_Industry -0.045*** -2.68 BGOV 0.069*** 7.11 0.070*** 7.19 0.068*** 6.96 ANAL 0.197*** 4.77 0.179*** 4.71 0.204*** 4.87 BIG4 0.122** 2.10 0.121** 2.15 0.119** 2.14 BLOCK -0.003 -0.74 -0.002 -0.49 -0.002 -0.59 IIOWN 0.001 1.55 0.001 1.10 0.001 1.59 CEO 0.004 0.87 0.003 0.62 0.003 0.70 LOGTA 0.105*** 7.90 0.109*** 8.93 0.108*** 7.89 LEV -0.478*** -6.93 -0.493*** -6.89 -0.482*** -7.35 ACCRUAL 0.134*** 2.60 0.119** 2.44 0.109** 1.97 TOBINQ -0.036*** -3.29 -0.034*** -3.13 -0.047*** -4.09 ROA -0.474** -2.09 -0.501** -2.10 -0.480** -1.94 RNDR 2.919*** 7.07 2.944*** 7.13 2.856*** 6.93 CAPXR -0.690*** -2.64 -0.618** -2.22 -0.775*** -2.57 GROW 0.036 0.63 0.033 0.64 0.037 0.69 DEVRET -0.017 -0.14 -0.004 -0.03 0.009 0.08 FERROR -0.010*** -2.97 -0.009*** -2.76 -0.007** -2.04 CIFAR 0.004 0.95 0.004 0.95 0.003 0.75 RULELAW 0.105* 1.91 0.111** 2.02 0.104* 1.80 STAKELAW -0.011* -1.77 -0.013** -2.19 -0.012* -1.80 COMMON -0.211** -2.30 -0.228*** -2.55 -0.206** -2.13 ADMDIST -0.426*** -7.05 -0.434*** -7.28 -0.451*** -7.19 GEODIST 0.001 0.01 0.001 0.12 0.001 0.17 CULDIST -0.011 -0.38 -0.016 -0.58 -0.014 -0.49 ECODIST 0.162*** 5.91 0.157*** 6.45 0.155*** 5.45 Adj. R-Square 47.00 47.30 47.20 N 5,072 5,072 5,072
Notes This table presents the regression results for the effect of SGOV and SGOV *around CRISIS (2007-2008) on CSRIDX.
The details of definitions of all variables are reported in the Appendix II. Non_Fin_Industry is an indicator variable that
takes value of one if the firm is NOT in the financial/bank industries. Significance at the 10%, 5%, and 1% levels is
indicated by *, **, and ***, respectively.

43
Table 8 Additional Test Results Using ASSET4 ESG data
I II
Dep. Var. CSR_ASSET4 CSR_ASSET4
Coef. t-value Coef. t-value
Intercept -0.860*** -5.63 -0.822*** -5.44
SGOV
SGOV
0.027*** 10.90 0.025*** 9.71
BGOV 0.006* 1.95 0.006** 1.98
ANAL 0.032 1.61 0.045** 2.44
BIG4 0.026 0.94 0.020 0.80
BLOCK -0.009*** -5.12 -0.004*** -2.88
IIOWN -0.001 -0.41 -0.001 -0.31
CEO -0.005** -2.44 -0.004** -2.06
LOGTA 0.085*** 11.50 0.086*** 12.05
LEV 0.047 1.09 0.050 1.22
ACCRUAL -0.024 -1.06 0.017 0.71
TOBINQ -0.032*** -6.49 -0.036*** -7.54
ROA -0.026 -0.40 -0.019 -0.32
RNDR 0.333 1.38 0.352 1.54
CAPXR -0.181 -1.10 -0.186 -1.05
GROW -0.091*** -5.02 -0.099*** -6.24
DEVRET -0.138*** -2.72 -0.129*** -2.54
FERROR 0.001 0.41 -0.001 -0.24
CIFAR 0.007*** 3.66 0.005*** 2.86
RULELAW -0.021 -0.82 -0.026 -1.25
STAKELAW -0.004** -2.31 -0.004*** -2.84
COMMON -0.105*** -3.75 -0.071*** -2.73
ADMDIST -0.064** -2.49
GEODIST -0.008*** -4.23
CULDIST -0.008 -1.07
ECODIST 0.052*** 6.02
Industry Dummies Yes Yes
Year Dummies Yes Yes
Adj. R-Square 46.85 48.39
N 4,518 4,518
Notes The table presents the regression results for the effect of SGOV and BGOV on CSR_ASSET4. The
dependent variable CSR_ASSET4 is measured by the CSR performance data provided by ASSET4 ESG
database. Specifically, CSR_ASSET4 is calculated as the mean performance score of environmental (EN)
and social (SO) pillars. EN: The environmental pillar measures a company's impact on living and non-
living natural systems, including the air, land and water, as well as complete ecosystems. It reflects how
well a company uses best management practices to avoid environmental risks and capitalize on
environmental opportunities in order to generate long term shareholder value. It covers three categories
including Resource Reduction, Emission Reduction, and Product Innovation. SO: The social pillar
measures a company's capacity to generate trust and loyalty with its workforce, customers and society,
through its use of best management practices. It is a reflection of the company's reputation and the health
of its license to operate, which are key factors in determining its ability to generate long term shareholder
value. It covers a total of seven categories including Employment Quality, Health & Safety, Training and
Development, Diversity and Opportunity, Human Rights, Communities, and Product Responsibility. Both
EN and SO are ranged from 0-1 with higher value for better performance. The details of definitions of all
variables are reported in the Appendix II. Significance at the 10%, 5%, and 1% levels is indicated by *, **,
and ***, respectively.