Embed Size (px)
Citation preview

Not Protectively MarkedED]
Corporate Services: Performance Summary Essex Police Performance Summary: To July 2015
1
STRATEGIC CHANGE MANAGEMENT DEPARTMENT
Date: August 2015
Unit: Performance Information Unit
Contact: David Howard
Essex Police Performance Summary To July 2015
Corporate Services

Not Protectively MarkedED]
Corporate Services: Performance Summary Essex Police Performance Summary: To July 2015
2
1. Introduction
This performance summary is designed to pictorially represent how individual districts are performing
within each crime type.
The report includes:
Charts to show the cumulative number of offences in each District each year, for the specified crime type, with the % difference between the two periods labelled
Tables of data relating to both of the above
Solved rate: Essex police could potentially still be under extracting the number of crimes that have been solved
2. Current Position
Not Protectively MarkedED]
Corporate Services: Performance Summary Essex Police Performance Summary: To July 2015
3
Castle Point

Not Protectively MarkedED]
Corporate Services: Performance Summary Essex Police Performance Summary: To July 2015
4

Not Protectively MarkedED]
Corporate Services: Performance Summary Essex Police Performance Summary: To July 2015
5

Not Protectively MarkedED]
Corporate Services: Performance Summary Essex Police Performance Summary: To July 2015
6

Not Protectively MarkedED]
Corporate Services: Performance Summary Essex Police Performance Summary: To July 2015
7
Force
Top Level
Crime Type 2014 2015 # diff. % diff. 2014 2015 # diff. % diff. 2014 2015% pt.
diff.
Anti-Social Behaviour (incidents) 20462 20093 -369 -1.8 - - - - - - -
All Crime (excl. Action (NFIB) Fraud) 34010 36608 2598 7.6 9289 7016 -2273 -24.5 27.3 19.2 -8.1
- State Based Crime 3485 3484 -1 0.0 2382 1620 -762 -32.0 68.4 46.5 -21.9
- Victim Based Crime 30525 33124 2599 8.5 6907 5396 -1511 -21.9 22.6 16.3 -6.3
Victim Based Crime
Crime Type 2014 2015 # diff. % diff. 2014 2015 # diff. % diff. 2014 2015% pt.
diff.
Violence Against the Person 7742 9163 1421 18.4 2815 2306 -509 -18.1 36.4 25.2 -11.2
- Homicide 5 12 7 140.0 3 10 7 233.3 60.0 83.3 23.3
- Violence with Injury 3600 3726 126 3.5 1369 1062 -307 -22.4 38.0 28.5 -9.5
- Violence without Injury 4137 5425 1288 31.1 1443 1234 -209 -14.5 34.9 22.7 -12.1
Sexual Offences 742 860 118 15.9 137 117 -20 -14.6 18.5 13.6 -4.9
- Rape 272 324 52 19.1 48 39 -9 -18.8 17.6 12.0 -5.6
- Rape - Under 16 yrs 77 131 54 70.1 25 17 -8 -32.0 32.5 13.0 -19.5
- Rape - Over 16 yrs 195 193 -2 -1.0 23 22 -1 -4.3 11.8 11.4 -0.4
- Other Sexual Offences 470 536 66 14.0 89 78 -11 -12.4 18.9 14.6 -4.4
Robbery 328 327 -1 -0.3 72 57 -15 -20.8 22.0 17.4 -4.5
Theft Offences 16903 17739 836 4.9 3074 2305 -769 -25.0 18.2 13.0 -5.2
- Burglary 4253 4448 195 4.6 440 301 -139 -31.6 10.3 6.8 -3.6
- Dwelling Burglary 2063 2326 263 12.7 339 237 -102 -30.1 16.4 10.2 -6.2
- Other Burglary 2190 2122 -68 -3.1 101 64 -37 -36.6 4.6 3.0 -1.6
- Vehicle Offences (incl. Interference) 3575 4508 933 26.1 189 114 -75 -39.7 5.3 2.5 -2.8
- Theft from Vehicle 2279 2913 634 27.8 64 43 -21 -32.8 2.8 1.5 -1.3
- Theft of Motor Vehicle 973 1134 161 16.5 118 65 -53 -44.9 12.1 5.7 -6.4
- Vehicle Interference 323 461 138 42.7 7 6 -1 -14.3 2.2 1.3 -0.9
- Theft 9075 8783 -292 -3.2 2445 1890 -555 -22.7 26.9 21.5 -5.4
- Theft from the Person 476 492 16 3.4 19 18 -1 -5.3 4.0 3.7 -0.3
- Theft of Pedal Cycle 796 804 8 1.0 15 37 22 146.7 1.9 4.6 2.7
- Shoplifting 3231 3230 -1 0.0 1952 1543 -409 -21.0 60.4 47.8 -12.6
- Other Theft 4572 4257 -315 -6.9 459 292 -167 -36.4 10.0 6.9 -3.2
Criminal Damage inc. Arson 4810 5035 225 4.7 809 611 -198 -24.5 16.8 12.1 -4.7
- Criminal Damage 4640 4854 214 4.6 789 599 -190 -24.1 17.0 12.3 -4.7
- Arson 170 181 11 6.5 20 12 -8 -40.0 11.8 6.6 -5.1
Racial/Religiously Aggravated Offences 312 223 -89 -28.5 103 50 -53 -51.5 33.0 22.4 -10.6
State Based Crime
Crime Type 2014 2015 # diff. % diff. 2014 2015 # diff. % diff. 2014 2015% pt.
diff.
Drug Offences 1326 929 -397 -29.9 1229 802 -427 -34.7 92.7 86.3 -6.4
- Trafficking of Drugs 272 224 -48 -17.6 240 155 -85 -35.4 88.2 69.2 -19.0
- Possession of Drugs 1054 705 -349 -33.1 989 647 -342 -34.6 93.8 91.8 -2.1
Possession of Weapons 297 326 29 9.8 235 198 -37 -15.7 79.1 60.7 -18.4
Public Order 1466 1695 229 15.6 711 463 -248 -34.9 48.5 27.3 -21.2
Miscellaneous Crimes against Society 396 534 138 34.8 207 157 -50 -24.2 52.3 29.4 -22.9
Cumulative Year to JulyOffences Outcomes Solved Rates %
Offences Outcomes Solved Rates %
Offences Outcomes Solved Rates %

Not Protectively MarkedED]
Corporate Services: Performance Summary Essex Police Performance Summary: To July 2015
8
Force
Top Level
Crime Type 2014 2015 # diff. % diff. 2014 2015 # diff. % diff. 2014 2015% pt.
diff.
Anti-Social Behaviour (incidents) 53340 55945 2605 4.9 - - - - - - -
All Crime (excl. Action (NFIB) Fraud) 100051 102391 2340 2.3 28119 24777 -3342 -11.9 28.1 24.2 -3.9
- State Based Crime 9806 9796 -10 -0.1 7315 6110 -1205 -16.5 74.6 62.4 -12.2
- Victim Based Crime 90245 92595 2350 2.6 20804 18667 -2137 -10.3 23.1 20.2 -2.9
Victim Based Crime
Crime Type 2014 2015 # diff. % diff. 2014 2015 # diff. % diff. 2014 2015% pt.
diff.
Violence Against the Person 20946 24336 3390 16.2 8051 7772 -279 -3.5 38.4 31.9 -6.5
- Homicide 15 18 3 20.0 11 14 3 27.3 73.3 77.8 4.4
- Violence with Injury 9788 10467 679 6.9 3839 3643 -196 -5.1 39.2 34.8 -4.4
- Violence without Injury 11143 13851 2708 24.3 4201 4115 -86 -2.0 37.7 29.7 -8.0
Sexual Offences 1977 2557 580 29.3 383 412 29 7.6 19.4 16.1 -3.3
- Rape 711 934 223 31.4 122 124 2 1.6 17.2 13.3 -3.9
- Rape - Under 16 yrs 218 333 115 52.8 63 56 -7 -11.1 28.9 16.8 -12.1
- Rape - Over 16 yrs 493 601 108 21.9 59 68 9 15.3 12.0 11.3 -0.7
- Other Sexual Offences 1266 1623 357 28.2 261 288 27 10.3 20.6 17.7 -2.9
Robbery 1025 956 -69 -6.7 212 193 -19 -9.0 20.7 20.2 -0.5
Theft Offences 52150 50779 -1371 -2.6 9753 8303 -1450 -14.9 18.7 16.4 -2.4
- Burglary 13485 13260 -225 -1.7 1419 1215 -204 -14.4 10.5 9.2 -1.4
- Dwelling Burglary 7274 7013 -261 -3.6 1084 916 -168 -15.5 14.9 13.1 -1.8
- Other Burglary 6211 6247 36 0.6 335 299 -36 -10.7 5.4 4.8 -0.6
- Vehicle Offences (incl. Interference) 11808 12565 757 6.4 567 555 -12 -2.1 4.8 4.4 -0.4
- Theft from Vehicle 8180 8142 -38 -0.5 205 218 13 6.3 2.5 2.7 0.2
- Theft of Motor Vehicle 2835 3112 277 9.8 349 303 -46 -13.2 12.3 9.7 -2.6
- Vehicle Interference 793 1311 518 65.3 13 34 21 161.5 1.6 2.6 1.0
- Theft 26857 24954 -1903 -7.1 7767 6533 -1234 -15.9 28.9 26.2 -2.7
- Theft from the Person 1603 1361 -242 -15.1 47 37 -10 -21.3 2.9 2.7 -0.2
- Theft of Pedal Cycle 2352 2222 -130 -5.5 96 121 25 26.0 4.1 5.4 1.4
- Shoplifting 9634 9243 -391 -4.1 6080 5037 -1043 -17.2 63.1 54.5 -8.6
- Other Theft 13268 12128 -1140 -8.6 1544 1338 -206 -13.3 11.6 11.0 -0.6
Criminal Damage inc. Arson 14147 13967 -180 -1.3 2405 1987 -418 -17.4 17.0 14.2 -2.8
- Criminal Damage 13694 13507 -187 -1.4 2346 1932 -414 -17.6 17.1 14.3 -2.8
- Arson 453 460 7 1.5 59 55 -4 -6.8 13.0 12.0 -1.1
Racial/Religiously Aggravated Offences 833 806 -27 -3.2 295 259 -36 -12.2 35.4 32.1 -3.3
State Based Crime
Crime Type 2014 2015 # diff. % diff. 2014 2015 # diff. % diff. 2014 2015% pt.
diff.
Drug Offences 3887 3303 -584 -15.0 3754 3124 -630 -16.8 96.6 94.6 -2.0
- Trafficking of Drugs 657 637 -20 -3.0 595 520 -75 -12.6 90.6 81.6 -8.9
- Possession of Drugs 3230 2666 -564 -17.5 3159 2604 -555 -17.6 97.8 97.7 -0.1
Possession of Weapons 880 922 42 4.8 757 716 -41 -5.4 86.0 77.7 -8.4
Public Order 3847 4185 338 8.8 2071 1659 -412 -19.9 53.8 39.6 -14.2
Miscellaneous Crimes against Society 1192 1386 194 16.3 733 611 -122 -16.6 61.5 44.1 -17.4
Rolling 12 Months to JulyOffences Outcomes Solved Rates %
Offences Outcomes Solved Rates %
Offences Outcomes Solved Rates %

Not Protectively MarkedED]
Corporate Services: Performance Summary Essex Police Performance Summary: To July 2015
9
Chelmsford
Top Level
Crime Type 2014 2015 # diff. % diff. 2014 2015 # diff. % diff. 2014 2015% pt.
diff.
Anti-Social Behaviour (incidents) 1568 1594 26 1.7 - - - - - - -
All Crime (excl. Action (NFIB) Fraud) 3056 3183 127 4.2 936 721 -215 -23.0 30.6 22.7 -8.0
- State Based Crime 324 319 -5 -1.5 218 144 -74 -33.9 67.3 45.1 -22.1
- Victim Based Crime 2732 2864 132 4.8 718 577 -141 -19.6 26.3 20.1 -6.1
Victim Based Crime
Crime Type 2014 2015 # diff. % diff. 2014 2015 # diff. % diff. 2014 2015% pt.
diff.
Violence Against the Person 682 835 153 22.4 298 233 -65 -21.8 43.7 27.9 -15.8
- Homicide 1 1 0 0.0 0 1 1 - 0.0 100.0 100.0
- Violence with Injury 322 348 26 8.1 154 109 -45 -29.2 47.8 31.3 -16.5
- Violence without Injury 359 486 127 35.4 144 123 -21 -14.6 40.1 25.3 -14.8
Sexual Offences 53 59 6 11.3 16 11 -5 -31.3 30.2 18.6 -11.5
- Rape 19 26 7 36.8 7 6 -1 -14.3 36.8 23.1 -13.8
- Rape - Under 16 yrs 2 6 4 200.0 2 2 0 0.0 100.0 33.3 -66.7
- Rape - Over 16 yrs 17 20 3 17.6 5 4 -1 -20.0 29.4 20.0 -9.4
- Other Sexual Offences 34 33 -1 -2.9 9 5 -4 -44.4 26.5 15.2 -11.3
Robbery 26 15 -11 -42.3 10 6 -4 -40.0 38.5 40.0 1.5
Theft Offences 1590 1530 -60 -3.8 322 267 -55 -17.1 20.3 17.5 -2.8
- Burglary 449 304 -145 -32.3 46 16 -30 -65.2 10.2 5.3 -5.0
- Dwelling Burglary 181 137 -44 -24.3 30 11 -19 -63.3 16.6 8.0 -8.5
- Other Burglary 268 167 -101 -37.7 16 5 -11 -68.8 6.0 3.0 -3.0
- Vehicle Offences (incl. Interference) 231 294 63 27.3 12 5 -7 -58.3 5.2 1.7 -3.5
- Theft from Vehicle 145 189 44 30.3 2 1 -1 -50.0 1.4 0.5 -0.9
- Theft of Motor Vehicle 72 63 -9 -12.5 10 4 -6 -60.0 13.9 6.3 -7.5
- Vehicle Interference 14 42 28 200.0 0 0 0 - 0.0 0.0 0.0
- Theft 910 932 22 2.4 264 246 -18 -6.8 29.0 26.4 -2.6
- Theft from the Person 64 51 -13 -20.3 2 3 1 50.0 3.1 5.9 2.8
- Theft of Pedal Cycle 129 125 -4 -3.1 4 4 0 0.0 3.1 3.2 0.1
- Shoplifting 304 391 87 28.6 201 210 9 4.5 66.1 53.7 -12.4
- Other Theft 413 365 -48 -11.6 57 29 -28 -49.1 13.8 7.9 -5.9
Criminal Damage inc. Arson 381 425 44 11.5 72 60 -12 -16.7 18.9 14.1 -4.8
- Criminal Damage 366 404 38 10.4 68 60 -8 -11.8 18.6 14.9 -3.7
- Arson 15 21 6 40.0 4 0 -4 -100.0 26.7 0.0 -26.7
Racial/Religiously Aggravated Offences 22 16 -6 -27.3 9 4 -5 -55.6 40.9 25.0 -15.9
State Based Crime
Crime Type 2014 2015 # diff. % diff. 2014 2015 # diff. % diff. 2014 2015% pt.
diff.
Drug Offences 123 96 -27 -22.0 110 84 -26 -23.6 89.4 87.5 -1.9
- Trafficking of Drugs 16 27 11 68.8 11 20 9 81.8 68.8 74.1 5.3
- Possession of Drugs 107 69 -38 -35.5 99 64 -35 -35.4 92.5 92.8 0.2
Possession of Weapons 19 25 6 31.6 16 11 -5 -31.3 84.2 44.0 -40.2
Public Order 137 151 14 10.2 65 34 -31 -47.7 47.4 22.5 -24.9
Miscellaneous Crimes against Society 45 47 2 4.4 27 15 -12 -44.4 60.0 31.9 -28.1
Cumulative Year to JulyOffences Outcomes Solved Rates %
Offences Outcomes Solved Rates %
Offences Outcomes Solved Rates %

Not Protectively MarkedED]
Corporate Services: Performance Summary Essex Police Performance Summary: To July 2015
10
Chelmsford
Top Level
Crime Type 2014 2015 # diff. % diff. 2014 2015 # diff. % diff. 2014 2015% pt.
diff.
Anti-Social Behaviour (incidents) 4123 4541 418 10.1 - - - - - - -
All Crime (excl. Action (NFIB) Fraud) 9124 9020 -104 -1.1 2773 2468 -305 -11.0 30.4 27.4 -3.0
- State Based Crime 988 983 -5 -0.5 724 649 -75 -10.4 73.3 66.0 -7.3
- Victim Based Crime 8136 8037 -99 -1.2 2049 1819 -230 -11.2 25.2 22.6 -2.6
Victim Based Crime
Crime Type 2014 2015 # diff. % diff. 2014 2015 # diff. % diff. 2014 2015% pt.
diff.
Violence Against the Person 1865 2214 349 18.7 793 798 5 0.6 42.5 36.0 -6.5
- Homicide 1 3 2 200.0 1 3 2 200.0 100.0 100.0 0.0
- Violence with Injury 908 981 73 8.0 399 369 -30 -7.5 43.9 37.6 -6.3
- Violence without Injury 956 1230 274 28.7 393 426 33 8.4 41.1 34.6 -6.5
Sexual Offences 162 220 58 35.8 33 24 -9 -27.3 20.4 10.9 -9.5
- Rape 67 89 22 32.8 13 9 -4 -30.8 19.4 10.1 -9.3
- Rape - Under 16 yrs 17 25 8 47.1 5 3 -2 -40.0 29.4 12.0 -17.4
- Rape - Over 16 yrs 50 64 14 28.0 8 6 -2 -25.0 16.0 9.4 -6.6
- Other Sexual Offences 95 131 36 37.9 20 15 -5 -25.0 21.1 11.5 -9.6
Robbery 68 55 -13 -19.1 16 17 1 6.3 23.5 30.9 7.4
Theft Offences 4813 4383 -430 -8.9 974 782 -192 -19.7 20.2 17.8 -2.4
- Burglary 1249 963 -286 -22.9 104 61 -43 -41.3 8.3 6.3 -2.0
- Dwelling Burglary 551 424 -127 -23.0 64 36 -28 -43.8 11.6 8.5 -3.1
- Other Burglary 698 539 -159 -22.8 40 25 -15 -37.5 5.7 4.6 -1.1
- Vehicle Offences (incl. Interference) 746 817 71 9.5 39 22 -17 -43.6 5.2 2.7 -2.5
- Theft from Vehicle 479 553 74 15.4 11 5 -6 -54.5 2.3 0.9 -1.4
- Theft of Motor Vehicle 218 171 -47 -21.6 27 17 -10 -37.0 12.4 9.9 -2.4
- Vehicle Interference 49 93 44 89.8 1 0 -1 -100.0 2.0 0.0 -2.0
- Theft 2818 2603 -215 -7.6 831 699 -132 -15.9 29.5 26.9 -2.6
- Theft from the Person 284 173 -111 -39.1 8 7 -1 -12.5 2.8 4.0 1.2
- Theft of Pedal Cycle 340 346 6 1.8 17 15 -2 -11.8 5.0 4.3 -0.7
- Shoplifting 933 952 19 2.0 641 554 -87 -13.6 68.7 58.2 -10.5
- Other Theft 1261 1132 -129 -10.2 165 123 -42 -25.5 13.1 10.9 -2.2
Criminal Damage inc. Arson 1228 1165 -63 -5.1 233 198 -35 -15.0 19.0 17.0 -2.0
- Criminal Damage 1187 1124 -63 -5.3 226 193 -33 -14.6 19.0 17.2 -1.9
- Arson 41 41 0 0.0 7 5 -2 -28.6 17.1 12.2 -4.9
Racial/Religiously Aggravated Offences 63 68 5 7.9 24 22 -2 -8.3 38.1 32.4 -5.7
State Based Crime
Crime Type 2014 2015 # diff. % diff. 2014 2015 # diff. % diff. 2014 2015% pt.
diff.
Drug Offences 415 412 -3 -0.7 397 389 -8 -2.0 95.7 94.4 -1.2
- Trafficking of Drugs 41 63 22 53.7 32 46 14 43.8 78.0 73.0 -5.0
- Possession of Drugs 374 349 -25 -6.7 365 343 -22 -6.0 97.6 98.3 0.7
Possession of Weapons 50 60 10 20.0 42 42 0 0.0 84.0 70.0 -14.0
Public Order 381 373 -8 -2.1 198 147 -51 -25.8 52.0 39.4 -12.6
Miscellaneous Crimes against Society 142 138 -4 -2.8 87 71 -16 -18.4 61.3 51.4 -9.8
Rolling 12 Months to JulyOffences Outcomes Solved Rates %
Offences Outcomes Solved Rates %
Offences Outcomes Solved Rates %
Not Protectively MarkedED]
Corporate Services: Performance Summary Essex Police Performance Summary: To July 2015
11
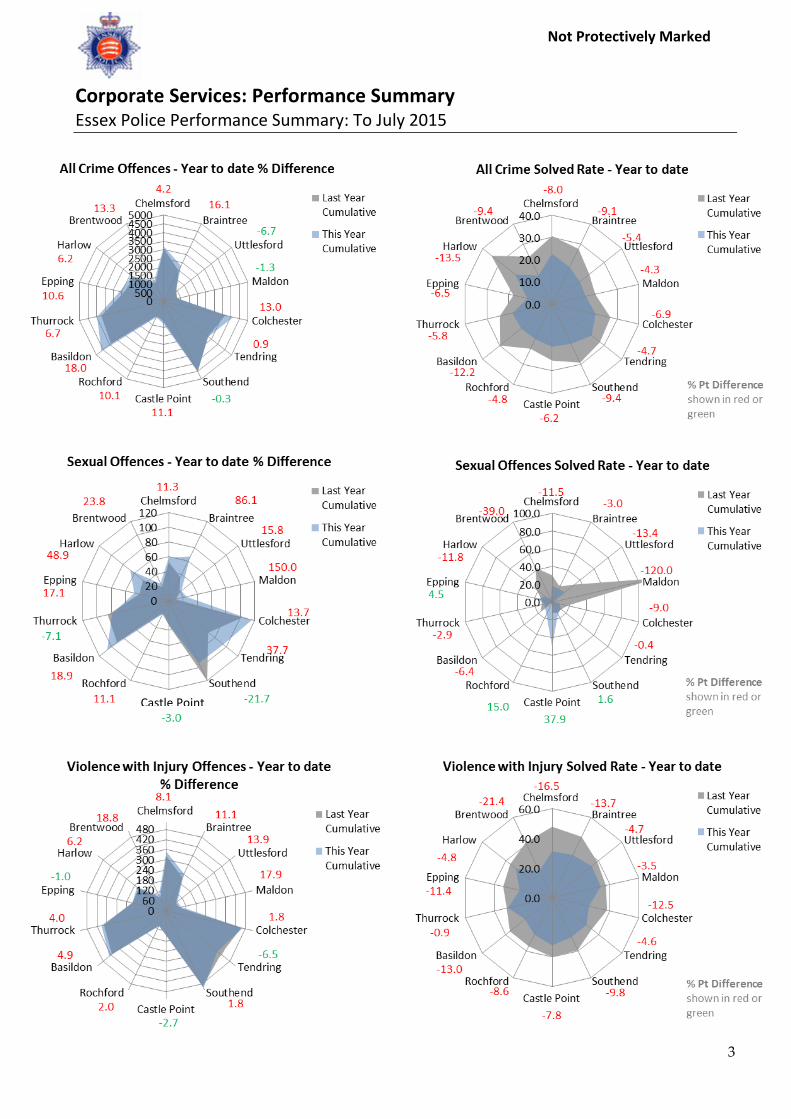
Braintree
Top Level
Crime Type 2014 2015 # diff. % diff. 2014 2015 # diff. % diff. 2014 2015% pt.
diff.
Anti-Social Behaviour (incidents) 1385 1292 -93 -6.7 - - - - - - -
All Crime (excl. Action (NFIB) Fraud) 1974 2291 317 16.1 543 421 -122 -22.5 27.5 18.4 -9.1
- State Based Crime 164 189 25 15.2 120 91 -29 -24.2 73.2 48.1 -25.0
- Victim Based Crime 1810 2102 292 16.1 423 330 -93 -22.0 23.4 15.7 -7.7
Victim Based Crime
Crime Type 2014 2015 # diff. % diff. 2014 2015 # diff. % diff. 2014 2015% pt.
diff.
Violence Against the Person 471 612 141 29.9 207 180 -27 -13.0 43.9 29.4 -14.5
- Homicide 1 0 -1 -100.0 1 0 -1 -100.0 100.0 - -
- Violence with Injury 217 241 24 11.1 99 77 -22 -22.2 45.6 32.0 -13.7
- Violence without Injury 253 371 118 46.6 107 103 -4 -3.7 42.3 27.8 -14.5
Sexual Offences 36 67 31 86.1 7 11 4 57.1 19.4 16.4 -3.0
- Rape 12 21 9 75.0 3 3 0 0.0 25.0 14.3 -10.7
- Rape - Under 16 yrs 6 11 5 83.3 3 3 0 0.0 50.0 27.3 -22.7
- Rape - Over 16 yrs 6 10 4 66.7 0 0 0 - 0.0 0.0 0.0
- Other Sexual Offences 24 46 22 91.7 4 8 4 100.0 16.7 17.4 0.7
Robbery 11 8 -3 -27.3 10 3 -7 -70.0 90.9 37.5 -53.4
Theft Offences 972 1044 72 7.4 146 97 -49 -33.6 15.0 9.3 -5.7
- Burglary 273 305 32 11.7 7 11 4 57.1 2.6 3.6 1.0
- Dwelling Burglary 97 128 31 32.0 5 7 2 40.0 5.2 5.5 0.3
- Other Burglary 176 177 1 0.6 2 4 2 100.0 1.1 2.3 1.1
- Vehicle Offences (incl. Interference) 183 225 42 23.0 7 4 -3 -42.9 3.8 1.8 -2.0
- Theft from Vehicle 140 174 34 24.3 2 3 1 50.0 1.4 1.7 0.3
- Theft of Motor Vehicle 31 25 -6 -19.4 5 1 -4 -80.0 16.1 4.0 -12.1
- Vehicle Interference 12 26 14 116.7 0 0 0 - 0.0 0.0 0.0
- Theft 516 514 -2 -0.4 132 82 -50 -37.9 25.6 16.0 -9.6
- Theft from the Person 36 26 -10 -27.8 1 0 -1 -100.0 2.8 0.0 -2.8
- Theft of Pedal Cycle 34 58 24 70.6 0 2 2 - 0.0 3.4 3.4
- Shoplifting 159 126 -33 -20.8 99 58 -41 -41.4 62.3 46.0 -16.2
- Other Theft 287 304 17 5.9 32 22 -10 -31.3 11.1 7.2 -3.9
Criminal Damage inc. Arson 320 371 51 15.9 53 39 -14 -26.4 16.6 10.5 -6.1
- Criminal Damage 308 359 51 16.6 52 39 -13 -25.0 16.9 10.9 -6.0
- Arson 12 12 0 0.0 1 0 -1 -100.0 8.3 0.0 -8.3
Racial/Religiously Aggravated Offences 8 7 -1 -12.5 4 1 -3 -75.0 50.0 14.3 -35.7
State Based Crime
Crime Type 2014 2015 # diff. % diff. 2014 2015 # diff. % diff. 2014 2015% pt.
diff.
Drug Offences 65 54 -11 -16.9 60 48 -12 -20.0 92.3 88.9 -3.4
- Trafficking of Drugs 6 5 -1 -16.7 7 4 -3 -42.9 116.7 80.0 -36.7
- Possession of Drugs 59 49 -10 -16.9 53 44 -9 -17.0 89.8 89.8 0.0
Possession of Weapons 7 11 4 57.1 6 7 1 16.7 85.7 63.6 -22.1
Public Order 77 94 17 22.1 40 32 -8 -20.0 51.9 34.0 -17.9
Miscellaneous Crimes against Society 15 30 15 100.0 14 4 -10 -71.4 93.3 13.3 -80.0
Cumulative Year to JulyOffences Outcomes Solved Rates %
Offences Outcomes Solved Rates %
Offences Outcomes Solved Rates %

Not Protectively MarkedED]
Corporate Services: Performance Summary Essex Police Performance Summary: To July 2015
12
Braintree
Top Level
Crime Type 2014 2015 # diff. % diff. 2014 2015 # diff. % diff. 2014 2015% pt.
diff.
Anti-Social Behaviour (incidents) 3639 3666 27 0.7 - - - - - - -
All Crime (excl. Action (NFIB) Fraud) 5693 6190 497 8.7 1564 1548 -16 -1.0 27.5 25.0 -2.5
- State Based Crime 447 561 114 25.5 327 355 28 8.6 73.2 63.3 -9.9
- Victim Based Crime 5246 5629 383 7.3 1237 1193 -44 -3.6 23.6 21.2 -2.4
Victim Based Crime
Crime Type 2014 2015 # diff. % diff. 2014 2015 # diff. % diff. 2014 2015% pt.
diff.
Violence Against the Person 1216 1528 312 25.7 554 586 32 5.8 45.6 38.4 -7.2
- Homicide 1 0 -1 -100.0 1 0 -1 -100.0 100.0 - -
- Violence with Injury 532 652 120 22.6 235 255 20 8.5 44.2 39.1 -5.1
- Violence without Injury 683 876 193 28.3 318 331 13 4.1 46.6 37.8 -8.8
Sexual Offences 112 179 67 59.8 13 27 14 107.7 11.6 15.1 3.5
- Rape 42 62 20 47.6 5 8 3 60.0 11.9 12.9 1.0
- Rape - Under 16 yrs 17 24 7 41.2 4 8 4 100.0 23.5 33.3 9.8
- Rape - Over 16 yrs 25 38 13 52.0 1 0 -1 -100.0 4.0 0.0 -4.0
- Other Sexual Offences 70 117 47 67.1 8 19 11 137.5 11.4 16.2 4.8
Robbery 25 30 5 20.0 13 5 -8 -61.5 52.0 16.7 -35.3
Theft Offences 3019 2909 -110 -3.6 506 425 -81 -16.0 16.8 14.6 -2.2
- Burglary 862 797 -65 -7.5 107 82 -25 -23.4 12.4 10.3 -2.1
- Dwelling Burglary 339 295 -44 -13.0 94 71 -23 -24.5 27.7 24.1 -3.7
- Other Burglary 523 502 -21 -4.0 13 11 -2 -15.4 2.5 2.2 -0.3
- Vehicle Offences (incl. Interference) 673 605 -68 -10.1 27 18 -9 -33.3 4.0 3.0 -1.0
- Theft from Vehicle 490 443 -47 -9.6 7 9 2 28.6 1.4 2.0 0.6
- Theft of Motor Vehicle 129 99 -30 -23.3 20 8 -12 -60.0 15.5 8.1 -7.4
- Vehicle Interference 54 63 9 16.7 0 1 1 - 0.0 1.6 1.6
- Theft 1484 1507 23 1.5 372 325 -47 -12.6 25.1 21.6 -3.5
- Theft from the Person 89 66 -23 -25.8 2 3 1 50.0 2.2 4.5 2.3
- Theft of Pedal Cycle 98 156 58 59.2 7 7 0 0.0 7.1 4.5 -2.7
- Shoplifting 441 409 -32 -7.3 264 204 -60 -22.7 59.9 49.9 -10.0
- Other Theft 856 876 20 2.3 99 111 12 12.1 11.6 12.7 1.1
Criminal Damage inc. Arson 874 983 109 12.5 151 150 -1 -0.7 17.3 15.3 -2.0
- Criminal Damage 846 953 107 12.6 149 146 -3 -2.0 17.6 15.3 -2.3
- Arson 28 30 2 7.1 2 4 2 100.0 7.1 13.3 6.2
Racial/Religiously Aggravated Offences 26 26 0 0.0 14 9 -5 -35.7 53.8 34.6 -19.2
State Based Crime
Crime Type 2014 2015 # diff. % diff. 2014 2015 # diff. % diff. 2014 2015% pt.
diff.
Drug Offences 193 211 18 9.3 193 202 9 4.7 100.0 95.7 -4.3
- Trafficking of Drugs 14 21 7 50.0 16 16 0 0.0 114.3 76.2 -38.1
- Possession of Drugs 179 190 11 6.1 177 186 9 5.1 98.9 97.9 -1.0
Possession of Weapons 22 26 4 18.2 15 19 4 26.7 68.2 73.1 4.9
Public Order 179 238 59 33.0 89 99 10 11.2 49.7 41.6 -8.1
Miscellaneous Crimes against Society 53 86 33 62.3 30 35 5 16.7 56.6 40.7 -15.9
Rolling 12 Months to JulyOffences Outcomes Solved Rates %
Offences Outcomes Solved Rates %
Offences Outcomes Solved Rates %

Not Protectively MarkedED]
Corporate Services: Performance Summary Essex Police Performance Summary: To July 2015
13
Uttlesford
Top Level
Crime Type 2014 2015 # diff. % diff. 2014 2015 # diff. % diff. 2014 2015% pt.
diff.
Anti-Social Behaviour (incidents) 506 468 -38 -7.5 - - - - - - -
All Crime (excl. Action (NFIB) Fraud) 923 861 -62 -6.7 198 138 -60 -30.3 21.5 16.0 -5.4
- State Based Crime 65 63 -2 -3.1 43 33 -10 -23.3 66.2 52.4 -13.8
- Victim Based Crime 858 798 -60 -7.0 155 105 -50 -32.3 18.1 13.2 -4.9
Victim Based Crime
Crime Type 2014 2015 # diff. % diff. 2014 2015 # diff. % diff. 2014 2015% pt.
diff.
Violence Against the Person 158 176 18 11.4 55 46 -9 -16.4 34.8 26.1 -8.7
- Homicide 0 3 3 - 0 1 1 - - 33.3 -
- Violence with Injury 72 82 10 13.9 28 28 0 0.0 38.9 34.1 -4.7
- Violence without Injury 86 91 5 5.8 27 17 -10 -37.0 31.4 18.7 -12.7
Sexual Offences 19 22 3 15.8 6 4 -2 -33.3 31.6 18.2 -13.4
- Rape 7 10 3 42.9 2 1 -1 -50.0 28.6 10.0 -18.6
- Rape - Under 16 yrs 1 6 5 500.0 1 0 -1 -100.0 100.0 0.0 -100.0
- Rape - Over 16 yrs 6 4 -2 -33.3 1 1 0 0.0 16.7 25.0 8.3
- Other Sexual Offences 12 12 0 0.0 4 3 -1 -25.0 33.3 25.0 -8.3
Robbery 2 3 1 50.0 0 2 2 - 0.0 66.7 66.7
Theft Offences 530 476 -54 -10.2 73 41 -32 -43.8 13.8 8.6 -5.2
- Burglary 176 155 -21 -11.9 27 17 -10 -37.0 15.3 11.0 -4.4
- Dwelling Burglary 40 61 21 52.5 22 7 -15 -68.2 55.0 11.5 -43.5
- Other Burglary 136 94 -42 -30.9 5 10 5 100.0 3.7 10.6 7.0
- Vehicle Offences (incl. Interference) 119 124 5 4.2 3 9 6 200.0 2.5 7.3 4.7
- Theft from Vehicle 81 91 10 12.3 0 7 7 - 0.0 7.7 7.7
- Theft of Motor Vehicle 22 16 -6 -27.3 3 2 -1 -33.3 13.6 12.5 -1.1
- Vehicle Interference 16 17 1 6.3 0 0 0 - 0.0 0.0 0.0
- Theft 235 197 -38 -16.2 43 15 -28 -65.1 18.3 7.6 -10.7
- Theft from the Person 3 18 15 500.0 1 1 0 0.0 33.3 5.6 -27.8
- Theft of Pedal Cycle 10 6 -4 -40.0 0 0 0 - 0.0 0.0 0.0
- Shoplifting 44 24 -20 -45.5 27 6 -21 -77.8 61.4 25.0 -36.4
- Other Theft 178 149 -29 -16.3 15 8 -7 -46.7 8.4 5.4 -3.1
Criminal Damage inc. Arson 149 121 -28 -18.8 21 12 -9 -42.9 14.1 9.9 -4.2
- Criminal Damage 145 115 -30 -20.7 20 12 -8 -40.0 13.8 10.4 -3.4
- Arson 4 6 2 50.0 1 0 -1 -100.0 25.0 0.0 -25.0
Racial/Religiously Aggravated Offences 2 1 -1 -50.0 1 1 0 0.0 50.0 100.0 50.0
State Based Crime
Crime Type 2014 2015 # diff. % diff. 2014 2015 # diff. % diff. 2014 2015% pt.
diff.
Drug Offences 21 17 -4 -19.0 21 16 -5 -23.8 100.0 94.1 -5.9
- Trafficking of Drugs 3 2 -1 -33.3 1 1 0 0.0 33.3 50.0 16.7
- Possession of Drugs 18 15 -3 -16.7 20 15 -5 -25.0 111.1 100.0 -11.1
Possession of Weapons 4 8 4 100.0 2 5 3 150.0 50.0 62.5 12.5
Public Order 25 30 5 20.0 12 8 -4 -33.3 48.0 26.7 -21.3
Miscellaneous Crimes against Society 15 8 -7 -46.7 8 4 -4 -50.0 53.3 50.0 -3.3
Cumulative Year to JulyOffences Outcomes Solved Rates %
Offences Outcomes Solved Rates %
Offences Outcomes Solved Rates %

Not Protectively MarkedED]
Corporate Services: Performance Summary Essex Police Performance Summary: To July 2015
14
Uttlesford
Top Level
Crime Type 2014 2015 # diff. % diff. 2014 2015 # diff. % diff. 2014 2015% pt.
diff.
Anti-Social Behaviour (incidents) 1295 1333 38 2.9 - - - - - - -
All Crime (excl. Action (NFIB) Fraud) 2706 2546 -160 -5.9 511 498 -13 -2.5 18.9 19.6 0.7
- State Based Crime 154 171 17 11.0 110 108 -2 -1.8 71.4 63.2 -8.3
- Victim Based Crime 2552 2375 -177 -6.9 401 390 -11 -2.7 15.7 16.4 0.7
Victim Based Crime
Crime Type 2014 2015 # diff. % diff. 2014 2015 # diff. % diff. 2014 2015% pt.
diff.
Violence Against the Person 382 501 119 31.2 157 178 21 13.4 41.1 35.5 -5.6
- Homicide 0 3 3 - 0 1 1 - - 33.3 -
- Violence with Injury 181 234 53 29.3 78 98 20 25.6 43.1 41.9 -1.2
- Violence without Injury 201 264 63 31.3 79 79 0 0.0 39.3 29.9 -9.4
Sexual Offences 44 70 26 59.1 15 17 2 13.3 34.1 24.3 -9.8
- Rape 15 26 11 73.3 4 6 2 50.0 26.7 23.1 -3.6
- Rape - Under 16 yrs 4 15 11 275.0 1 3 2 200.0 25.0 20.0 -5.0
- Rape - Over 16 yrs 11 11 0 0.0 3 3 0 0.0 27.3 27.3 0.0
- Other Sexual Offences 29 44 15 51.7 11 11 0 0.0 37.9 25.0 -12.9
Robbery 8 8 0 0.0 4 2 -2 -50.0 50.0 25.0 -25.0
Theft Offences 1712 1413 -299 -17.5 173 142 -31 -17.9 10.1 10.0 -0.1
- Burglary 623 507 -116 -18.6 55 41 -14 -25.5 8.8 8.1 -0.7
- Dwelling Burglary 223 148 -75 -33.6 48 26 -22 -45.8 21.5 17.6 -4.0
- Other Burglary 400 359 -41 -10.3 7 15 8 114.3 1.8 4.2 2.4
- Vehicle Offences (incl. Interference) 419 357 -62 -14.8 7 18 11 157.1 1.7 5.0 3.4
- Theft from Vehicle 320 261 -59 -18.4 0 7 7 - 0.0 2.7 2.7
- Theft of Motor Vehicle 62 56 -6 -9.7 7 11 4 57.1 11.3 19.6 8.4
- Vehicle Interference 37 40 3 8.1 0 0 0 - 0.0 0.0 0.0
- Theft 670 549 -121 -18.1 111 83 -28 -25.2 16.6 15.1 -1.4
- Theft from the Person 13 27 14 107.7 1 1 0 0.0 7.7 3.7 -4.0
- Theft of Pedal Cycle 30 20 -10 -33.3 1 0 -1 -100.0 3.3 0.0 -3.3
- Shoplifting 128 100 -28 -21.9 62 37 -25 -40.3 48.4 37.0 -11.4
- Other Theft 499 402 -97 -19.4 47 45 -2 -4.3 9.4 11.2 1.8
Criminal Damage inc. Arson 406 383 -23 -5.7 52 51 -1 -1.9 12.8 13.3 0.5
- Criminal Damage 391 369 -22 -5.6 51 50 -1 -2.0 13.0 13.6 0.5
- Arson 15 14 -1 -6.7 1 1 0 0.0 6.7 7.1 0.5
Racial/Religiously Aggravated Offences 12 9 -3 -25.0 4 3 -1 -25.0 33.3 33.3 0.0
State Based Crime
Crime Type 2014 2015 # diff. % diff. 2014 2015 # diff. % diff. 2014 2015% pt.
diff.
Drug Offences 53 57 4 7.5 52 54 2 3.8 98.1 94.7 -3.4
- Trafficking of Drugs 4 10 6 150.0 3 7 4 133.3 75.0 70.0 -5.0
- Possession of Drugs 49 47 -2 -4.1 49 47 -2 -4.1 100.0 100.0 0.0
Possession of Weapons 6 18 12 200.0 4 11 7 175.0 66.7 61.1 -5.6
Public Order 68 64 -4 -5.9 39 30 -9 -23.1 57.4 46.9 -10.5
Miscellaneous Crimes against Society 27 32 5 18.5 15 13 -2 -13.3 55.6 40.6 -14.9
Rolling 12 Months to JulyOffences Outcomes Solved Rates %
Offences Outcomes Solved Rates %
Offences Outcomes Solved Rates %

Not Protectively MarkedED]
Corporate Services: Performance Summary Essex Police Performance Summary: To July 2015
15
Maldon
Top Level
Crime Type 2014 2015 # diff. % diff. 2014 2015 # diff. % diff. 2014 2015% pt.
diff.
Anti-Social Behaviour (incidents) 420 413 -7 -1.7 - - - - - - -
All Crime (excl. Action (NFIB) Fraud) 799 789 -10 -1.3 159 123 -36 -22.6 19.9 15.6 -4.3
- State Based Crime 49 96 47 95.9 34 46 12 35.3 69.4 47.9 -21.5
- Victim Based Crime 750 693 -57 -7.6 125 77 -48 -38.4 16.7 11.1 -5.6
Victim Based Crime
Crime Type 2014 2015 # diff. % diff. 2014 2015 # diff. % diff. 2014 2015% pt.
diff.
Violence Against the Person 180 212 32 17.8 63 52 -11 -17.5 35.0 24.5 -10.5
- Homicide 0 1 1 - 0 1 1 - - 100.0 -
- Violence with Injury 78 92 14 17.9 29 31 2 6.9 37.2 33.7 -3.5
- Violence without Injury 102 119 17 16.7 34 20 -14 -41.2 33.3 16.8 -16.5
Sexual Offences 10 25 15 150.0 12 0 -12 -100.0 120.0 0.0 -120.0
- Rape 5 19 14 280.0 6 0 -6 -100.0 120.0 0.0 -120.0
- Rape - Under 16 yrs 3 13 10 333.3 3 0 -3 -100.0 100.0 0.0 -100.0
- Rape - Over 16 yrs 2 6 4 200.0 3 0 -3 -100.0 150.0 0.0 -150.0
- Other Sexual Offences 5 6 1 20.0 6 0 -6 -100.0 120.0 0.0 -120.0
Robbery 4 4 0 0.0 1 2 1 100.0 25.0 50.0 25.0
Theft Offences 447 364 -83 -18.6 40 14 -26 -65.0 8.9 3.8 -5.1
- Burglary 113 123 10 8.8 15 1 -14 -93.3 13.3 0.8 -12.5
- Dwelling Burglary 21 30 9 42.9 14 1 -13 -92.9 66.7 3.3 -63.3
- Other Burglary 92 93 1 1.1 1 0 -1 -100.0 1.1 0.0 -1.1
- Vehicle Offences (incl. Interference) 146 89 -57 -39.0 6 4 -2 -33.3 4.1 4.5 0.4
- Theft from Vehicle 100 61 -39 -39.0 3 2 -1 -33.3 3.0 3.3 0.3
- Theft of Motor Vehicle 32 21 -11 -34.4 3 2 -1 -33.3 9.4 9.5 0.1
- Vehicle Interference 14 7 -7 -50.0 0 0 0 - 0.0 0.0 0.0
- Theft 188 152 -36 -19.1 19 9 -10 -52.6 10.1 5.9 -4.2
- Theft from the Person 11 16 5 45.5 1 0 -1 -100.0 9.1 0.0 -9.1
- Theft of Pedal Cycle 16 5 -11 -68.8 0 0 0 - 0.0 0.0 0.0
- Shoplifting 38 24 -14 -36.8 12 5 -7 -58.3 31.6 20.8 -10.7
- Other Theft 123 107 -16 -13.0 6 4 -2 -33.3 4.9 3.7 -1.1
Criminal Damage inc. Arson 109 88 -21 -19.3 9 9 0 0.0 8.3 10.2 2.0
- Criminal Damage 107 85 -22 -20.6 7 8 1 14.3 6.5 9.4 2.9
- Arson 2 3 1 50.0 2 1 -1 -50.0 100.0 33.3 -66.7
Racial/Religiously Aggravated Offences 1 4 3 300.0 1 0 -1 -100.0 100.0 0.0 -100.0
State Based Crime
Crime Type 2014 2015 # diff. % diff. 2014 2015 # diff. % diff. 2014 2015% pt.
diff.
Drug Offences 16 33 17 106.3 16 24 8 50.0 100.0 72.7 -27.3
- Trafficking of Drugs 4 9 5 125.0 5 6 1 20.0 125.0 66.7 -58.3
- Possession of Drugs 12 24 12 100.0 11 18 7 63.6 91.7 75.0 -16.7
Possession of Weapons 3 6 3 100.0 3 4 1 33.3 100.0 66.7 -33.3
Public Order 27 44 17 63.0 13 13 0 0.0 48.1 29.5 -18.6
Miscellaneous Crimes against Society 3 13 10 333.3 2 5 3 150.0 66.7 38.5 -28.2
Cumulative Year to JulyOffences Outcomes Solved Rates %
Offences Outcomes Solved Rates %
Offences Outcomes Solved Rates %

Not Protectively MarkedED]
Corporate Services: Performance Summary Essex Police Performance Summary: To July 2015
16
Maldon
Top Level
Crime Type 2014 2015 # diff. % diff. 2014 2015 # diff. % diff. 2014 2015% pt.
diff.
Anti-Social Behaviour (incidents) 1140 1127 -13 -1.1 - - - - - - -
All Crime (excl. Action (NFIB) Fraud) 2207 2297 90 4.1 479 481 2 0.4 21.7 20.9 -0.8
- State Based Crime 148 230 82 55.4 106 135 29 27.4 71.6 58.7 -12.9
- Victim Based Crime 2059 2067 8 0.4 373 346 -27 -7.2 18.1 16.7 -1.4
Victim Based Crime
Crime Type 2014 2015 # diff. % diff. 2014 2015 # diff. % diff. 2014 2015% pt.
diff.
Violence Against the Person 451 573 122 27.1 173 188 15 8.7 38.4 32.8 -5.5
- Homicide 1 1 0 0.0 0 1 1 - 0.0 100.0 100.0
- Violence with Injury 202 254 52 25.7 80 99 19 23.8 39.6 39.0 -0.6
- Violence without Injury 248 318 70 28.2 93 88 -5 -5.4 37.5 27.7 -9.8
Sexual Offences 34 70 36 105.9 14 8 -6 -42.9 41.2 11.4 -29.7
- Rape 14 38 24 171.4 7 1 -6 -85.7 50.0 2.6 -47.4
- Rape - Under 16 yrs 6 21 15 250.0 3 1 -2 -66.7 50.0 4.8 -45.2
- Rape - Over 16 yrs 8 17 9 112.5 4 0 -4 -100.0 50.0 0.0 -50.0
- Other Sexual Offences 20 32 12 60.0 7 7 0 0.0 35.0 21.9 -13.1
Robbery 14 14 0 0.0 2 10 8 400.0 14.3 71.4 57.1
Theft Offences 1212 1113 -99 -8.2 142 94 -48 -33.8 11.7 8.4 -3.3
- Burglary 301 328 27 9.0 24 8 -16 -66.7 8.0 2.4 -5.5
- Dwelling Burglary 91 75 -16 -17.6 20 5 -15 -75.0 22.0 6.7 -15.3
- Other Burglary 210 253 43 20.5 4 3 -1 -25.0 1.9 1.2 -0.7
- Vehicle Offences (incl. Interference) 354 313 -41 -11.6 27 14 -13 -48.1 7.6 4.5 -3.2
- Theft from Vehicle 238 200 -38 -16.0 22 9 -13 -59.1 9.2 4.5 -4.7
- Theft of Motor Vehicle 90 82 -8 -8.9 5 5 0 0.0 5.6 6.1 0.5
- Vehicle Interference 26 31 5 19.2 0 0 0 - 0.0 0.0 0.0
- Theft 557 472 -85 -15.3 91 72 -19 -20.9 16.3 15.3 -1.1
- Theft from the Person 37 39 2 5.4 1 0 -1 -100.0 2.7 0.0 -2.7
- Theft of Pedal Cycle 37 20 -17 -45.9 0 0 0 - 0.0 0.0 0.0
- Shoplifting 106 97 -9 -8.5 54 49 -5 -9.3 50.9 50.5 -0.4
- Other Theft 377 316 -61 -16.2 36 23 -13 -36.1 9.5 7.3 -2.3
Criminal Damage inc. Arson 348 297 -51 -14.7 42 46 4 9.5 12.1 15.5 3.4
- Criminal Damage 340 287 -53 -15.6 39 43 4 10.3 11.5 15.0 3.5
- Arson 8 10 2 25.0 3 3 0 0.0 37.5 30.0 -7.5
Racial/Religiously Aggravated Offences 12 13 1 8.3 6 3 -3 -50.0 50.0 23.1 -26.9
State Based Crime
Crime Type 2014 2015 # diff. % diff. 2014 2015 # diff. % diff. 2014 2015% pt.
diff.
Drug Offences 54 84 30 55.6 55 69 14 25.5 101.9 82.1 -19.7
- Trafficking of Drugs 9 24 15 166.7 7 14 7 100.0 77.8 58.3 -19.4
- Possession of Drugs 45 60 15 33.3 48 55 7 14.6 106.7 91.7 -15.0
Possession of Weapons 10 14 4 40.0 8 11 3 37.5 80.0 78.6 -1.4
Public Order 66 96 30 45.5 34 42 8 23.5 51.5 43.8 -7.8
Miscellaneous Crimes against Society 18 36 18 100.0 9 13 4 44.4 50.0 36.1 -13.9
Rolling 12 Months to JulyOffences Outcomes Solved Rates %
Offences Outcomes Solved Rates %
Offences Outcomes Solved Rates %

Not Protectively MarkedED]
Corporate Services: Performance Summary Essex Police Performance Summary: To July 2015
17
Colchester
Top Level
Crime Type 2014 2015 # diff. % diff. 2014 2015 # diff. % diff. 2014 2015% pt.
diff.
Anti-Social Behaviour (incidents) 2184 2215 31 1.4 - - - - - - -
All Crime (excl. Action (NFIB) Fraud) 3635 4106 471 13.0 981 825 -156 -15.9 27.0 20.1 -6.9
- State Based Crime 350 384 34 9.7 225 161 -64 -28.4 64.3 41.9 -22.4
- Victim Based Crime 3285 3722 437 13.3 756 664 -92 -12.2 23.0 17.8 -5.2
Victim Based Crime
Crime Type 2014 2015 # diff. % diff. 2014 2015 # diff. % diff. 2014 2015% pt.
diff.
Violence Against the Person 913 1128 215 23.5 313 253 -60 -19.2 34.3 22.4 -11.9
- Homicide 2 0 -2 -100.0 1 2 1 100.0 50.0 - -
- Violence with Injury 455 463 8 1.8 173 118 -55 -31.8 38.0 25.5 -12.5
- Violence without Injury 456 665 209 45.8 139 133 -6 -4.3 30.5 20.0 -10.5
Sexual Offences 102 116 14 13.7 18 10 -8 -44.4 17.6 8.6 -9.0
- Rape 35 49 14 40.0 5 3 -2 -40.0 14.3 6.1 -8.2
- Rape - Under 16 yrs 10 16 6 60.0 1 1 0 0.0 10.0 6.3 -3.8
- Rape - Over 16 yrs 25 33 8 32.0 4 2 -2 -50.0 16.0 6.1 -9.9
- Other Sexual Offences 67 67 0 0.0 13 7 -6 -46.2 19.4 10.4 -9.0
Robbery 23 33 10 43.5 10 3 -7 -70.0 43.5 9.1 -34.4
Theft Offences 1696 1867 171 10.1 316 315 -1 -0.3 18.6 16.9 -1.8
- Burglary 392 491 99 25.3 27 54 27 100.0 6.9 11.0 4.1
- Dwelling Burglary 157 237 80 51.0 11 47 36 327.3 7.0 19.8 12.8
- Other Burglary 235 254 19 8.1 16 7 -9 -56.3 6.8 2.8 -4.1
- Vehicle Offences (incl. Interference) 229 279 50 21.8 17 8 -9 -52.9 7.4 2.9 -4.6
- Theft from Vehicle 134 171 37 27.6 6 3 -3 -50.0 4.5 1.8 -2.7
- Theft of Motor Vehicle 70 85 15 21.4 11 5 -6 -54.5 15.7 5.9 -9.8
- Vehicle Interference 25 23 -2 -8.0 0 0 0 - 0.0 0.0 0.0
- Theft 1075 1097 22 2.0 272 253 -19 -7.0 25.3 23.1 -2.2
- Theft from the Person 47 60 13 27.7 2 5 3 150.0 4.3 8.3 4.1
- Theft of Pedal Cycle 142 187 45 31.7 3 20 17 566.7 2.1 10.7 8.6
- Shoplifting 391 405 14 3.6 230 189 -41 -17.8 58.8 46.7 -12.2
- Other Theft 495 445 -50 -10.1 37 39 2 5.4 7.5 8.8 1.3
Criminal Damage inc. Arson 551 578 27 4.9 99 83 -16 -16.2 18.0 14.4 -3.6
- Criminal Damage 541 560 19 3.5 98 81 -17 -17.3 18.1 14.5 -3.7
- Arson 10 18 8 80.0 1 2 1 100.0 10.0 11.1 1.1
Racial/Religiously Aggravated Offences 41 24 -17 -41.5 11 8 -3 -27.3 26.8 33.3 6.5
State Based Crime
Crime Type 2014 2015 # diff. % diff. 2014 2015 # diff. % diff. 2014 2015% pt.
diff.
Drug Offences 149 90 -59 -39.6 129 78 -51 -39.5 86.6 86.7 0.1
- Trafficking of Drugs 19 25 6 31.6 15 18 3 20.0 78.9 72.0 -6.9
- Possession of Drugs 130 65 -65 -50.0 114 60 -54 -47.4 87.7 92.3 4.6
Possession of Weapons 15 25 10 66.7 11 10 -1 -9.1 73.3 40.0 -33.3
Public Order 157 199 42 26.8 71 54 -17 -23.9 45.2 27.1 -18.1
Miscellaneous Crimes against Society 29 70 41 141.4 14 19 5 35.7 48.3 27.1 -21.1
Cumulative Year to JulyOffences Outcomes Solved Rates %
Offences Outcomes Solved Rates %
Offences Outcomes Solved Rates %

Not Protectively MarkedED]
Corporate Services: Performance Summary Essex Police Performance Summary: To July 2015
18
Colchester
Top Level
Crime Type 2014 2015 # diff. % diff. 2014 2015 # diff. % diff. 2014 2015% pt.
diff.
Anti-Social Behaviour (incidents) 5760 6004 244 4.2 - - - - - - -
All Crime (excl. Action (NFIB) Fraud) 10806 11430 624 5.8 2888 2871 -17 -0.6 26.7 25.1 -1.6
- State Based Crime 945 984 39 4.1 638 591 -47 -7.4 67.5 60.1 -7.5
- Victim Based Crime 9861 10446 585 5.9 2250 2280 30 1.3 22.8 21.8 -1.0
Victim Based Crime
Crime Type 2014 2015 # diff. % diff. 2014 2015 # diff. % diff. 2014 2015% pt.
diff.
Violence Against the Person 2655 3031 376 14.2 929 933 4 0.4 35.0 30.8 -4.2
- Homicide 4 0 -4 -100.0 2 2 0 0.0 50.0 - -
- Violence with Injury 1274 1300 26 2.0 474 459 -15 -3.2 37.2 35.3 -1.9
- Violence without Injury 1377 1731 354 25.7 453 472 19 4.2 32.9 27.3 -5.6
Sexual Offences 270 325 55 20.4 51 34 -17 -33.3 18.9 10.5 -8.4
- Rape 83 130 47 56.6 16 6 -10 -62.5 19.3 4.6 -14.7
- Rape - Under 16 yrs 23 39 16 69.6 9 2 -7 -77.8 39.1 5.1 -34.0
- Rape - Over 16 yrs 60 91 31 51.7 7 4 -3 -42.9 11.7 4.4 -7.3
- Other Sexual Offences 187 195 8 4.3 35 28 -7 -20.0 18.7 14.4 -4.4
Robbery 79 87 8 10.1 21 19 -2 -9.5 26.6 21.8 -4.7
Theft Offences 5198 5322 124 2.4 988 1030 42 4.3 19.0 19.4 0.3
- Burglary 1177 1430 253 21.5 99 143 44 44.4 8.4 10.0 1.6
- Dwelling Burglary 528 718 190 36.0 53 109 56 105.7 10.0 15.2 5.1
- Other Burglary 649 712 63 9.7 46 34 -12 -26.1 7.1 4.8 -2.3
- Vehicle Offences (incl. Interference) 769 867 98 12.7 39 49 10 25.6 5.1 5.7 0.6
- Theft from Vehicle 530 532 2 0.4 13 16 3 23.1 2.5 3.0 0.6
- Theft of Motor Vehicle 184 239 55 29.9 25 30 5 20.0 13.6 12.6 -1.0
- Vehicle Interference 55 96 41 74.5 1 3 2 200.0 1.8 3.1 1.3
- Theft 3252 3025 -227 -7.0 850 838 -12 -1.4 26.1 27.7 1.6
- Theft from the Person 196 147 -49 -25.0 3 5 2 66.7 1.5 3.4 1.9
- Theft of Pedal Cycle 436 414 -22 -5.0 18 32 14 77.8 4.1 7.7 3.6
- Shoplifting 1109 1138 29 2.6 682 650 -32 -4.7 61.5 57.1 -4.4
- Other Theft 1511 1326 -185 -12.2 147 151 4 2.7 9.7 11.4 1.7
Criminal Damage inc. Arson 1659 1681 22 1.3 261 264 3 1.1 15.7 15.7 0.0
- Criminal Damage 1627 1636 9 0.6 258 258 0 0.0 15.9 15.8 -0.1
- Arson 32 45 13 40.6 3 6 3 100.0 9.4 13.3 4.0
Racial/Religiously Aggravated Offences 101 81 -20 -19.8 27 40 13 48.1 26.7 49.4 22.7
State Based Crime
Crime Type 2014 2015 # diff. % diff. 2014 2015 # diff. % diff. 2014 2015% pt.
diff.
Drug Offences 342 303 -39 -11.4 319 300 -19 -6.0 93.3 99.0 5.7
- Trafficking of Drugs 35 49 14 40.0 30 41 11 36.7 85.7 83.7 -2.0
- Possession of Drugs 307 254 -53 -17.3 289 259 -30 -10.4 94.1 102.0 7.8
Possession of Weapons 53 58 5 9.4 41 32 -9 -22.0 77.4 55.2 -22.2
Public Order 440 466 26 5.9 222 185 -37 -16.7 50.5 39.7 -10.8
Miscellaneous Crimes against Society 110 157 47 42.7 56 74 18 32.1 50.9 47.1 -3.8
Rolling 12 Months to JulyOffences Outcomes Solved Rates %
Offences Outcomes Solved Rates %
Offences Outcomes Solved Rates %

Not Protectively MarkedED]
Corporate Services: Performance Summary Essex Police Performance Summary: To July 2015
19
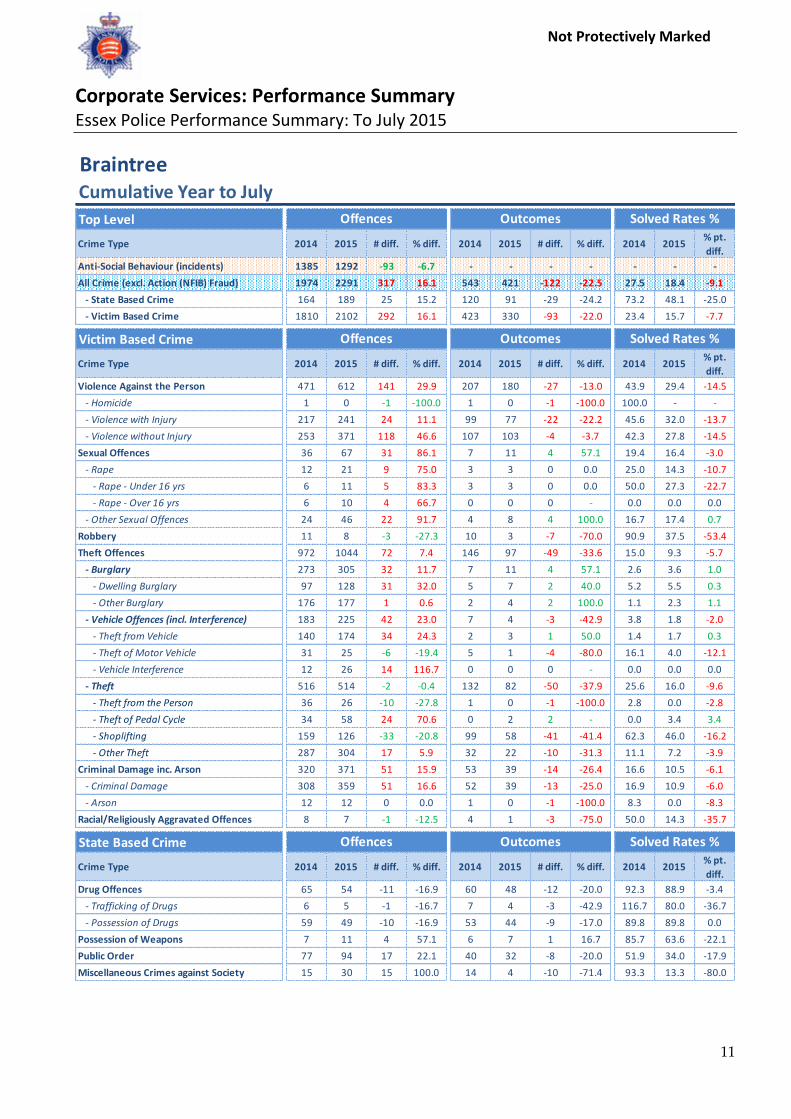
Tendring
Top Level
Crime Type 2014 2015 # diff. % diff. 2014 2015 # diff. % diff. 2014 2015% pt.
diff.
Anti-Social Behaviour (incidents) 1883 1840 -43 -2.3 - - - - - - -
All Crime (excl. Action (NFIB) Fraud) 3261 3291 30 0.9 897 749 -148 -16.5 27.5 22.8 -4.7
- State Based Crime 298 315 17 5.7 197 153 -44 -22.3 66.1 48.6 -17.5
- Victim Based Crime 2963 2976 13 0.4 700 596 -104 -14.9 23.6 20.0 -3.6
Victim Based Crime
Crime Type 2014 2015 # diff. % diff. 2014 2015 # diff. % diff. 2014 2015% pt.
diff.
Violence Against the Person 911 1014 103 11.3 311 279 -32 -10.3 34.1 27.5 -6.6
- Homicide 0 2 2 - 0 1 1 - - 50.0 -
- Violence with Injury 413 386 -27 -6.5 141 114 -27 -19.1 34.1 29.5 -4.6
- Violence without Injury 498 626 128 25.7 170 164 -6 -3.5 34.1 26.2 -7.9
Sexual Offences 69 95 26 37.7 9 12 3 33.3 13.0 12.6 -0.4
- Rape 23 38 15 65.2 3 6 3 100.0 13.0 15.8 2.7
- Rape - Under 16 yrs 4 16 12 300.0 3 2 -1 -33.3 75.0 12.5 -62.5
- Rape - Over 16 yrs 19 22 3 15.8 0 4 4 - 0.0 18.2 18.2
- Other Sexual Offences 46 57 11 23.9 6 6 0 0.0 13.0 10.5 -2.5
Robbery 40 27 -13 -32.5 6 3 -3 -50.0 15.0 11.1 -3.9
Theft Offences 1481 1389 -92 -6.2 286 240 -46 -16.1 19.3 17.3 -2.0
- Burglary 426 413 -13 -3.1 29 30 1 3.4 6.8 7.3 0.5
- Dwelling Burglary 152 183 31 20.4 14 27 13 92.9 9.2 14.8 5.5
- Other Burglary 274 230 -44 -16.1 15 3 -12 -80.0 5.5 1.3 -4.2
- Vehicle Offences (incl. Interference) 230 249 19 8.3 16 5 -11 -68.8 7.0 2.0 -4.9
- Theft from Vehicle 158 182 24 15.2 4 1 -3 -75.0 2.5 0.5 -2.0
- Theft of Motor Vehicle 53 49 -4 -7.5 12 3 -9 -75.0 22.6 6.1 -16.5
- Vehicle Interference 19 18 -1 -5.3 0 1 1 - 0.0 5.6 5.6
- Theft 825 727 -98 -11.9 241 205 -36 -14.9 29.2 28.2 -1.0
- Theft from the Person 25 40 15 60.0 0 1 1 - 0.0 2.5 2.5
- Theft of Pedal Cycle 65 37 -28 -43.1 0 4 4 - 0.0 10.8 10.8
- Shoplifting 340 324 -16 -4.7 213 174 -39 -18.3 62.6 53.7 -8.9
- Other Theft 395 326 -69 -17.5 28 26 -2 -7.1 7.1 8.0 0.9
Criminal Damage inc. Arson 462 451 -11 -2.4 88 62 -26 -29.5 19.0 13.7 -5.3
- Criminal Damage 438 434 -4 -0.9 88 62 -26 -29.5 20.1 14.3 -5.8
- Arson 24 17 -7 -29.2 0 0 0 - 0.0 0.0 0.0
Racial/Religiously Aggravated Offences 24 10 -14 -58.3 6 3 -3 -50.0 25.0 30.0 5.0
State Based Crime
Crime Type 2014 2015 # diff. % diff. 2014 2015 # diff. % diff. 2014 2015% pt.
diff.
Drug Offences 97 79 -18 -18.6 90 73 -17 -18.9 92.8 92.4 -0.4
- Trafficking of Drugs 7 20 13 185.7 9 20 11 122.2 128.6 100.0 -28.6
- Possession of Drugs 90 59 -31 -34.4 81 53 -28 -34.6 90.0 89.8 -0.2
Possession of Weapons 22 20 -2 -9.1 20 12 -8 -40.0 90.9 60.0 -30.9
Public Order 139 155 16 11.5 72 52 -20 -27.8 51.8 33.5 -18.3
Miscellaneous Crimes against Society 40 61 21 52.5 15 16 1 6.7 37.5 26.2 -11.3
Cumulative Year to JulyOffences Outcomes Solved Rates %
Offences Outcomes Solved Rates %
Offences Outcomes Solved Rates %
Not Protectively MarkedED]
Corporate Services: Performance Summary Essex Police Performance Summary: To July 2015
20
Tendring
Top Level
Crime Type 2014 2015 # diff. % diff. 2014 2015 # diff. % diff. 2014 2015% pt.
diff.
Anti-Social Behaviour (incidents) 4895 4821 -74 -1.5 - - - - - - -
All Crime (excl. Action (NFIB) Fraud) 9171 9238 67 0.7 2838 2550 -288 -10.1 30.9 27.6 -3.3
- State Based Crime 818 857 39 4.8 612 507 -105 -17.2 74.8 59.2 -15.7
- Victim Based Crime 8353 8381 28 0.3 2226 2043 -183 -8.2 26.6 24.4 -2.3
Victim Based Crime
Crime Type 2014 2015 # diff. % diff. 2014 2015 # diff. % diff. 2014 2015% pt.
diff.
Violence Against the Person 2351 2660 309 13.1 914 905 -9 -1.0 38.9 34.0 -4.9
- Homicide 0 3 3 - 0 1 1 - - 33.3 -
- Violence with Injury 1089 1090 1 0.1 438 389 -49 -11.2 40.2 35.7 -4.5
- Violence without Injury 1262 1567 305 24.2 476 515 39 8.2 37.7 32.9 -4.9
Sexual Offences 198 274 76 38.4 48 44 -4 -8.3 24.2 16.1 -8.2
- Rape 69 96 27 39.1 12 13 1 8.3 17.4 13.5 -3.8
- Rape - Under 16 yrs 19 35 16 84.2 8 5 -3 -37.5 42.1 14.3 -27.8
- Rape - Over 16 yrs 50 61 11 22.0 4 8 4 100.0 8.0 13.1 5.1
- Other Sexual Offences 129 178 49 38.0 36 31 -5 -13.9 27.9 17.4 -10.5
Robbery 100 77 -23 -23.0 24 12 -12 -50.0 24.0 15.6 -8.4
Theft Offences 4289 4025 -264 -6.2 959 881 -78 -8.1 22.4 21.9 -0.5
- Burglary 1258 1102 -156 -12.4 145 141 -4 -2.8 11.5 12.8 1.3
- Dwelling Burglary 541 474 -67 -12.4 91 84 -7 -7.7 16.8 17.7 0.9
- Other Burglary 717 628 -89 -12.4 54 57 3 5.6 7.5 9.1 1.5
- Vehicle Offences (incl. Interference) 659 684 25 3.8 55 38 -17 -30.9 8.3 5.6 -2.8
- Theft from Vehicle 473 467 -6 -1.3 25 10 -15 -60.0 5.3 2.1 -3.1
- Theft of Motor Vehicle 146 161 15 10.3 30 26 -4 -13.3 20.5 16.1 -4.4
- Vehicle Interference 40 56 16 40.0 0 2 2 - 0.0 3.6 3.6
- Theft 2372 2239 -133 -5.6 759 702 -57 -7.5 32.0 31.4 -0.6
- Theft from the Person 89 90 1 1.1 1 5 4 400.0 1.1 5.6 4.4
- Theft of Pedal Cycle 209 138 -71 -34.0 8 10 2 25.0 3.8 7.2 3.4
- Shoplifting 959 1016 57 5.9 636 571 -65 -10.2 66.3 56.2 -10.1
- Other Theft 1115 995 -120 -10.8 114 116 2 1.8 10.2 11.7 1.4
Criminal Damage inc. Arson 1415 1345 -70 -4.9 281 201 -80 -28.5 19.9 14.9 -4.9
- Criminal Damage 1362 1286 -76 -5.6 274 196 -78 -28.5 20.1 15.2 -4.9
- Arson 53 59 6 11.3 7 5 -2 -28.6 13.2 8.5 -4.7
Racial/Religiously Aggravated Offences 58 50 -8 -13.8 21 21 0 0.0 36.2 42.0 5.8
State Based Crime
Crime Type 2014 2015 # diff. % diff. 2014 2015 # diff. % diff. 2014 2015% pt.
diff.
Drug Offences 277 279 2 0.7 271 266 -5 -1.8 97.8 95.3 -2.5
- Trafficking of Drugs 34 65 31 91.2 32 56 24 75.0 94.1 86.2 -8.0
- Possession of Drugs 243 214 -29 -11.9 239 210 -29 -12.1 98.4 98.1 -0.2
Possession of Weapons 76 58 -18 -23.7 67 38 -29 -43.3 88.2 65.5 -22.6
Public Order 357 388 31 8.7 207 153 -54 -26.1 58.0 39.4 -18.6
Miscellaneous Crimes against Society 108 132 24 22.2 67 50 -17 -25.4 62.0 37.9 -24.2
Rolling 12 Months to JulyOffences Outcomes Solved Rates %
Offences Outcomes Solved Rates %
Offences Outcomes Solved Rates %

Not Protectively MarkedED]
Corporate Services: Performance Summary Essex Police Performance Summary: To July 2015
21
Southend
Top Level
Crime Type 2014 2015 # diff. % diff. 2014 2015 # diff. % diff. 2014 2015% pt.
diff.
Anti-Social Behaviour (incidents) 2849 2644 -205 -7.2 - - - - - - -
All Crime (excl. Action (NFIB) Fraud) 4516 4502 -14 -0.3 1319 892 -427 -32.4 29.2 19.8 -9.4
- State Based Crime 594 474 -120 -20.2 410 199 -211 -51.5 69.0 42.0 -27.0
- Victim Based Crime 3922 4028 106 2.7 909 693 -216 -23.8 23.2 17.2 -6.0
Victim Based Crime
Crime Type 2014 2015 # diff. % diff. 2014 2015 # diff. % diff. 2014 2015% pt.
diff.
Violence Against the Person 1074 1231 157 14.6 414 316 -98 -23.7 38.5 25.7 -12.9
- Homicide 1 2 1 100.0 1 2 1 100.0 100.0 100.0 0.0
- Violence with Injury 497 506 9 1.8 196 150 -46 -23.5 39.4 29.6 -9.8
- Violence without Injury 576 723 147 25.5 217 164 -53 -24.4 37.7 22.7 -15.0
Sexual Offences 120 94 -26 -21.7 16 14 -2 -12.5 13.3 14.9 1.6
- Rape 51 37 -14 -27.5 6 6 0 0.0 11.8 16.2 4.5
- Rape - Under 16 yrs 13 15 2 15.4 3 5 2 66.7 23.1 33.3 10.3
- Rape - Over 16 yrs 38 22 -16 -42.1 3 1 -2 -66.7 7.9 4.5 -3.3
- Other Sexual Offences 69 57 -12 -17.4 10 8 -2 -20.0 14.5 14.0 -0.5
Robbery 56 49 -7 -12.5 10 7 -3 -30.0 17.9 14.3 -3.6
Theft Offences 2103 2020 -83 -3.9 356 257 -99 -27.8 16.9 12.7 -4.2
- Burglary 454 435 -19 -4.2 40 29 -11 -27.5 8.8 6.7 -2.1
- Dwelling Burglary 236 260 24 10.2 33 23 -10 -30.3 14.0 8.8 -5.1
- Other Burglary 218 175 -43 -19.7 7 6 -1 -14.3 3.2 3.4 0.2
- Vehicle Offences (incl. Interference) 549 518 -31 -5.6 15 20 5 33.3 2.7 3.9 1.1
- Theft from Vehicle 329 362 33 10.0 3 7 4 133.3 0.9 1.9 1.0
- Theft of Motor Vehicle 153 113 -40 -26.1 10 13 3 30.0 6.5 11.5 5.0
- Vehicle Interference 67 43 -24 -35.8 2 0 -2 -100.0 3.0 0.0 -3.0
- Theft 1100 1067 -33 -3.0 301 208 -93 -30.9 27.4 19.5 -7.9
- Theft from the Person 74 70 -4 -5.4 3 4 1 33.3 4.1 5.7 1.7
- Theft of Pedal Cycle 137 107 -30 -21.9 3 3 0 0.0 2.2 2.8 0.6
- Shoplifting 400 387 -13 -3.3 243 173 -70 -28.8 60.8 44.7 -16.0
- Other Theft 489 503 14 2.9 52 28 -24 -46.2 10.6 5.6 -5.1
Criminal Damage inc. Arson 569 634 65 11.4 113 99 -14 -12.4 19.9 15.6 -4.2
- Criminal Damage 539 623 84 15.6 110 96 -14 -12.7 20.4 15.4 -5.0
- Arson 30 11 -19 -63.3 3 3 0 0.0 10.0 27.3 17.3
Racial/Religiously Aggravated Offences 52 37 -15 -28.8 15 8 -7 -46.7 28.8 21.6 -7.2
State Based Crime
Crime Type 2014 2015 # diff. % diff. 2014 2015 # diff. % diff. 2014 2015% pt.
diff.
Drug Offences 256 119 -137 -53.5 230 96 -134 -58.3 89.8 80.7 -9.2
- Trafficking of Drugs 106 46 -60 -56.6 91 25 -66 -72.5 85.8 54.3 -31.5
- Possession of Drugs 150 73 -77 -51.3 139 71 -68 -48.9 92.7 97.3 4.6
Possession of Weapons 35 36 1 2.9 31 14 -17 -54.8 88.6 38.9 -49.7
Public Order 244 248 4 1.6 119 68 -51 -42.9 48.8 27.4 -21.4
Miscellaneous Crimes against Society 59 71 12 20.3 30 21 -9 -30.0 50.8 29.6 -21.3
Cumulative Year to JulyOffences Outcomes Solved Rates %
Offences Outcomes Solved Rates %
Offences Outcomes Solved Rates %

Not Protectively MarkedED]
Corporate Services: Performance Summary Essex Police Performance Summary: To July 2015
22
Southend
Top Level
Crime Type 2014 2015 # diff. % diff. 2014 2015 # diff. % diff. 2014 2015% pt.
diff.
Anti-Social Behaviour (incidents) 7813 7713 -100 -1.3 - - - - - - -
All Crime (excl. Action (NFIB) Fraud) 13150 12890 -260 -2.0 3970 3340 -630 -15.9 30.2 25.9 -4.3
- State Based Crime 1506 1418 -88 -5.8 1108 934 -174 -15.7 73.6 65.9 -7.7
- Victim Based Crime 11644 11472 -172 -1.5 2862 2406 -456 -15.9 24.6 21.0 -3.6
Victim Based Crime
Crime Type 2014 2015 # diff. % diff. 2014 2015 # diff. % diff. 2014 2015% pt.
diff.
Violence Against the Person 2897 3296 399 13.8 1169 1061 -108 -9.2 40.4 32.2 -8.2
- Homicide 4 3 -1 -25.0 3 3 0 0.0 75.0 100.0 25.0
- Violence with Injury 1373 1431 58 4.2 550 504 -46 -8.4 40.1 35.2 -4.8
- Violence without Injury 1520 1862 342 22.5 616 554 -62 -10.1 40.5 29.8 -10.8
Sexual Offences 294 316 22 7.5 56 51 -5 -8.9 19.0 16.1 -2.9
- Rape 120 118 -2 -1.7 21 23 2 9.5 17.5 19.5 2.0
- Rape - Under 16 yrs 35 37 2 5.7 7 12 5 71.4 20.0 32.4 12.4
- Rape - Over 16 yrs 85 81 -4 -4.7 14 11 -3 -21.4 16.5 13.6 -2.9
- Other Sexual Offences 174 198 24 13.8 35 28 -7 -20.0 20.1 14.1 -6.0
Robbery 221 152 -69 -31.2 50 26 -24 -48.0 22.6 17.1 -5.5
Theft Offences 6520 5919 -601 -9.2 1245 995 -250 -20.1 19.1 16.8 -2.3
- Burglary 1571 1312 -259 -16.5 155 115 -40 -25.8 9.9 8.8 -1.1
- Dwelling Burglary 928 804 -124 -13.4 116 81 -35 -30.2 12.5 10.1 -2.4
- Other Burglary 643 508 -135 -21.0 39 34 -5 -12.8 6.1 6.7 0.6
- Vehicle Offences (incl. Interference) 1574 1549 -25 -1.6 76 84 8 10.5 4.8 5.4 0.6
- Theft from Vehicle 1131 1069 -62 -5.5 24 29 5 20.8 2.1 2.7 0.6
- Theft of Motor Vehicle 323 333 10 3.1 48 50 2 4.2 14.9 15.0 0.2
- Vehicle Interference 120 147 27 22.5 4 5 1 25.0 3.3 3.4 0.1
- Theft 3375 3058 -317 -9.4 1014 796 -218 -21.5 30.0 26.0 -4.0
- Theft from the Person 213 216 3 1.4 8 5 -3 -37.5 3.8 2.3 -1.4
- Theft of Pedal Cycle 433 310 -123 -28.4 17 14 -3 -17.6 3.9 4.5 0.6
- Shoplifting 1257 1092 -165 -13.1 825 642 -183 -22.2 65.6 58.8 -6.8
- Other Theft 1472 1440 -32 -2.2 164 135 -29 -17.7 11.1 9.4 -1.8
Criminal Damage inc. Arson 1712 1789 77 4.5 342 273 -69 -20.2 20.0 15.3 -4.7
- Criminal Damage 1642 1743 101 6.2 332 264 -68 -20.5 20.2 15.1 -5.1
- Arson 70 46 -24 -34.3 10 9 -1 -10.0 14.3 19.6 5.3
Racial/Religiously Aggravated Offences 129 116 -13 -10.1 51 44 -7 -13.7 39.5 37.9 -1.6
State Based Crime
Crime Type 2014 2015 # diff. % diff. 2014 2015 # diff. % diff. 2014 2015% pt.
diff.
Drug Offences 633 510 -123 -19.4 588 501 -87 -14.8 92.9 98.2 5.3
- Trafficking of Drugs 160 161 1 0.6 137 139 2 1.5 85.6 86.3 0.7
- Possession of Drugs 473 349 -124 -26.2 451 362 -89 -19.7 95.3 103.7 8.4
Possession of Weapons 116 87 -29 -25.0 100 57 -43 -43.0 86.2 65.5 -20.7
Public Order 597 618 21 3.5 323 272 -51 -15.8 54.1 44.0 -10.1
Miscellaneous Crimes against Society 160 203 43 26.9 97 104 7 7.2 60.6 51.2 -9.4
Rolling 12 Months to JulyOffences Outcomes Solved Rates %
Offences Outcomes Solved Rates %
Offences Outcomes Solved Rates %

Not Protectively MarkedED]
Corporate Services: Performance Summary Essex Police Performance Summary: To July 2015
23
Castle Point
Top Level
Crime Type 2014 2015 # diff. % diff. 2014 2015 # diff. % diff. 2014 2015% pt.
diff.
Anti-Social Behaviour (incidents) 850 791 -59 -6.9 - - - - - - -
All Crime (excl. Action (NFIB) Fraud) 1193 1326 133 11.1 303 255 -48 -15.8 25.4 19.2 -6.2
- State Based Crime 111 116 5 4.5 68 50 -18 -26.5 61.3 43.1 -18.2
- Victim Based Crime 1082 1210 128 11.8 235 205 -30 -12.8 21.7 16.9 -4.8
Victim Based Crime
Crime Type 2014 2015 # diff. % diff. 2014 2015 # diff. % diff. 2014 2015% pt.
diff.
Violence Against the Person 289 321 32 11.1 110 92 -18 -16.4 38.1 28.7 -9.4
- Homicide 0 0 0 - 0 0 0 - - - -
- Violence with Injury 150 146 -4 -2.7 60 47 -13 -21.7 40.0 32.2 -7.8
- Violence without Injury 139 175 36 25.9 50 45 -5 -10.0 36.0 25.7 -10.3
Sexual Offences 33 32 -1 -3.0 4 16 12 300.0 12.1 50.0 37.9
- Rape 15 12 -3 -20.0 0 1 1 - 0.0 8.3 8.3
- Rape - Under 16 yrs 5 7 2 40.0 0 0 0 - 0.0 0.0 0.0
- Rape - Over 16 yrs 10 5 -5 -50.0 0 1 1 - 0.0 20.0 20.0
- Other Sexual Offences 18 20 2 11.1 4 15 11 275.0 22.2 75.0 52.8
Robbery 15 15 0 0.0 3 5 2 66.7 20.0 33.3 13.3
Theft Offences 541 659 118 21.8 95 63 -32 -33.7 17.6 9.6 -8.0
- Burglary 160 245 85 53.1 15 8 -7 -46.7 9.4 3.3 -6.1
- Dwelling Burglary 87 137 50 57.5 13 5 -8 -61.5 14.9 3.6 -11.3
- Other Burglary 73 108 35 47.9 2 3 1 50.0 2.7 2.8 0.0
- Vehicle Offences (incl. Interference) 100 154 54 54.0 10 6 -4 -40.0 10.0 3.9 -6.1
- Theft from Vehicle 59 92 33 55.9 3 5 2 66.7 5.1 5.4 0.4
- Theft of Motor Vehicle 35 50 15 42.9 7 1 -6 -85.7 20.0 2.0 -18.0
- Vehicle Interference 6 12 6 100.0 0 0 0 - 0.0 0.0 0.0
- Theft 281 260 -21 -7.5 70 49 -21 -30.0 24.9 18.8 -6.1
- Theft from the Person 10 15 5 50.0 1 2 1 100.0 10.0 13.3 3.3
- Theft of Pedal Cycle 28 17 -11 -39.3 0 1 1 - 0.0 5.9 5.9
- Shoplifting 74 71 -3 -4.1 47 30 -17 -36.2 63.5 42.3 -21.3
- Other Theft 169 157 -12 -7.1 22 16 -6 -27.3 13.0 10.2 -2.8
Criminal Damage inc. Arson 204 183 -21 -10.3 23 29 6 26.1 11.3 15.8 4.6
- Criminal Damage 193 176 -17 -8.8 23 28 5 21.7 11.9 15.9 4.0
- Arson 11 7 -4 -36.4 0 1 1 - 0.0 14.3 14.3
Racial/Religiously Aggravated Offences 9 8 -1 -11.1 1 2 1 100.0 11.1 25.0 13.9
State Based Crime
Crime Type 2014 2015 # diff. % diff. 2014 2015 # diff. % diff. 2014 2015% pt.
diff.
Drug Offences 47 30 -17 -36.2 40 27 -13 -32.5 85.1 90.0 4.9
- Trafficking of Drugs 7 6 -1 -14.3 5 5 0 0.0 71.4 83.3 11.9
- Possession of Drugs 40 24 -16 -40.0 35 22 -13 -37.1 87.5 91.7 4.2
Possession of Weapons 5 6 1 20.0 3 2 -1 -33.3 60.0 33.3 -26.7
Public Order 49 66 17 34.7 19 17 -2 -10.5 38.8 25.8 -13.0
Miscellaneous Crimes against Society 10 14 4 40.0 6 4 -2 -33.3 60.0 28.6 -31.4
Cumulative Year to JulyOffences Outcomes Solved Rates %
Offences Outcomes Solved Rates %
Offences Outcomes Solved Rates %

Not Protectively MarkedED]
Corporate Services: Performance Summary Essex Police Performance Summary: To July 2015
24
Castle Point
Top Level
Crime Type 2014 2015 # diff. % diff. 2014 2015 # diff. % diff. 2014 2015% pt.
diff.
Anti-Social Behaviour (incidents) 2113 2251 138 6.5 - - - - - - -
All Crime (excl. Action (NFIB) Fraud) 3520 3461 -59 -1.7 838 810 -28 -3.3 23.8 23.4 -0.4
- State Based Crime 295 329 34 11.5 206 184 -22 -10.7 69.8 55.9 -13.9
- Victim Based Crime 3225 3132 -93 -2.9 632 626 -6 -0.9 19.6 20.0 0.4
Victim Based Crime
Crime Type 2014 2015 # diff. % diff. 2014 2015 # diff. % diff. 2014 2015% pt.
diff.
Violence Against the Person 753 844 91 12.1 292 260 -32 -11.0 38.8 30.8 -8.0
- Homicide 0 0 0 - 0 0 0 - - - -
- Violence with Injury 368 397 29 7.9 145 125 -20 -13.8 39.4 31.5 -7.9
- Violence without Injury 385 447 62 16.1 147 135 -12 -8.2 38.2 30.2 -8.0
Sexual Offences 84 100 16 19.0 13 33 20 153.8 15.5 33.0 17.5
- Rape 34 24 -10 -29.4 6 8 2 33.3 17.6 33.3 15.7
- Rape - Under 16 yrs 12 8 -4 -33.3 4 4 0 0.0 33.3 50.0 16.7
- Rape - Over 16 yrs 22 16 -6 -27.3 2 4 2 100.0 9.1 25.0 15.9
- Other Sexual Offences 50 76 26 52.0 7 25 18 257.1 14.0 32.9 18.9
Robbery 46 34 -12 -26.1 5 6 1 20.0 10.9 17.6 6.8
Theft Offences 1796 1681 -115 -6.4 254 262 8 3.1 14.1 15.6 1.4
- Burglary 575 611 36 6.3 43 46 3 7.0 7.5 7.5 0.1
- Dwelling Burglary 384 380 -4 -1.0 37 38 1 2.7 9.6 10.0 0.4
- Other Burglary 191 231 40 20.9 6 8 2 33.3 3.1 3.5 0.3
- Vehicle Offences (incl. Interference) 463 402 -61 -13.2 24 52 28 116.7 5.2 12.9 7.8
- Theft from Vehicle 315 237 -78 -24.8 3 45 42 1400.0 1.0 19.0 18.0
- Theft of Motor Vehicle 123 123 0 0.0 21 6 -15 -71.4 17.1 4.9 -12.2
- Vehicle Interference 25 42 17 68.0 0 1 1 - 0.0 2.4 2.4
- Theft 758 668 -90 -11.9 187 164 -23 -12.3 24.7 24.6 -0.1
- Theft from the Person 34 30 -4 -11.8 2 2 0 0.0 5.9 6.7 0.8
- Theft of Pedal Cycle 51 73 22 43.1 1 12 11 1100.0 2.0 16.4 14.5
- Shoplifting 210 160 -50 -23.8 112 74 -38 -33.9 53.3 46.3 -7.1
- Other Theft 463 405 -58 -12.5 72 76 4 5.6 15.6 18.8 3.2
Criminal Damage inc. Arson 546 473 -73 -13.4 68 65 -3 -4.4 12.5 13.7 1.3
- Criminal Damage 527 456 -71 -13.5 68 61 -7 -10.3 12.9 13.4 0.5
- Arson 19 17 -2 -10.5 0 4 4 - 0.0 23.5 23.5
Racial/Religiously Aggravated Offences 17 16 -1 -5.9 8 5 -3 -37.5 47.1 31.3 -15.8
State Based Crime
Crime Type 2014 2015 # diff. % diff. 2014 2015 # diff. % diff. 2014 2015% pt.
diff.
Drug Offences 129 102 -27 -20.9 117 101 -16 -13.7 90.7 99.0 8.3
- Trafficking of Drugs 21 13 -8 -38.1 16 12 -4 -25.0 76.2 92.3 16.1
- Possession of Drugs 108 89 -19 -17.6 101 89 -12 -11.9 93.5 100.0 6.5
Possession of Weapons 12 24 12 100.0 10 16 6 60.0 83.3 66.7 -16.7
Public Order 108 158 50 46.3 46 53 7 15.2 42.6 33.5 -9.0
Miscellaneous Crimes against Society 46 45 -1 -2.2 33 14 -19 -57.6 71.7 31.1 -40.6
Rolling 12 Months to JulyOffences Outcomes Solved Rates %
Offences Outcomes Solved Rates %
Offences Outcomes Solved Rates %

Not Protectively MarkedED]
Corporate Services: Performance Summary Essex Police Performance Summary: To July 2015
25
Rochford
Top Level
Crime Type 2014 2015 # diff. % diff. 2014 2015 # diff. % diff. 2014 2015% pt.
diff.
Anti-Social Behaviour (incidents) 607 599 -8 -1.3 - - - - - - -
All Crime (excl. Action (NFIB) Fraud) 920 1013 93 10.1 205 177 -28 -13.7 22.3 17.5 -4.8
- State Based Crime 82 73 -9 -11.0 52 39 -13 -25.0 63.4 53.4 -10.0
- Victim Based Crime 838 940 102 12.2 153 138 -15 -9.8 18.3 14.7 -3.6
Victim Based Crime
Crime Type 2014 2015 # diff. % diff. 2014 2015 # diff. % diff. 2014 2015% pt.
diff.
Violence Against the Person 200 240 40 20.0 65 52 -13 -20.0 32.5 21.7 -10.8
- Homicide 0 0 0 - 0 1 1 - - - -
- Violence with Injury 99 101 2 2.0 36 28 -8 -22.2 36.4 27.7 -8.6
- Violence without Injury 101 139 38 37.6 29 23 -6 -20.7 28.7 16.5 -12.2
Sexual Offences 18 20 2 11.1 0 3 3 - 0.0 15.0 15.0
- Rape 7 7 0 0.0 0 1 1 - 0.0 14.3 14.3
- Rape - Under 16 yrs 4 2 -2 -50.0 0 0 0 - 0.0 0.0 0.0
- Rape - Over 16 yrs 3 5 2 66.7 0 1 1 - 0.0 20.0 20.0
- Other Sexual Offences 11 13 2 18.2 0 2 2 - 0.0 15.4 15.4
Robbery 5 9 4 80.0 1 4 3 300.0 20.0 44.4 24.4
Theft Offences 462 516 54 11.7 70 65 -5 -7.1 15.2 12.6 -2.6
- Burglary 137 153 16 11.7 9 2 -7 -77.8 6.6 1.3 -5.3
- Dwelling Burglary 80 87 7 8.8 8 0 -8 -100.0 10.0 0.0 -10.0
- Other Burglary 57 66 9 15.8 1 2 1 100.0 1.8 3.0 1.3
- Vehicle Offences (incl. Interference) 102 115 13 12.7 3 4 1 33.3 2.9 3.5 0.5
- Theft from Vehicle 70 62 -8 -11.4 2 0 -2 -100.0 2.9 0.0 -2.9
- Theft of Motor Vehicle 25 48 23 92.0 1 4 3 300.0 4.0 8.3 4.3
- Vehicle Interference 7 5 -2 -28.6 0 0 0 - 0.0 0.0 0.0
- Theft 223 248 25 11.2 58 59 1 1.7 26.0 23.8 -2.2
- Theft from the Person 13 9 -4 -30.8 1 0 -1 -100.0 7.7 0.0 -7.7
- Theft of Pedal Cycle 13 16 3 23.1 0 0 0 - 0.0 0.0 0.0
- Shoplifting 78 121 43 55.1 48 53 5 10.4 61.5 43.8 -17.7
- Other Theft 119 102 -17 -14.3 9 6 -3 -33.3 7.6 5.9 -1.7
Criminal Damage inc. Arson 153 155 2 1.3 17 14 -3 -17.6 11.1 9.0 -2.1
- Criminal Damage 147 150 3 2.0 17 13 -4 -23.5 11.6 8.7 -2.9
- Arson 6 5 -1 -16.7 0 1 1 - 0.0 20.0 20.0
Racial/Religiously Aggravated Offences 6 5 -1 -16.7 4 0 -4 -100.0 66.7 0.0 -66.7
State Based Crime
Crime Type 2014 2015 # diff. % diff. 2014 2015 # diff. % diff. 2014 2015% pt.
diff.
Drug Offences 36 19 -17 -47.2 34 21 -13 -38.2 94.4 110.5 16.1
- Trafficking of Drugs 16 3 -13 -81.3 14 3 -11 -78.6 87.5 100.0 12.5
- Possession of Drugs 20 16 -4 -20.0 20 18 -2 -10.0 100.0 112.5 12.5
Possession of Weapons 5 7 2 40.0 4 4 0 0.0 80.0 57.1 -22.9
Public Order 27 38 11 40.7 10 11 1 10.0 37.0 28.9 -8.1
Miscellaneous Crimes against Society 14 9 -5 -35.7 4 3 -1 -25.0 28.6 33.3 4.8
Cumulative Year to JulyOffences Outcomes Solved Rates %
Offences Outcomes Solved Rates %
Offences Outcomes Solved Rates %

Not Protectively MarkedED]
Corporate Services: Performance Summary Essex Police Performance Summary: To July 2015
26
Rochford
Top Level
Crime Type 2014 2015 # diff. % diff. 2014 2015 # diff. % diff. 2014 2015% pt.
diff.
Anti-Social Behaviour (incidents) 1577 1710 133 8.4 - - - - - - -
All Crime (excl. Action (NFIB) Fraud) 2808 2790 -18 -0.6 672 673 1 0.1 23.9 24.1 0.2
- State Based Crime 244 211 -33 -13.5 178 137 -41 -23.0 73.0 64.9 -8.0
- Victim Based Crime 2564 2579 15 0.6 494 536 42 8.5 19.3 20.8 1.5
Victim Based Crime
Crime Type 2014 2015 # diff. % diff. 2014 2015 # diff. % diff. 2014 2015% pt.
diff.
Violence Against the Person 534 657 123 23.0 202 211 9 4.5 37.8 32.1 -5.7
- Homicide 0 1 1 - 0 1 1 - - 100.0 -
- Violence with Injury 267 299 32 12.0 111 112 1 0.9 41.6 37.5 -4.1
- Violence without Injury 267 357 90 33.7 91 98 7 7.7 34.1 27.5 -6.6
Sexual Offences 50 70 20 40.0 5 20 15 300.0 10.0 28.6 18.6
- Rape 18 28 10 55.6 1 4 3 300.0 5.6 14.3 8.7
- Rape - Under 16 yrs 7 9 2 28.6 1 0 -1 -100.0 14.3 0.0 -14.3
- Rape - Over 16 yrs 11 19 8 72.7 0 4 4 - 0.0 21.1 21.1
- Other Sexual Offences 32 42 10 31.3 4 16 12 300.0 12.5 38.1 25.6
Robbery 19 20 1 5.3 4 6 2 50.0 21.1 30.0 8.9
Theft Offences 1459 1396 -63 -4.3 204 242 38 18.6 14.0 17.3 3.4
- Burglary 473 396 -77 -16.3 23 16 -7 -30.4 4.9 4.0 -0.8
- Dwelling Burglary 295 240 -55 -18.6 18 8 -10 -55.6 6.1 3.3 -2.8
- Other Burglary 178 156 -22 -12.4 5 8 3 60.0 2.8 5.1 2.3
- Vehicle Offences (incl. Interference) 353 304 -49 -13.9 11 13 2 18.2 3.1 4.3 1.2
- Theft from Vehicle 258 173 -85 -32.9 4 2 -2 -50.0 1.6 1.2 -0.4
- Theft of Motor Vehicle 68 112 44 64.7 6 10 4 66.7 8.8 8.9 0.1
- Vehicle Interference 27 19 -8 -29.6 1 1 0 0.0 3.7 5.3 1.6
- Theft 633 696 63 10.0 170 213 43 25.3 26.9 30.6 3.7
- Theft from the Person 27 37 10 37.0 1 0 -1 -100.0 3.7 0.0 -3.7
- Theft of Pedal Cycle 39 35 -4 -10.3 0 1 1 - 0.0 2.9 2.9
- Shoplifting 212 302 90 42.5 141 180 39 27.7 66.5 59.6 -6.9
- Other Theft 355 322 -33 -9.3 28 32 4 14.3 7.9 9.9 2.1
Criminal Damage inc. Arson 502 436 -66 -13.1 79 57 -22 -27.8 15.7 13.1 -2.7
- Criminal Damage 479 422 -57 -11.9 78 55 -23 -29.5 16.3 13.0 -3.3
- Arson 23 14 -9 -39.1 1 2 1 100.0 4.3 14.3 9.9
Racial/Religiously Aggravated Offences 9 13 4 44.4 6 4 -2 -33.3 66.7 30.8 -35.9
State Based Crime
Crime Type 2014 2015 # diff. % diff. 2014 2015 # diff. % diff. 2014 2015% pt.
diff.
Drug Offences 115 74 -41 -35.7 109 73 -36 -33.0 94.8 98.6 3.9
- Trafficking of Drugs 27 11 -16 -59.3 22 12 -10 -45.5 81.5 109.1 27.6
- Possession of Drugs 88 63 -25 -28.4 87 61 -26 -29.9 98.9 96.8 -2.0
Possession of Weapons 20 21 1 5.0 16 16 0 0.0 80.0 76.2 -3.8
Public Order 72 86 14 19.4 35 34 -1 -2.9 48.6 39.5 -9.1
Miscellaneous Crimes against Society 37 30 -7 -18.9 18 14 -4 -22.2 48.6 46.7 -2.0
Rolling 12 Months to JulyOffences Outcomes Solved Rates %
Offences Outcomes Solved Rates %
Offences Outcomes Solved Rates %

Not Protectively MarkedED]
Corporate Services: Performance Summary Essex Police Performance Summary: To July 2015
27
Basildon
Top Level
Crime Type 2014 2015 # diff. % diff. 2014 2015 # diff. % diff. 2014 2015% pt.
diff.
Anti-Social Behaviour (incidents) 2394 2293 -101 -4.2 - - - - - - -
All Crime (excl. Action (NFIB) Fraud) 3920 4624 704 18.0 1172 820 -352 -30.0 29.9 17.7 -12.2
- State Based Crime 422 393 -29 -6.9 308 187 -121 -39.3 73.0 47.6 -25.4
- Victim Based Crime 3498 4231 733 21.0 864 633 -231 -26.7 24.7 15.0 -9.7
Victim Based Crime
Crime Type 2014 2015 # diff. % diff. 2014 2015 # diff. % diff. 2014 2015% pt.
diff.
Violence Against the Person 855 1076 221 25.8 308 237 -71 -23.1 36.0 22.0 -14.0
- Homicide 0 1 1 - 0 1 1 - - 100.0 -
- Violence with Injury 412 432 20 4.9 150 101 -49 -32.7 36.4 23.4 -13.0
- Violence without Injury 443 643 200 45.1 158 135 -23 -14.6 35.7 21.0 -14.7
Sexual Offences 90 107 17 18.9 15 11 -4 -26.7 16.7 10.3 -6.4
- Rape 27 34 7 25.9 7 2 -5 -71.4 25.9 5.9 -20.0
- Rape - Under 16 yrs 7 16 9 128.6 3 2 -1 -33.3 42.9 12.5 -30.4
- Rape - Over 16 yrs 20 18 -2 -10.0 4 0 -4 -100.0 20.0 0.0 -20.0
- Other Sexual Offences 63 73 10 15.9 8 9 1 12.5 12.7 12.3 -0.4
Robbery 39 67 28 71.8 4 8 4 100.0 10.3 11.9 1.7
Theft Offences 1922 2267 345 18.0 438 315 -123 -28.1 22.8 13.9 -8.9
- Burglary 510 644 134 26.3 108 30 -78 -72.2 21.2 4.7 -16.5
- Dwelling Burglary 321 407 86 26.8 97 25 -72 -74.2 30.2 6.1 -24.1
- Other Burglary 189 237 48 25.4 11 5 -6 -54.5 5.8 2.1 -3.7
- Vehicle Offences (incl. Interference) 462 725 263 56.9 27 14 -13 -48.1 5.8 1.9 -3.9
- Theft from Vehicle 311 449 138 44.4 15 3 -12 -80.0 4.8 0.7 -4.2
- Theft of Motor Vehicle 111 182 71 64.0 11 11 0 0.0 9.9 6.0 -3.9
- Vehicle Interference 40 94 54 135.0 1 0 -1 -100.0 2.5 0.0 -2.5
- Theft 950 898 -52 -5.5 303 271 -32 -10.6 31.9 30.2 -1.7
- Theft from the Person 51 55 4 7.8 3 0 -3 -100.0 5.9 0.0 -5.9
- Theft of Pedal Cycle 70 55 -15 -21.4 1 1 0 0.0 1.4 1.8 0.4
- Shoplifting 330 397 67 20.3 246 238 -8 -3.3 74.5 59.9 -14.6
- Other Theft 499 391 -108 -21.6 53 32 -21 -39.6 10.6 8.2 -2.4
Criminal Damage inc. Arson 592 714 122 20.6 99 62 -37 -37.4 16.7 8.7 -8.0
- Criminal Damage 581 698 117 20.1 96 61 -35 -36.5 16.5 8.7 -7.8
- Arson 11 16 5 45.5 3 1 -2 -66.7 27.3 6.3 -21.0
Racial/Religiously Aggravated Offences 33 26 -7 -21.2 13 4 -9 -69.2 39.4 15.4 -24.0
State Based Crime
Crime Type 2014 2015 # diff. % diff. 2014 2015 # diff. % diff. 2014 2015% pt.
diff.
Drug Offences 217 127 -90 -41.5 204 116 -88 -43.1 94.0 91.3 -2.7
- Trafficking of Drugs 27 31 4 14.8 25 20 -5 -20.0 92.6 64.5 -28.1
- Possession of Drugs 190 96 -94 -49.5 179 96 -83 -46.4 94.2 100.0 5.8
Possession of Weapons 23 31 8 34.8 15 12 -3 -20.0 65.2 38.7 -26.5
Public Order 134 182 48 35.8 61 44 -17 -27.9 45.5 24.2 -21.3
Miscellaneous Crimes against Society 48 53 5 10.4 28 15 -13 -46.4 58.3 28.3 -30.0
Cumulative Year to JulyOffences Outcomes Solved Rates %
Offences Outcomes Solved Rates %
Offences Outcomes Solved Rates %

Not Protectively MarkedED]
Corporate Services: Performance Summary Essex Police Performance Summary: To July 2015
28
Basildon
Top Level
Crime Type 2014 2015 # diff. % diff. 2014 2015 # diff. % diff. 2014 2015% pt.
diff.
Anti-Social Behaviour (incidents) 6155 6360 205 3.3 - - - - - - -
All Crime (excl. Action (NFIB) Fraud) 12013 12863 850 7.1 3474 2863 -611 -17.6 28.9 22.3 -6.7
- State Based Crime 1198 1156 -42 -3.5 953 725 -228 -23.9 79.5 62.7 -16.8
- Victim Based Crime 10815 11707 892 8.2 2521 2138 -383 -15.2 23.3 18.3 -5.0
Victim Based Crime
Crime Type 2014 2015 # diff. % diff. 2014 2015 # diff. % diff. 2014 2015% pt.
diff.
Violence Against the Person 2357 2790 433 18.4 842 767 -75 -8.9 35.7 27.5 -8.2
- Homicide 1 1 0 0.0 1 1 0 0.0 100.0 100.0 0.0
- Violence with Injury 1139 1226 87 7.6 413 368 -45 -10.9 36.3 30.0 -6.2
- Violence without Injury 1217 1563 346 28.4 428 398 -30 -7.0 35.2 25.5 -9.7
Sexual Offences 254 306 52 20.5 40 55 15 37.5 15.7 18.0 2.2
- Rape 88 104 16 18.2 14 13 -1 -7.1 15.9 12.5 -3.4
- Rape - Under 16 yrs 30 42 12 40.0 5 6 1 20.0 16.7 14.3 -2.4
- Rape - Over 16 yrs 58 62 4 6.9 9 7 -2 -22.2 15.5 11.3 -4.2
- Other Sexual Offences 166 202 36 21.7 26 42 16 61.5 15.7 20.8 5.1
Robbery 137 170 33 24.1 13 27 14 107.7 9.5 15.9 6.4
Theft Offences 6247 6671 424 6.8 1377 1091 -286 -20.8 22.0 16.4 -5.7
- Burglary 1638 1954 316 19.3 249 170 -79 -31.7 15.2 8.7 -6.5
- Dwelling Burglary 1129 1159 30 2.7 211 140 -71 -33.6 18.7 12.1 -6.6
- Other Burglary 509 795 286 56.2 38 30 -8 -21.1 7.5 3.8 -3.7
- Vehicle Offences (incl. Interference) 1633 2052 419 25.7 76 75 -1 -1.3 4.7 3.7 -1.0
- Theft from Vehicle 1162 1348 186 16.0 33 31 -2 -6.1 2.8 2.3 -0.5
- Theft of Motor Vehicle 371 435 64 17.3 41 40 -1 -2.4 11.1 9.2 -1.9
- Vehicle Interference 100 269 169 169.0 2 4 2 100.0 2.0 1.5 -0.5
- Theft 2976 2665 -311 -10.5 1052 846 -206 -19.6 35.3 31.7 -3.6
- Theft from the Person 191 180 -11 -5.8 8 3 -5 -62.5 4.2 1.7 -2.5
- Theft of Pedal Cycle 214 211 -3 -1.4 8 10 2 25.0 3.7 4.7 1.0
- Shoplifting 1179 1073 -106 -9.0 862 680 -182 -21.1 73.1 63.4 -9.7
- Other Theft 1392 1201 -191 -13.7 174 153 -21 -12.1 12.5 12.7 0.2
Criminal Damage inc. Arson 1820 1770 -50 -2.7 249 198 -51 -20.5 13.7 11.2 -2.5
- Criminal Damage 1764 1725 -39 -2.2 241 191 -50 -20.7 13.7 11.1 -2.6
- Arson 56 45 -11 -19.6 8 7 -1 -12.5 14.3 15.6 1.3
Racial/Religiously Aggravated Offences 92 95 3 3.3 26 26 0 0.0 28.3 27.4 -0.9
State Based Crime
Crime Type 2014 2015 # diff. % diff. 2014 2015 # diff. % diff. 2014 2015% pt.
diff.
Drug Offences 611 469 -142 -23.2 612 445 -167 -27.3 100.2 94.9 -5.3
- Trafficking of Drugs 94 100 6 6.4 107 85 -22 -20.6 113.8 85.0 -28.8
- Possession of Drugs 517 369 -148 -28.6 505 360 -145 -28.7 97.7 97.6 -0.1
Possession of Weapons 83 77 -6 -7.2 64 46 -18 -28.1 77.1 59.7 -17.4
Public Order 389 470 81 20.8 194 174 -20 -10.3 49.9 37.0 -12.9
Miscellaneous Crimes against Society 115 140 25 21.7 83 60 -23 -27.7 72.2 42.9 -29.3
Rolling 12 Months to JulyOffences Outcomes Solved Rates %
Offences Outcomes Solved Rates %
Offences Outcomes Solved Rates %

Not Protectively MarkedED]
Corporate Services: Performance Summary Essex Police Performance Summary: To July 2015
29
Thurrock
Top Level
Crime Type 2014 2015 # diff. % diff. 2014 2015 # diff. % diff. 2014 2015% pt.
diff.
Anti-Social Behaviour (incidents) 2078 2121 43 2.1 - - - - - - -
All Crime (excl. Action (NFIB) Fraud) 3725 3974 249 6.7 897 728 -169 -18.8 24.1 18.3 -5.8
- State Based Crime 309 352 43 13.9 177 165 -12 -6.8 57.3 46.9 -10.4
- Victim Based Crime 3416 3622 206 6.0 720 563 -157 -21.8 21.1 15.5 -5.5
Victim Based Crime
Crime Type 2014 2015 # diff. % diff. 2014 2015 # diff. % diff. 2014 2015% pt.
diff.
Violence Against the Person 860 923 63 7.3 256 247 -9 -3.5 29.8 26.8 -3.0
- Homicide 0 0 0 - 0 0 0 - - - -
- Violence with Injury 379 394 15 4.0 119 120 1 0.8 31.4 30.5 -0.9
- Violence without Injury 481 529 48 10.0 137 127 -10 -7.3 28.5 24.0 -4.5
Sexual Offences 85 79 -6 -7.1 10 7 -3 -30.0 11.8 8.9 -2.9
- Rape 31 32 1 3.2 3 1 -2 -66.7 9.7 3.1 -6.6
- Rape - Under 16 yrs 9 12 3 33.3 2 0 -2 -100.0 22.2 0.0 -22.2
- Rape - Over 16 yrs 22 20 -2 -9.1 1 1 0 0.0 4.5 5.0 0.5
- Other Sexual Offences 54 47 -7 -13.0 7 6 -1 -14.3 13.0 12.8 -0.2
Robbery 38 37 -1 -2.6 6 9 3 50.0 15.8 24.3 8.5
Theft Offences 1932 2021 89 4.6 359 247 -112 -31.2 18.6 12.2 -6.4
- Burglary 393 393 0 0.0 37 18 -19 -51.4 9.4 4.6 -4.8
- Dwelling Burglary 210 185 -25 -11.9 22 13 -9 -40.9 10.5 7.0 -3.4
- Other Burglary 183 208 25 13.7 15 5 -10 -66.7 8.2 2.4 -5.8
- Vehicle Offences (incl. Interference) 536 561 25 4.7 39 11 -28 -71.8 7.3 2.0 -5.3
- Theft from Vehicle 311 315 4 1.3 12 1 -11 -91.7 3.9 0.3 -3.5
- Theft of Motor Vehicle 189 205 16 8.5 25 10 -15 -60.0 13.2 4.9 -8.3
- Vehicle Interference 36 41 5 13.9 2 0 -2 -100.0 5.6 0.0 -5.6
- Theft 1003 1067 64 6.4 283 218 -65 -23.0 28.2 20.4 -7.8
- Theft from the Person 44 49 5 11.4 1 0 -1 -100.0 2.3 0.0 -2.3
- Theft of Pedal Cycle 69 93 24 34.8 3 0 -3 -100.0 4.3 0.0 -4.3
- Shoplifting 398 416 18 4.5 236 181 -55 -23.3 59.3 43.5 -15.8
- Other Theft 492 509 17 3.5 43 37 -6 -14.0 8.7 7.3 -1.5
Criminal Damage inc. Arson 501 562 61 12.2 89 53 -36 -40.4 17.8 9.4 -8.3
- Criminal Damage 480 524 44 9.2 87 50 -37 -42.5 18.1 9.5 -8.6
- Arson 21 38 17 81.0 2 3 1 50.0 9.5 7.9 -1.6
Racial/Religiously Aggravated Offences 56 36 -20 -35.7 12 4 -8 -66.7 21.4 11.1 -10.3
State Based Crime
Crime Type 2014 2015 # diff. % diff. 2014 2015 # diff. % diff. 2014 2015% pt.
diff.
Drug Offences 87 94 7 8.0 82 80 -2 -2.4 94.3 85.1 -9.1
- Trafficking of Drugs 17 19 2 11.8 12 16 4 33.3 70.6 84.2 13.6
- Possession of Drugs 70 75 5 7.1 70 64 -6 -8.6 100.0 85.3 -14.7
Possession of Weapons 31 37 6 19.4 18 22 4 22.2 58.1 59.5 1.4
Public Order 146 160 14 9.6 56 40 -16 -28.6 38.4 25.0 -13.4
Miscellaneous Crimes against Society 45 61 16 35.6 21 23 2 9.5 46.7 37.7 -9.0
Cumulative Year to JulyOffences Outcomes Solved Rates %
Offences Outcomes Solved Rates %
Offences Outcomes Solved Rates %

Not Protectively MarkedED]
Corporate Services: Performance Summary Essex Police Performance Summary: To July 2015
30
Thurrock
Top Level
Crime Type 2014 2015 # diff. % diff. 2014 2015 # diff. % diff. 2014 2015% pt.
diff.
Anti-Social Behaviour (incidents) 5568 5905 337 6.1 - - - - - - -
All Crime (excl. Action (NFIB) Fraud) 11011 11219 208 1.9 2814 2449 -365 -13.0 25.6 21.8 -3.7
- State Based Crime 954 923 -31 -3.2 645 526 -119 -18.4 67.6 57.0 -10.6
- Victim Based Crime 10057 10296 239 2.4 2169 1923 -246 -11.3 21.6 18.7 -2.9
Victim Based Crime
Crime Type 2014 2015 # diff. % diff. 2014 2015 # diff. % diff. 2014 2015% pt.
diff.
Violence Against the Person 2227 2434 207 9.3 757 755 -2 -0.3 34.0 31.0 -3.0
- Homicide 2 0 -2 -100.0 2 0 -2 -100.0 100.0 - -
- Violence with Injury 996 1042 46 4.6 347 372 25 7.2 34.8 35.7 0.9
- Violence without Injury 1229 1392 163 13.3 408 383 -25 -6.1 33.2 27.5 -5.7
Sexual Offences 204 243 39 19.1 30 40 10 33.3 14.7 16.5 1.8
- Rape 73 98 25 34.2 9 12 3 33.3 12.3 12.2 -0.1
- Rape - Under 16 yrs 22 41 19 86.4 7 7 0 0.0 31.8 17.1 -14.7
- Rape - Over 16 yrs 51 57 6 11.8 2 5 3 150.0 3.9 8.8 4.9
- Other Sexual Offences 131 145 14 10.7 21 28 7 33.3 16.0 19.3 3.3
Robbery 123 110 -13 -10.6 21 28 7 33.3 17.1 25.5 8.4
Theft Offences 6027 6022 -5 -0.1 1118 924 -194 -17.4 18.5 15.3 -3.2
- Burglary 1355 1412 57 4.2 106 132 26 24.5 7.8 9.3 1.5
- Dwelling Burglary 748 783 35 4.7 70 100 30 42.9 9.4 12.8 3.4
- Other Burglary 607 629 22 3.6 36 32 -4 -11.1 5.9 5.1 -0.8
- Vehicle Offences (incl. Interference) 1767 1710 -57 -3.2 92 86 -6 -6.5 5.2 5.0 -0.2
- Theft from Vehicle 1142 1023 -119 -10.4 31 27 -4 -12.9 2.7 2.6 -0.1
- Theft of Motor Vehicle 535 516 -19 -3.6 59 52 -7 -11.9 11.0 10.1 -1.0
- Vehicle Interference 90 171 81 90.0 2 7 5 250.0 2.2 4.1 1.9
- Theft 2905 2900 -5 -0.2 920 706 -214 -23.3 31.7 24.3 -7.3
- Theft from the Person 125 126 1 0.8 3 0 -3 -100.0 2.4 0.0 -2.4
- Theft of Pedal Cycle 227 259 32 14.1 10 9 -1 -10.0 4.4 3.5 -0.9
- Shoplifting 1201 1151 -50 -4.2 731 559 -172 -23.5 60.9 48.6 -12.3
- Other Theft 1352 1364 12 0.9 176 138 -38 -21.6 13.0 10.1 -2.9
Criminal Damage inc. Arson 1476 1487 11 0.7 243 176 -67 -27.6 16.5 11.8 -4.6
- Criminal Damage 1422 1424 2 0.1 236 170 -66 -28.0 16.6 11.9 -4.7
- Arson 54 63 9 16.7 7 6 -1 -14.3 13.0 9.5 -3.4
Racial/Religiously Aggravated Offences 157 136 -21 -13.4 41 30 -11 -26.8 26.1 22.1 -4.1
State Based Crime
Crime Type 2014 2015 # diff. % diff. 2014 2015 # diff. % diff. 2014 2015% pt.
diff.
Drug Offences 332 296 -36 -10.8 311 271 -40 -12.9 93.7 91.6 -2.1
- Trafficking of Drugs 63 49 -14 -22.2 48 42 -6 -12.5 76.2 85.7 9.5
- Possession of Drugs 269 247 -22 -8.2 263 229 -34 -12.9 97.8 92.7 -5.1
Possession of Weapons 64 75 11 17.2 50 52 2 4.0 78.1 69.3 -8.8
Public Order 401 416 15 3.7 184 145 -39 -21.2 45.9 34.9 -11.0
Miscellaneous Crimes against Society 157 136 -21 -13.4 100 58 -42 -42.0 63.7 42.6 -21.0
Rolling 12 Months to JulyOffences Outcomes Solved Rates %
Offences Outcomes Solved Rates %
Offences Outcomes Solved Rates %

Not Protectively MarkedED]
Corporate Services: Performance Summary Essex Police Performance Summary: To July 2015
31
Epping
Top Level
Crime Type 2014 2015 # diff. % diff. 2014 2015 # diff. % diff. 2014 2015% pt.
diff.
Anti-Social Behaviour (incidents) 1387 1384 -3 -0.2 - - - - - - -
All Crime (excl. Action (NFIB) Fraud) 2364 2614 250 10.6 422 297 -125 -29.6 17.9 11.4 -6.5
- State Based Crime 205 263 58 28.3 118 86 -32 -27.1 57.6 32.7 -24.9
- Victim Based Crime 2159 2351 192 8.9 304 211 -93 -30.6 14.1 9.0 -5.1
Victim Based Crime
Crime Type 2014 2015 # diff. % diff. 2014 2015 # diff. % diff. 2014 2015% pt.
diff.
Violence Against the Person 457 525 68 14.9 137 91 -46 -33.6 30.0 17.3 -12.6
- Homicide 0 0 0 - 0 0 0 - - - -
- Violence with Injury 207 205 -2 -1.0 70 46 -24 -34.3 33.8 22.4 -11.4
- Violence without Injury 250 320 70 28.0 67 45 -22 -32.8 26.8 14.1 -12.7
Sexual Offences 41 48 7 17.1 5 8 3 60.0 12.2 16.7 4.5
- Rape 21 14 -7 -33.3 0 4 4 - 0.0 28.6 28.6
- Rape - Under 16 yrs 7 6 -1 -14.3 0 0 0 - 0.0 0.0 0.0
- Rape - Over 16 yrs 14 8 -6 -42.9 0 4 4 - 0.0 50.0 50.0
- Other Sexual Offences 20 34 14 70.0 5 4 -1 -20.0 25.0 11.8 -13.2
Robbery 28 27 -1 -3.6 9 2 -7 -77.8 32.1 7.4 -24.7
Theft Offences 1270 1468 198 15.6 102 76 -26 -25.5 8.0 5.2 -2.9
- Burglary 350 409 59 16.9 17 23 6 35.3 4.9 5.6 0.8
- Dwelling Burglary 220 262 42 19.1 14 21 7 50.0 6.4 8.0 1.7
- Other Burglary 130 147 17 13.1 3 2 -1 -33.3 2.3 1.4 -0.9
- Vehicle Offences (incl. Interference) 331 531 200 60.4 8 11 3 37.5 2.4 2.1 -0.3
- Theft from Vehicle 193 329 136 70.5 1 5 4 400.0 0.5 1.5 1.0
- Theft of Motor Vehicle 104 150 46 44.2 5 6 1 20.0 4.8 4.0 -0.8
- Vehicle Interference 34 52 18 52.9 2 0 -2 -100.0 5.9 0.0 -5.9
- Theft 589 528 -61 -10.4 77 42 -35 -45.5 13.1 8.0 -5.1
- Theft from the Person 33 14 -19 -57.6 1 0 -1 -100.0 3.0 0.0 -3.0
- Theft of Pedal Cycle 23 27 4 17.4 0 1 1 - 0.0 3.7 3.7
- Shoplifting 157 151 -6 -3.8 45 33 -12 -26.7 28.7 21.9 -6.8
- Other Theft 376 336 -40 -10.6 31 8 -23 -74.2 8.2 2.4 -5.9
Criminal Damage inc. Arson 363 283 -80 -22.0 51 34 -17 -33.3 14.0 12.0 -2.0
- Criminal Damage 357 276 -81 -22.7 51 34 -17 -33.3 14.3 12.3 -2.0
- Arson 6 7 1 16.7 0 0 0 - 0.0 0.0 0.0
Racial/Religiously Aggravated Offences 20 28 8 40.0 6 3 -3 -50.0 30.0 10.7 -19.3
State Based Crime
Crime Type 2014 2015 # diff. % diff. 2014 2015 # diff. % diff. 2014 2015% pt.
diff.
Drug Offences 47 63 16 34.0 42 51 9 21.4 89.4 81.0 -8.4
- Trafficking of Drugs 6 9 3 50.0 4 2 -2 -50.0 66.7 22.2 -44.4
- Possession of Drugs 41 54 13 31.7 38 49 11 28.9 92.7 90.7 -1.9
Possession of Weapons 11 15 4 36.4 6 5 -1 -16.7 54.5 33.3 -21.2
Public Order 116 145 29 25.0 59 20 -39 -66.1 50.9 13.8 -37.1
Miscellaneous Crimes against Society 31 40 9 29.0 11 10 -1 -9.1 35.5 25.0 -10.5
Cumulative Year to JulyOffences Outcomes Solved Rates %
Offences Outcomes Solved Rates %
Offences Outcomes Solved Rates %

Not Protectively MarkedED]
Corporate Services: Performance Summary Essex Police Performance Summary: To July 2015
32
Epping
Top Level
Crime Type 2014 2015 # diff. % diff. 2014 2015 # diff. % diff. 2014 2015% pt.
diff.
Anti-Social Behaviour (incidents) 3357 3746 389 11.6 - - - - - - -
All Crime (excl. Action (NFIB) Fraud) 6795 6933 138 2.0 1410 1116 -294 -20.9 20.8 16.1 -4.7
- State Based Crime 599 648 49 8.2 421 298 -123 -29.2 70.3 46.0 -24.3
- Victim Based Crime 6196 6285 89 1.4 989 818 -171 -17.3 16.0 13.0 -2.9
Victim Based Crime
Crime Type 2014 2015 # diff. % diff. 2014 2015 # diff. % diff. 2014 2015% pt.
diff.
Violence Against the Person 1258 1443 185 14.7 422 359 -63 -14.9 33.5 24.9 -8.7
- Homicide 1 0 -1 -100.0 1 0 -1 -100.0 100.0 - -
- Violence with Injury 556 592 36 6.5 196 169 -27 -13.8 35.3 28.5 -6.7
- Violence without Injury 701 851 150 21.4 225 190 -35 -15.6 32.1 22.3 -9.8
Sexual Offences 97 137 40 41.2 13 23 10 76.9 13.4 16.8 3.4
- Rape 37 46 9 24.3 2 9 7 350.0 5.4 19.6 14.2
- Rape - Under 16 yrs 9 14 5 55.6 1 1 0 0.0 11.1 7.1 -4.0
- Rape - Over 16 yrs 28 32 4 14.3 1 8 7 700.0 3.6 25.0 21.4
- Other Sexual Offences 60 91 31 51.7 11 14 3 27.3 18.3 15.4 -2.9
Robbery 70 87 17 24.3 20 13 -7 -35.0 28.6 14.9 -13.6
Theft Offences 3851 3805 -46 -1.2 400 327 -73 -18.3 10.4 8.6 -1.8
- Burglary 1068 1153 85 8.0 112 86 -26 -23.2 10.5 7.5 -3.0
- Dwelling Burglary 673 774 101 15.0 92 80 -12 -13.0 13.7 10.3 -3.3
- Other Burglary 395 379 -16 -4.1 20 6 -14 -70.0 5.1 1.6 -3.5
- Vehicle Offences (incl. Interference) 1150 1240 90 7.8 30 29 -1 -3.3 2.6 2.3 -0.3
- Theft from Vehicle 741 737 -4 -0.5 10 10 0 0.0 1.3 1.4 0.0
- Theft of Motor Vehicle 305 391 86 28.2 18 15 -3 -16.7 5.9 3.8 -2.1
- Vehicle Interference 104 112 8 7.7 2 4 2 100.0 1.9 3.6 1.6
- Theft 1633 1412 -221 -13.5 258 212 -46 -17.8 15.8 15.0 -0.8
- Theft from the Person 96 62 -34 -35.4 3 0 -3 -100.0 3.1 0.0 -3.1
- Theft of Pedal Cycle 45 55 10 22.2 0 4 4 - 0.0 7.3 7.3
- Shoplifting 384 452 68 17.7 139 129 -10 -7.2 36.2 28.5 -7.7
- Other Theft 1108 843 -265 -23.9 116 79 -37 -31.9 10.5 9.4 -1.1
Criminal Damage inc. Arson 920 813 -107 -11.6 134 96 -38 -28.4 14.6 11.8 -2.8
- Criminal Damage 900 784 -116 -12.9 132 96 -36 -27.3 14.7 12.2 -2.4
- Arson 20 29 9 45.0 2 0 -2 -100.0 10.0 0.0 -10.0
Racial/Religiously Aggravated Offences 54 82 28 51.9 18 17 -1 -5.6 33.3 20.7 -12.6
State Based Crime
Crime Type 2014 2015 # diff. % diff. 2014 2015 # diff. % diff. 2014 2015% pt.
diff.
Drug Offences 187 171 -16 -8.6 185 142 -43 -23.2 98.9 83.0 -15.9
- Trafficking of Drugs 18 23 5 27.8 16 9 -7 -43.8 88.9 39.1 -49.8
- Possession of Drugs 169 148 -21 -12.4 169 133 -36 -21.3 100.0 89.9 -10.1
Possession of Weapons 31 40 9 29.0 23 23 0 0.0 74.2 57.5 -16.7
Public Order 302 337 35 11.6 173 96 -77 -44.5 57.3 28.5 -28.8
Miscellaneous Crimes against Society 79 100 21 26.6 40 37 -3 -7.5 50.6 37.0 -13.6
Rolling 12 Months to JulyOffences Outcomes Solved Rates %
Offences Outcomes Solved Rates %
Offences Outcomes Solved Rates %

Not Protectively MarkedED]
Corporate Services: Performance Summary Essex Police Performance Summary: To July 2015
33
Harlow
Top Level
Crime Type 2014 2015 # diff. % diff. 2014 2015 # diff. % diff. 2014 2015% pt.
diff.
Anti-Social Behaviour (incidents) 1558 1438 -120 -7.7 - - - - - - -
All Crime (excl. Action (NFIB) Fraud) 2244 2383 139 6.2 782 508 -274 -35.0 34.8 21.3 -13.5
- State Based Crime 300 249 -51 -17.0 240 127 -113 -47.1 80.0 51.0 -29.0
- Victim Based Crime 1944 2134 190 9.8 542 381 -161 -29.7 27.9 17.9 -10.0
Victim Based Crime
Crime Type 2014 2015 # diff. % diff. 2014 2015 # diff. % diff. 2014 2015% pt.
diff.
Violence Against the Person 479 602 123 25.7 194 166 -28 -14.4 40.5 27.6 -12.9
- Homicide 0 1 1 - 0 0 0 - - 0.0 -
- Violence with Injury 210 223 13 6.2 76 70 -6 -7.9 36.2 31.4 -4.8
- Violence without Injury 269 378 109 40.5 118 96 -22 -18.6 43.9 25.4 -18.5
Sexual Offences 45 67 22 48.9 10 7 -3 -30.0 22.2 10.4 -11.8
- Rape 18 20 2 11.1 4 3 -1 -25.0 22.2 15.0 -7.2
- Rape - Under 16 yrs 5 4 -1 -20.0 2 1 -1 -50.0 40.0 25.0 -15.0
- Rape - Over 16 yrs 13 16 3 23.1 2 2 0 0.0 15.4 12.5 -2.9
- Other Sexual Offences 27 47 20 74.1 6 4 -2 -33.3 22.2 8.5 -13.7
Robbery 36 25 -11 -30.6 2 3 1 50.0 5.6 12.0 6.4
Theft Offences 1082 1148 66 6.1 278 167 -111 -39.9 25.7 14.5 -11.1
- Burglary 223 185 -38 -17.0 17 12 -5 -29.4 7.6 6.5 -1.1
- Dwelling Burglary 138 89 -49 -35.5 14 9 -5 -35.7 10.1 10.1 0.0
- Other Burglary 85 96 11 12.9 3 3 0 0.0 3.5 3.1 -0.4
- Vehicle Offences (incl. Interference) 155 372 217 140.0 19 3 -16 -84.2 12.3 0.8 -11.5
- Theft from Vehicle 109 266 157 144.0 7 0 -7 -100.0 6.4 0.0 -6.4
- Theft of Motor Vehicle 28 63 35 125.0 12 3 -9 -75.0 42.9 4.8 -38.1
- Vehicle Interference 18 43 25 138.9 0 0 0 - 0.0 0.0 0.0
- Theft 704 591 -113 -16.1 242 152 -90 -37.2 34.4 25.7 -8.7
- Theft from the Person 32 26 -6 -18.8 0 0 0 - 0.0 0.0 0.0
- Theft of Pedal Cycle 41 44 3 7.3 1 0 -1 -100.0 2.4 0.0 -2.4
- Shoplifting 398 260 -138 -34.7 211 136 -75 -35.5 53.0 52.3 -0.7
- Other Theft 233 261 28 12.0 30 16 -14 -46.7 12.9 6.1 -6.7
Criminal Damage inc. Arson 302 292 -10 -3.3 58 38 -20 -34.5 19.2 13.0 -6.2
- Criminal Damage 289 281 -8 -2.8 55 38 -17 -30.9 19.0 13.5 -5.5
- Arson 13 11 -2 -15.4 3 0 -3 -100.0 23.1 0.0 -23.1
Racial/Religiously Aggravated Offences 21 11 -10 -47.6 12 9 -3 -25.0 57.1 81.8 24.7
State Based Crime
Crime Type 2014 2015 # diff. % diff. 2014 2015 # diff. % diff. 2014 2015% pt.
diff.
Drug Offences 127 82 -45 -35.4 127 64 -63 -49.6 100.0 78.0 -22.0
- Trafficking of Drugs 36 17 -19 -52.8 37 13 -24 -64.9 102.8 76.5 -26.3
- Possession of Drugs 91 65 -26 -28.6 90 51 -39 -43.3 98.9 78.5 -20.4
Possession of Weapons 16 18 2 12.5 15 10 -5 -33.3 93.8 55.6 -38.2
Public Order 135 112 -23 -17.0 82 43 -39 -47.6 60.7 38.4 -22.3
Miscellaneous Crimes against Society 22 37 15 68.2 16 10 -6 -37.5 72.7 27.0 -45.7
Cumulative Year to JulyOffences Outcomes Solved Rates %
Offences Outcomes Solved Rates %
Offences Outcomes Solved Rates %

Not Protectively MarkedED]
Corporate Services: Performance Summary Essex Police Performance Summary: To July 2015
34
Harlow
Top Level
Crime Type 2014 2015 # diff. % diff. 2014 2015 # diff. % diff. 2014 2015% pt.
diff.
Anti-Social Behaviour (incidents) 3900 4231 331 8.5 - - - - - - -
All Crime (excl. Action (NFIB) Fraud) 6621 6894 273 4.1 2326 1857 -469 -20.2 35.1 26.9 -8.2
- State Based Crime 799 686 -113 -14.1 637 421 -216 -33.9 79.7 61.4 -18.4
- Victim Based Crime 5822 6208 386 6.6 1689 1436 -253 -15.0 29.0 23.1 -5.9
Victim Based Crime
Crime Type 2014 2015 # diff. % diff. 2014 2015 # diff. % diff. 2014 2015% pt.
diff.
Violence Against the Person 1388 1607 219 15.8 589 545 -44 -7.5 42.4 33.9 -8.5
- Homicide 0 1 1 - 0 0 0 - - 0.0 -
- Violence with Injury 615 667 52 8.5 249 236 -13 -5.2 40.5 35.4 -5.1
- Violence without Injury 773 939 166 21.5 340 309 -31 -9.1 44.0 32.9 -11.1
Sexual Offences 119 174 55 46.2 32 23 -9 -28.1 26.9 13.2 -13.7
- Rape 42 58 16 38.1 9 9 0 0.0 21.4 15.5 -5.9
- Rape - Under 16 yrs 13 18 5 38.5 5 2 -3 -60.0 38.5 11.1 -27.4
- Rape - Over 16 yrs 29 40 11 37.9 4 7 3 75.0 13.8 17.5 3.7
- Other Sexual Offences 77 116 39 50.6 23 14 -9 -39.1 29.9 12.1 -17.8
Robbery 94 91 -3 -3.2 16 17 1 6.3 17.0 18.7 1.7
Theft Offences 3394 3453 59 1.7 859 713 -146 -17.0 25.3 20.6 -4.7
- Burglary 675 658 -17 -2.5 82 80 -2 -2.4 12.1 12.2 0.0
- Dwelling Burglary 382 297 -85 -22.3 65 61 -4 -6.2 17.0 20.5 3.5
- Other Burglary 293 361 68 23.2 17 19 2 11.8 5.8 5.3 -0.5
- Vehicle Offences (incl. Interference) 627 920 293 46.7 39 24 -15 -38.5 6.2 2.6 -3.6
- Theft from Vehicle 473 631 158 33.4 17 8 -9 -52.9 3.6 1.3 -2.3
- Theft of Motor Vehicle 118 199 81 68.6 22 15 -7 -31.8 18.6 7.5 -11.1
- Vehicle Interference 36 90 54 150.0 0 1 1 - 0.0 1.1 1.1
- Theft 2092 1875 -217 -10.4 738 609 -129 -17.5 35.3 32.5 -2.8
- Theft from the Person 108 79 -29 -26.9 4 1 -3 -75.0 3.7 1.3 -2.4
- Theft of Pedal Cycle 135 120 -15 -11.1 6 5 -1 -16.7 4.4 4.2 -0.3
- Shoplifting 1101 977 -124 -11.3 637 537 -100 -15.7 57.9 55.0 -2.9
- Other Theft 748 699 -49 -6.6 91 66 -25 -27.5 12.2 9.4 -2.7
Criminal Damage inc. Arson 827 883 56 6.8 193 138 -55 -28.5 23.3 15.6 -7.7
- Criminal Damage 800 850 50 6.3 185 136 -49 -26.5 23.1 16.0 -7.1
- Arson 27 33 6 22.2 8 2 -6 -75.0 29.6 6.1 -23.6
Racial/Religiously Aggravated Offences 65 72 7 10.8 34 25 -9 -26.5 52.3 34.7 -17.6
State Based Crime
Crime Type 2014 2015 # diff. % diff. 2014 2015 # diff. % diff. 2014 2015% pt.
diff.
Drug Offences 367 230 -137 -37.3 357 211 -146 -40.9 97.3 91.7 -5.5
- Trafficking of Drugs 124 37 -87 -70.2 116 36 -80 -69.0 93.5 97.3 3.7
- Possession of Drugs 243 193 -50 -20.6 241 175 -66 -27.4 99.2 90.7 -8.5
Possession of Weapons 40 46 6 15.0 32 34 2 6.3 80.0 73.9 -6.1
Public Order 325 314 -11 -3.4 209 141 -68 -32.5 64.3 44.9 -19.4
Miscellaneous Crimes against Society 67 96 29 43.3 39 35 -4 -10.3 58.2 36.5 -21.8
Rolling 12 Months to JulyOffences Outcomes Solved Rates %
Offences Outcomes Solved Rates %
Offences Outcomes Solved Rates %

Not Protectively MarkedED]
Corporate Services: Performance Summary Essex Police Performance Summary: To July 2015
35
Brentwood
Top Level
Crime Type 2014 2015 # diff. % diff. 2014 2015 # diff. % diff. 2014 2015% pt.
diff.
Anti-Social Behaviour (incidents) 678 807 129 19.0 - - - - - - -
All Crime (excl. Action (NFIB) Fraud) 1154 1308 154 13.3 273 186 -87 -31.9 23.7 14.2 -9.4
- State Based Crime 80 82 2 2.5 53 27 -26 -49.1 66.3 32.9 -33.3
- Victim Based Crime 1074 1226 152 14.2 220 159 -61 -27.7 20.5 13.0 -7.5
Victim Based Crime
Crime Type 2014 2015 # diff. % diff. 2014 2015 # diff. % diff. 2014 2015% pt.
diff.
Violence Against the Person 203 248 45 22.2 73 48 -25 -34.2 36.0 19.4 -16.6
- Homicide 0 1 1 - 0 0 0 - - 0.0 -
- Violence with Injury 85 101 16 18.8 35 20 -15 -42.9 41.2 19.8 -21.4
- Violence without Injury 118 146 28 23.7 38 28 -10 -26.3 32.2 19.2 -13.0
Sexual Offences 21 26 5 23.8 9 1 -8 -88.9 42.9 3.8 -39.0
- Rape 1 5 4 400.0 2 1 -1 -50.0 200.0 20.0 -180.0
- Rape - Under 16 yrs 1 1 0 0.0 2 0 -2 -100.0 200.0 0.0 -200.0
- Rape - Over 16 yrs 0 4 4 - 0 1 1 - - 25.0 -
- Other Sexual Offences 20 21 1 5.0 7 0 -7 -100.0 35.0 0.0 -35.0
Robbery 5 7 2 40.0 0 0 0 - 0.0 0.0 0.0
Theft Offences 701 772 71 10.1 125 93 -32 -25.6 17.8 12.0 -5.8
- Burglary 197 192 -5 -2.5 46 50 4 8.7 23.4 26.0 2.7
- Dwelling Burglary 123 123 0 0.0 42 41 -1 -2.4 34.1 33.3 -0.8
- Other Burglary 74 69 -5 -6.8 4 9 5 125.0 5.4 13.0 7.6
- Vehicle Offences (incl. Interference) 193 259 66 34.2 7 10 3 42.9 3.6 3.9 0.2
- Theft from Vehicle 132 160 28 21.2 4 5 1 25.0 3.0 3.1 0.1
- Theft of Motor Vehicle 46 62 16 34.8 3 0 -3 -100.0 6.5 0.0 -6.5
- Vehicle Interference 15 37 22 146.7 0 5 5 - 0.0 13.5 13.5
- Theft 311 321 10 3.2 72 33 -39 -54.2 23.2 10.3 -12.9
- Theft from the Person 10 21 11 110.0 1 0 -1 -100.0 10.0 0.0 -10.0
- Theft of Pedal Cycle 19 27 8 42.1 0 1 1 - 0.0 3.7 3.7
- Shoplifting 66 77 11 16.7 50 24 -26 -52.0 75.8 31.2 -44.6
- Other Theft 216 196 -20 -9.3 21 8 -13 -61.9 9.7 4.1 -5.6
Criminal Damage inc. Arson 144 173 29 20.1 13 17 4 30.8 9.0 9.8 0.8
- Criminal Damage 139 165 26 18.7 13 17 4 30.8 9.4 10.3 1.0
- Arson 5 8 3 60.0 0 0 0 - 0.0 0.0 0.0
Racial/Religiously Aggravated Offences 15 8 -7 -46.7 5 2 -3 -60.0 33.3 25.0 -8.3
State Based Crime
Crime Type 2014 2015 # diff. % diff. 2014 2015 # diff. % diff. 2014 2015% pt.
diff.
Drug Offences 29 14 -15 -51.7 31 12 -19 -61.3 106.9 85.7 -21.2
- Trafficking of Drugs 2 5 3 150.0 4 2 -2 -50.0 200.0 40.0 -160.0
- Possession of Drugs 27 9 -18 -66.7 27 10 -17 -63.0 100.0 111.1 11.1
Possession of Weapons 2 4 2 100.0 2 3 1 50.0 100.0 75.0 -25.0
Public Order 38 52 14 36.8 18 10 -8 -44.4 47.4 19.2 -28.1
Miscellaneous Crimes against Society 11 12 1 9.1 2 2 0 0.0 18.2 16.7 -1.5
Cumulative Year to JulyOffences Outcomes Solved Rates %
Offences Outcomes Solved Rates %
Offences Outcomes Solved Rates %

Not Protectively MarkedED]
Corporate Services: Performance Summary Essex Police Performance Summary: To July 2015
36
Brentwood
Top Level
Crime Type 2014 2015 # diff. % diff. 2014 2015 # diff. % diff. 2014 2015% pt.
diff.
Anti-Social Behaviour (incidents) 1739 2063 324 18.6 - - - - - - -
All Crime (excl. Action (NFIB) Fraud) 3488 3642 154 4.4 888 658 -230 -25.9 25.5 18.1 -7.4
- State Based Crime 291 230 -61 -21.0 232 139 -93 -40.1 79.7 60.4 -19.3
- Victim Based Crime 3197 3412 215 6.7 656 519 -137 -20.9 20.5 15.2 -5.3
Victim Based Crime
Crime Type 2014 2015 # diff. % diff. 2014 2015 # diff. % diff. 2014 2015% pt.
diff.
Violence Against the Person 575 716 141 24.5 222 197 -25 -11.3 38.6 27.5 -11.1
- Homicide 0 2 2 - 0 1 1 - - 50.0 -
- Violence with Injury 280 289 9 3.2 116 79 -37 -31.9 41.4 27.3 -14.1
- Violence without Injury 295 425 130 44.1 106 117 11 10.4 35.9 27.5 -8.4
Sexual Offences 50 63 13 26.0 17 6 -11 -64.7 34.0 9.5 -24.5
- Rape 9 16 7 77.8 3 2 -1 -33.3 33.3 12.5 -20.8
- Rape - Under 16 yrs 4 4 0 0.0 3 1 -2 -66.7 75.0 25.0 -50.0
- Rape - Over 16 yrs 5 12 7 140.0 0 1 1 - 0.0 8.3 8.3
- Other Sexual Offences 41 47 6 14.6 14 4 -10 -71.4 34.1 8.5 -25.6
Robbery 21 20 -1 -4.8 3 5 2 66.7 14.3 25.0 10.7
Theft Offences 2167 2175 8 0.4 358 252 -106 -29.6 16.5 11.6 -4.9
- Burglary 660 634 -26 -3.9 115 94 -21 -18.3 17.4 14.8 -2.6
- Dwelling Burglary 462 442 -20 -4.3 105 77 -28 -26.7 22.7 17.4 -5.3
- Other Burglary 198 192 -6 -3.0 10 17 7 70.0 5.1 8.9 3.8
- Vehicle Offences (incl. Interference) 599 711 112 18.7 22 28 6 27.3 3.7 3.9 0.3
- Theft from Vehicle 412 446 34 8.3 5 9 4 80.0 1.2 2.0 0.8
- Theft of Motor Vehicle 157 185 28 17.8 17 14 -3 -17.6 10.8 7.6 -3.3
- Vehicle Interference 30 80 50 166.7 0 5 5 - 0.0 6.3 6.3
- Theft 908 830 -78 -8.6 221 130 -91 -41.2 24.3 15.7 -8.7
- Theft from the Person 39 43 4 10.3 1 1 0 0.0 2.6 2.3 -0.2
- Theft of Pedal Cycle 57 63 6 10.5 3 2 -1 -33.3 5.3 3.2 -2.1
- Shoplifting 261 201 -60 -23.0 153 77 -76 -49.7 58.6 38.3 -20.3
- Other Theft 551 523 -28 -5.1 64 50 -14 -21.9 11.6 9.6 -2.1
Criminal Damage inc. Arson 384 438 54 14.1 56 59 3 5.4 14.6 13.5 -1.1
- Criminal Damage 377 425 48 12.7 56 58 2 3.6 14.9 13.6 -1.2
- Arson 7 13 6 85.7 0 1 1 - 0.0 7.7 7.7
Racial/Religiously Aggravated Offences 27 21 -6 -22.2 8 5 -3 -37.5 29.6 23.8 -5.8
State Based Crime
Crime Type 2014 2015 # diff. % diff. 2014 2015 # diff. % diff. 2014 2015% pt.
diff.
Drug Offences 146 70 -76 -52.1 143 66 -77 -53.8 97.9 94.3 -3.7
- Trafficking of Drugs 13 11 -2 -15.4 13 5 -8 -61.5 100.0 45.5 -54.5
- Possession of Drugs 133 59 -74 -55.6 130 61 -69 -53.1 97.7 103.4 5.6
Possession of Weapons 9 14 5 55.6 9 11 2 22.2 100.0 78.6 -21.4
Public Order 100 112 12 12.0 60 46 -14 -23.3 60.0 41.1 -18.9
Miscellaneous Crimes against Society 36 34 -2 -5.6 20 16 -4 -20.0 55.6 47.1 -8.5
Rolling 12 Months to JulyOffences Outcomes Solved Rates %
Offences Outcomes Solved Rates %
Offences Outcomes Solved Rates %