Embed Size (px)
Citation preview

The Franco-German regional bankDie deutsch-französische Regionalbank
Corporate Report 2012
Foresight THROUGH PROXIMITY

2
CONTENTS
Foreword from the Board of Management .................................................. 6
Group Management Report – Overview ......................................................13
SaarLB consolidated financial statements 2012 .......................................58
Consolidated statement of comprehensive income .................................59
Consolidated balance sheet .........................................................................60
Schedule of changes in equity .....................................................................62
Cash flow statement .....................................................................................63
Group Notes to the consolidated financial statements 2012 ..................64
Board of Administration ............................................................................. 142
Board of Management ................................................................................ 143
Independent Auditors’ Report ................................................................... 150
Report of the Board of Administration ..................................................... 151
Organisational Chart ................................................................................... 152
Shareholders ................................................................................................ 153
“Wortsegel” (“Wordsail”)
Steel plastic in Tholey-Sotzweiler, by Heinrich Popp

3
CORPORATE REPORT 2012 | CONTENTS
Take our word for it
As a regional bank with Franco-German
roots, we have grown with the region.
Thanks to our experience and dedication,
knowledge of the regional economy and
culture, we work with our customers to find
the right solutions for present and future
challenges. Take our word for it.

4
At a glance (IFRS)
* Including security repurchase transactions and interests in entities valued at equity
** Including shares of profits in associated companies accounted for using the equity method
*** Change in the figure from 2011
1. BALANCE SHEET 31 DEC. 2012 EUR MILLION
31 DEC. 2011 EUR MILLION
CHANGE IN %
Total assets 18,740 19,761*** -5.2
Business volumes 19,713 20,912 -5.7
Loans and advances to banks 3,246 4,106 -20.9
Loans and advances to customers 9,039 8,607 5.0
Assets held for trading 518 432 19.9
Investments* 5,271 6,531 -19.3
Liabilities to banks 6,000 8,008 -25.1
Liabilities to customers 5,898 5,905 -0.1
Securitised liabilities 5,115 4,329 18.2
Liabilities held for trading 645 544 18.6
Shareholders’ equity 559 461 21.3
Liable capital in acc. with Sec. 10 KWG/Banking Act
932 976 -4.5
2. PROFIT AND LOSS ACCOUNT
Net interest and commission income** 146.1 133.8 9.2
Gains or losses on fair value measurement 37.0 -16.2 >100.0
Administrative expenses 72.4 78.5 -7.8
Earnings before taxes 82.1 18.4*** >100.0
Consolidated net income/loss for the year 59.4 22.2*** >100.0
5
SaarLB’s earnings were exceptional in 2012.
This is proof of the very good collaboration
with our customers and partners in the region
– and the further expansion of our position.
CORPORATE REPORT 2012 | AT A GLANCE (IFRS)

6
Ladies and Gentlemen,Dear Business Partners,

7
We are pleased to present SaarLB’s annual
report for 2012. It was a very successful finan-
cial year that we can look back on, with an af-
ter-tax profit of EUR 59.4 million. There were
multiple reasons for this.
On the one hand, it was due to a constant
improvement in our core business. Both the
volume of business and earnings are steadily
growing.
Growth in the regional economy may have
been weaker than in 2011 and 2010, but we
also saw increasing demand for loans in seg-
ments such as Corporate Customers or Ger-
man Real Estate – and were able to expand
our volume of business here.
Thomas Christian Buchbinder
Corporate Development, Market 2
Corporate Development, Savings Banks, Institutionals
and High Net Worth Individuals, Treasury and Portfolio
Management, LBS Market and Risk Office, Internal Audit
CORPORATE REPORT 2012 | FOREWORD FROM THE BOARD OF MANAGEMENT

8
The real estate business in France and the pro-
ject financing (above all for renewable energy)
performed well. It was the same with strong
municipality business on both the German
and French side. Furthermore, we were able
to further reduce the non-core business –
which is why the balance sheet total fell to
EUR 18.7 billion.
The fact that SaarLB enjoys a very good rep-
utation as an issuer can be seen from the
strong demand for our own issues in the past
year – which let the funding of the bank be
achieved at attractive conditions.
The most important reason for our success is
the mostly long-term business relationships
with our customers. But SaarLB is much more
than “just” a lender: We are advisers in all fi-
nancial questions, an engine for investments
and innovations and promoters of cross-bor-
der business.
Here we would like to present four of our
customers as examples. They are well-known
names in the region. Wendelin von Boch
elaborates on why sustainable business was
always important for him as an entrepreneur
– and why he now built a solar power plant for
this reason. Dr. Guido Colsman and Bruno P.
Proietti from the company Ludwig Schokolade
explain how a Saarland family-run company
with a passion for cocoa products became an
economic success story. Prof. Dr. Peter Theiss
describes how he turned his father’s small
pharmacy into a successful company on five
continents – with natural cosmetics. And Dr.
Karlheinz Blessing makes it clear why the suc-
cessful work in Dillinger Hütte or at Saarstahl
AG has much in common with good harmony
in an orchestra – and why qualified actors, i.e.
employees, guarantee our success.

9
Frank Eloy
Market 1
Corporate Customers,
Real Estate and Projects,
Central Sales Management
SaarLB is much more than “just” a lender.
CORPORATE REPORT 2012 | FOREWORD FROM THE BOARD OF MANAGEMENT

10
Education and training play a major role for us.
The subject of education and training also
plays a major role for SaarLB. It is very impor-
tant that the future generation profits from
experienced colleagues. We will also describe
how well this works at SaarLB in this annual
report. Going beyond the area of education,
we would like to thank all our employees at
this point for their tremendous dedication
yet again in the past year.
Werner Severin
Bank Management/Operations
Overall Bank Management,
Risk Office, Services, Compliance,
Data Protection

11
Good collaboration with our partners in the region is another of the bank’s major “secrets of
success.” SaarLB benefits from the cross-border character of the region. At the same time, it
gives a lot back to the region through its dedication. We support the arts, culture, and science.
We have been an important taxpayer for a long time. The bank offers more than 500 profes-
sional jobs. For the purchasing of products or services, the bank mostly awards contracts to
companies in the area.
Last but not least, we would like to express our particular thanks to our shareholders both in
and outside the region. Their tremendous commitment to the bank will also serve as the basis
for its success in the future.
Werner SeverinThomas Christian Buchbinder Frank Eloy
CORPORATE REPORT 2012 | FOREWORD FROM THE BOARD OF MANAGEMENT

12

13
CORPORATE REPORT 2012 | GROUP MANAGEMENT REPORT
OVERVIEW
ECONOMIC ENVIRONMENT
The German economy enjoyed a strong start
to 2012. In the Summer and increasingly dur-
ing the rest of the year, growth slowed on ac-
count of the poor performance of the global
economy and the difficult situation in the
euro zone. In the fourth quarter, economic
output actually even declined. Overall, real
gross domestic product (GDP) rose by 0.7% in
2012, and foreign trade remained a bright spot
despite the foreign trade environment, as ex-
ports were the strongest driver of growth.
However, on account of weaker demand
from the euro zone, export activity declined
in the last few months of the year. Domestic
demand, which fell overall in real terms, de-
veloped unevenly. Private and government
consumption may have increased and stimu-
lated growth, but investments did not make
a positive contribution for the first time since
the economic crisis in 2009. Construction in-
vestments and capital expenditures declined,
although a positive development is that most
companies kept their employees despite the
hesitancy to make investments. The number
of employed people reached a new record
high in 2012. Government budgets continued
to be reduced, and measured in terms of gross
domestic product (GDP), there was a small
general government surplus of 0.1%.
In the course of 2012, the recovery in the Saar-
land economy weakened substantially. The
reason for this was the development of the
global economy, which had a corresponding
impact on some important export markets.
Demand fell substantially in the steel indus-
try, a significant sector for the Saarland econ-
omy. Machine building also saw a decline in
incoming orders, whereby there was still an
increase in sales. The automotive industry,
on the other hand, performed better. Despite
a decline in economic activity, Saarland and
Germany as a whole achieved a record high
number of employed people.
Economic growth in Rhineland-Palatinate
was primarily fuelled by the service sectors in
the first half of the year. As compared to previ-
ous years, manufacturing made only a minor
contribution. But here, too, companies’ busi-
ness expectations dimmed toward the end of
the year due to the euro crisis.
The French economy did not grow in 2012,
and economic output actually contracted in
the fourth quarter of the past year, although
private consumption and exports had a stabi-
lising impact. Industrial production was quite
volatile over the course of the year, fluctuat-
ing very unevenly within various industrial ar-
eas. The inconsistent business environment
led to a slight overall decline in investment ac-
tivity by companies. Despite a deterioration
in the financial position of companies and
uncertainty with regard to the overall devel-
opment of the economy, the investment ratio
remained on a high level. However, unemploy-
ment continued to rise and, together with a
rise in taxes in the second half of the year, had
a negative impact on the purchasing power of
private households. Private consumption was
helped by the savings of private households.
The Lorraine economy faced a difficult envi-
ronment in 2012. Business activity declined
significantly due to the poor business cli-
mate. Gross domestic product fell by an esti-
mated 0.4%. The investment rate dropped no-
ticeably. There were many lay-offs, especially
in industry, as a result of which unemploy-
ment rates continued to rise. Exports also fell
sharply.
Alsace also suffered an economic slowdown
in 2012, contracting by an estimated 0.3%.
The stagnating economic output forecast for
the second quarter was not confirmed. Small
and medium-sized enterprises (SMEs) had to
withstand a decline in their business activi-
ties. The liquidity situation and earnings fell
as expected. However, the investment rate re-
mained stable despite the negative business
climate in 2012. The number of unemployed
people also increased in Alsace.
Group Management Report

14
FINANCIAL SECTOR
The critical factor on German financial mar-
kets in 2012 was again the European sover-
eign debt crisis, which resulted in a turbulent
year. After the crisis initially spread and also
reached large economies such as Spain and
Italy, massive efforts by central banks in the
second half of the year ensured an improve-
ment. In June 2012, the European Central Bank
(ECB) lowered the interest rate for deposit fa-
cilities to 0.0% p.a. and decided to reduce the
main refinancing rate to 0.75% p.a.
The decision by euro member states to form a
bank union should also stabilise the markets.
The plan for the bank union includes uniform
bank supervision by the ECB, a collective un-
winding and restructuring mechanism and a
European system of deposit insurance. The
establishment of a European bank superviso-
ry authority is a requirement for the direct re-
capitalisation of banks by the European Sta-
bility Mechanism (ESM) and is being forced by
some member states against this backdrop.
The significant regulatory measures that are
usually combined under the description of Ba-
sel III or CRD IV have not been implemented
yet. In contrast to the original plan, coordina-
tion and passage on the European level will
still take some time, which means that these
measures did not enter into force on 1 Janu-
ary 2013. In 2013, additional, currently not
yet completed amendments are waiting for
passage and/or implementation. They include
the separation of investment and commercial
banks and the financial transaction tax. With
regard to its risk-bearing capacity, the Ger-
man banking system is stronger than it was
before the financial market crisis.
SAARLB
SaarLB’s strategic objective is to be a region-
al bank with a focus on corporate customer
lending, real estate business and advisory
services for institutional investors, public sec-
tor/municipalities and high net worth private
customers (wealth management). In recent
years, the Bank has distinguished itself as
a special financier for projects in the area of
renewable energy throughout Germany and
France.
Landesbausparkasse Saar (LBS), part of Saar-
LB, finances primarily residential real estate
through its home loan savings business.
The Bank’s business model depends heavily
on the awarding of long-term loans and is to
be harmonised with respect to the coming
strict requirements of Basel III (particularly
with regard to the core capital ratio and li-
quidity management) by passing through a
control process with supervisory guidelines.
On account of its history and its ownership
structure, SaarLB is an integral part of the
savings banks finance group [Sparkassen-
Finanzgruppe] and places a high priority on
networking work, particularly with the Saar-
land savings banks, while simultaneously con-
centrating on core competencies. SaarLB is a
central bank for the savings banks and is the
principal bank for Saarland.
SaarLB’s ownership structure did not change
from 2011 and took the following form at the
end of 2012:
Saarbrücken 14.9%
SaarLB and its shareholders have each agreed
to commitments that are expected to ensure
the long-term independence of the Bank and
its further development as a Franco-German
regional bank. There is also a framework
agreement with the Sparkassen-und Girover-
band [German Savings Bank Association] on
the principles for collaboration between the
Saarland savings banks and SaarLB. The com-
mitments and the framework agreement set

15
CORPORATE REPORT 2012 | GROUP MANAGEMENT REPORT
forth fundamental framework conditions.
The binding form is determined by the Bank’s
risk strategy.
The SaarLB Group’s target market is made up
of the core market Saarland and the regional
market, which consists of the surrounding
regions in south-west Germany, France and
Luxembourg.
The objective for business financing is funda-
mentally business with target customers that
have their headquarters in the Bank’s target
market or, if their business’s headquarters is
outside of the target market, then at least
the business’s sales are primarily made in the
Bank’s target market.
The requirements for the business objective
in real estate and project financing and LBS
[Landesbausparkasse : subsidiary of savings
bank offering collective real estate savings
products and providing low-interest residen-
tial mortgage loans] are met if the financed
object or project is in Germany or France. For
real estate (with the exception of LBS), the
following criteria must be met:
a) the borrower/investor/asset manager must
be based in the target market or
b) the financed object must be in the target
market.
Portfolio financing is a business objective
if the focus of the portfolio is classified as a
business objective.
Customer relationship management is usu-
ally handled according to the so-called re-
lationship management approach, i.e each
customer has a primary contact who works in
a problem- and service-oriented way. For spe-
cial questions (e.g. interest and currency man-
agement), the customer manager receives
support from internal product specialists.
Depending on the significance (monetary/
ideas) of the customer for the Bank, he is in-
cluded in the senior coverage model. As a re-
sult, the customer relationship management
is handled by the respective manager of the
organisational unit, division head or Board of
Management.
On the product side, SaarLB primarily con-
centrates on marketable and standardised
products. Project financing is, however, an ex-
ception on account of the business structure.
Over the long term, complex products and
services that require substantial advice are
primarily handled by cooperation partners.
As a member of the Saarland Sparkassen-Fi-
nanzgruppe, SaarLB and Landesbausparkasse
Saar are heavily involved in the syndication
business and as an arranger with the region’s
savings banks. SaarLB is also a centre of ex-
cellence, particularly for project financing,
corporate financing, foreign commercial busi-
ness and interest and currency management.
SaarLB is the largest bank in Saarland and
feels a particular connection and obligation
to the region. SaarLB has deep roots in the
region and actively shapes economic life,
makes an important contribution to cultural
diversity and promotes the sciences in the
greater region. This is seen, among others, in
the promotion of science and culture through
the awarding of the SaarLB science prize and
countless permanent loans to the Saarland
museum.
EARNINGS
The SaarLB Group’s net interest income (in-
cluding the results of the companies valued
at equity) increased by EUR 16.6 million, from
EUR 122.2 million in 2011 to EUR 138.8 million
in 2012. This is an increase of 13.6%. The de-
cline in interest income from EUR 834.3 mil-
lion in 2011 to EUR 765.4 million in 2012 (-8.3%)
was more than compensated by the decline in
interest expenses from EUR 712.3 million in
2011 to EUR 626.7 million (-12.0%). The decline
in interest income is mainly due to a decrease
of roughly EUR 0.9 million in the portfolio
of investments and the current low interest

16
rates. The drop in interest expenses also re-
flects the advantageous refinancing costs for
SaarLB. In addition, the change in net interest
income is defined by one-off effects from the
receipt of prepayment penalties on interest
derivatives (approx. EUR 5.0 million).
Interest income from credit and money mar-
ket transactions fell slightly from the previ-
ous year (-1.3%).
As in previous years, increases in interest mar-
gin contributions in the corporate custom-
ers business and in real estate and project
financing explained the rise in the net inter-
est income. Thus falling income from other
budgeted reductions in the no longer strate-
gic portfolio from Treasury and Portfolio Man-
agement could be more than compensated
again.
The maturity transformation/treasury gains/
losses totalled EUR 14.8 million in 2012, thus
roughly on the high level of 2011 (EUR 15.8 mil-
lion).
The Landesbausparkasse’s net interest in-
come also increased in comparison to 2011.
The interest expenses for subordinated and
hybrid capital were EUR 19.5 million in 2012,
slightly below the amount in 2011 (EUR 20.1
million).
Expenses for risk provisions in the credit busi-
ness rose substantially, by EUR 14.4 million,
from EUR 18.9 million in 2011 to EUR 33.3 mil-
lion in 2012, but were still below the expected
amount in the budget for 2012.
The increase in the risk provisions is mainly due
to the valuation of the Treasury and Portfolio
Management segment in which the reduction
portfolio of non-strategic assets is managed.
Approx. 62.6% of the individual risk provisions
created for all segments, including provisions
for off-balance-sheet transactions, are repre-
sented by this segment. This was countered
by the risk provision requirement in the area of
corporate customers, which was significantly
reduced to roughly 4.4% of the net newly cre-
ated provisions. 29.7% of the risk provisions
for individual transactions can be attributed
to the real estate financing segment.
An additional negative impact was made by
the net additions to portfolio risk provisions
in the credit business for a total of EUR 2.4
million in 2012. This was also offset by a re-
lease of EUR 3.7 million in 2011.
Net commission income totalled EUR 7.3 mil-
lion and did not remain on the level from 2011
(EUR 11.5 million).
The decline in the net commission income is
primarily due to a drop in the commission in-
come from the credit and home loan savings
business.
The commission income in the credit busi-
ness was EUR 0.2 million below the level from
2011, despite good new business of EUR 12.9
million. The commission expenses totalled
EUR 1.6 million, in part due to significantly
higher than planned brokerage commissions,
and were EUR 0.8 million above the level from
2011 as a result.
The commission income from the home loan
savings business rose 2.5% to EUR 4.3 mil-
lion and was therefore roughly on the level
of the previous year. Commission expenses
increased 19.1% and reflect the substantial
rise in closing fees for home loan savings
contracts and the related brokerage commis-
sions.
Future increases in net interest income can be
viewed in comparison to the commission ex-
penses for the brokerage of credit and home
loan savings business, which were above the
level from the previous year.
The net commission income in the securi-
ties business declined from the previous
year to EUR -0.7 million (2011: EUR 1.5 mil-
lion) and is mainly due to lower year-on-year

17
CORPORATE REPORT 2012 | GROUP MANAGEMENT REPORT
commission income from EUREX transactions
of EUR 1.1 million. This is due to changes in the
investment habits of special funds, for which
SaarLB assumes the custodian bank function.
The gains on fair value measurement and
hedge accounting totalled EUR 36.9 million in
2012 and greatly exceeded the amount from
2011 (EUR -16.1 million). The improvement of
EUR 53.0 million is primarily comprised of
positive, planned maturity effects related
to interest swaps (EUR 4.8 million), the posi-
tive market development of credit deriva-
tives (EUR 5.4 million) and the very positive
valuation effects from securities measured
at fair value (EUR 24.8 million). Alone roughly
EUR 16.0 million are attributable to securities
invested in special funds; another roughly
EUR 9.0 million are due to securities that
were invested as part of the LCR portfolio.
The losses on hedge accounting totalled
EUR -0.2 million in the year under review and
were at the level of the previous year and in-
significant.
The gains on investments were EUR 3.2 mil-
lion in 2012, which reflected an increase of EUR
3.7 million from the level in 2011. The gains in
2012 were affected by disposal losses for Greek
bank bonds of EUR 5.9 million, which could
largely be compensated by the release of the
portfolio risk provision created for this in 2011
and amounting to a total of EUR 4.9 million.
Furthermore, another EUR 1.5 million in port-
folio risk provisions were released and had a
positive impact on income from investments.
The decline in gains/losses on the dispos-
al amount of EUR 11.7 million in 2011 to
EUR -3.7 million in 2012 is mainly due to a
special effect in 2011 related to the sale of the
DEKA bank shares (EUR + 12.3 million) and the
disposal losses on Greek bank bonds.
The write-down of debt securities and other
fixed income securities was EUR 0.7 million
and thus significantly below the amount from
the previous year (EUR 12.3 million).
Administrative expenses incl. the deprecia-
tion of property, plant and equipment and
the amortisation of other intangible assets
totalled EUR 72.4 million on 31 December 2012
and was EUR 6.7 million lower than planned
and also EUR 6.1 million below the amount in
2011 (EUR 78.5 million).
Personnel expenses rose slightly by
EUR 1.8 million year on year. On the other
hand, other administrative expenses fell
by EUR 8.4 million as compared to 2011
(EUR 37.6 million). This is mainly due to the
high one-off IT expenses (approx. EUR 8.5 mil-
lion) in 2011, which were connected with the
system migration to OSPlus. The depreciation
of property, plant and equipment and the am-
ortisation of other intangible assets totalled
EUR 2.6 million and was slightly above the
level from 2011 (EUR 2.2 million).
Other income amounted to EUR 1.6 million in
2012 (2011: EUR -1.3 million).
Other income rose from EUR 4.0 million in 2011
to EUR 5.1 million in 2012. It mainly includes
rental income from investment property
(EUR 1.3 million; 2011: EUR 1.4 million), income
from the release of provisions (EUR 0.9 mil-
lion; 2011: EUR 1.2 million) and other income
(EUR 1.8 million; 2011: EUR 0.8 million).
Other expenses totalled EUR 3.5 million in
2012, which was EUR 1.7 million below the
level from 2011 (EUR 5.2 million). The offset-
ting expenses with partnerships were critical
here and amounted to EUR 1.0 million (2011:
EUR 1.5 million).
In total, there was a consolidated net profit
before taxes of EUR 82.1 million in financial
year 2012 (2011: EUR 18.5 million).
After taking into account the tax expenses
of EUR 22.7 million (2011: EUR +3.8 million),
SaarLB had a consolidated net profit after
taxes of EUR 59.4 million (2011: EUR 22.2
million). The tax expenses consist of an ac-
tual tax expense of EUR 15.7 million and an

18
expense for deferred taxes of EUR 7.0 mil-
lion.
The SaarLB Group will service its hybrid capi-
tal in full in 2012, similar to previous years.
EUR 9.7 million (2011: EUR 10.7 million) will
be distributed on the equity component of
the hybrid capital. A dividend on the share-
holder capital of SaarLB will not be paid in
2012. As a result, the total consolidated profit
of EUR 49.7 million will remain (2011: EUR 11.3
million).
The cost income ratio (CIR) fell from 59.3% in
2011 to 49.0% in 2012. The cost income ratio
is calculated for the respective financial year
on the basis of the administrative expenses
in relation to the Bank’s income (net interest
income, net commission income and net trad-
ing income less additions to risk provisions).
The lower administrative expenses alongside
a substantial rise in income had a major im-
pact on the CIR in 2012.
On account of the very positive course of busi-
ness in 2012, the return on equity, which is
based on the consolidated profit before taxes
in relation to the currently available equity,
rose by 11.0 percentage points, from 3.0% in
2011 to 14.0% in 2012.

19
CORPORATE REPORT 2012 | GROUP MANAGEMENT REPORT
FINANCIAL POSITION
The SaarLB Group’s financial position re-
mained good in 2012. The inflow of liquid-
ity over the next few years is ensured on ac-
count of the current refinancing structures.
The flow of liquidity from the asset business
can be used again to refinance new business.
The expansion of the mortgage collateral real
estate business in 2012 continued to back
the surplus cover in SaarLB’s collateral pool
and the collateral pool for Pfandbriefe, and
remains on a high level, even if it fell slightly
from 2011. The lower surplus cover is mainly
due to an increase in the issuing of mortgage
Pfandbriefe and declining cover funds for
public sector Pfandbriefe.
The situation on the capital market, from the
perspective of the SaarLB Group, substan-
tially improved again as compared to finan-
cial year 2011. With just under EUR 2.3 billion
(2011: EUR 0.7 billion), the placed volumes
in 2012 rose significantly again year on year,
whereby the total volume solely took place
as part of private placements with custom-
ers and financial partners. As a result, SaarLB
was largely independent of capital markets
in 2012. In the process, the SaarLB Group also
succeeded in refinancing itself primarily via
uncollateralized issuances with long maturi-
ties.
In order to ensure solvency at all times, Saar-
LB deposited securities amounting to roughly
EUR 1.4 billion at the ECB, as in 2011. Payment
obligations could therefore be met indepen-
dently of other sources of refinancing.
The SaarLB Group’s ability to meet its pay-
ment obligations was thus ensured at all
times in the 2012 financial year.
The SaarLB Group’s access to money markets
and capital markets is supported by the credit
ratings of two international rating agencies.
The two rating agencies Moody’s Investor
Service and Fitch Ratings confirmed SaarLB’s
credit rating as an issuer in the past financial
year.
Rating Moody’s Fitch
Long-term rating (uncollateralised)
with government liability Aa1 AAA
without government liability A3 A
Short-term rating (uncollateralised) P-2 F1
Financial strength/viability rating D BB+

20
ASSETS
The SaarLB Group’s total assets fell by 5.2%
to EUR 18.7 billion as of 31 December 2012 (31
December 2011: EUR 19.8 billion). The decline
mainly results from a substantially lower
portfolio of investments, which is due to the
planned decrease in the reduction portfolio
for the most part. Furthermore, short-term
loans and advances to banks decreased sub-
stantially in comparison to the treasury-
related high level on 31 December 2011. The
increase in loans and advances to customers
by some EUR 0.4 billion in the core segments
of the Bank more than compensated for this.
In terms of liabilities, this decrease was pri-
marily reflected in a decline in short-term
bank liabilities. Scheduled maturities for
profit participation rights and subordinated
liabilities led to a further decrease in subordi-
nated capital.
The SaarLB Group’s equity increased to
EUR 558.8 million (2011: EUR 462.0 million)
in the year under review. This was primarily a
result of the increase in revaluation reserves
and the consolidated net income generated
in 2012.
The credit volume of the SaarLB Group – simi-
lar to total assets – fell by 9.2% from EUR 20.3
billion to EUR 18.4 billion in the 2012 financial
year.
Loans and advances to banks made a signifi-
cant contribution, declining year on year by
some EUR 0.9 billion to EUR 3.2 billion. The
decrease in invested excess liquidity in 2011 is
responsible for this.
Another major driver of the declining credit
volume was investments (including securities
repurchase transactions) that fell by EUR 1.3
billion, from EUR 6.5 billion to EUR 5.3 billion
(-19.3%) in the past financial year. The reasons
for this include the repayment of bank securi-
ties and investments in international corpo-
rates that do not belong to the core business.
PORTFOLIO PERFORMANCE
Change
in EUR million 31 Dec. 2012 31 Dec. 2011 Δ in EUR million Δ in %
Loans and advances to banks 3,246.1 4,105.6 -859.5 -20.9 %
Investments 5,271.3 6,531.2 -1,259.9 -19.3 %
of which
Interests in associated companies 2.9 2.8 0.1 4.1 %
Investments 4,698.4 5,574.2 -875.8 -15.7 %
Securities repurchase transactions 570.0 954.2 -384.2 -40.3 %
Loans and advances to customers 9,039.0 8,607.2 431.8 5.0 %
Contingent liabilities 274.3 290.2 -15.8 -5.5 %
Irrevocable credit commitments 592.9 756.7 -163.8 -21.6 %
Total credit volume 18,423.6 20,290.9 -1,867.2 -9.2 %
21
CORPORATE REPORT 2012 | GROUP MANAGEMENT REPORT
A slightly different development was seen in
loans and advances to customers, which are
mainly influenced by the Bank’s core business
segments. Loans and advances to customers
increased by EUR 0.4 billion to EUR 9.0 billion
in 2012 (2011: EUR 8.6 billion), primarily in the
long-term maturity area.
Contingent liabilities totalled EUR 0.3 bil-
lion in 2012 (2011: EUR 0.3 billion), while ir-
revocable credit commitments amounted to
EUR 0.6 billion and were 21.6% below the pre-
vious year (2011: EUR 0.8 billion).
The credit portfolio performance is reflected –
as illustrated in the following – in the busi-
ness segments of the SaarLB Group:
Corporate Customers services corporate cus-
tomers in Germany and corporate customers,
municipalities and municipally owned com-
panies in France. The target markets in Ger-
many include Saarland, Rhineland-Palatinate
and the surrounding regions. In France, the
SaarLB Group concentrates on the Grand Est
and here in particular on the neighbouring Al-
sace-Lorraine where the Bank is represented
by its SaarLB France branch at the offices in
Metz and Strasbourg.
In the past financial year, the positive trend
from 2010 continued. Both in our target mar-
kets of Saarland, Rhineland-Palatinate and
the surrounding regions, including the French
side, and particularly Alsace and Lorraine,
it was possible to significantly increase the
credit volume reported at the end of the year.
This is, among others, due to the increased us-
age of cross-border consulting and financial
services, which has let the SaarLB Group use
and further expand its unique selling point
among French and German customers. The
SaarLB Group also benefits, on the German
side, from long-term customer relationships
that were in turn the basis for the structur-
ing and financial support of numerous in-
vestment projects in 2012. The revaluation
of the entire Corporate Customers business
segment amounts to EUR 420 million (2010:
EUR 196 million), whereby roughly 55% is at-
tributable to Germany and 45% to France. The
margins on the French market increased no-
ticeably year on year, while in Germany it was
possible to maintain the high level from the
previous year. Risk premiums can be charged
increasingly better on the market in France.
Furthermore, the quality of the portfolio
continued to improve on account of the thor-
oughly better than planned ratings in new
business. Overall, the credit volume in the
business segment as of 31 December 2012 was
EUR 2.1 billion, and thus EUR 0.2 billion above
the level from the prior year.
Real Estate is responsible for the financing of
commercial real estate in the SaarLB Group.
The regional focus is also on the German tar-
get market already defined for the Corporate
Customers segment and the French Grand
Est, with a focus on the Île-de-France. The
management of French real estate financiers
is also handled from the offices in Paris. Addi-
tionally, Real Estate monitors public private
partnership measures (PPP) for investments
in infrastructure and education as well as
other public sector construction measures in
the German regional market. In Real Estate,
roughly EUR 447 million was revalued/extend-
ed in 2012 (2011: EUR 631 million) of which
EUR 202 million was in France and EUR 245
million in Germany. On the German market,
the budgeted targets for the past financial
year were substantially exceeded, by roughly
70%. The French business, on the other hand,
was roughly 40% below the budget, which is
mainly due to the stronger competition in
the conditions for high-quality business. The
targeted margins in both segments are above
the budget. In France, the missed targets
in volume were overcompensated by higher
margins. In total, the credit volume in the
segment amounts to EUR 2.8 billion, which is
EUR 0.2 billion above the level from the prior
year.
The Projects segment is responsible for the
financing of projects in the SaarLB Group,
especially in the renewable energy sector,

22
but also in the area of public private partner-
ship (PPP) on the French market. The regional
business also focuses on the target markets
already defined in the Corporate Customers
segment. In Project Financing subsegment,
loans for renewable energies were valued at
EUR 393 million (2011: EUR 561 million). Of this
amount, as in the previous year, almost 90%
was attributable to the French market, which
again underscores the substantial market po-
sition and the structuring and legal expertise
of the SaarLB Group as the Franco-German
regional bank. The planned volumes could be
slightly exceeded, which is primarily due to
the French business with renewable energies.
In total, the credit volume of EUR 1.5 billion in
the segment as of 31 December 2011 increased
by roughly EUR 0.3 billion to EUR 1.8 billion as
of 31 December 2012. In the PPP France sub-
segment, the Group was able to expand its
market position. The total volume here was
EUR 83 million in 2012, as compared to EUR 53
million in the previous year.
Privately used real estate was financed, in
close collaboration with the Saarland sav-
ings banks, exclusively through Landesbau-
sparkasse Saar, which belongs to the SaarLB
Group. The customer credit volume for the
Landesbausparkasse was a good EUR 0.5 bil-
lion as of 31 December 2012, that is, slightly
above the level in 2011.
Savings Banks, Institutionals and High Net
Worth Individuals provides asset advice and
management for savings banks, institutional
investors and high net worth individuals. The
focus of Savings Banks and Institutionals is
on increasing existing customer connections
and expanding contacts with insurance com-
panies and pension funds in the region and
the business relationships to savings banks
in Rhineland-Palatinate. It also deals with the
financing of the region’s savings banks and
municipalities. The credit volume – primarily
from the financing of municipalities in the re-
gion – fell slightly from roughly EUR 2.1 billion
to roughly EUR 2.0 billion year on year. New
business in the municipal sector successively
improved, particularly for the securing of the
low interest rates, while the loan volume in
this subsegment was roughly at the level of
the previous year, although margins increased
from 6 bp to 9 bp year on year. The good liquid-
ity situation at savings banks kept a lid on de-
mand, resulting in a drop in loan volumes by
EUR 131 million to EUR 744 million in the 2012
financial year.
The non-portfolio related business with insti-
tutional investors improved significantly year
on year due to the very successful placement
of SaarLB issues.
In the business with high net worth individu-
als, SaarLB continues to see risk aversion due
to the ongoing discussions surrounding the
debt crisis. The low interest rates also lead to
a decrease in margins in the asset area. In ad-
dition to the cooperation between the SaarLB
Group and Berenberg Bank, Hamburg, which
has existed since the end of 2009, we im-
proved high net worth individuals’ perception
of the SaarLB Group through the creation of
a specialized team for wealth management in
2012 and strengthened our image in this seg-
ment. Volumes with high net worth clients
increased even more here.
The Treasury and Portfolio Management seg-
ment handles the active management of all
the portfolios of the SaarLB Group that no
longer belong to the core business. This in-
cludes both the so-called reduction portfo-
lios (mainly the investments in international
banks and corporates outside the core of
Europe, the international commercial real es-
tate financing, the securitisations and diverse
smaller subportfolios that the SaarLB Group
would like to dispose of in the medium term)
and liquidity portfolios. They comprise the
Securities Account A, which is held primarily
according to strict liquidity criteria (securi-
ties portfolio with a focus on European com-
panies in the investment grade area) and the
LCR portfolio, which serves to expand the
qualified assets in accordance with Basel III.
While the reduction portfolios fell in 2012 by
23
CORPORATE REPORT 2012 | GROUP MANAGEMENT REPORT
roughly EUR 0.9 billion to EUR 2.8 billion in
accordance with the strategic orientation of
the Group, the corresponding volume in the
Securities Account A remained, at EUR 2.3 bil-
lion, on the level of the previous year due to
the required structure and asset parameters.
In consideration of Basel III, the building of a
corresponding LCR portfolio was begun at the
end of 2011. The portfolio of securities in com-
pliance with Basel III totalled roughly EUR 0.3
billion as of 31 December 2012.
Furthermore, this business segment is re-
sponsible for the liquidity and asset-liability
management of the Group, for which the
Bank’s derivative business is mainly used. The
derivative business is mainly used to hedge
interest rate risks. The nominal volume was
EUR 16.5 billion, roughly on the level from the
previous year (2011: EUR 16.5 billion). Broken
down by type of business, 80.6% of this is at-
tributable to interest rate swaps.
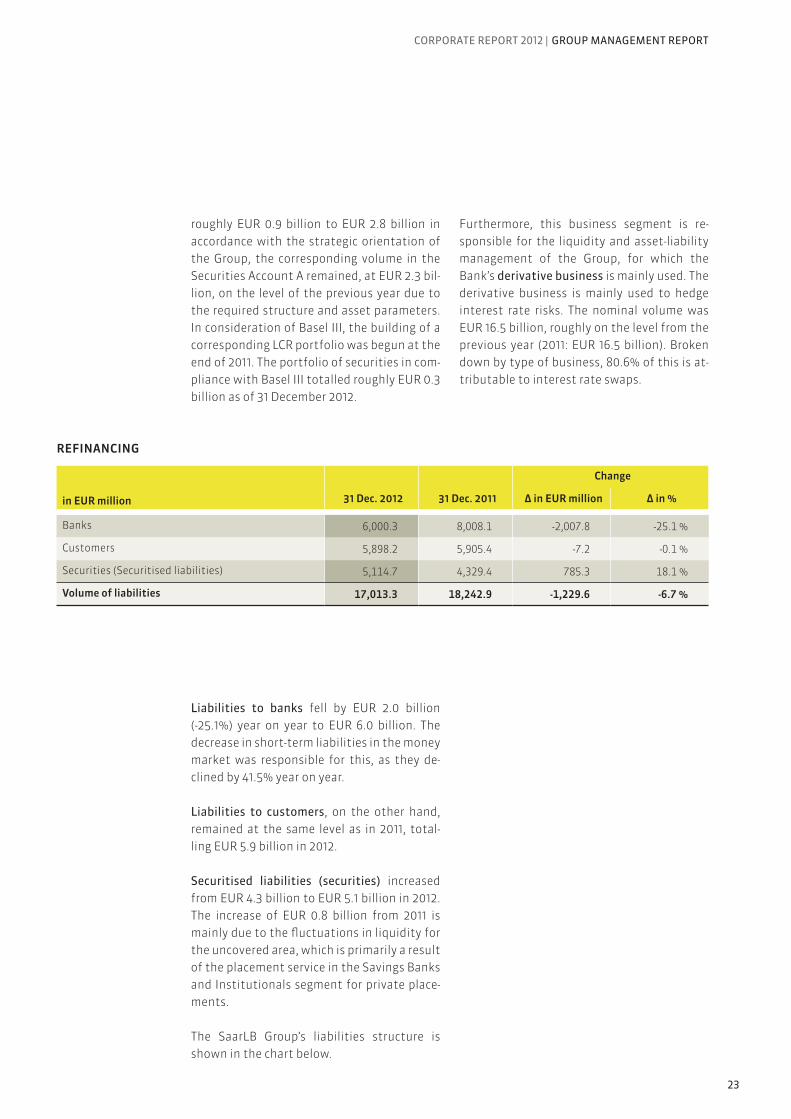
Liabilities to banks fell by EUR 2.0 billion
(-25.1%) year on year to EUR 6.0 billion. The
decrease in short-term liabilities in the money
market was responsible for this, as they de-
clined by 41.5% year on year.
Liabilities to customers, on the other hand,
remained at the same level as in 2011, total-
ling EUR 5.9 billion in 2012.
Securitised liabilities (securities) increased
from EUR 4.3 billion to EUR 5.1 billion in 2012.
The increase of EUR 0.8 billion from 2011 is
mainly due to the fluctuations in liquidity for
the uncovered area, which is primarily a result
of the placement service in the Savings Banks
and Institutionals segment for private place-
ments.
The SaarLB Group’s liabilities structure is
shown in the chart below.
REFINANCING
Change
in EUR million 31 Dec. 2012 31 Dec. 2011 Δ in EUR million Δ in %
Banks 6,000.3 8,008.1 -2,007.8 -25.1 %
Customers 5,898.2 5,905.4 -7.2 -0.1 %
Securities (Securitised liabilities) 5,114.7 4,329.4 785.3 18.1 %
Volume of liabilities 17,013.3 18,242.9 -1,229.6 -6.7 %

24
SUBORDINATED CAPITAL
The subordinated capital fell from EUR 351.9
million to EUR 335.1 million in the past finan-
cial year. A planned run-off of subordinated
liabilities and profit participation rights for a
total of EUR 27.5 million was not replaced. The
debt component of silent reserves increased
by EUR 10.7 million in 2012 due to the shorter
maturities as part of the split accounting in
2012.
REPORTED EQUITY
Reported equity rose by EUR 96.8 million,
from EUR 462.0 million to EUR 558.8 million.
The change is, on the one hand, due to an in-
crease in the revaluation reserve from EUR
-11.6 million in 2011 to EUR 43.6 million in 2012
and, on the other, due to a significant rise in
the retained profit of EUR 49.7 million, which
is EUR 38.4 million above the previous year.
REGULATORY CAPITAL
SaarLB’s equity in accordance with regulatory
requirements [Solvency Ordinance : SolvV] as
of the reporting deadline 31 December 2012
fell from EUR 865.2 million as of 31 December
2011 to EUR 845.4 million. The reason for this
is a decrease in the profit participation rights
capital in accordance with Section 10 (5) KWG
[German Banking Act] of EUR 30.0 million and
a decrease in the dated silent reserves of EUR
10.0 million. Both capital components may no
longer be assigned to capital on account of
the remaining maturities. On account of the
use of the exemption provisions pursuant to
Section 31 KWG [German Banking Act], SaarLB
has not prepared a regulatory group report.
The core capital – before the items that are
subject to a 50% deduction from core capi-
tal – fell by some EUR 10.1 million to EUR 812.1
million. The reason for this includes two silent
reserves with fixed terms that may no longer
be assigned to capital on account of the ma-
turity date.
The supplementary capital – before the items
that are subject to a 50% deduction from sup-
plementary capital – totalled EUR 139.4 mil-
lion (2011: EUR 173.0 million) on account of the
regulatory subordinated liabilities and profit
participation rights that ceased to be eligible.
The decrease in the eligibility of the profit par-
ticipation rights was material.
The value adjustment shortfalls, which
must be deducted fifty-fifty from core and
EUR billion
9.0
8.0
7.0
6.0
5.0
4.0
3.0
2.0
1.0
0.0
Banks Customers Securities
2012 2011 2010

25
CORPORATE REPORT 2012 | GROUP MANAGEMENT REPORT
supplementary capital, fell by EUR 22.1 million
to EUR 87.0 million. This amount results from
the difference between the actual value ad-
justments made in accordance with economic
standards and those that must be forecast
based on prudent regulatory requirements.
Likewise, the items, which must be deduct-
ed fifty-fifty from core and supplementary
capital, decreased slightly for investments to
EUR 19.1 million (2011: EUR 20.9 million).
The risk positions of the SaarLB Group fell –
similar to the development of the balance
sheet total – by EUR 437 million to EUR 7.2 bil-
lion as of 31 December 2012 (2011: EUR 7.6 bil-
lion). A reduction in the risk positions was
primarily driven by a reduction in the non-
strategic business.
As of the reporting deadline 31 December
2012, the core capital ratio was 10.6% and thus
significantly above the level from 2011 (9.9%),
while the solvency coefficient improved from
11.4% in 2011 to 11.8% in 2012.
With the approval of the annual financial
statements (German Commercial Code) of
the Group’s parent company SaarLB, the core
capital of SaarLB will be strengthened by EUR
30.3 million through the increase in reserves
pursuant to Section 340 g of the German Com-
mercial Code.
The Bank has been engaged in intense ne-
gotiations with the shareholders since the
beginning of 2013 in order to strengthen the
silent reserves of Saarland savings banks to
meet the stricter capital requirements in ac-
cordance with Basel III. The negotiations have
been moving ahead positively and the objec-
tive is to have the Saar Association of Savings
Banks increase its share of the voting share-
holder capital of SaarLB to 25.1% by means
of converting the previous silent reserves of
Saarland savings banks, effective 30 Septem-
ber 2013. Furthermore, the plan is to grant,
to the remaining silent reserves of Saarland
savings banks in SaarLB, the right to request
conversion to solid core capital as of 1 January
2016, if need be.
Irrespective of this, the Bank continued to im-
plement the regulatory changes under Basel
III/CRD IV and CRR and determine the imple-
mentation measures required in 2013 by con-
ducting a commensurate concept study.
SUPPLEMENTARY REPORT
There have been no events of special signifi-
cance since the end of the year under review.
RISK REPORT
RISK MANAGEMENT AND MONITORING
PRINCIPLES
The SaarLB Group manages and monitors its
risks on the basis of uniform principles. All in-
formation given below relates to the SaarLB
Group unless expressly stated otherwise.
Management of subsidiaries and companies
valued at equity takes place as part of invest-
ment controlling.
The key risk management and monitoring
principles are laid down in SaarLB’s risk strat-
egy. In accordance with the business strategy,
the Board of Management sets the policy for
dealing with counterparty risk (counterparty
default risks and credit spread risks), market
price risk, liquidity risk, operational risk, risks
from unexpected behaviour of savers, real es-
tate risk, strategic risks / business risks and
reputation risks, which are the key risk types
for SaarLB. It is responsible for and monitors
the implementation of these guidelines.
Generating a reasonable and sustainable re-
turn after allowing for risk is the ultimate aim
of all SaarLB’s business activities. Risks may
only be entered into to the extent permitted
by SaarLB’s risk-bearing capacity.

26
Suitable limits for the key risk types have
therefore been set and appropriate proce-
dures for identifying, measuring and monitor-
ing them defined as part of the risk strategy.
The tasks, competencies and responsibilities
of the staff involved are based on clearly de-
fined organisational structures and process-
es. Organisational structures take account of
the regulatory requirements under the Mini-
mum Requirements for Risk Management
[MaRisk] and the Solvency Ordinance [SolvV]
on the division of functions between Sales
and Trading (business segments) on the one
hand and Risk Office, Settlement and Risk
Controlling on the other.
While business areas are based around Saar-
LB’s business model, core competencies have
been combined in the organisation of the Risk
Office and Settlement.
Global Risk Management is in charge of risk
controlling of all risk types at the portfolio
level. Risk Office is responsible for managing
and monitoring counterparty risk at the indi-
vidual exposure and sub-portfolio level. This
involves integrated risk reporting of all risk
types as part of a joint MaRisk risk report.
Internal Audit reports directly to the Board of
Management and is answerable to its Chair-
man. It is an independent internal division that
audits and assesses, on the basis of a risk-ori-
ented audit approach, all activities and process-
es within SaarLB, including the internal control
system and risk management and controlling.
This also applies for outsourced activities and
processes. Internal Audit acts in accordance
with legal and regulatory requirements such as
KWG [German Banking Act], MaRisk [Minimum
Requirements for Risk Management].
With the publication of the 4th MaRisk
amendment on 14 December 2012, SaarLB im-
mediately began the implementation of the
new requirements and completed them in ac-
cordance with the requirements at the end of
2013.
CAPITAL MANAGEMENT
The regulatory requirements set out in the
Solvency Ordinance [SolvV] are key for SaarLB
when assessing and managing capital ad-
equacy as well as maintaining economic risk-
bearing capacity.
REGULATORY CAPITAL
SaarLB has applied the relevant rules on cal-
culating capital requirements under the Sol-
vency Ordinance since obtaining approval
from the German Federal Financial Supervi-
sory Authority (BaFin) to use the Internal Rat-
ings Based Approach (IRBA) on 1 January 2007.
Regulatory capital – i.e. equity – comprises
core capital (essentially nominal capital, si-
lent partner contributions and reserves, in-
cluding the reserves under Section 340 g of
the Commercial Code) plus supplementary
capital (essentially profit participation rights
and long-term subordinated liabilities) after
deductible items.
The overall ratio – the ratio of capital to risk
positions calculated under Solvency Ordi-
nance rules – must not fall below 8.0% from a
regulatory point of view. SaarLB has specified
a stricter target ratio of 10.0% for its Group
figure and a core capital target ratio of 8.0%
in its internal management. The latter is the
ratio of core capital (after deductible items)
to risk exposures.
Target values are constantly maintained by
means of medium-term planning over a five-
year timeframe. The Corporate Development
segment is responsible for the strategic plan-
ning process. On the basis of the economic
conditions determined in this process, each
business area performs its own risk exposure
planning for this time period. Their figures
are then aggregated at the Group level by
Controlling – the department in charge of the
quantitative aspects of medium-term plan-
ning – and compared with the equity available
in the planning period. Finally, the measures

27
CORPORATE REPORT 2012 | GROUP MANAGEMENT REPORT
needed to procure capital or scale back pro-
posed business area budgeting are defined to
ensure the targets are met.
An overview of the key Solvency Ordinance
data as of the balance sheet date of 31
December 2012 and the corresponding fig-
ures from the previous year are given below.
SaarLB stopped preparing regulatory group
reports in the middle of 2011. To this extent,
the figures only include the single institute.
The key figures for SaarLB increased noticea-
bly year on year due to the drop in risk assets.
SaarLB complied with the minimum regula-
tory ratio during the entire reporting period
at all times as well as its stricter target ratios.
Good overall capital adequacy ratios were
also reflected in the results of the required
regulatory stress tests: Based on the assump-
tion of economic weakness, the equity ratio
at the Group level was 10.0% and the core
capital ratio was 9.0% as of 31 December 2012.
ECONOMIC CAPITAL (RISK BEARING
CAPACITY)
The core aim of the SaarLB Group’s risk man-
agement, aside from complying with regula-
tory capital requirements, is to ensure that
the economic risk-bearing capacity, which is
the difference between risk capital (risk cover
funds) and risk capital needed, is adequate.
Risk cover funds are fundamentally deter-
mined on the basis of IFRS accounting and
indicate the maximum actual level of unex-
pected losses from risks entered into that can
be borne.1 In the reporting period, the calcula-
tion of the risk bearing capacity was refined
with an impact on the components of avail-
able cover funds:2
Key Solvency Ordinance (SolvV) data 31 Dec. 2012 31 Dec. 2011
Risk exposure (EUR million) 7,181 7,618
Equity (EUR million) 845 865
of which: core capital (EUR million) 759 757
Equity ratio (Group level in %) 11.8 % 11.4 %
Core capital ratio (in %) 10.6 % 9.9 %
1 On account of the one-year period under consideration, the equity items as of the reporting deadline are not reported in the risk cover funds, but rather
the figures (if need be, reduced by maturities in the period under consideration) one year after the reporting deadline are recognised.2 The comparable figures as of 31 December 2011 were adjusted to the new system. A reconciliation with the available cover funds in the risk report for
the 2011 consolidated financial statements is included in the presentation. In the earnings after taxes, only the taxes to be actually paid in the case of
liquidation are taken into account. On the comparable reporting deadline, all taxes were recognised; compensating deferred taxes were included in the
revaluation reserve.

28
Components of the risk cover funds (EUR million) 31 Dec. 2012 31 Dec. 2011 Change
Results after taxes (minimum YTD and Proj.) 74.1 11.1 +63.0
+ nominal capital 132.1 132.1 -
+ capital reserves 50.8 50.8 -
+ retained earnings 154.1 129.3 +24.8
+ undated silent partner contributions 137.0 137.0 -
+ dated silent partner contributions 252.3 252.3 -
+ profit participation rights 38.5 38.5 -
+ subordinated liabilities 124.0 133.8 -9.8
+ revaluation reserve 58.7 -19.0 +77.7
Risk cover funds 1,021.7 865.9 +155.7
./. less intangibles -2.0 -2.1 +0.1
./. less balance of hidden charges and silent reserves from securities (LaR and HtM)
-0.4 -39.5 +39.1
./. less corrections in equity due to the surplus of deferred tax assets 8.0 -13.3 +21.4
Liquidation cover funds +1,027.3 +811.0 +216.3
./. less losses from non-performing positions -21.3 -20.9
./. less anticipated losses from the risk assessment horizon -30.5 -22.8
Available cover funds +975.5 +767.4
Previous reporting:
Liquidation cover funds +1,027.3 +811.0 +216.3
./. less buffer for business and strategic risks -46.7
./. less buffer for real estate risks -6.7
./. less buffer for liquidity and reputation risks -17.7
Available cover funds (to date) +739.9
29
CORPORATE REPORT 2012 | GROUP MANAGEMENT REPORT
The risk cover funds rose significantly in com-
parison to the previous deadline primarily due
to the higher earnings, an addition to profit
reserves and due to positive effects from the
revaluation reserve, while slight declines in
subordinated liabilities were overcompensat-
ed as a result.3 The available risk cover funds
result from the risk cover funds due to the re-
ductive consideration of other effects:
-
ducted from the cover funds, which might not
retain their value in the case of a liquidation.
cover funds are also deducted over a one-year
assessment horizon, which will not be explic-
itly considered in the future modelling of the
economic risk bearing capacity calculation.
As part of economic risk capital management,
SaarLB monitors its risk profile and ensures
its risk-bearing capacity is always adequate
by comparing each month the risk capital al-
located to the available cover funds and risk
capital needed. Risk capital needed is deter-
mined by analysing all significant risk types
in a consistent manner.4 The risks from across
the Group are collated into an overall assess-
ment of the risk existing. In ICAAP, the value at
risk (VaR) method based on a confidence level
of 99.95% is used to determine risk capital
needed. The limits are set at the level of the
individual risk types and collectively through
the (total) allocated risk capital. Assumptions
and results of the risk quantification are to be
validated at least once a year.
3 In 2013 – i.e. over a one-year assessment horizon – some EUR 10 million of subordinated liabilities will fall due.4 Besides the previously considered risk types, the new system also includes the following risks: unexpected behaviour by savers, real estate risk, strate-
gic risk / business risks and reputation risks.

30
The ICAAP risk-bearing capacity as of 31 De-
cember 2012 is illustrated in the following
overview:5
Economic RBC (ICAAP)(EUR million)
31 Dec. 2012 31 Dec. 2011
Capitalneeded
Limit Range Capitalneeded
Limit Range
Counterparty risk 331.1 430.0 77.0 % 338.5 430.0 78.7 %
of which default risk (141.2) (180.0) 78.4 % (136.2) (180.0) 75.7 %
of which credit spread risk (189.9) (250.0) 75.9 % (202.2) (250.0) 80.9 %
Market risk 32.2 90.0 35.8 % 12.0 90.0 13.3 %
Operational risk 2.6 5.0 51.1 % 2.1 5.0 41.8 %
Reputation risk 0.0 2.0 0.0 % 0.0 2.0 0.0 %
Unexp. behaviour by savers 0.6 3.0 19.7 % 1.0 3.0 32.5 %
Real estate risk 13.3 15.0 88.5 % 13.3 15.0 88.5 %
Strategic risk / business risk 72.7 85.0 85.5 % 68.1 85.0 80.1 %
Total 452.4 630.0 71.8 % 434.8 630.0 69.0 %
Available cover funds 975.5 767.4
Free econ. cover funds 523.1 332.5
5 The refinement of the risk bearing capacity calculation was retroactively applied to the comparable reporting deadline of 31 December 2011. In comparison
to the system outlined in the report for the previous year, credit spread risks (EUR +169.9 million) and market risks (EUR +4.6 million) are quantified higher
in the comparable figures as of 31 December 2011 as a result. In the credit spread risks, significantly higher divergence in spreads is anticipated on the basis
of the experiences in the financial crisis; a holding period of 10 days is no longer generally assumed for market price risks; instead, the losses expected
within a year are to be quantified. On the other hand, no longer regulatory, but expected capital needed due to economic performance is counted (EUR
-20.7 million). The utilisation of the limits allocated at the reporting deadline is also illustrated as of 31 December 2011.
The SaarLB Group’s risk bearing capacity was
ensured at all times without qualification
throughout the reporting period (both in to-
tal and on the level of individual types of risk).
Besides the ICAAP risk capital needed, the risk
capital needed in multiple scenarios, was cal-
culated among others in the case of serious
economic weakness across all risk types under
consistent assumptions. With regard to coun-
terparty risks, a sector-specific deterioration
of the credit portfolio and a further increase
in credit spreads are assumed, and for all oth-
er types of risk, more stringent assumptions
also apply.

31
CORPORATE REPORT 2012 | GROUP MANAGEMENT REPORT
While the capital needed fell slightly overall,
the free economic cover funds rose year on
year and significantly exceeded the capital
needed as of the reporting deadline.6
COUNTERPARTY RISK (CREDIT RISK)
Under counterparty risk (credit risk), SaarLB
combines counterparty default risk and credit
spread risks. SaarLB defines counterparty de-
fault risk as the risk that the credit quality of
a business partner will deteriorate to such an
extent that it is unable to meet its payment
or contractual obligations towards the Bank
either in full and/or on time. Counterparty
default risk traditionally covers credit risk
but also includes issuer risk, borrower risk,
country risk and investment risk. Other coun-
terparty risks (credit spread risks) result from
credit-related changes in prices for the securi-
ties portfolio (including credit derivatives and
securitisation).
The risk strategy sets out the framework for
taking on counterparty default risks. A limit
on them, calculated from the risk-bearing
capacity, is then set in the annual strategy
process. To manage and monitor concentra-
tion risks and for operationalisation purpos-
es, limits are also imposed according to the
credit quality of borrowers, transactions, geo-
graphical markets and sectors.
The entire credit business chain, including
management and monitoring systems, is de-
scribed in detail in the SaarLB Lending Man-
ual. The master processes defined here apply
Bank-wide and are implemented uniformly in
all Risk Office areas. The Lending Manual is
constantly updated to take account of chang-
ing internal and external requirements.
Counterparty default risk is initially assessed
at individual borrower and (regulatory) bor-
rower unit level using the rating procedures
of RSU Rating Service Unit GmbH & Co. KG,
Munich, for banks, corporate customers (in-
cluding municipally-owned companies), inter-
national public authorities, leasing entities
(leasing companies and real estate leasing),
insurers, international commercial real es-
tate, project financing, country and transfer
6 In the presentation of the stress scenarios as of 31 December 2011 calculated according to the new system for comparative purposes, the direct eco-
nomic impact of the scenario would have been manageable, but the simultaneous occurrence of the 2000 year ICAAP loss would no longer have been
covered. From a regulatory point of view, both the scenario losses and an additional SolvV stress would have been covered as of 31 December 2011.
Serious economic weakness(EUR million)
31 Dec. 2012 31 Dec. 2011
Capital needed Capital needed
Counterparty risk 306.8 332.0
of which default risk (155.8) (166.0)
of which credit spread risk (151.0) (166.0)
Market risk 12.2 9.6
Operational risk 1.3 1.0
Reputation risk 0.0 0.0
Unexp. behaviour by savers 0.5 0.8
Real estate risk 10.2 10.2
Strategic risk / business risk 38.3 36.0
Total capital needed 369.3 389.7
Free econ. cover funds 523.1 332.5

32
risk, and the DSGV liability association. These
procedures are backed up by the savings
banks standard rating and the savings bank
real estate rating modules from Sparkassen
Rating und Risikosysteme GmbH, Berlin. All
these rating procedures have been approved
by the German Federal Financial Supervisory
Authority (BaFin) for use within the Internal
Ratings Based Approach (IRBA) to calculate
capital requirements in accordance with the
Solvency Ordinance. They are validated an-
nually by the Bank in cooperation with these
partners on the basis of the current credit
portfolio.
Significant input parameters for the quan-
titative part of the credit rating analysis
performed in the rating process come from a
balance sheet analysis system that supports
the major accounting standards (among oth-
ers HGB, IFRS, US-GAAP) and facilitates peer
groups and industry comparisons. In addition
to borrowers’ credit ratings, the risk assess-
ment also takes into account, where required,
property and project risks as well as country
and transfer risks. Finally, borrowers are allo-
cated to a specific rating category on a 25-tier
rating scale based on the probability of de-
fault. Rating categories are therefore compa-
rable regardless of the rating procedure used.
In accordance with SaarLB’s requirements,
standard forms of bank collateral – particular-
ly mortgage liens, pledges, assignments, chat-
tel mortgages, and debt undertakings – are
accepted by the Bank to reduce risks. Collater-
al is processed and valued in accordance with
the Collateral Manual. The procedure used to
calculate and determine collateral value must
be clearly documented. In the case of deriva-
tives trading, master agreements are conclud-
ed for the purpose of close-out netting. Collat-
eral agreements have been made with certain
business partners limiting the risk of default
in each case to an agreed maximum.
Exposures that may be at risk are identified
using an appropriately constructed early
warning system – for example by means of
annually revised ratings – and transferred for
intensive support. As with problem loan han-
dling, this falls within the remit of the Risk
Office.
Counterparty default risks from trading are
monitored daily by Settlement to take ac-
count of MaRisk. In particular, all derivatives
business is monitored (counterparty risk). All
trading business conducted with each cus-
tomer is counted towards the borrower lim-
its – including settlement limit – set for that
specific customer in a system-supported and
uniform Bank-wide process and in accordance
with the requirements on market valuation
methods under the Solvency Ordinance.
The internal rating is key for managing and
monitoring counterparty default risks at the
overall Bank level; collateral is currently taken
into account only at individual exposure level
as part of reaching decisions. In particular
for the calculation of the capital adequacy
under the Solvency Ordinance [SolvV], col-
lateral (through the credit risk mitigation
techniques) is largely not taken into account.
Gross exposure limits for borrower units
based on rating categories, markets and cus-
tomer types derived from the business strat-
egy are clearly defined in the risk strategy.
In addition, to strengthen individual sector
portfolios, only selected new business may
be conducted in the risk sectors identified by
the Bank. A strict ancillary condition requires
risk-oriented pricing supported by a suitable
calculation tool.
The relevant Sales and Risk Office areas moni-
tor each individual credit decision to ensure
compliance with the risk strategy.
The quarterly MaRisk risk report for the Board
of Management, Board of Administration and
the SaarLB Risk Committee contains both an
analysis of the credit portfolio – particularly
in relation to rating categories, sectors and
countries – as well as a summary target/ac-
tual comparison with the risk strategy.

33
CORPORATE REPORT 2012 | GROUP MANAGEMENT REPORT
SaarLB uses the CreditRisk+ credit portfolio
model – particularly in calculating risk-bear-
ing capacity – to analyse risks at the portfo-
lio level. The credit portfolio model takes ac-
count of the SaarLB Group’s entire receivables
portfolio exposed to counterparty default
risk, weighted by the specific probability of
default for each borrower derived from the
rating categories. A key variable is credit val-
ue at risk, which breaks down into expected
loss – which the risk-oriented pricing takes ac-
count of – and unexpected loss. Both the ex-
pected and unexpected loss must be covered
by risk capital in the risk-bearing capacity cal-
culation.
PORTFOLIO ANALYSIS (ECONOMIC)
The presentation in the following sections ti-
tled “Portfolio analysis (economic)” and “Sub-
portfolios with elevated risk profiles” is based
on the internal risk management (manage-
ment approach) according to which there was
a maximum credit risk of EUR 20,139 million
on the reporting deadline (as of 31 December
2011: EUR 21,896 million). Minor deviations
from the balance sheet approach (see section
“Portfolio analysis (balance sheet)”) are due,
among others, to consideration given to add-
ons in the determination of the exposure of
derivative financial instruments according to
the market valuation method, counterparty
risks from securities repurchase transactions
and the recognition of credit derivatives at
nominal values.

34
Around 81% of exposure is in the investment
grade bracket (rating categories 1 to 5 ac-
cording to the DSGV scale). In comparison to
2011, this share has increased by around three
percentage points due in particular to the de-
crease in exposure in rating category 1.
SaarLB uses a value-added and risk-orientated
grouping code for the purposes of economic
management and strategic alignment of the
sector exposure, breaking down exposure
into 32 sector groups. Sector group exposure
(excluding the low-risk Banks sector group,
which is shown separately in the following
and comprises just under 42% of total expo-
sure) can be broken down as follows:
Exposure by rating category (EUR million)
14,000
12,000
10,000
8,000
6,000
4,000
2,000
0
DSGV scale 1 2 - 5 6 - 12 13 - 15 16 - 18(Landesbanks
scale:0-7 8-11 12-18 19-21 22-24)
31 Dec. 2011 31 Dec. 2012
Customer exposure by sector (EUR million)
3,500
3,000
2,500
2,000
1,500
1,000
500
0
Real Estate SovereignsRenewable
EnergyUtilities Automotive
Construc-tion
SteelWholesale +retail trade
Food +Beverages
ABSRetail
customersOther
sectors
31 Dec. 2011 31 Dec. 2012

35
CORPORATE REPORT 2012 | GROUP MANAGEMENT REPORT
SaarLB’s sector portfolio – particularly the
corporates portfolio – continues to be well-
diversified. Real estate, the largest individual
sector (besides banks), comprises roughly 17%
of the total exposure (including banks) after
amounting to 15% in 2011.
In the year under review, the exposure in the
target industry of renewable energy signifi-
cantly increased again by EUR 448 million,
while primarily exposure to the bank sector
fell (by EUR 2,097 million).
SaarLB uses the official Bundesbank codes to
give a breakdown of its exposure in a uniform
manner for each individual country. Regions
are then grouped on the basis of global and
regional economic ties. The focus of SaarLB’s
country portfolio is in its defined target mar-
kets of Germany and France, which amount
to a share of around 85% (as of 31 December
2011: 84%). Another 12% (as of 31 December
2011: 13%) concerns exposure in the rest of Eu-
rope, whereby the exposure in Ireland and in
the southern European countries of Greece,
Italy, Spain and Portugal amounts to a total
of EUR 445 million (of which 71% is invest-
ment grade). In the reporting period, the vol-
ume of French business was expanded in par-
ticular, while exposure in Germany (primarily
to banks) and outside of the target markets
fell slightly.
Exposure by region (EUR million)
14,000
12,000
10,000
8,000
6,000
4,000
2,000
0
Germany France Other Europe North America Other
31 Dec. 2011 31 Dec. 2012

36
The loans and advances to banks – includ-
ing the credit substitute securities portfolio
reported under investments on the balance
sheet – are predominantly to banks based in
Europe, mostly in Germany. Across all regions,
the bank exposure fell by a total of EUR 2.1 bil-
lion in the reporting period, in absolute terms
seen most clearly in Germany where it fell by
EUR 1.3 billion, and as a percentage in France
where it dropped by -41%.
Banks: Maximum credit risk (EUR million)Regions
31 Dec. 2012 31 Dec. 2011
Germany 6,478 7,815
France 418 707
Rest of Europe 1,364 1,775
North America 213 264
Other 69 77
Total 8,542 10,639
Non-banks: Maximum credit risk (EUR million) as of 31 Dec. 2012 31 Dec. 2011
SectorsGermany France Other
WesternEurope
NorthAmerica
Other Total Total
Sovereigns 1,559 483 198 0 25 2,264 2,314
Real Estate 1,360 1,414 332 230 0 3,335 3,364
Automotive 222 68 9 0 0 299 326
ABS 8 0 90 9 0 107 160
Wholesale + retail trade 229 12 2 0 0 242 248
Construction 138 177 6 0 0 320 341
Utilities 214 31 111 0 2 359 353
Steel 303 7 17 0 0 327 312
Renewable energy 389 1,295 0 0 0 1,684 1,236
Food + beverage 125 69 85 0 6 285 297
Retail customers 420 130 2 0 0 552 508
Other sectors 1,241 367 165 35 12 1,821 1,798
Total 6,208 4,053 1,016 275 46 11,597 11,258

37
CORPORATE REPORT 2012 | GROUP MANAGEMENT REPORT
Most of the loans and advances to customers
(around 97%) – including the credit substitute
securities portfolio reported under invest-
ments on the balance sheet – are to customers
based or residing in Western Europe. Of these
customers, German and French customers
make up the largest share – roughly 91%.
Loans to banks were mostly in larger volumes
and were reduced slightly in the reporting
year. The changes in the higher size categories
result from the shift of individual customers
to adjacent categories.
Loans and advances to customers are well-di-
versified in terms of size. In accordance with
SaarLB’s business model, most of the new
exposures were in the EUR 1 million to EUR 50
million range.
Banks: Maximum credit risk (EUR million)Size category
31 Dec. 2012 31 Dec. 2011
Up to EUR 1 million 35 74
> EUR 1 million to 5 million 142 281
> EUR 5 million to 10 million 164 335
> EUR 10 million to 20 million 700 706
> EUR 20 million to 50 million 1,500 1,864
> EUR 50 million to 100 million 1,424 1,499
> EUR 100 million to 250 million 2,006 2,443
> EUR 250 million to 500 million 1,078 1,675
> EUR 500 million to 1 billion 1,492 699
> EUR 1 billion to 2.5 billion 0 1,062
Total 8,542 10,639
Non-banks: Maximum credit risk (EUR million) Size category
31 Dec. 2012 31 Dec. 2011
Up to EUR 1 million 695 742
> EUR 1 million to 5 million 1,116 1,211
> EUR 5 million to 10 million 1,912 1,770
> EUR 10 million to 20 million 3,150 2,865
> EUR 20 million to 50 million 3,057 2,965
> EUR 50 million to 100 million 702 688
> EUR 100 million to 250 million 709 646
> EUR 250 million to 500 million 257 370
Total 11,597 11,258

38
Subportfolios with elevated risk profiles
The securitisation positions held by SaarLB
largely possess a good to very good external
rating. More than 67% of the held volumes
have a rating in the investment grade area.
Securitisations: Maximum credit risk (EUR million) Rating category
31 Dec.2012 31 Dec.2011
1 46 115
2 - 5 26 37
6 - 8 17 0
9 - 12 11 3
13 - 15 4 3
Default categories 3 3
Total exposure 107 160
The receivables from the support given to
SachsenLB are included in the overall expo-
sure of the securitisation positions. They
amounted to some EUR 6.4 million as of 31
December 2012 (as of 31 December 2011: some
EUR 27.6 million). When classified according
to regions, a share of 8% of other exposure is
represented by Germany. 84% is distributed
across the rest of Europe, with a focus on
Spain (25%), Italy (21%) and Ireland (15%). The
share of securitisations in the North American
market is EUR 9.0 million and did not change
in comparison to the prior year.
The total exposure from securitisation po-
sitions fell even more in comparison to the
reporting deadline from the previous year.
The reason for this was both a reduction of
EUR 21.1 million in redemptions from the ex-
posure due to the support given to SachsenLB
and still existing exposure (around EUR 41.7
million) and repayments (around EUR 8 mil-
lion). These figures take into account a posi-
tive currency effect of EUR 0.3 million. In 2012,
there were no write-downs. New business was
not concluded in the reporting year and also
will not be concluded in the future under
SaarLB’s business and risk strategy. There was
a charge of around EUR 4.0 million from the
securitisation portfolio to the revaluation re-
serve at the balance sheet date. In addition,
reclassification of holdings as LaR in 2008
avoided a further charge of EUR 15.6 million
to the revaluation reserve.
On account of the sovereign debt crisis in the
euro zone, exposure in Portugal, Ireland, Italy,
Greece and Spain (“PIIGS” countries) is cur-
rently being observed very closely.
PIIGS exposureMaximum credit risk (EUR million)Country
31 Dec.2012 31 Dec.2011
Spain 212 370
Italy 175 274
Portugal 39 96
Ireland 19 70
Greece 0 26
Total exposure 445 836
In the reporting period, the credit level fell
by almost 50%. The maximum credit risk as
of the reporting deadline was 71% in the in-
vestment grade (rating 0-5 according to DSGV
scale).
PIIGS exposureMaximum credit risk (EUR million)Sectors
31 Dec.2012 31 Dec.2011
Banks 303 643
ABS 71 105
Real estate 33 35
Sovereigns 0 5
Rest 37 48
Total exposure 445 836
SaarLB does not have any receivables from
loans and advances to sovereigns in the PIIGS
countries. Impairments of EUR 3.6 million
have already been considered in the maxi-
mum credit risk of the Spanish exposure (real
estate sector).

39
CORPORATE REPORT 2012 | GROUP MANAGEMENT REPORT
Risk provisions
As part of risk monitoring, all exposures with
counterparty default risk are subject to a set
“early warning, intensive care and problem
loan handling process” and the relevant in-
structions and policies. Within this process,
exposures with warning signals are trans-
ferred to the appropriate type of support
adequate for the risk content and classified.
This is based on objective indicators pointing
to impairment of the exposure. These include:
stances,
streams than those agreed,
capital and/or interest, application for de-
ferment or extension,
or legal reasons in connection with financial
difficulties,
or other restructuring of the borrower,
-
tion,
financial asset due to financial difficulties,
When the risk analysis shows that the con-
tractual repayment or collection of all con-
tractual compensation for credit is improb-
able, a risk provision is established. The
calculation of the risk provision is made for
each business and considers all counterpar-
ty risks. The amount of the impairment is
fundamentally determined by the difference
between the carrying value of the receivable
and the anticipated future cash flows, which
are discounted with the original effective in-
terest rate. Specific risk provisions are also es-
tablished for exposures if repayment of loans
is improbable due entirely to country risks.
When establishing risk provisions, a distinc-
tion is made between specific risk provisions
for existing receivables and provisions for fu-
ture drawdowns (provisions for non-balance
sheet business in the credit business). Where
a default has occurred and it has been estab-
lished that there are no prospects of recovery,
the receivable is written off directly against
the gain/loss.
Portfolio risk provisions are established for
financial instruments that are recognised
at amortised cost and for which no impair-
ment has been identified. These include ex-
posures where objective indications as listed
above did exist for an impairment but, after
subsequent examination, were not rated as
impaired. When establishing portfolio risk
provisions, it needs to be ensured that impair-
ments not individually identified are taken
into account, thereby covering latent risks.
The portfolio risk provisions are calculated us-
ing Basel II parameters and under considera-
tion of the loss identification period (LIP) for
portfolios with the same risks.
Adequate provision was made for any poten-
tial losses detected as part of risk monitoring
in the reporting year. The changes in risk provi-
sions for individual risks in the SaarLB Group
(including the Landesbausparkasse and the
country risk provisions) were as follows:

40
Direct write-downs due to rating changes
amounted to EUR 1.8 million. Portfolio risk
provisions of EUR 20.9 million have been es-
tablished for latent risks in the credit busi-
ness, including financial assets measured at
amortised cost, of which EUR 3.0 million are
related to warranties and irrevocable credit
commitments. As a result of ratings changes,
write-downs of EUR 0.7 million were carried
out on investments.
Portfolio analysis (balance sheet)
The changes in maximum credit risk based
on IFRS carrying amounts (taking account of
specific risk provisions and country risk provi-
sions in accordance with IAS 39) in the report-
ing period were as follows:
Risk provisions for individual risksEUR million
1 Jan. 2012-31 Dec. 2012
1 Jan. 2011-31 Dec. 2011
Start level 140.8 163.5
Release1) -13.3 -16.6
Unwindings -4.1 -3.4
Utilisations1) -20.5 -40.0
Additions1) 44.2 37.4
Other* 0.0 -0.0
End level 147.1 140.8
* In particular exchange rate fluctuations
1) Figures have been adjusted; see note 39.
Maximum credit risk (EUR million)Balance sheet item
31 Dec. 2012 31 Dec. 2011
Cash reserves 669 107
Loans and advances to banks 3,228 4,083
Loans and advances to customers 8,911 8,491
Assets held for trading (HfT) 518 432
Positive market value of fair value hedges 46 0
Financial assets* 5,162 6,468
Other assets 4 4
Contingent liabilities 274 290
Irrevocable credit commitments 593 757
Total 19,405 20,632
* Not including equity instruments, including securities repurchase transactions

41
CORPORATE REPORT 2012 | GROUP MANAGEMENT REPORT
Exposures that are neither past due nor
impaired fell by roughly EUR 1.0 billion pri-
marily due to loans and advances to banks
(by EUR 775 million) and investments (by
EUR 1.3 billion).
This was countered by the rise in loans and ad-
vances to customers by EUR 467 million and
cash reserves by roughly EUR 563 million.7
The following tables show this maximum
credit risk, broken down by (a) financial as-
sets that are neither past due nor impaired,
(b) financial assets that are past due, but not
impaired and (c) financial assets that are im-
paired.
Financial assets that are neither past due nor impaired: maximum credit risk(EUR million)
Distribution by rating category as of 31 Dec. 2012 31 Dec. 2011
Balance sheet item and category* 1 2-5 6-12 13-15 Default
category No
ratingTotal Total
Cash reserve (LaR) - - - - - 669 669 107
Loans and advances to banks (LaR) 1,224 177 1,739 - - 47 3,187 3,962
Loans and advances to customers (LaR) 2,235 3,317 2,517 79 24 73 8,246 7,779
Assets held for trading (HfT) 344 99 59 - 1 1 504 387
Positive market value of fair value hedges 39 7 - - - - 46 -
Investments** 4,266 708 175 4 - 5 5,157 6,455
Available for sale 3,059 415 71 - - - 3,545 4,379
Fair value option 328 40 - - - 5 373 406
Held to maturity 600 75 - - - - 675 752
Loans and receivables 280 177 104 4 - - 565 918
Other assets - - 3 - - 1 4 4
Contingent liabilities 21 120 108 12 0 0 261 259
Irrevocable credit commitments 178 230 116 4 - 37 565 733
Total 8,306 4,657 4,718 98 26 834 18,639 19,686
* Categories are: Loans and Receivables (LaR), Held for Trading (HfT), Available for Sale (AfS), Fair Value Option (FVO) and Held to Maturity (HtM).
** Not including equity instruments, including securities repurchase transactions
7 Unrated items relate to assets for which a derived rating could not be allocated in accordance with the management approach, e.g. active balances for
ledger accounts.

42
The loans and advances that were past due
but not impaired were largely those to cus-
tomers, while only a small number of loans
and advances to banks were slightly past
due. The reduction of around EUR 229 million
in the year under review took place across
almost all balance sheet items, but is primar-
ily due to loans and advances to customers
and banks.
Financial assets that are overdue,but not impaired (EUR million)*
31 Dec. 2012 31 Dec. 2011
Maximum credit risk by period overdue
Fair value of colla-
teral
Max. credit risk
Fair value of colla-
teral
Balance sheet item, category** and sector
< 30days
30 daysto
3 months
3 monthsto
1 year
> 1 year Total
LOANS AND RECEIVABLES TO BANKS (LaR) 41 - - - 41 21 119 59
Banks / Finance 41 - - - 41 21 119 59
LOANS AND RECEIVABLES TO CUSTOMERS (LaR) 347 56 2 21 426 217 539 267
Real Estate 175 46 1 3 225 115 266 132
Renewable Energies 100 - 0 - 100 51 114 56
Hotels 1 - - 17 18 9 35 17
Health Care 13 - - - 13 6 0 0
Construction 6 5 - - 11 6 14 7
Pharmaceuticals 10 - - - 10 5 14 7
Other sectors 42 5 1 0 49 25 97 48
ASSETS HELD FOR TRADING (HfT) 10 4 - - 14 7 45 22
Renewable Energies 6 - - - 6 3 2 1
Real Estate 2 4 - - 6 3 6 3
Banks / Finance - - - - 0 0 37 18
Other sectors 1 - - - 1 1 0 0
INVESTMENTS*** - - - - 0 0 - -
Contingent liabilities 1 10 - - 11 6 22 11
Manufacturing & Engineering - 6 - - 6 3 - -
Construction 0 3 - - 3 1 3 2
Steel - - - - 0 0 10 5
Other sectors 0 1 - - 2 1 8 4
Irrevocable credit commitments 21 4 - - 25 13 20 10
Steel 10 - - - 10 5 - -
Real Estate 9 - - - 9 4 2 1
Renewable Energies 2 - - - 2 1 9 5
Other sectors 0 4 - - 5 2 9 5
Total 419 75 2 21 516 263 745 369
* In the event of overdue receivables, the entire exposure of the borrower incl. investments, assets held for trading, contingent liabilities and irrevoca-
ble credit commitments are reported as overdue.
** Categories are: Loans and Receivables (LaR), Held for Trading (HfT), Available for Sale (AfS), Fair Value Option (FVO) and Held to Maturity (HtM).
*** Not including equity instruments, including securities repurchase transactions

43
CORPORATE REPORT 2012 | GROUP MANAGEMENT REPORT
Individual risk provisions of roughly EUR 146.5
million were offset in the maximum credit
risk as of the reporting deadline. The collater-
al includes standard forms of bank collateral,
particularly mortgage liens, pledges, assign-
ments, chattel mortgages, and debt under-
takings.
Market risk
Market risk is the risk of (valuation) losses
on open (trading) positions due to unfavour-
able market price fluctuations. For SaarLB,
relevant market prices are in particular inter-
est rates (in both EUR and foreign currencies),
share prices and exchange rates. Open posi-
tions are created from spot, forward and op-
tion transactions.
Financial assets that are impaired (EUR million) 31 Dec. 2012 31 Dec. 2011
Balance sheet item, category* and sectorMax.
credit riskFair Value
of collateralMax.
credit riskFair Value
of collateral
LOANS AND RECEIVABLES TO BANKS (LaR) 0 0 2 1
Banks / Finance 0 0 2 1
Other sectors - - 1 0
LOANS AND RECEIVABLES TO CUSTOMERS (LaR) 239 122 173 85
Real Estate 141 72 78 38
Retail customers 42 21 25 13
Pulp + Paper 13 7 19 9
Sovereigns 12 6 12 6
Construction 7 3 13 6
Renewable energy 5 2 0 0
Chemicals 4 2 1 0
Other sectors 16 8 25 13
INVESTMENTS** 4 2 13 6
Available for sale 1 0 0 0
ABS portfolios 1 0 0 0
Loans and Receivables 4 2 13 6
ABS portfolios 4 2 13 6
Contingent liabilities 2 1 10 5
Pulp + Paper 1 1 3 2
Automotive 0 0 0 0
Construction 0 0 6 3
Other sectors 0 0 0 0
Irrevocable credit commitments 3 2 3 2
Pulp + Paper 3 2 0 0
Automotive - - 3 1
Other sectors - - 0 0
Total 250 127 201 99
* Categories are: Loans and Receivables (LaR), Held for trading (HfT), Available for Sale (AfS), Fair Value Option (FVO) and Held to Maturity (HtM).
** Not including equity instruments, including securities repurchase transactions

44
The strategic principles for dealing with mar-
ket risks at SaarLB are set out in the risk strat-
egy. Organisationally, the trading business
is structured around the requirements of
MaRisk. Treasury and Portfolio Management
actively manages assets and liabilities, inter-
est rate risks from the banking book, while
the Savings Banks, Institutionals and High
Net Worth Individuals segment is in charge of
interest rate products and foreign exchange.
Trading transactions are processed by the Ser-
vices area. Controlling is responsible for man-
aging and monitoring market risks and for
systematically developing the tools required
to perform this.
Since the Minimum Requirements for Trad-
ing Activities (MaH) was introduced in 1996,
SaarLB has measured and limited market
price risks from both the trading book and
the banking book, including interest rate
risks, using a uniform Value at Risk (VaR) ap-
proach. Risk controlling monitors the risks in
all six sub-portfolios, taking account not just
of trading risks in the narrow sense, but also
the asset/liability management positions,
which hold substantial interest rate risks for
the Bank.
The parameters used for calculating VaR re-
flect the Bank’s caution in exposing itself to
market risks. Standard deviations in market
price variations over ten trading days are cal-
culated using the Bank’s own and sometimes
historically long time frames and are scaled
to a one-sided confidence interval with 99.5%
statistical probability. Particular account is
taken of any recent increases in volatility.
When producing a risk summary, correlations
that minimise risks are disregarded.
The Board of Management has set a maximum
potential loss limit (VaR limit) and a maximum
loss limit (target deviation limit) for each sub-
portfolio based on the risk cover funds. Each
sub-portfolio’s value-at-risk, which is calculat-
ed daily, must not exceed the VaR limit allo-
cated to it at any time. Negative deviations in
the sub-portfolio’s net gain/loss must not ex-
ceed any of the target deviation limits either.
The target deviation limit is usually 50% of
the VaR limit. In some cases, VaR limits can be
supplemented by guideline values for upper
portfolio limits and other restrictive stipula-
tions laid down by the member of the Board
of Management responsible for Trading.
Reporting to all departments and segments,
including the Board of Management, in the
risk monitoring and management process
takes place at the start of each trading day. It
covers realised gains/losses, valuation gains/
losses, VaR and limit utilisation for the pre-
ceding trading day.
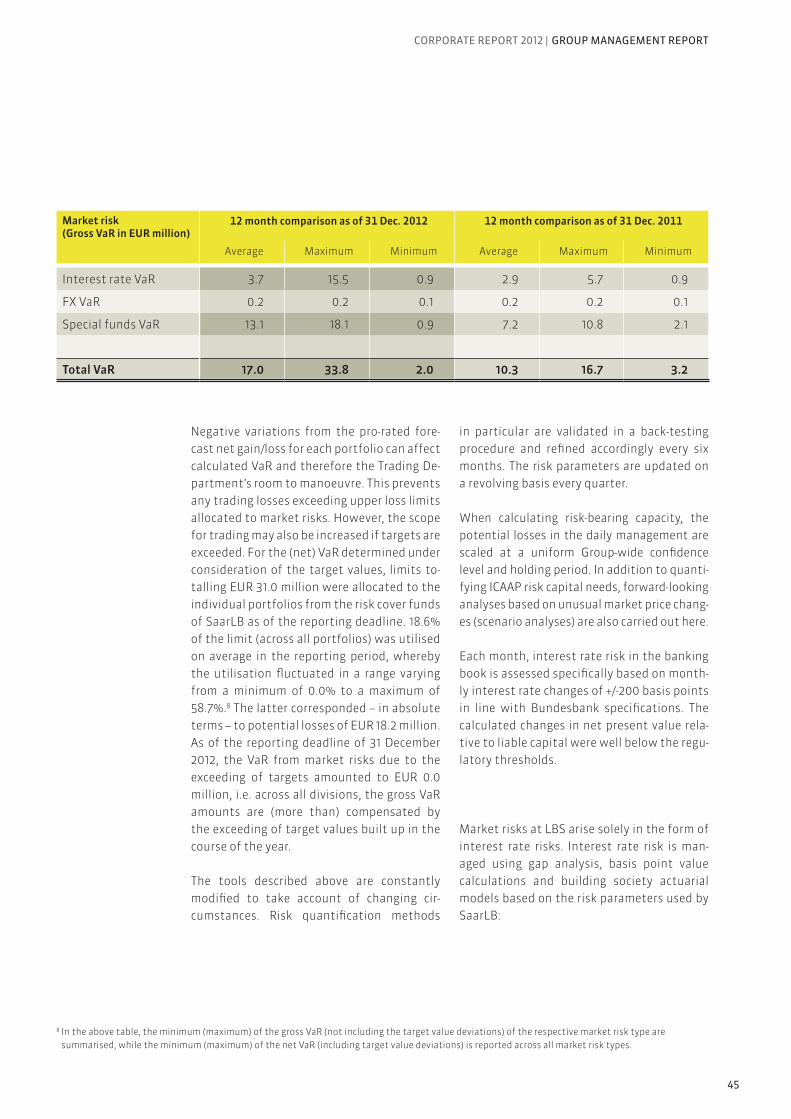
45
CORPORATE REPORT 2012 | GROUP MANAGEMENT REPORT
Negative variations from the pro-rated fore-
cast net gain/loss for each portfolio can affect
calculated VaR and therefore the Trading De-
partment’s room to manoeuvre. This prevents
any trading losses exceeding upper loss limits
allocated to market risks. However, the scope
for trading may also be increased if targets are
exceeded. For the (net) VaR determined under
consideration of the target values, limits to-
talling EUR 31.0 million were allocated to the
individual portfolios from the risk cover funds
of SaarLB as of the reporting deadline. 18.6%
of the limit (across all portfolios) was utilised
on average in the reporting period, whereby
the utilisation fluctuated in a range varying
from a minimum of 0.0% to a maximum of
58.7%.8 The latter corresponded – in absolute
terms – to potential losses of EUR 18.2 million.
As of the reporting deadline of 31 December
2012, the VaR from market risks due to the
exceeding of targets amounted to EUR 0.0
million, i.e. across all divisions, the gross VaR
amounts are (more than) compensated by
the exceeding of target values built up in the
course of the year.
The tools described above are constantly
modified to take account of changing cir-
cumstances. Risk quantification methods
in particular are validated in a back-testing
procedure and refined accordingly every six
months. The risk parameters are updated on
a revolving basis every quarter.
When calculating risk-bearing capacity, the
potential losses in the daily management are
scaled at a uniform Group-wide confidence
level and holding period. In addition to quanti-
fying ICAAP risk capital needs, forward-looking
analyses based on unusual market price chang-
es (scenario analyses) are also carried out here.
Each month, interest rate risk in the banking
book is assessed specifically based on month-
ly interest rate changes of +/-200 basis points
in line with Bundesbank specifications. The
calculated changes in net present value rela-
tive to liable capital were well below the regu-
latory thresholds.
Market risks at LBS arise solely in the form of
interest rate risks. Interest rate risk is man-
aged using gap analysis, basis point value
calculations and building society actuarial
models based on the risk parameters used by
SaarLB:
Market risk(Gross VaR in EUR million)
12 month comparison as of 31 Dec. 2012 12 month comparison as of 31 Dec. 2011
Average Maximum Minimum Average Maximum Minimum
Interest rate VaR 3.7 15.5 0.9 2.9 5.7 0.9
FX VaR 0.2 0.2 0.1 0.2 0.2 0.1
Special funds VaR 13.1 18.1 0.9 7.2 10.8 2.1
Total VaR 17.0 33.8 2.0 10.3 16.7 3.2
8 In the above table, the minimum (maximum) of the gross VaR (not including the target value deviations) of the respective market risk type are
summarised, while the minimum (maximum) of the net VaR (including target value deviations) is reported across all market risk types.

46
The market risks of LBS were integrated into
SaarLB’s risk-bearing capacity analyses in the
reporting year.
Liquidity risk
SaarLB defines liquidity risk as the risk of be-
ing unable to meet payment obligations as
they fall due in full or on time or – in the case
of a liquidity crisis – only being able to obtain
funds at high rates or sell assets at discounts
to the market prices.
The strategic principles for dealing with li-
quidity risks at SaarLB are set out in the risk
strategy and the liquidity contingency plan.
The prime goal of liquidity risk management
and risk controlling is to ensure SaarLB’s pay-
ment obligations can be met and refinancing
obtained at all times.
Liquidity management is handled by Treasury,
which also includes the money market trad-
ing unit responsible for ensuring that liquid-
ity is balanced on the market for maturities
of up to one year. Liquidity risk controlling is
performed by Risk Controlling.
All the liquidity flows (incoming and outgo-
ing payments) of the Bank are included in
the measurement. They include the deter-
ministic payment flows and, modelled on as-
sumptions, the relevant non-deterministic
payment flows (e.g. from irrevocable credit
commitments or investments). The poten-
tial liquidity coverage which is juxtaposed
to the payment flows consists of the freely
available access to central bank money at the
ECB, securities that can be sold or loaned at
short notice and the potential for the place-
ment of Pfandbrief issues at short notice, and
quantifies the options for covering (negative)
liquidity flows.
The most important instruments for meas-
uring liquidity risks up to and including No-
vember 2012 were the liquidity commitment
schedule and the liquidity cover potential (in
gross terms). Since the reporting deadline
of 31 December 2012, liquidity outflows and
potential liquidity coverage have been net-
ted: The net presentation used since then
provides an analysis of solely the resulting
(cumulative) liquidity gaps in four different
scenarios:
Illustration of the “ordinary” business activ-
ity by taking into account the contractual
capital maturities and assumption of equiv-
alent new business at maturity.
Illustration of a significant downgrade of
SaarLB, which leads to liquidity outflows by
private and institutional investors (outflow
of variable portfolios).
Illustration of a capital market disruption
(loss of confidence in the interbank market),
which has an impact on the procurement of
liquidity and leads to outflows of liquidity
with primarily institutional investors (out-
flow of variable portfolios and extension
difficulties).
Simultaneous illustration of the effects
from the bank stress and market liquidity
crisis scenarios.
Market risk(Gross VaR in EUR million)
12 month comparison as of 31 Dec. 2012 12 month comparison as of 31 Dec. 2011
Average Maximum Minimum Average Maximum Minimum
Interest rate VaR 2.3 3.5 0.5 0.9 2.4 0.2
Total VaR 2.3 3.5 0.5 0.9 2.4 0.2

47
CORPORATE REPORT 2012 | GROUP MANAGEMENT REPORT
To remain solvent even in times of crisis,
SaarLB has a suitable portfolio of securities
eligible for refinancing at central banks. An
adequate facility with the ECB ensures that
any unexpected payment obligations can
be covered on the same day. SaarLB thereby
limits its short-term liquidity needs so that
the shortfall arising from liabilities maturing
overnight does not exceed the central bank
refinancing freely available at the time con-
cerned.
The volume of the ECB account remained
around EUR 1.4 billion as of 31 Dec. 2012, at the
level of the end of 2011. Payment obligations
can continue to be covered, if need be, largely
independently of other sources of refinanc-
ing. The Bank did not resort to the overnight
facility of the ECB in the reporting period (as
in previous years).
The short-term refinancing needs pursuant to
BTR 3.2 MaRisk [Minimum Requirements for
Risk Management] have been reported since
the end of 2011 by solely offsetting both the
ECB-eligible and GC pooling-eligible assets in
the potential liquidity coverage. This should
be sufficient in the weekly report updated
on each trading day for the coverage of the
liquidity gaps resulting from the “combina-
tion” scenario and increased by an additional
collateral surcharge of 10%.
Liquidity management and monitoring for
each next 180-day period is performed using
an analysis of the cumulative liquidity gaps.
The balance from the cumulative liquidity
outflows and cumulative potential liquidity
coverage should be positive in each case. The
following example shows the basic scenario
for the control-relevant 180 day point of view:
Cumulative liquidity gap in base scenario (EUR ‘000s)
4,500
4,000
3,500
3,000
2,500
2,000
1,500
01/01/2013 31/01/2013 02/03/2013 01/04/2013 01/05/2013 31/05/2013 30/06/2013

48
Lastly, the regulatory tools available under
the Liquidity Regulation [LiqV] are used to
measure short-term liquidity.
The cumulative liquidity commitment sched-
ule is also key for managing maturities for pe-
riods of longer than 180 days. Suitable fund-
ing instruments are employed by the Bank to
create a balanced funding structure so it can
safeguard its solvency and ability to refinance
in the medium and long term. This exists at
the present time: On the one hand, SaarLB’s
collateral pool – the pool of assets serving as
cover for Pfandbriefs – has sufficient surplus
cover, enabling issuing activity to continue in
normal market situations. On the other hand,
the liquidity commitment schedule has been
structured so that there will be a net inflow
of liquidity in the coming years. Returns from
asset management can therefore be used as
credit.
Under the stress assumptions of the previ-
ously defined scenarios, the liquidity out-
flows as of 31 December 2012 were covered by
appropriate potential liquidity coverage from
the control-relevant 180 day point of view at
all times.
All the tools described form part of the regu-
lar reporting to the Board of Management
and are integrated into the MaRisk risk re-
port. In 2012, potential liquidity coverage was
sufficient to cover SaarLB’s liquidity flows at
all times.
The ongoing positive assessment of the li-
quidity situation is also confirmed by the
liquidity ratio (according to the regulatory
requirements under the Liquidity Regula-
tion [Liquiditätsverordnung]). In its internal
regulations, SaarLB’s managing and monitor-
ing goes further than the regulatory require-
ment that the liquidity ratio within the com-
ing month must be greater than 1. The bank
sets its warning level to 1.25, which triggers
countermeasures. In the year under review,
the liquidity ratio of the bank was between
1.79 and 3.46; as of the reporting deadline of
31 Dec. 2012, it amounted to 2.60. The obser-
vance of both the regulatory and internal re-
quirements was thus ensured at all times. LBS
also complied with the regulatory require-
ments on liquidity at all times in 2012.
In addition, a breakdown of balance sheet
financial liabilities by contractually agreed
terms to maturity (excluding home loan sav-
ings deposits that have no agreed maturity) is
given below:
Minimum liquidity gapas of 31 Dec. 2012 (EUR million)
10 days 90 days 180 days
Base scenario 1,687 1,687 1,687
Bank stress scenario 1,953 1,953 1,953
Market liquidity crisis scenario 1,355 1,355 1,008
Combination scenario 1,244 1,005 177

49
CORPORATE REPORT 2012 | GROUP MANAGEMENT REPORT
In the reporting period, SaarLB was also able
to place sufficient covered issues on the capi-
tal market. There was also demand from in-
vestors for uncovered issues. In view of the
pricing involved, the Bank utilised this op-
tion selectively, but out of business consid-
erations used its sufficient other refinancing
possibilities.
Operational risk
a) General information
Operational risk describes the risk of losses
that occur in consequence of inappropriate-
ness or the failure of internal processes and
systems, people or as a result of external
events. This definition includes legal risks.
SaarLB undertakes to manage operational
risks efficiently so as to protect the Bank, its
employees and clients from financial loss, loss
of trust and loss of reputation.
The methods and processes for controlling
and managing operational risk are set out
in detail in the SaarLB OpRisk manual. The
measurement and limitation of operational
risks are also part of the risk strategy.
Operational risk is managed decentrally in the
individual business segments, with each one
being responsible for dealing with the opera-
tional risks that fall under its responsibility.
This in particular covers preventive measures
against risks from incomplete business pro-
cesses and human error. The intention is to
avoid or at least mitigate impairments arising
from unforeseen events – especially in tech-
nical areas – through disaster recovery plans
and the use of parallel systems. The disaster
recovery plans are regularly adapted to cater
to changing structural and procedural organi-
sational circumstances and the systems up-
dated on an ongoing basis.
EUR ’000s31 Dec. 2012
Up to 3months
>3 monthsup to 1 year
>1 year to5 years
>5 years
Liabilities to banks 1,976 1,519 1,534 971
Liabilities to customers 2,823 638 795 1,122
Securitised liabilities 121 265 3,721 1,008
Off-balance sheet liabilities 867
Liabilities held for trading 15 31 285 315
Total 5,802 2,453 6,335 3,416
31 Dec. 2011
Liabilities to banks 3,194 1,947 2,111 756
Liabilities to customers 2,642 914 986 858
Securitised liabilities 0 361 3,887 82
Off-balance-sheet liabilities 1,047
Liabilities held for trading 10 30 235 269
Total 6,892 3,252 7,219 1,965

50
The duties of SaarLB’s Legal Department in-
clude minimising legal risks from contractual
terms and conditions, provisions of national
and international law and litigation and court
decisions. Pending litigation is taken into ac-
count appropriately in the annual financial
statements.
Risk Controlling provides central monitoring
of operational risks. The used instruments
currently include in particular the systematic
collation of operational losses occurring at
SaarLB in a loss database, forward-looking
assessment of the OpRisk profile through
regular self-assessments of all of SaarLB’s
risk-relevant organisational units and the req-
uisite structural and procedural organisation
within the Bank. Since 1 January 2007, SaarLB
has used the standardised approach under
the Solvency Ordinance [SolvV] for calculat-
ing capital requirements for operational risk.
Losses that have occurred and the results of
the self-assessments are analysed in a regular
reporting process that is integrated into the
MaRisk risk report. In the reporting period, 23
losses were observed.
These losses had a negative impact on net in-
come of less than EUR 1.5 million. This amount
is significantly below the risk capital allocat-
ed for operational risk based on the capital
requirements of the regulatory standardised
approach in the amount of EUR 21.5 million.
b) Accounting-related internal control and
risk management system
The following comments relate to the pro-
vision of Section 315 (2) Nr. 5 of the German
Commercial Code [HGB], in conjunction with
Section 315a (1) of the German Commercial
Code, according to which corporations in
terms of Section 264d of the German Com-
mercial Code have to describe the significant
features of the internal control and risk man-
agement system with regard to the Group ac-
counting process.
Responsibilities and goals
To ensure the appropriateness and reliability
of the accounting, the SaarLB Group has set
up an internal control system (ICS). It includes
principles, processes and measures to ensure
the effectiveness and efficiency of the ac-
counting. Against this backdrop, the internal
control system also serves to present a true
and fair view of the SaarLB Group’s net assets,
financial position and results of operations.
The main goal of the internal control system
is to ensure that all transactions are recorded,
processed and documented correctly and in
full in accordance with the legal requirements
and standards as well as the provisions of the
articles of association and the other internal
guidelines. The internal risk management sys-
tem is viewed as a component of the internal
control system.
Organisation
The SaarLB’s Board of Management (Group’s
Board of Management) bears responsibil-
ity for the Bank having a proper business or-
ganisation, which includes both appropriate
internal control processes and above all the
adequate controlling and monitoring of the
significant risks. The Group’s Board of Man-
agement is supported in this particularly by
the corporate area of Global Risk Manage-
ment with its two organisational units of Risk
Controlling, Financing and Reporting, and the
corporate area of Services with its IT organisa-
tional unit as well as by Internal Audit.
Risk management and monitoring
See “Risk management and monitoring princi-
ples” for the organisation of these areas.
Financing and Reporting
Financing and Reporting in the SaarLB Group
is responsible for the preparation of the
consolidated financial statements, the de-
velopment of accounting requirements, the

51
CORPORATE REPORT 2012 | GROUP MANAGEMENT REPORT
initiation of accounting-relevant projects and
for the observance of national and interna-
tional changes in the accounting. With regard
to the preparation of the consolidated finan-
cial statements, other subdivisions as well as
units to be consolidated are included.
Responsibilities in this context include pri-
marily ensuring the appropriateness of the
accounting, in particular the uniform Group
accounting and valuation (partially in collab-
oration with the IT organisational unit). This
primarily consists of setting up and monitor-
ing the effectiveness of the accounting pro-
cesses as well as the implementation of the
accounting standards and statutory require-
ments in the area of accounting that are rel-
evant for the SaarLB Group and are stipulated
in the accounting guidelines, the booking
logic and the posting rules. Furthermore, the
special departments and consolidation units
define the rules for business recognition,
master data maintenance and the fulfilment
of storage obligations in organisation and
process instructions. These instructions form
an essential basis for the accounting-related
internal control system.
The consolidated financial statements and
Group management report prepared on the
basis of the accounting guidelines are pre-
pared by the Group’s Board of Management,
examined by the Group’s auditor and finally
presented to the Board of Administration for
approval. The Board of Administration creat-
ed an Audit Committee that is responsible for
the review of the Group’s audit report and the
preparation of the decision by the Board of
Administration to approve the consolidated
financial statements and the Group manage-
ment report prepared in accordance with the
requirements of IFRS/IAS. Furthermore, the
Audit Committee addresses the accounting
process. It monitors the effectiveness of the
internal control, audit and risk management
system to the extent that this task is not
handled by the Board of Administration. The
Group auditor participates in the consulting
of the Audit Committee on the consolidated
financial statements and reports on the sig-
nificant results of his audit.
Internal Audit
Internal Audit audits the business operations
of the SaarLB Group and is subordinate to the
Chairman of the Group’s Board of Manage-
ment. The audit activities extend fundamen-
tally to all the SaarLB Group’s activities and
processes, also to the extent that they are
outsourced, on the basis of a risk-oriented au-
dit approach. This includes a review of the ef-
fectiveness and appropriateness of the inter-
nal control system and the risk management.
Internal Audit carries out the tasks assigned
to it independently of the activities, process-
es and functions to be reviewed or audited
in accordance with the applicable legal and
regulatory requirements (e.g. German Bank-
ing Act, MaRisk).
Control environment and control process
The internal control system is based on organ-
isation and process instructions.
The central components of these regulations
with regard to the accounting-related inter-
nal control system are:
-
uct processes for the recording, valuation
and reporting,
Manual for recording, valuing and reporting
on receivables as well as
-
paring the financial statements.
These provisions include the significant re-
quirements for uniform Group accounting
and valuation methods in the SaarLB Group
on the basis of IFRS/IAS.

52
Furthermore, Financing and Reporting pre-
pares the annual and semi-annual instruc-
tions at each reporting deadline, which con-
tain not only legal changes, but also primarily
the significant preparation work (including
the required proofs) and a schedule to be
undertaken by the respective special depart-
ments.
The rules for the recording and controlling
of business data are at the disposal of the
respective organisational unit; these instruc-
tions are prepared decentrally and updated if
need be.
The organisation and process instructions
also include the handling of the SaarLB
Group’s significant risks with regard to the
risk management and monitoring.
The rules for risk management and monitor-
ing are regularly reviewed and updated. On
account of the migration to the systems of
FinanzInformatik, a comprehensive revision
of all instructions and risk controlling and
monitoring was undertaken in the year under
review.
To ensure a complete and correct processing
of the transactions including the proper data
recording, booking and documentation, a va-
riety of internal controls are performed in the
SaarLB Group. These include appropriate sep-
arations of functions, a differentiated access
authorisation system for protection against
unauthorised access, continuous controls
within the scope of the work processes under
application of the four-eye principle as well as
programmed controls within the IT systems.
As part of the internal controls, general ledg-
ers and sub-ledgers are reconciled in SaarLB
and manually postable ledger accounts are
monitored by the responsible areas. Further-
more, controls and reconciliations are also
handled to ensure the proper transfer of data
between the different IT systems. Within
the process for preparing the consolidated
financial statements, the correct professional
presentation of the circumstances forming
the basis of the financial statements is re-
viewed and the quality assurance measures
are carried out for data included in the con-
solidated financial statements. The IDL-KON-
SIS server-based software that is used for the
consolidation contains multiple programmed
controls to ensure the recording of data and
documentation in accordance with the Group
requirements.
The SaarLB Group outsourced a portion of its
services (primarily IT services, services in the
area of payment transactions and securities
settlement) to external companies. The inte-
gration of the outsourced areas into the Saar-
LB Group’s internal control system is ensured.
Furthermore, Internal Audit at Saar LB consid-
ers the outsourced areas in the test process.
Where there is an audit by the Internal Audit
of the outsourcer, SaarLB’s Internal Audit reg-
ularly convinces itself of the functionability
of the respective audits by the outsourcers.
In the SaarLB Group, the accounting process
is subject to regular controls with regard to
the inherent risks in order to introduce appro-
priate measures for the further development
of the internal control system, if need be. This
also relates to the internal risk management
and monitoring.
Summary of risk situation
Saar LB has risk cover funds that are suf-
ficient to cover all the ICAAP risk capital
needed at any time in the year under review.
Consequently, the SaarLB Group’s economic
risk-bearing capacity was present at all times
last year without any qualifications. From a
regulatory point of view in terms of the Sol-
vency Ordinance [SolvV] report, the key fig-
ures in the year under review exceeded the
internal targets so that the regulatory risk-
bearing capacity was ensured at all times
without any qualifications.

53
CORPORATE REPORT 2012 | GROUP MANAGEMENT REPORT
OUTLOOK
For the German economy, growth is expected
to increase starting in the spring of 2013. The
good structural situation and the signals from
the global economy suggest a positive impact
will be had. This will be countered by the on-
going tendency for economies in the euro
zone to slip into recessions, although early
indicators suggest an improvement in the
situation. The forecast growth rates for Ger-
many mostly range between 0.4% and 1.0%
for the year. Recently positive signals for the
global economy speak for a gradual recovery
in exports over the course of the year. On the
other hand, consumption could make an even
stronger contribution to growth than in 2012.
The framework conditions such as employ-
ment, wages, low price increases, changes
in fiscal spending are advantageous for this.
Corporate investment, which was fairly disap-
pointing in 2012, will be critical for economic
performance. Based on the latest indicators,
consumer and economic sentiment have im-
proved slightly, and the labour market should
continue to see strong improvements.
In the Saarland economy, sentiment at the
beginning of 2013 has been restrained. In
the second half of the year at the latest, a re-
covery of the Saarland economy is expected.
Then the foreign business, domestic invest-
ment demand and private consumption will
ensure positive stimulus. Economic growth of
around 1% is anticipated for the entire year.
Despite the initially anticipated restrained
improvement in the economy, SaarLB contin-
ues to expect a robust labour market similar
to the forecast for Germany as a whole.
The prospects for the economy in Rhineland-
Palatinate improved again at the beginning
of the year. The reasons for this are consum-
ers’ ongoing high level of confidence and
companies’ adjustments to the economic
framework conditions. If there are no general
economic shocks, a moderate increase in eco-
nomic activity is expected in 2013.
The prospects for the first half of 2013 in
France are very conservative, with growth
forecast to be around 0.1%. The expected
stability of demand in France in the first few
months should mean that there is no fur-
ther decline in investment. The tendency of
private households to rely on their savings
should continue and thus allow stable private
consumption. A recovery of the global econo-
my and the expected devaluation of the euro
should generate export advantages. A slight
revival in some sectors of industrial produc-
tion is anticipated. The expectations in the
area of exports and for innovative companies
are very positive.
The forecasts for the Lorraine economy in
2013 are fairly subdued. Numerous small and
medium-sized companies fear a further de-
cline in business activities and are not plan-
ning any new investments. As a result, more
lay-offs are expected.
In Alsace, small and medium-sized companies
are anticipating a further deterioration in the
framework conditions, which should have a
corresponding impact on the labour market.
The liquidity and income position of compa-
nies will be hurt, possibly leading to a further
decrease in investment activity. Positive de-
velopments such as exports, tourism and new
businesses remain despite the poor business
climate.
After the decision by the ECB at the end of
2012 not to change the base interest rates, we
expect the three month interest rate for un-
collateralised interbank business to be 0.5%
on average for the year in 2013 on account of
the market expectations. It should then move
back in the direction of 1.25% in 2014.
The SaarLB Group as a whole sees a positive
course of business in the coming two years.
If, however, our expectations of a stable eco-
nomic development and a manageable crisis
54
in the euro zone are not accurate, our fore-
casts will not be met.
The development of Corporate Customers
must be viewed differently, depending on the
target markets and/or target customers.
In the German target market, the economic
performance of companies across all sectors
can be viewed as good. The only exception
here is the steel industry due to global over-
capacities and raw material and energy costs
and/or energy production, particularly on ac-
count of the impact of energy change.
Due to the material market position in Saar-
land and the increasing focus on acquisitions
in Rhineland-Palatinate, we are confident
that it will be possible to continue the good
performance in Corporate Customers in 2013.
The weak economic development and the lim-
ited willingness to invest in the French target
markets of Alsace and Lorraine are stifling
demand for credit. While retaining our risk-
oriented and selective new business strategy,
we have adjusted our plans accordingly. We
expect growth to be stimulated by the ongo-
ing high demand from municipalities and mu-
nicipally owned companies.
Real Estate will see above average growth
in Germany in 2013 through the financing
of portfolio real estate. The Bank is also in-
creasingly doing business in the area of new
construction financing for commercial real
estate. For the financing of commercial real
estate in France, SaarLB also expects a posi-
tive development of business despite sharp
competition. The real estate market in France
continues to be one of the most strategic and
important markets for institutional inves-
tors. SaarLB was able to establish itself as a
reliable partner for these professional players
in recent years.
In the Projects segment, the Bank antici-
pates – similar to the developments in 2012 –
a positive, dynamic development of new
business and ongoing stable portfolio in-
come. SaarLB is profiting from its very good
position in the markets of onshore wind
and photovoltaic in France, the stability of
the framework conditions there and the un-
changed need for retrofitting for a portion of
the renewable energy as a percentage of the
total energy produced. On the German mar-
ket, the Bank expects strong demand in the
sector of onshore wind due to the ongoing
discussion and the uncertainty with regard to
the EEC subsidy, especially in the first three
quarters of 2013. The Bank can rely on its tight
network of project planners, manufacturers,
investors, municipalities and municipality-
owned companies.
Savings Banks, Institutionals and High Net
Worth Individuals will concentrate on and
increasingly intensify the deposit and service
business with institutional investors and
high net worth private customers in the next
two years. With a trend toward rising interest
rates in the euro zone and an improvement
in sentiment in the relevant asset markets,
the commission income should also increase.
The interest margin contribution from the li-
abilities business should also increase again
slightly against the backdrop of the Bank’s
interest expectations. Previously, additional
possibilities for income emerged through
derivatives in the interest and currency man-
agement due to the use of the currently low
interest rate.
The ongoing low market interest rate level will
continue to limit the income possibilities for
Landesbausparkasse in the next two years.
The liabilities side of the Bausparkasse is de-
fined by interest payments on the home loan
savings deposits, while the asset side with the
credit business and investment possibilities
largely depends on the current market condi-
tions. Consequently, the net interest income
is only anticipated to rise moderately, which
is justified by rising volumes. Due to the on-
going very positive development of new busi-
ness, the Bank also expects a net commission
loss for Landesbausparkasse in the coming

55
CORPORATE REPORT 2012 | GROUP MANAGEMENT REPORT
year. In total, SaarLB anticipates positive op-
erating income over the next two years.
Treasury and Portfolio Management will con-
tinue active portfolio management within
the framework of the risk and income man-
agement of the SaarLB Group. The Bank an-
ticipates a further decline in the contribu-
tions from non-core business on the income
side in the next two years due to the planned
decrease in the reduction portfolio (roughly
EUR 1.6 billion in the next two years), whereby
stable contributions to income are expected
from Securities Account A. Depending on the
development of financial markets, last but
not least the situation in the euro zone, an
increase in risks cannot be excluded in the
forecast timeframe. Consequently, the busi-
ness segment for portfolio management
anticipates another increase in the need for
risk provisions or rating-related value adjust-
ments in the reduction portfolio in this year.
Treasury income from the money market and
asset-liability management should stay at
the current level of prior years.
In the area of Banking, the SaarLB Group is
in good shape due to the application of in-
ternational accounting standards, the regu-
latory requirements of the German Solvency
Ordinance [SolvV], and the implementation
of the 3rd amendment of MaRisk [Minimum
Requirements for Risk Management]. In 2012,
the Bank began the preparations for the im-
plementation of other regulatory require-
ments, particularly Basel III, CRD IV, the 4th
amendment of MaRisk and numerous inter-
nal projects, which were continued in 2013.
New or updated IFRS requirements (cf. note
1) were also implemented. The impact of the
regulatory reforms, the further increasing of
liquidity buffers for Basel III and other possi-
ble legal changes as a result of the financial
market crisis would have a negative impact
on income.
In 2013, there will be new challenges in the
technical-organisational area, which the
SaarLB Group will advance on the way to the
greatest possible integrated data manage-
ment.
These positive assessments will also show up
in the coming years with constantly good pre-
tax income. The greatest risk for the SaarLB
Group continues to be another intensifica-
tion of the sovereign debt crisis in Europe,
which could produce a chain reaction across
the entire sector and also drag in the SaarLB
Group.
Net interest income in 2013 will carry over
from the performance in 2012 and remain at a
high level despite the restrained money mar-
ket. This is primarily due to the higher income
in the core business segments due to the
growth in volumes and margins.
In the net commission income, the trend from
2012 will continue in 2013 and increase no-
ticeably again from this level in the following
years.
For 2013, slightly higher personnel expenses
than in 2012 are expected – partly due to the
planned restructuring measures and the im-
plementation of salary increases. In the years
after that, personnel expenses will fluctuate,
starting in 2016, on the level from 2012. Due
to the already planned and largely regulato-
ry-driven projects, administrative expenses
will increase from 2012 to 2013, but fall suc-
cessively again, as of 2014, below the level of
2012.
The gains/losses on fair value measurement
take into account the pure maturity effects
of negative market values for the interest de-
rivatives in the portfolio for this time period,
as in the prior year. As a result, the positive
contribution to earnings as a result of these
income statement items in the budget peri-
od, similar to the situation with the portfolio,
is planned to decline commensurately. The
gains/losses on investments include disposal
losses from the sale of securities and income
from the release of portfolio risk provisions
for 2012 that should not be repeated in the

56
following years. For the planning horizon of
2013 to 2017, no income statement effects
from other transactions are planned for these
items on account of this.
With regard to the increase in the Bank’s capi-
tal requirements due to Basel III / CRD IV, the
SaarLB Group is moving in the right direction
on account of the advanced and positive ne-
gotiations with the shareholders to solidify
and convert the silent reserves into solid core
capital, meeting the future requirements for
adequate capital in accordance with the new
rules over the next few years.
In summary, the SaarLB Group anticipates
that the positive performance in the results
of operations for the core operating areas,
which the Bank has observed since the 2010
financial year, will also continue in the next
two years of 2013 and 2014 unless there is a
worsening of the situation in the euro zone
and the connected negative impact on eco-
nomic development.
Saarbrücken, 26 March 2013
Landesbank Saar
Board of Management
Thomas Christian Buchbinder Werner Severin Frank Eloy

57
CORPORATE REPORT 2012 | GROUP MANAGEMENT REPORT

58
SaarLB consolidated financial statements 2012

59
Consolidated statement of comprehensive income FROM 1 JANUARY 2012 TO 31 DECEMBER 2012
EUR ’000s Notes 2012 2011 Change
1 Interest income (26) 765,432 834,274 -68,842
2 Interest expenses (26) -626,717 -712,317 85,600
3 Shares of profits in associated companies accounted for using the equity method
(27) 114 269 -155
4 Risk provisions in the credit business1) (28) -33,310 -18,900 -14,410
5 Commission income (29) 24,060 25,186 -1,126
6 Commission expense (29) -16,742 -13,662 -3,080
7 Gains or losses on fair value measurement (30) 37,009 -16,150 53,159
8 Gains or losses on hedge accounting (31) -151 43 -194
9 Gains or losses on investments (32) 3,190 -507 3,697
10 Administrative expenses (33) -72,398 -78,521 6,123
11 Other income (34) 5,124 3,977 1,147
12 Other expenses (34) -3,500 -5,242 1,742
13 Income taxes (35) -22,723 3,769 -26,492
14 Consolidated net profit/loss1) 59,388 22,219 37,169
14 Consolidated net profit/loss1) 59,388 22,219 37,169
15 Change in revaluation reserve (net) (59) 80,182 7,694 72,488
of which valuation changes (gross, temporary, no impact on income statement)
(59) 70,668 1,490 69,178
of which portfolio changes due to recognition
of profits or losses (59) 9,514 6,204 3,310
16 Other comprehensive income before taxes 80,182 7,694 72,488
17 Income taxes established without impact
on profit or loss (59) -25,002 -3,046 -21,956
18 Other comprehensive income after taxes 55,180 4,648 50,532
19 Consolidated comprehensive income1) 114,568 26,867 87,701
1) Figures from 2011 have been adjusted; see note 39.
CORPORATE REPORT 2012 | CONSOLIDATED STATEMENT OF COMPREHENSIVE INCOME

60
Consolidated balance sheet AS OF 31 DECEMBER 2012
Assets
EUR ’000s Notes 2012 2011 2010
1 Cash reserves (7), (36) 669,302 106,737 7,269
2 Loans and advances to banks (8), (37) 3,246,133 4,105,613 3,834,459
3 Loans and advances to customers (8), (38) 9,039,001 8,607,193 7,572,791
4 Risk provisions in the credit business 1) (9), (39) -162,694 -153,112 -179,822
5 Assets held for trading (10), (40) 517,917 431,629 359,649
6 Positive market values from derivative financial instruments (hedge accounting)
(11), (41) 46,181 - -
7 Investments (12), (42) 4,698,415 5,574,215 6,547,362
8 Securities repurchase transactions (6), (43) 569,969 954,197 779,740
9 Interests in entities valued at equity (13), (44) 2,876 2,762 2,493
10 Investment property (14), (45) 21,005 21,232 15,631
11 Property, plant and equipment (14), (46) 22,480 23,558 29,485
12 Intangible assets (15), (47) 2,010 1,612 2,120
13 Current income tax claims (25), (48) 5,467 8,036 9,451
14 Deferred income tax claims (25), (48) 58,320 73,523 61,236
15 Other assets (16), (49) 3,838 4,047 3,131
16 Non-current assets held for sale and disposal groups (17) - - 4,500
Total assets 18,740,218 19,761,242 19,049,495

61
CORPORATE REPORT 2012 | CONSOLIDATED BALANCE SHEET
Liabilities
EUR ’000s Notes 2012 2011 2010
1 Liabilities to banks (18), (50) 6,000,336 8,008,089 7,692,416
2 Liabilities to customers (18), (51) 5,898,175 5,905,351 5,136,091
3 Securitised liabilities (18), (52) 5,114,745 4,329,445 4,749,283
4 Liabilities held for trading (19), (53) 645,331 544,131 461,208
5 Negative fair values from derivative financial instruments (hedge accounting)
(20), (54) 31,636 32,585 20,010
6 Provisions (21), (55) 31,907 32,445 30,868
7 Current income tax liabilities (25), (56) 7,466 2,884 1,434
8 Deferred income tax liabilities (25), (56) 66,362 47,166 45,141
9 Other liabilities (22), (57) 50,394 45,290 50,546
10 Subordinated capital (23), (58) 335,112 351,888 412,970
11 Shareholders’ equity (59) 558,753 461,968 449,527
Subscribed capital (59) 169,114 169,114 169,114
Hybrid capital (23), (59) 91,453 104,258 114,909
Capital reserve (59) 50,841 50,841 50,841
Retained earnings1) (59) 154,058 137,798 117,500
Revaluation reserve (42), (59) 43,595 -11,585 -16,233
Consolidated profit1) (59) 49,692 11,542 13,396
Total liabilities 18,740,218 19,761,242 19,049,495
1) Figures from 2011 have been adjusted; see note 39.

62
Schedule of changes in equity
EUR ’000s Subscribed capital
Hybridcapital
Capital reserve
Retained earnings
Revaluation reserve
Consolida-ted profit
Consolida-ted share-
holders’ equity
as of 31. Dec. 2010 169,114 114,909 50,841 116,800 -16,232 13,396 448,828
Correction for the previous year 1) - - - 700 - - 700
as of 31 Dec. 2010 169,114 114,909 50,841 117,500 -16,232 13,396 449,528
as of 1 Jan. 2011 169,114 114,909 50,841 117,500 -16,232 13,396 449,528
Change in the revaluation reserve - - - - 4,648 - 4,648
Total changes taken directly to equity - - - - 4,648 - 4,648
Consolidated net profit/loss - - - - - 22,001 22,001
Total consolidated profit - - - - 4,648 22,001 26,649
Correction for the previous year 1) - - - -10 - 218 208
Change in deferred taxes - - - 6,911 - - 6,911
Allocations to/Withdrawals from retained earnings
- - - 13,396 - -13,396 -
Decrease in hybrid capital - -10,651 - - - - -10,651
Distribution on silent partner contribu-tions and profit participation rights
- - - - - -10,677 -10,677
as of 31 Dec. 2011 169,114 104,258 50,841 137,797 -11,584 11,542 461,968
as of 1 Jan. 2012 169,114 104,258 50,841 137,797 -11,584 11,542 461,968
Change in the revaluation reserve - - - - 55,179 - 55,179
Total changes taken directly to equity - - - - 55,179 - 55,179
Consolidated net profit/loss - - - - - 59,388 59,388
Total consolidated comprehensive income
- - - - 55,179 59,388 114,567
Change in deferred taxes - - - 4,719 - - 4,719
Allocations to/withdrawals fromretained earnings
- - - 11,542 - -11,542 -
Decrease in hybrid capital - -12,805 - - - - -12,805
Distribution on silent partner contribu-tions and profit participation rights
- - - - - -9,696 -9,696
as of 31 Dec. 2012 169,114 91,453 50,841 154,058 43,595 49,692 558,753
1) Figures from 2011 have been adjusted; see note 39.

63
CORPORATE REPORT 2012 | SCHEDULE OF CHANGES IN EQUITY & CASH FLOW STATEMENT
Cash flow statement
EUR ’000s 2012 2011
Consolidated net income for the year1) 59,388 11,542
Non-cash items included in the consolidated financial statements and reconciliation to cash flow from operating activities
Write-downs, impairments and write-ups on receivables, property, plant and equip-ment, investments, intangibles and investment properties
29,207 33,560
Changes in provisions -538 1,577
Changes in other non-cash items -89,947 -22,189
Gains on sales of non-current assets 3,734 -11,393
Other adjustments -105,864 -118,960
Subtotal -163,407 -117,404
Change in assets and liabilities after adjusting for cash items
Loans and advances to banks 837,639 -279,002
Loans and advances to customers1) -485,191 -1,064,710
Assets held for trading -74,122 -78,640
Other operating assets 209 -915
Liabilities to banks -1,969,531 315,435
Liabilities to customers 30,223 767,542
Securitised liabilities 786,003 -414,851
Liabilities held for trading 101,200 82,923
Other operating liabilities 5,104 -5,256
Positive/negative fair value of hedging derivatives -36,255 981
Interest paid -654,046 -669,482
Interest received 791,413 827,809
Dividends received 3,623 6,004
Income tax paid/reimbursed -6,428 -6,801
Cash flow from operating activities -774,180 -624,825
Inflows from sale/repayment of investments 2,339,191 1,813,949
Inflows from the disposal of property, plant and equipment,investment properties and intangibles
0 4,703
Outflows for the purchase of investments -971,060 -1,018,018
Outflows for the purchase of property, plant and equipment,investment properties and intangibles
-1,914 -1,913
Cash flow from investment activities 1,366,218 798,721
Payments to shareholders - -
Application of funds from subordinated capital (contribution) - -
Application of funds from subordinated capital (payout) -29,473 -74,429
Cash flow from financing activities -29,473 -74,429
Cash and cash equivalents at the end of the previous period 106,737 7,269
Cash flow from operating activities -774,180 -624,825
Cash flow from investment activities 1,366,218 798,721
Cash flow from financing activities -29,473 -74,429
Cash and cash equivalents at end of period 669,302 106,737
1) Figures from 2011 have been adjusted; see note 39.

64
Notes to the consolidated financial statements of Landesbank Saar ...............................................66
Accounting policies ............................................................................................................................67
(1) General principles ...................................................................................................................................67
(2) Scope of consolidation ......................................................................................................................... 70
(3) Principles of consolidation .................................................................................................................. 70
(4) Currency translation .............................................................................................................................. 71
(5) Offsetting ................................................................................................................................................ 71
(6) Financial instruments ........................................................................................................................... 71
(7) Cash reserve ............................................................................................................................................77
(8) Receivables .............................................................................................................................................77
(9) Risk provisions in the credit business .................................................................................................77
(10) Assets held for trading ........................................................................................................................77
(11) Positive market values from derivative financial instruments (hedge accounting) ...................77
(12) Investments ..........................................................................................................................................77
(13) Interests in entities valued at equity ................................................................................................78
(14) Investment property/property, plant and equipment ....................................................................78
(15) Intangibles .............................................................................................................................................79
(16) Other assets ..........................................................................................................................................79
(17) Non-current assets held for sale and disposal groups .....................................................................79
(18) Liabilities ...............................................................................................................................................79
(19) Liabilities held for trading ...................................................................................................................79
(20) Negative market values from derivative financial instruments (hedge accounting) ............... 80
(21) Provisions ............................................................................................................................................. 80
(22) Other liabilities .................................................................................................................................... 81
(23) Hybrid capital ....................................................................................................................................... 81
(24) Leasing transactions ........................................................................................................................... 81
(25) Taxation ................................................................................................................................................ 82
Segment reporting .............................................................................................................................83
Disclosures on the statement of comprehensive income ..................................................................87
(26) Net interest income .............................................................................................................................87
(27) Shares of profits in associated companies accounted for using the equity method ................ 88
(28) Risk provisions in the credit business .............................................................................................. 88
(29) Net commission income ..................................................................................................................... 89
(30) Gains/losses on fair value measurement......................................................................................... 90
(31) Gains/losses on hedge accounting .................................................................................................... 90
(32) Gains/losses on investments .............................................................................................................. 91
(33) Administrative expenses ................................................................................................................... 92
(34) Other income ....................................................................................................................................... 93
(35) Income taxes ........................................................................................................................................ 94
Notes to the balance sheet ................................................................................................................96
(36) Cash reserve ......................................................................................................................................... 96
(37) Loans and advances to banks ............................................................................................................ 96
(38) Loans and advances to customers ................................................................................................... 96
(39) Risk provisions in the credit business .............................................................................................. 98
Group Notes to the consolidated financial statements 2012

65
CORPORATE REPORT 2012 | NOTES
(40) Assets held for trading ......................................................................................................................100
(41) Positive market values from derivative financial instruments (hedge accounting) ................. 101
(42) Investments ........................................................................................................................................ 101
(43) Securities repurchase transactions .................................................................................................104
(44) Interests in entities valued at equity ..............................................................................................104
(45) Investment property .........................................................................................................................104
(46) Property, plant and equipment .......................................................................................................105
(47) Intangibles ..........................................................................................................................................106
(48) Current and deferred income tax claims ........................................................................................107
(49) Other assets ........................................................................................................................................109
(50) Liabilities to banks ............................................................................................................................ 110
(51) Liabilities to customers ..................................................................................................................... 110
(52) Securitised liabilities .......................................................................................................................... 111
(53) Liabilities held for trading .................................................................................................................112
(54) Negative market values from derivative financial instruments (hedge accounting)................112
(55) Provisions .............................................................................................................................................113
(56) Current and deferred income tax liabilities ....................................................................................116
(57) Other liabilities ...................................................................................................................................116
(58) Subordinated capital ..........................................................................................................................117
(59) Shareholders’ equity ..........................................................................................................................118
Notes on financial instruments ....................................................................................................... 124
(60) Fair value of financial instruments ................................................................................................. 124
(61) Level information for financial instruments measured at fair value .......................................... 128
(62) Financial instrument measurement categories .............................................................................131
(63) Net gains or losses on financial instruments ................................................................................. 132
(64) Derivative transactions ..................................................................................................................... 132
(65) Notes to items in the cash flow statement ................................................................................... 135
Notes to the cash flow statement ................................................................................................... 135
(66) Subordinated assets..........................................................................................................................136
(67) Assets and liabilities in foreign currencies .....................................................................................136
(68) Transferred, but not fully written-off financial assets .................................................................136
(69) Transferred, fully written-off financial assets ............................................................................... 137
(70) Assets pledged as collateral ............................................................................................................. 137
(71) Collateral received that may be sold or pledged on .......................................................................138
(72) Leasing transactions .........................................................................................................................138
(73) Fiduciary transactions.......................................................................................................................139
(74) Contingent liabilities and other obligations ..................................................................................139
(75) Other financial obligations ...............................................................................................................140
(76) List of shareholdings of Landesbank Saar (excerpt) .....................................................................140
(77) Administrative bodies of SaarLB ..................................................................................................... 142
(78) Related party disclosures ................................................................................................................. 144
(79) Auditors’ fees ...................................................................................................................................... 147
(80) Employees ........................................................................................................................................... 148
Responsibility statement by the Board of Management ................................................................. 149

66
The consolidated financial statements for
Landesbank Saar, Saarbrücken, a corporation
established under public law (hereinafter
SaarLB), for the 2012 financial year have been
prepared in accordance with International
Financial Reporting Standards (IFRS), pursu-
ant to Commission Regulation 1606/2002 of
the European Parliament and of the Council
dated 19 July 2002, and in conjunction with
Section 315a (1) of the German Commercial
Code (HGB). In addition to the IFRS-defined
standards, IFRS also comprise the Interna-
tional Accounting Standards (IAS), the in-
terpretations of the International Financial
Reporting Interpretations Committee (IFRIC)
and the Standing Interpretations Committee
(SIC). All standards and interpretations that
are mandatory in the EU for the 2012 financial
year have been applied. In addition, German
Accounting Standards (DRS) 5– 10 and 15 were
applied with regard to the management re-
port.
The consolidated financial statements con-
tain the statement of comprehensive income,
consisting of the income statement with an
effect on profits and losses and without an ef-
fect on profits and losses, the balance sheet,
the schedule of changes in equity, the cash
flow statement, the Notes and the segment
reporting. The reporting currency is the euro.
Unless explicitly stated otherwise, all
amounts are given in thousands of euro (EUR
’000s). Figures in the tables may be rounded
by +/- one unit and are not normally preceded
by a symbol if it is clear from the context.
BayernLB continues to hold an unchanged
49.9%, Saarland 35.2% and Sparkassen- und
Giroverband Saar [Saarland Savings Bank
Association] 14.9% of the shares in SaarLB.
SaarLB is included in the consolidated finan-
cial statements of BayernLB at equity.
The Group management report, which in-
cludes the risk report, has been published in a
separate section of the annual report.
Notes to the consolidated financial statements of Landesbank Saar

67
CORPORATE REPORT 2012 | NOTES
(1) GENERAL PRINCIPLES
The consolidated accounts of SaarLB are
drawn up using consistent accounting poli-
cies across the Group. The accounting policies
are based on the assumption that the Group
is a going concern.
Income and expenses are accrued pro rata
temporis and recognised in the income state-
ment in the period to which they are economi-
cally relevant.
Estimates and measurements required for ac-
counting and valuation under IFRS are carried
out in accordance with the relevant standards.
They are examined on an ongoing basis and are
based on past experience and other factors
such as expectations of future events. The as-
sumptions and estimates essentially relate
to the calculation of the fair values of certain
financial instruments, the identification and
calculation of impairments under IAS 39, the
accounting treatment and measurement of
provisions and the realisability of future tax
reliefs. Where broader estimates were neces-
sary the relevant assumptions are shown in
the notes to the corresponding items.
Assets are recognised when it is probable that
the SaarLB Group will derive a future econom-
ic benefit from them and the cost of acquisi-
tion or production can be reliably determined.
Debts are recognised when it is probable that
satisfaction of a current obligation will result
in an outflow of economically useful resourc-
es and the amount required to do so can be
reliably determined.
Effects of new and amended IFRS
Standards and interpretations that must
be applied for the first time in the reporting
period
The amended standard IFRS 7 “Disclosure of
Financial Instruments” was required for the
first time in the reporting period.
The amendments to IFRS 7 were published
by the International Accounting Standards
Board (IASB) in October 2010 and endorsed
by the EU on 22 November 2011. The amended
IFRS 7 contains new disclosure requirements
for transferred assets.
Additional disclosure requirements for trans-
ferred assets that are not written-off (e.g. as
part of real repurchase transactions):
-
ferred asset and the connected liability is to
be described, including the limitations that
result from the transfer with regard to the
use of the asset (e.g. prohibition of a pledge
to third parties).
-
course to the asset transferred in connec-
tion with the debt, an overview is to be
provided, which shows the fair value of the
transferred assets, the fair value of the li-
abilities and the balance of the two.
Additional disclosure requirements for trans-
ferred assets that are not written-off in full:
The following information on retained rights/
obligations or newly obtained rights/obliga-
tions (ongoing exposure) is to be provided:
exposure,
-
sure,
the written-off asset (e.g. exercise price of
an option), and a maturity analysis of these
cash outflows,
ongoing exposure and the risk that the com-
pany continues to be exposed to,
-
sure (current and cumulative),
-
uted unevenly across the reporting period.
Accounting policies

68
There is no ongoing exposure if the company:
flows from the financial asset, but is con-
tractually obligated to pay the cash flows
to one or more companies if this involves a
pass-through arrangement in terms of IAS
39.19.
Cf. note 68 and 69 for details on the imple-
mentation of the new disclosure obligations.
Standards and interpretations passed in the
reporting period and to be applied in the
periods following the reporting period and
not applied in advance
The key standards approved in 2012, the man-
datory effective date and the expected im-
pact on SaarLB are summarised below.
Standard Effective date for financial years that begin after the stated date
Description of amendments and impact on SaarLB
IAS 1 “Presentation ofFinancial Statements”
1 January 2013 (published17 May 2012; endorsed5 June 2012)
Clarification that the income statement and other comprehensive income are to be reported directly after each other in the annual report.On the other hand, the other comprehensive income is to be divided between temporary items taken to equity and permanent items taken to equity.Clarification of the requirements for the comparative values from the previous year: All quantitative information in the previous period must be reported. If a company retrospectively adjusts a balance sheet item due to a change in the ac-counting method, voluntarily reported quantitative comparative amounts must be adjusted to the altered accounting method.These changes will not have any major impact on the financial statements of the SaarLB Group.
IAS 12 “Income Taxes” 1 January 2012 (published20 December 2010; endorsed11 December 2012)
For real estate held as an investment and measured at fair value, deferred tax assets and liabilities are to be recognized in the future on the basis of the tax consequences of a sale.Since SaarLB does not conduct any fair value measurement of real estate held as an investment, this amendment will not have any impact on the SaarLB Group’s financial statements.
IAS 19 “EmployeeBenefits”
1 January 2013 (published16 June 2011; endorsed5 June 2012)
The amendments to IAS 19 relate above all to the recording and breakdown of the expenses and income for defined benefit loans and termination benefits. The significant change consists of the discontinuation of the corridor method so that actuarial profits and losses are reported under other comprehensive income in the period in which they emerge. There continued to be no later re-cycling of actuarial profits and losses. The second major change relates to the calculation of the income from the plan asset. A typical return for the plan asset at the amount of the discount interest rate of pension obligations is to be rec-ognized as income at the beginning of the period in the future. A later deviation as a result of the actual returns is recognised in the revaluation reserve in other comprehensive income.This amendment will have an impact on the SaarLB Group, since SaarLB is cur-rently applying the corridor method.
IAS 32 “Financial Instruments: Disclosure”
1 January 2014 (published16 December 2011; not yet endorsed)
1 January 2013 (published17 May 2012; endorsed13 December 2012)
Clarification with regard to the term “current point in time” and the term “simul-taneity” in connection with the netting of financial assets and liabilities.This change will not have any major impact on the financial statements of the SaarLB Group.Clarification that the accounting of the income tax impact from distributions to the owners of an equity instrument must be in conformity with IAS 12 Income Taxes.The amendment will not have any material impact on the SaarLB Group’s finan-cial statements.

69
CORPORATE REPORT 2012 | NOTES
Standard Effective date for financial years that begin after the stated date
Description of amendments and impact on SaarLB
IAS 34 “Interim Financial Report-ing”
1 January 2013 (published17 May 2012; not yet endorsed)
Clarification that for interim financial statement there is a disclosure require-ment for the segment asset only if this amount is reported regularly to the Board of Management and there have been material changes with regard to the segment asset in comparison to the last statement.This change will not have any major impact on the financial statements of the SaarLB Group.
IFRS 7 “Financial Instruments: Disclosures”
1 January 2013 (published16 December 2011, endorsed 13 December 2012)
The amendments require disclosures on all reported financial instruments that are netted in accordance with IAS 32.42. Due to the amendments, it is also nec-essary to provide information on all the reported financial instruments that are subject to an enforceable global settlement or similar agreement, even if they are not netted in accordance with IAS 32.This amendment will have an impact on the SaarLB Group’s financial statements in the form of additional disclosure in the notes.
IFRS 9 “Financial Instruments” 1 January 2015 (published 12 November 2009; not yet en-dorsed)
1 January 2015 (published 28 October 2010; not yet endorsed)
The new IFRS 9 contains the results of the first revision of IAS 39, which refers to the classification and measurement of financial instruments. Accordingly, when financial assets are recognised, they are to be allocated to the amortised cost category or to the fair value category. Recognition at amortised cost occurs when
receive contractual cash flows and-
uled dates that represent interest and redemption payments on the outstand-ing nominal amount.
Financial assets that do not fulfil these conditions are recognised at profit or loss on fair value.A voluntary allocation of financial assets to the fair value category is possible upon recognition if incongruities are eliminated or significantly reduced with such measurement or disclosure.For the initial recognition of equity instruments that are not held for trading purposes, there is the option of disclosing changes in the value of these financial assets including the gain/loss on disposals not at profit or loss, but rather in the statement of comprehensive income without an impact on profits/losses.A change in the business model requires a recategorisation.Financial liabilities are usually measured at amortised cost. The exceptions to this are the trade portfolios and the financial liabilities for which the fair value option was selected. Fair value changes to financial liabilities in the fair value option are fundamentally recognised in other comprehensive income according to IFRS 9 if the fair value changes result from a change in the credit risk. All other fair value changes continue to be recognised at profit or loss.The application of the new IFRS 9 will have a major impact on the classification and measurement of financial assets in the SaarLB Group’s financial statements.
IFRS 10 “Consolidated Financial Statements”
1 January 2013 (published on12 May 2011; endorsed11 December 2012)
IFRS 10 replaces the previous IAS 27 and SIC 12 with regard to the group of consol-idated companies. Through this new standard, a uniform method to specify the group of consolidated companies is introduced for all companies that is based on the control of the subsidiary by the parent company. The control concept of IFRS 10 includes the following three elements, which must be cumulatively ful-filled:
power.The impact on the consolidated financial statements is not definitively clear. First-time application is required for financial years that begin after 31 Decem-ber 2013.
IFRS 11 “Joint Arrangements”
1 January 2013 (published on12 May 2011; endorsed11 December 2012)
IFRS 11 replaces IAS 31 “Interests in Joint Ventures” and eliminates the former possibility of proportionate consolidation of joint ventures. A participant in a joint venture is to report his interests as an equity investment and use the eq-uity methods pursuant to IAS 28.At the present time, SaarLB does not have any shares in joint ventures.
IFRS 12 “Disclosure of Interests in Other Entities”
1 January 2013 (published on 12 May 2011; endorsed 11 December 2012)
IFRS 12 will lead to a reporting obligation for all equity investments in subsidiar-ies, joint ventures and associated companies as well as not-consolidated struc-tured units according to one standard. Accordingly, companies must provide quantitative and qualitative information that make it possible for readers of the financial statements to identify the risks and financial effect that is con-nected with the company’s equity investment in the business.Fundamentally, this amendment will have an impact on the scope of the infor-mation in the notes to the financial statements of the SaarLB Group.

70
Standard Effective date for financial years that begin after the stated date
Description of amendments and impact on SaarLB
IFRS 13 “Fair Value Measure-ment”
1 January 2013 (published on 12 May 2011; endorsed 11 December 2012)
In IFRS 13, uniform methods of valuation are set for measurement at fair value by defining the fair value and illustrating the methods for the determination of the fair value. In connection with the calculation of the fair value, the main market is to form the basis. The main market is the market with the largest trad-ing volume and the highest market activity for the financial instrument and to which the company has access. The new standard will also lead to an expansion of the information in the notes with regard to the measurement at fair value. Accordingly, additional inform-ation for level 3 is required in particular. Further-more, the processes that were applied for the determination of the fair value are specifically represented.These amendments will have an impact with regard to the fair value calculation and the scope of the information in the notes to the financial statements of the SaarLB Group.
IAS 27 “Separate Financial State-ments”
1 January 2013 (published on12 May 2011; endorsed11 December 2012)
On account of the introduction of the new IFRS 10 standard, the consolidation rules included in IAS 27 were removed. Consequently, IAS 27 includes only the requirements that are to be applied to separate individual financial statements. In this connection, the standard was renamed.The impact on SaarLB’s consolidated financial statements has not been defini-tively determined yet.
IAS 28 “Investments in Associ-ates and Joint Ventures”
1 January 2013 (published on12 May 2011; endorsed11 December 2012)
IFRS 11 resulted in the elimination of the proportionate consolidation of joint venture companies. Since the joint venture companies are to be taken into ac-count according to the equity method pursuant to IAS 28, the application area of IAS 28 was expanded for joint venture companies and the standard renamed accordingly. At the present time, SaarLB does not hold any shares in joint ventures.
SaarLB has refrained from early implementa-
tion of any amended or new standards and
interpretations (partially not yet endorsed)
that have been issued by the IASB and the
IFRIC and are fundamentally relevant for the
SaarLB Group where their application is not
mandatory as of the 2013 financial year or
later.
(2) SCOPE OF CONSOLIDATION
The group of consolidated companies at
SaarLB includes six (31 December 2011: seven)
subsidiaries. These include SaarLB Banken-
beteiligungsgesellschaft mbH, Saarbrücken,
and special funds that are consolidated in full
in accordance with IAS 27 in conjunction with
SIC 12. The consolidated financial statements
do not include entities that are only propor-
tionately consolidated. Two associated com-
panies (31 Dec. 2011: two) continue to be val-
ued according to the at-equity method.
Materiality criteria are used to determine
SaarLB’s scope of consolidation. A total of
three subsidiaries (31 Dec. 2011: three) and
five associated companies were neither fully
consolidated nor valued at equity as they are
only of minor significance to the Group’s net
assets, financial position and results of opera-
tions. The accounting and earnings-related
impact of the contractual relationships be-
tween Group companies and these excluded
companies is contained in the consolidated
financial statements.
A complete overview of the special funds and
associated companies included in the consoli-
dated financial statements can be found in
the list of shareholdings (see note 76).
(3) PRINCIPLES OF CONSOLIDATION
Consolidation was carried out using the pur-
chase method under IAS 27.18 in conjunction
with IFRS 3.
The costs of acquisition of the consolidation
entities were offset against their equity. To
date, there have been no amounts where the
costs of acquisition exceed equity.
In consolidating the balance sheet and in-
come statement and eliminating intragroup
gains, all receivables and liabilities, income
and expenses and gains arising from intra-
group transactions have been eliminated.

71
CORPORATE REPORT 2012 | NOTES
Associated companies are valued at equity
and shown under the balance sheet item in-
terests in entities valued at equity. Under
this method, the costs of acquisition of an
investment in an associated company is rec-
ognised at its acquisition cost at the time of
acquisition and subsequently carried over in
line with the Group’s share of the associated
company’s net income or other change(s) in
its net assets.
(4) CURRENCY TRANSLATION
All assets and liabilities denominated in a
foreign currency are translated into the func-
tional currency at the spot rate on the day of
the business transaction on initial recogni-
tion. For the translation of currency in subse-
quent periods, it is necessary to distinguish
between monetary and non-monetary items
when translating currency. Monetary assets
and liabilities denominated in foreign curren-
cies are translated using the rate on the bal-
ance sheet date. In the case of non-monetary
items valued at historic cost of acquisition
or production, currencies are translated at
the historical acquisition rate. Non-monetary
items designated at fair value are translated
using the rate on the date the fair value was
calculated. Gains and losses from monetary
items resulting from currency translation are
recognised in the income statement.
(5) OFFSETTING
Receivables and liabilities are offset against
each other where they relate to the same
counterparty, are payable on demand, and it
has been agreed with the counterparty that
interest and commission will be charged as if
there were only one account.
(6) FINANCIAL INSTRUMENTS
Definition
A financial instrument is an agreement that
simultaneously creates a financial asset for
one of the contracting parties and a financial
liability or equity instrument for the other
party.
Recognition and measurement
Financial instruments are recognised on the
balance sheet from the date upon which the
company reporting becomes a contracting
party and is either entitled to obtain a consid-
eration or required to provide a consideration.
Normal purchases or sales (spot transactions)
of financial assets (regular way contracts) can
be recognised either on their trade date or
settlement date. Under IAS 39.9, purchases
and sales of financial assets where delivery
of the asset takes place in accordance with a
specified deadline in line with customary mar-
ket practice are deemed to be such contracts.
At SaarLB securities are always recognised on
their trade date. Derivatives are recognised on
their trade date. Other financial instruments
are recognised on their settlement date.
All financial instruments, including financial
derivatives, are carried on the balance sheet
in accordance with IAS 39 and allocated to
categories set out in IAS 39.
Initial recognition of financial instruments is
at fair value, which generally corresponds to
the consideration (the transaction price) paid
or received at the time of acquisition.
Subsequent measurement
Subsequent measurement of financial instru-
ments depends on their measurement cat-
egories under IAS 39, which differ as follows:
Financial assets and liabilities at fair value
through profit and loss:
These include financial instruments and deriv-
atives held for trading purposes that do not
meet hedge accounting criteria under IAS 39
(held for trading), and financial instruments
not held for trading purposes where the fair
value option under IAS 39 is used.

72
These are measured at fair value and recog-
nised in the income statement under gains
or losses on fair value measurement. This
item also shows realised gains and losses,
while current income and expenses appear
under net interest income. Derivatives in
hedges do not meet the hedge accounting
criteria under IAS 39. They are used for risk
management and have not been concluded
for trading purposes.
HfT financial instruments are recognised
under assets held for trading and liabilities
held for trading accordingly.
-
tion category (FVO):
The fair value option is used for portfolios of
financial instruments managed on a fair val-
ue basis in accordance with a documented
risk management or investment strategy;
this relates primarily to securities managed
by the securities special funds. For struc-
tured products that have to be separated
the fair value option is also applied to avoid
splitting the underlying transaction and the
embedded derivative. Measurement is at
fair value. Gains and losses are recognised in
gains or losses on fair value measurement,
while current income is recognised in net in-
terest income.
Financial instruments designated under the
fair value option are included under invest-
ments. Financial instruments that would
otherwise have to be measured at amor-
tised cost are not categorised under the fair
value option.
This category covers non-derivative finan-
cial assets with fixed or determinable pay-
ments, and fixed maturities that the Bank
intends and is able to hold to maturity,
where an active market exists for them at
the time of recognition or reclassification.
Measurement is at amortised cost. Please
refer to the comments on impairments for
the calculation of required write-downs.
These financial instruments are recognised
under investments. Current gains and losses
and income and expense from amortisation
are recognised under net interest income.
These are non-derivative financial assets
with fixed or determinable payments that
are not quoted on an active market. They
are measured at amortised cost. Please re-
fer to the comments on impairments for the
calculation of required risk provisions and
write-downs.
Financial instruments in the LaR category
are shown under cash reserves, loans and
advances to banks/customers, investments
and other assets. Current gains and losses
and income and expense from amortisation
are recognised under net interest income;
this also applies for holdings that are part
of a hedge under IAS 39. Gains and losses on
sale are shown under gains or losses on in-
vestments if they relate to investments and
under other income/expense if they relate
to receivables.
This category covers non-derivative financial
assets (securities, equity investments) that
are classified as available for sale or have
not been assigned to any of the categories
above. The financial instruments in this cat-
egory are measured at fair value. Any differ-
ence between fair value and amortised cost
is shown as a separate item under share-
holders’ equity (the revaluation reserve)
until the asset is either sold or matures or
a permanent impairment (see comments on
impairments) has to be recognised at profit
or loss.
Available for sale financial instruments are
included in investments. Gains/losses on
their sale and permanent impairment are
reported in gains or losses on investments,
current income and income and expense
from amortisation are recognised under net
interest income; this also applies to hold-
ings that are part of a hedge under IAS 39.

73
CORPORATE REPORT 2012 | NOTES
Liabilities measured at amortised cost in-
clude financial liabilities not held for trad-
ing purposes. They are shown at amortised
cost under liabilities to banks/customers,
securitised liabilities, other liabilities and
subordinated capital. Current gains and
losses and income and expense from amor-
tisation are shown under interest expense.
Fair value
The fair value of a financial instrument is the
amount for which it could be exchanged or
settled between knowledgeable, willing and
independent business partners.
The fair value is determined according to
the valuation hierarchy of IAS 39. In calculat-
ing the fair value, a distinction is made as to
whether fair values exist on active markets
or whether, for inactive markets, there is re-
course to valuation methods. Equity instru-
ments for which fair value cannot be reliably
calculated are recognised at their costs of ac-
quisition less any impairments.
As far as possible, SaarLB uses the quoted
price on an active market (such as the ex-
change price) to determine fair value (Level 1
and 2 of the valuation hierarchy of IAS 39). A
market for financial instruments is regarded
as active if quoted prices are easily and regu-
larly available from an exchange or broker and
these prices represent actual, regularly oc-
curring market transactions between knowl-
edgeable, willing and independent business
partners.
SaarLB uses the market price and prices on
other active markets for subsequent meas-
urement of financial instruments traded on
active markets and carried at fair value (se-
curities and derivative exchange-traded con-
tracts).
If there is no active market, valuation meth-
ods are used (Level 3 to 5 of the valuation
hierarchy of IAS 39). The aim is to determine
the transaction price that would have been
reached between two knowledgeable, willing
and independent business partners on the
valuation date. The inputs used for this pur-
pose must include all inherent market expec-
tations. Inactive markets are characterised by
heavily reduced trading volumes, extremely
wide bid/offer spreads and existing arbitra-
tion possibilities.
With securities, mainly indicative prices
from independent market data providers
are used in applying the valuation methods
and – where these are not available – prices
from other market participants (especially
issue arrangers). In the process, prices are
obtained from different providers for each
financial instrument. The prices provided are
compared for plausibility. If in exceptional
circumstances only one price is available, a
credit analysis is also performed as a plausi-
bility check. Where present, prices of securi-
ties with similar features, residual maturities
and credit ratings are used for plausibility.
This approach was used to calculate the fair
values of certain securities. In the absence
of other sources, fair values of ABS securities
were mainly calculated using prices provided
by arrangers.
Valuation models are used for OTC derivatives
and equity securities not traded on active
markets.
Fair values are also calculated using recog-
nised valuation models based on publicly
available market inputs and, to a limited ex-
tent, internal company data. The valuation
models include the net present value method
and option pricing models.
The net present value method is used for un-
conditional derivative financial instruments
(interest rate swaps, interest rate/currency
swaps, forward rate agreements and forward
foreign exchange transactions). Valuation is
based on cash flow structure taking account
of nominal values, residual maturities and
the agreed interest rate calculation method.

74
Credit default swaps are also treated as un-
conditional derivative financial instruments,
with expected defaults based on current cred-
it spreads also being taken into account.
The cash flow structure of financial instru-
ments with contractually agreed fixed cash
flows is calculated using the cash flows
agreed. For variable rate instruments, cash
flows are determined using forward curves.
Discounting uses a yield curve in the same
currency and of matching maturity, and a risk-
adjusted spread. Observable market inputs
are used where spreads are publicly available.
Material equity securities held as invest-
ments that are not traded on active markets
are valued using earnings power value analy-
sis. Expected cash flows are based on the tar-
gets of the entities in question. Non-material
holdings and holdings without reliable pro-
jected values are carried at amortised cost.
Options and other financial derivatives with
option-type characteristics are largely val-
ued on the basis of the Black-Scholes option
pricing model. The following parameters are
regularly used in the valuation process: cu-
mulative probability distribution function for
standard normal distribution, option strike
prices, risk-free interest rates (for different
currencies and maturities), price volatilities,
option time to expiry, (as applicable) interest
rate and pricing barriers, and probabilities of
occurrence. Options include interest rate cap
and floor agreements, swaptions and curren-
cy options.
The valuation models are therefore used to
calculate fair values for accounting purposes
for financial instruments in the categories
HfT and AfS. Balance sheet items and prod-
ucts affected are:
For Notes purposes, the financial instruments
recognised at fair value in the balance sheet
are allocated to a three-level system (level 1 to
3). These three levels are defined on the basis
of the input parameters used for fair value
measurement.
Allocation to level 1 occurs if the fair value
measurements is made with prices on the ac-
tive markets (without adjustment). This is the
case for securities where transaction-based
market prices or binding offers are available.
If the fair value is calculated according to the
valuation methods whose valuation param-
eters are directly or indirectly observable on
the market and have a significant impact on
the calculation of the fair value, then they are
allocated to level 2. Derivatives that are val-
ued solely with parameters observable on the
market, are to be allocated to level 2.
If the fair value is calculated with valuation
methods where the influence of valuation pa-
rameters – that are not based on observable
market data – is significant for the fair value,
they are allocated to level 3. The Bank also in-
cludes those securities that are valued on the
basis of indicative prices here.
Please refer to note 60 and note 61 for the dis-
closures of the fair values of financial instru-
ments and their level allocation.
Hedge accounting
Interest rate, currency and credit risks are
managed using financial derivatives to hedge
assets or liabilities on the balance sheet. The
different valuation methods possible for
the underlying transaction and the hedging
transaction can give rise to asymmetric ef-
fects in the income statement that do not
reflect economic reality and, most notably,
give an incomplete picture of profitability.
Hedges that meet hedge accounting criteria
within the meaning of IAS 39 are currently
reported exclusively as fair value hedges. By
applying hedge accounting, which in respect

75
CORPORATE REPORT 2012 | NOTES
of the hedged risk provides a valuation of the
underlying transaction through the fair value,
the frequency of asymmetric valuations is
reduced. All or a portion of an asset or liabil-
ity on the balance sheet is hedged against a
change in fair value due to interest rate risk
that could affect the net income for the pe-
riod. As a precondition for applying hedge ac-
counting, a high expected and actual degree
of effectiveness is needed; i.e. that changes in
the fair value of the hedged underlying trans-
actions must stay within a range of 80%-125%
of the hedged risk and the hedging derivative.
Fair value hedge accounting uses micro-fair
value hedges. Interest rate swaps are used
as hedging instruments. Derivatives used to
hedge the fair value of assets and liabilities
held on the balance sheet are measured at
fair value; changes in value have to be taken
to the income statement. The carrying values
of the underlying transactions are adjusted
for the measurement gains/losses arising
from the hedged risk, which are recognised in
the income statement.
Both the measurement gains/losses of hedge
transactions and measurement gains/losses
of underlying transactions are reported in
“Gains/losses on hedge accounting” in the in-
come statement. Current income from deriva-
tives that are part of a hedge and meet the
hedging criteria under IAS 39 is recognised
under net interest income.
Impairments
At every balance sheet date, SaarLB assesses
whether objective indicators of impairment
exist for a financial asset. A financial asset is
considered to be impaired and an impairment
loss to have occurred if:
-
ment due to a loss event that occurred after
the financial instrument was recognised for
the first time and no later than the report-
ing date,
-
mated future cash flow of the financial as-
set or group of financial assets and
amount can be made.
For financial instruments in the LaR, HtM
and AfS categories, SaarLB initially assesses
at the individual level whether objective in-
dicators of an impairment exist. To this end,
customer relationships and securities issu-
ers are analysed at regular intervals (if there
are debt securities and other fixed income
securities). The following criteria are specifi-
cally regarded as objective indicators of an
impairment:
streams than those agreed
capital and/or interest, application for de-
ferment or extension,
or legal reasons in connection with financial
difficulties,
or other restructuring of the borrower
-
tion
financial asset due to financial difficulties,
in comparison to the original buying price.
For receivables, the amount of the specific
provision is equal to the difference between
the carrying value of the financial instru-
ment concerned and the net present value
of expected future cash inflows calculated
using the discounted cash flow method and
based on the original effective interest rate.
Cash flows also have to include cash flows
that may result from the realisation of col-
lateral after deduction of the costs of acqui-
sition and sale. The carrying value of the fi-
nancial instrument is reduced by means of a
specific risk provision, which is shown on the
assets side of the balance sheet. The impair-
ment expense is recognised in the income
statement as part of the risk provisions.

76
Changes in expected inflows lead to releases
from or additions to risk provisions.
For securities in the LaR and HtM categories,
the amount of the impairment expense is
equal to the difference between the carrying
value and the fair value, if there is an active
market. The impairment expense is recog-
nised as a write-down and shown in gains or
losses on investments.
As soon as a receivable in the LaR or HtM cate-
gory is identified as impaired, interest income
ceases being recognised on the contractual
terms. Notwithstanding this, the change in
the net present value of expected future cash
inflows over time (unwinding) is reported un-
der interest income.
For financial instruments in the LaR and HtM
categories, portfolio risk provisions are cal-
culated on the basis of historic default prob-
abilities for receivables where there are no ob-
jective indicators of impairment and for those
where, in the case of objective indicators, an
individual examination has revealed no need
for impairment. Historical default probabili-
ties are updated on an ongoing basis in the
course of backtesting.
Country risks (transfer risks) are also reflected
through the creation of portfolio risk provi-
sions based on country-specific probabilities
of default, unless the risks have already been
taken into account through specific risk provi-
sions.
Irrecoverable financial instruments are
derecognised. With receivables this normally
involves utilising specific risk provisions. De-
faults for which no or insufficient specific
provisions have been created were charged to
current portfolio risk provisions.
For financial instruments in the AfS category,
an assessment is also made on each reporting
date as to whether objective indicators of im-
pairment exist.
For equity instruments classified as AfS, a
significant or lasting decline in the fair value
of the investment below the costs of acquisi-
tion constitutes an objective indicator of an
impairment. For debt instruments classified
as AfS, the existence of an impairment is de-
termined based on the same criteria as for
securities in the categories LaR and HtM.
If an impairment exists, the cumulative un-
realised loss that previously was reported
under shareholders’ equity in the revalua-
tion reserve has to be reallocated to the in-
come statement for the reporting period and
recognised under gains or losses on invest-
ments. The amount to be reclassified from
the revaluation reserve is the difference be-
tween the amortised cost and the current
fair value.
Where there is no further reason for impair-
ments on debt instruments, these are re-
versed through the income statement up to
a maximum of amortised cost. Increases in
the value of equity instruments may only be
reversed after prior impairment against the
revaluation surplus under equity.
Derecognition
Financial liabilities are derecognised when
the contractual rights to cash flows from the
respective assets expire or the financial asset
is transferred and the transfer meets the cri-
teria for derecognition in accordance with IAS
39. A transfer in accordance with IAS 39 occurs
when the contractual rights to the cash flows
from the financial asset are transferred to a
third party or the cash flows are forwarded to
a third party in accordance with IAS 39.19. If
such a transfer occurs, the financial asset is
derecognised when the Group has transferred
fundamentally all the rewards and risks from
the financial asset.
Financial liabilities are derecognised when
the contractual obligations are settled, re-
moved or expire.

77
CORPORATE REPORT 2012 | NOTES
Transfers that do not meet the criteria for
derecognition at SaarLB include in particu-
lar real securities repurchase transactions
and securities-lending transactions. Since all
the risks and rewards connected with own-
ership are primarily retained in these cases,
the transferred assets continue to remain
in full in the balance sheet and are disclosed
in a separate item (note 43). The equivalent
values received from real repurchase trans-
actions as well as accepted cash collateral
are disclosed as liabilities under liabilities to
banks/customers.
Please refer to the explanations under “Assets
pledged as collateral” (note 70) for the trans-
ferred assets that continued to be recognised.
(7) CASH RESERVE
The cash reserves include cash on hand and
deposits at central banks. Their disclosure
was at nominal value.
(8) RECEIVABLES
Loans to banks and customers involve non-
derivative financial assets with fixed or de-
terminable payments that are not quoted
on an active market and not held for trading
purposes. Measurement is at amortised cost
unless the receivable is not an underlying
transaction in an efficient fair-value hedge.
Premiums, discounts and fees that are part
of the effective interest rate of the financial
instruments are spread over the fixed interest
period and reported in interest income.
Impairments on receivables are recognised in
a separate risk provision in the balance sheet
and offset against the value of the asset.
(9) RISK PROVISIONS IN THE CREDIT
BUSINESS
The risk provisions for receivables are shown
as a negative item under an individual asset;
the item includes specific risk provisions and
portfolio risk provisions for receivables.
Expenses for allocations to risk provisions,
income from the release of risk provisions
and receipts on receivables written off are
reported under risk provisions in the income
statement.
(10) ASSETS HELD FOR TRADING
Assets held for trading contain exclusively
financial derivatives with positive fair values
not designated as hedging instruments under
IAS 39. Measurement is at fair value. Measure-
ment gains/losses and realised gains/losses
on assets held for trading are recorded on the
income statement under gains or losses on
fair value measurement; current gains/losses,
with the exception of gains/losses from credit
derivatives (premium payments), are recog-
nised in net interest income.
(11) POSITIVE MARKET VALUES FROM
DERIVATIVE FINANCIAL INSTRUMENTS
(HEDGE ACCOUNTING)
This item contains financial derivatives with
positive market values that are used as hedg-
es and meet the hedge accounting criteria of
IAS 39. These derivatives are measured at fair
value. Both changes in the fair value of hedg-
ing instruments and changes in the fair value
of underlying transactions that result from
the hedged risk are shown under gain/loss on
hedges. Interest income and expense from
hedging derivatives are recognised in net in-
terest income.
(12) INVESTMENTS
Investments comprise investments in the
categories HtM, LaR, FVO and AfS. Shares in
non-consolidated subsidiaries and associated
companies not consolidated under the equity
method are reported under available for sale
investments. Measurement of investments
varies according to the valuation category
to which they belong. The impairments to be
made are identified in accordance with the cri-
teria set out in note 6.

78
(13) INTERESTS IN ENTITIES VALUED AT
EQUITY
Interest in entities valued at equity include
the shareholdings in two companies valued
accordingly (cf. note 43).
(14) INVESTMENT PROPERTY/PROPERTY,
PLANT AND EQUIPMENT
Investment property includes land and build-
ings rented to third parties or primarily held
to achieve an increase in capital value. Prop-
erty, plant and equipment mainly comprises
land and buildings for own use and operating
fixtures and fittings. Where properties are
used for both purposes, the different por-
tions are normally accounted for separately.
If the portions cannot be separately sold or
let, the properties are only regarded as invest-
ment property if the portion used for own
purposes is insignificant.
Measurement is at cost of acquisition or
production, which in the case of depreciable
assets is reduced on a straight line basis in
accordance with useful life. The option un-
der IAS 40 permitting companies to chose
between fair value and amortised cost for in-
vestment property was exercised in favour of
amortised cost for investment property.
The useful life is determined according to the
expected rate at which future economic use is
exhausted and therefore factors in physical
wear and tear; technical or commercial obso-
lescence is taken into account independently
of expected physical wear and tear.
For the determination of the useful life, ad-
ditions to buildings (not incl. property) are
broken down into their main components. In
the subsequent measurement, these compo-
nents of property, plant and equipment are to
be depreciated separately if they
acquisition and manufacturing costs of the
property, plant and equipment and
length of use and depreciation methods.
The identification of the components and the
assessment of the essentiality are required
at the time of the first measurement of the
asset for the execution of the component ap-
proach. The applicable methodology for the
identification of the components and the
subsequent distribution of the total costs of
property, plant and equipment for the main
components is to be handled in accordance
with prudent business judgement. As a rule,
an estimate is required in the event of an ac-
quisition of property, plant and equipment.
Individual utilisability of a component is not
required for this.
The buildings (not incl. property) at SaarLB
are divided into the following components
with the following useful lives:
structure 90
(painting and floor work) 20
With regard to individual buildings for the
reconstruction/renovation measures, i.e. if
major renovations are made, capitalisation of
these measures occurs unless their costs are
inessential. Ongoing maintenance costs are
taken to the income statement.
The useful life of the operating and office
equipment is between 3 and 15 years.
An impairment charge is recognised in cases
of permanent impairment (according to IAS
36) and is the difference between the (higher)
carrying value and the recoverable amount.

79
CORPORATE REPORT 2012 | NOTES
Where the reasons for impairments no longer
apply, they are reversed, up to a maximum of
cost of acquisition or production. The impair-
ment process applies to components of an as-
set accordingly.
Impairments on investment property are
shown under other income, impairments on
property, plant and equipment are reported
under administrative expenses. Reversals ap-
pear under other income.
(15) INTANGIBLES
The only intangibles are purchased software.
Intangibles are carried at amortised cost and
depreciated on a linear basis over an expected
useful life of between three to five years.
An impairment charge is recognised in cases
of permanent impairment. Where the reasons
for impairments no longer apply, they are re-
versed, up to a maximum of cost of acquisi-
tion or production.
Depreciation of intangibles is disclosed under
administrative expenses. Reversals appear
under other income.
(16) OTHER ASSETS
Other assets include prepaid expenses and
miscellaneous assets.
(17) NON-CURRENT ASSETS HELD FOR
SALE AND DISPOSAL GROUPS
The SaarLB Group classifies non-current as-
sets and disposal groups as being held for sale
when the intention is to realise their carrying
value by selling them. Conditions for catego-
rising assets as being held for sale include: the
fact that the asset is immediately realisable
in its current condition; that there is a plan
for disposal; that an active search for a buyer
has started; and that the sale is expected to
be completed within one year of the time of
classification and that the price is reasonable
in relation to the current fair value.
Non-current assets and disposal groups clas-
sified as held for sale are measured at the
lower of carrying value or fair value less sell-
ing costs; financial instruments falling within
the scope of IAS 39 are measured according to
the principles set out in IAS 39.
Operating gains and losses are reported un-
der the same item in the income statement
as they would have been were there no inten-
tion to sell. Impairments are recognised when
fair value less selling costs is less than the
carrying value. These are shown under other
income/expense.
There were no non-current assets held for sale
or disposal groups as of 31 December 2012.
(18) LIABILITIES
Liabilities to banks and customers and secu-
ritised liabilities are measured at amortised
cost where they are not underlying transac-
tions in an effective fair value hedge. Premi-
ums and discounts are spread over the fixed
interest period on a constant effective yield
basis and recognised under interest expense
in the income statement.
(19) LIABILITIES HELD FOR TRADING
Liabilities held for trading contain exclusively
financial derivatives with negative fair values
not designated as hedging instruments under
IAS 39. Measurement is at fair value. Measure-
ment gains/losses and realised gains/losses
on liabilities held for trading are recorded in
the income statement under gains or losses
on fair value measurement; current gains/
losses, with the exception of gains/losses
from credit derivatives, are recognised in net
interest income.

80
(20) NEGATIVE MARKET VALUES FROM
DERIVATIVE FINANCIAL INSTRUMENTS
(HEDGE ACCOUNTING)
This item contains financial derivatives with
negative market values that are used as hedg-
es and meet the hedge accounting criteria of
IAS 39. These derivatives are measured at fair
value. Both changes in the fair value of hedg-
ing instruments and changes in the fair value
of underlying transactions that result from
the hedged risk are shown under gains/losses
on hedges. Interest income and expenses
from hedging derivatives are recognised as
those of the underlying transactions in net
interest income.
(21) PROVISIONS
This item shows the provisions for pensions
and similar obligations and other obligations
as well as other provisions.
There are various pension plans within the
SaarLB Group, which in the event of deferred
compensation are financed through an exter-
nal provider by means of reinsurance. The de-
fined benefit plans have set benefits that are
provided in the event of retirement or disabil-
ity and to surviving dependants in the event
of death, and that depend on multiple factors
such as age, length of service and salary.
Pension obligations are calculated annually in
an actuarial report.
The pension provisions were calculated on the
basis of the following actuarial assumptions:
The amount of the pension obligations is
calculated using the projected unit credit
method, whereby they are measured on the
basis of the defined benefit obligations ac-
crued at the balance sheet date. Assumptions
about the future trend of certain parameters
that affect the value of the benefits, such as
increases in salaries and pensions, are taken
into account in this measurement.
The determination of the pension accrual is
carried over on the basis of the anticipated
actuarial parameters at the beginning of the
period so that there is usually a difference
between the disclosed carrying value and the
current actuarial value that is reported as an
actuarial profit or loss. To the extent that ac-
tuarial gains and losses at the end of the re-
porting period exceed the corridor threshold
of 10% of the greater of net present value of
liabilities and fair value of plan assets under
IAS 19.92, from the following year they are al-
located over the estimated average remain-
ing working life of active plan beneficiaries
as an additional component of the pension
expense.
SaarLB is also a voluntary member of Zusatz-
versorgungskasse Saarland (ZVK). This is a
joint retirement benefit plan covering a num-
ber of employers; the benefits provided are
financed on a pay as you go basis.
Under the terms of IAS 19, the ZVK retirement
benefit plan is categorised as a defined ben-
efit plan. However, since the Bank does not
have access to the information required to ac-
count for it as a defined benefit plan and is un-
able to obtain this, and under the pay as you
go arrangement is also exposed to actuarial
risks relating to active and former employees
of other members (employers), no provision
has been created in the IFRS consolidated fi-
nancial statements for the contributions of
SaarLB to ZVK. In accordance with IAS 19.32
the commitment is recognised for conveni-
ence as a defined contribution retirement
benefit plan, so the contributions SaarLB
makes to ZVK are recognised immediately as
an expense under staff costs.
in % 2012 2011
Interest rate 3.50 4.80
Expected return on plan assets
3.61 3.90
Increases in salaries 2.50 2.50
Increases in retire-ment benefits
2.00 2.00

81
CORPORATE REPORT 2012 | NOTES
From an economic perspective all the pay-
ments SaarLB makes to ZVK, i.e. the regular
pay as you go contributions and the addition-
al “recapitalisation payments”, represent con-
tributions towards the ongoing financing of
ZVK. They serve neither to settle a past deficit
nor to create a capital base. The recapitalisa-
tion payments in particular are in essence
simply increased pay as you go contributions.
Other provisions are set up in accordance
with IAS 37 for present obligations both le-
gal and constructive arising as a result of an
event where it is probable that an outflow
of resources with economic utility will be re-
quired to perform the obligation. It must also
be possible to make a reliable estimate of the
amount of the outflow of resources.
There are no other long-term provisions to be
discounted except for long-term employee
benefit provisions.
Provisions have been set up at both the indi-
vidual transaction and portfolio level in the
credit business to meet contingent liabilities
and other liabilities where there is a risk of
default.
(22) OTHER LIABILITIES
Other liabilities contains deferred income,
other liabilities, accruals and amounts to be
distributed on hybrid capital reported under
equity.
(23) HYBRID CAPITAL
Debt and equity instruments are classified
in accordance with IAS 32, taking account
of IDW recommendation RS HRA 9 dated 11
March 2011 on accounting for financial instru-
ments. This states that a financial instrument
must be treated as equity if it:
the assets of an entity after deducting all
its liabilities (IAS 32.11)
obligation to transfer cash or cash equiva-
lents or other financial assets to the con-
tractual partner (IAS 32.16).
The accounting and measurement methods
used in the consolidated financial statements
for the contractual terms of the hybrid capi-
tal instruments issued by SaarLB are shown
below.
Undated silent partnership contributions not
recallable by the lender meet the criteria for
inclusion under shareholders’ equity if the
usual conditions exist.
Silent partnership contributions with a fixed
term or recallable by the lender and profit
participation rights are compound financial
instruments and have to be divided into their
equity and debt components (split account-
ing). On initial recognition the fair value of the
debt component is determined by discount-
ing the nominal value of the total compound
instrument at the agreed effective interest
rate. The debt component is shown under
subordinated capital. In subsequent years in-
terest is accrued on the debt component and
the associated expense is recognised in net
interest income.
The equity component, which on initial rec-
ognition is equal to the net present value of
expected future distributions, is shown as hy-
brid capital under equity. Distributions are re-
ported as part of the appropriation of profit.
Subordinated loans and bonds are shown un-
der subordinated capital.
(24) LEASING TRANSACTIONS
Under IAS 17, leases are divided into finance
leases and operating leases. Agreements are
classified on the basis of the distribution of
economic risks and rewards from the leased
property. A lease is classified as a finance
lease if substantially all the risks and rewards
associated with ownership are transferred to
the lessee; otherwise it is an operating lease.

82
SaarLB is currently only exposed to operating
leases.
SaarLB as lessor
The leased assets – primarily land and build-
ings – are reported on the balance sheet under
investment property and carried at amortised
cost. Both leasing instalments received and
depreciation and impairments are recorded in
other income.
SaarLB as lessee
Leasing payments made under operating leas-
es are recognised as administrative expense.
The assets leased are operating fixtures and
fittings.
(25) TAXATION
Current income tax assets and liabilities are
measured by applying currently valid tax
rates. Income tax receivables and liabilities
are carried at the amount of the refund or
payment due.
Deferred tax assets and liabilities arise from
the difference between the value of an asset
or a liability as shown on the balance sheet
under the German Commercial Code (HGB)
and the value on the balance sheet according
to tax law, which are so-called timing differ-
ences. This gives rise to increases and decreas-
es in income taxes that can be expected in the
future. For each entity in the consolidated fi-
nancial statement these are measured at the
specific applicable income tax rate expected
to be valid when the timing differences are
reversed, based on tax legislation which is in
force or has already been passed.
Deferred tax assets from as yet unutilised tax
losses carried forward and deductible timing
differences are only capitalised if it is prob-
able that sufficient taxable earnings will be
generated in future for the tax benefit to be
utilised.
Deferred taxes are not discounted. Deferred
tax assets and liabilities are formed and recog-
nised on the income statement where the un-
derlying transaction is recognised as income
or expense; where the underlying transaction
does not pass through the income statement,
they are recognised directly under the respec-
tive item in equity.
Income tax expenses and receipts arising
from normal operating activities are shown
under the income tax in the consolidated in-
come statement.
Other taxes not dependent on income appear
under other income.

83
CORPORATE REPORT 2012 | NOTES
Segment reporting is based on the business
structure of the SaarLB Group. In total, the
Group reports on seven segments: the six op-
erating business areas of SaarLB, including
the Landesbausparkasse Saar, and the Invest-
ments segment. The former Real Estate and
Projects segment was divided into a Real Es-
tate segment and a Projects segment in 2012.
The amounts from the previous year were ad-
justed for better comparison and are shown in
the segment reporting as of 31 December 2011.
The internal management information for the
Board of Management has been prepared on
the basis of a separate report since 2011 on ac-
count of the increasing size and significance
as well as the different income and risk pro-
file of the Projects segment as compared to
the other segments. As a result, the segment
reporting was adjusted in 2012 to systemati-
cally implement the requirements of IFRS 8,
according to which the Board of Management
acts as the main decision maker in terms of
IFRS 8.7 and the external segment reporting
follows the internal reporting and controlling.
The divisional heads in charge of each seg-
ment are responsible for earnings and serve
as segment managers as defined in IFRS 8.8.
The reconciliation contains those amounts
that cannot be meaningfully allocated to the
operating units. The column headed Consoli-
dation shows the results of the consolidation
of the special funds and the investments val-
ued at equity that are included in the internal
accounting on the basis of the calculation.
For the years 2011 and 2012, the management
information for net interest and net commis-
sion income and administrative expenses was
calculated on an arithmetical basis (internal
accounting) and for the other items using the
accounting and valuation methods of IFRS;
however, unrealised gains or losses on fair val-
ue measurement that SaarLB assumes will be
reversed in subsequent years are not allocat-
ed to any segment. These amounts, together
with those above, are also presented in the
Reconciliation column.
Segment reporting
Segment reporting as of 31 December 2012
EUR ’000s Corporate Customers
Real estate Projects Savings Banks, Ins-titutionals
and High Net Worth Individuals
Treasury and
Portfolio Manage-
ment
LBS Invest-ments
Reconcilia-tion
Consolida-tion
Total
Net interest income1) 22,253 29,318 19,952 7,374 36,787 15,244 3,510 4,363 28 138,829
Risk provisions in the credit business
-1,361 -9,136 -706 160 -19,258 -469 - -2,540 - -33,310
Net commission income 3,258 1,247 5,337 1,672 1,854 -1,768 - -3,844 -437 7,319
Gain or loss on fairvalue measurement2) 344 2,805 - 2,789 2 - - 14,423 16,494 36,857
Gains or losses on investments
- - - - -2,583 - -351 6,124 - 3,190
Administrative expenses -14,798 -8,709 -6,595 -7,948 -10,515 -10,784 -489 -11,390 -1,170 -72,398
Other income -1 - 1 -1 - 555 - 717 353 1,624
Earnings from ordinary operating activities /earnings before taxes
9,695 15,525 17,989 4,046 6,287 2,778 2,670 7,853 15,268 82,111
Segment assets 1,734,358 2,678,550 1,502,700 1,966,598 5,387,485 690,920 48,519 5,062,123 -331,035 18,740,218
1) Including shares of profits in associated companies accounted for using the equity method2) Including gains /losses on hedge accounting

84
Notes to the definition of segments
Corporate Customers
This segment covers the entire SME business
of the SaarLB Group in its target markets.
In Germany, this includes Saarland, Rhine-
land-Palatinate and the adjacent regions. In
France, the SaarLB Group concentrates on
the Grand Est and here in particular on the
neighbouring Alsace-Lorraine where the Bank
is represented by its SaarLB France branch at
the offices in Metz and Strasbourg. The main
product in this segment is traditional lending.
Furthermore, a full service is provided, primar-
ily by offering investment business and inter-
est rate and currency management as well as
the foreign trade and payment transactions
in accordance with customers’ needs and giv-
ing business advice on how to finance com-
panies. Furthermore, it offers financing for
municipalities and municipally owned compa-
nies (with a focus on Alsace and Lorraine).
Real Estate
This segment is responsible for the financ-
ing of commercial real estate in the SaarLB
Group. The regional focus is also on the target
markets of Corporate Customers, whereby
the support of the French real estate financi-
ers also takes place from the office in Paris.
Additionally, this segment monitors public
private partnership measures (PPP) for in-
vestments in infrastructure and education as
well as other public construction measures
in Germany. As in the Corporate Customers
segment, the main product in Real Estate is
lending, whereby the SaarLB Group’s struc-
turing and legal expertise is significant for
the business success in this segment. Since
the 2012 financial year, the Real Estate and
Projects segment has also been retroactively
separated into the Real Estate segment and
the Projects segment.
Segment reporting as of 31 December 2011
EUR ’000s Corporate Customers
Real estate Projects Savings Banks, Ins-titutionals
and High Net Worth Individuals
Treasury and
Portfolio Manage-
ment
LBS Invest-ments
Reconcilia-tion
Consolida-tion
Total
Net interest income1) 20,555 27,523 12,456 3,588 46,298 14,442 4,782 -3,712 -3,705 122,227
Risk provisionsin the credit business3) -6,152 -8,110 1,435 -269 -8,932 -1,232 - 4,360 - -18,900
Net commission income 3,449 2,898 8,315 4,487 879 -767 - -5,637 -2,100 11,524
Gain or loss on fairvalue measurement2) 212 4 - 863 5 - - -3,455 -13,735 -16,106
Gains or losses on investments
- - - - -4,559 11 11,247 -7,206 - -507
Administrative expenses -12,909 -7,472 -4,539 -7,370 -11,493 -10,993 -383 -23,184 -178 -78,521
Other income - - - - 59 412 - -2,247 509 -1,267
Earnings from ordinary operating activities /earnings before taxes
5,155 14,843 17,667 1,299 22,257 1,873 15,646 -41,081 -19,209 18,450
Segment assets 1,389,452 2,475,277 1,194,282 2,114,693 7,092,976 648,832 49,627 5,079,753 -284,556 19,760,336
1) Including shares of profits in associated companies accounted for using the equity method2) Including gain /loss on hedge accounting3) Figures have been adjusted; see note 39.

85
CORPORATE REPORT 2012 | NOTES
Projects
This segment is responsible for the financing
of projects in the SaarLB Group, especially in
the renewable energy sector, but also in the
area of public private partnership (PPP) on
the French market. The regional focus is also
on the target markets already defined in the
Corporate Customers segment. As in the Cor-
porate Customers segment, the main product
in Projects is lending, whereby the SaarLB
Group’s structuring and legal expertise is sig-
nificant for the business success in this seg-
ment.
Savings Banks, Institutionals and High Net
Worth Individuals
This segment handles investment advisory
services and the administration for savings
banks, institutionals and high net worth in-
dividuals. The focus of the Savings Banks and
Institutionals is on increasing existing cus-
tomer connections and expanding contacts
with insurance companies and pension funds
in the region and the business relationships
to savings banks in Rhineland-Palatinate. It
also deals with the financing of the region’s
savings banks and municipalities. In the sub-
segment of wealthy private customers, the
focus is on holistic advise and consulting for
wealthy private customers. Lastly, as a centre
of expertise, it actively supports the other
segments in customer relationship manage-
ment, especially in investment, interest rate
and currency management.
Treasury and Portfolio Management
This segment is responsible for the Treasury,
which is in charge of asset/liability manage-
ment as well as the SaarLB Group’s liquid-
ity management. Furthermore, this segment
provides active support for all portfolios
that no longer belong to the SaarLB Group’s
core business and are to be systematically re-
turned. These primarily include investments
in international banks and corporations with
a focus on OECD countries. It does this chiefly
through involvement in loan syndications
and issues. They also include international
commercial real estate financing – primarily
via investments in consortia – with a focus
on Northern and Western European urban
centres as well as diverse smaller sub-port-
folios with primarily German counterparties
that the SaarLB Group would like to dispose
in the medium term. In the past financial
year, the returns from these non-core busi-
nesses resulting primarily from the regular
redemptions were partially reinvested with
counterparties in the investment grade area,
from an income perspective, as part of asset
portfolio management. The focus was on
bonds of German and French banks and cor-
porations. The management of the liquidity
accounts (Securities Account A and Basel III /
LCR Portfolio) are also the responsibilities of
the segment. While the Securities Account A
has the goal of establishing a sound ECB se-
curities account, Basel III / LCR Portfolio es-
tablishes a liquidity buffer for the fulfilment
of the liquidity ratio in accordance with
MaRisk and Basel III.
LBS
Landesbausparkasse Saar is a legally depend-
ent unit of SaarLB. It operates the home loan
savings business (= core business) of Sparkas-
senfinanzgruppe Saar, cooperating closely
with the Saarland savings banks. It also fi-
nances energy-saving measures for real estate
as part of the Renewable Energies Act [EEG].
Investments
Investments are mainly holdings in compa-
nies in the savings bank sector and in regional
development-type companies, which are man-
aged by the Strategic Development unit. A dif-
ference is made between strategic, finance-/
credit-related and other equity investments.
The segment assets involve loans and advanc-
es to banks and customers and bonds report-
ed under investments (known as credit sub-
stitute securities) and equity investments.

86
The reconciliation primarily includes financial
assets that are used to manage liquidity.
Notes to the reconciliation:
The reconciliation for net interest income
primarily relates to matters that are not as-
signed to a specific segment as part of the
management reporting to the Board of Man-
agement. In contrast to the netting in 2011, al-
most all profit components under equity are
distributed across the segments on account
of an improvement in the allocation logic.
This includes interest expenses for interest-
bearing equity offset with these segments
for EUR 9.2 million (target, actual value:
EUR 9.7 million), which are reported in the ap-
propriation of the result in accordance with
IFRS (2011: EUR 6.3 million) and the trailing
negative effects from the planned measures
in previous years.
The reconciliation of the risk provision items
primarily includes EUR 2.4 million (2011:
EUR 3.7 million) from the net change in the
portfolio adjustment. Since these are not al-
located to the segment, there is no allocation
to the segments as part of the management
reporting.
In the net commission income, the recon-
ciliation primarily results from the differ-
ences between the internal and external
accounting. These differences mainly relate
to EUR -4.5 million in expenses connected
with silent reserves and the reclassification
of commissions on credit derivatives to the
gains or losses on fair value measurement and
EUR -0.6 million (2011: EUR -0.3 million) for the
reclassification of commissions that are re-
ported under other income statement items
in accordance with the internal reporting.
In the gains or losses on the fair value meas-
urement, the reconciliation mainly relates
to losses from interest- and currency-related
transactions in the amount of EUR -1.2 mil-
lion (2011: EUR -1.7 million), the gains on credit
derivatives of EUR 5.4 million (2011: losses of
EUR -1.2 million) and the securities measured
at fair value. These gains are not allocated to
any segment in the internal accounting, since
SaarLB assumes that a reversal will take place
in subsequent years.
The reconciliation for the gains or losses on
investments is mainly influenced by the net
change in the portfolio provision for securi-
ties in LaR and HtM of EUR 6.4 million (2011:
EUR 6.9 million). In the management informa-
tion for the Board of Management, it is not
allocated to any segment, similar to the pro-
cedure with the risk provision.
The reconciliation of administrative expenses
mainly relates to EUR -12.6 million (2011: EUR
-23.8 million) in expenses that could not be
meaningfully allocated; these primarily re-
sult from strategic projects, overhead costs
and staff areas. The decrease in the year un-
der review is primarily due to the project and
consulting costs that were incurred in 2011 as
special effects on account of the system mi-
gration.
In other income/expenses, the reconciliation
includes almost exclusively non-allocatable
effects. They primarily result from the change
in provisions from EUR 0.8 million (2011:
EUR 1.2 million), which are compensated
through offsetting expenses with partner-
ships in the amount of EUR 1.0 million (2011:
EUR 1.5 million), other one-off expenses in the
amount of EUR 0.6 million (2011: EUR 1.5 mil-
lion and expenses from the management of
security issues of SaarLB for EUR 0.7 million
(2011: EUR 0.7 million).
No further breakdown of the income by indi-
vidual product or service is available and the
cost of producing such a breakdown would be
disproportionately high.
A further breakdown by region is only under-
taken in the internal reporting for Germany
and France with regard to selected products.

87
CORPORATE REPORT 2012 | NOTES
(26) NET INTEREST INCOME
Disclosures on the statement of comprehensive income
EUR ’000s 2012 2011
Interest income 765,432 834,274
Interest income from credit and money market transactions, 374,244 379,241
includingInterest income from unwindings
4,053 3,467
Interest income from debt securities and other fixed-interest securities
128,922 154,884
Current income from shares and other non fixed-interest securities
669 2,583
Current income from non-consolidated subsidiaries and associates as well as other investments
3,397 4,514
Current income from profit pools and profit and loss transferagreements
136 166
Interest income from derivatives in hedges 258,065 292,886
Interest expenses 626,717 712,317
Interest expense for liabilities tobanks and customers
246,055 278,611
Interest expense for securitised liabilities 66,843 88,198
Interest expense for subordinated capital 6,651 6,755
Interest expense for hybrid capital 12,805 13,349
Interest expense for derivatives in hedges 290,225 324,258
Other interest expense 4,139 1,146
Total 138,715 121,957
Total interest income from financial assets
and liabilities measured at fair value not
through profit or loss was EUR 494.1 million
(2011: EUR 524.2 million) and the total in-
terest expense was EUR 336.5 million (2011:
EUR 388.1 million). The constant effective
yield basis from the distribution of premiums,
discounts and fees led to interest income of
EUR 5.9 million (2011: EUR 6.6 million) and
interest expenses of EUR 7.0 million (2011:
EUR 9.8 million). Interest income in 2012
included the release of differing amounts
from the reclassification of securities for
EUR 4.2 million (2011: EUR 8.5 million), which
were largely compensated by amounts from
the release of the revaluation reserve.

88
The profits derive from pro-rata recognition of
net income for matching periods.
(28) RISK PROVISIONS IN THE CREDIT
BUSINESS
The amounts include both on-balance sheet
and off-balance sheet credit business.
The net release to the provisions for indi-
vidual risks from the off-balance sheet credit
business in the reporting period amounts to
EUR 2.4 million (2011: EUR 1.8 million).
The net addition to portfolio risk provisions
was EUR 2.4 million (net release in 2011:
EUR 3.7 million). The difference from the pre-
vious year is due to an increase in anticipated
losses.
The appreciation of receivables involves the
release of interest cancellations of invest-
ments recovered in the financial year.
(27) SHARES OF PROFITS IN ASSOCIATED COMPANIES
ACCOUNTED FOR USING THE EQUITY METHOD
EUR ’000s 2012 2011
Shares of profits in associated companiesaccounted for using the equity method
114 269
Total 114 269
EUR ’000s 2012 2011
Allocations1) 46,777 37,943
Direct depreciation 1,800 3,688
Releases1) 13,508 20,872
Receipts on receivables written off 1,093 654
Appreciation to receivables 668 1,205
Total 33,310 18,900
1) Figures have been adjusted; see note 39.

89
CORPORATE REPORT 2012 | NOTES
(29) NET COMMISSION INCOME
EUR ’000s 2012 2011
Net commission income 24,060 25,186
Securities business 4,423 5,232
Credit business 12,876 13,081
Payment transactions 1,359 1,653
Home loan savings business 4,293 4,190
Fiduciary transactions - 15
Other services 1,109 1,015
Commission expenses 16,742 13,662
Securities business 5,083 3,761
Broker's commissions - 12
Credit business 1,553 788
Payment transactions 156 199
Home loan savings business 6,417 5,387
Fiduciary transactions 2,909 2,911
Other services 624 604
Total 7,318 11,524
The decrease in commission income from the
securities business is due to EUR 1.1 million in
lower fees from the EUREX business.
The rise in commission expenses both in the
securities and in the credit business is con-
nected with an increase in brokerage services.
In the home loan savings business, brokerage
commission on account of higher new busi-
ness had an impact.

90
These figures include the gains/losses from
foreign currency translation.
Net trading income includes realised and
unrealised gains or losses attributable to de-
rivative valuation and current income from
credit default swaps of EUR 595,000 (2011:
EUR 788,000).
The gains or losses from the fair value op-
tion includes equity-related transactions of
EUR 2.5 million (2011: EUR -7.6 million), invest-
ment fund units of EUR -353,000 (2011: EUR
-6.7 million) and interest rate-related transac-
tions of EUR 22.7 million (2011: EUR 4.3 mil-
lion).
In the gains or losses on the fair value option,
the realised gains or losses of EUR 5.3 million
(2011: EUR -7.3 million) are reported.
Current gains and losses on HfT securities,
fair value option holdings and derivatives (ex-
cept CDS) held in the portfolio during the year
are shown under net interest income.
EUR ’000s 2012 2011
Net trading income 12,165 -6,368
Interest rate-related transactions 4,791 -3,253
Equity/Index-related transactions and transactions with other risks 1,878 -2,565
Currency-related transactions -93 384
Credit derivatives 5,435 -1,225
Other financial transactions 154 291
Fair value gains or losses from the fair value option 24,844 -9,782
Total 37,009 -16,150
(31) GAINS/LOSSES ON HEDGE ACCOUNTING
(30) GAINS/LOSSES ON FAIR VALUE MEASUREMENT
EUR ’000s 2012 2011
Gains or losses of underlying transactions -11,027 11,637
Gains or losses of hedging instruments 10,876 -11,594
Total -151 43

91
CORPORATE REPORT 2012 | NOTES
The risk of changes in interest rates is hedged.
The underlying transactions are receivables in
the LaR category, securities in the category of
AfS.
(32) GAINS/LOSSES ON INVESTMENTS
The disposal proceeds for financial assets in
the LaR category are due to the sale of two
Greek bank bonds. The write-ups relate to
three securitisations (known as ABS / asset
backed securities) and the release of port-
folio risk provisions that primarily include
EUR 4.9 million for the release of the afore-
mentioned Greek bank bonds (in the prior
year: allocation to portfolio risk provisions).
The disposal proceeds from investments in
the AfS category are connected with the sale
of bonds (EUR 1.3 million) and the buy back of
an issuer’s bonds (EUR 690,000). The write-
down of investments in the AfS category are
due to other investments.
EUR ’000s 2012 2011
Gains or losses on investments 'held to maturity' 13 118
Income from appreciation 13 118
of which portfolio risk provisions 13 118
Expenses from write-downs - -
of which portfolio risk provisions - -
Gains or losses on investments classified as 'loans and receivables' 1,330 -12,066
Disposal proceeds -5,746 -852
Income from appreciation 7,258 -
of which portfolio risk provisions 6,354 -
Expenses from write-downs -182 -11,214
of which portfolio risk provisions - -7,010
Gains or losses on investments 'available for sale' 1,847 11,441
Disposal proceeds 2,012 12,527
Income from appreciation 395 -
Expenses from write-downs -560 -1,086
Total 3,190 -507

92
(33) ADMINISTRATIVE EXPENSES
Staff costs include expenses for the estab-
lishment of pension provisions amounting to
EUR 716,000 (2011: EUR 535,000).
The decrease in IT costs is connected with the
completion of the migration to the systems
of FinanzInformatik in 2011.
The increase in costs for contributions, legal
and consultancy fees is mainly due to con-
sulting services rendered by BayernInvest
Kapitalanlagegesellschaft in the amount of
EUR 1.2 million and the contribution to the
security reserve for the DSGV in the amount
of EUR 878,000.
Other administrative expenses include the
bank fee in the amount of EUR 566,000
(2011: EUR 2.8). Furthermore, project costs of
EUR 2.8 million (2011: EUR 1.2 million), process-
ing costs for the closure of the Luxembourg
branch of EUR 323,000 (2011: EUR 685,000)
and contributions to D&O insurance in the
amount of EUR 413,000 (2011: EUR 413,000).
Expenses from external management relate
to the compensation paid by the Metz branch
to Banque LB Lux S.A. The decline resulted
from the closure of the Luxembourg branch at
the end of the previous year.
EUR ’000s 2012 2011
Staff costs 40,554 38,723
Wages and salaries 32,819 30,976
Social security contributions 4,891 4,787
Expenses for pensions and other employee benefits 2,844 2,960
of which:
Expenses for defined contribution retirement benefit plans
- 1,711
Other administrative expenses 29,249 37,614
Expenses for land and buildings for own use 2,502 2,488
IT costs 6,610 15,867
Office costs 252 268
Advertising 1,177 1,046
Communication and other distribution costs 2,587 2,280
Contributions, legal and consultancy fees 8,579 6,692
Other administrative costs 6,896 7,804
Expenses for agency arrangements 646 1,169
Depreciation of property, plant and equipment and amortisation of intangibles (not incl. goodwill)
2,595 2,183
Total 72,398 78,521

93
CORPORATE REPORT 2012 | NOTES
Depreciation of property, plant and equip-
ment and amortisation of intangibles include
impairments of software for EUR 152,000.
(34) OTHER INCOME
The rest of other income includes cost reim-
bursement and charged-on staff and operat-
ing costs.
The decline in other expenses is connected
with offsetting expenses with partnerships
of EUR 1.0 million (2011: EUR 1.5 million) and
expenses in connection with staff reductions
of EUR 207,000 (2011: EUR 965,000).
EUR ’000s 2012 2011
Other income 5,124 3,977
Income from the buyback of the Bank's own issues 1,094 -
Rental income 1,313 1,442
of which:
Rental income on investment property 1,313 1,442
Disposal profits from property, plant and equipment, intangibles,investment property and real estate of the inventory assets
- 37
Income from the release of provisions 932 1,243
Other miscellaneous income 1,785 1,255
Other expense 3,500 5,242
Expense from the buyback of the Bank’s own issues 741 739
Current expense for investment property 403 372
- Leased properties 403 372
Disposal losses from property, plant and equipment, intangibles,investment property and real estate of the inventory assets
- 324
Depreciation of investment property and real estate of the inventory assets
228 228
Expense from loss transfers 41 32
Expense for other taxes 132 126
Other miscellaneous expenses 1,955 3,421
Total 1,624 -1,265

94
(35) INCOME TAXES
The net current income taxes include income
of EUR 21,000 (2011: EUR 353,000) not related
to the period, as well as current taxes on hy-
brid capital of EUR -7.1 million (2011: EUR -7.6
million) that do not affect profits or losses.
The net deferred tax expenses of EUR -7.0 mil-
lion (2011: deferred tax income of EUR 15.4 mil-
lion) consisted of EUR -12.3 million (2011: 13.3
million) from the expenses due to the occur-
rence, i.e. reversal of timing differences and
EUR 5.3 million (2011: EUR 2.1 million) from
the change in deferred tax assets for losses
carried forward.
The reported income tax expense of EUR 22.7
million deviates from the anticipated income
tax expense by EUR 3.2 million in the report-
ing year. The reasons for this deviation are il-
lustrated in the following table.
EUR ’000s 2012 2011
Current income taxes -15,713 -11,595
German and foreign corporation tax, incl. solidarity premium -7,770 -5,296
German trade tax / foreign local taxes -7,943 -6,299
Deferred income taxes -7,011 15,364
German and foreign corporation tax, incl. solidarity premium -705 10,884
German trade tax / foreign local taxes -6,306 4,480
Total -22,724 3,769

95
CORPORATE REPORT 2012 | NOTES
The forecast income tax expense/income was
calculated using the tax rate applicable to
companies subject to taxation in Germany. Al-
lowing for the non-deductibility of the trade
tax from the corporation tax, a corporation
tax rate of 15%, a solidarity surcharge of 5.5%,
and an unchanged trade tax of 15.75%, there
was an unchanged Group income tax rate of
31.57% on the reporting date.
The impact of the tax-free income results pri-
marily from tax-free dividend income and dis-
posal profits in the previous years. The impact
of non-tax-deductible operating expenses are
due to expenses in relation to dividend in-
come, non-deductible assumptions of costs
for partnerships and expenses for bank fees
pursuant to Section 12 (2) of the Restructur-
ing Law. The impact of value adjustments/
disclosure corrections is primarily connected
with the subsequent recognition of deferred
tax assets for previously unrecognised losses
carried forward.
EUR ’000s 2012 2011
Earnings before taxes 82,111 18,232
Group income tax rate (in %) 31.57 31.57
Expected income tax expense -25,922 -5,756
Effect of different local tax rates -255 -12
Effect from previous years of taxes recognised in the financial year -400 496
Effect of changes in tax rates - -
Effect of non-deductible taxes (especially withholding tax) - -176
Effect of non-deductible operating expenses -2,744 -1,544
Effect of tax-free income 1,775 3,825
Effect of permanent accounting differences -434 -3,238
Effect of transfers of basis of assessment -823 2,497
Effect of impairments / value adjustments 7,491 8,565
Additions and reductions for trade tax -1,412 -888
Other effects 0 -
Effective income tax expense (-)/ income (+) -22,724 3,769
Effective income tax rate (in %) 27.67 -20.60

96
(36) CASH RESERVE
(37) LOANS AND ADVANCES TO BANKS
Breakdown of loans and advances to banks by maturities:
(38) LOANS AND ADVANCES TO CUSTOMERS
Notes to the balance sheet
EUR ’000s 2012 2011
Cash on hand 1,321 1,319
Balances with central banks 667,981 105,418
Total 669,302 106,737
EUR ’000s 2012 2011
Loans and advances to domestic banks 2,439,830 3,133,410
Loans and advances to foreign banks 806,302 972,203
Total 3,246,133 4,105,613
EUR ’000s 2012 2011
Payable on demand 853,039 941,579
Fixed-term with residual maturity of 2,393,094 3,164,034
up to 3 months 708,155 1,154,456
more than 3 months and up to 1 year 854,496 866,040
more than 1 year and up to 5 years 830,443 1,143,538
more than 5 years - -
Total 3,246,133 4,105,613
EUR ’000s 2012 2011
Loans and advances to domestic customers 4,820,752 4,827,376
Loans and advances to foreign customers 4,218,248 3,779,817
Total 9,039,001 8,607,193

97
CORPORATE REPORT 2012 | NOTES
Breakdown of loans and advances to customers by sector:
Breakdown of loans and advances to customers by maturities:
EUR ’000s 2012 2011
Real estate 2,751,891 3,081,916
Sovereigns / Public sector 1,510,883 1,664,711
Renewable energy 1,332,036 1,124,432
Retail customers 546,142 516,332
Steel 329,282 344,609
Utilities 220,212 217,069
Wholesale & retail trade 218,742 211,572
Automotive 139,867 190,770
Food & beverages 176,096 178,589
Construction 146,161 153,032
Health care 107,473 125,235
Pharmaceuticals 62,124 71,222
Aviation 36,866 45,689
Other 1,461,226 682,015
Total 9,039,001 8,607,193
EUR ’000s 2012 2011
Fixed-term with residual maturity of 8,666,117 7,560,850
up to 3 months 865,123 546,382
more than 3 months and up to 1 year 656,531 631,704
more than 1 year and up to 5 years 2,389,661 2,475,472
more than 5 years 4,754,802 3,907,292
Indefinite 372,884 1,046,343
Total 9,039,001 8,607,193

98
(39) RISK PROVISIONS IN THE CREDIT BUSINESS
Specific risk provisions
EUR ’000s Loans and advances to banks
Loans and advances to customers
Total
2012 2011 2012 2011 2012 2011
Balance as of 1 January -22,675 -21,765 -115,096 -139,710 -137,771 -161,475
Changes recognised through profit or loss
249 -343 -29,516 -15,188 -29,267 -15,531
Allocations1) -68 -458 -43,988 -34,418 -44,056 -34,876
Releases1) 304 59 10,432 15,799 10,736 15,858
Unwindings 13 56 4,040 3,411 4,053 3,467
Changes from currency translation
- - - 20 - 20
Changes not recognised through profit or loss
4,211 -567 16,314 39,802 20,525 39,235
Utilisations1) - 4,298 20,525 34,937 20,525 39,235
Transfers/Otherchanges
4,211 -4,865 -4,211 4,865 - -
Balance as of 31 December -18,213 -22,675 -128,299 -115,096 -146,512 -137,771
1) Figures from 2011 have been adjusted.
Specific risk provisions include country risk
provisions of EUR 60,000 (2011: EUR 93,000).

99
CORPORATE REPORT 2012 | NOTES
The following table shows the state of the
specific risk provisions (not including country
risk provisions) by sector.
The unwindings are recorded by a reduction
of the specific risk provisions; the income is
disclosed in net interest income.
In the financial statements, an incorrectly
created specific risk provision for a total
of EUR 908,000 in previous years was cor-
rected and taken to equity. The figures from
the previous year were adjusted accord-
ingly. The adjustment reduced the portfolio
of risk provisions as of 31 December 2011 by
EUR 908,000, the allocation to risk provi-
sions in 2011 by EUR 244,000, the release of
the risk provisions in 2011 by EUR 26,000, and
the profit reserves as of 31 December 2011 in-
creased by EUR 690,000. The total consolidat-
ed income as of 31 December 2011 increased by
EUR 218,000 to EUR 26.9 million.
EUR ’000s 2012 2011
Sector groups
Real estate 49,524 47,777
Retail customers 23,500 8,990
Banks / Financial service providers 18,213 22,357
Automotive 15,446 17,736
Construction 6,825 5,793
Steel 6,750 5,437
Media 4,356 4,251
Pulp and paper industry 3,243 4,327
Machine and system construction 3,067 3,160
Sovereigns / Public sector 2,971 339
Food & beverages 2,795 3,239
Aviation 2,672 2,672
Chemical industry 2,565 2,559
Technology 1,335 1,636
Health care 1,241 790
Utilities 967 967
Suppliers / Disposers 654 -
Logistics 268 -
Wholesale & retail trade 59 59
Textile / Clothing - 5,588
Other1) - -
Total 146,452 137,677
1) Figures from 2011 have been adjusted.
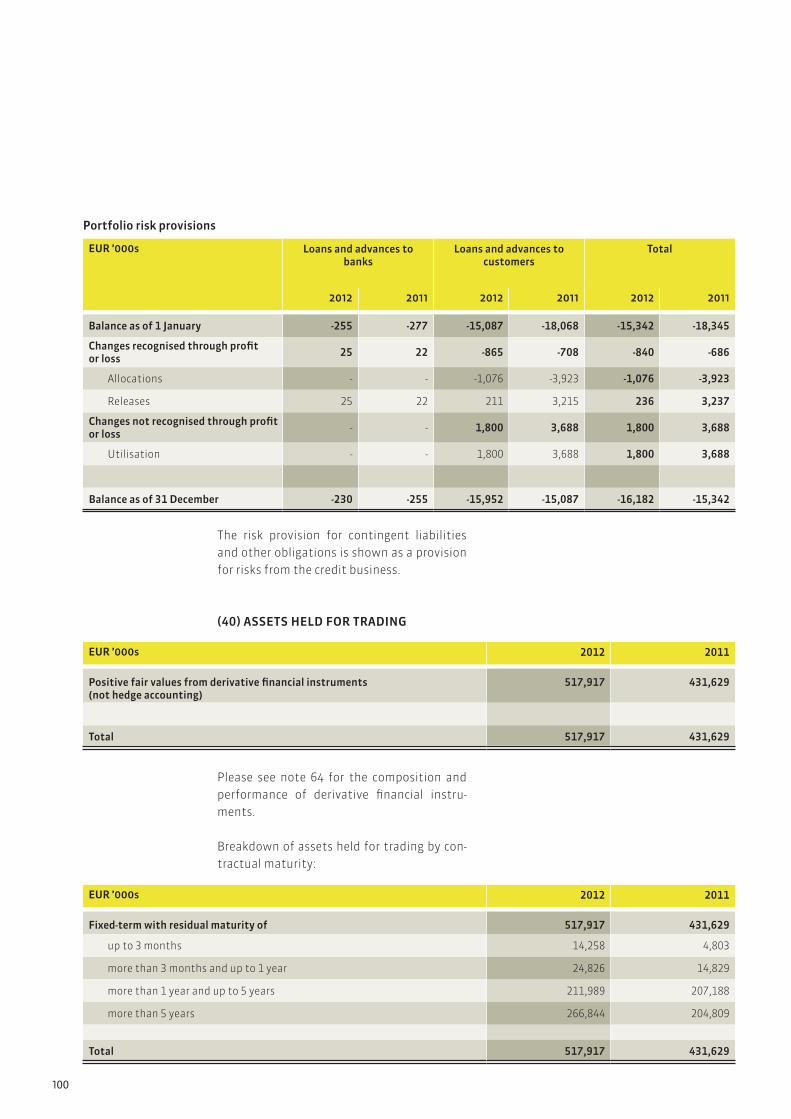
100
The risk provision for contingent liabilities
and other obligations is shown as a provision
for risks from the credit business.
(40) ASSETS HELD FOR TRADING
Please see note 64 for the composition and
performance of derivative financial instru-
ments.
Breakdown of assets held for trading by con-
tractual maturity:
Portfolio risk provisions
EUR ’000s Loans and advances to banks
Loans and advances to customers
Total
2012 2011 2012 2011 2012 2011
Balance as of 1 January -255 -277 -15,087 -18,068 -15,342 -18,345
Changes recognised through profit or loss
25 22 -865 -708 -840 -686
Allocations - - -1,076 -3,923 -1,076 -3,923
Releases 25 22 211 3,215 236 3,237
Changes not recognised through profit or loss
- - 1,800 3,688 1,800 3,688
Utilisation - - 1,800 3,688 1,800 3,688
Balance as of 31 December -230 -255 -15,952 -15,087 -16,182 -15,342
EUR ’000s 2012 2011
Positive fair values from derivative financial instruments (not hedge accounting)
517,917 431,629
Total 517,917 431,629
EUR ’000s 2012 2011
Fixed-term with residual maturity of 517,917 431,629
up to 3 months 14,258 4,803
more than 3 months and up to 1 year 24,826 14,829
more than 1 year and up to 5 years 211,989 207,188
more than 5 years 266,844 204,809
Total 517,917 431,629

101
CORPORATE REPORT 2012 | NOTES
(41) POSITIVE MARKET VALUES FROM DERIVATIVE
FINANCIAL INSTRUMENTS (HEDGE ACCOUNTING)
EUR ’000s 2012 2011
Bonds, notes and other fixed-interest securities 4,593,617 5,521,163
Money market instruments 458,532 894,143
Bonds and notes 4,135,085 4,627,020
Equities and other non-fixed-interest securities 55,563 9,077
Equities 469 1,136
Investment fund units 54,234 7,061
Other non-fixed-interest securities 860 880
Interest in subsidiaries 1,920 1,920
Associates not consolidated 2,292 2,292
Other investments 46,737 47,844
less portfolio risk provisions 1,714 8,081
Total 4,698,415 5,574,215
(42) INVESTMENTS
The investments consist of the following:
The hedges involve securing the risk of
a change in interest rates. Underlying
transactions are securitised liabilities and
promissory notes.
EUR ’000s 2012 2011
Positive market values from fair value hedges 46,181 –
Total 46,181 –

102
EUR ’000s 2012 2011
Fixed-term with residual maturity of 4,591,903 5,513,081
up to 3 months 411,958 288,042
more than 3 months and up to 1 year 601,661 1,407,116
more than 1 year and up to 5 years 3,094,555 3,311,455
more than 5 years 483,729 506,468
No maturity 106,512 61,134
Total 4,698,415 5,574,215
Breakdown of investments by maturity:
Recognition of shares without maturity with-
in the next twelve months is not planned.
Reclassification
Due to the financial market crisis, debt securi-
ties with a value of EUR 1.2 billion were reclas-
sified from the AfS to the LaR category retro-
spectively as of 1 July 2008 and in the fourth
quarter of 2008. Furthermore, SaarLB reclas-
sified debt securities with a market value of
EUR 538.4 million from the AfS to the LaR cat-
egory and debt securities with a market value
of EUR 1.1 billion from the AfS to HtM catego-
ry as of 31 October 2008. More details on the
reclassifications can be found in SaarLB’s fi-
nancial report for the 2008 financial year (see
explanations in notes 1, 6 and 42).
As of 31 December 2012, with separately re-
ported security repurchase transactions of
EUR 275.0 million (2011: EUR 468.0 million),
these reclassified securities had a fair value
of EUR 1.2 billion (2011: EUR 1.6 billion). The
amortised costs of the reclassified securities
amounted to EUR 1.2 billion (2011: EUR 1.7 bil-
lion).

103
CORPORATE REPORT 2012 | NOTES
The revaluation reserve of the reclassified
securities amounts to EUR -15.2 million (2011:
EUR -24.6 million). If no reclassification had
occurred, there would have been a revalua-
tion reserve of EUR -15.6 million (2011: EUR
-91.2 million) so that the portfolio of the re-
valuation reserve for the reclassified securi-
ties would have been another EUR 0.4 million
lower.
EUR ’000s 2012 2011
Change in the revaluation reserve
Without reclassification 65,670 -7,722
of which LaR 54,345 -7,256
of which HtM 11,325 -466
With reclassification 9,393 16,862
of which LaR 7,694 12,620
of which HtM 1,699 4,242
The effective interest rates determined at the
time of the reclassifications on the basis of
the new acquisition costs ranged from a mini-
mum of 2.3857% to a maximum of 13.1024%.
The estimated cash flows that SaarLB had
expected at the time of the reclassifications
amounted to EUR 3.5 billion.
EUR ’000s 2012 2011
Fair value 1,233,402 1,624,123
of which LaR 546,833 864,487
of which HtM 686,569 759,636
Amortised cost 1,233,785 1,690,783
of which LaR 564,121 938,720
of which HtM 669,664 752,063
Revaluation reserve -15,191 -24,584
of which LaR -12,025 -19,719
of which HtM -3,166 -4,865
Revaluation reserve without reclassification -15,574 -91,244
of which LaR -29,313 -93,658
of which HtM 13,739 2,414
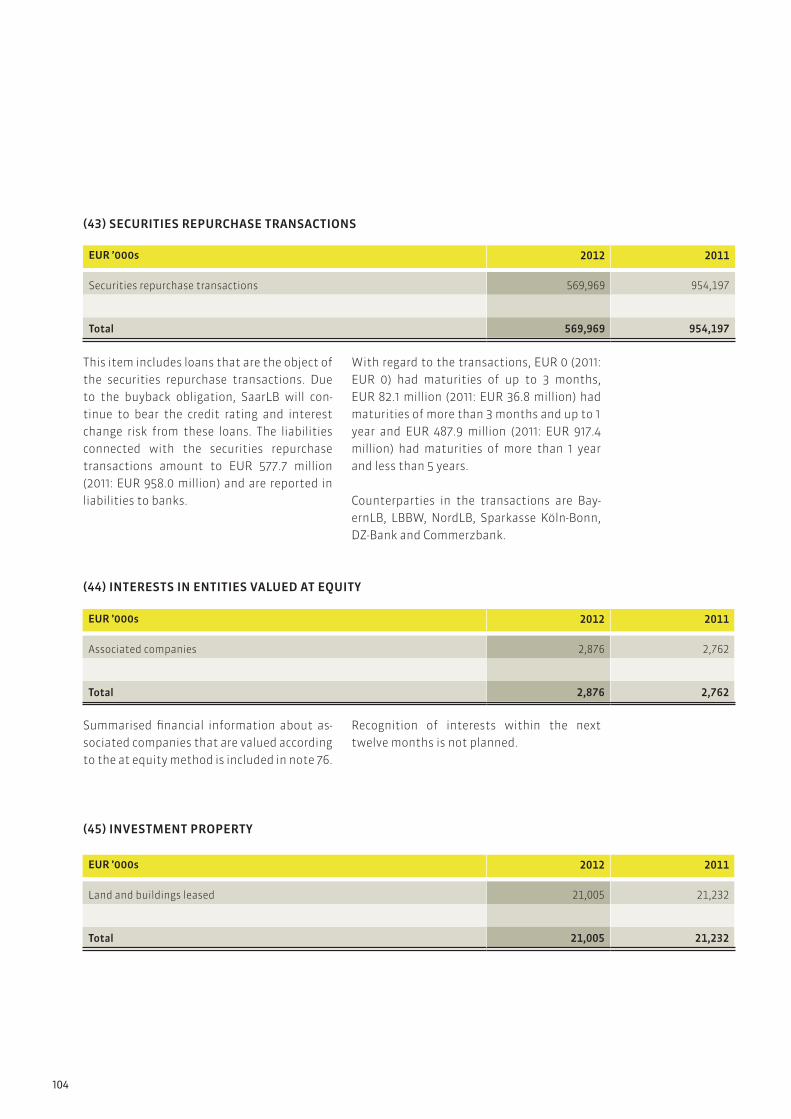
104
EUR ’000s 2012 2011
Securities repurchase transactions 569,969 954,197
Total 569,969 954,197
(44) INTERESTS IN ENTITIES VALUED AT EQUITY
(45) INVESTMENT PROPERTY
(43) SECURITIES REPURCHASE TRANSACTIONS
EUR ’000s 2012 2011
Associated companies 2,876 2,762
Total 2,876 2,762
EUR ’000s 2012 2011
Land and buildings leased 21,005 21,232
Total 21,005 21,232
This item includes loans that are the object of
the securities repurchase transactions. Due
to the buyback obligation, SaarLB will con-
tinue to bear the credit rating and interest
change risk from these loans. The liabilities
connected with the securities repurchase
transactions amount to EUR 577.7 million
(2011: EUR 958.0 million) and are reported in
liabilities to banks.
With regard to the transactions, EUR 0 (2011:
EUR 0) had maturities of up to 3 months,
EUR 82.1 million (2011: EUR 36.8 million) had
maturities of more than 3 months and up to 1
year and EUR 487.9 million (2011: EUR 917.4
million) had maturities of more than 1 year
and less than 5 years.
Counterparties in the transactions are Bay-
ernLB, LBBW, NordLB, Sparkasse Köln-Bonn,
DZ-Bank and Commerzbank.
Summarised financial information about as-
sociated companies that are valued according
to the at equity method is included in note 76.
Recognition of interests within the next
twelve months is not planned.

105
CORPORATE REPORT 2012 | NOTES
Development of investment property:
(46) PROPERTY, PLANT AND EQUIPMENT
EUR ’000s 2012 2011
Land and buildings for own use 19,812 20,530
Operating and office equipment 2,668 3,029
Total 22,480 23,558
Limitations regarding the disposability or the
generation of income and disposal proceeds
did not exist as of balance sheet date.
The fair value of the investment property
and buildings amounted to EUR 22.2 million
(2011: EUR 22.1 million), of which EUR 22.1 mil-
lion (2011: EUR 21.2 million) was calculated by
external experts. The calculation is based on
the application of the discounted cash flow
process in which market and geographic data
are included.
There was no expert report for investment
property with a carrying value of EUR 49,000
(2011: EUR 49,000).
Recognition of investment property within
the next twelve months is not planned.
EUR ’000s 2012 2011
Cost of acquisition or production
Balance as of 1 January 25,089 18,939
Additions - 11
Transfers - 6,139
Disposals - -
Balance as of 31 December 25,089 25,089
Write-ups / write-downs
Balance as of 1 January 3,857 3,308
Scheduled amortisation 227 228
Transfers for scheduled amortisation - 21
Impairments - -
Transfers of impairments - 300
Balance as of 31 December 4,084 3,857
Carrying values
Balance as of 1 January 21,232 15,631
Balance as of 31 December 21,005 21,232

106
Property, plant and equipment with limited
disposal rights did not exist as of balance
sheet date.
Recognition of property, plant and equip-
ment within the next twelve months is not
planned.
EUR ’000s Land and buildings for own use
Operating and office equipment
Total
2012 2011 2012 2011 2012 2011
Cost of acquisition or production
Balance as of 1 January 23,327 29,466 14,711 14,064 38,038 43,530
Additions - - 388 967 388 967
Transfers - -6,139 - - - -6,139
Disposals - - - 320 - 320
Balance as of 31 December 23,327 23,327 15,099 14,711 38,426 38,038
Write-ups / write-downs
Balance as of 1 January 2,798 2,764 11,682 11,281 14,480 14,045
Scheduled amortisation 355 355 749 699 1,104 1,054
Transfer of scheduled amortisation - -21 - - - -21
Impairments 362 - - - 362 -
Transfers of impairments - -300 - - - -300
Disposals - - - 298 - 298
Balance as of 31 December 3,515 2,798 12,431 11,682 15,946 14,480
Carrying values
Balance as of 1 January 20,529 26,702 3,029 2,783 23,558 29,485
Balance as of 31 December 19,812 20,529 2,668 3,029 22,480 23,558
Performance of property, plant and equipment:
(47) INTANGIBLES
EUR ’000s 2012 2011
Other intangible assets 2,010 1,612
Total 2,010 1,612

107
CORPORATE REPORT 2012 | NOTES
Performance of intangible assets:
(48) CURRENT AND DEFERRED INCOME TAX CLAIMS
EUR ’000s 2012 2011
Cost of acquisition or production
Balance as of 1 January 3,185 8,369
Additions 1,525 934
Disposals - 6,118
Balance as of 31 December 4,710 3,185
Write-ups / write-downs
Balance as of 1 January 1,572 6,248
Scheduled amortisation 1,127 974
Impairments - 152
Disposals - 5,802
Balance as of 31 December 2,699 1,572
Carrying values
Balance as of 1 January 1,612 2,120
Balance as of 31 December 2,010 1,612
EUR ’000s 2012 2011
Current income tax claims 5,467 8,036
Domestic 5,467 8,036
International - -
Deferred income tax claims 58,320 73,523
Domestic 58,320 73,523
International - -
Total 63,787 81,559
Intangible assets involve exclusively standard
software.
Recognition of intangibles within the next
twelve months is not planned.

108
Deferred income tax claims and obligations are distributed over the following items:
The decrease of EUR 34.4 million (2011: in-
crease of EUR 10.3 million) in the balance of
deferred income tax claims and obligations
does not correspond to deferred tax expens-
es of EUR 7.0 million (2011: tax income of
EUR 15.4 million).
The reasons for this are the changes in de-
ferred taxes not recognised at profit or loss;
these are due to bookings of EUR 25.0 million
against the revaluation reserve and profit re-
serves of EUR 2.4 million.
The stock of taxable losses carried forward
where deferred tax assets are reported is
listed separately in the following table for all
types of losses carried forward in the Group.
EUR ’000s 2012 2011
Deferred tax assets
Deferred tax liabilities
Deferred tax assets
Deferred tax liabilities
Cash reserves - - - -
Loans and advances to banks and customers 150 7,468 0 12,306
Risk provisions 1,735 - 872 -
Assets held for trading 32 - 32 9
Positive market value from derivative financial instruments - 4,593 - -
Investments 3,717 25,135 18,835 367
Property, plant and equipment - 2 - 2
Other assets 500 - - 1,017
Liabilities to banks and customers 1,664 - 6,897 -
Securities liabilities 2,666 - - 58
Assets held for trading 34,631 - 27,926 -
Negative fair values from derivative financial instruments (hedge accounting)
- - 10,289 -
Provisions 2,137 186 2,484 -
Other liabilities 290 73 674 451
Subordinated capital - 28,905 - 32,956
Losses brought forward for corporation tax and trade tax 10,792 - 5,514 -
Total deferred taxes after impairments and netting
58,314 66,362 73,523 47,166

109
CORPORATE REPORT 2012 | NOTES
In total, the excess of deferred tax assets over
deferred tax liabilities of EUR 26.4 million in
2011 changed to an excess of deferred tax li-
abilities amounting to EUR 8.0 million.
The disclosure of deferred tax assets for car-
ry-over losses is based on tax planning that
extends to 2017; a sufficiently precise plan is
possible for this period under consideration
of appropriate security discounts.
EUR ’000s 2012 2011
Corporation tax
Balance of losses carried forward 68,231 81,446
Losses carried forward for which a deferred tax asset has been created 68,231 34,846
Losses carried forward for which no deferred tax asset has been created - 46,600
Usable indefinitely - 46,600
Trade tax
Balance of losses carried forward 85,628 85,628
Losses carried forward for which no deferred tax asset has been created 85,628 85,628
Usable indefinitely 85,628 85,628
(49) OTHER ASSETS
The intention is to realise other assets within
the next twelve months.
EUR ’000s 2012 2011
Prepaid expenses 753 876
Other assets 3,085 3,171
Total 3,838 4,047

110
EUR ’000s 2012 2011
Liabilities to domestic banks 4,975,243 6,771,753
Liabilities to foreign banks 1,025,093 1,236,336
Total 6,000,336 8,008,089
(50) LIABILITIES TO BANKS
Breakdown of liabilities to banks by maturity:
(51) LIABILITIES TO CUSTOMERS
EUR ’000s 2012 2011
Payable on demand 213,733 183,928
Fixed-term with residual maturity of 5,786,603 7,824,161
up to 3 months 1,762,108 3,009,871
more than 3 months and up to 1 year 1,519,284 1,947,091
more than 1 year and up to 5 years 1,533,958 2,111,424
more than 5 years 971,253 755,775
Total 6,000,336 8,008,089
EUR ’000s 2012 2011
Liabilities to domestic customers 5,503,630 5,607,348
Liabilities to foreign customers 394,545 298,003
Total 5,898,175 5,905,351

111
CORPORATE REPORT 2012 | NOTES
EUR ’000s 2012 2011
Fixed-term with residual maturity of 5,378,142 5,400,029
up to 3 months 2,822,803 2,641,754
more than 3 months and up to 1 year 637,525 913,974
more than 1 year and up to 5 years 795,338 985,843
more than 5 years 1,122,476 858,458
No maturity (home loan savings deposits) 520,033 505,322
Total 5,898,175 5,905,351
Breakdown of liabilities to customers by maturity:
(52) SECURITISED LIABILITIES
Breakdown of securitised liabilities by maturity:
EUR ’000s 2012 2011
Fixed-term with residual maturity of
up to 3 months 120,910 -
more than 3 months and up to 1 year 265,070 360,640
more than 1 year and up to 5 years 3,720,860 3,886,648
more than 5 years 1,007,905 82,157
Total 5,114,745 4,329,445
EUR ’000s 2012 2011
Bonds and notes issued 5,114,745 4,329,445
Mortgage Pfandbriefe 350,555 208,714
Public-sector Pfandbriefe 783,647 805,722
Other bonds 3,980,543 3,315,009
Total 5,114,745 4,329,445

112
EUR ’000s 2012 2011
Fixed-term with residual maturity of
up to 3 months 14,906 9,776
more than 3 months and up to 1 year 30,747 30,314
more than 1 year and up to 5 years 284,905 234,968
more than 5 years 314,773 269,073
Total 645,331 544,131
(53) LIABILITIES HELD FOR TRADING
Please see note 64 for the composition and per-
formance of liabilities held for trading.
Breakdown of liabilities held for trading by con-
tractual maturity:
The hedges involve securing the risk of a change
in interest rates. The underlying transactions are
loans and advances to customers and fixed inter-
est securities.
EUR ’000s 2012 2011
Negative market values from derivative financial instruments (nothedge accounting)
645,331 544,131
Total 645,331 544,131
(54) NEGATIVE MARKET VALUES FROM DERIVATIVE
FINANCIAL INSTRUMENTS (HEDGE ACCOUNTING)
EUR ’000s 2012 2011
Negative market values from fair value hedges 31,636 32,585
Total 31,636 32,585

113
CORPORATE REPORT 2012 | NOTES
(55) PROVISIONS
EUR ’000s 2012 2011
Provisions for pensions and similar obligations 24,596 24,081
Other provisions 7,311 8,364
Provisions for the credit business 3,549 4,439
Other provisions 3,762 3,925
Total 31,907 32,445
EUR ’000s 2012 2011
Net present value of pension obligations 29,167 24,107
unfunded 28,576 23,493
funded 591 614
Fair value of plan assets -611 -710
Actuarial gains and losses not yet recognised -3,994 649
Assets not recognised due to the limitation of IAS 19.58 (b) (Asset Ceiling)
34 35
Pension provisions reported 24,596 24,081
Provisions for pensions and similar obliga-
tions
The value recorded on the balance sheet for
pension provisions is derived as follows:
Performance of the net present value of pen-
sion obligations:
EUR ’000s 2012 2011
Balance as of 1 January 24,107 21,945
Current service expense 716 557
Interest expense 1,124 1,150
Actuarial gains and losses 4,641 1,645
Benefits paid -1,421 -1,190
Balance as of 31 December 29,167 24,107
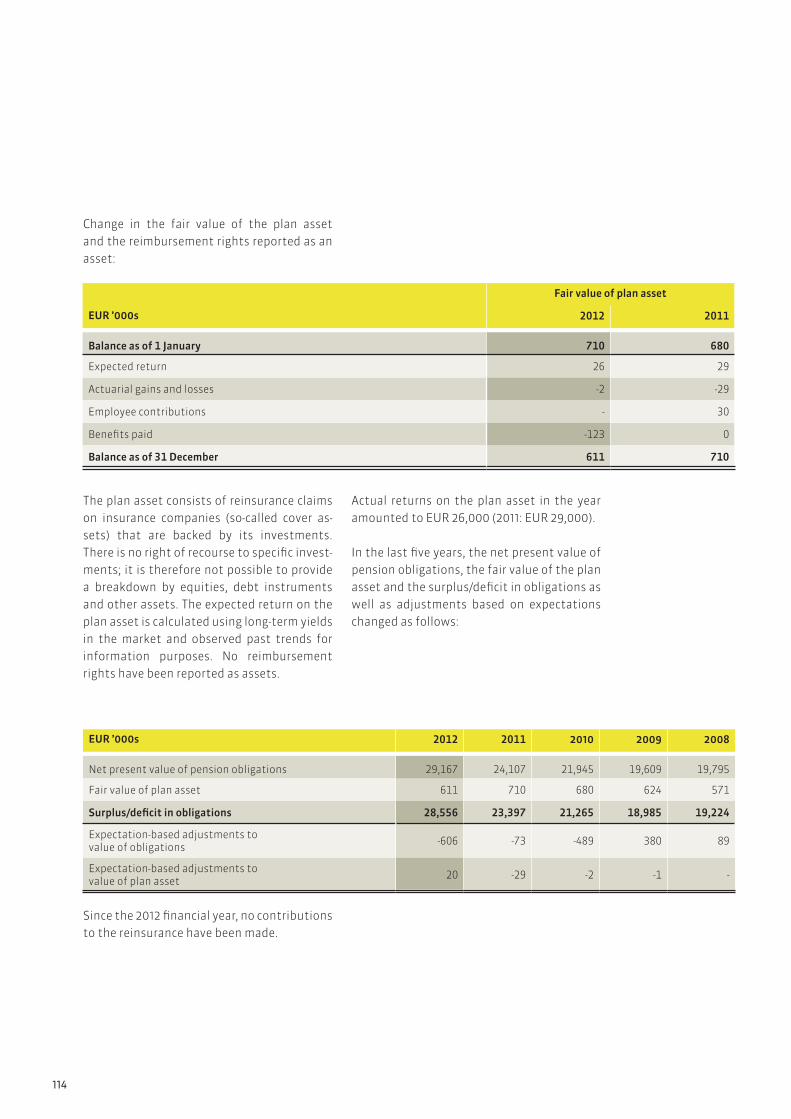
114
Fair value of plan asset
EUR ’000s 2012 2011
Balance as of 1 January 710 680
Expected return 26 29
Actuarial gains and losses -2 -29
Employee contributions - 30
Benefits paid -123 0
Balance as of 31 December 611 710
Change in the fair value of the plan asset
and the reimbursement rights reported as an
asset:
The plan asset consists of reinsurance claims
on insurance companies (so-called cover as-
sets) that are backed by its investments.
There is no right of recourse to specific invest-
ments; it is therefore not possible to provide
a breakdown by equities, debt instruments
and other assets. The expected return on the
plan asset is calculated using long-term yields
in the market and observed past trends for
information purposes. No reimbursement
rights have been reported as assets.
Actual returns on the plan asset in the year
amounted to EUR 26,000 (2011: EUR 29,000).
In the last five years, the net present value of
pension obligations, the fair value of the plan
asset and the surplus/deficit in obligations as
well as adjustments based on expectations
changed as follows:
EUR ’000s 2012 2011 2010 2009 2008
Net present value of pension obligations 29,167 24,107 21,945 19,609 19,795
Fair value of plan asset 611 710 680 624 571
Surplus/deficit in obligations 28,556 23,397 21,265 18,985 19,224
Expectation-based adjustments to value of obligations
-606 -73 -489 380 89
Expectation-based adjustments to value of plan asset
20 -29 -2 -1 -
Since the 2012 financial year, no contributions
to the reinsurance have been made.

115
CORPORATE REPORT 2012 | NOTES
The cost of pension obligations recognised
on the income statement consists of the
following:
EUR ’000s 2012 2011
Current service expense 716 557
Interest expense 1,124 1,150
Current return on plan asset 26 29
Actuarial gains and losses - 30
Effect of upper limit in IAS 19.58 (b) (Asset Ceiling) 1 9
Total 1,815 1,657
Other provisions
Provisions for the credit business Otherprovisions
At individual transaction level
At portfolio level
EUR ’000s 2012 2011 2012 2011 2012 2011
Balance as of 1 January 3,028 1,279 1,411 2,106 3,925 3,839
Utilisations - - - - 732 1,068
Releases 2,536 708 - 1,069 364 733
Allocations 97 2,458 1,549 374 933 1,888
Balance as of 31 December 589 3,028 2,960 1,411 3,762 3,925
The current service expense and the expense
from the effect of the upper limit in IAS 19.58
(b) (Asset Ceiling) is reported under adminis-
trative expenses. Interest expense is offset
against expected income from the plan asset
and reported under net interest income. Actu-
arial profits are reported in other income.
It is anticipated that pension provisions of
EUR 1.3 million will be utilised in the follow-
ing financial year.
The amendments to IAS 19 (discontinuation
of the so-called corridor rules) mean that in
the 2013 financial year, the not yet recog-
nised actuarial losses as of 31 December 2012
(EUR 4.0 million) will be taken to equity in
other income (cf. note 1).
The provisions in the credit business are cre-
ated for contingent liabilities and irrevocable
credit commitments.
The other provisions are largely provisions
for staff (length of service bonuses, provi-
sions for pre-retirement part-time working
and early retirement) of EUR 1.6 million (2011:
EUR 1.8 million), and for legal costs of EUR 1.0
million (2011: EUR 615,000).
External expert reports form the basis of the
staff provisions.

116
EUR ’000s 2012 2011
Prepaid income 192 665
Other liabilities 35,158 31,657
Accruals 15,043 12,968
Total 50,394 45,290
EUR ’000s 2012 2011
Current income tax liabilities 7,466 2,884
Domestic 4,969 2,619
International 2,497 265
Deferred income tax liabilities 66,362 47,166
Domestic 66,362 47,166
International - -
Total 73,828 50,050
Other provisions are not discounted, apart
from those related to staff, as the cash out-
flows are expected to take place within one
year.
Please see note 48 for a breakdown of the de-
ferred tax liabilities and the deferred tax as-
sets.
(57) OTHER LIABILITIES
Other liabilities mainly comprise the propor-
tionate, not yet paid servicing of subordinat-
ed and hybrid capital and permanent capital
contributions of silent partners amounting to
EUR 27.0 million (2011: EUR 28.5 million).
The accruals consist of EUR 7.1 million (2011:
EUR 4.5 million) in employee benefits due
in the short term, EUR 2.8 million (2011:
EUR 2.4 million) in taxes unrelated to income
and EUR 4.4 million (2011: EUR 4.9 million) in
outstanding invoices.
(56) CURRENT AND DEFERRED INCOME TAX LIABILITIES
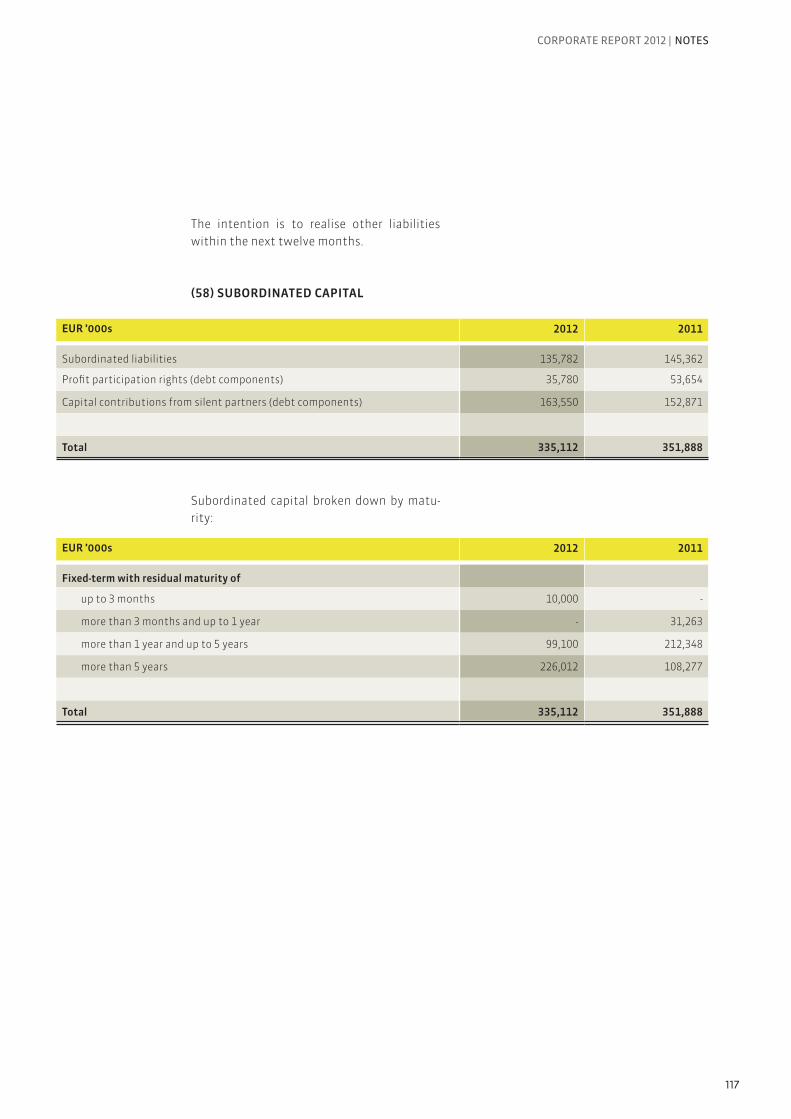
117
CORPORATE REPORT 2012 | NOTES
The intention is to realise other liabilities
within the next twelve months.
(58) SUBORDINATED CAPITAL
EUR ’000s 2012 2011
Subordinated liabilities 135,782 145,362
Profit participation rights (debt components) 35,780 53,654
Capital contributions from silent partners (debt components) 163,550 152,871
Total 335,112 351,888
EUR ’000s 2012 2011
Fixed-term with residual maturity of
up to 3 months 10,000 -
more than 3 months and up to 1 year - 31,263
more than 1 year and up to 5 years 99,100 212,348
more than 5 years 226,012 108,277
Total 335,112 351,888
Subordinated capital broken down by matu-
rity:

118
(59) SHAREHOLDERS’ EQUITY
EUR ’000s 2012 2011
Subscribed capital 169,114 169,114
Statutory share capital 132,114 132,114
Undated capital contributions from silent partners 37,000 37,000
Hybrid capital 91,453 104,258
Profit participation rights (equity component) 2,720 4,846
Dated silent partnership contributions (equity component) 88,733 99,412
Capital reserve 50,841 50,841
Retained earnings 154,058 137,798
Other retained earnings 1) 154,058 137,798
Revaluation reserve 43,595 -11,585
Retained profit 1) 49,692 11,542
Total 558,753 461,968
1) Figures have been adjusted; see note 39.
Hybrid capital
Silent partnership contributions with a fixed
term or recallable by the lender and profit
participation rights are compound financial
instruments and have to be divided into their
equity and debt components (split account-
ing). The disclosure in equity takes place un-
der hybrid capital instruments.
Capital reserve
Additional contributions by the sharehold-
ers into shareholders’ equity are listed in the
capital reserve.
Retained earnings
Amounts allocated to reserves from the previ-
ous year’s distributable earnings are booked
under retained earnings.
Revaluation reserve
The item contains valuation gains and losses
on AfS financial instruments, and AfS finan-
cial instruments reclassified to LaR and HtM
instruments, taken directly to equity, if they
occurred during the categorisation as AfS.

119
CORPORATE REPORT 2012 | NOTES
The movements in the revaluation reserve
were as follows:
The revaluation reserve contains reclassi-
fied securities (before deferred taxes) in the
amount of EUR -4.9 million from the HtM cat-
egory and EUR -19.7 million from LaR; these
will be amortised over the expected remain-
ing life of the underlying investments.
Consolidated profit
The retained profit was EUR 49.7 million (2011:
EUR 11.5 million).
The determinant figure under the German
Commercial Code for the appropriate of prof-
its is, as in 2011, EUR 0.00. No dividends were
paid in 2012 for the 2011 financial year.
Capital management
The regulatory requirements set out in the
Solvency Ordinance [SolvV] are key for SaarLB
when assessing and managing capital ad-
equacy as well as maintaining economic risk-
bearing capacity.
Regulatory capital
SaarLB has applied the relevant rules on calcu-
lating capital requirements under the Solven-
cy Ordinance since obtaining approval from
the German Federal Financial Supervisory
Authority (BaFin) to use the Internal Ratings
Based Approach (IRBA) from 1 January 2007.
Regulatory capital – i.e. equity – comprises
core capital (essentially nominal capital,
silent partner contributions and reserves,
including the reserves under Section 340 g
of the German Commercial Code [HGB]) plus
supplementary capital (essentially profit par-
ticipation rights and long-term subordinated
liabilities) after deductible items.
The overall ratio – the ratio of capital to risk
positions calculated under Solvency Ordi-
nance [SolvV] rules – must not fall below 8.0%
from a regulatory point of view. SaarLB has
specified a stricter target ratio of 10.0% for its
Group figure and a core capital target ratio of
8.0% in its internal management. The latter
is the ratio of core capital (after deductible
items) to risk exposures.
Target values are constantly maintained by
means of medium-term planning over a five-
year timeframe. The Corporate Development
segment is responsible for the strategic plan-
ning process. On the basis of the economic
conditions determined in this process, each
business area performs its own risk exposure
planning for this time period. Their figures are
then collated at Group level by Controlling –
the department in charge of the quantitative
aspects of medium-term planning – and com-
pared with the equity available in the plan-
ning period. Finally, the measures needed to
procure capital or scale back proposed busi-
ness area budgeting are defined to ensure the
targets are met.
An overview of the key Solvency Ordinance
data as of the balance sheet date of 31
EUR ’000s 2012 2011
Balance as of 1 January -11,585 -16,233
Measurement changes taken directly to equity 70,668 1,490
Changes in deferred taxes taken directly to equity -25,002 -3,046
Measurement changes taken to the income statement / recognition 9,514 6,204
Balance as of 31 December 43,595 -11,585

120
December 2012 and the corresponding fig-
ures from the previous year are given below.
SaarLB stopped preparing regulatory group
reports in the middle of 2011. To this extent,
the figures only include the single institute.
The key figures for SaarLB increased noticea-
bly year on year due to the drop in risk assets.
SaarLB complied with the minimum regula-
tory ratio during the entire reporting period
at all times as well as its stricter target ratios.
Good overall capital adequacy ratios were
also reflected in the results of the required
regulatory stress tests: Based on the assump-
tion of economic weakness, the equity ratio
at the Group level was 10.0% and the core
capital ratio was 9.0% as of 31 December 2012.
Key Solvency Ordinance (SolvV) data 31 Dec. 2012 31 Dec. 2011
Risk exposure (EUR million) 7,181 7,618
Equity (EUR million) 845 865
of which: core capital (EUR million) 759 757
Equity ratio (Group level in %) 11.8% 11.4%
Core capital ratio (in %) 10.6% 9.9%
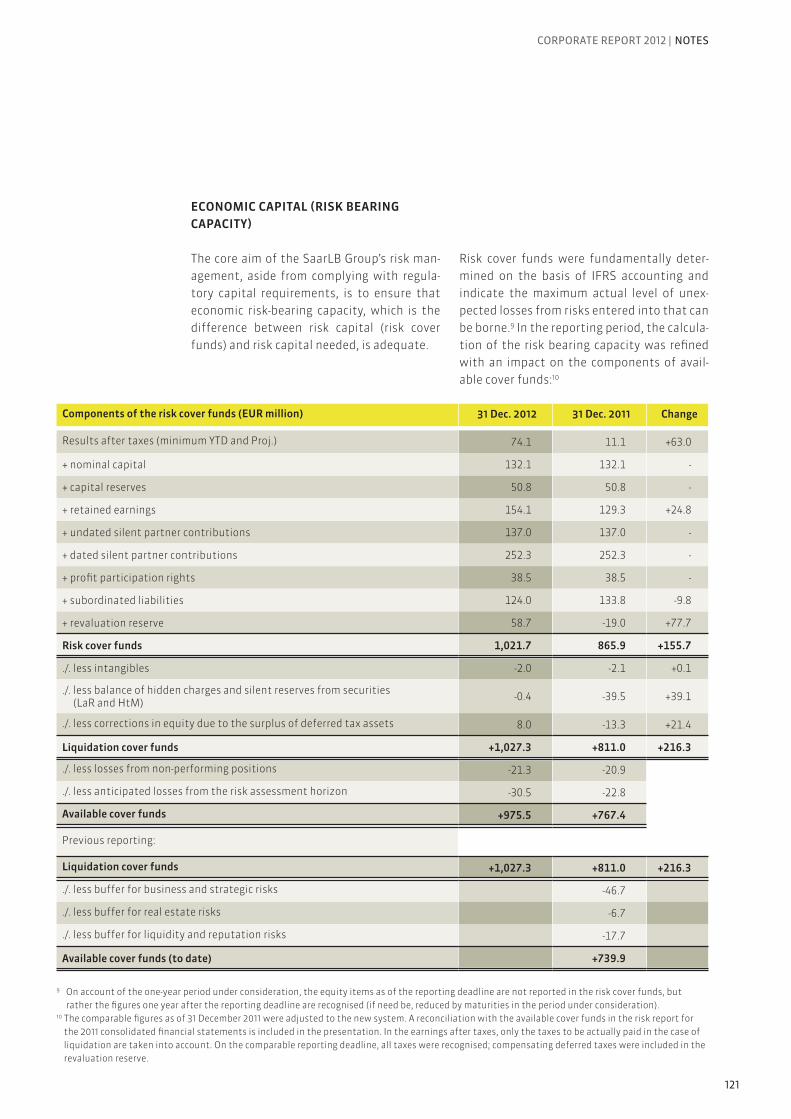
121
CORPORATE REPORT 2012 | NOTES
ECONOMIC CAPITAL (RISK BEARING
CAPACITY)
The core aim of the SaarLB Group’s risk man-
agement, aside from complying with regula-
tory capital requirements, is to ensure that
economic risk-bearing capacity, which is the
difference between risk capital (risk cover
funds) and risk capital needed, is adequate.
Risk cover funds were fundamentally deter-
mined on the basis of IFRS accounting and
indicate the maximum actual level of unex-
pected losses from risks entered into that can
be borne.9 In the reporting period, the calcula-
tion of the risk bearing capacity was refined
with an impact on the components of avail-
able cover funds:10
Components of the risk cover funds (EUR million) 31 Dec. 2012 31 Dec. 2011 Change
Results after taxes (minimum YTD and Proj.) 74.1 11.1 +63.0
+ nominal capital 132.1 132.1 -
+ capital reserves 50.8 50.8 -
+ retained earnings 154.1 129.3 +24.8
+ undated silent partner contributions 137.0 137.0 -
+ dated silent partner contributions 252.3 252.3 -
+ profit participation rights 38.5 38.5 -
+ subordinated liabilities 124.0 133.8 -9.8
+ revaluation reserve 58.7 -19.0 +77.7
Risk cover funds 1,021.7 865.9 +155.7
./. less intangibles -2.0 -2.1 +0.1
./. less balance of hidden charges and silent reserves from securities (LaR and HtM)
-0.4 -39.5 +39.1
./. less corrections in equity due to the surplus of deferred tax assets 8.0 -13.3 +21.4
Liquidation cover funds +1,027.3 +811.0 +216.3
./. less losses from non-performing positions -21.3 -20.9
./. less anticipated losses from the risk assessment horizon -30.5 -22.8
Available cover funds +975.5 +767.4
Previous reporting:
Liquidation cover funds +1,027.3 +811.0 +216.3
./. less buffer for business and strategic risks -46.7
./. less buffer for real estate risks -6.7
./. less buffer for liquidity and reputation risks -17.7
Available cover funds (to date) +739.9
9 On account of the one-year period under consideration, the equity items as of the reporting deadline are not reported in the risk cover funds, but
rather the figures one year after the reporting deadline are recognised (if need be, reduced by maturities in the period under consideration).10 The comparable figures as of 31 December 2011 were adjusted to the new system. A reconciliation with the available cover funds in the risk report for
the 2011 consolidated financial statements is included in the presentation. In the earnings after taxes, only the taxes to be actually paid in the case of
liquidation are taken into account. On the comparable reporting deadline, all taxes were recognised; compensating deferred taxes were included in the
revaluation reserve.

122
The risk cover funds rose significantly in
comparison to the previous deadline primar-
ily due to the higher earnings, an addition
to profit reserves and due to positive effects
from the revaluation reserve, while slight de-
clines in subordinated liabilities are overcom-
pensated as a result.11 The available risk cover
funds result from the risk cover funds due to
the reductive consideration of other effects:
-
ducted from the cover funds, which might
not retain their value in the case of a liqui-
dation.
cover funds are deducted over a one-year as-
sessment horizon, which will not be explicit-
ly considered in the future modelling of the
economic risk bearing capacity calculation.
As part of economic risk capital management,
SaarLB monitors its risk profile and ensures
its risk-bearing capacity is always adequate
by comparing each month the risk capital al-
located to the available cover funds and risk
capital needed. Risk capital needed is deter-
mined by analysing all significant risk types
in a consistent manner.12 The risks from across
the Group are collated into an overall assess-
ment of the risk existing. In ICAAP, the value
at risk (VaR) method based on a confidence
level of 99.95% is used to the determine risk
capital needed. The limits are set at the level
of the individual risk types and collectively
through the (total) allocated risk capital. As-
sumptions and results of the risk quantifica-
tion are to be validated at least once a year.
The ICAAP risk-bearing capacity as of 31 De-
cember 2012 is illustrated in the following
overview:13
Economic RBC (ICAAP) (EUR million)
31 Dec. 2012 31 Dec. 2011
Capital needed
Limit Range Capital needed
Limit Range
Counterparty risk 331.1 430.0 77.0% 338.5 430.0 78.7%
of which default risk (141.2) (180.0) 78.4% (136.2) (180.0) 75.7%
of which credit spread risk (189.9) (250.0) 75.9% (202.2) (250.0) 80.9%
Market risk 32.2 90.0 35.8% 12.0 90.0 13.3%
Operational risk 2.6 5.0 51.1% 2.1 5.0 41.8%
Reputation risk 0.0 2.0 0.0% 0.0 2.0 0.0%
Unexp. behaviour by savers 0.6 3.0 19.7% 1.0 3.0 32.5%
Real estate risk 13.3 15.0 88.5% 13.3 15.0 88.5%
Strategic risk / business risk 72.7 85.0 85.5% 68.1 85.0 80.1%
Total 452.4 630.0 71.8% 434.8 630.0 69.0%
Available cover funds 975.5 767.4
Free econ. cover funds 523.1 332.5
11 In 2013 – i.e. over a one-year assessment horizon – some EUR 10 million of subordinated liabilities will fall due.12 Besides the previously considered risk types, the new system also includes the following risks: unexpected behaviour by savers, real estate risk,
strategic risk / business risks and reputation risks.13 The further development of the risk bearing capacity calculation was retroactively applied to the comparable reporting deadline of 31 December 2011.
In comparison to the system outlined in the report for the previous year, credit spread risks (EUR +169.9 million) and market risks (EUR +4.6 million) are
quantified higher in the comparable figures as of 31 December 2011 as a result. In the credit spread risks, significantly higher divergence in spreads is an-
ticipated on the basis of the experiences in the financial crisis; a holding period of 10 days is no longer generally assumed for market price risks; instead,
the losses expected within a year are to be quantified. In return, no longer regulatory, but expected capital needed due to economic performance is
counted (EUR -20.7 million). The utilisation of the limits allocated at the reporting deadline is also illustrated as of 31 December 2011.

123
CORPORATE REPORT 2012 | NOTES
The SaarLB Group’s risk-bearing capacity was
ensured at all times without qualification
throughout the reporting period (both in to-
tal and on the level of individual types of risk).
Besides the ICAAP risk capital needed, the risk
capital needed in multiple scenarios was cal-
culated among others in the case of serious
economic weakness across all risk types under
consistent assumptions. With regard to coun-
terparty risks, a sector-specific deterioration
of the credit portfolio and a further increase
in credit spreads are assumed, and for all oth-
er types of risk, more stringent assumptions
also apply.
While the capital needed fell slightly overall,
the free economic cover funds rose year on
year and significantly exceeded the capital
needed as of the reporting deadline.14
Serious economix weakness(EUR million)
31 Dec. 2012 31 Dec. 2011
Capital needed Capital needed
Counterparty risk 306.8 332.0
of which default risk (155.8) (166.0)
of which credit spread risk (151.0) (166.0)
Market risk 12.2 9.6
Operational risk 1.3 1.0
Reputation risk 0.0 0.0
Unexp. behaviour by savers 0.5 0.8
Real estate risk 10.2 10.2
Strategic risk / business risk 38.3 36.0
Total capital needed 369.3 389.7
Free econ. cover funds 523.1 332.5
14 In the presentation of the stress scenarios as of 31 December 2011 calculated according to the new system for comparative purposes, the direct eco-
nomic impact of the scenario would have been manageable, but the simultaneous occurrence of the 2000 year ICAAP loss would no longer have been
covered. From a regulatory point of view, both the scenario losses and an additional SolvV stress would have been covered as of 31 December 2011.

124
The notes on the risks arising from financial
instruments under IFRS 7 are contained in the
risk report.
(60) FAIR VALUE OF FINANCIAL
INSTRUMENTS
Overview
Notes on financial instruments
EUR ’000s Fair value Carrying value
Fair value Carrying value
2012 2012 2011 2011
Assets 19,056,136 18,643,366 19,753,804 19,645,520
Cash reserve 669,302 669,302 106,737 106,737
Loans and advances to banks1) 3,456,062 3,227,919 3,982,450 4,082,938
Loans and advances to customers1) 9,096,375 8,910,702 8,766,924 8,492,097
Assets held for trading 517,917 517,917 431,629 431,629
Positive market value from derivative financial instruments (hedge accounting)
46,181 46,181 - -
Investments 4,692,650 4,698,415 5,506,507 5,574,215
Securities repurchase transactions 574,688 569,969 955,850 954,197
Interests in entities valued at equity 2,876 2,876 2,762 2,762
Other assets 85 85 945 945
Liabilities 18,156,121 18,063,168 19,191,828 19,213,045
Liabilities to banks 6,052,162 6,000,336 7,936,097 8,008,089
Liabilities to customers 5,917,771 5,898,175 5,929,652 5,905,351
Securitised liabilities 5,133,337 5,114,745 4,353,621 4,329,445
Liabilities held for trading 645,331 645,331 544,131 544,131
Negative fair values from derivative financial instruments(hedge accounting)
31,636 31,636 32,585 32,585
Other liabilities 37,833 37,833 41,556 41,556
Subordinated capital 338,051 335,112 354,186 351,888
1) After deduction of individual risk provisions, before the deduction of the portfolio risk provision. The carrying values in 2011 were adjusted for loans and
advances to customers; see note 39.
The difference between fair values and carry-
ing values is EUR 412.7 million for assets (2011:
EUR 109.2 million) and EUR 93.0 million for li-
abilities (2011: EUR -21.2 million).
It was not possible to reliably determine the
fair value for EUR 6.7 million (2011: EUR 7.5 mil-
lion) of unlisted equity instruments under in-
vestments. These are therefore stated at car-
rying value.

125
CORPORATE REPORT 2012 | NOTES
For the purposes of the notes, the fair value
of loans measured at amortised cost and re-
ported in loans and advances and liabilities to
banks and customers as well as subordinated
capital is determined using the net present
value method. In the case of receivables the
discounting process uses:
and in the same currency,
Risk-adjusted spreads are calculated by tak-
ing the rating, the fixed interest period and
the size of capital repayments.
In the case of liabilities, risk-adjusted spreads
and rating-related cost of equity premiums
are not used.
The cash reserves, the other accounts in-
cluded in loans and advances and liabilities
to banks and customers as well as the items
reported in other assets and liabilities are dis-
closed at their nominal amounts.
The fair values for the securitised liabilities
are based on the prices that the Bank deter-
mined itself as issuer.
See note 6 on the methods and assumptions
for the fair value calculation in assets and li-
abilities held for trading (including the nega-
tive market value from derivative financial
instruments for hedge accounting) and finan-
cial assets (including securities repurchase
transactions).

126
FAIR VALUES BY CATEGORIES
Assets
EUR ’000s Fair value Fair value
2012 2011
Cash reserves 669,302 106,737
Loans and advances to banks 3,456,062 3,982,450
Clearing and current accounts 261,715 241,178
Overnight and time deposits 1,692,365 2,037,720
Loans 1,444,607 1,696,630
Other loans and advances 57,375 6,922
Loans and advances to customers 9,096,375 8,766,924
Clearing and current accounts 224,641 100,305
Overnight and time deposits 319,364 576,270
Loans 8,511,568 8,073,880
Other loans and advances 40,802 16,469
Assets held for trading 517,917 431,629
Interest rate-related transactions 513,948 427,264
Equity-related transactions 1,734 1,257
Currency-related transactions 1,945 3,108
Credit derivatives 290 -
Positive market values from derivative financial instruments (hedge accounting)
46,181 -
Interest rate-related transactions 46,181 -
Investments 4,692,650 5,506,507
Bonds, notes and other fixed-interest securities 4,586,138 5,445,374
Money market instruments 458,532 894,143
Bonds and notes 4,127,606 4,551,231
Equities and other non-fixed-interest securities 55,563 9,077
Equities 469 1,136
Investment fund units 54,234 7,061
Other non-fixed-interest securities 860 880
Interest in subsidiaries 1,920 1,920
Associates not consolidated 2,292 2,292
Other investments 46,737 47,844
Securities repurchase transactions 574,688 955,850
Interests in entities valued at equity 2,876 2,762
Other assets 85 945

127
CORPORATE REPORT 2012 | NOTES
Liabilities
EUR ’000s Fair value Fair value
2012 2011
Liabilities to banks 6,052,162 7,936,097
Clearing and current accounts 697,275 430,944
Overnight and time deposits 1,973,106 3,904,040
Loans 3,326,936 3,599,579
Other liabilities 54,844 1,533
Liabilities to customers 5,917,771 5,929,652
Clearing and current accounts 1,144,450 623,007
Overnight and time deposits 1,797,323 2,499,592
Loans 2,292,229 2,287,790
Home loan savings deposit and savings deposits 514,301 506,417
Other liabilities 169,467 12,847
Securitised liabilities 5,133,337 4,353,621
Liabilities held for trading 645,331 544,131
Interest rate-related transactions 640,252 524,207
Equity-related transactions 1,734 1,257
Currency-related transactions 1,750 12,522
Credit derivatives 1,595 6,145
Negative market values from derivative financial instruments (hedge accounting) 31,636 32,585
Interest rate-related transactions 31,636 32,585
Other liabilities 37,833 41,556
Subordinated capital 338,051 354,186

128
(61) LEVEL INFORMATION FOR FINANCIAL INSTRUMENTS
MEASURED AT FAIR VALUE
General level information
EUR ’000s Level 1 Level 2 Level 3 Total
2012 2011 2012 2011 2012 2011 2012 2011
Assets held for trading 3,589 5,622 514,053 426,007 275 - 517,917 431,629
Interest rate-related transactions 1,855 4,365 512,093 422,899 - - 513,948 427,264
Equity-related transactions 1,734 1,257 - - - - 1,734 1,257
Currency-related transactions - - 1,945 3,108 - - 1,945 3,108
Credit derivatives - - 15 - 275 - 290 -
Positive market values fromderivative financial instruments(hedge accounting)
- - 46,181 - - - 46,181 -
Interest rate-related transactions - - 46,181 - - - 46,181 -
Investments 655,492 435,582 2,320,626 2,902,162 747,694 1,014,246 3,722,022 4,351,990
Bonds, notes and other fixed-interest securities
601,258 427,385 2,319,766 2,901,282 703,045 969,687 3,624,069 4,298,354
Money market instruments - - - 197,669 458,532 696,474 458,532 894,143
Bonds and notes 601,258 427,385 2,319,766 2,703,613 244,513 273,213 3,165,537 3,404,211
Equities and other non-fixed-interest securities
54,234 8,197 860 880 469 - 55,563 9,077
Equities 54,234 1,136 - - 469 - 54,703 1,136
Investment fund units - 7,061 - - - - - 7,061
Other non-fixed-interest securities
- - 860 880 - - 860 880
Subsidiaries - - - - 1,790 - 1,790 -
Associates not consolidated - - - - - 2,000 - 2,000
Other investments - - - - 42,390 42,559 42,390 42,559
Securities repurchase transactions
- - 294,850 486,225 - - 294,850 486,225
Liabilities held for trading 3,832 5,622 641,499 537,789 - 720 645,331 544,131
Interest rate-related transactions 2,098 4,365 638,397 519,842 - - 640,495 524,207
Equity-related transactions 1,734 1,257 - 0.3 - - 1,734 1,257
Currency-related transactions - - 1,507 12,522 - - 1,507 12,522
Credit derivatives - - 1,595 5,425 - 720 1,595 6,145
Negative market values fromderivative financial instruments(hedge accounting)
- - 31,636 32,585 - - 31,636 32,585
Interest rate-related transactions - - 31,636 32,585 - - 31,636 32,585

129
CORPORATE REPORT 2012 | NOTES
Level 1:
Level 1 consists of those financial instruments
for which a transaction-based price could be
determined on or shortly before or after the
balance sheet date at a not insignificant trad-
ing volume. For derivatives, these include in
particular prices that were determined on
the EUREX. Accordingly, the SaarLB Group
presents securities that have a price listed on
an active market and OTC derivatives under
level 1.
Level 2:
Level 2 consists of financial instruments
where the significant input parameters for
the determination of the fair value are exclu-
sively observed on the market. This relates in
particular to derivatives not traded over-the-
counter where valuation models with input
parameters observable on the market are
used to determine their fair value (primarily
observable interest and spread curves). For
securities that do not meet the criteria ac-
cording to level 1 and whose prices are observ-
able on the market, allocation to level 2 take
place unless there are indications that alloca-
tion to another level is appropriate.
Level 3:
Level 3 consists of financial instruments
where the criteria for allocation to level 1 or 2
were absent, i.e. where input parameters that
are not observed on the market have a signifi-
cant influence on the determination of the
fair value. These include loans and debt se-
curities for which only the indicative courses
are present (counterparty prices that do not
represent an offer). SaarLB derives spreads
from internal ratings for CDS to a limited ex-
tent; consequently, these derivatives are allo-
cated to level 3 on account of the significant
influence of credit spreads on the fair value.
Furthermore, this level contains investments
that are measured at fair value.
The so-called stress test led to the following:
If the spreads as an input parameter vary by
10% for a CDS allocated to level 3, then the
fair value changes by roughly 22%. The fair
value of the CDS allocated to level 3 and val-
ued in this way amounts to EUR 275,000 (2011:
EUR -720,000). If the spreads fall by 10%, the
positive market value rises accordingly to
EUR 304,000 (2011: EUR -870,000).
The investments are valued in particular on
the basis of the so-called risk-free interest
and a risk surcharge, which consists of the
market risk premium and the beta factor (rep-
resentation of sector volatility). If the input
parameters are uniformly raised or reduced by
10%, then the value of the investments meas-
ured at fair value in the amount of EUR 42.4
million (2011: EUR 45.5 million) decreases or
increases by EUR 4.5 million (2011: EUR 2.4 mil-
lion) or EUR 4.1 million (2011: EUR 4.4 million).
If only one input parameter varies by 10%, the
change in the fair value is less.
No stress test for the input parameters was
made for level 3 financial instruments that
were valued with an indicative price. There
were no significant reclassifications between
level 1 and 2.

130
Special disclosures on level 3
EUR ’000s Financial assets measured at fair value
through profit or loss
Financial assetsavailable for sale
Financial liabilities measured at fair value
through profit orloss
Assets held for trading
Investments Liabilities held for trading
Start level - 1,015,150 -720
Total of profits or losses 275 21,653 720
on income statement 275 12,731 720
in revaluation reserve - 8,922 -
Purchases - 489,625 -
Disposals - -1,478 -
Redemptions - -815,149 -
Exchange rate effects - 858 -
Transfers from level 3 - -8,808 -
Transfers to level 3 - 46,894 -
Investments measured at fair value for the first time - 1,790
Investments no longer measured at fair value - -2,841
End level 275 747,694 -
Total of measurement profits/losses for assets that were in the portfolio at the end of the period
275 6,479 720

131
CORPORATE REPORT 2012 | NOTES
(62) FINANCIAL INSTRUMENT MEASUREMENT CATEGORIES
EUR ’000s 2012 2011
Assets
Financial assets measured at fair value through profit or loss 944,941 844,831
Fair value option 427,024 413,202
Investments 427,024 413,202
Financial assets held for trading 517,917 431,629
Assets held for trading 517,917 431,629
Investments held to maturity 674,478 752,063
Investments 399,360 284,090
Securities repurchase transactions 275,118 467,973
Loans and receivables 13,523,097 13,751,076
Cash reserves 669,302 106,737
Loans and advances to banks1) 3,246,133 4,105,613
Loans and advances to customers1) 9,039,001 8,607,193
Investments 568,576 930,639
Other assets 85 894
Financial assets available for sale 3,598,306 4,432,561
Investments 3,303,455 3,946,284
Securities repurchase transactions 294,851 486,226
Other assets - 51
Positive fair values from derivative financial instruments 46,181 -
Liabilities
Financial liabilities measured at fair value through profit or loss 645,331 544,131
Fair value option - -
Financial liabilities held for trading (Held for trading) 645,331 544,131
Liabilities held for trading 645,331 544,131
Financial liabilities measured at amortised cost 17,386,201 18,626,650
Liabilities to banks 6,000,336 8,008,089
Liabilities to customers 5,898,175 5,905,351
Securitised liabilities 5,114,745 4,329,445
Subordinated capital 335,112 351,888
Other liabilities 37,833 31,877
Negative fair values from derivative financial instruments(hedge accounting)
31,636 32,585
1) Before deducting risk provisions

132
(63) NET GAINS OR LOSSES ON FINANCIAL INSTRUMENTS
EUR ’000s Net interest income
Risk provisions Gains or losses on fair value
measurement
Gains or losses onhedges
Gains or losses on investments
Total
2012 2011 2012 2011 2012 2011 2012 2011 2012 2011 2012 2011
Financial assets and liabilities measuredat fair value throughprofit or loss
-18,736 -14,231 - - 37,009 -16,150 10,876 -11,594 - - 29,149 -41.975
Fair value option 13,424 17,141 - - 24,844 -9,782 - - - - 38,268 7.359
Financial assets held for trading1 ) -32,160 -31,372 - - 12,165 -6,368 10,876 -11,594 - - -9,119 -49.334
Loans and receivables2) 384,996 399,399 -33,310 -19,118 - - 5,640 11,392 1,330 -12,067 358,656 379.606
Financial assets available for sale3)
94,272 104,333 - - - - 225 245 1,847 11,441 96,344 116.019
Investments held to maturity
14,791 20,785 - - - - - - 13 118 14,804 20.903
Liabilities measuredat amortisedcost
-336,493 -388,059 - - - - -16,892 - - - -353,385 -388.059
1 ) Including gains/losses on currency conversion2) Including financial assets in the loans and receivables category3) Including shares of profits in associated companies accounted for using the equity method
For each category, net gains or losses on fi-
nancial instruments include both measure-
ment gains and losses and gains or losses on
disposal.
Gains amounting to EUR 70.7 million (2011:
EUR 1.5 million) on fair value measurement of
available for sale financial assets was taken
straight to the revaluation reserve in equity
(see note 59).
(64) DERIVATIVE TRANSACTIONS
Interest and foreign currency-related and
other forward transactions and credit deriva-
tives not settled at the balance sheet date are
shown in the tables below. Most of the deals
were concluded to hedge fluctuations in in-
terest rates, exchange rates or market prices
and trading on behalf of customers.

133
CORPORATE REPORT 2012 | NOTES
Volumes
EUR ’000s Nominal values Positive fair values
Negative fair values
2012 2011 2012 2012
Interest rate risks
Interest rate swaps 13,658,119 13,324,482 554,536 -663,979
of which interest rate swaps under hedge accounting
1,093,096 70,365 46,181 -31,636
FRAs - 100,000 - -
Caps, floors 1,275,776 1,350,483 2,830 -2,828
Futures 903,148 810,060 1,855 -2,098
Total interest rate risk 15,837,043 15,585,025 559,221 -668,905
Currency risks
Forward foreign exchange transactions 267,504 584,137 1,905 -1,467
Currency swaps, currency/interest swaps 30,803 29,893 908 -3,226
Foreign exchange options 50,532 40,400 40 -40
- Purchases 25,266 20,200 40 -
- Sales 25,266 20,200 - -40
Total currency risk 348,839 654,430 2,853 -4,733
Equity and other price risks
Index options 156,674 122,191 707 -707
- Purchases 78,337 61,095 707 -
- Sales 78,337 61,096 - -707
Equity options 54,844 8,191 902 -902
- Purchases 27,422 4,095 902 -
- Sales 27,422 4,096 - -902
Futures 25,196 32,543 124 -124
Total equity and other price risks 236,714 162,925 1,733 -1,733
Credit derivative risks
Protection buyer - - - -
Protection seller 65,000 135,000 290 -1,595
Credit derivative risks 65,000 135,000 290 -1,595
Total 16,487,596 16,537,380 564,097 -676,966

134
Breakdown of maturities
The information is based on contractual re-
sidual maturities.
Breakdown by counterparty
Nominal value
Interest-rate risks Currency risks Other price risks
Credit derivative risks
EUR ’000s 2012 2011 2012 2011 2012 2011 2012 2011
Residual terms
up to 3 months 709,152 573,302 278,315 540,087 227,900 160,230 5,000 15,000
up to 1 year 1,817,049 1,480,866 42,306 84,450 8,798 2,395 - 55,000
up to 5 years 7,579,737 8,514,597 28,218 29,893 16 300 60,000 35,000
more than 5 years 5,731,105 5,016,260 - - - - - 30,000
Total 15,837,043 15,585,025 348,839 654,430 236,714 162,925 65,000 135,000
Nominal values Positive fair values Negative fair values
EUR ’000s 2012 2011 2012 2011 2012 2011
OECD banks 13,664,695 14,007,156 408,593 327,157 -670,679 -561,744
Public-sector entities within the OECD 744,968 807,960 5,854 86 -436 -
Other counterparties 2,077,933 1,722,264 149,650 104,385 -5,851 -14,971
Total 16,487,596 16,537,380 564,097 431,628 -676,966 -576,715

135
CORPORATE REPORT 2012 | NOTES
(65) NOTES TO ITEMS IN THE CASH FLOW
STATEMENT
The cash flow statement shows the cash
flows resulting from operating activities, in-
vesting activities and financing activities for
the financial year.
Cash and cash equivalents reported are equal
to the cash reserves item on the balance
sheet, which comprises cash on hand and de-
posits at central banks.
Cash and cash equivalents are not subject to
any restrictions on the right of disposal.
Payments from loans and advances to banks/
customers, securities (unless investments),
derivatives and other assets are shown as
cash flows from operating activities. Pay-
ments from liabilities to banks/customers,
securitised liabilities and other liabilities are
also assigned to operating activities. Interest
and dividend payments from operating activi-
ties are also included under cash flows from
operating activities.
Cash flows from investing activities shows
payments for investments and property,
plant and equipment (including intangibles).
Cash flow from financing activities includes
payments to silent partners and holders of
profit participation rights and changes in sub-
ordinated capital.
Notes to the cash flow statement

136
(66) SUBORDINATED ASSETS
The following balance sheet items contain
subordinated assets:
(67) ASSETS AND LIABILITIES IN FOREIGN
CURRENCIES
(68) TRANSFERRED, BUT NOT FULLY
WRITTEN-OFF FINANCIAL ASSETS
As of 31 December 2012, SaarLB did not have
any such assets.
See note 43 for securities repurchase transac-
tions for which there was no write-off.
Other notes
EUR ’000s 2012 2011
Loans and advances to banks 12,000 12,000
Investments 8,845 8,841
Total 20,845 20,841
EUR ’000s 2012 2011
Foreign currency assets 735,455 1,022,037
CAD 18,813 26,661
CHF 207,668 261,228
GBP 61,984 65,529
HKD 1 1
JPY 6,116 8,100
USD 381,825 579,907
Other currencies 59,048 80,611
Foreign currency liabilities 708,405 500,277
CAD 2,464 2,807
CHF 116,516 89,004
GBP 40,934 59,617
JPY 6 14
USD 528,113 328,827
Other currencies 20,372 20,008

137
CORPORATE REPORT 2012 | NOTES
(69) TRANSFERRED, FULLY WRITTEN-OFF
FINANCIAL ASSETS
In 2012, SaarLB transferred a financial asset
that was written off in full, but in which it still
had ongoing exposure. The ongoing exposure
consists of a repayment option for the writ-
ten-off receivable if the shares in the borrow-
er are sold with income in the next 12 years.
The claim was sold for EUR 1 and it cannot be
assumed that the shares in the borrower will
be sold for a profit. For this reason, the fair
value of the ongoing exposure as of 31 Decem-
ber 2012 is EUR 0. There is no loss risk from the
ongoing exposure for SaarLB. At the time of
the transfer of the financial asset, there was a
loss of EUR 2.8 million.
EUR ’000s 2012 2011
Loans and advances to banks and customers 316,000 223,894
Investments 1,963,472 2,431,272
of which:Collateral that may be sold on or pledged on by the recipient
569,969 954,197
Total 2,279,472 2,655,166
(70) ASSETS PLEDGED AS COLLATERAL
The collateral pledged relates to securities
repurchase transactions, tender transactions
with the European Central Bank (ECB), trans-
actions on the European Exchange (EUREX),
with Clearstream Banking of Frankfurt am
Main and Clearstream Banking Luxembourg.
In these cases, substantially all risks and re-
wards associated with ownership of the trans-
ferred assets remain with the SaarLB Group.
Assets pledged as collateral relate to the fol-
lowing balance sheet items:
The transferred assets back liabilities in the
amount of EUR 1.4 billion (2011: EUR 2.3 bil-
lion).
These transactions were executed at stand-
ard market conditions.

138
(71) COLLATERAL RECEIVED THAT MAY BE
SOLD OR PLEDGED ON
EUR ’000s 2012 2011
Lease agreements (residual maturities) 5,708 5,708
up to 1 year 1,243 1,214
more than 1 year and up to 5 years 3,480 3,246
more than 5 years 985 1,248
EUR ’000s 2012 2011
Future minimum leasing payments from noncallable lease agreements (residual maturities)
1,880 1,385
up to 1 year 700 662
more than 1 year and up to 5 years 952 723
more than 5 years 228 -
As part of securities repurchase transactions
and securities lending transactions, SaarLB re-
ceives assets lodged as collateral that may be
sold on or pledged on without the collateral
provider defaulting. We held no such securi-
ties on 31 December 2011 or 31 December 2012.
(72) LEASING TRANSACTIONS
Operating leases
The SaarLB Group as lessor:
The leased assets are real estate. The leasing
agreements include some with fixed maturi-
ties and some that are open-ended. The long-
est fixed maturity expires on 30 September
2025. In some cases on expiry, the lessee has
the unilateral option to extend the agree-
ment or the option to a contractually agreed
extension provided the other party does not
object. There are no conditional payments.
The SaarLB Group as lessee:
The leasing agreements mainly relate to the
rental of fixtures and fittings. They have fixed
terms of three to five years. There are no op-
tions or conditional payments.

139
CORPORATE REPORT 2012 | NOTES
EUR ’000s 2012 2011
Fiduciary assets 105,753 104,816
Loans and advances to banks 10,805 5,712
Loans and advances to customers 94,948 96,914
Other loans and advances - 2,190
Fiduciary liabilities 105,753 104,816
Liabilities to banks 4,154 3,041
Liabilities to customers 1,580 1,756
Other liabilities 100,019 100,019
EUR ’000s 2012 2011
Contingent liabilities 274,333 290,170
Liabilities for guarantees and warranty agreements 274,333 290,170
Other obligations 592,900 756,707
Irrevocable credit commitments 592,900 756,707
Total 867,233 1,046,877
(73) FIDUCIARY TRANSACTIONS
Fiduciary transactions break down as follows:
(74) CONTINGENT LIABILITIES AND OTHER
OBLIGATIONS
The provisions (note 55) were established for
guarantees and warranty agreements where
an impairment was determined, since usage
is viewed as probable.

140
(75) OTHER FINANCIAL OBLIGATIONS
Furthermore, there are financial obligations
under operating leases and in relation to
rental, usage, service and maintenance agree-
ments (see note 72).
Moreover, under the articles of the deposit
insurance fund run by the Landesbanks and
giro associations, SaarLB has undertaken to
indemnify the Deutscher Sparkassen- und
EUR ’000s 2012 2011
Additional funding obligations to security reserve of the Landesbanks 21,527 18,221
Additional obligations and additional co-liability for other shareholders
7,012 7,012
Commitments not yet called 2,315 2,315
Obligations to acquire shares 6,505 6,043
Giroverband e. V. (German Savings Bank Asso-
ciation), as the owner of the deposit security
reserve of the Landesbanks and giro associa-
tions, against any losses that may be incurred
due to measures taken in favour of banks in
which SaarLB holds shares. As members of
deposit protection schemes, the branches
are also liable under the provisions governing
those schemes.
(76) LIST OF SHAREHOLDINGS OF LANDES-
BANK SAAR (EXCERPT)
The following table includes the list of share-
holdings (except where these are of minor
importance), pursuant to Section 285 Clause
11 HGB [German Commercial Code] for the in-
dividual financial statements and pursuant
to Section 315 in conjunction with Section 313
(2) HGB for the consolidated financial state-
ments of SaarLB.

141
CORPORATE REPORT 2012 | NOTES
Name Notes Share in %
Equity/fundassets
Total assets Total liabilities
Income Net income
EUR ’000s3) EUR ’000s EUR ’000s EUR ’000s EUR ’000s4)
Special fund included in the consolidated financial statements
LB Immo Invest Saar-Fonds, Hamburg 1) 100.00 41,626 43,242 1,616 1,346 399
SaarLB 1-Fonds, Munich 2) 100.00 149,649 149,892 243 11,066 10,967
SBLB-Fonds, Munich 2) 100.00 67,525 67,525 - 5,567 5,530
SBLB-2-Fonds, Munich 2) 100.00 68,071 68,071 - 5,734 5,696
SBLBHALBS-Fonds, Munich 2) 100.00 32,102 32,102 - 2,680 2,605
Subsidiaries included in theconsolidated financial statements
SaarLB-Bankenbeteiligungsgesellschaft mbH, Saarbrücken
5) 100.00 15,577 16,764 1,187 1,187 1,187
Associates included in the consolidated financial statements
Gekoba-Gesellschaft für Gewerbe- und Kommunalbauten mbH, Saarbrücken
38.00 6,091 25,910 19,819 1,136 590
GSW-Saarländische Wohnungsbaug-esellschaft mbH, Saarbrücken
28.57 8,325 19,651 11,326 2,315 113
Subsidiaries not included in theconsolidated financial statements
ELGESA Beteiligungsgesellschaft mbH in liquidation, Saarbrücken
5) 100.00 1,790 1,796 6 - 4
LBS Immobilien GmbH, Saarbrücken 5) 100.00 105 883 778 2,903 50
LBS Vertriebs GmbH, Saarbrücken 5) 100.00 25 158 133 571 86
Associates
TEGES Grundstücksvermietungsgesells-chaft mbH, Berlin
50.00 19 25 6 36 -
TEGES Grundstücksvermietungsgesells-chaft mbH & Co. Objekt Berlin KG, Berlin
47.01 -7,369 10,608 17,977 1,570 55
Gesellschaft für Wirtschaftsförderung Untere Saar mbH, Saarlouis
33.33 325 390 65 - -42
Saarländische Kapitalbeteiligungsgesells-chaft mbH, Saarbrücken
33.33 6,566 55,462 48,895 3,881 430
Saarländische Wagnisfinanzierungsge-sellschaft mbH, Saarbrücken (direct equity investment)
30.43 6,382 11,410 5,027 890 -169
Notes:
1) Income relates to rental income less administrative expenses
2) Income relates to interest income, commission income and gains or losses on fair value measurement less interest expense and commission expense
3) Shareholders’ funds as defined in Section 266 (3A) in conjunction with Section 272 of the German Commercial Code (HGB)
4) Net income/loss for the year as defined in Section 275 (2) No. 20 of the German Commercial Code (HGB)
5) There is a profit transfer agreement with this company
An interest of less than 20% with voting rights of more than 5% is held in Saarländische Investitionskreditbank AG.

142
Franz Josef SchumannPresident
Saar Association of Savings Banks,
Saarbrücken
Deputy Chairman
Manfred FichterBank employee
Landesbank Saar, Saarbrücken
Dr. Rudolf FuchsChairman of the Board of Management
Sparkasse Mainfranken Würzburg, Würzburg
(until 31 December 2012)
Peter JacobyMinister (in retirement),
Saabrücken
(until 20 August 2012 )
Marcus KramerMember of the Board of Management of
Bayerische Landesbank, Munich
Fred MetzkenChief Financial Officer
CEO of Dillinger Hüttenwerke and Saarstahl
AG, Dillingen
Thomas RoßBank employee
Landesbank Saar, Saarbrücken
(77) ADMINISTRATIVE BODIES OF SAARLB
Board of Administration
Jan-Christian DreesenMember of the Board of Management
Bayerische Landesbank, Munich
Chairman
Dr. Michael BraunSegment Manager for Corporate Strategy
and Corporate Communication at
Bayerische Landesbank, Munich
(from 1 January 2013)
Dr. Winfried FreygangSegment Manager for Group Accounting and
Taxes at Bayerische Landesbank, Munich
Dr. Christoph HartmannMinister (in retirement),
Saarbrücken
(until 23 April 2012)
Thomas KleinBank employee
Landesbank Saar, Saarbrücken
Heiko MaasMinister
Ministry of Economic Affairs, Labour, Energy
and Traffic, Saarbrücken
(from 12 September 2012)
Susanne RiesBank employee
Landesbank Saar, Saarbrücken
Stephan ToscaniMinister
Ministry of Finance and Europe, Saarbrücken
(from 12 September 2012)
Representative of the regulatory body
Iris JungUndersecretary
Ministry of Economic Affairs, Labour, Energy
and Traffic, Saarbrücken

143
CORPORATE REPORT 2012 | NOTES
Board of Management
Thomas Christian Buchbinder Chairman of the Board of Management
Frank EloyMember of the Board of Management
Werner SeverinDeputy Chairman of the Board of
Management

144
Administration of SaarLB and their close
family members,
plans for SaarLB employees, which are used
after the end of the employment relation-
ship.
The circle of related parties has been expand-
ed from the prior year for complete disclosure
in accordance with IAS 24.
The SaarLB Group has business dealings with
related companies and persons. Transactions
with such persons and companies fall within
the normal course of business and are always
on the same terms (including interest rates
and collateral) as for comparable transactions
conducted at the same time with third par-
ties. These transactions did not have unusu-
ally high risks of recovery or other unfavour-
able characteristics.
Details on the subsidiaries and associated
companies in which SaarLB holds an interest
can be found in the list of shareholdings.
(78) RELATED PARTY DISCLOSURES
Companies and persons are deemed to be re-
lated where one party directly or indirectly
controls the other or can exercise significant
influence on its operating and business deci-
sions. Related parties of the SaarLB Group as
of 31 December 2012 include:
-
ture companies
-
LB (except for the last level),
-
iaries of BayernLB (except for the last level),
-
ture companies,
(except for the last level),
-
iaries of Saarland (except for the last level),
-
ies and joint venture companies,
State of Bavaria (except for the last level),
-
sidiaries of the Free State of Bavaria (except
for the last level),
and joint ventures,
-
LB Holding (except for the last level),
-
iaries of BayernLB Holding (except for the
last level),
-
aries of SaarLB (except for the last level),
-
cept for the last level),
its subsidiaries and joint ventures,
members and companies that are controlled
or materially influenced by these people or
their close family members, or hold signifi-
cant voting rights in this circle of related
parties; people in key positions are those
with direct and indirect responsibility for
planning, managing and monitoring the
activities of SaarLB. This includes members
of the Board of Management and Board of

145
CORPORATE REPORT 2012 | NOTES
EUR ’000s 31 Dec. 2012 31 Dec. 2011
Loans and advances to banks 932,748 1,000,142
BayernLB 838,281 902,244
Subsidiaries and joint venture companies of BayernLB 74,637 73,033
Subsidiaries and joint venture companies of Saarland 19,830 24,865
Loans and advances to customers 591,170 909,203
Subsidiaries and joint venture companies of BayernLB - 25,238
Saarland 212,410 522,094
Subsidiaries and joint venture companies of Saarland2) 304,998 274,173
Subsidiaries2) 29,249 29,803
Consolidated associates 5,474 6,279
Associates not consolidated 39,039 51,616
Assets held for trading 57,188 53,600
BayernLB 17,028 20,882
Subsidiaries and joint venture companies of BayernLB 40,160 32,718
Subsidiaries and joint venture companies of Saarland2) 13,359 8,271
Investments 53,725 646,069
BayernLB - 573,369
Subsidiaries and joint venture companies of BayernLB - -
Saarland 53,725 72,700
EUR ’000s 31 Dec. 2012 31 Dec. 2011
Liabilities to banks 1,357,219 2,104,810
BayernLB 1,280,104 2,020,052
Subsidiaries and joint ventures of BayernLB 9,282 11,967
Subsidiaries and joint ventures of Saarland 67,833 72,791
Subsidiaries of the Free State of Bavaria2) 64,800 64,762
Liabilities to customers 38,391 17,271
Saar Association of Savings Banks2) 20,256 12,659
Saarland 3,851 3,210
Subsidiaries and joint ventures of Saarland2) 26,661 6,150
Subsidiaries 2,039 2,090
Consolidated associates 138 110
Associates not consolidated 5,702 5,711
Securitised liabilities 1,825,000 2,325,000
BayernLB 1,825,000 2,325,000
Liabilities held for trading 113,107 92,002
BayernLB3) 113,107 92,002
Subsidiaries and joint ventures of BayernLB - -
Subordinated capital - 55,158
BayernLB - 55,158
Hybrid capital I 58,927 44,842
BayernLB 58,927 44,842
Subsidiaries and joint ventures of BayernLB - -
Financial assets and liabilities as well as hybrid capital with respect
to related parties1):
1) Amounts not incl. accrued interest.2) Expansion of the circle of closely affiliated companies and adjustment of the amounts from 20113) Includes EUR 15.6 million (EUR 16.4 million) of negative fair values from financial derivatives (hedge accounting)

146
Amounts due from/to ZVK
EUR ’000s 31 Dec. 2012 31 Dec. 2011
Receivables 37 -
Liabilities 29,235 33,287
Liabilities to customers 21,635 21,187
Subordinated capital 7,600 12,100
Amounts due from/to members of the Board
of Management and the Board of Administra-
tion of SaarLB
The total amount of loans granted to and de-
posits made by the members of the Board of
Management or the Board of Administration
at SaarLB (including their immediate family
members) breaks down as follows:
EUR ’000s 31 Dec. 2012 31 Dec. 2011
Receivables 17 24
Members of the Board of Management of SaarLB - -
Members of the Board of Administration of SaarLB 17 24
Liabilities 389 403
Members of the Board of Management of SaarLB 147 158
Members of the Board of Administration of SaarLB 242 245
SaarLB received deposits of EUR 36,000 from
close family members (EUR 45,000).

147
CORPORATE REPORT 2012 | NOTES
Remuneration paid to members of the Board
of Management and the Board of Administra-
tion of SaarLB
The interested accrued on pension provisions
amounted to EUR 1.1 million (2011: EUR 1.1 mil-
lion) and is reported as an interest expense.
(79) AUDITORS’ FEES
External auditor’s fees reported as an expense
in the year under review are broken down as
follows:
In the 2012 financial year, the fee for the audit
services includes EUR 155,000 for 2011.
EUR ’000s 2012 2011
Members of the Board of Management of SaarLB 2,175 2,166
Benefits due in the short term 1,459 1,655
Benefits due after the end of the employment relationship 716 511
Expenses due for defined benefit plans 716 511
Members of the Board of Administration of SaarLB 388 388
Benefits due in the short term for supervisory board activities 167 154
Benefits due in the short term for work performance 221 234
Former members of the Board of Management of SaarLB and theirdependants
1,298 1,190
Pension provisions established for members of the Board of Management of SaarLB
8,892 6,156
Pension provisions established for former members of the Board of Management of SaarLB and their dependants
19,684 17,337
EUR ’000s 2012 2011
Audit 835 975
Other audit and valuation services 164 153
Tax consulting services 85 -
Other services 317 437
Total 1,401 1,565

148
(80) EMPLOYEES
The average number of people employed dur-
ing the year was:
The average number of people employed in
associates consolidated at equity during the
year was 43 (previous year: 47).
EUR ’000s 2012 2011
Average number of employees in the year 518 514
of which full time employees 409 418
of which part time employees 90 79
of which trainees 19 17
Female 248 235
Male 270 279

149
CORPORATE REPORT 2012 | NOTES
We affirm that to the best of our knowledge
and in accordance with the applicable re-
porting principles the consolidated financial
statements give a true and fair view of the
net assets, financial position and results of
operations of the Group and the management
report of the Group includes a fair view of the
development and performance of the busi-
ness and the position of the Group, together
with a description of the principal opportuni-
ties and risks associated with the expected
development of the Group.
Saarbrücken, 26 March 2013
Landesbank Saar
Board of Management
Responsibility statement by the Board of Management
Thomas Christian Buchbinder Werner Severin Frank Eloy

150
We have audited the consolidated financial
statements, comprising the consolidated bal-
ance sheet, the Group statement of compre-
hensive income, the schedule of changes in
equity, the cash flow statement, the Group
notes to the consolidated financial state-
ments and the Group management report of
Landesbank Saar, Saarbrücken for the finan-
cial year from 1 January to 31 December 2012.
It is the responsibility of the Board of Man-
agement of the company to draw up the con-
solidated financial statements and the Group
management report in accordance with IFRS
as applicable in the EU, the extra legal require-
ments applicable under Section 315a (1) of the
German Commercial Code and the additional
provisions of the articles of association. Our
responsibility is to express an opinion on the
consolidated financial statements and the
management report, based on the audit we
have conducted.
We carried out our audit of the consolidated
financial statements in accordance with Sec-
tion 317 of the German Commercial Code and
German generally accepted standards for the
audit of financial statements promulgated
by the Institut der Wirtschaftsprüfer (IDW).
These require that we plan and perform the
audit in such a way that misstatements ma-
terially affecting the presentation of the
net assets, financial position and results
of operations in the consolidated financial
statements under the applicable accounting
standards and in the Group management re-
port are detected with reasonable assurance.
Knowledge of the business activities and the
economic and legal environment and expecta-
tions as to possible misstatements are taken
into account in setting the audit procedures.
In the audit, the effectiveness of the internal
accounting control system and the evidence
supporting the disclosures in the consoli-
dated financial statements and Group man-
agement report are examined primarily on a
test basis. The audit includes examining the
annual financial statements of consolidated
companies, setting the scope of consolida-
tion, assessing the accounting policies used,
evaluating significant estimates made by
the Board of Management and considering
the overall presentation of the consolidated
financial statements and the Group manage-
ment report. We believe that our audit pro-
vides a reasonable basis for our opinion.
Our audit has not led to any reservations.
In our opinion based on the findings of our
audit, the consolidated financial statements
are in accordance with IFRS as applicable in
the EU, the extra legal requirements applica-
ble under Section 315a (1) of the German Com-
mercial Code and the additional provisions of
the articles of association and present a true
and fair view of the net assets, financial posi-
tion and results of operations of the Group.
The Group management report is consistent
with the consolidated financial statements
and, taken as a whole, provides an accurate
view of the state of the Group and accurately
presents the risks and opportunities of future
developments.
Saarbrücken, 27 March 2013
PricewaterhouseCoopers
Aktiengesellschaft
Wirtschaftsprüfungsgesellschaft
Burkhard Eckes Isabel Rösler Wirtschaftsprüfer Wirtschaftsprüferin
(German Public Auditor) (German Public Auditor)
Independent Auditors’ Report

151
CORPORATE REPORT 2012 | NOTES
In the past year the Board of Administration
monitored the Board of Management’s con-
ducting of business. The Board of Administra-
tion and the Risk Committee have regularly
received reports on the Bank’s performance
and business situation, as well as on impor-
tant transactions and discussed them in de-
tail with the Bank’s Board of Management.
The Audit Committee addressed the audit
of the financial statements and the internal
control processes of the Bank and discussed
them with the Board of Management. At the
meetings of the Board of Administration, re-
ports were regularly given on significant mat-
ters at the meetings of the Risk Committee
and the Audit Committee.
In the trusting and close collaboration be-
tween the Board of Administration and the
Board of Management, the members pre-
pared the regular reports and addressed the
impact of the restructuring of WestLB, the
election of the auditor for the 2013 financial
year, the consequences of Basel III and CRD IV
on the equity plans of SaarLB and the project
for the optimisation of cooperation between
the savings banks and SaarLB. The Board of
Administration elected the economic com-
mittee of the Bank for the term from 1 January
2013 to 31 December 2015.
The Board of Administration and the Risk
Committee have, to the extent provided by
the articles of association, participated in
the Bank’s business and passed the requisite
resolutions.
At their meetings on 19 April 2013, the Bank’s
corporate bodies discussed compliance with
the Bank’s own corporate governance princi-
ples, to which SaarLB has voluntarily bound
itself, and stated that there were no indica-
tions of which they were aware that were in
contradiction to compliance with these prin-
ciples in the 2012 financial year.
The Board of Administration discussed the
management report, the annual financial
statements, the Group management report
and the consolidated financial statements for
the period ending 31 December 2012 and the
proposed appropriation of distributable earn-
ings with the Board of Management.
The annual financial statements and the
management report as well as the Group
management report and the consolidated fi-
nancial statements for the period ending 31
December 2012 were audited by the auditors,
PricewaterhouseCoopers AG Wirtschaftsprü-
fungsgesellschaft, and received an unquali-
fied auditor’s opinion.
The Board of Administration has taken note
of the audit findings and approved the an-
nual financial statements in accordance with
the German Commercial Code [HGB] for the
period ending 31 December 2012, in which
the company broke even, at its meeting on
19 April 2013. The IFRS consolidated financial
statements for the financial year ending 31
December 2012 were approved by the Board
of Administration. The Board of Management
was granted discharge.
Saarbrücken, 19 April 2013
The Chairman of the Board of Administration
Jan-Christian Dreesen
Report of the Board of Administration

152
MARKET 1
Frank Eloy
Corporate Customers
Michael Heß
∙ Corporate Customers Germany
∙ Corporate Customers France
- Branch of Landesbank Saar,
Metz
- Centre d’affaires Entreprises,
Strasbourg
∙ Foreign Trade
∙ Payments
Real Estate and Projects
Manfred Thinnes
∙ Real Estate Germany
∙ Real Estate France
Roger Lang
- Centre d’affaires Financement
Immobilier, Paris
∙ Project Financing
Daniel Koebnick
∙ Branch Management
Central Sales Management
CORPORATE DEVELOPMENT/
MARKET 2
Thomas Christian Buchbinder
Corporate Development
Dr. Matthias Böcker
∙ Communication and BoM
Support
∙ Human Resources
∙ Strategic Development
∙ Legal Services
Savings Banks, Institutionals and
High Net Worth Individuals
Andreas Hauck
∙ Savings Banks, Institutionals
∙ High Net Worth Individuals
∙ Savings Banks Relationship
Management
∙ Interest and Currency
Management
∙ Wealth Management
Klaus Bingel
Treasury and
Portfolio Management
Christian Mathe
∙ Portfolio Management
∙ Treasury
LBS Market
Dirk Hoffmann
∙ Market and Sales
∙ Service
∙ LBS Immobilien GmbH
LBS Risk Office
Jörg Welter
∙ Bank Management
∙ Risk Office
Internal Audit
Jörg Melde
OPERATIONS/MANAGEMENT
Werner Severin
Bank Management
Bernd Heublein
∙ Financing and Reporting
∙ Profit Controlling
∙ Risk Controlling
Risk Office
Frank-Oliver Groß
∙ Renewable Energies/Projects
∙ Real Estate Germany/France
∙ Portfolio Management:
Real Estate
∙ SME Corporate Customers
∙ Portfolio Management:
Financial Markets
∙ Credit Consult
∙ Area Coordination
Services
Barbara Wagner
∙ IT
∙ Organisation and Logistics
∙ Performance Coordination
∙ Customer and Accounts
∙ Project and Process
Management
Compliance
Data Protection
Organisational chart
As of: 26 March 2013

153As of: 26 March 2013
Shareholders
Bayerische Landesbank, Munich 49.9%
Saarland 35.2%
Sparkassenverband Saar, Saarbrücken 14.9%
Sparkassen-Finanzgruppe Saar
Aggregate total assets
in bank business
EUR 34.7 billion
Staff 4,886Aggregate premium volume
in insurance business
EUR 256.9 million
7 savings banks
Aggregate total assets
EUR 16.0 billion
Staff
3,777
Branches
259
Self-service branches
56
Advisory centres
42
Landesbank Saar
Total assets
EUR 18.7 billion (IFRS)
Staff
518
Landesbausparkasse Saar
Portfolio of contracts:
107,991 contracts
Savings contract total
EUR 2.9 billion
SAARLAND Versicherungen
Staff
591
Premium volumes
Non-life:
EUR 112.6 million
Life:
EUR 144.3 million
Investments
Feuerversicherung AG
EUR 126.7 million
Lebensversicherung AG
EUR 1.2 billion
Sparkassenverband Saar
Association members: 7 savings banks and their municipal owners, as well as Saarland and the Bayerische
Landesbank, owners of SaarLB.
CORPORATE REPORT 2012 | ORGANISATIONAL CHART & SHAREHOLDERS

154

155
Legal notice
Publisher Landesbank Saar
Ursulinenstraße 2
66111 Saarbrücken
Editors Communication and BoM Support
E-mail: [email protected]
This report was completed on 26 March 2013.
Design FBO Agentur für Marketing und Neue Medien
Heinrich-Barth-Straße 27
D-66115 Saarbrücken
Photos FBO, Fotolia, Karl-Otto Franz, Frank Schmitt, Andrew Wakeford
Print repa druck GmbH
Zum Gerlen 6
66131 Saarbrücken
CORPORATE REPORT 2012 | LEGAL NOTICE


address Landesbank Saar
Ursulinenstraße 2
66111 Saarbrücken / Germany
po box 66104 Saarbrücken / Germany
phone +49 681 383-01
fax +49 681 383-1200
internet www.saarlb.de
e-mail [email protected]
bic/swift SALADE55
sort code 590 500 00
SaarLB France, Branch of Landesbank Saar
address 2, place Raymond Mondon
57000 Metz
France
phone +33 387 6968-60
fax +33 387 5708-91
e-mail [email protected]
SaarLB France, Centre d’affaires Entreprises
address 9, rue du Maréchal Joffre
67000 Strasbourg
France
phone +33 388 3758-70
fax +33 388 3693-78
e-mail [email protected]
SaarLB France, Centre d’affaires Financement Immobilier
address 203, rue du Faubourg
Saint Honoré
75008 Paris
France
phone +33 145 6363-52
fax +33 145 6371-22
e-mail [email protected]
address LBS Landesbausparkasse Saar
Beethovenstraße 35 – 39
66111 Saarbrücken / Germany
po box Postfach 10 19 62
66019 Saarbrücken / Germany
phone +49 681 383-290
fax +49 681 383-2100
internet www.lbs-saar.de
e-mail [email protected]
DURCH NÄHEWeitsicht