Embed Size (px)
Citation preview

Agenda
2015-2016 Transmission Planning Stakeholder Meeting
Tom Cuccia
Sr. Stakeholder Engagement and Policy Specialist
February 23, 2015

2015-2016 Draft Study Plan Stakeholder Meeting -
Today’s Agenda Topic Presenter
Opening Tom Cuccia
Introduction & Overview
- 50% Renewable Energy Goal for 2030
Jeff Billinton
Neil Millar
Reliability Assessment Catalin Micsa
Local Capacity Requirement (LCR) Studies
- Near-Term
- Long-Term
Catalin Micsa
David Le
Special Studies
- Potential Risk of Over-Generation
Irina Green
33% Transmission RPS Assessment Sushant Barave
Economic Planning Study Yi Zhang
Western Planning Regions – Regional Status Updates WestConnect
ColumbiaGrid
Northern Tier Transmission Group
Next Steps Jeff Billinton
Page 2

Unified Planning Assumptions & Study Plan
Transmission Planning Process Overview
2015-2016 Transmission Planning Stakeholder Meeting
Jeff Billinton
Manager, Regional Transmission - North
February 23, 2015

2015-2016 Transmission Planning Process
Slide 2
Phase 1
Development of ISO unified
planning assumptions and
study plan
• Incorporates State and
Federal policy
requirements and
directives
• Demand forecasts, energy
efficiency, demand
response
• Renewable and
conventional generation
additions and retirements
• Input from stakeholders
• Ongoing stakeholder
meetings
Phase 3
Receive proposals to build
identified policy and
economic transmission
projects.
Technical Studies and Board Approval
• Reliability analysis
• Renewable delivery analysis
• Congestion analysis
• Publish comprehensive transmission plan
• ISO Board approval
Continued regional and sub-regional coordination
October 2016
Coordination of Conceptual
Statewide Plan
March 2015
Phase 2
March 2016
ISO Board Approval
of Transmission Plan

Schedule and Milestones
Page 3
Phase No Due Date 2015-2016 Activity
Ph
as
e 1
1 December 15, 2014 The ISO sends a letter to neighboring balancing authorities, sub-regional, regional planning
groups requesting planning data and related information to be considered in the development
of the Study Plan and the ISO issues a market notice announcing a thirty-day comment
period requesting demand response assumptions and generation or other non-transmission
alternatives to be considered in the Unified Planning Assumptions.
2 January 15, 2015 PTO’s, neighboring balancing authorities, regional/sub-regional planning groups and
stakeholders provide ISO the information requested No.1 above.
3 February 17, 2015 The ISO develops the draft Study Plan and posts it on its website
4 February 23, 2015 The ISO hosts public stakeholder meeting #1 to discuss the contents in the Study Plan with
stakeholders
5 February 23 - March 9, 2015 Comment period for stakeholders to submit comments on the public stakeholder meeting #1
material and for interested parties to submit Economic Planning Study Requests to the ISO
6 March 31, 2015 The ISO specifies a provisional list of high priority economic planning studies, finalizes the
Study Plan and posts it on the public website
7 Q1 ISO Initiates the development of the Conceptual Statewide Plan

Schedule and Milestones (continued)
Page 4
Phase No Due Date 2015-2016 Activity
Ph
as
e 2
8 August 15, 2015 Request Window opens
9 August 15, 2015 The ISO posts preliminary reliability study results and mitigation solutions
10 September 15, 2015 PTO’s submit reliability projects to the ISO
11 September/October ISO posts the Conceptual Statewide Plan on its website and issues a market notice
announcing the posting
12 September 21 – 22, 2015 The ISO hosts public stakeholder meeting #2 to discuss the reliability study results, PTO’s
reliability projects, and the Conceptual Statewide Plan with stakeholders
13 September 22 – October 6, 2015 Comment period for stakeholders to submit comments on the public stakeholder meeting #2
material
14 October 15, 2015 Request Window closes
15 October/November Stakeholders have a 20 day period to submit comments on the Conceptual Statewide Plan in
the next calendar month after posting conceptual statewide plan (i.e. August or September)
16 October 30, 2015 ISO post final reliability study results
17 November 12, 2015 The ISO posts the preliminary assessment of the policy driven & economic planning study
results and the projects recommended as being needed that are less than $50 million.
18 November 16 - 17, 2015 The ISO hosts public stakeholder meeting #3 to present the preliminary assessment of the
policy driven & economic planning study results and brief stakeholders on the projects
recommended as being needed that are less than $50 million.
19 November 17 – December 1,
2015
Comment period for stakeholders to submit comments on the public stakeholder meeting #3
material
20 December 17 – 18, 2015 The ISO to brief the Board of Governors of projects less than $50 million to be approved by
ISO Executive
21 January 2016 The ISO posts the draft Transmission Plan on the public website
22 February 2016 The ISO hosts public stakeholder meeting #4 to discuss the transmission project approval
recommendations, identified transmission elements, and the content of the Transmission
Plan
23 Approximately three weeks
following the public stakeholder
meeting #4
Comment period for stakeholders to submit comments on the public stakeholder meeting #4
material
24 March 2016 The ISO finalizes the comprehensive Transmission Plan and presents it to the ISO Board of
Governors for approval
25 End of March, 2016 ISO posts the Final Board-approved comprehensive Transmission Plan on its site

Schedule and Milestones (continued)
Page 5
Phase No Due Date 2015-2016 Activity
Ph
as
e
3
26 April 1, 2016 If applicable, the ISO will initiate the process to solicit proposals to finance, construct, and own
elements identified in the Transmission Plan eligible for competitive solicitation
Note: The schedule for Phase 3 will be updated and available to stakeholders
at a later date.

2015-2016 Transmission Planning Process
Study Plan
• Reliability Assessment to identify reliability-driven needs
• Local Capacity Requirements
– Near-Term; and
– Long-Term
• Special Studies
– 50% Renewable Energy Goal for 2030
– Over Generation Frequency Response Assessment
• 33% by 2020 renewable resource analysis to identify needed policy-
driven elements
• Economic Planning Study to identify needed economically-driven
elements
• Long-term Congestion Revenue Rights
Page 6

Study Information
• Final Study Plan will be published March 31st
• Base cases will be posted on the Market Participant
Portal (MPP)
– For reliability assessment in Q3
– For 33% renewable energy assessment in Q4
• Market notices will be sent to notify stakeholders of
meeting and any relevant information
• Stakeholder comments
– Stakeholders requested to submit comments to:
– Stakeholder comments are to be submitted within two weeks
after stakeholder meetings
– ISO will post comments and responses on website
Page 7

Coordination of input assumptions
• Coordinated with CEC and CPUC:
– CEC 2013 Integrated Energy Policy Report
• California Energy Demand Updated Final Forecast 2015-
2025
– Continued coordination between TPP and CPUC
LTPP
– ISO anticipates receiving the RPS portfolios for 2015-
2016 transmission planning process from the
CPUC/CEC in February
Page 8

Unified Planning Assumptions & Study Plan
50% Renewable Energy Goal for 2030 (Special Study)
2015-2016 Transmission Planning Process Stakeholder Meeting
Neil Millar
Executive Director, Infrastructure Development
February 23, 2015
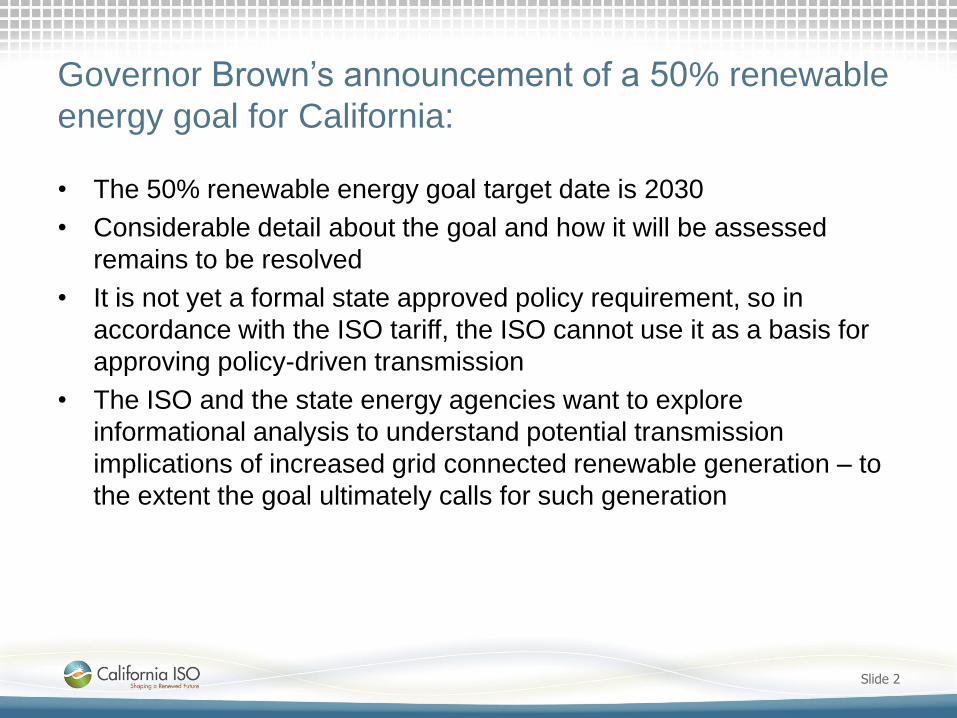
Governor Brown’s announcement of a 50% renewable
energy goal for California:
Slide 2
• The 50% renewable energy goal target date is 2030
• Considerable detail about the goal and how it will be assessed
remains to be resolved
• It is not yet a formal state approved policy requirement, so in
accordance with the ISO tariff, the ISO cannot use it as a basis for
approving policy-driven transmission
• The ISO and the state energy agencies want to explore
informational analysis to understand potential transmission
implications of increased grid connected renewable generation – to
the extent the goal ultimately calls for such generation

The ISO is therefore coordinating with the CPUC to
perform a special study in the 2015-2016 TPP:
• The special study will:
– be for information purposes only - will not be used to support a
need for policy-driven transmission in the 2015-2016 planning
cycle;
– provide information regarding the potential need for public policy-
driven transmission additions or upgrades to support a state
50% renewable energy goal; and
– will help inform the state’s procurement processes about the cost
impacts of achieving 50% renewable energy goal
• The CPUC raised this study and discussed underlying issues in the
recent February 10th and 11th RPS Calculator workshop
Slide 3

The Special Study will build on the 33% RPS work, but
explore different approaches:
• Purely as a “boundary” study assumption, the ISO anticipates
receiving a sensitivity portfolio based on a 50% RPS
• Transmission needs for 33% RPS have been based on providing full
capacity deliverability status, which reduced but did not preclude
possible curtailment
• In going beyond 33%, the special study will explore a new approach
and assume the incremental renewable generation to be energy-
only.
– The study will estimate the expected amount of congestion-
related curtailment of renewables that would likely result.
– The study will also consider what transmission could then be
rationalized based on cost effectively reducing renewables
curtailment (from a customer perspective)
Slide 4

Special Study - Schedule
• The ISO is coordinating with the CPUC on obtaining portfolios for
the 50% renewable energy goal to be used in the special study.
• Analysis will be initiated in August
• Preliminary results will be provided at the November TPP
stakeholder meeting.
Slide 5

Unified Planning Assumptions & Study Plan
Reliability Assessment
2015-2016 Transmission Planning Process Stakeholder Meeting
Catalin Micsa
Lead Regional Transmission Engineer
February 23, 2015

Planning Assumptions
• Reliability Standards and Criteria
– California ISO Planning Standards
– NERC Reliability Criteria
• TPL-001-4
• NUC-001-2.1
– WECC Regional Business Practices
• TPL-001-WECC-CRT-2.1
Page 2

Planning Assumptions
(continued)
• Study Horizon
– 10 years planning horizon
• near-term: 2016 to 2020
• longer-term: 2021 to 2025
• Study Years
• near-term: 2017 and 2020
• longer-term: 2025
Page 3

Study Areas
Page 4
• Northern Area - Bulk
• PG&E Local Areas:
– Humboldt area
– North Coast and North Bay
area
– North Valley area
– Central Valley area
– Greater Bay area:
– Greater Fresno area;
– Kern area;
– Central Coast and Los
Padres areas.
• Southern Area – Bulk
• SCE local areas:
– Tehachapi and Big Creek
Corridor
– North of Lugo area
– East of Lugo area;
– Eastern area; and
– Metro area
• SDG&E area
• Valley Electric Association area

Study Scenarios
Page 5
Study Area Near-term Planning Horizon Long-term
Planning Horizon
2017 2020 2025
Northern California (PG&E) Bulk System Summer Peak
Spring Off-Peak
Summer Peak
Summer Partial-Peak
Spring Light Load
Summer Peak
Spring Off-Peak
Humboldt Summer Peak
Winter Peak
Spring Off-Peak
Summer Peak
Winter Peak
Spring Light Load
Summer Peak
Winter Peak
North Coast and North Bay Summer Peak
Winter peak
Spring Off-Peak
Summer Peak
Winter Peak
Spring Light Load
Summer Peak
Winter peak
North Valley Summer Peak
Spring Off-Peak
Summer Peak
Spring Light Load
Summer Peak
Central Valley Summer Peak
Spring Off-Peak
Summer Peak
Spring Light Load
Summer Peak
Greater Bay Area Summer Peak
Winter peak
- (SF & Peninsula)
Spring Off-Peak
Summer Peak
Winter peak
- (SF & Peninsula)
Spring Light Load
Summer Peak
Winter peak
- (SF Only)
Greater Fresno Summer Peak
Spring Off-Peak
Summer Peak
Spring Light Load
Summer Peak
Kern Summer Peak
Spring Off-Peak
Summer Peak
Spring Light Load
Summer Peak
Central Coast & Los Padres Summer Peak
Winter Peak
Spring Off-Peak
Summer Peak
Winter Peak
Spring Light Load
Summer Peak
Winter Peak
Southern California Bulk Transmission
System
Summer Peak
Spring Off-Peak
Summer Peak
Spring Light Load
Summer Peak
Summer Partial-Peak
Southern California Edison (SCE) area Summer Peak
Spring Off-Peak
Summer Peak
Summer Light Load
Summer Peak
San Diego Gas & Electric (SDG&E) area Summer Peak
Spring Off-Peak
Summer Peak
Spring Light Load
Summer Peak
Valley Electric Association Summer Peak
Summer Off-Peak
Summer Peak
Summer Light Load
Summer Peak

Reliability Assessment Sensitivity Studies
Sensitivity Study Near-term Planning Horizon Long-Term
Planning Horizon
2017 2020 2025
Summer Peak with high CEC
forecasted load - -
PG&E Local Areas
SCE Metro
SCE Northern
SDG&E Area
Summer Peak with heavy renewable
output -
PG&E Bulk
PG&E Local Areas
SCE Bulk
SCE Northern
SCE North of Lugo
SCE East of Lugo
SCE Eastern
SDG&E Area
-
Summer Off-peak with heavy
renewable output
(generation addition)
- VEA Area -
Summer Peak with OTC plants
replaced
- SCE Metro Area -
Summer Peak with low hydro output
- SCE Northern Area -
Retirement of QF Generations
- - PG&E Local Areas
Page 6

Contingency Analysis
• Normal conditions (P0)
• Single contingency (Category P1)
– The assessment will consider all possible Category P1 contingencies based
upon the following: • Loss of one generator (P1.1)
• Loss of one transmission circuit (P1.2)
• Loss of one transformer (P1.3)
• Loss of one shunt device (P1.4)
• Loss of a single pole of DC lines (P1.5)
• Loss of both poles of the Pacific DC Intertie (WECC exemption)
• Single contingency (Category P2)
– The assessment will consider all possible Category P2 contingencies based
upon the following: • Loss of one transmission circuit without a fault (P2.1)
• Loss of one bus section (P2.2)
• Loss of one breaker (internal fault) (non-bus-tie-breaker) (P2.3)
• Loss of one breaker (internal fault) (bus-tie-breaker) (P2.4)
Page 7

Contingency Analysis
(continued)
• Multiple contingency (Category P3)
– The assessment will consider the Category P3 contingencies with the loss of a
generator unit followed by system adjustments and the loss of the following: • Loss of one generator (P3.1)
• Loss of one transmission circuit (P3.2)
• Loss of one transformer (P3.3)
• Loss of one shunt device (P3.4)
• Loss of a single pole of DC lines (P3.5)
• Loss of both poles of the Pacific DC Intertie (WECC exemption)
• Multiple contingency (Category P4)
– The assessment will consider the Category P4 contingencies with the loss of
multiple elements caused by a stuck breaker (non-bus-tie-breaker for P4.1-P4.5)
attempting to clear a fault on one of the following: • Loss of one generator (P4.1)
• Loss of one transmission circuit (P4.2)
• Loss of one transformer (P4.3)
• Loss of one shunt device (P4.4)
• Loss of one bus section (P4.5)
• Loss of a bus-tie-breaker (P4.6)
Page 8

Contingency Analysis
(continued) • Multiple contingency (Category P5)
– The assessment will consider the Category P5 contingencies with delayed fault
clearing due to the failure of a non-redundant relay protecting the faulted element
to operate as designed, for one of the following: • Loss of one generator (P5.1)
• Loss of one transmission circuit (P5.2)
• Loss of one transformer (P5.3)
• Loss of one shunt device (P5.4)
• Loss of one bus section (P5.5)
• Multiple contingency (Category P6)
– The assessment will consider the Category P6 contingencies with the loss of two
or more (non-generator unit) elements with system adjustment between them,
which produce the more severe system results.
• Multiple contingency (Category P7)
– The assessment will consider the Category P7 contingencies for the loss of a
common structure as follows: • Any two adjacent circuits on common structure14 (P7.1)
• Loss of a bipolar DC lines (P7.2)
Page 9

Contingency Event Table
New
Category
Old Category Description
P0 Cat A System intact
P1
Cat B Single contingency
(Fault of a shunt device- fixed, switched or SVC/STATCOM is new)
P2 Cat C1, C2 Single event which may result in multiple element outage. Open line
w/o fault, bus section fault, internal breaker fault
P3 Cat C31 Loss of generator unit followed by system adjustments + P1. No load
shed is allowed
P4 Cat C Fault + stuck breaker events
P5 n/a Fault + relay failure to operate (new)
P6 Cat C3 Two overlapping singles (not generator)
P7 Cat C5, C4 Common tower outages; loss of bipolar DC
Page 10
1. Loss of generator unit followed by system adjustment + line outage was and ISO Category B

Contingency Analysis
(continued)
• Extreme contingencies (TPL-001-4)
– As a part of the planning assessment the ISO assesses Extreme Event
contingencies per the requirements of TPL-001-4;
• however the analysis of Extreme Events will not be included within the
Transmission Plan unless these requirements drive the need for mitigation
plans to be developed.
Page 11

Base Case Assumptions
• WECC base cases will be used as the starting point to
represent the rest of WECC
• Transmission Assumptions
• ISO-approved transmission projects
• Transmission upgrades to interconnect new modeled
generation
Page 12

Generation Assumptions
• One-year operating cases
• 2-5-year planning cases
• Generation that is under construction (Level 1) and has a
planned in-service date within the time frame of the study;
• Conventional generation in pre-construction phase with
executed LGIA and progressing forward will be modeled off-
line but will be available as a non-wire mitigation option.
• CPUC’s discounted core and ISO’s interconnection
agreement status will be utilized as criteria for modeling
specific renewable generation
• 6-10-year planning cases
• CPUC RPS portfolio generation included in the baseline
scenario
• Retired generation is modeled in appropriate study areas
Page 13

New CEC approved resources
Page 14
PTO Area Project Capacity
(MW)
First Year
to be
Modeled
PG&E Oakley Generation Station (Construction) 624 2018
SCE Blyth Solar Energy Center (Construction) 485 2015
Huntington Beach Energy Project (Pre-Construction) 939 2019
SDG&E Carlsbad (Pre-Construction) 633 2018
Pio Pico Energy Center (Pre-Construction) 318 2017
Note: The ISO will be conducting the studies in the 2015-2016 TPP with Oakley, Huntington Beach Energy and
Carlsbad off-line in the base case. The ISO will may also conduct sensitivity studies with these generating
station resources on-line as needed.

Generation Retirements
• Nuclear Retirements
– Diablo Canyon will be modeled on-line and is assumed to have
obtained renewal of licenses to continue operation
• Once Through Cooled Retirements
– separate slide below for OTC assumptions
• Renewable and Hydro Retirements
– Assumes these resource types stay online unless there is an
announced retirement date.
• Other Retirements
– Unless otherwise noted, assumes retirement based resource
age of 40 years or more.
Page 15

Generation Retirements
Page 16
PTO Area Project Capacity
(MW)
First Year
to be
retired
PG&E
GWF Power Systems 1-5 100 2013
Morro Bay 3 325 2014
Morro Bay 4 325 2014
SCE
SONGS 2 & 3 2246 2013
El Segundo 3 335 2013
Huntington Beach 3 & 4 450 2013
McGen 118 2014
Kerrgen 26 2014
SDG&E
Kearny Peakers 135 2017
Miramar GT1 and GT2 36 2017
El Cajon GT 16 2017
OTC Generation
OTC Generation: Modeling of the once-through cooled
(OTC) generating units follows the State Water Resources
Control Board (SWRCB)’s Policy on OTC plants with the
following exception:
– Base-load Diablo Canyon Power Plant (DCPP)
nuclear generation units are modeled on-line;
– Generating units that are repowered, replaced or
having firm plans to connect to acceptable cooling
technology, as illustrated in Table 4-4; and
– All other OTC generating units will be modeled off-line
beyond their compliance dates, as illustrated in Table
4-4
Page 17

Renewable Dispatch
• The ISO has done a qualitative and quantitative
assessment of hourly Grid View renewable output for
stressed conditions during hours and seasons of
interest.
• Available data of pertinent hours was catalogued by
renewable technology and location on the grid.
• The results differ somewhat between locations and
seasons and was assigned to four areas of the grid:
PG&E, SCE, SDG&E and VEA.
Page 18

Load Forecast
• California Energy Demand Updated Final Forecast 2015-2025
adopted by California Energy Commission (CEC) on January 14,
2015 (posted February 9, 2015) will be used:
• Using the Mid Case LSE and Balancing Authority Forecast
spreadsheet of January 20, 2015
– Additional Achievable Energy Efficiency (AAEE)
• Consistent with CEC 2013 IEPR
• Mid AAEE will be used for system-wide studies
• Low-Mid AAEE will be used for local studies
– CEC forecast information is available on the CEC website at:
http://www.energy.ca.gov/2014_energypolicy/documents/index.html#adoptedfor
ecast
Page 19

Load Forecast
(continued)
• The following are how load forecasts are used for each
of the reliability assessment studies.
– 1-in-10 load forecasts will be used in PG&E, SCE, SDG&E, and
VEA local area studies including the studies for the LA Basin/San
Diego local capacity area.
– 1-in-5 load forecast will be used for bulk system studies
• Methodologies used by PTOs to create bus-level load
forecast were documented in the draft Study Plan
Page 20

Load Forecast Methodology
PG&E
• PG&E creates bus-level load forecast (using CEC
forecast as the starting point)
– PG&E loads in the base case
• Determination of Division Loads
• Allocation of Division Load to Transmission Bus Level
– Muni Loads in Base Case
Page 21

Load Forecast Methodology
SCE
Page 22

Load Forecast Methodology
SDG&E
• Utilize CEC’s latest load forecast as the starting point
• SDGE’s methodology to create bus-level load forecast
– Actual peak loads on low side of each substation
bank transformer
– Normalizing factors applied for achieving weather
normalized peak
– Adversing factor applied to get the adverse peak
Page 23

Load Forecast Methodology
VEA
• Utilize CEC’s latest load forecast as the starting point
• VEA’s methodology to create bus-level load forecast
– Actual peak loads on low side of each substation bank
transformer
– Long range study and load plans
– Adjust as needed
Page 24

Demand Response, Energy Storage
and Distributed Generation
• Demand Response
– Two scenarios
• Consistent with 2012 LTTP Track 4 DR assumption
• Assuming all existing emergency DR programs will become fast-response
supply resources integrated into the ISO Market
– Allocated to bus-bar by method defined in D.12-12-010 or as provided by PTO
– Used as potential mitigation in those planning areas where reliability concerns
are identified
• Energy Storage
– Amounts consistent with D.13-10-040
– Not included in starting cases (no location data available)
– Identify most effective busses for potential development after reliability concerns
have been identified
• Distributed Generation
– Identified in Commercial Interest Portfolio
– Off-line in starting cases (conceptual data)
– Identify DG that would mitigate identified reliability concerns
Page 25

Major Path Flows
Northern area (PG&E system) assessment
Southern area (SCE & SDG&E system) assessment
Page 26
Path
Transfer
Capability/SOL
(MW)
Scenario in which
Path will be stressed
Path 26 (N-S) 4,000
Summer Peak PDCI (N-S) 3,100
Path 66 (N-S) 4,800
Path 15 (N-S) -5,400 Summer Off Peak
Path 26 (N-S_ -3,000
Path 66 (N-S) -3,675 Winter Peak
Path
Transfer
Capability/SOL
(MW)
Target Flows
(MW) Scenario in which Path will
be stressed
Path 26 (N-S) 4,000 4,000 Summer Peak
PDCI (N-S) 3,100 3,100
West of River (WOR) 11,200 5,000 to 11,200 N/A
East of River (EOR) 9,600 4,000 to 9,600 N/A
San Diego Import 2,850 2,400 to 3,500 Summer Peak
SCIT 17,870 15,000 to 17,870 Summer Peak

Study Methodology
• The planning assessment will consist of:
– Power Flow Contingency Analysis
– Post Transient Analysis
– Post Transient Stability Analysis
– Post Transient Voltage Deviation Analysis
– Voltage Stability and Reactive Power Margin Analysis
– Transient Stability Analysis
Page 27

Corrective Action Plans
• The technical studies mentioned in this section will be used for
identifying mitigation plans for addressing reliability concerns.
• As per ISO tariff, identify the need for any transmission additions or
upgrades required to ensure System reliability consistent with all
Applicable Reliability Criteria and CAISO Planning Standards.
– In making this determination, the ISO, in coordination with each
Participating TO with a PTO Service Territory and other Market
Participants, shall consider lower cost alternatives to the
construction of transmission additions or upgrades, such as:
• acceleration or expansion of existing projects,
• demand-side management,
• special protection systems,
• generation curtailment,
• interruptible loads,
• storage facilities; or
• reactive support
Page 28

Questions/Comments?
Slide 29

Unified Planning Assumptions & Study Plan
2015-2016 ISO Near-term LCR Studies
2015-2016 Transmission Planning Process Stakeholder Meeting
Catalin Micsa
Lead Regional Transmission Engineer
February 23, 2015

Scope plus Input Assumptions, Methodology and
Criteria
The scope of the LCR studies is to reflect the minimum resource capacity needed in transmission constrained areas in order to meet the established criteria.
Used for one year out (2016) RA compliance, as well as five year out look (2020) in order to guide LSE procurement.
For latest study assumptions, methodology and criteria see the October 30, 2014 stakeholder meeting. This information along with the 2016 LCR Manual can be found at: http://www.caiso.com/informed/Pages/StakeholderProcesses/LocalCapacityRequirementsProcess.aspx. Note: in order to meet the CPUC deadline for capacity procurement by
CPUC-jurisdictional load serving entities, the ISO will complete the LCR studies approximately by May 1, 2015.
Slide 2

3
General LCR Transparency
• Base Case Disclosure
– ISO has published the 2016 and 2020 LCR base cases on the ISO
Market Participant Portal
(https://portal.caiso.com/tp/Pages/default.aspx)
• Access requires WECC/ISO non-disclosure agreements
(http://www.caiso.com/1f42/1f42d6e628ce0.html)
• Publication of Study Manual (Plan)
– Provides clarity and allows for study verification
(http://www.caiso.com/Documents/2016LocalCapacityRequirementsFi
nalStudyManual.pdf)
• ISO to respond in writing to questions raised (also in writing) during
stakeholder process
(http://www.caiso.com/informed/Pages/StakeholderProcesses/LocalCa
pacityRequirementsProcess.aspx )

4
Summary of LCR Assumptions
• Assumptions consistent with ISO Reliability Assessment
– Transmission and generation modeled if on-line before June 1 for applicable year of study (January 1 for Humboldt – winter peaking)
– Use the latest CEC 1-in-10 peak load in defined load pockets
• CEC Mid forecast
• CEC Low-Mid AAEE
– Maximize import capability into local areas
– Maintain established path flow limits
– Units under long-term contract turned on first
– Maintain deliverability of generation and imports
– Fixed load pocket boundary
– Maintain the system into a safe operating range
– Performance criteria includes normal, single as well as double contingency conditions in order to establish the LCR requirements in a local area
– Any relevant contingency can be used if it results in a local constraint
– System adjustment applied (up to a specified limit) between two single contingencies

5
LCR Criteria
• The LCR study is a planning function that currently forecasts local
operational needs one year in advance
• The LCR study relies on both:
– ISO/NERC/WECC Planning Standards
– WECC Operating Reliability Criteria (ORC)
• Applicable Ratings Incorporate:
– ISO/NERC/WECC Planning Standards – Thermal Rating
– WECC ORC – Path Rating
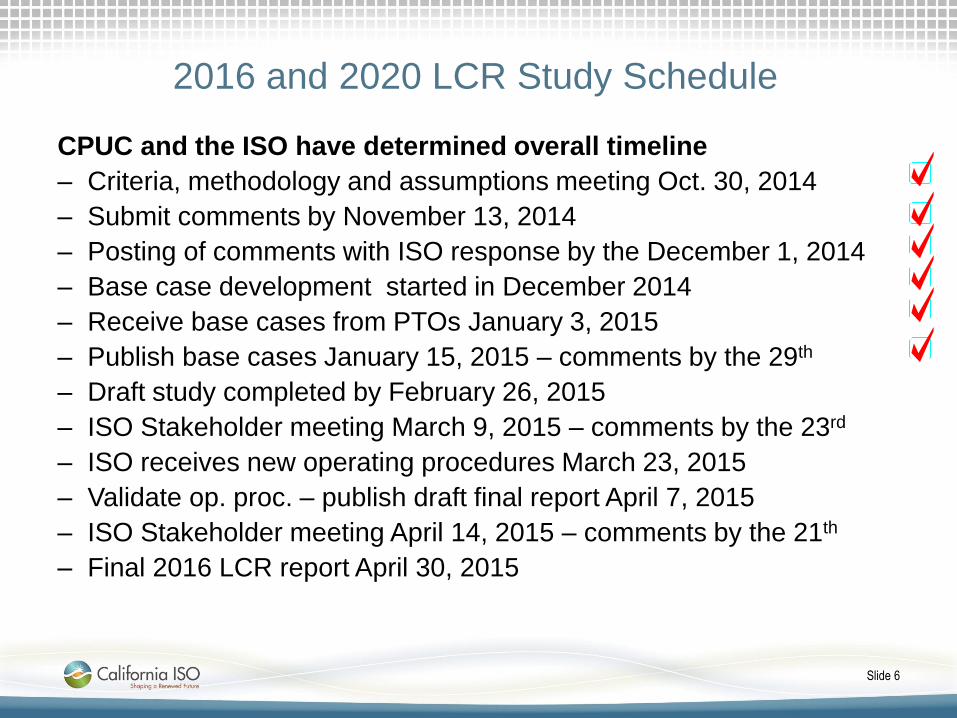
2016 and 2020 LCR Study Schedule
CPUC and the ISO have determined overall timeline
– Criteria, methodology and assumptions meeting Oct. 30, 2014
– Submit comments by November 13, 2014
– Posting of comments with ISO response by the December 1, 2014
– Base case development started in December 2014
– Receive base cases from PTOs January 3, 2015
– Publish base cases January 15, 2015 – comments by the 29th
– Draft study completed by February 26, 2015
– ISO Stakeholder meeting March 9, 2015 – comments by the 23rd
– ISO receives new operating procedures March 23, 2015
– Validate op. proc. – publish draft final report April 7, 2015
– ISO Stakeholder meeting April 14, 2015 – comments by the 21th
– Final 2016 LCR report April 30, 2015
Slide 6

Unified Planning Assumptions & Study Plan
ISO 2025 Long-Term LCR Studies for the LA
Basin/San Diego Local Areas
2015-2016 Transmission Planning Process Stakeholder Meeting
David Le
Senior Advisor Regional Transmission Engineer
February 23, 2015

2025 Long Term Local Capacity Requirement (LCR)
Studies for the Big Creek/Ventura and the LA Basin /
San Diego Areas Only
• Based on the alignment of the ISO transmission planning process with the CEC
Integrated Energy Policy Report (IEPR) demand forecast and the CPUC Long-
Term Procurement Plan (LTPP) proceeding, the long-term LCR assessment is to
be evaluated every two years.
• The 2014-2015 transmission planning process is the first year in which all ten
LCR areas within the ISO BAA were evaluated for long-term assessment.
• The 2016-2017 transmission planning process is the next planning process in
which all ten LCR areas will be evaluated for long-term needs.
• Due to critical nature of local capacity need for maintaining reliability in Southern
California, it is prudent to perform the long-term local capacity requirements
studies for the following LCR areas in this planning cycle:
– Big Creek/Ventura Area;
– LA Basin and San Diego Areas
Slide 2

Study Scope, Input Assumptions, Methodology
and Criteria
Slide 3
• Similar to the Near-Term Local Capacity Requirement (LCR) assessment
(http://www.caiso.com/Documents/Local%20capacity%20requirements%20process%20-
%20studies%20and%20papers), the Long-Term Capacity Requirement studies
focus on determining the minimum capacity requirements within each of the
local areas
– Scenario: local capacity requirement studies will be performed for year 10 of
the planning horizon (2025)
– Updated CPUC base portfolio for the 33% Renewable Portfolio Standards
(official RPS target at this time) will be included in the study cases
– Recently CEC-adopted 1-in-10 Mid demand forecast with Low-Mid
Additional Achievable Energy Efficiency (AAEE) will be used for the studies

Resource Retirements and Additions Assumptions
Slide 4
• The ISO will utilize the State Water Resources Control Board
(SWRCB)’s compliance schedule for assumptions on OTC generation
• Generating resources that are in service for forty years or older will be
retired
• For local capacity area reliability assessment, both the amounts
authorized by the CPUC from the Long Term Procurement Plan (LTPP)
Tracks 1 and 4 Decisions, as well as the amounts and locations of
resources from Load Serving Entities’ procurement selection will be
studied
– Specific projects that have received the CPUC-approved Power Purchase Tolling
Agreements (PPTAs) will be modeled in the study cases based on its latest
estimates of in-service dates

Summary of Generation Retirement Assumptions for Existing
Non-OTC Resources (Per CPUC LTPP Track 4 Scoping Ruling)
Generating Plant Total Plant
Capacity
(MW)
Individual Unit
Capacity (MW)
LCR Area SWRCB OTC
Compliance Date
Comments
Etiwanda
(Non-OTC)
640 Unit 3 (320)
Unit 4 (320)
LA Basin
N/A Aging power plant
assumptions (>40
yr.) per
CPUC LTPP
Track 4 Scoping
Ruling
Long Beach (Non-
OTC Refurbished
Plant)
260 Unit 1 (65)
Unit 2 (65)
Unit 3 (65)
Unit 4 (65)
LA Basin N/A Aging/refurbished
generating plant
retirement
assumptions per
CPUC LTPP Track
4 Scoping Ruling
Broadway Unit 3
(Non-OTC)
65 Unit 3 (65) LA Basin N/A Repowered as
Glenarm Unit 5 at
71 MW)
Cabrillo II (Non-
OTC)
188 El Cajon (16)
9-Kearny Mesa Units
(Total 136 MW)
2-Mira Mar Units
(Total 36 MW)
San Diego N/A Future retirements
(contracts
considered for
termination by
SDG&E in the
future)
Slide 5

Long-term LCR Study Areas for this Planning Cycle
Slide 6
• ISO will be
conducting
studies on three
LCR areas as
shown here
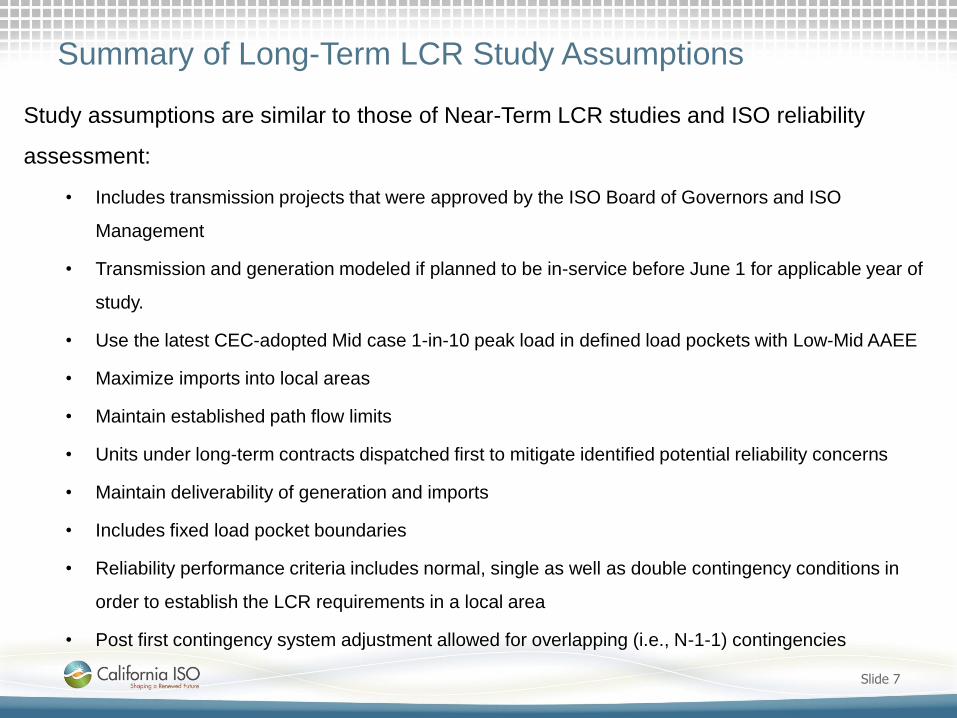
Summary of Long-Term LCR Study Assumptions
Slide 7
Study assumptions are similar to those of Near-Term LCR studies and ISO reliability
assessment:
• Includes transmission projects that were approved by the ISO Board of Governors and ISO
Management
• Transmission and generation modeled if planned to be in-service before June 1 for applicable year of
study.
• Use the latest CEC-adopted Mid case 1-in-10 peak load in defined load pockets with Low-Mid AAEE
• Maximize imports into local areas
• Maintain established path flow limits
• Units under long-term contracts dispatched first to mitigate identified potential reliability concerns
• Maintain deliverability of generation and imports
• Includes fixed load pocket boundaries
• Reliability performance criteria includes normal, single as well as double contingency conditions in
order to establish the LCR requirements in a local area
• Post first contingency system adjustment allowed for overlapping (i.e., N-1-1) contingencies
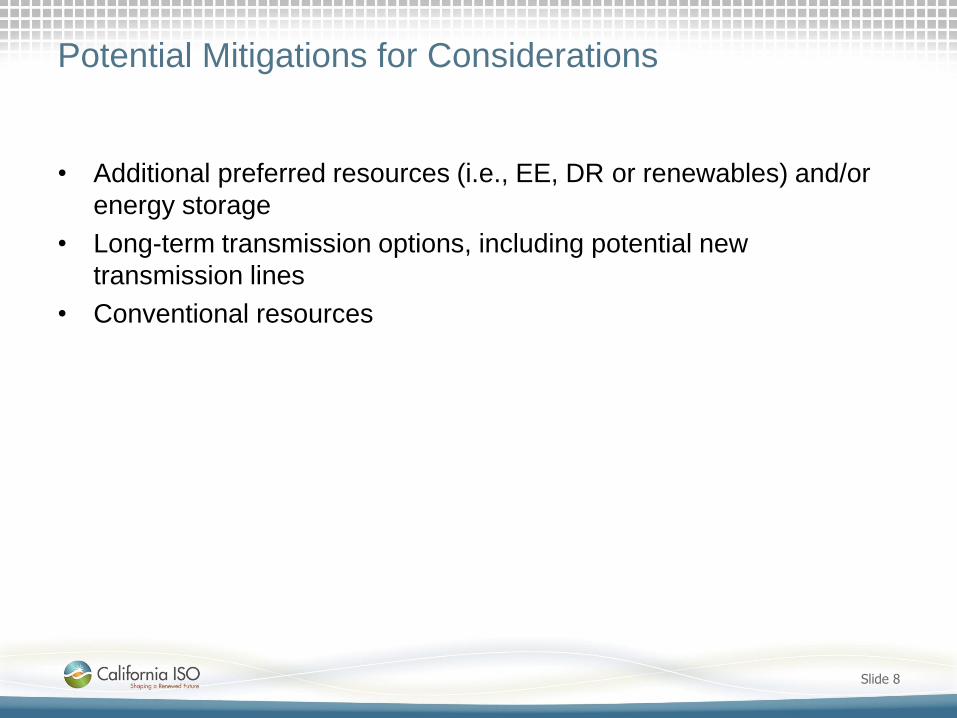
Potential Mitigations for Considerations
• Additional preferred resources (i.e., EE, DR or renewables) and/or
energy storage
• Long-term transmission options, including potential new
transmission lines
• Conventional resources
Slide 8

Questions/Comments?
Slide 9
Unified Planning Assumptions & Study Plan
Special Study – Over Generation Frequency
Response Assessment
2015-2016 Transmission Planning Process Stakeholder Meeting
Irina Green
Engineering Lead, Regional Transmission - North
February 23, 2015

2014-2015 Transmission Planning Process
• Conducted the initial studies of frequency response for potential over-
generation conditions with the following conclusions:
– Acceptable frequency performance within WECC; however, the
ISO’s frequency response was below the ISO frequency response
obligation specified in BAL-003-1
• Study results seem optimistic compared to actual system performance:
– Actual frequency responses for some contingencies were lower
than the dynamic model indicated
– Large headroom of responsive generation modeled in study case.
Slide 2

2014-2015 Transmission Planning Process
(continued)
– Headroom on responsive governors is a good indicator of the
Frequency Response Metric, but it is not the only indicator.
• Higher available headroom on a smaller number of governor
responsive resources can result in less frequency response than
lower available headroom on a larger number of governor
responsive resources for the same contingency.
– Further model validation is needed to ensure that governor
response in the simulations matches their response in the real life.
– Exploration of other sources of governor response is needed.
Slide 3

2015-2016 Transmission Planning Process
• The ISO will conduct further analysis to investigate measures to
improve the ISO frequency response post contingency.
– These measures may include the following:
• load response,
• response from storage: and frequency response from inverter-
based generation.
– Other contingencies may also need to be studied, as well as other
cases with reduced headroom.
– Future work will also include validation of models based on real-
time contingencies and studies with modeling of behind the meter
generation.
Slide 4

Continuous Supply and Demand Balance
Slide 5

Frequency Regulation –Governor Droop
Slide 6
Each generating unit will contribute to
system regulation according to the
overall gain set in the governor
control loop
Each governor is acting to control
speed, increasing power when
frequency is below the set point
Droop = Change in percent frequency
per change in percent output, e.g.,
f drops to 59.9 Hz, with 5% droop
setting, unit responds with ([60-
59.9]/60)/0.05 = 3.33% of rated power

Governor Response
Governor response has enormous impact on frequency regulation
Frequency regulation is largely impacted by operation (control modes,
load points, etc.)
Poor system frequency regulation can lead to load shedding, generator
trips
For meaningful studies of off nominal frequency events, it is essential to
properly characterize the response of each generator
Governors may be disabled, or operating at limit
Droop (governor gain) may be nonlinear
May be affected by ambient conditions
Has deadband
Slide 7

Non-summer months – net load pattern changes
significantly starting in 2014
Slide 8
Net load is the load that must be served by dispatchable resources
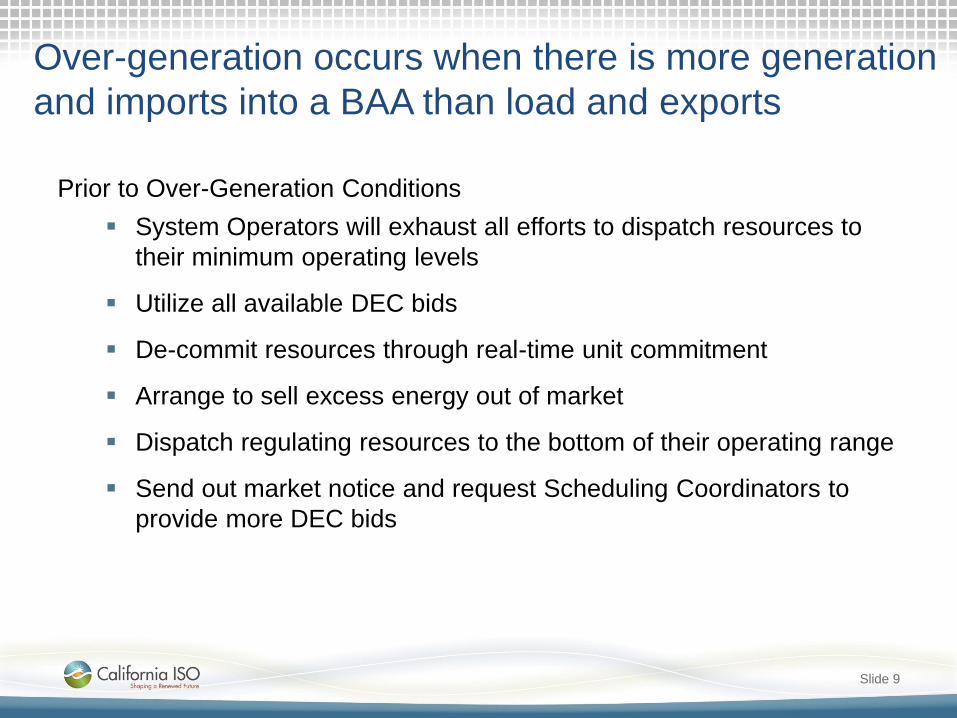
Over-generation occurs when there is more generation
and imports into a BAA than load and exports
Prior to Over-Generation Conditions
System Operators will exhaust all efforts to dispatch resources to
their minimum operating levels
Utilize all available DEC bids
De-commit resources through real-time unit commitment
Arrange to sell excess energy out of market
Dispatch regulating resources to the bottom of their operating range
Send out market notice and request Scheduling Coordinators to
provide more DEC bids
Slide 9

Study contingencies and metrics
Contingencies to be studied:
Simultaneous loss of two Palo Verde nuclear units – was studied in
2014-2015 TPP
Simultaneous loss of two Diablo Canyon nuclear units
PDCI bi-pole outage
Other?
The impact of unit commitment on frequency response
The impact of generator output level on governor response
Headroom or unloaded synchronized capacity
Speed of governor response
Number of generators with governors
Slide 10

Frequency Response Obligation (FRO)
Slide 11
Frequency Response (FR)
FRO for the Interconnection is established in BAL-003-1 Frequency
Response & Frequency Bias Setting Standard
For WECC FRO is 949 MW/0.1Hz
Balancing Authority FRO allocation
For the CAISO, FRO is approximately 30% of WECC FRO (285
MW/0.1HZ)

Frequency Performance Metrics
• Frequency Nadir
(Cf)
• Frequency Nadir
Time (Ct)
• Nadir-Based
Frequency
Response (Δ
MW/Δfc *0.1)
• Settling
Frequency (Bf)
• Settling
Frequency-Based
Frequency
Response (Δ
MW/Δfb *0.1)
Slide 12

Additional sensitivity studies
• Current load model - 20% of the load is modeled as induction motors
with typical parameters
• Composite load model
Slide 13

Questions/Comments?
Slide 14

Unified Planning Assumptions & Study Plan
2015-2016 ISO 33% RPS Transmission
Assessment
2015-2016 Transmission Planning Process Stakeholder Meeting
Sushant Barave
Senior Regional Transmission Engineer
February 23, 2015

Overview of the 33% RPS Transmission Assessment
in 2015-2016 Planning Cycle
• Objective
– Identify the policy driven transmission upgrades needed to meet
the 33% renewable resource goal
• Portfolios
– CPUC/CEC portfolios
• Load Forecast
– CEC Mid 1-in-5 load forecast
– CEC Mid AAEE
• Methodology
– Power flow and stability assessments
– Production cost simulations
– Deliverability assessments
Page 2

Portfolios
• In accordance with tariff Section 24.4.6.6, the renewable
portfolios and justification for policy driven upgrades will
reflect considerations, including but not limited to,
environmental impact, commercial interest, risk of
stranded investment, and comparative cost of
transmission alternatives
• The TPP portfolios are developed by CPUC and CEC
and are expected to be submitted to the ISO in
February/March, 2015
– The RPS portfolio submission letter will be posted on the ISO
2015-2016 Transmission Planning website
Page 3

Portfolios
• The ISO expects to see two portfolios for the 2015-2016
TPP:
– Commercial Interest (base case); and
– High DG
• These portfolios, or additional ones if included with the
CPUC submittal to the ISO, will be assessed in the ISO
33% RPS Transmission Assessments
Page 4

Methodology – Production Simulation
• Conduct production simulation for each of the developed
portfolios using the ISO unified economic assessment
database
• The production simulation results are used to inform the
development of power flow scenarios for the power flow
and stability assessments
Page 5

Methodology –Power Flow and Stability Assessments
• Power flow contingency analysis
• Voltage stability assessment (Voltage deviation, Reactive
Power Margin, PV/QV analysis)
• Transient stability (Voltage deviation, Frequency
deviation, stability)
Page 6

Methodology –Deliverability Assessment
• Follow the same methodology as used in GIP
• Deliverability for the base portfolio and sensitivity
portfolios as needed
Page 7

Modeling Portfolios
• Model base commercial interest portfolio in the reliability
peak and off-peak base cases for 2024
• Create additional stressed power flow models for peak,
off-peak for commercial interest and additional portfolios.
• Representative GIP study data used if an equivalent
resource could be matched; otherwise generic model
and data will be used
Page 8

Q &A
Page 9

Unified Planning Assumptions & Study Plan
Economic Planning Studies
2015-2016 Transmission Planning Process Stakeholder Meeting
Yi Zhang
Regional Transmission Engineer Lead
February 23, 2015
Page 2
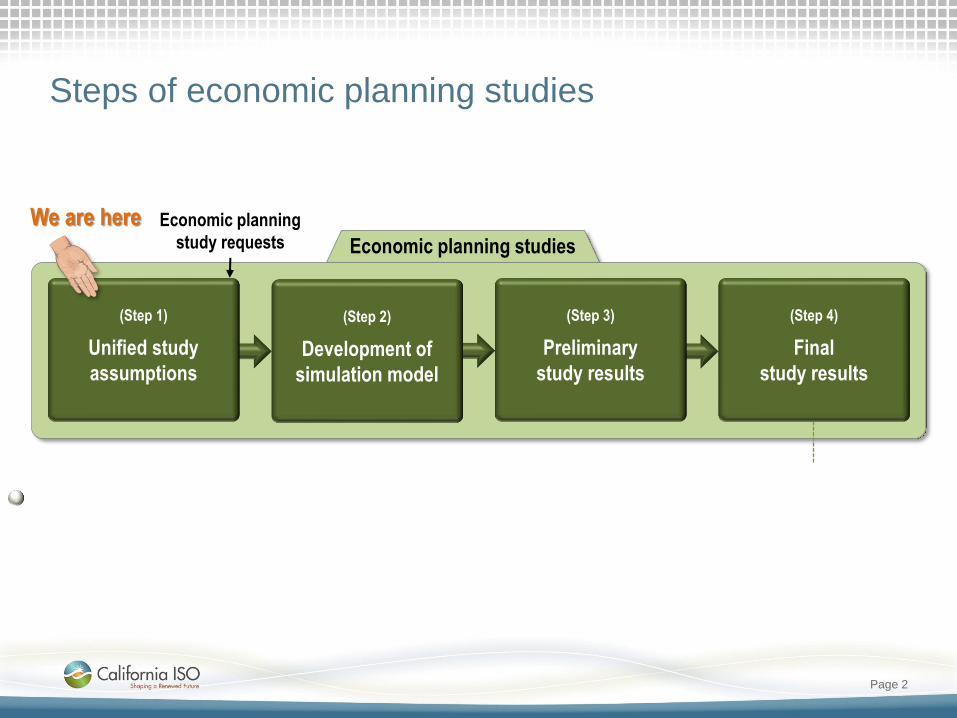
Economic planning studies
(Step 4)
Final
study results
We are here
(Step 1)
Unified study
assumptions
(Step 3)
Preliminary
study results
(Step 2)
Development of
simulation model
Economic planning
study requests
Steps of economic planning studies

Page 3
Economic planning study
• Database development for production cost simulation
• Production cost simulation and congestion analysis
– Will be conducted on years 2020 and 2025
• Selection of high priority studies
– Rank congestion by severity
– Consider economic study requests
– Determines five high priority studies
• Detail production cost simulation and financial analysis
for high priority studies

Page 4
Assumptions for database development – base case Category Type 2015~2016 cycle
Starting database Latest available TEPPC database release (now is TEPPC 2024
V1.4 )
Load
In-state load California Energy Demand Updated Final Forecast 2015-2025
adopted by California Energy Commission (CEC)
Out-of-state load Load in the latest available TEPPC database release
Load profiles TEPPC profiles
Load distribution Four seasonal load distribution patterns
Generation
RPS CPUC/CEC 2015 RPS portfolios
Once-Thru-Cooling ISO 2015 Unified Study Assumptions
Natural gas units ISO 2015 Unified Study Assumptions
Natural gas prices CEC 2015 IEPR
Other fuel prices TEPPC fuel prices
GHG prices CEC 2015 IEPR
Transmission
Reliability upgrades Approved projects
Policy upgrades Approved projects
Economic upgrades Approved projects
Other models EIM

Page 5
Economic planning study request
• Economic Planning Study Requests are to be submitted
to the ISO during the comment period of the draft Study
Plan.
– February 23 to March 9, 2015
• The ISO will consider the Economic Planning Study
Requests as identified in section 24.3.4.1 of the ISO
Tariff.
• In evaluation of the congestion and review of the study
requests, the ISO will determine the high priority studies
during the 2015-2016 transmission planning cycle.

Page 6
For written comments, please send to: [email protected]
Thanks! Your questions and comments are welcome

Unified Planning Assumptions & Study Plan
Next Steps
2015-2016 Transmission Planning Stakeholder Meeting
Jeff Billinton
Manager, Regional Transmission - North
February 23, 2015

Next Steps – Major Milestones in 2015-2016 TPP
Page 2
Date Milestone
Phase 1
February 23 – March 9,
2015
Stakeholder comments and economic planning study requests
to be submitted to [email protected]
March 31, 2015 Post Final 2015-2016 Study Plan
Phase 2
August 15, 2015 Post Reliability Results
August 15 - October 15,
2015
Request Window
September 21 – 22,
2015
Stakeholder Meeting – Reliability Results and PTO proposed
mitigation
November 16 - 17, 2015 Stakeholder Meeting – Policy and Economic Analysis
January 2016 Post Draft 2015-2016 Transmission Plan
February 2016 Stakeholder Meeting – Draft 2015-2016 Transmission Plan
End of March 2016 Post Final 2015-2016 Transmission Plan