Embed Size (px)
Citation preview

Corporate Presentation
Quarter I ended June, 2021

Our Journey
19821st Integrated Plant at Sirohi,
Total Capacity - 0.5 Mn MT
2001Capacity Augmentation at Sirohi,
Capacity – 2.4 Mn MT
2009Capacity Addition at Sirohi,
Capacity – 4.2 Mn MT
2009Kalol Grinding Unit Commissioned – 0.5 Mn MT,
Total Capacity – 4.7 Mn MT
2012Jharli GU Commissioned –1.3 Mn MT,
Total Capacity – 6.0 Mn MT
20152nd Integrated Plant at Durg – 1.8 Mn MT,
Total Capacity – 7.8 Mn MT
1

Our Journey
2015Capacity Addition at Sirohi –0.5 Mn MT,
Total Capacity – 8.3 Mn MT
2016Capacity Addition at Kalol –0.3 Mn MT,
Total Capacity – 8.6 Mn MT
2017Surat GU Commissioned –1.4 Mn MT,
Total Capacity – 10.0 Mn MT
2017Capacity Addition at Durg –0.9 Mn MT,
Total Capacity – 10.9 Mn MT
2017Successfully commissioned integrated plant of 1.6 Mn MT under Company’s subsidiary - UCWL,
Total Capacity – 12.5 Mn MT
2019Odisha GU Commissioned – 0.8 Mn MT,
Total Capacity – 13.30 Mn MT
2

Our Journey
3
2021
Capacity at UCWL Plant increased from 1.6 Mn MT to 2.2 Mn MT
(June’21).
Total Capacity – Approx. 14 Mn MT (June’21)
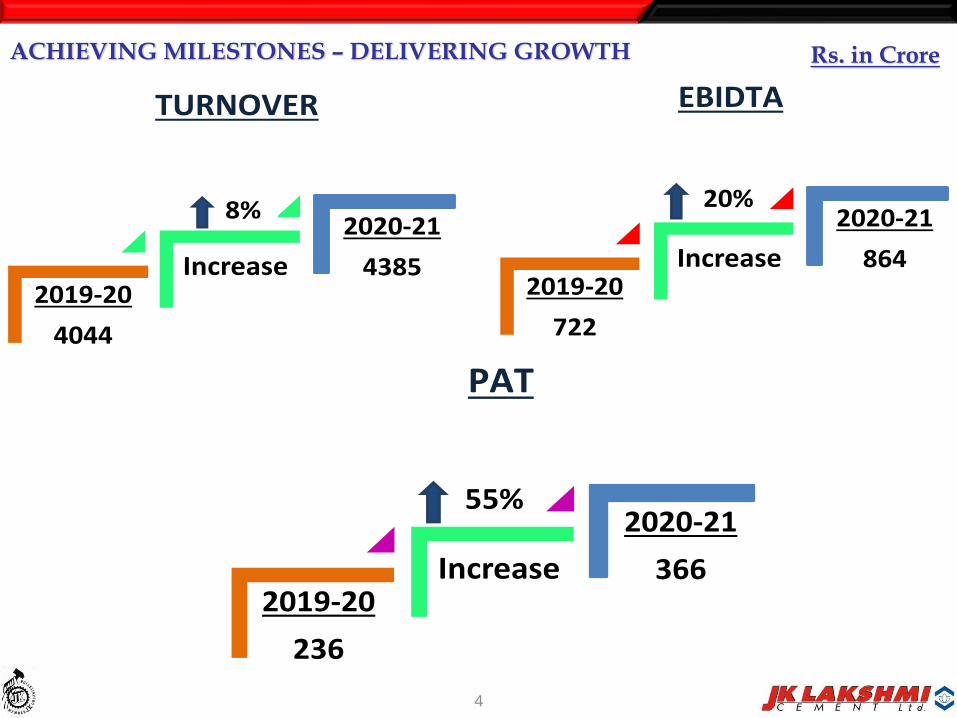
ACHIEVING MILESTONES – DELIVERING GROWTH
4
Rs. in Crore
2019-20
4044
Increase
TURNOVER
2020-21
4385
8%
2019-20
722
Increase
EBIDTA
2020-21
864
20%
2019-20
236
Increase
PAT
2020-21
366
55%
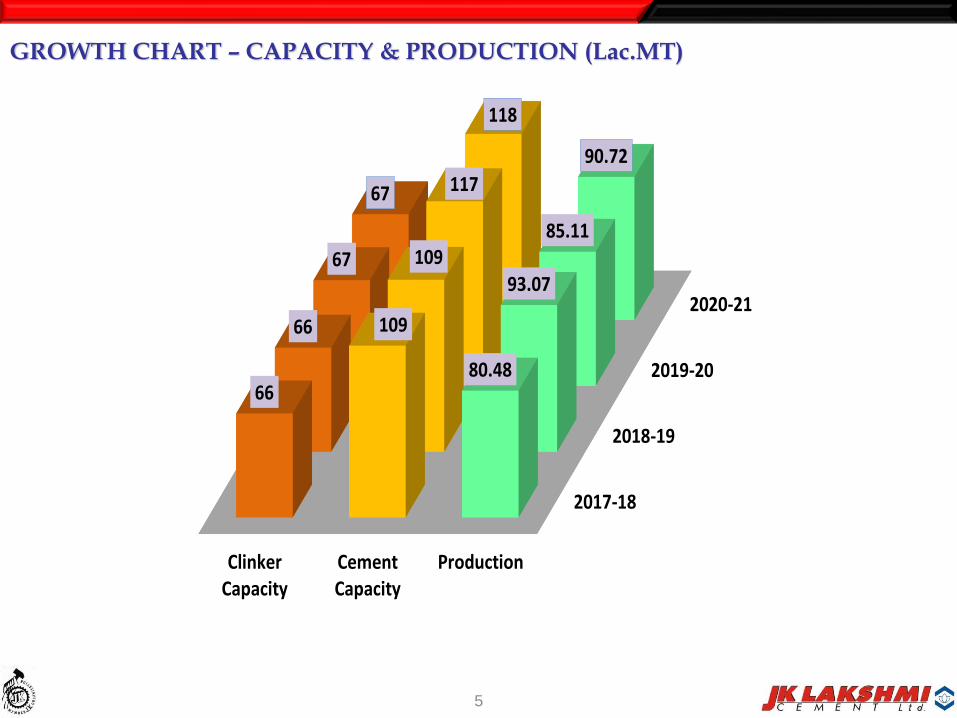
GROWTH CHART – CAPACITY & PRODUCTION (Lac.MT)
5
2017-18
2018-19
2019-20
2020-21
ClinkerCapacity
CementCapacity
Production
66
109
80.48
66
10993.07
67
117
85.11
67
118
90.72

CAPTIVE POWER CAPACITY
6
WHR18%
SOLAR17%
TPP65%
15 14
54
North - Captive Power (83 MW)
WHR24%
SOLAR15%
TPP61%
85
20
East - Captive Power (33 MW)
WHR20%
SOLAR16%
TPP64%
23 19
74
Total - Captive Power (116 MW)

MOTHER PLANTS – CEMENT (CLINKER) Mn. MT
7
Jaykaypuram
Durg
Kalol(Grinding Unit)
Jharli(Grinding Unit
& AAC Block)
Surat(Grinding Unit)
1.30
4.75 (5.00)
0.90
1.352.70 (2.00)
Odisha(Grinding Unit)
0.80
2.20 (1.50)
UCWL
Capacity (Mn. MT) Capacity (Mn. MT)
Zone Cement Clinker
JKLC
North 8.30 5.00
East 3.50 2.00
Sub-Total 11.80 7.00
UCWL 2.20 1.50
Total 14.00 8.50
8
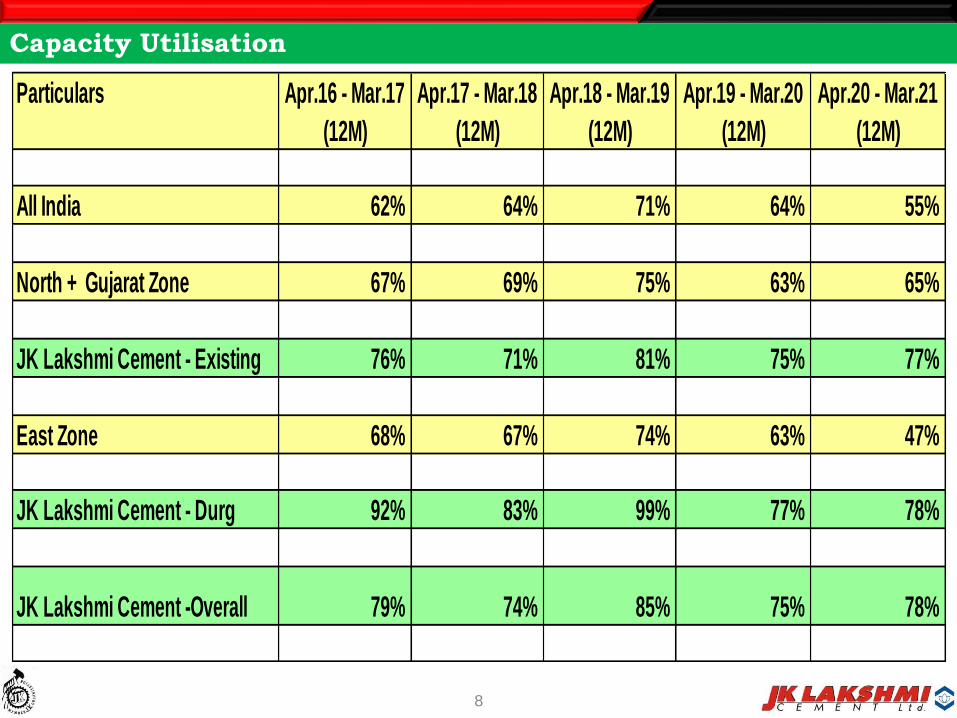
Capacity Utilisation
Particulars Apr.16 - Mar.17 Apr.17 - Mar.18 Apr.18 - Mar.19 Apr.19 - Mar.20 Apr.20 - Mar.21
(12M) (12M) (12M) (12M) (12M)
All India 62% 64% 71% 64% 55%
North + Gujarat Zone 67% 69% 75% 63% 65%
JK Lakshmi Cement - Existing 76% 71% 81% 75% 77%
East Zone 68% 67% 74% 63% 47%
JK Lakshmi Cement - Durg 92% 83% 99% 77% 78%
JK Lakshmi Cement -Overall 79% 74% 85% 75% 78%
9
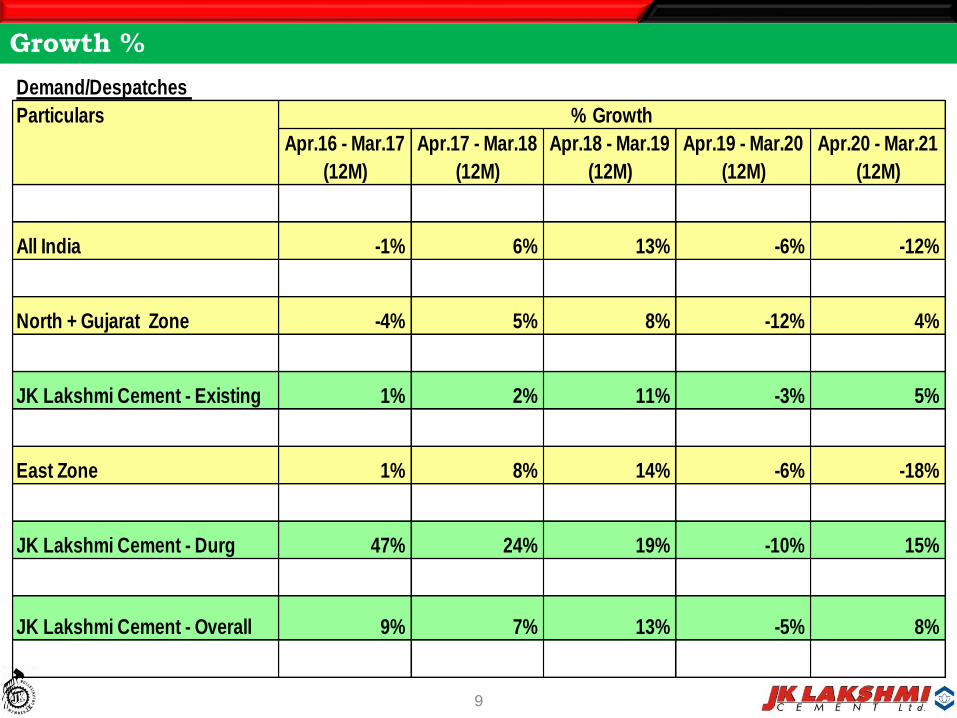
Growth %
Demand/Despatches
Particulars % Growth
Apr.16 - Mar.17 Apr.17 - Mar.18 Apr.18 - Mar.19 Apr.19 - Mar.20 Apr.20 - Mar.21
(12M) (12M) (12M) (12M) (12M)
All India -1% 6% 13% -6% -12%
North + Gujarat Zone -4% 5% 8% -12% 4%
JK Lakshmi Cement - Existing 1% 2% 11% -3% 5%
East Zone 1% 8% 14% -6% -18%
JK Lakshmi Cement - Durg 47% 24% 19% -10% 15%
JK Lakshmi Cement - Overall 9% 7% 13% -5% 8%
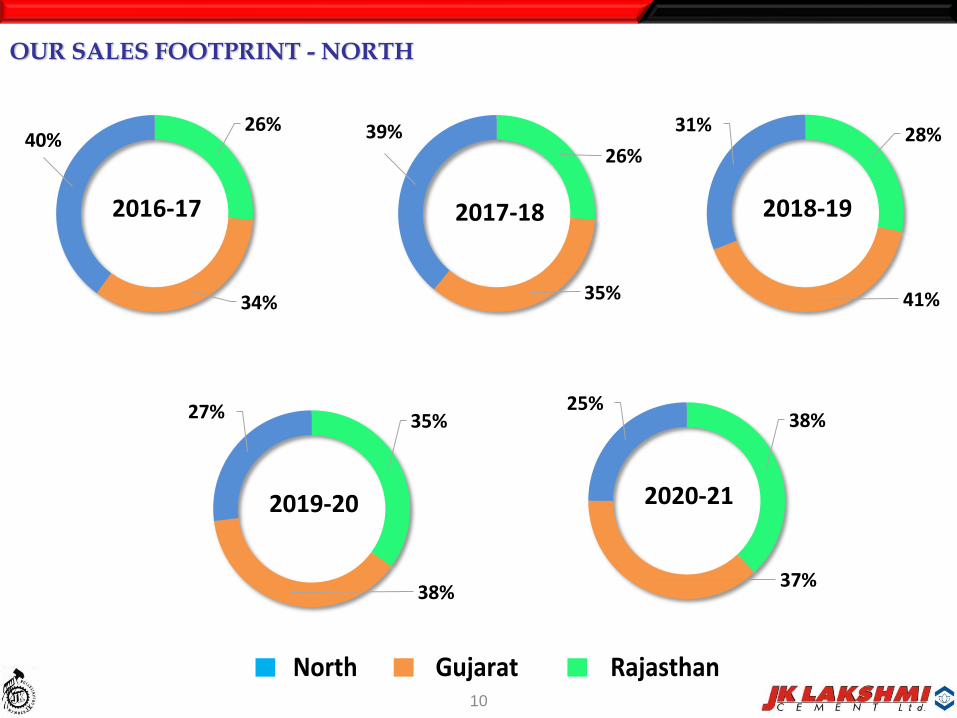
OUR SALES FOOTPRINT - NORTH
10
26%
34%
40%
2016-17
26%
35%
39%
2017-18
28%
41%
31%
2018-19
35%
38%
27%
2019-20
38%
37%
25%
2020-21
RajasthanGujaratNorth
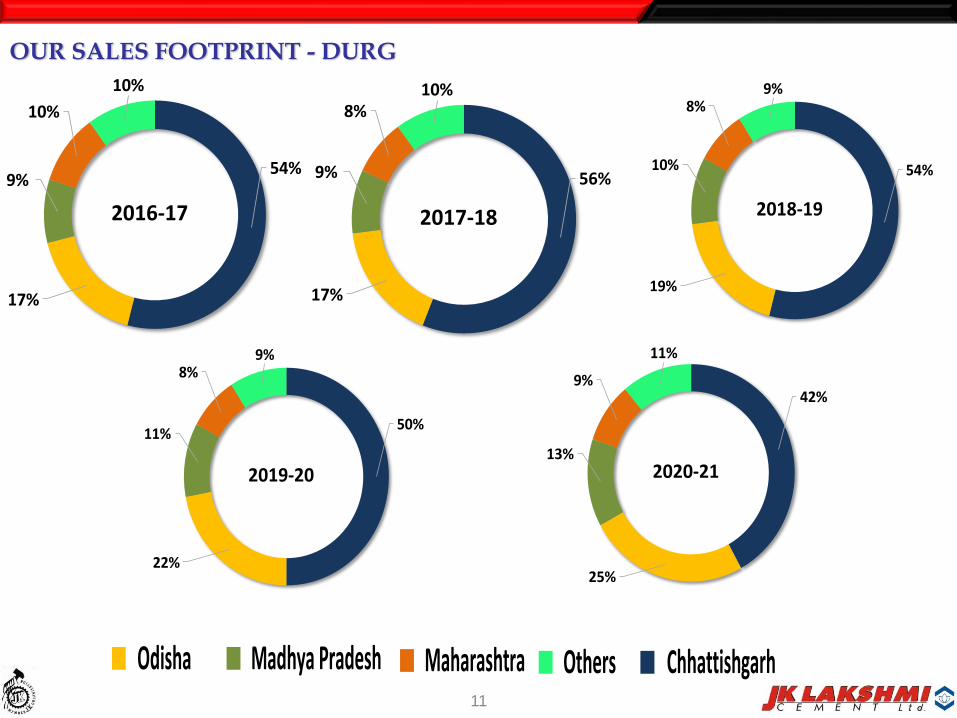
OUR SALES FOOTPRINT - DURG
11
54%
17%
9%
10%
10%
2016-17
56%
17%
9%
8%10%
2017-18
54%
19%
10%
8%9%
2018-19
50%
22%
11%
8%9%
2019-20
42%
25%
13%
9%
11%
2020-21
ChhattishgarhOdisha Madhya Pradesh Maharashtra Others

FINANCIAL HIGHLIGHTS FOR 3 MONTHS ENDED
12
Sl. Particulars Unit For 3 Months ended Incr./Decr.(-)
No. 30.06.2021 30.06.2020 Figures %
1 Net Sales Rs. in Cr. 1232 825 406 49%
2 PBIDT (after Other Income) Rs. in Cr. 233 152 81 54%
3 PBDT Rs. in Cr. 207 114 94 82%
4 PBT (after Exceptional Items) Rs. in Cr. 161 65 96 147%
5 PAT Rs. in Cr. 119 44 74 167%
6 Total CI after Tax Rs. in Cr. 119 45 75 167%
7 OPM (on Net Sales) % 18% 17% 1%
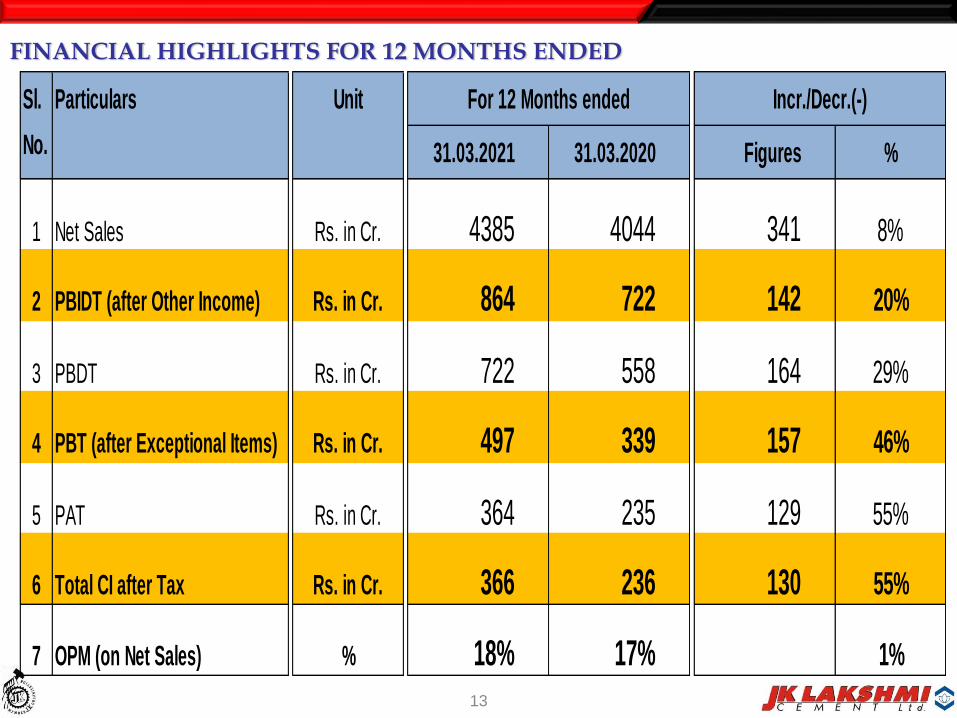
FINANCIAL HIGHLIGHTS FOR 12 MONTHS ENDED
13
Sl. Particulars Unit For 12 Months ended Incr./Decr.(-)
No. 31.03.2021 31.03.2020 Figures %
1 Net Sales Rs. in Cr. 4385 4044 341 8%
2 PBIDT (after Other Income) Rs. in Cr. 864 722 142 20%
3 PBDT Rs. in Cr. 722 558 164 29%
4 PBT (after Exceptional Items) Rs. in Cr. 497 339 157 46%
5 PAT Rs. in Cr. 364 235 129 55%
6 Total CI after Tax Rs. in Cr. 366 236 130 55%
7 OPM (on Net Sales) % 18% 17% 1%
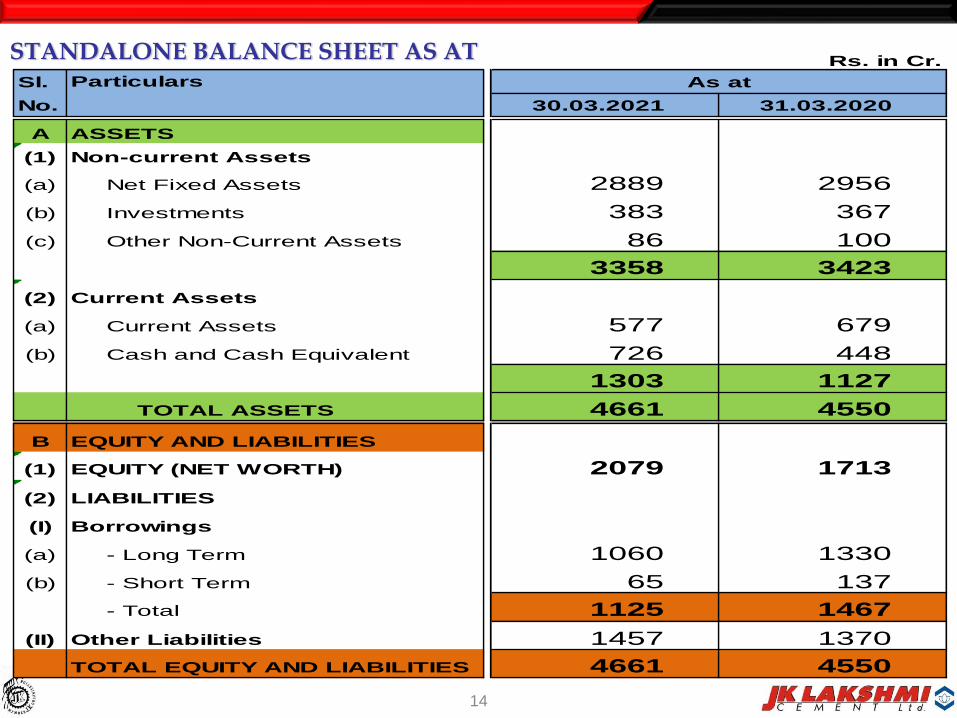
STANDALONE BALANCE SHEET AS AT
14
Rs. in Cr.
Sl. As at
No. 30.03.2021 31.03.2020
A ASSETS
(1) Non-current Assets
(a) Net Fixed Assets 2889 2956
(b) Investments 383 367
(c) Other Non-Current Assets 86 100
3358 3423
(2) Current Assets
(a) Current Assets 577 679
(b) Cash and Cash Equivalent 726 448
1303 1127
TOTAL ASSETS 4661 4550
B EQUITY AND LIABILITIES
(1) EQUITY (NET WORTH) 2079 1713
(2) LIABILITIES
(I) Borrowings
(a) - Long Term 1060 1330
(b) - Short Term 65 137
- Total 1125 1467
(II) Other Liabilities 1457 1370
TOTAL EQUITY AND LIABILITIES 4661 4550
Particulars

CONSOLIDATED BALANCE SHEET AS AT
15
Rs. in Cr.
Sl. As at
No. 31.03.2021 31.03.2020
A ASSETS
(1) Non-current Assets
(a) Net Fixed Assets 3701 3752
(b) Investments 15 14
(c) Other Non-Current Assets 88 141
3804 3907
(2) Current Assets
(a) Current Assets 649 780
(b) Cash and Cash Eqivalent 833 476
1482 1256
TOTAL ASSETS 5286 5163
B EQUITY AND LIABILITIES
(1) EQUITY (NET WORTH) 2107 1684
(2) LIABILITIES
(I) Borrowings
(a) - Long Term 1589 1851
(b) - Short Term 65 136
- Total 1654 1987
(II) Other Liabilities 1525 1492
TOTAL EQUITY AND LIABILITIES 5286 5163
Particulars

DEBT : EQUITY & DEBT : EBIDTA RATIO ( STANDALONE)
16
3.42
2.03
1.301.18
2.61
1.41
0.46 0.47
31.03.2019 31.03.2020 31.03.2021 30.06.2021
Gross Debt : EBIDTA Net Debt : EBIDTA
1.06
0.86
0.540.50
0.81
0.59
0.19 0.20
31.03.2019 31.03.2020 31.03.2021 30.06.2021
Debt : Equity Ratio Net Debt : Equity Ratio
DEBT : EQUITY RATIO DEBT : EBIDTA RATIO

DEBT : EQUITY & DEBT : EBIDTA RATIO ( CONSOLIDATED)
17
1.44
1.18
0.790.75
1.18
0.90
0.39 0.38
31.03.2019 31.03.2020 31.03.2021 30.06.2021
Debt : Equity Ratio Net Debt : Equity Ratio
DEBT : EQUITY RATIO 4.19
2.35
1.631.52
3.44
1.79
0.81 0.78
31.03.2019 31.03.2020 31.03.2021 30.06.2021
Gross Debt : EBIDTA Net Debt : EBIDTA
DEBT : EBIDTA RATIO
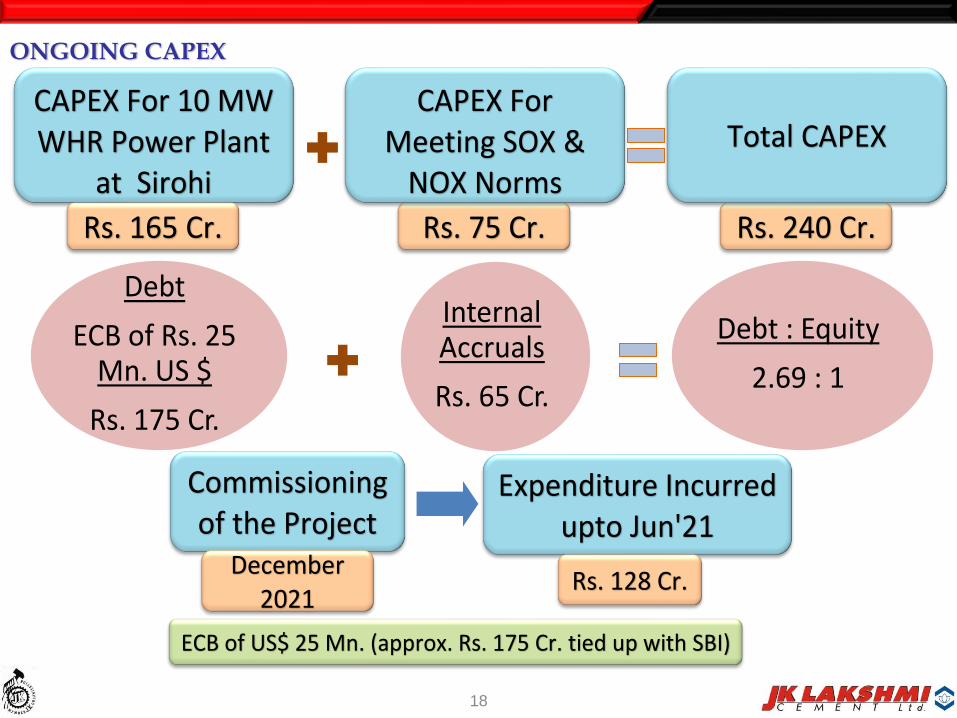
ONGOING CAPEX
18
Rs. 75 Cr. Rs. 240 Cr.
CAPEX For 10 MW WHR Power Plant
at Sirohi
Rs. 165 Cr.
CAPEX For Meeting SOX &
NOX Norms
Total CAPEX
Debt
ECB of Rs. 25 Mn. US $
Rs. 175 Cr.
Internal Accruals
Rs. 65 Cr.
Debt : Equity
2.69 : 1
Commissioning of the Project
December 2021
Expenditure Incurred upto Jun'21
Rs. 128 Cr.
ECB of US$ 25 Mn. (approx. Rs. 175 Cr. tied up with SBI)
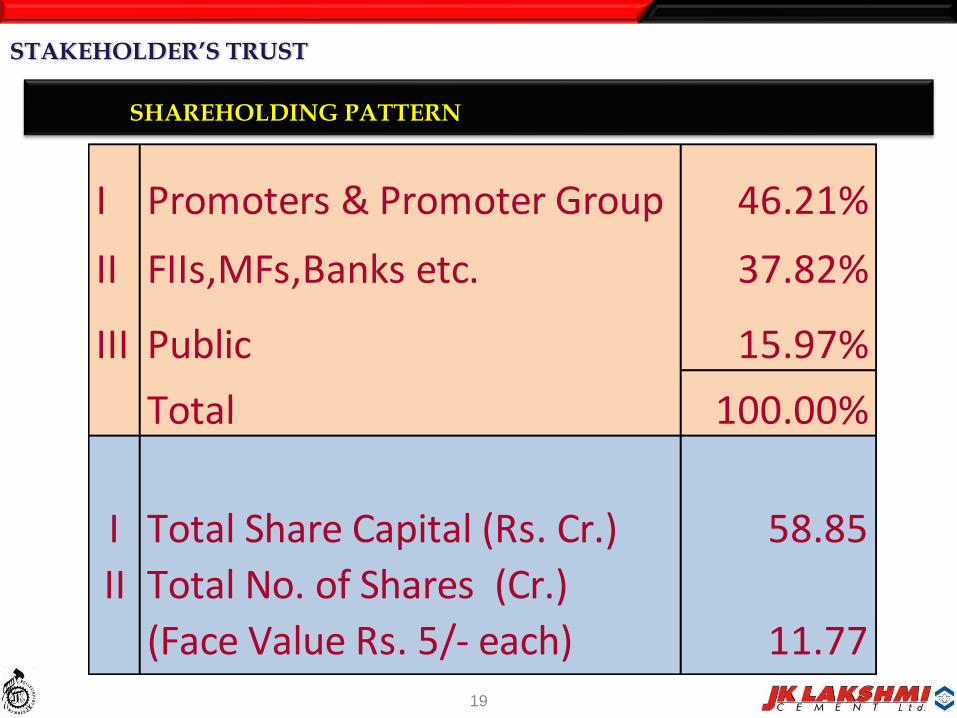
STAKEHOLDER’S TRUST
SHAREHOLDING PATTERN
19
I Promoters & Promoter Group 46.21%
II FIIs,MFs,Banks etc. 37.82%
III Public 15.97%
Total 100.00%
I Total Share Capital (Rs. Cr.) 58.85
II Total No. of Shares (Cr.)
(Face Value Rs. 5/- each) 11.77
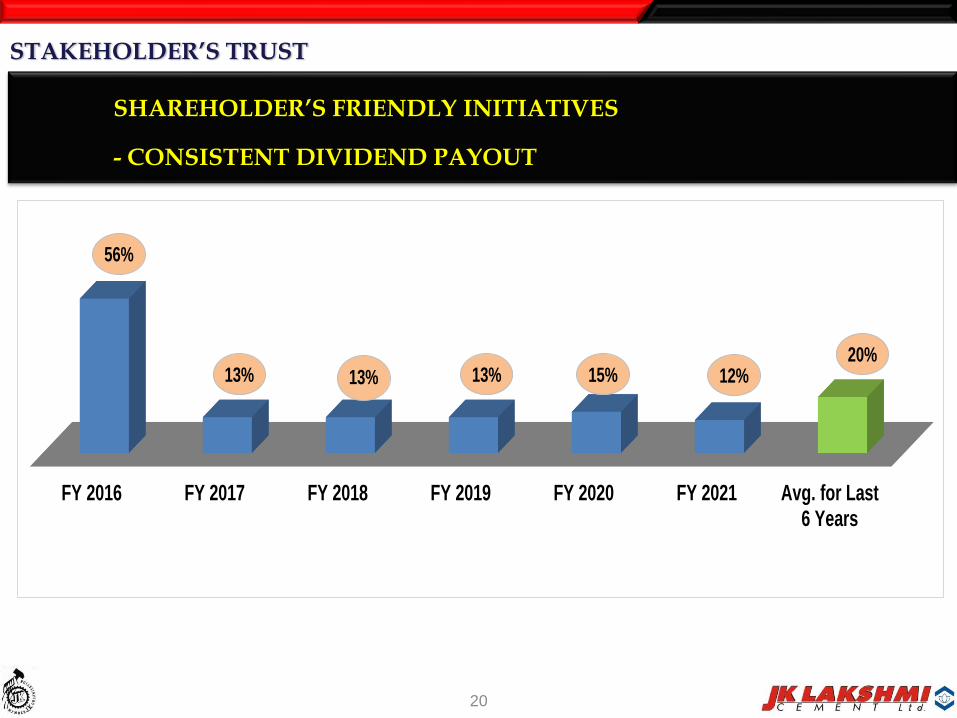
STAKEHOLDER’S TRUST
SHAREHOLDER’S FRIENDLY INITIATIVES
- CONSISTENT DIVIDEND PAYOUT
20
FY 2016 FY 2017 FY 2018 FY 2019 FY 2020 FY 2021 Avg. for Last6 Years
56%
13% 13% 13% 15% 12%20%
Corporate Social Responsibility for transformative changes…..
21
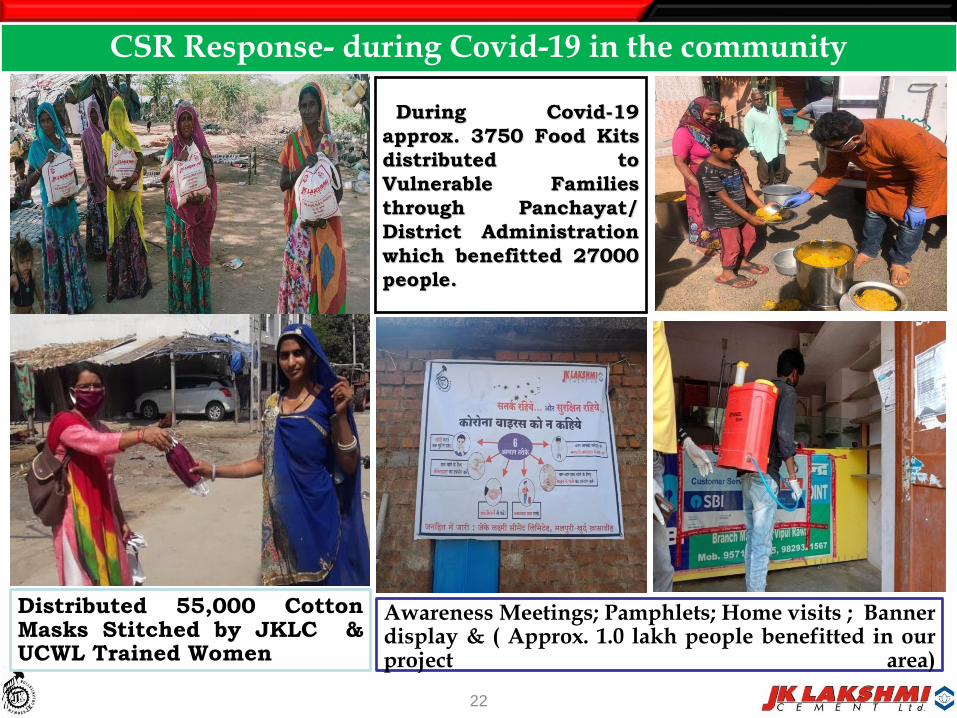
During Covid-19
approx. 3750 Food Kits
distributed to
Vulnerable Families
through Panchayat/
District Administration
which benefitted 27000
people.
CSR Response- during Covid-19 in the community
Distributed 55,000 CottonMasks Stitched by JKLC &UCWL Trained Women
Awareness Meetings; Pamphlets; Home visits ; Bannerdisplay & ( Approx. 1.0 lakh people benefitted in ourproject area)
22
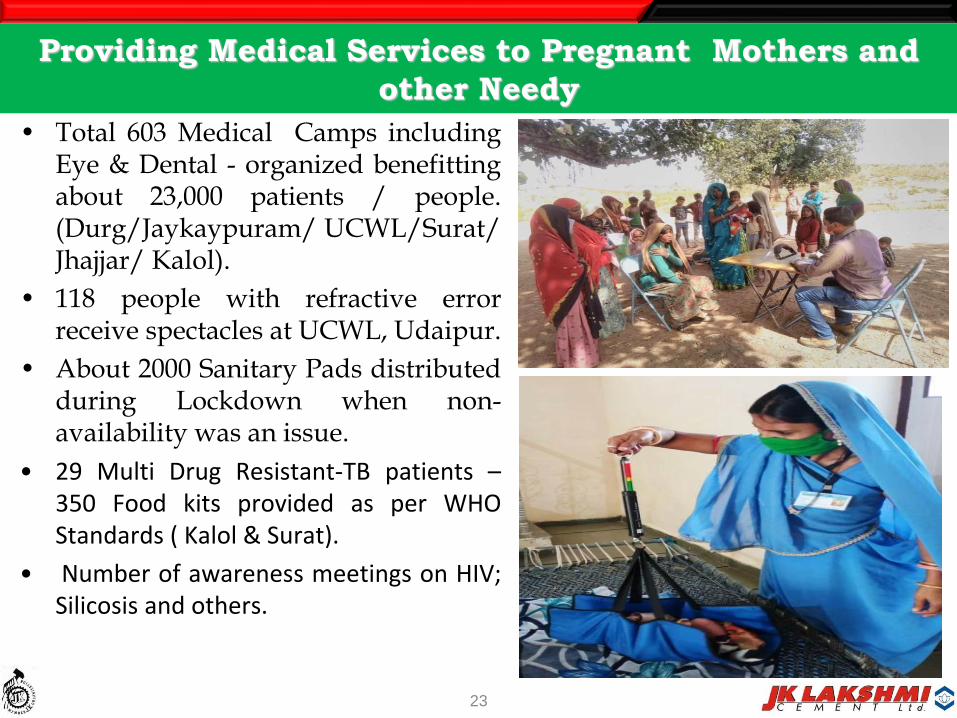
Providing Medical Services to Pregnant Mothers and
other Needy
• Total 603 Medical Camps includingEye & Dental - organized benefittingabout 23,000 patients / people.(Durg/Jaykaypuram/ UCWL/Surat/Jhajjar/ Kalol).
• 118 people with refractive errorreceive spectacles at UCWL, Udaipur.
• About 2000 Sanitary Pads distributedduring Lockdown when non-availability was an issue.
• 29 Multi Drug Resistant-TB patients –350 Food kits provided as per WHOStandards ( Kalol & Surat).
• Number of awareness meetings on HIV;Silicosis and others.
23
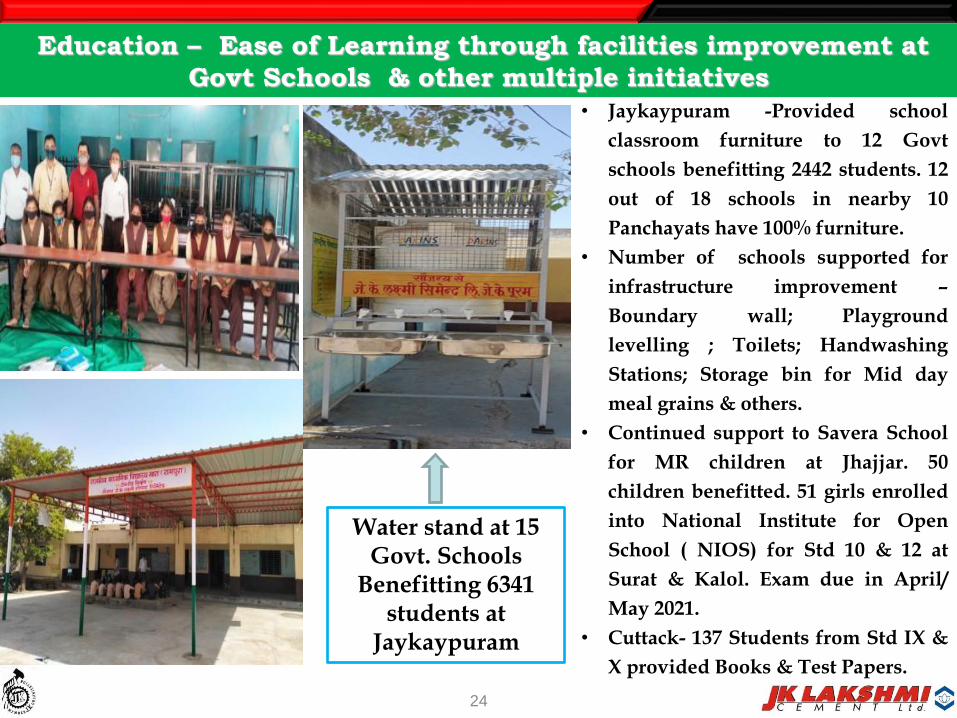
Education – Ease of Learning through facilities improvement at
Govt Schools & other multiple initiatives • Jaykaypuram -Provided school
classroom furniture to 12 Govt
schools benefitting 2442 students. 12
out of 18 schools in nearby 10
Panchayats have 100% furniture.
• Number of schools supported for
infrastructure improvement –
Boundary wall; Playground
levelling ; Toilets; Handwashing
Stations; Storage bin for Mid day
meal grains & others.
• Continued support to Savera School
for MR children at Jhajjar. 50
children benefitted. 51 girls enrolled
into National Institute for Open
School ( NIOS) for Std 10 & 12 at
Surat & Kalol. Exam due in April/
May 2021.
• Cuttack- 137 Students from Std IX &
X provided Books & Test Papers.
Water stand at 15 Govt. Schools
Benefitting 6341 students at
Jaykaypuram
24
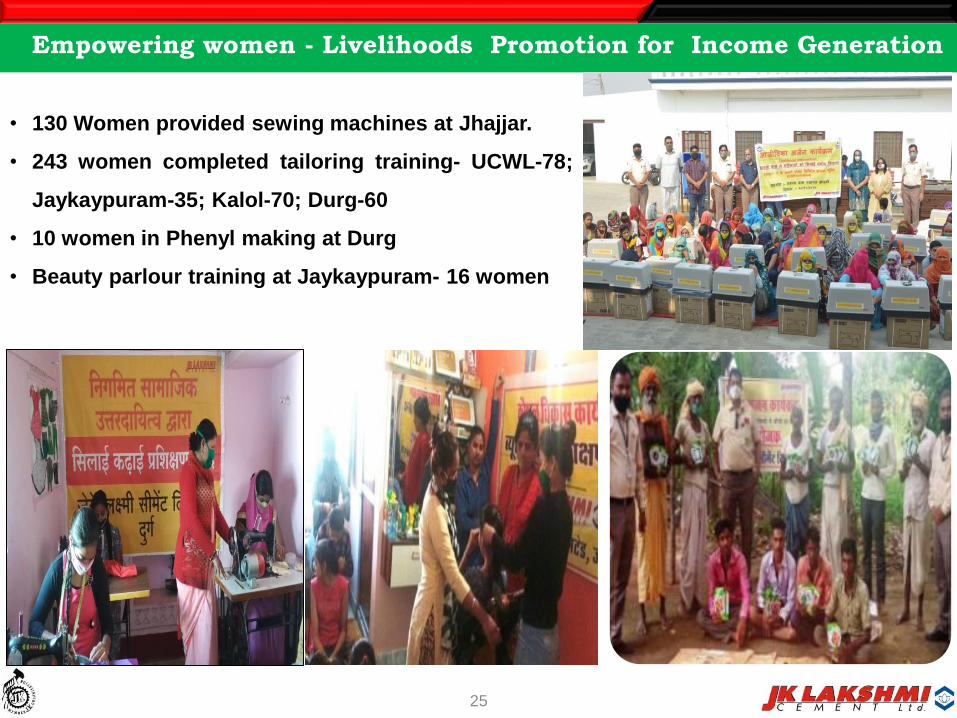
Empowering women - Livelihoods Promotion for Income Generation
• 130 Women provided sewing machines at Jhajjar.
• 243 women completed tailoring training- UCWL-78;
Jaykaypuram-35; Kalol-70; Durg-60
• 10 women in Phenyl making at Durg
• Beauty parlour training at Jaykaypuram- 16 women
25
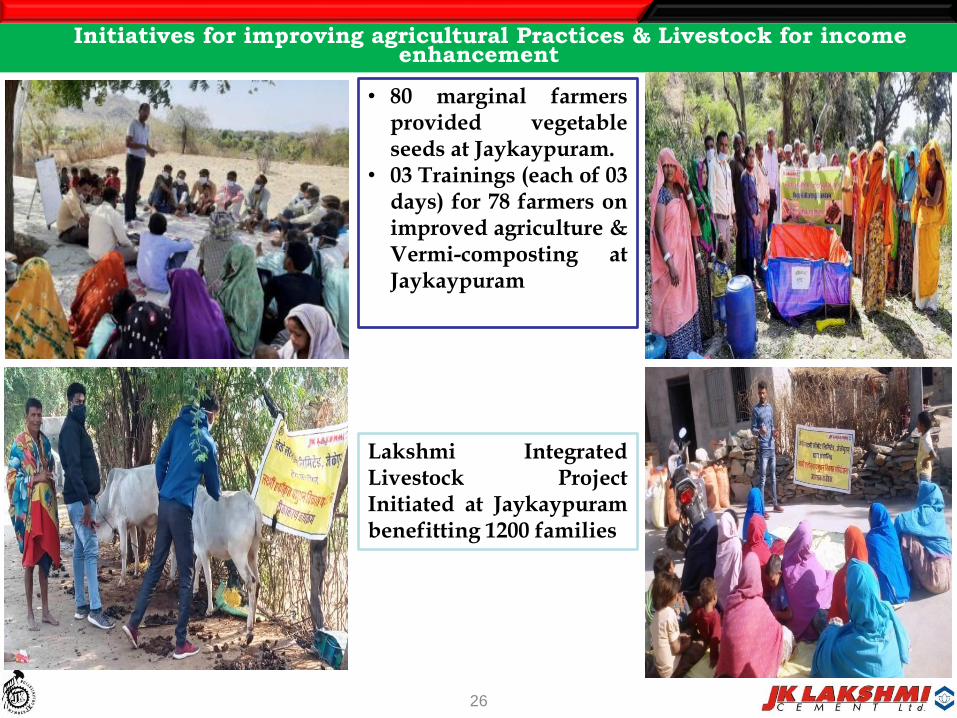
Initiatives for improving agricultural Practices & Livestock for income enhancement
• 80 marginal farmersprovided vegetableseeds at Jaykaypuram.
• 03 Trainings (each of 03days) for 78 farmers onimproved agriculture &Vermi-composting atJaykaypuram
Lakshmi IntegratedLivestock ProjectInitiated at Jaykaypurambenefitting 1200 families
26
27
27
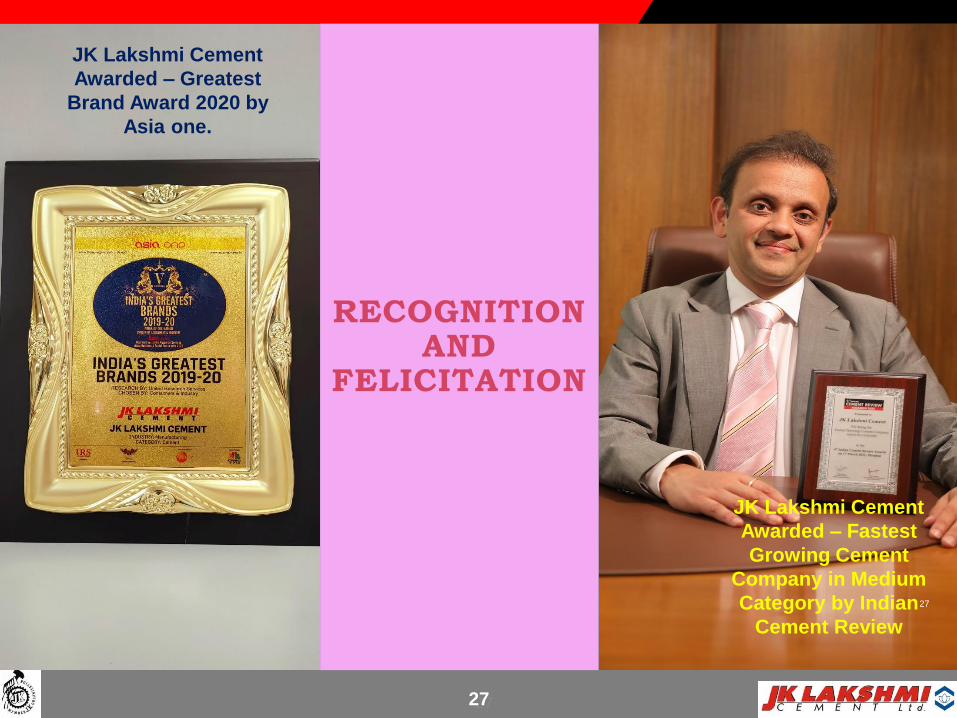
JK Lakshmi Cement
Awarded – Fastest
Growing Cement
Company in Medium
Category by Indian
Cement Review
JK Lakshmi Cement
Awarded – Greatest
Brand Award 2020 by
Asia one.
27

JK Lakshmi Cement Awarded – Most Iconic Brand Award by Economic Times 2021
Platinum Heavy Duty Cement
Awarded – Most Promising Brand
(Cement Sector) by Asia’s Most
Promising Brand 2020
28
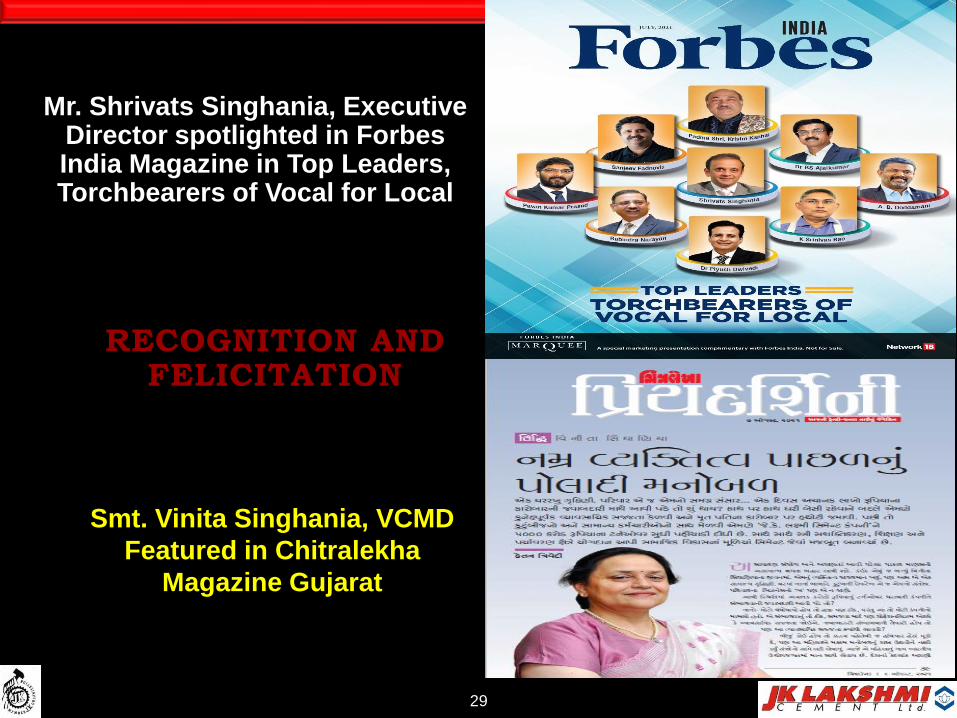
Mr. Shrivats Singhania, Executive Director spotlighted in Forbes India Magazine in Top Leaders, Torchbearers of Vocal for Local
Smt. Vinita Singhania, VCMD
Featured in Chitralekha
Magazine Gujarat
29
30 30
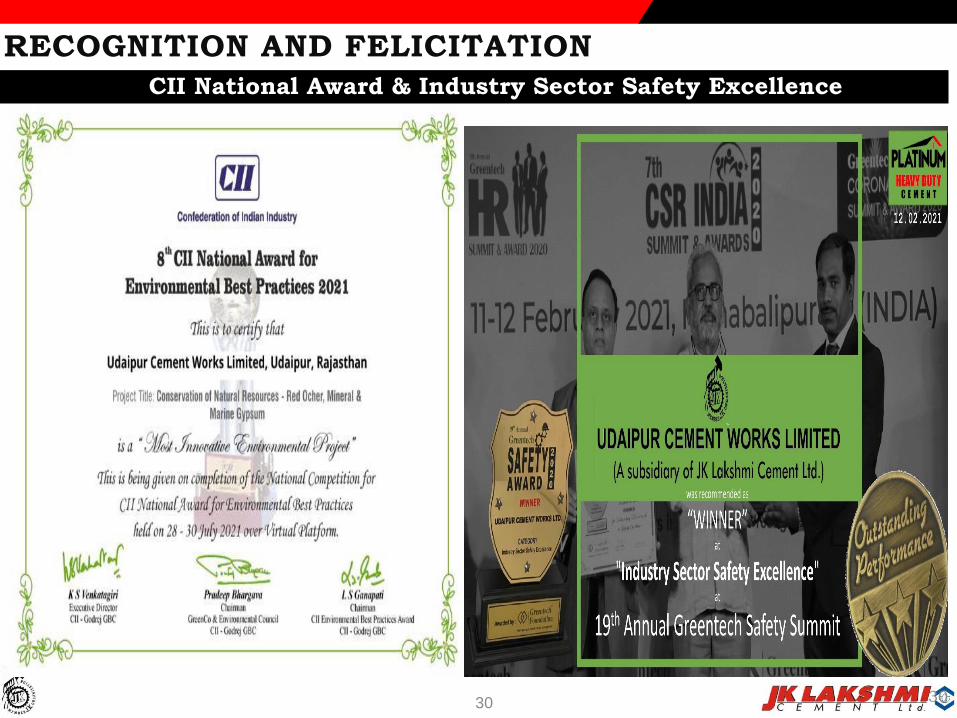
RECOGNITION AND FELICITATION
CII National Award & Industry Sector Safety Excellence
31 31
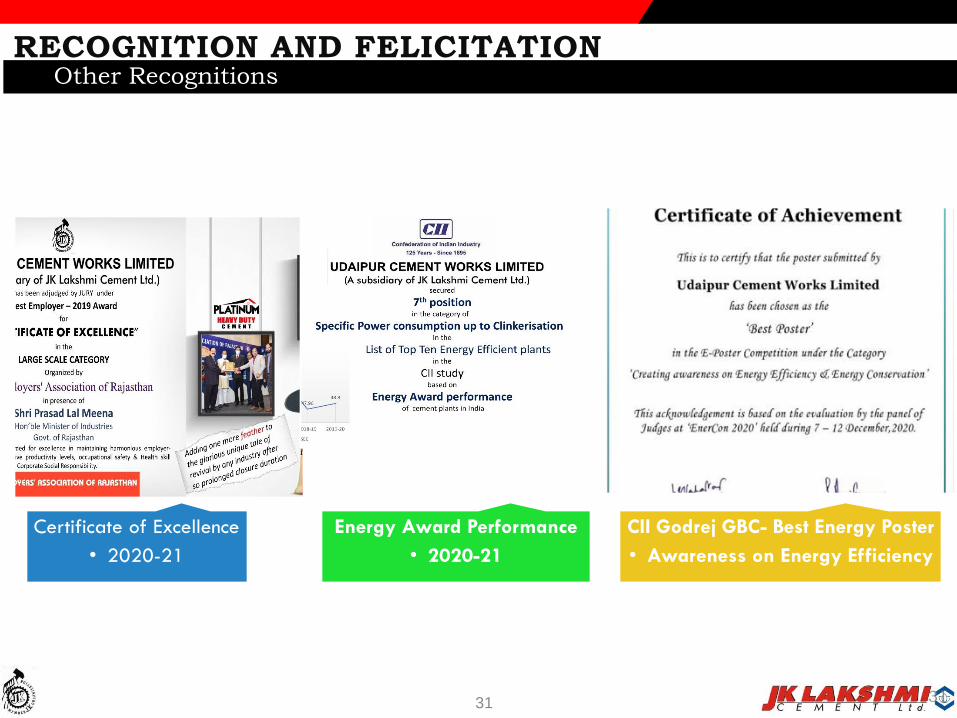
RECOGNITION AND FELICITATIONOther Recognitions
Certificate of Excellence
• 2020-21
Energy Award Performance
• 2020-21
CII Godrej GBC- Best Energy Poster
• Awareness on Energy Efficiency
32
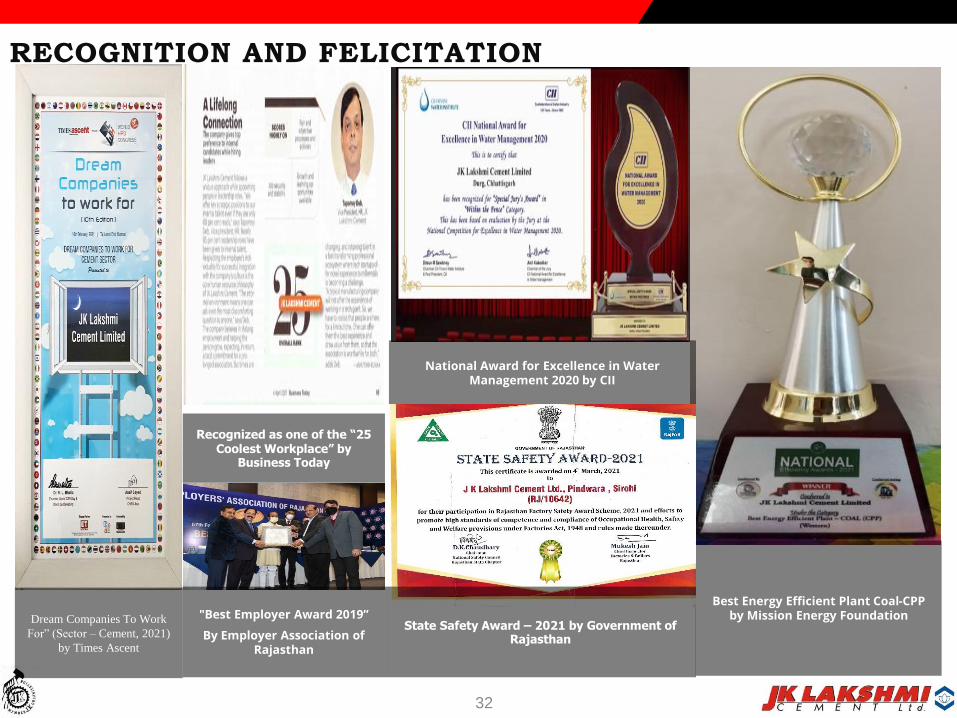
Dream Companies To Work
For” (Sector – Cement, 2021)
by Times Ascent
Recognized as one of the “25 Coolest Workplace” by
Business Today
"Best Employer Award 2019”
By Employer Association of Rajasthan
Best Energy Efficient Plant Coal-CPP by Mission Energy Foundation
National Award for Excellence in Water Management 2020 by CII
State Safety Award – 2021 by Government of Rajasthan
RECOGNITION AND FELICITATION

Way Forward
Commissioning of Cement Mill - III at UCWL Plant to increase its Capacity from 1.60 Mn.Ton to 2.20 Mn. Ton. in Jun’2021.
Commissioning of WHR Plant of 10 MW at Sirohi by December 2021 will further improve Power Cost and efficiency.
Project for Capacity Expansion of 2.50 Mn. Ton at UCWL already announced.
Putting up Solar Power Plants at Sirohi and Durg for further Power Cost reduction.
Logistic Optimization with Group Company UCWL.
% of Premium Products continuously increase.
Reduction in Borrowing Cost on LT Loans through annual resetting.
33
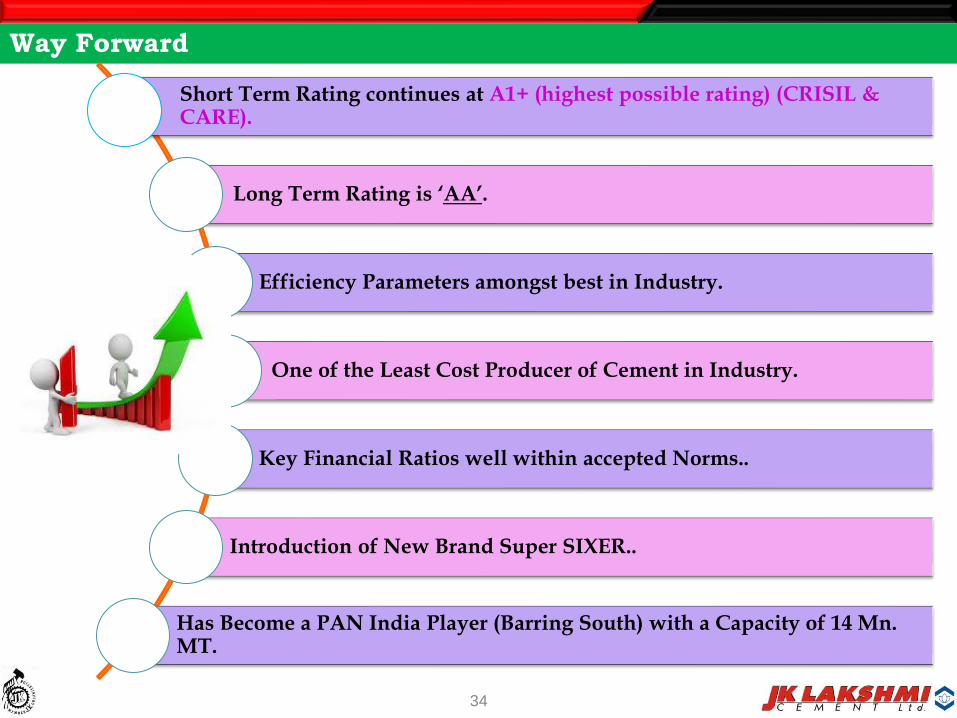
Way Forward
Short Term Rating continues at A1+ (highest possible rating) (CRISIL & CARE).
Long Term Rating is ‘AA’.
Efficiency Parameters amongst best in Industry.
One of the Least Cost Producer of Cement in Industry.
Key Financial Ratios well within accepted Norms..
Introduction of New Brand Super SIXER..
Has Become a PAN India Player (Barring South) with a Capacity of 14 Mn. MT.
34

Thank You