Embed Size (px)
Citation preview

Corporate PresentationNovember 2018

Disclaimer
2
Note Project/Property Company Date
(1) Hasaga Premier Gold Mines Limited December 30, 2016(2) Hardrock Feasibility Premier Gold Mines Limited December 21, 2016(3) McCoy-Cove Premier Gold Mines Limited April 15, 2017(4) South Arturo Premier Gold Mines Limited February 26, 2018(5) Mercedes Premier Gold Mines Limited April 18, 2018
This Presentation contains certain information that may constitute "forward-looking information" under applicable Canadian securities legislation. Forward-looking information includes, but is not limited to,statements regarding the Company’s achievement of the full-year projections for ounce production, production costs, AISC costs per ounce, cash cost per ounce and realized gold/silver price per ounce, theCompany’s ability to meet annual operations estimates, and statements about strategic plans, including future operations, future work programs, capital expenditures, discovery and production of minerals, priceof gold and currency exchange rates, timing of geological reports and corporate and technical objectives. Forward-looking information is necessarily based upon a number of assumptions that, while consideredreasonable, are subject to known and unknown risks, uncertainties, and other factors which may cause the actual results and future events to differ materially from those expressed or implied by such forward-looking information, including the risks inherent to the mining industry, adverse economic and market developments and the risks identified in Premier's annual information form under the heading "RiskFactors". There can be no assurance that such information will prove to be accurate, as actual results and future events could differ materially from those anticipated in such information. Accordingly, readersshould not place undue reliance on forward-looking information. All forward-looking information contained in this Presentation is given as of the date hereof and is based upon the opinions and estimates ofmanagement and information available to management as at the date hereof. Premier disclaims any intention or obligation to update or revise any forward-looking information, whether as a result of newinformation, future events or otherwise, except as required by law.
This presentation has been completed by Premier. Certain corporate projects referred to herein are subject to agreements with third parties who have not prepared, reviewed nor approved this presentation.The presentation is not intended to reflect the actual plans or exploration and development programs contemplated for such projects.
Please refer to Appendix A-2 for cautionary notes on non IFRS measures and production guidance.
Foreign Exchange Assumptions
Effective January 1, 2018, the Company has changed its presentation currency to U.S. dollars. This change is applied retroactively to restate comparative financial statements. Unless otherwise stated, all amountsdiscussed herein are denominated in U.S. dollars. This Accounting policy change is discussed in Note 2(c) to the Q2 2018 unaudited condensed consolidated interim financial statements of the Company
Cautionary Notes to Investors - Reserve and Resource Estimates
In accordance with applicable Canadian securities regulatory requirements, all mineral reserve and mineral resource estimates of the Company disclosed this Presentation have been prepared in accordance withCanadian National Instrument 43-101 - Standards of Disclosure for Mineral Projects ("NI 43-101"), classified in accordance with Canadian Institute of Mining Metallurgy and Petroleum's "CIM Standards onMineral Resources and Reserves Definitions and Guidelines" (the "CIM Guidelines").
Pursuant to the CIM Guidelines, mineral resources have a higher degree of uncertainty than mineral reserves as to their existence as well as their economic and legal feasibility. Inferred mineral resources, whencompared with measured or indicated mineral resources, have the least certainty as to their existence, and it cannot be assumed that all or any part of an inferred mineral resource will be upgraded to anindicated or measured mineral resource as a result of continued exploration. Pursuant to NI 43-101, inferred mineral resources may not form the basis of any economic analysis, including any feasibility study.Accordingly, readers are cautioned not to assume that all or any part of a mineral resource exists, will ever be converted into a mineral Reserve, or is or will ever be economically or legally mineable or recovered.Premier is not aware of any environmental, permitting, legal, title-related, taxation, socio-political, marketing or other relevant issue that could materially affect the Mineral Resource estimate.
The scientific and technical information contained in this Presentation has been reviewed by Stephen McGibbon, P. Geo., (Executive VP Corporate and Project Development) and a Qualified Person within themeaning of National Instrument 43-101.
For further information on the technical data provided in this Presentation, including the key assumptions underlying the mineral resource herein, refer to the Sedar filings as listed below:

Building a Mining Business
3
ONTARIOGreenstone Gold
HasagaRahill-Bonanza
MEXICOMercedes
NEVADASouth ArturoMcCoy-Cove
Rye-Goldbanks
Development pipeline delivers long-term production growth
✓ North American focus
✓ World-class districts
✓ Safe jurisdictions
✓ Sensible partnerships
✓ Low-cost production:
• 2 mining operations
✓ 4 Advanced-stage projects:
• El Nino, Nevada
• P1 pit, Nevada
• Cove, Nevada
• Hardrock, Ontario
✓ Strong treasury
• $56.4 M (September 30, 2018)
✓ Exploration upside
Production
Exploration/Development
See Disclaimer page for notes and forward looking statements and the Company’s Q3 2018 MD&A and Financial Statements

Building a Mining Business
4
Reserve and Resource Growth
Go
ld O
un
ces
(00
0’s
)
See Disclaimer page for notes and forward looking statements
Tonnes (Mt)
Grade (g/t Au)
Grade (g/t Au)
Tonnes (Mt)
Tonnes (Mt)
Grade (g/t Au)
P+P 0.86 1.08 74.42 1.17 76.77 1.22M+I 55.91 1.77 66.10 1.44 74.57 1.48Inferred 16.38 3.69 42.10 1.94 44.41 2.50
-
500
1,000
1,500
2,000
2,500
3,000
3,500
4,000
2015 2016 2017
Gold Ounces

Building a Mining Business
5
Relative Performance – 2017 (1)
See Disclaimer page for notes and forward looking statements
(1) Market data as at December 31, 2017.Peers: Alacer, Argonaut, Asanko, Fortuna, Guyana, Leagold, MAG Silver, Osisko Mining, Roxgold, SEMAFO, TMAC, Torex and Wesdome. Source: Bloomberg Financial Markets.
70
80
90
100
110
120
130
140
150
160
170
Jan-17 Apr-17 Jun-17 Sep-17 Dec-17
Rela
tive P
erf
orm
ance (
Base
= 1
00)
Premier Peers Spot Gold GDX GDXJ TSX Div. Mining
11%
41%
23%
13%
8%
(11%)
• One of the top performing gold stocks on the TSX exchange in 2017
• Key attributes:• Strong cash flow driven by low-cost production from South Arturo• Strong operating performance at Mercedes

Building a Mining Business
6
Relative Performance – 2018 (1)
See Disclaimer page for notes and forward looking statements
(1) Market data as at December 31, 2017.Peers: Alacer, Argonaut, Asanko, Fortuna, Guyana, Leagold, MAG Silver, Osisko Mining, Roxgold, SEMAFO, TMAC, Torex and Wesdome. Source: Bloomberg Financial Markets.
40
50
60
70
80
90
100
110
120
Jan-18 Mar-18 May-18 Jul-18 Sep-18 Nov-18
Rela
tive P
erf
orm
ance (
Base
= 1
00)
Premier Peers Spot Gold GDX GDXJ TSX Div. Mining
(17%)
(54%)
(22%)
(6%)
(19%)
(24%)
• Underperformance in 2018 – transition year with new mines under construction
• Key attributes:• Limited production from lower-grade stockpiles at South Arturo• Challenging operating performance at Mercedes driven by new deposits
Mining Operations
7See Disclaimer page for notes and forward looking statementsSee Appendix for “Non IFRS Measures” and complete production guidance
A Focus on Quality Production
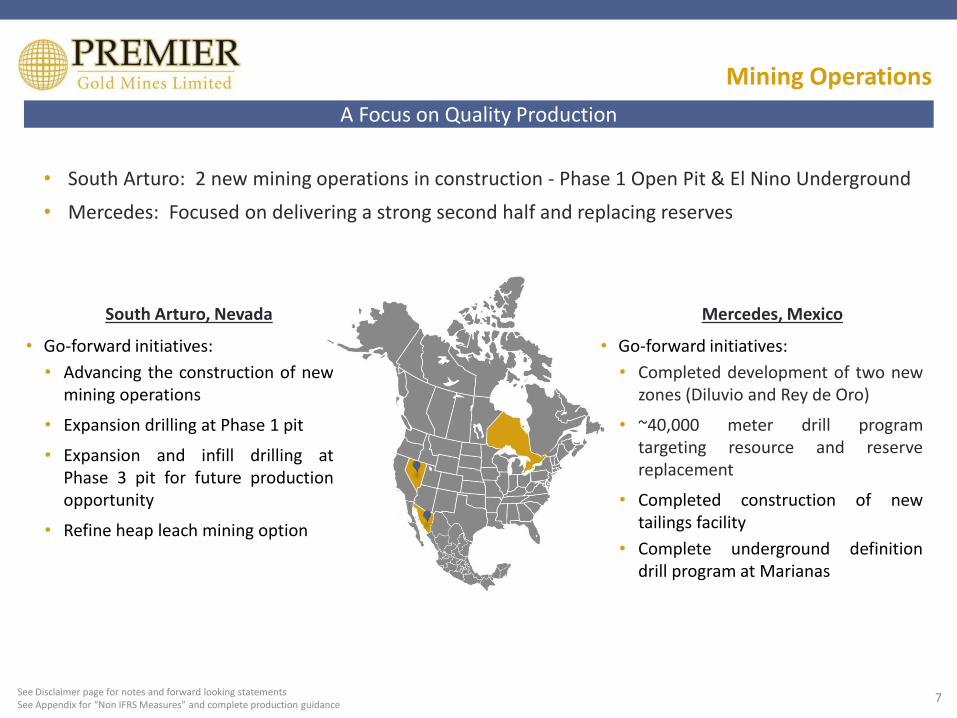
• South Arturo: 2 new mining operations in construction - Phase 1 Open Pit & El Nino Underground
• Mercedes: Focused on delivering a strong second half and replacing reserves
South Arturo, Nevada Mercedes, Mexico
• Go-forward initiatives:
• Advancing the construction of newmining operations
• Expansion drilling at Phase 1 pit
• Expansion and infill drilling atPhase 3 pit for future productionopportunity
• Refine heap leach mining option
• Go-forward initiatives:
• Completed development of two newzones (Diluvio and Rey de Oro)
• ~40,000 meter drill programtargeting resource and reservereplacement
• Completed construction of newtailings facility
• Complete underground definitiondrill program at Marianas
South Arturo Mine, Nevada
8
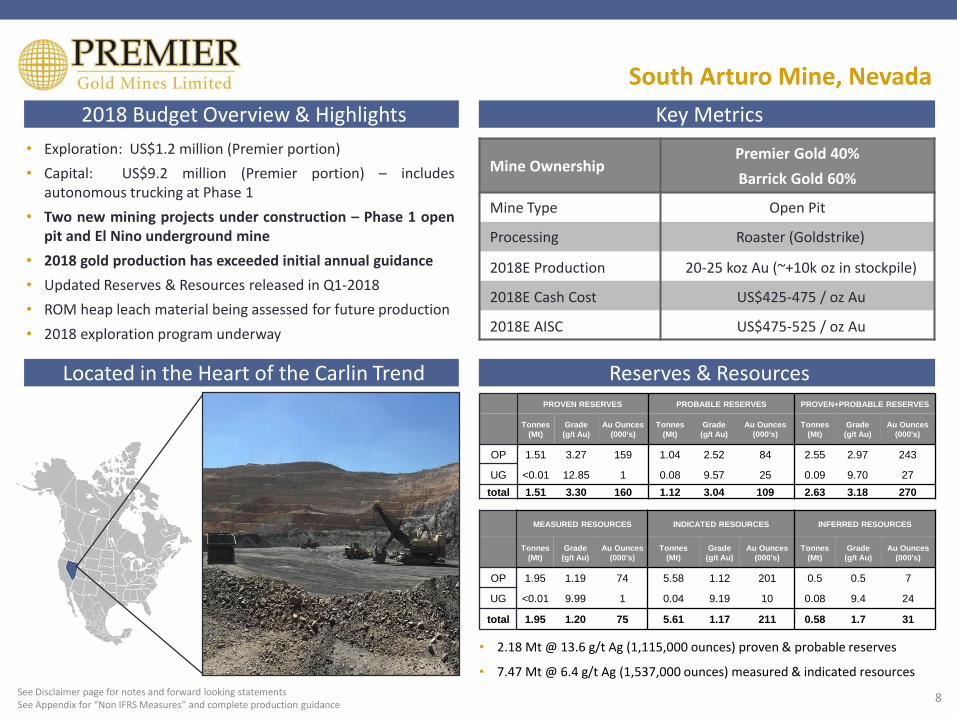
• Exploration: US$1.2 million (Premier portion)
• Capital: US$9.2 million (Premier portion) – includesautonomous trucking at Phase 1
• Two new mining projects under construction – Phase 1 openpit and El Nino underground mine
• 2018 gold production has exceeded initial annual guidance
• Updated Reserves & Resources released in Q1-2018
• ROM heap leach material being assessed for future production
• 2018 exploration program underway
2018 Budget Overview & Highlights Key Metrics
Located in the Heart of the Carlin Trend
Mine OwnershipPremier Gold 40%
Barrick Gold 60%
Mine Type Open Pit
Processing Roaster (Goldstrike)
2018E Production 20-25 koz Au (~+10k oz in stockpile)
2018E Cash Cost US$425-475 / oz Au
2018E AISC US$475-525 / oz Au
See Disclaimer page for notes and forward looking statementsSee Appendix for “Non IFRS Measures” and complete production guidance
Reserves & ResourcesPROVEN RESERVES PROBABLE RESERVES PROVEN+PROBABLE RESERVES
Tonnes
(Mt)
Grade
(g/t Au)
Au Ounces
(000's)
Tonnes
(Mt)
Grade
(g/t Au)
Au Ounces
(000's)
Tonnes
(Mt)
Grade
(g/t Au)
Au Ounces
(000's)
OP 1.51 3.27 159 1.04 2.52 84 2.55 2.97 243
UG <0.01 12.85 1 0.08 9.57 25 0.09 9.70 27
total 1.51 3.30 160 1.12 3.04 109 2.63 3.18 270
MEASURED RESOURCES INDICATED RESOURCES INFERRED RESOURCES
Tonnes
(Mt)
Grade
(g/t Au)
Au Ounces
(000's)
Tonnes
(Mt)
Grade
(g/t Au)
Au Ounces
(000's)
Tonnes
(Mt)
Grade
(g/t Au)
Au Ounces
(000's)
OP 1.95 1.19 74 5.58 1.12 201 0.5 0.5 7
UG <0.01 9.99 1 0.04 9.19 10 0.08 9.4 24
total 1.95 1.20 75 5.61 1.17 211 0.58 1.7 31
• 2.18 Mt @ 13.6 g/t Ag (1,115,000 ounces) proven & probable reserves
• 7.47 Mt @ 6.4 g/t Ag (1,537,000 ounces) measured & indicated resources

9See Disclaimer page for notes and forward looking statementsSee Appendix for “Non IFRS Measures” and the Company’s Q3 2018 MD&A and Financial Statements
Q3-2018 Operational Results
• Production: 2,635 ounces of gold & 1,122 ounces of silver
• Co-product cash costs of US$396 per ounce of gold
• Co-product all-in sustaining costs (“AISC”) of US$498 per ounce of gold
South Arturo Mine, Nevada
Three months ended
September 30
Nine months ended
September 30
(in millions of U.S. dollars, unless otherwise stated) (v)
2018 2017 2018 2017
Ore & Metals
Ore milled tonnes 21,334 79,479 190,249 345,998
Gold produced ounces 2,635 8,113 20,403 52,652
Gold sold ounces 1,932 13,026 19,996 64,559
Silver produced ounces 1,122 2,575 10,958 19,918
Average gold grade grams/t 4.48 3.79 3.96 5.42
Average gold recovery rate % 85.7 83.8 84.2 87.4
Realized Price (2017 as restated) (iv)
Average realized gold price (i,ii) $/ounce 1,200 1,264 1,306 1,249
Non-IFRS Performance Measures
Co-product cash costs per ounce of gold sold (i,ii) $/ounce 396 363 421 295
Co-product all in sustaining costs per ounce of gold sold (i,ii) $/ounce 498 371 465 336
By-product cash costs per ounce of gold sold (i,ii,iii) $/ounce 396 363 421 295
By-product all in sustaining costs per ounce of gold sold (i,ii,iii) $/ounce 498 371 465 336
Financial Measures (2017 as restated) (iv)
Gold revenue m $ 2.3 16.5 26.1 80.6
Mine operating income m $ 1.0 6.7 11.7 30.2
Exploration, evaluation & pre-development m $ 0.4 0.4 1.1 0.5
Capital expenditures - sustaining (i,ii) m $ - - - 0.1
Capital expenditures - expansionary (i,ii) m $ 2.8 0.5 4.8 0.5
(i) A cautionary note regarding Non-IFRS metrics is included in the "Non IFRS Measures" section of this Management's Discussion and Analysis.(ii) Cash costs, all in sustaining costs, sustaining and expansionary capital expenditures as well as average realized gold\silver price per ounce are Non-IFRS metrics and discussed in the section "Non-IFRS Measures" of the Q3 2018 Management Discussion and Analysis.(iii) Given the small nature and timing of South Arturo silver output, no silver by-product credits are reported. (iv) 2017 restated for the presentation currency change as discussed in the "Critical Accounting Judgements and Estimates, Policies and Changes" section of the Q3 2018 Management Discussion and Analysis.(v) May not add due to rounding

Strategic Project on the Carlin Trend
10
• Core land position in one of the most soughtafter gold districts in the world
• South Arturo Phase 2 pit was one of thelowest cost operations in the world with2017 AISC of US$351 /oz
• Several upside opportunities:
• El Nino u/g deposit• Phase 1 & Phase 3 pits• Potential for ROM heap leach• East Dee deposit• Exploration targets
• Partnership with Barrick has led to additionalstrategic opportunities (McCoy-Cove JV;custom processing arrangement forrefractory ore, Rye Property acquisition)
• Option agreement on Rodeo Creek (100%PG) grows Premier’s land position in thisprolific district.
World Class Gold District
See Disclaimer page for notes and forward looking statements

Multiple Development Opportunities
11
• Construction underway
• ROM heap leach project continues to beadvanced with material being stockpiledduring P1 mining
• Heap leach opportunity has the potentialto increase reserves and resources
• High-potential East Dee and South Hingetargets offer significant upside (beingdrilled in 2018)
Phase 2 Pit
• Surface facilities construction underway
• Highlight results from 2017 drilling:
• EL17-10: 225 feet grading 0.46 oz/t Au(15.92 g/t Au across 68.6 m)
• EL17-12: 150 feet grading 0.63 oz/t Au(21.68 g/t Au across 45.7 m)
• Targeted as a multi-year mining operation
• Deposit remains open along strike and atdepth
Phase 1 Open Pit Project Phase 3 Open Pit Project• New resource estimate supports the
potential for future development
• Highlight results from 2017 drilling:
• ART17-01C: 177.8 feet grading 0.23 oz/tAu (52.7 m grading 7.90 g/t)
• ART17-04C: 261.6 feet grading 0.15 oz/tAu (79.7 m grading 5.18 g/t)
• ART17-10C: 117.0 feet grading 0.48 oz/tAu (35.7 m grading 16.54 g/t)
• Open for expansion down-plunge
See Disclaimer page for notes and forward looking statements
El Nino Underground Project
Phase 1 Pit
Phase 3 Pit
Phase 2: Mining
completed
Phase 2 Pit
South Hinge Target
Phase 1
Phase 3Phase 2
El Niño Underground
Plan view Isometric view looking North
East DeeTarget
12
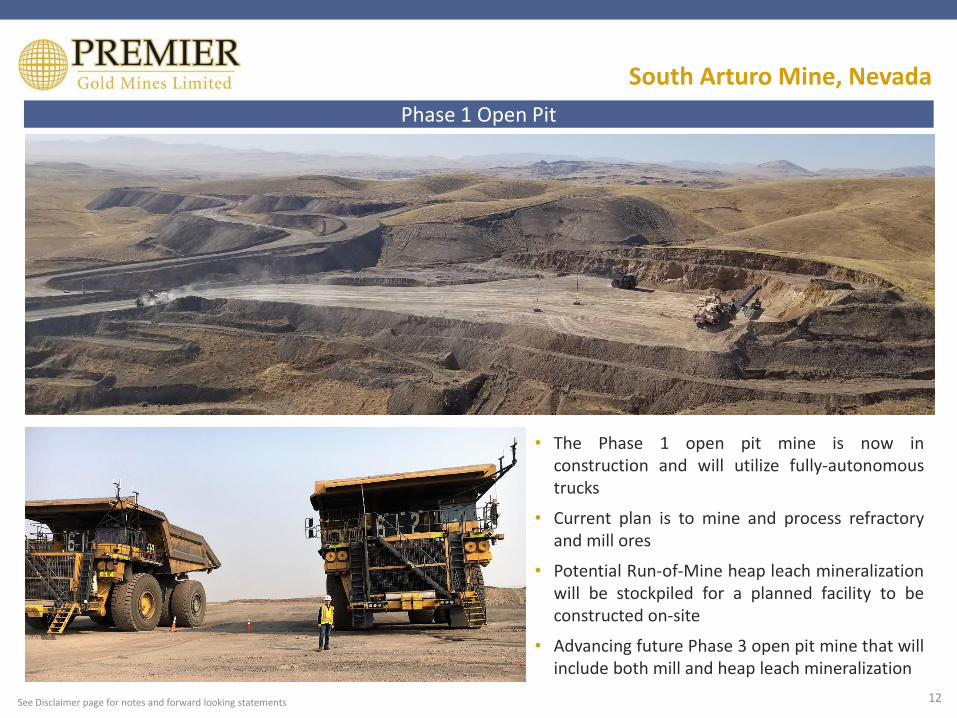
Phase 1 Open Pit
South Arturo Mine, Nevada
See Disclaimer page for notes and forward looking statements
• The Phase 1 open pit mine is now inconstruction and will utilize fully-autonomoustrucks
• Current plan is to mine and process refractoryand mill ores
• Potential Run-of-Mine heap leach mineralizationwill be stockpiled for a planned facility to beconstructed on-site
• Advancing future Phase 3 open pit mine that willinclude both mill and heap leach mineralization

13
El Nino Underground
South Arturo Mine, Nevada
See Disclaimer page for notes and forward looking statements
• Ramp construction underway to access ore located immediately below the Phase 2 pit
• Production ramp-up expected in 2019
East PortalWest Portal

14
Phase 3 Open Pit
South Arturo Mine, Nevada
See Disclaimer page for forward looking statements and Notes
Hole ID From (ft)
To(ft)
Length (ft)
Au oz/t
Au g/t
ART17-01C 670.2 789.0 118.8 0.232 7.95
including 696.2 716.0 19.8 0.330 11.31
and 741.0 749.0 8.0 0.439 15.05
ART17-02C 982.4 1033.0 50.6 0.134 4.59
Z2 1098.0 1128.0 30.0 0.098 3.36
ART17-04C 734.4 996.0 261.6 0.152 5.21
Including 734.4 877.0 142.6 0.204 6.99
ART17-10C 733.0 850.0 117.0 0.482 16.54
including 738.0 788.0 50.0 0.824 28.26
Z2 955.0 1030.0 75.0 0.059 2.02
including 955.0 990.0 35.0 0.075 2.58
and 1020.0 1030.0 10.0 0.091 3.13
Z3 1061.0 1287.5 226.5 0.089 3.05
including 1076.0 1121.0 45.0 0.163 5.58
• Phase 3 open pit Mineral Resources include a high grade core: 344,000 tonnes at 8.16 g/t Au (90,000 ouncesattributable to Premier)
• Deposit remains open for expansion with higher than anticipated grade encountered in the southern extent of thepit design - additional drilling underway
• Targeted as the next phase of open pit mining at South Arturo
ART17-10C0.48 oz/t Au – 117.0 ft
ART17-10C0.089 oz/t Au – 226.5 ft
Excellent potential to expand resources below
current pit design

15
Rodeo Creek Property Acquisition
Rodeo Creek Property, Nevada
See Disclaimer page for forward looking statements and Notes
• Increases Premier’s exposure to primegeology in the heart of the prolific CarlinTrend
• Adjoining the South Arturo joint ventureproperty and within 10 km of the Goldstrikeprocessing facility
• Under option from Nevada Select Royalty, Inc.subject to a 2% NSR
• Soil sample program is underway with drillingplanned in 2019

Mercedes Mine, Mexico
16
• Exploration Expense: US$1.2 million
• Exploration Capital: US$4.8 million
• Expansionary Capital: US$6.3 million
• Major developments in 2018:
• Advance Diluvio and Rey de Oro into 2018 mine plan
• Complete drift to Marianas deposit for u/g drilling
• Define high-grade Aida Zone for development
• ~40,000 meters of drilling planned - delineation & exploration
2018 Budget & Overview Key Metrics
Located in a Prolific Mining District
Mine Ownership Premier Gold 100%
Mine Type Underground
Plant Throughput Capacity 2,000 tpd
2018E Production * 70-75 koz Au
2018E Cash Cost US$875-925 /oz Au
2018E AISC US$1000-1050 /oz Au
Reserves & Resources
PROVEN RESERVES PROBABLE RESERVES PROVEN+PROBABLE RESERVES
Tonnes
(Mt)
Grade
(g/t Au)
Au Ounces
(000's)
Tonnes
(Mt)
Grade
(g/t Au)
Au Ounces
(000's)
Tonnes
(Mt)
Grade
(g/t Au)
Au Ounces
(000's)
0.24 5.10 40 3.05 3.85 378 3.29 3.94 417
MEASURED RESOURCES INDICATED RESOURCESMEASURED+INDICATED
RESOURCESINFERRED RESOURCES
Tonnes
(Mt)
Grade
(g/t Au)
Au
Ounces
(000's)
Tonnes
(Mt)
Grade
(g/t Au)
Au
Ounces
(000's)
Tonnes
(Mt)
Grade
(g/t Au)
Au
Ounces
(000's)
Tonnes
(Mt)
Grade
(g/t Au)
Au
Ounces
(000's)
1.08 5.73 200 2.60 3.73 311 3.68 4.32 511 1.63 4.2 222
• 3.29 million tonnes @ 24.20 g/t Ag for 2,556,000 ounces ofproven and probable silver reserves
• 3.68 million tonnes @ 43.70 g/t Ag for 5,178,000 ounces ofmeasured and indicated silver resources
See Disclaimer page for notes and forward looking statementsSee Appendix for “Non IFRS Measures” and complete production guidance
* - Production expected to be weighted to H2-2018
Q3-2018 Operating Performance
17
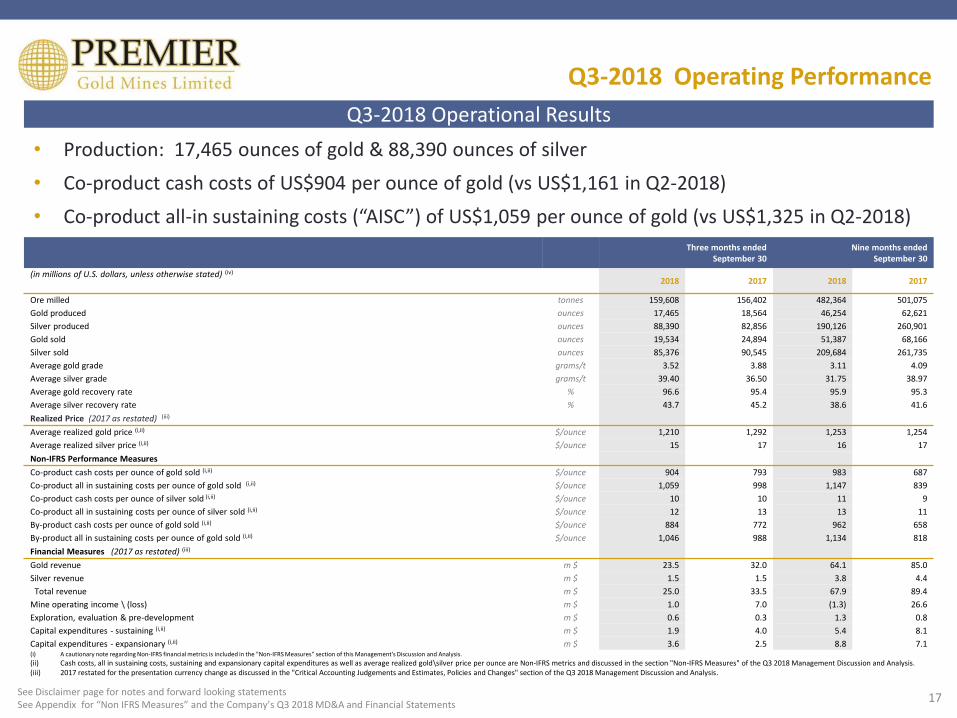
Q3-2018 Operational Results
• Production: 17,465 ounces of gold & 88,390 ounces of silver
• Co-product cash costs of US$904 per ounce of gold (vs US$1,161 in Q2-2018)
• Co-product all-in sustaining costs (“AISC”) of US$1,059 per ounce of gold (vs US$1,325 in Q2-2018)
Three months ended September 30
Nine months ended September 30
(in millions of U.S. dollars, unless otherwise stated) (iv)
2018 2017 2018 2017
Ore milled tonnes 159,608 156,402 482,364 501,075
Gold produced ounces 17,465 18,564 46,254 62,621
Silver produced ounces 88,390 82,856 190,126 260,901
Gold sold ounces 19,534 24,894 51,387 68,166
Silver sold ounces 85,376 90,545 209,684 261,735
Average gold grade grams/t 3.52 3.88 3.11 4.09
Average silver grade grams/t 39.40 36.50 31.75 38.97
Average gold recovery rate % 96.6 95.4 95.9 95.3
Average silver recovery rate % 43.7 45.2 38.6 41.6
Realized Price (2017 as restated) (iii)
Average realized gold price (i,ii) $/ounce 1,210 1,292 1,253 1,254
Average realized silver price (i,ii) $/ounce 15 17 16 17
Non-IFRS Performance Measures
Co-product cash costs per ounce of gold sold (i,ii) $/ounce 904 793 983 687
Co-product all in sustaining costs per ounce of gold sold (i,ii) $/ounce 1,059 998 1,147 839
Co-product cash costs per ounce of silver sold (i,ii) $/ounce 10 10 11 9
Co-product all in sustaining costs per ounce of silver sold (i,ii) $/ounce 12 13 13 11
By-product cash costs per ounce of gold sold (i,ii) $/ounce 884 772 962 658
By-product all in sustaining costs per ounce of gold sold (i,ii) $/ounce 1,046 988 1,134 818
Financial Measures (2017 as restated) (iii)
Gold revenue m $ 23.5 32.0 64.1 85.0
Silver revenue m $ 1.5 1.5 3.8 4.4
Total revenue m $ 25.0 33.5 67.9 89.4
Mine operating income \ (loss) m $ 1.0 7.0 (1.3) 26.6
Exploration, evaluation & pre-development m $ 0.6 0.3 1.3 0.8
Capital expenditures - sustaining (i,ii) m $ 1.9 4.0 5.4 8.1
Capital expenditures - expansionary (i,ii) m $ 3.6 2.5 8.8 7.1(i) A cautionary note regarding Non-IFRS financial metrics is included in the "Non-IFRS Measures" section of this Management's Discussion and Analysis.
(ii) Cash costs, all in sustaining costs, sustaining and expansionary capital expenditures as well as average realized gold\silver price per ounce are Non-IFRS metrics and discussed in the section "Non-IFRS Measures" of the Q3 2018 Management Discussion and Analysis.(iii) 2017 restated for the presentation currency change as discussed in the "Critical Accounting Judgements and Estimates, Policies and Changes" section of the Q3 2018 Management Discussion and Analysis.
See Disclaimer page for notes and forward looking statementsSee Appendix for “Non IFRS Measures” and the Company’s Q3 2018 MD&A and Financial Statements

Performance - Production
18See Disclaimer page for notes and forward looking statementsSee Appendix the company’s Nov 6, 2018 Press Release and 2018 MD&A and Financial Statements
Monthly Production - 2018
• Production is weighted to the second half of the year owing to delays in developing the Diluvio andRey de Oro deposits
• Monthly production in October was the best to-date in 2018
38154259
5706
6635
5926
4904
7918
0
1000
2000
3000
4000
5000
6000
7000
8000
9000
April May June July August September October
Go
ld O
un
ces
Q2 – 13,780 ounces Q3 – 17,465 ounces

Reserve Growth & Quality Production
19
• Mercedes (Corona de Oro)
• Barrancas - Lagunas (Future access to Marianas)
• Klondike - Rey De Oro (RDO development underway)
• Lupita - Diluvio (Both now being developed)
LAGUNAS
CHIPOTLE
Exploration Opportunity• District-wide exploration target studies have identified ~45 km
of untested structures
• Limited drilling has been completed outside of existingresource areas
• District has excellent potential to host additional veinsystems
• Primary targets for reserve and resource definition in 2018include Aida, Rey de Oro, Diluvio/Lupita and Marianas
• Exploration drilling has identified prospective new veinhorizons at Axis, Reyna and Olvidada
MARIANAS
Resources Identified in Four Main ZonesCHIPOTLE
MARIANAS
DILUVIO
LUPITA
REY DE ORO& OFFSETKLONDIKE
AXIS
MERCEDES
BARRANCAS
Post-Mineral Sedimentary and Volcanic Rocks
LAGUNAS
1000m
BELLOTA
OLVIDADA
REYNA
See Disclaimer page for notes and forward looking statements
AIDA

~250m
Mercedes Mine, Mexico
Marianas Zone
(Perspective view looking northeast)
• Marianas represents the down-plunge extension of the higher-grade, main Mercedes mine trend
• Previous drilling returned multiple intercepts suggesting a zone containing higher than current reserve grades
• Deposit remains open in multiple directions and represents one of the primary exploration targets at Mercedes
• Current drill program designed to upgrade Marianas to reserves in 2019
Historic surface drillingLagunas
Gap Barrancas
Marianas
See Disclaimer page for notes and forward looking statements 20
Barrancas/Lagunas Mineralization
MarianasMineralization
HangingwallExploration Ramp
• Definition drill program underway• First production targeted in late 2019

21
Marianas Zone – Longitudinal Section
Mercedes Mine, Mexico
NW SELooking NE
Not part of current reserves – drift underway from Lagunas for underground delineation drilling in H2-2018
M-640 1.61 m @ 14.50 Au g/t, 17.00 Ag g/t
M-639 3.04 m @ 12.69 Au g/t, 11.50 Ag g/t
M-716 4.68 m @ 7.57 Au g/t, 7.03 Ag g/t
Lagunas
Marianas
G x T
AuEq g/t
M-651 4.58 m @ 7.55 Au g/t, 10.72 Ag g/t
See Disclaimer page for notes and forward looking statements
M-710 5.09 m @ 12.21 Au g/t
M-655 4.89 m @ 17.52 Au g/t, 11.10 Ag g/t
OPEN

22
Rey de Oro Zone
Mercedes Mine, Mexico
• Near-mine drilling to replace mineral reserves is displaying extremely high grades located on-strike from new mineworkings at Rey de Oro
• Some of the best widths intersected to-date in the 2018 drill program
• Zone remains open up-plunge, down-plunge, and along strike
• Mining high-grade area is expected to begin in Q4-2018, expected to contribute to the H2 production increase
• Drilling continues to test the on-strike potential from surface and underground
UG-RDO18-01329.65m @ 12.64 g/t Au, 240.06 g/t Ag
UG-RDO18-0089.20m @ 8.33 g/t Au, 67.66 g/t Ag
UG-RDO18-00621.95m @ 36.65 g/t Au, 171.30 g/t Ag
UG-RDO18-00216.55m @ 6.21 g/t Au, 101.83 g/t Ag
UG-RDO18-00720.50m @ 8.10 g/t Au, 121.32 g/t Ag
See Disclaimer page for notes and forward looking statements
NW SELooking NE
Longitudinal Section View

Advanced-Exploration / Development
23See Disclaimer page for notes and forward looking statementsSee Appendix for “Non IFRS Measures” and complete production guidance
Organic Growth: One Pipeline - Two Projects
• Advancing permitting to develop two new mines in mine-friendly districts within North America
• Cove: Battle Mountain Trend – Nevada, USA
• Greenstone Gold: Beardmore-Geraldton Camp – Ontario, Canada
Cove, Nevada Greenstone Gold, Ontario
• Go-forward initiatives:
• Hydrological flow-testing
• Preliminary Economic Assessmentcompleted in H1 - 2018
• Underground development plannedfollowed by definition drilling fromramp
• Feasibility and deposit developmentin 2019-2020
• Go-forward initiatives:
• EA and EIS have been submitted toregulatory agencies – permittingprocess underway
• Continued consultation with localcommunities
• Centerra sole-funding ongoing work$75.5M remaining (September 30,2018)

Cove & McCoy-Cove, Nevada
24
• Located in the Battle Mountain Trend, Nevada
• Past production: 3.3 M oz Au and 110.0 M oz Ag
• Recently signed joint venture of exploration property withBarrick Gold (earning 60% through expenditures of US$22.5Million over 4.5 years)
• Premier retains 100% ownership of main Cove deposit
Overview
Key Metrics
Heart of the Battle Mountain Trend
Project Highlights
Ownership Premier Gold 100%
Stage Exploration – Resource Definition
Mine Type (potential) Underground
Processing Plan Third Party Roaster/Autoclave
Mineral Resources
CategoryTonnes
(Mt)Au
(g/t)Ag
(g/t)
Contained Ounces
Gold (koz )
Silver (koz )
Indicated 0.948 11.21 29.53 342 900
Inferred 3.658 11.24 20.90 1,322 2,457
• PEA concludes robust economics with low up-front capital
• Substantial upside exists with deposits remaining open forexpansion and a renewed exploration effort from the JV lands
• Go-forward initiatives:
• Hydrological flow testing
• Underground infrastructure development followed bydefinition drilling from ramp
• Feasibility and deposit development in 2019-2020
• Drilling underway on JV property (new discovery)See Disclaimer page for notes and forward looking statements
Phoenix Mine (NEM)+200,000 oz Au/yr
100% PG

25
Vent #1
Vent #2
PEA Mine Development
Helen Gap
CSD
2201 (polymetallic)
Cove Pit2.6M oz Au, 100M oz+ Ag
Historic Production
NW SE
> 15.0 g/t Au
> 10.0 g/t Au
> 7.5 g/t Au
> 5.6 g/t Au
Gold Grade
100 m
OPEN
Cove Property, Nevada
PEA was completed solely on the Helen and Gap (refractory) deposits
After-tax NPV 5%: $143.0 MAfter-tax IRR: 48%
PEA Production Assumptions
Tons Mined – Average Gold Grade 2,932,000 Tons @ 0.305 oz/t (10.46 g/t)
Recovered Gold 740,000 ounces
2201 Tons opt Au oz.
Inferred 305,000 0.596 169,000
See Disclaimer page for notes and forward looking statements

Underground Exploration Program
26
Underground Program – Delineation & Expansion Drilling
Gap
CSD
Helen
• Underground delineation drill program to upgrade resources & expand Gap Zone beneath the Cove pit
• Final step-out holes suggest excellent potential to define additional resources along strike
• Drilling is underway on the Barrick JV lands – initial targets include Lakeside (Cove Ext) and Windy Point (Helen Ext)
Gap
CSD
Gap Extension
300mPG-01
28.05 g/t Au – 4.50 m
PG16-018.73 g/t Au – 6.30 m
PB18-02
See Disclaimer page for notes and forward looking statements
- New mineralized intercept
HE18-02
HE18-01G

McCoy Cove Property
27
• Recent exploration has identified the potential for parallel “trends”• Drilling has discovered high-grade mineralization south of the main deposit• Surface work has identified a prominent soil and rock chip anomaly at Alpha• Drilling underway to follow-up on new intercepts – both on JV and 100%
lands
HE18-01G3.0 m - 8.04 g/t Au
HE18-024.6 m - 12.69 g/t Au
- Soil anomaly and high-graderock chip samples including105.0 g/t Au (51 g/t Ag) & 17.2g/t Au (91 g/t Ag) with Carlin-style geochemistry
- Elevated Pb-Zn: 8.5 g/t Au (8%Pb, 242 g/t Ag) chip sample
Premier 100%Premier-Barrick JV
= 2018 drilling
Helen
Gap
CSD / 2201
PB18-022.74 m – 5.00 g/t Au, 410 g/t Au, 5.7% Zn,
5.0% Pb
See Disclaimer page for notes and forward looking statements
McCoy Cove Property
28
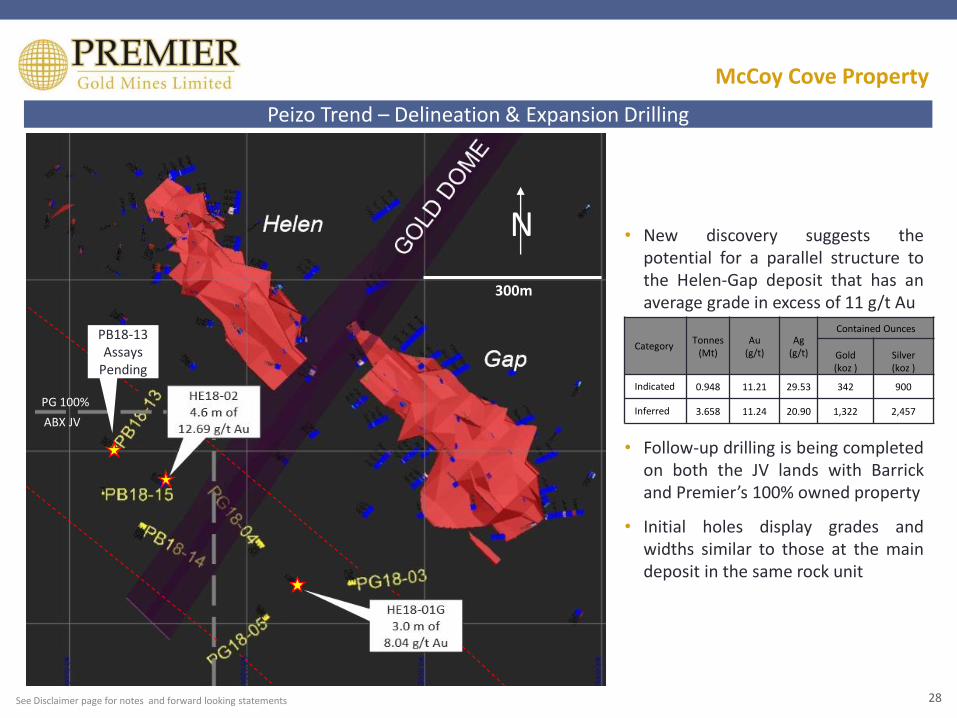
Peizo Trend – Delineation & Expansion Drilling
• New discovery suggests thepotential for a parallel structure tothe Helen-Gap deposit that has anaverage grade in excess of 11 g/t Au
• Follow-up drilling is being completedon both the JV lands with Barrickand Premier’s 100% owned property
• Initial holes display grades andwidths similar to those at the maindeposit in the same rock unit
CategoryTonnes
(Mt)Au
(g/t)Ag
(g/t)
Contained Ounces
Gold (koz )
Silver (koz )
Indicated 0.948 11.21 29.53 342 900
Inferred 3.658 11.24 20.90 1,322 2,457
N
PG 100%
ABX JV
300m
See Disclaimer page for notes and forward looking statements
PB18-13Assays
Pending
Greenstone Property, Ontario
29See Disclaimer page for notes and forward looking statements and the Company’s Q3 2018 MD&A and Financial Statements
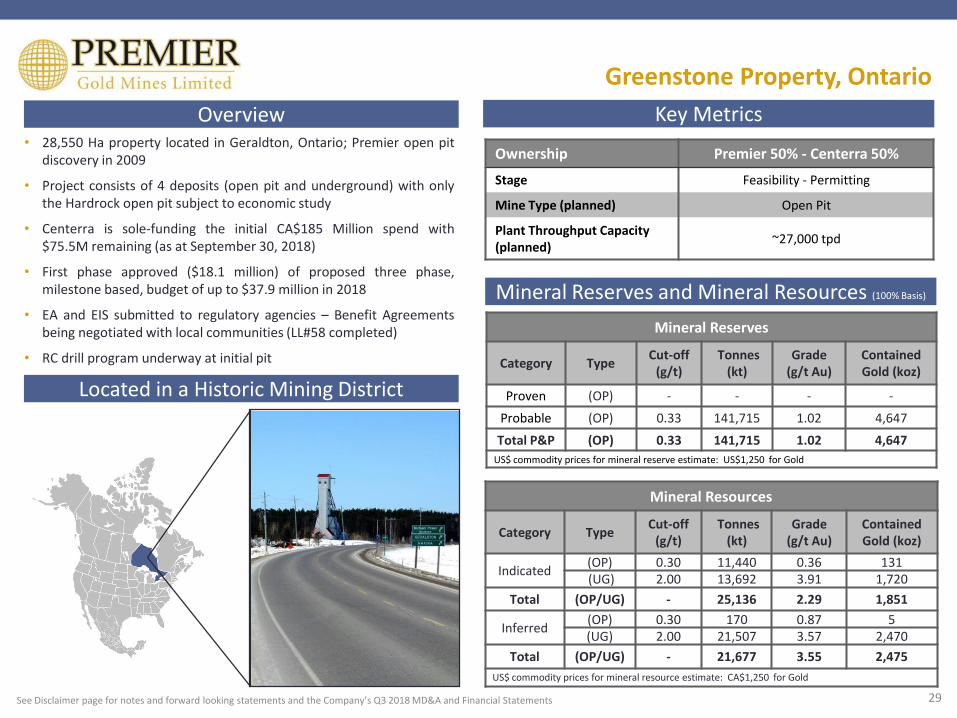
Overview Key Metrics
Located in a Historic Mining District
Mineral Reserves and Mineral Resources (100% Basis)
• 28,550 Ha property located in Geraldton, Ontario; Premier open pitdiscovery in 2009
• Project consists of 4 deposits (open pit and underground) with onlythe Hardrock open pit subject to economic study
• Centerra is sole-funding the initial CA$185 Million spend with$75.5M remaining (as at September 30, 2018)
• First phase approved ($18.1 million) of proposed three phase,milestone based, budget of up to $37.9 million in 2018
• EA and EIS submitted to regulatory agencies – Benefit Agreementsbeing negotiated with local communities (LL#58 completed)
• RC drill program underway at initial pit
Mineral Reserves
Category TypeCut-off
(g/t)Tonnes
(kt)Grade
(g/t Au)ContainedGold (koz)
Proven (OP) - - - -
Probable (OP) 0.33 141,715 1.02 4,647
Total P&P (OP) 0.33 141,715 1.02 4,647
US$ commodity prices for mineral reserve estimate: US$1,250 for Gold
Mineral Resources
Category TypeCut-off
(g/t)Tonnes
(kt)Grade
(g/t Au)ContainedGold (koz)
Indicated(OP) 0.30 11,440 0.36 131(UG) 2.00 13,692 3.91 1,720
Total (OP/UG) - 25,136 2.29 1,851
Inferred(OP) 0.30 170 0.87 5(UG) 2.00 21,507 3.57 2,470
Total (OP/UG) - 21,677 3.55 2,475
US$ commodity prices for mineral resource estimate: CA$1,250 for Gold
Ownership Premier 50% - Centerra 50%
Stage Feasibility - Permitting
Mine Type (planned) Open Pit
Plant Throughput Capacity (planned)
~27,000 tpd

Feasibility Study Results (Premier Case)
30As per Premier’s 50% case – see press release dated Nov 16, 2016See Disclaimer page for notes and forward looking statements
N
Operating Cash Flow Summary (M CA$)
Gross Revenue 6,813
Total Operating Costs (2,950)
Operating Cash Flow Before Tax 3,845
Capex/Salvage/Closure (1,520)
Taxes (689)
Project Economics Before-Tax Results
Net Cash Flow (M CA$) 2,326
NPV 5% (M CA$) 607*
Payback Period (years) 3.9
IRR (%) 21.1%*
Project Economics After-Tax Results
Net Cash Flow (M CA$) 1,636
NPV 5% (M CA$) 414*
Payback Period (years) 4.5
IRR (%) 17.5%*
Project Highlights
• LOM production: 14.5 year mine life - 4.2 M ounces of gold
• LOM grade: 1.11 g/t Au prior to low-grade stockpiles (1.02g/t Au including stockpiles)
• Annual production: Approximately 300,000 ounces per year(excluding stockpiles)
• Additional development opportunities:
• Hardrock underground deposit located down-plunge of pit
• High-grade Brookbank deposit
31
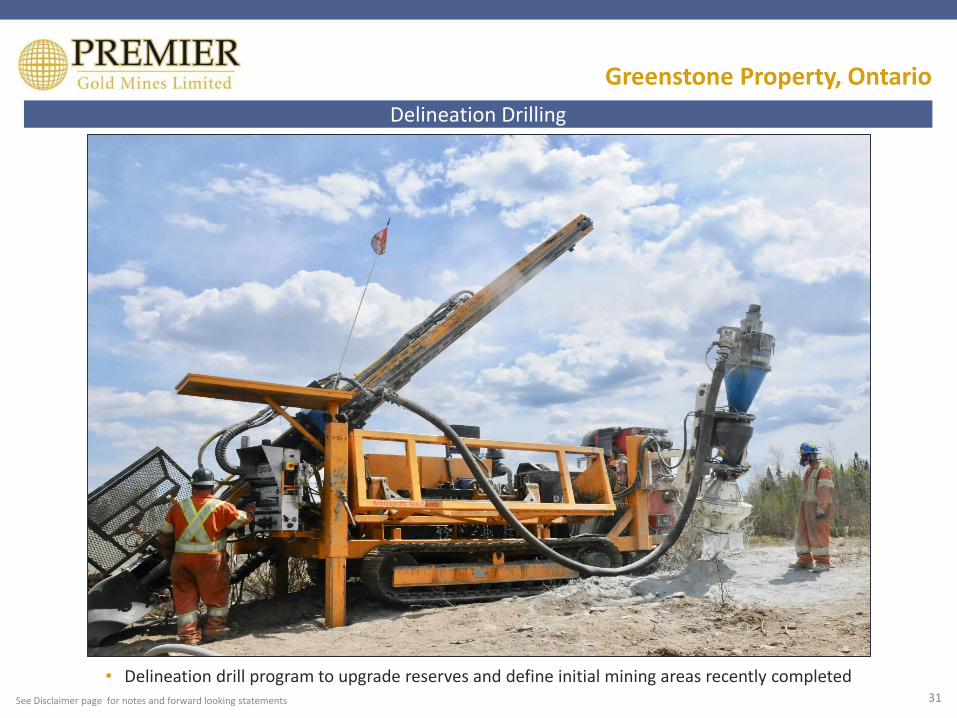
Delineation Drilling
• Delineation drill program to upgrade reserves and define initial mining areas recently completedSee Disclaimer page for notes and forward looking statements
Greenstone Property, Ontario

Exploration
32
Defining the Mines of Our Future
• Defining future resources through sustained exploration focus
• Excellent potential for new discoveries in some of the world’s most prolific gold districts
Goldbanks-Rye, NevadaRed Lake, Ontario
Hasaga Mineral Resources
Category TypeCut-off
(g/t)Tonnes
(kt)Grade
(g/t Au)ContainedGold (koz)
Indicated (OP) 42.29 0.83 1,124Inferred (OP) 25.14 0.78 631
US$ commodity prices for mineral resource estimate: US$1,400 for Gold
• Red Lake has seen continuous productionsince the mid 1920’s with nearly 30 Mounces of gold produced at an averagegrade of +15 g/t Au (as at Dec 31, 2017)
• The Hasaga/Howey mines produced~640,000 ounces of gold (1930-1952)
• Historic underground mining wasfocused on bulk mining zones hosted in aporphyry rock unit (Hasaga grade 4.94g/t Au)
• Latest drilling includes Hole HMP176W3- 39.0 meters (23.4 meters true width) at5.69 g/t Au
• Consolidated land package is host toone of the most extensive knownepithermal vein systems in NorthAmerica
• Potential for open pit and undergroundmineralization
• Option to acquire a 50% interest in theGoldbanks Property from Kinross Goldby spending US$20M
• Option to acquire a 100% interest inthe Rye Property from Barrick Gold byspending US$3.0M
• Drilling underway
See Disclaimer page for notes and forward looking statements

Summary
33
• Growing Production:– Two new mine developments underway at South Arturo in 2018 (El Nino & Phase 1 open pit)
– Two projects currently being permitted for future development (Cove & Hardrock)
• Growing reserves and resources:– 2019 updates planned for South Arturo, Mercedes and Hardrock
– New discovery at McCoy-Cove offers future upside opportunity
– Sustained exploration effort across entire project portfolio
• Growing Cash Flow:– Focused on delivering long-term cash flow through development of project pipeline
A World of Opportunity
See Disclaimer page for notes and forward looking statements

Key Contacts
34
Ewan Downie 807.346.1390President & CEO
John Begeman 605.484.3701Executive Chairman
Stephen McGibbon 613.376.6782Executive Vice-PresidentCorporate & Project Development
Matthew Gollat 807.346.1397Vice-PresidentBusiness Development
A World of OpportunityPROVEN MANAGEMENT | WORLD-CLASS DISTRICTS | SAFE JURISDICTIONS | SENSIBLE PARTNERSHIPS
Symbol: PG Exchange: TSX

Our Leadership
A-1
John Begeman: Executive ChairmanOver 35 years experience in mining - Former VP western operations for Goldcorp, COO Wolfden Resources, President of Avion Gold Corp and is currently a director of Yamana Gold Inc. and
African Gold Group Inc.
Ewan Downie: CEO, President and DirectorOver 25 years experience in the exploration and mining industry - Founder of Wolfden Resources - recipient of the PDAC “Bill Dennis Prospector Of The Year” award and several Exploration
and Development awards from the Northwestern Ontario Prospectors Association
Steve Filipovic: Chief Financial OfficerChartered Professional Accountant with over 18 years’ experience in financial management and reporting, M&A, and international risk management, taxation and structuring. Previously
held senior finance and director roles with several listed mining companies.
Stephen McGibbon: Executive Vice-President Corporate & Project DevelopmentOver 30 years of exploration, mine production and management experience - Former Chief Geologist and Exploration Manager at the Red Lake Mine (Goldcorp) and senior member of the
team that discovered the “High Grade Zone”
Charlie Ronkos: Executive Vice-President Project Development, AmericasMore than 38 years of exploration and mining experience - formerly Executive Vice President Goldcorp Inc. and associated with the discovery of more than 40 million ounces of gold and 1.2
billion ounces of silver
Brent Kristof: Senior Vice-President OperationsOver 35 years of experience in and leadership of underground and surface mining operations. Previously COO of Klondex, GM (Turquoise Ridge Mine), and several years managing
operations for Newmont and Barrick in Canada, Nevada, Australia, and Papua New Guinea.
Claude Lemasson: DirectorMore than 20 years of mining and development experience - Previously held senior mine development and operational roles with Goldcorp Inc. - formerly President and CEO Guyana
Goldfileds Inc. - currently President and CEO of Eastmain Resources
Ron Little: DirectorMore than 30 years experience in the mining industry – Formerly President and CEO of Orezone Gold Corporation
Tony Makuch: DirectorMore than 20 years of direct mining experience - formerly Executive Vice President / President of Canadian Operations of Tahoe Resources Inc., President and CEO of Lake Shore Gold Corp. -
currently President and CEO of Kirkland Lake Gold
John Seaman: DirectorFormer CFO of Premier Gold Mines and Wolfden Resources Inc. - Currently President and CEO of a large private security Company
Mike Vitton: DirectorOver 30 years experience in the mining finance industry - Formerly Executive Managing Director, Head, US Equity Sales, BMO Capital Markets, Seat Holder, NYSE; and President, New York
Society of Metals Analysts.

Company Snapshot
A-2
(1) As at September 30, 2018(2) Source: TSX infosuite and Sedi as at August 27, 2018(3) Includes Ewan DownieSee Disclaimer page for notes and forward looking statements
Shares i/o 202,964,036(1)
Options 9,755,000(1)
RBC Capital Markets Mark Mihaljevic
CanaccordGenuity Tom Gallo
Scotia Capital Ovais Habib
CIBC World Markets Bryce Adams
TD Securities Daniel Earle
Cormark Securities Tyron Breytenbach
BMO Capital Markets Andrew Mikitchook
Fidelity
Orion Mine Finance
Van Eck Associates
Tocqueville
Vanguard
Top 5 Shareholders(2) (~36%)
Total Insiders(3) 6,164,169
Ewan Downie 4,045,278
Insiders(2)
Share Structure Analyst Coverage

Non IFRS Measures, Production Guidance
A-3
NON-IFRS MEASURES
The Company has included certain terms or performance measures commonly used in the mining industry thatare not defined under International Financial Reporting Standards (“IFRS”) in this document. These include:earnings before interest, tax, depreciation and amortization (EBITDA), free cash flow, cash cost per ounce sold,all in sustaining cost (“AISC”) per ounce sold and average realized price per ounce. Non-IFRS measures do nothave any standardized meaning prescribed under IFRS, and therefore, they may not be comparable to similarmeasures employed by other companies. The data presented is intended to provide additional information andshould not be considered in isolation or as a substitute for measures prepared in accordance with IFRS andshould be read in conjunction with the Company's consolidated financial statements. Readers should refer tothe Company’s Management’s Discussion and Analysis under the heading “Non-IFRS Measures” for a moredetailed discussion of how such measures and are calculated.
Gold Guidance 2018
MineProduction
ouncesCash Cost per ounce
All-in Sustaining Cost per ounce
South Arturo 20,000 – 25,000 $425 - $475 $475 - $525
Mercedes 70,000 – 75,000 $875 - $925 $1000 - $1050
Consolidated 90,000 - 100,000 $775 - $825 $900 - $950Mercedes mine is forecasting 225,000 - 250,000 oz silver for 2018.

Global Mineral Reserves & Resources
A-5See Disclaimer page for forward looking statements and cautionary notes on mineral reserve and mineral resource estimates
Global Reserves
Global ResourcesGOLD (Au) MEASURED RESOURCES INDICATED RESOURCES MEASURED+INDICATED RESOURCES INFERRED RESOURCES
PROPERTY
Tonnes
(Mt)
Grade
(g/t Au)
Au Ounces
(000's)
Tonnes
(Mt)
Grade
(g/t Au)
Au Ounces
(000's)
Tonnes
(Mt)
Grade
(g/t Au)
Au Ounces
(000's)
Tonnes
(Mt)
Grade
(g/t Au)
Au Ounces
(000's)
Greenstone* 2.03 1.07 70 18.38 2.27 1,340 20.41 2.15 1,410 13.68 3.09 1,360
Mercedes** 1.08 5.73 200 2.60 3.73 311 3.68 4.32 511 1.63 4.23 222
South Arturo (OP)** 1.95 1.19 74 5.58 1.12 201 7.53 1.14 275 0.50 0.45 7
South Arturo (U/G)** <0.01 9.99 1 0.04 9.19 10 0.04 9.24 11 0.08 9.37 24
McCoy-Cove*** - - - 0.61 11.57 228 0.61 11.55 228 3.38 12.17 1,322
Hasaga**** - - - 42.29 0.83 1,124 42.29 0.83 1,124 25.14 0.78 631
Rahill-Bonanza***** - - - - - - - - - 0.00 0.00 -
TOTAL 5.07 2.12 345 69.50 1.44 3,215 74.57 1.48 3,559 44.41 2.50 3,566
SILVER (Ag) MEASURED RESOURCES INDICATED RESOURCES MEASURED+INDICATED RESOURCES INFERRED RESOURCES
PROPERTY
Tonnes
(Mt)
Grade
(g/t Ag)
Ag Ounces
(000's)
Tonnes
(Mt)
Grade
(g/t Ag)
Ag Ounces
(000's)
Tonnes
(Mt)
Grade
(g/t Ag)
Ag Ounces
(000's)
Tonnes
(Mt)
Grade
(g/t Ag)
Ag Ounces
(000's)
Greenstone* - - - - - - - - - - - -
Mercedes** 1.08 60.66 2,115 2.60 36.65 3,063 3.68 43.72 5,178 1.63 33.99 1,783
South Arturo (O/P)** 1.95 6.93 434 5.58 6.14 1,102 7.53 6.35 1,537 0.50 3.83 61
South Arturo (U/G)** - - - - - - - - - - - -
McCoy-Cove*** - - - - - - - - - - - -
Hasaga**** - - - - - - - - - - - -
Rahill-Bonanza***** - - - - - - - - - - - -
TOTAL 3.03 26.13 2,549 8.18 15.84 4,165 11.21 18.63 6,715 2.13 26.92 1,845
GOLD (Au) PROVEN RESERVES PROBABLE RESERVES PROVEN+PROBABLE RESERVES
PROPERTY
Tonnes
(Mt)
Grade
(g/t Au)
Au Ounces
(000's)
Tonnes
(Mt)
Grade
(g/t Au)
Au Ounces
(000's)
Tonnes
(Mt)
Grade
(g/t Au)
Au Ounces
(000's)
Greenstone (Hardrock)* - - - 70.85 1.02 2,324 70.85 1.02 2,324
Mercedes** 0.24 5.10 40 3.05 3.85 378 3.29 3.94 417
South Arturo (O/P)** 1.51 3.27 159 1.04 2.52 84 2.55 2.97 243
South Arturo (U/G)** <0.01 12.85 1 0.08 9.57 25 0.09 9.70 27
TOTAL 1.75 3.55 200 75.02 1.17 2,810 76.77 1.22 3,010
SILVER (Ag) PROVEN RESERVES PROBABLE RESERVES PROVEN+PROBABLE RESERVES
PROPERTY
Tonnes
(Mt)
Grade
(g/t Ag)
Ag Ounces
(000's)
Tonnes
(Mt)
Grade
(g/t Ag)
Ag Ounces
(000's)
Tonnes
(Mt)
Grade
(g/t Ag)
Ag Ounces
(000's)
Greenstone (Hardrock)* - - - - - - - - -
Mercedes** 0.24 26.05 202 3.05 24.01 2,354 3.29 24.16 2,556
South Arturo (O/P)** - - - - - - - - -
South Arturo (U/G)** - - - - - - - - -
TOTAL 0.24 26.05 201.767 3.05 24.01 2,354 3.29 24.16 2,556