Embed Size (px)
Citation preview

Proud
to be
part of.
Corporate Presentation
August 2016

Corporate Presentation August 2016
Disclaimer
2
This presentation is not a prospectus, a statement in lieu of a prospectus, an offering circular, an offering memorandum, an advertisement, an offer or an offer document under
the Companies Act, 2013, the Securities and Exchange Board of India (Issue of Capital and Disclosure Requirements) Regulations, 2009, as amended, or any other applicable
law in India.
This presentation does not constitute or form part of and should not be construed as, directly or indirectly, any offer or invitation or inducement to sell or issue or an offer, or any
solicitation of any offer, to purchase or sell any securities. This presentation should not be considered as a recommendation that any person should subscribe for or purchase
any securities of Motherson Sumi Systems Limited with its subsidiaries and the promoter companies/entities of Motherson Sumi Systems Limited (collectively, the “Group”) and
should not be used as a basis for any investment decision.
The information contained in this presentation is only current as of its date, unless specified otherwise, and has not been independently verified. Please note that, you will not
be updated in the event the information in the presentation becomes stale. You must make your own assessment of the relevance, accuracy and adequacy of the information
contained in this presentation and must make such independent investigation as you may consider necessary or appropriate for such purpose. Moreover, no express or implied
representation or warranty is made as to, and no reliance should be placed on, the accuracy, fairness or completeness of the information presented or contained in this
presentation. Further, past performance is not necessarily indicative of future results. Any opinions expressed in this presentation or the contents of this presentation are
subject to change without notice. The presentation should not be construed as legal, tax, investment or other advice.
None of the Group or any of its affiliates, advisers or representatives accepts any liability whatsoever for any loss howsoever arising from any information presented or
contained in this presentation. Furthermore, no person is authorized to give any information or make any representation which is not contained in, or is inconsistent with, this
presentation. Any such extraneous or inconsistent information or representation, if given or made, should not be relied upon as having been authorized by or on behalf of the
Group.
The distribution of this presentation in certain jurisdictions may be restricted by law. Accordingly, any persons in possession of this presentation should inform themselves about
and observe any such restrictions.
This presentation contain certain statements of future expectations and other forward-looking statements, including those relating to the Group's general business plans and
strategy, its future financial condition and growth prospects, and future developments in its sectors and its competitive and regulatory environment. In addition to statements
which are forward looking by reason of context, the words ‘may’, ‘will’, ‘should’, ‘expects’, ‘plans’, ‘intends’, ‘anticipates’, ‘believes’, ‘estimates’, ‘predicts’, ‘potential’ or ‘continue’
and similar expressions identify forward- looking statements. All forward looking statements are subject to risks, uncertainties and assumptions that could cause actual results,
performances or events to differ materially from the results contemplated by the relevant forward looking statement. The factors which may affect the results contemplated by
the forward looking statements could include, among others, future changes or developments in (i) the Group’s business, (ii) the Group’s regulatory and competitive
environment, (iii) the information technology service sector, and (iv) political, economic, legal and social conditions in India and the United States. Given the risks, uncertainties
and other factors, viewers of this presentation are cautioned not to place undue reliance on these forward-looking statements.
The information contained herein does not constitute an offer of securities for sale in the United States or in any other jurisdiction. Securities may not be offered or sold in the
United States absent registration or an exemption from registration under the U.S. Securities Act of 1933, as amended.

Photo by Modestas Urbonas
To be a globally preferred solutions provider.
Corporate Presentation August 2016
The
vision of
the Group
has been the
same all along.
3
• Founded in 1975
• The Group1 has over 180 facilities
globally with presence in 25
countries
Note:
1 Company with its subsidiaries and the promoter companies/entities of the Company

Corporate Presentation August 2016 4
FOCUS ON CONSISTENT
OUTSTANDING PERFORMANCE
TRUST ASKED TO DO MORE
“PROUD TO BE PART” OF WAY
OF LIFE (PURPOSE)
INCREASE CONTENT/ VALUE PER
CAR
RETURN ON PURPOSE
• Focus on consistent outstanding performance:
– Aim to never compromise on product quality
– Focus on cost and capital efficiency (QCDDMSES)1
• Trust: Superior performance nurtures client
relationships
• Asked to do more:
– Leverage trust to enable greater client engagement
– Sole supplier status² and R&D collaboration
• Increase content/value per car: Trust and increased
engagement to drive cross-sell
• Pride in purpose/way of life: Sustainable value
creation, fuelling top and bottom line as well as the de-
risking
Key elements of Samvardhana Motherson group
(SMG) philosophy
Note:
1 Quality, Cost, Delivery, Development, Management, Safety, Environment and Sustainability
2 In select product segments

Corporate Presentation August 2016
MSSL… Stiff 5 year targets set… and achieved
Target set
in 2000
Actual
achieved
in 2005
Target set
in 2005
Actual
achieved
in 2010
Target set
in 2010
Actual
achieved
in 2015
Notes:
1 Sales considered is sale of products including traded goods (net of excise)
2 Including full turnover of Joint Ventures
3 Using RBI reference rate of INR/USD of March 31, 2005: Rs 43.75, March 31, 2010: Rs 44.89, March 31, 2015: Rs 62.50
4 Percentage Sales from outside India has been calculated as Sales of products (including traded goods from outside India ) / Total sales of products including traded goods (net of excise)
5 s: standalone; c: consolidated
6 Return on Capital Employed (ROCE) defined as Earnings Before Interest and Tax (excluding foreign exchange gain/ loss on long term borrowings, exceptional expenses and impairment loss/ reversal) divided
by Average Capital Employed (Capital + Reserves (excluding revaluation, amalgamation and capital reserves) + long-term borrowings + short-term borrowings+ current maturities of long-term borrowings +
Minority) for consolidated and as Earnings Before Interest and Tax (excluding foreign exchange gain/ loss on long term borrowings, exceptional expenses, dividend income from JVs and subsidiaries and
impairment loss/ reversal) divided by Average Capital Employed (Capital + Reserves (excluding revaluation, amalgamation and capital reserves) + long-term borrowings + short-term borrowings+ current
maturities of long-term borrowings – current investments – non current investments
7 Dividend payout ratio defined as proposed dividend including tax thereon divided by profit after tax (after minority interest and share of results of associates)
US$
1bn
(from ~US$
235m)3
US$
1.5bn3
Consolidated
sales1
INR
10,000m
US$
5bn3
US$
5.5bn3
INR
10,290m2 333 333 333
60% 70% Sales from
outside India4
30%
(from <1%) 29% 70% 85% 33 333 333
<20% 15%
Contribution
from individual
customers
<25% 27% 33 333
40%
37% s
22% c
Return on capital
employed5, 6 40% 39% s 40%
41% s
26% c 33 33 33
40%
44% s
32% c
Dividend
payout ratio5, 7 40% 43% 40%
62% s
37% c
333 33 33
333 Full achievement 33 Partial achievement
5

Corporate Presentation August 2016
Motherson Sumi Systems Limited ("MSSL")
overview
Wiring
Harness
Modules and
polymer
products
Rear view
mirrors
• Leading position in India across segments
• Serving global customers through 525 facilities across South Asia,
Mexico, Middle East, Europe, Thailand and Japan
• Key products:
• One of the largest moulded parts, assemblies and modules
suppliers to the European automotive industry as per LMC
Automotive1
• One of the leading modules suppliers to the Indian automotive
industry²
• 525 facilities across 14 countries
• Key products:
Shareholding Structure³
55%
27%
16%
Notes:
1 Through Samvardhana Motherson Peguform ("SMP")
2 Through Motherson Automotive Technologies and Engineering (MATE)
3 As of June 30, 2016 sourced from BSE Limited
4 MSSL's segment revenue share for FY16 excluding sales of services and other operating revenue of INR3,617m; other businesses including elastomer processing, machined metal components and environment
management systems contribute <1% to overall FY16 revenue
5 Includes subsidiaries and joint ventures
6 Others constitute 2% of the sales of products including traded goods (gross)
• Leading market share in the global exterior rear view mirrors
segment as per LMC Automotive
• 245 facilities across 5 continents serving global OEMs
• Key products:
Revenue share (%)4, 6
Revenue share (%)4, 6
Revenue share (%)4, 6
Indian
promoters
40.1%
Public
34.4%
Sumitomo Wiring
Systems
25.6%
Wiring harness
Bumper Module Door panel
Rear view mirror
6

Corporate Presentation August 2016
MSSL journey so far…
na na 301 592 956 1,103 1,145 1,157 1,530 2,304 2,965 4,188 5,899 7,812 10,155 15,276 20,281 25,956
67,022
81,756
147,022
252,253
303,580
344,903
380,335
FY75 FY86 FY94 FY95 FY96 FY97 FY98 FY99 FY00 FY01 FY02 FY03 FY04 FY05 FY06 FY07 FY08 FY09 FY10 FY11 FY12 FY13 FY14 FY15 FY16
MSSL revenue
1993
MSSL listed
on the
stock
exchange
1975
SMG was
formed
2000
Five-year
plan
announced
2009
Visiocorp
acquisition
to form
SMR3
2011
Peguform
acquisition
to form
SMP
2015–16
Current
market cap.2
US$ 6.6 bn
(Rs. in Million)
1986
Incorporated as
a joint venture
Notes:
1 Sales considered is sales of products including traded goods (net of excise) and represents standalone from FY75 to FY01 & consolidated from FY02 onwards
2 As on 18th August 2016 (INR/US$: 66.7939 based on RBI reference rate and closing share price of INR334.70)
3 Samvardhana Motherson Reflectec
7
1
Corporate Presentation August 2016
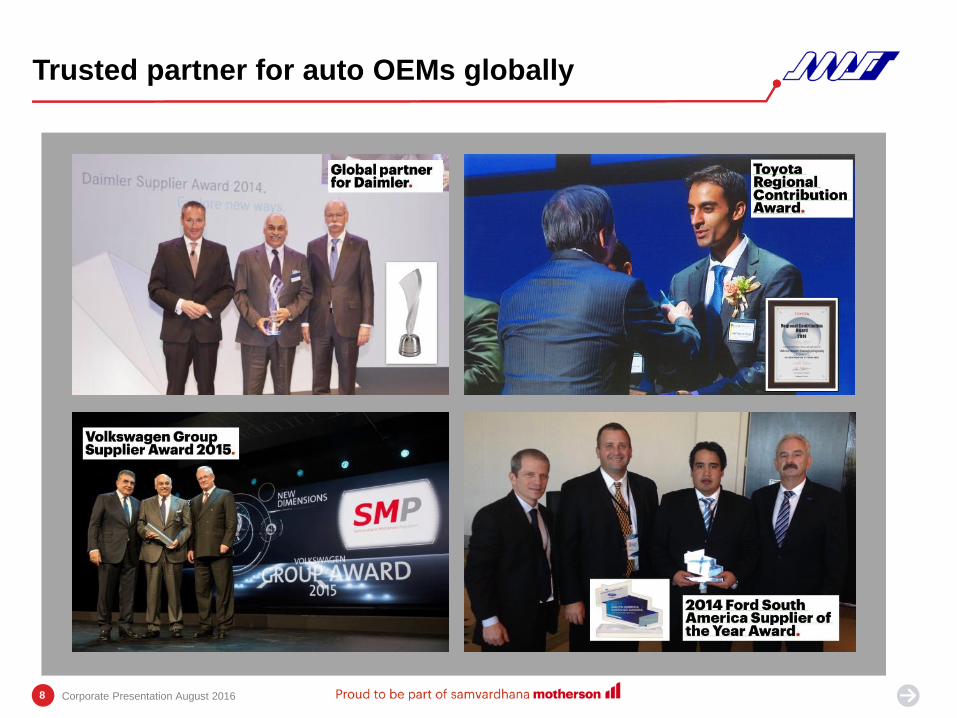
Trusted partner for auto OEMs globally
8

Corporate Presentation August 2016
Trusted partner for auto OEMs globally
9
Daimler
Best Performance
Award Partner for Asia
VW
Group Award Partner for
FAST Program
Maruti Suzuki
Overall Excellence Design & Development Safety

Corporate Presentation August 2016
Trusted partner for auto OEMs globally
10
Toyota
Supplier of the year
Golden Award Zero PPM Award PPM Performance Certificate of Recognition in
the area of Value Analysis
GM
Supplier Quality
Excellence Award
Supplier of the year
Honda Cars
Best Practice
Recognition
Silver Award for
Quality of spares
Recognition for
valuable contribution

Corporate Presentation August 2016
Trusted partner for auto OEMs globally
11
Hyundai
Renault Nissan
Overall Best QCDM
Performance Awards Special Contribution
Award
In Recognition of the excellent support
in RNAIPL product during torrential
Rain / flood in Nov-Dec 2015
Nissan
Supplier Best Practices
Poke Yoke Development
Best Overall
Performance
Best
Performer Supplier Quality
Certificate
Hyundai Mobis
Best Performance Letter of
Commendation

Corporate Presentation August 2016
Trusted partner for auto OEMs globally
12
Tata Motors
Mahindra Rise Suzuki Motorcycle
Vendor Performance
Award in the field of
Special Cost
Reduction Support
JCB
Best Quality
Performance Award
Valuable Contribution in development
of KUV100 & TUV 300
Annual Commodity
Award
Best Supplier
Quality
Best Vendor Quality
Rating Supplier Special Citation of
Distinction
Chairman’s Award
Special Citation of Distinction
Q.C.R.P.M Supplier
Performance

Corporate Presentation August 2016
Trusted partner for auto OEMs globally
13
Caterpillar John Deere NAACO / Hyster Yale
Platinum Level in
Supplier Quality
Excellence Process
Commendable
Performance for
India Business
Above and beyond Certificate of
Merit
Certificate of Honor
(100% Quality Product,
100% On Time Delivery)
Kobelco Tata Hitachi Toyota Boshoku
Partners in
Excellence Preferred Business
Partner Award of excellence for support in
aggressive Indigenization Supplier of the Year – Quality
Performance Rank 1
Corporate Presentation August 2016
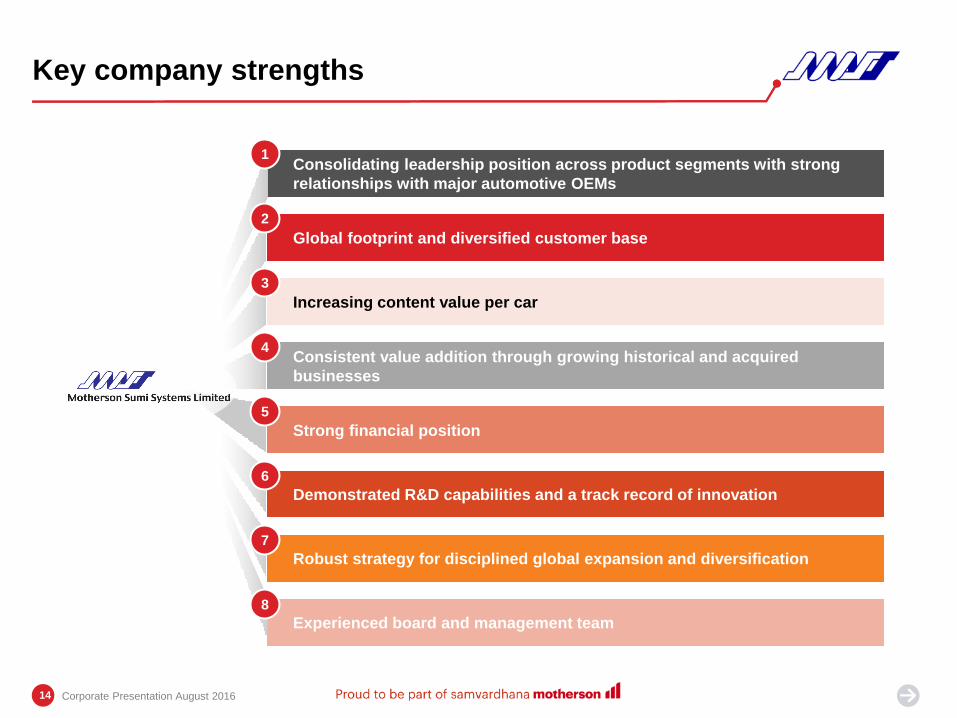
Key company strengths
Consolidating leadership position across product segments with strong
relationships with major automotive OEMs
Global footprint and diversified customer base
Increasing content value per car
Consistent value addition through growing historical and acquired
businesses
Strong financial position
Demonstrated R&D capabilities and a track record of innovation
Robust strategy for disciplined global expansion and diversification
Experienced board and management team
1
3
4
5
2
6
7
8
14

Corporate Presentation August 2016
Strong relationships with major automotive
OEMs in India…
By product
Customer Wiring harness Mirrors Polymers
Maruti
Hyundai¹
Mahindra
Honda
Toyota
Renault
Tata Motors
Ford
Strong relationship with major OEMs across products
Note:
1 Sales to Hyundai through joint venture, Kyungshin Industrial Motherson Ltd.
15
1
Corporate Presentation August 2016
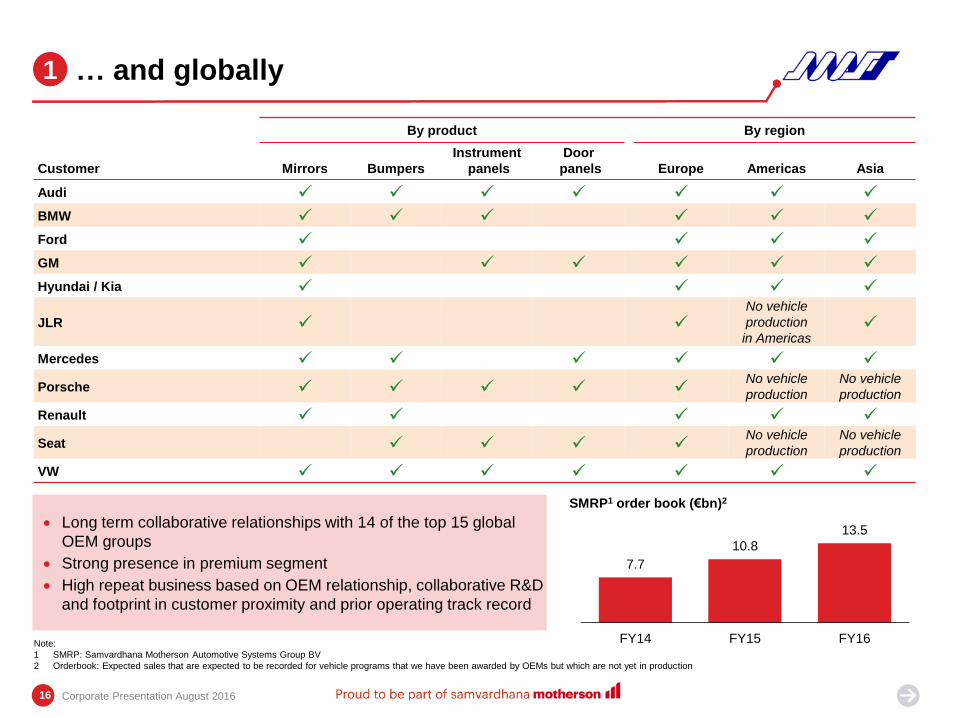
Long term collaborative relationships with 14 of the top 15 global
OEM groups
Strong presence in premium segment
High repeat business based on OEM relationship, collaborative R&D
and footprint in customer proximity and prior operating track record
… and globally
By product By region
Customer Mirrors Bumpers
Instrument
panels
Door
panels Europe Americas Asia
Audi
BMW
Ford
GM
Hyundai / Kia
JLR
No vehicle
production
in Americas
Mercedes
Porsche
No vehicle
production
No vehicle
production
Renault
Seat
No vehicle
production
No vehicle
production
VW
1
7.7
10.8
13.5
FY14 FY15 FY16
SMRP1 order book (€bn)2
Note:
1 SMRP: Samvardhana Motherson Automotive Systems Group BV
2 Orderbook: Expected sales that are expected to be recorded for vehicle programs that we have been awarded by OEMs but which are not yet in production
16

Corporate Presentation August 2016
20%
19%
6% 3% 7%
6%
5%
6%
5%
2%
21%
Audi
20%
Volkswagen
10%
Seat
7%
Daimler
7%
BMW
7%
Hyundai
6%
Ford
6%
Renault
Nissan
5%
Maruti
5%
Porsche
4%
Other
25%
Global footprint and diversified customer base
17
Local presence in all major vehicle production regions
Global footprint, aligned with that of customers provides competitive
advantage
– ability to supply to global platforms locally
Customer proximity with production sites near OEM assembly plants
– delivery on “Just-in-time" and "Just-in-sequence“ basis
– efficient inventory management
– high switching costs for customers
Modern facilities with high level of automation
Continued investment in the footprint to service growing order book
Diversified customer sales1
Split of facilities for MSSL2
● Long term collaborative relationships with 14 of
the top 15 global OEM groups
● Average relationship with 7 OEM customers of 40
years
2
P
P
P
P
FY 2014
FY 2016
Notes:
1 Excludes sales of services and other operating revenue of INR3,617m for FY'16 and
INR700m for FY'14
2 Includes subsidiaries and joint ventures
Region Number of facilities
Americas 18
Europe 36
India 67
ROW 29
Total 150
Corporate Presentation August 2016
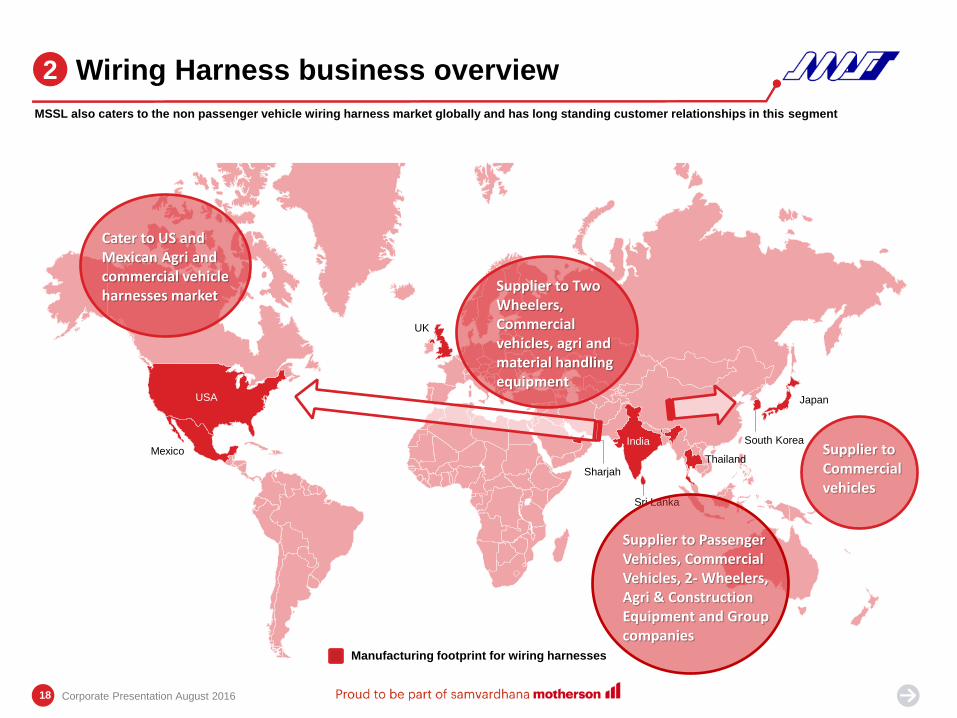
Wiring Harness business overview 2
MSSL also caters to the non passenger vehicle wiring harness market globally and has long standing customer relationships in this segment
Japan
South Korea India
Sri Lanka
Thailand
Sharjah
UK
USA
Mexico
Cater to US and Mexican Agri and commercial vehicle harnesses market
Supplier to Two Wheelers, Commercial vehicles, agri and material handling equipment
Manufacturing footprint for wiring harnesses
Supplier to Commercial vehicles
Supplier to Passenger Vehicles, Commercial Vehicles, 2- Wheelers, Agri & Construction Equipment and Group companies
18

Corporate Presentation August 2016
SMRP BV Global footprint 2
19
SMP division
SMR division
Corporate Presentation August 2016
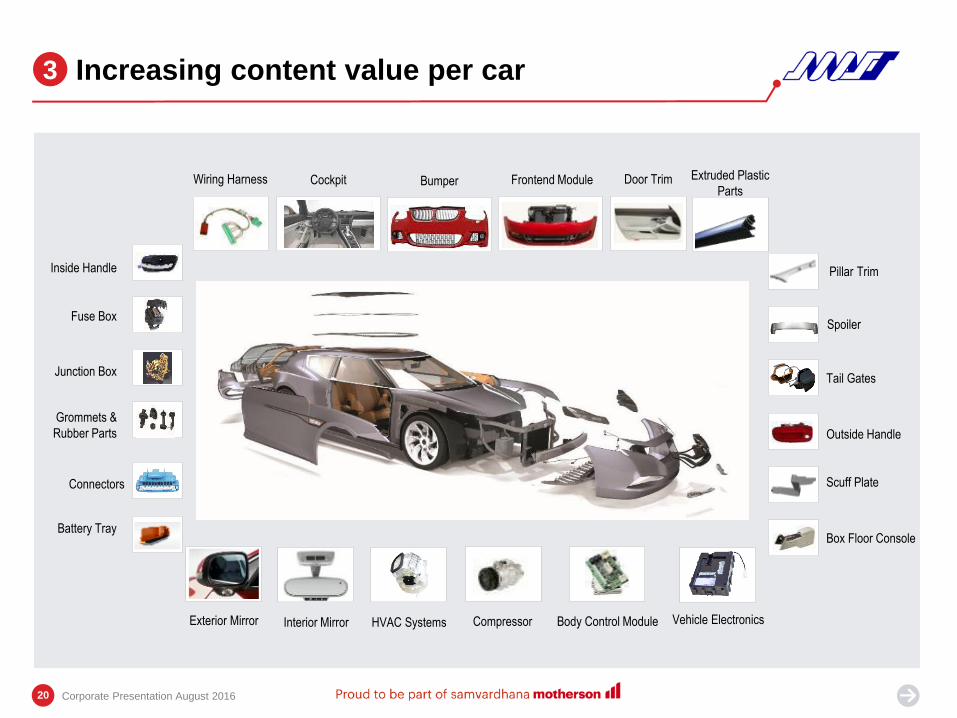
Increasing content value per car
20
3
Cockpit Bumper Frontend Module Door Trim
Exterior Mirror Interior Mirror HVAC Systems Vehicle Electronics
Fuse Box
Connectors
Grommets &
Rubber Parts
Junction Box
Outside Handle
Inside Handle
Tail Gates
Battery Tray Box Floor Console
Body Control Module
Pillar Trim
Scuff Plate
Spoiler
Wiring Harness
Compressor
Extruded Plastic
Parts
Corporate Presentation August 2016
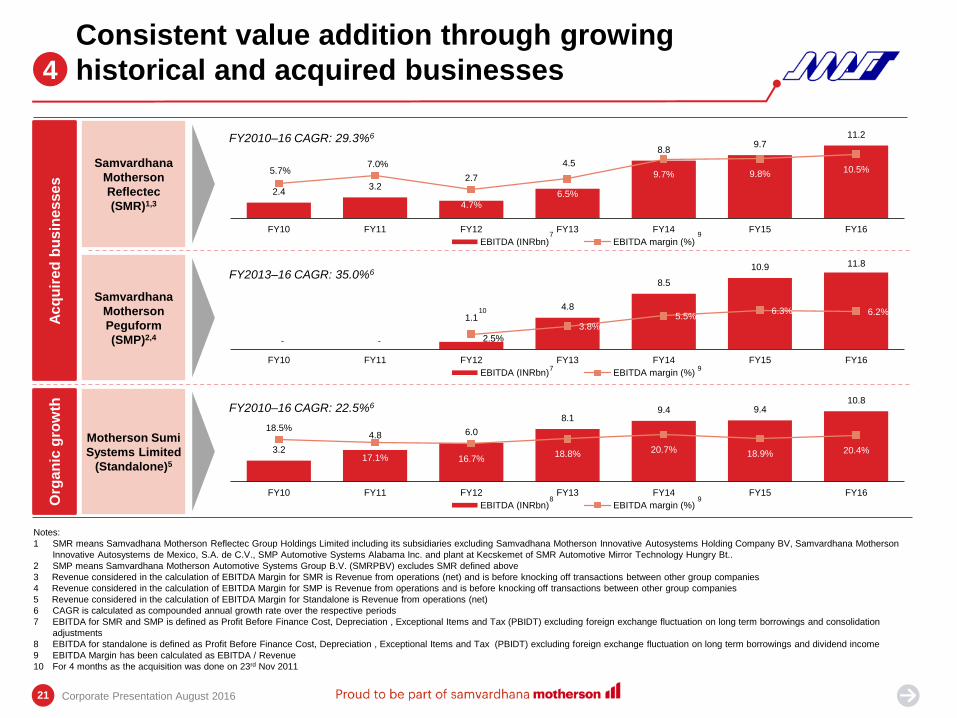
3.2
4.8 6.0
8.1 9.4 9.4
10.8
18.5%
17.1% 16.7% 18.8% 20.7% 18.9% 20.4%
FY10 FY11 FY12 FY13 FY14 FY15 FY16
EBITDA (INRbn) EBITDA margin (%)
1.1
4.8
8.5
10.9 11.8
2.5%
3.8% 5.5%
6.3% 6.2%
FY10 FY11 FY12 FY13 FY14 FY15 FY16
EBITDA (INRbn) EBITDA margin (%)
2.4 3.2
2.7
4.5
8.8 9.7
11.2
5.7% 7.0%
4.7% 6.5%
9.7% 9.8% 10.5%
FY10 FY11 FY12 FY13 FY14 FY15 FY16
EBITDA (INRbn) EBITDA margin (%)
4
Consistent value addition through growing
historical and acquired businesses
21
Notes:
1 SMR means Samvadhana Motherson Reflectec Group Holdings Limited including its subsidiaries excluding Samvadhana Motherson Innovative Autosystems Holding Company BV, Samvardhana Motherson
Innovative Autosystems de Mexico, S.A. de C.V., SMP Automotive Systems Alabama Inc. and plant at Kecskemet of SMR Automotive Mirror Technology Hungry Bt..
2 SMP means Samvardhana Motherson Automotive Systems Group B.V. (SMRPBV) excludes SMR defined above
3 Revenue considered in the calculation of EBITDA Margin for SMR is Revenue from operations (net) and is before knocking off transactions between other group companies
4 Revenue considered in the calculation of EBITDA Margin for SMP is Revenue from operations and is before knocking off transactions between other group companies
5 Revenue considered in the calculation of EBITDA Margin for Standalone is Revenue from operations (net)
6 CAGR is calculated as compounded annual growth rate over the respective periods
7 EBITDA for SMR and SMP is defined as Profit Before Finance Cost, Depreciation , Exceptional Items and Tax (PBIDT) excluding foreign exchange fluctuation on long term borrowings and consolidation
adjustments
8 EBITDA for standalone is defined as Profit Before Finance Cost, Depreciation , Exceptional Items and Tax (PBIDT) excluding foreign exchange fluctuation on long term borrowings and dividend income
9 EBITDA Margin has been calculated as EBITDA / Revenue
10 For 4 months as the acquisition was done on 23rd Nov 2011
Ac
qu
ire
d b
us
ine
sse
s
Org
an
ic g
row
th
Samvardhana
Motherson
Reflectec
(SMR)1,3
Samvardhana
Motherson
Peguform
(SMP)2,4
Motherson Sumi
Systems Limited
(Standalone)5
FY2010–16 CAGR: 29.3%6
FY2013–16 CAGR: 35.0%6
FY2010–16 CAGR: 22.5%6
- -
10
7
7
8
9
9
9

Corporate Presentation August 2016
2,500 6,150 30,847 25,650 110,250 201,318
537,384
1,466,732
2,914,861
5,635,461
FY94 FY98 FY01 FY03 FY04 FY05 FY08 FY13 FY14 FY16
04 Generating significant shareholder return
1,040 2,990 5,802 8,052 27,205 83,399 Cumulative Dividend 11,428 111,876
• Replace the bottom chart with stock price line chart super imposed with Market cap bar chart on the major acquisition dates with annotations
• The total value of 2500 =xx point should remain. However, calculation to be prepared as a back-up
188,763 188,763
Total Value of Rs 2,500 is
Rs 5,635,461 plus cumulative
dividend of Rs 188,763 = 2,330 times1
of the original investment value
22
Investment value in Rupees Note:
1 At closing rate of 12th Aug 2016
2 100 shares at IPO are equivalent to 17,085 shares currently as a result of corporate actions including 7 bonus issuances and 2 stock splits
4
• Limited equity capital raises historically
• INR29m IPO in FY94
• INR104m rights issuance in FY96
• EUR50m FCCB issuance in FY06

Investor Presentation August 2016
10.8
19.3
28.9 32.5
38.4
7.3% 7.6%
9.5% 9.4%
10.0%
5.0%
6.0%
7.0%
8.0%
9.0%
10.0%
11.0%
0.0
10.0
20.0
30.0
40.0
50.0
FY12 FY13 FY14 FY15 FY16
EBITDA EBITDA Margin
26.2% 16.8% 12.7% 15.3% 15.8%
73.8%
83.2%
87.3% 84.7%
84.2%
149.1
256.2
307.2
350.3
386.9
0
50
100
150
200
250
300
350
400
450
500
FY12 FY13 FY14 FY15 FY16
India Rest of the World
2.6 4.4
7.7 8.6
12.7
1.8% 1.8%
2.5% 2.5%
3.3%
0.0%
1.0%
2.0%
3.0%
4.0%
0.0
5.0
10.0
15.0
20.0
FY12 FY13 FY14 FY15 FY16
PAT PAT Margin
Delivering consistent growth while improving profitability
Total revenue1 Profits and margins
(IN
R b
n)
(IN
R b
n)
(IN
R b
n)
23
Notes: Consolidated financials
1 Total Revenue excluding interest income
2 CAGR is calculated as compounded annual growth rate over the respective periods
3 Split for India and Rest of the World excludes unallocated income
4 EBITDA defined as Profit Before Finance Cost, Depreciation , Exceptional Items and Tax (PBIDT) excluding foreign exchange fluctuation on long term borrowings
5 EBITDA Margin has been calculated as EBITDA / Revenue from operations (net)
6 Profit after tax (after minority interest and share of results of associates) (PAT)
7 PAT margin has been calculated as PAT / Revenue from operations (net)
5
CAGR: 37.3%
CAGR: 48.7%
India CAGR: 11.9%2, 3
Rest of the World CAGR: 31.2%2, 3
Overall CAGR: 26.9%2
4
Corporate Presentation August 2016
5
6 7

Investor Presentation August 2016 24
10.3 10.9 13.5
18.4 20.2
0.0
5.0
10.0
15.0
20.0
25.0
FY12 FY13 FY14 FY15 FY16
Capex
3.5 2.4 1.2 0.5
46.1
0.0
10.0
20.0
30.0
40.0
50.0
FY17 FY18 FY19 FY20 FY21
Robust balance sheet, well positioned for growth
24
Maintaining conservative capital structure…1, 2, 3
ROCE (%)6
(IN
R b
n)
(IN
R b
n)
(x)
5
15% 18%
26% 26% 27%
0%
10%
20%
30%
FY12 FY13 FY14 FY15 FY16
Debt maturity profile5
… while investing in growth
(IN
R b
n)
4
Notes: Consolidated financials
1 Total equity defined as Share capital plus reserves and surplus plus minority interest
2 Net debt defined as long-term borrowings + short-term borrowings+ current maturities of long-term borrowings net of cash and bank balances (excluding unpaid dividend account)
3 EBITDA defined as Profit Before Finance Cost, Depreciation , Exceptional Items and Tax (PBIDT) excluding foreign exchange fluctuation on long term borrowings
4 Capex defined as cash outflow from purchase of tangible/intangible assets less cash inflow from sale of tangible/intangible assets
5 Based on company information
6 Return on Capital Employed (ROCE) defined as Earnings Before Interest and Tax (excluding foreign exchange gain/ loss on long term borrowings, exceptional expenses and impairment loss/ reversal) divided by
Average Capital Employed (Capital + Reserves (excluding revaluation, amalgamation and capital reserves) + long-term borrowings + short-term borrowings+ current maturities of long-term borrowings+ Minority)
Corporate Presentation August 2016
23.7 26.9 37.5 43.4 56.9 41.5 43.1
39.3 32.4 44.1
3.9
2.2
1.4 1.0 1.1
0.0
1.0
2.0
3.0
4.0
5.0
0.0
30.0
60.0
90.0
120.0
FY12 FY13 FY14 FY15 FY16
Total Equity Net Debt Net Debt / EBITDA

Corporate Presentation August 2016
Motherson Innovations Overview
Increasing R&D focus on likely disruptive trend towards
autonomous driving
Solutions for enhanced safety, ergonomics, performance
and aesthetics
New, proprietary digital image processing technology underpinning
introduction of new high value solutions
– Intelligent Electronic Mirrors (currently being legalized in
many countries)
– New generation camera system
– Advanced driver assistance features
Currently holds approximately 900 patents
Intelligent Electronic Mirrors
Automotive Innovation
Specialized high-performance cameras
and expertise for package solutions
Highest quality displays for best visibility
and augmented information
Integrated intelligence for object detection
and lane recognition
Display integration by interior specialist SMP
Light transmissive
metal coatings
Environment-
friendly and highly
durable chrome
Suitable for multiple
market segments
Translucent metal surfaces for integration of
light for night branding
Surround view monitors which combine enhanced
visibility with intelligent assistance features
Digital cockpits with integrated vision system
monitors and augmented information
Noise-less actuator solutions based on
memory-shape alloy technology
Demonstrated R&D capabilities and a track
record of innovation 6
25
Advanced Materials and Surfaces
1
3 2

Corporate Presentation August 2016 26
Innovating for the future of driving 6
Natural Fibres in interior panels
Telescopic Mirrors
Intelligent blind spot cameras
Innovative metallic surfaces
Logo projection lamps
Intelligent Side Assist
Translucent Illuminated Metal
Digital rear view systems
Today Tomorrow After Tomorrow
Digital Rear Visions Systems
Intelligent Surround View Systems
Intelligent Rear Vision Systems
Sensor Fusion Surround Monitoring
Digital Cockpits
Our select R&D focus areas

Corporate Presentation August 2016
Robust Strategy for disciplined global
expansion and diversification 7
27
US$18 billion
FY19-20¹
01
40% ROCE
(consolidated)¹
02
03 3CX15 (individual customer,
component or country to have
revenue contribution of <15%)¹
04 40% of consol.
profit as dividend¹
VISION 20201
5 Y P
Drive further efficiency and
continue to improve cost
base and capex efficiency
5
Be a full system solutions
provider to the automotive
industry
1
Support customers through
strategic acquisitions while
maintaining financial
discipline
6
Increase customer
penetration and
diversification
Retain and strengthen
technological leadership
through continued focus on
R&D, innovation and
collaboration
Continue disciplined global
expansion and diversification
through selective
investments backed by new
orders
2
3
4
Note:
1 These numbers are the vision/aspirations of the Company and not projections that should be relied on
Corporate Presentation August 2016
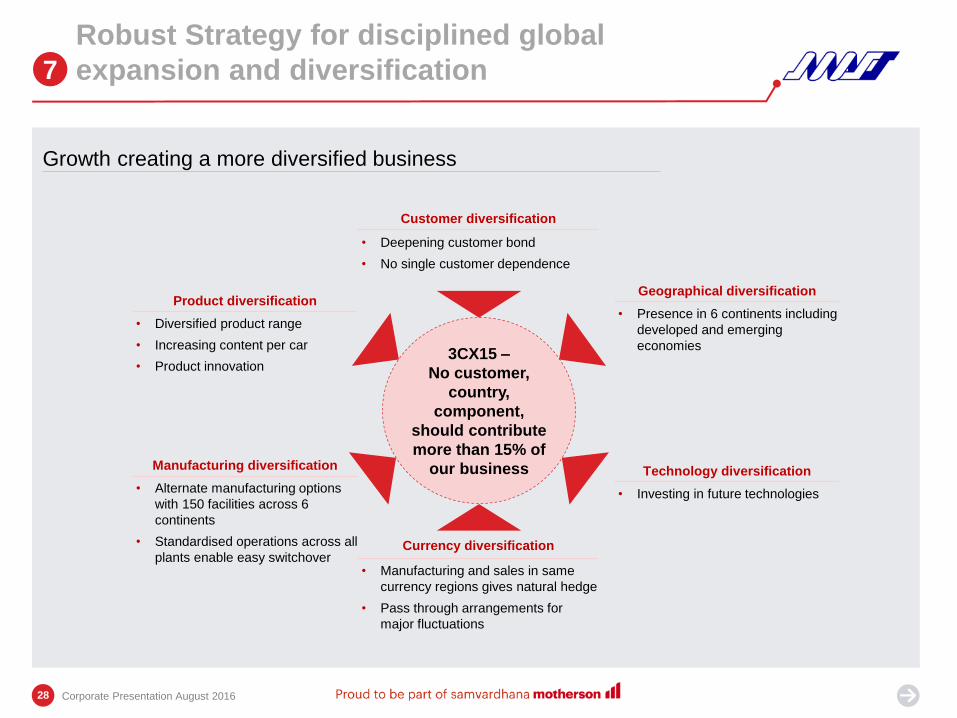
Robust Strategy for disciplined global
expansion and diversification 7
28
Growth creating a more diversified business
Geographical diversification
• Presence in 6 continents including
developed and emerging
economies
Manufacturing diversification
• Alternate manufacturing options
with 150 facilities across 6
continents
• Standardised operations across all
plants enable easy switchover
Customer diversification
• Deepening customer bond
• No single customer dependence
Currency diversification
• Manufacturing and sales in same
currency regions gives natural hedge
• Pass through arrangements for
major fluctuations
Technology diversification
• Investing in future technologies
Product diversification
• Diversified product range
• Increasing content per car
• Product innovation 3CX15 –
No customer,
country,
component,
should contribute
more than 15% of
our business

Corporate Presentation August 2016
Experienced board and management team
Board
Laksh Vaaman Sehgal
Director
Vivek Chaand Sehgal
Chairman
● Mr. Vivek Chaand Sehgal
has 41 years of industry
experience, since the
establishment of
Motherson in 1975
● Founding family oversees
strategic decision making
and customer /
collaborator relationships
● Unit heads are
individually responsible
for delivering profitability
and growth
29
8
G.N. Gauba
Company Secretary &
CFO
Kunal Malani
Head of Strategy and
M&A
Key Management Personnel
Bimal Dhar
Business Head –
Polymers and modules
Founding family Sumitomo Wiring Systems Professionals Independent
Noriyo Nakamura
Director
Toshimi Shirakawa
Director
Pankaj Mital
Whole-time Director/
COO
Sushil C. Tripathi
Independent Director
Geeta Mathur
Independent Director
Naveen Ganzu
Independent Director
Arjun Puri
Independent Director
Gautam Mukherjee
Independent Director
Char Zawadzinski
Business Head – Mirrors

Corporate Presentation August 2016
… The world’s leading automotive brands
… The lives of employees
… The wellbeing of the communities we work in
Proud to be part of
Customers
Employees
Investors
Society
Proud to be part of
30
… The value creation for investors

Proud
to be
part of.
Appendix

Investor Presentation August 2016 32
8.0
9.3
8.9% 9.0%
7.0%
7.5%
8.0%
8.5%
9.0%
9.5%
0
2
4
6
8
10
2016 Q1 2017 Q1
EBITDA EBITDA Margin
12% 12%
88%
88%
89.2
103.5
0
20
40
60
80
100
120
2016 Q1 2017 Q1
Within India Rest of the World
Consolidated Q1 FY2017 results
32
Sales1, 2 Profits and margins1
(IN
R b
n)
(IN
R b
n)
YoY: 16.0%
(IN
R b
n)
3
Notes: Consolidated financials
1 Q1 FY17 financials based on reviewed unaudited financials prepared under Indian Accounting Standards Rules, 2015 (IndAS) and Q1 FY16 financials based on unaudited un-reviewed management accounts
prepared under IndAS
2 Sales considered is sale of products including traded goods (net of excise)
3 EBITDA defined as Profit Before Finance Cost, Depreciation , Exceptional Items and Tax (PBIDT)
4 EBITDA Margin has been calculated as EBITDA / Sales (as defined above)
5 PAT is net profit attributable to owners and before other comprehensive income
6 PAT margin has been calculated as PAT / Sales (as defined above)
Corporate Presentation August 2016
4
5 6
2.7
3.0
3.0% 2.9%
2.0%
3.0%
4.0%
5.0%
6.0%
2.2
2.7
3.2
2016 Q1 2017 Q1
PAT PAT Margin

Investor Presentation August 2016 33
83%
84%
17%
16% 11.8
14.0
0
2
4
6
8
10
12
14
16
2016 Q1 2017 Q1
Within India Rest of the World
Standalone Q1 FY2017 results
33
Sales1, 2 Profits and margins1
YoY: 18.6%
(IN
R b
n)
(IN
R b
n)
(IN
R b
n)
Notes: Standalone financials
1 Q1 FY17 financials based on reviewed unaudited financials prepared under Indian Accounting Standards Rules, 2015 (IndAS) and Q1 FY16 financials based on unaudited un-reviewed management accounts
prepared under IndAS
2 Sales considered is sale of products including traded goods (net of excise)
3 EBITDA defined as Profit Before Finance Cost, Depreciation , Exceptional Items and Tax (PBIDT)
4 EBITDA Margin has been calculated as EBITDA / Sales (as defined above)
5 PAT is net profit before other comprehensive income
6 PAT margin has been calculated as PAT / Sales (as defined above)
3
Corporate Presentation August 2016
4
5 6
2.7
2.6
23.3%
18.8%
0.0%
5.0%
10.0%
15.0%
20.0%
25.0%
2.4
2.6
2.8
3.0
2016 Q1 2017 Q1
EBITDA EBITDA Margin
1.6 1.4
13.6%
10.3%
0.0%
5.0%
10.0%
15.0%
0.0
1.0
2.0
2016 Q1 2017 Q1
PAT PAT Margin
Investor Presentation August 2016 34
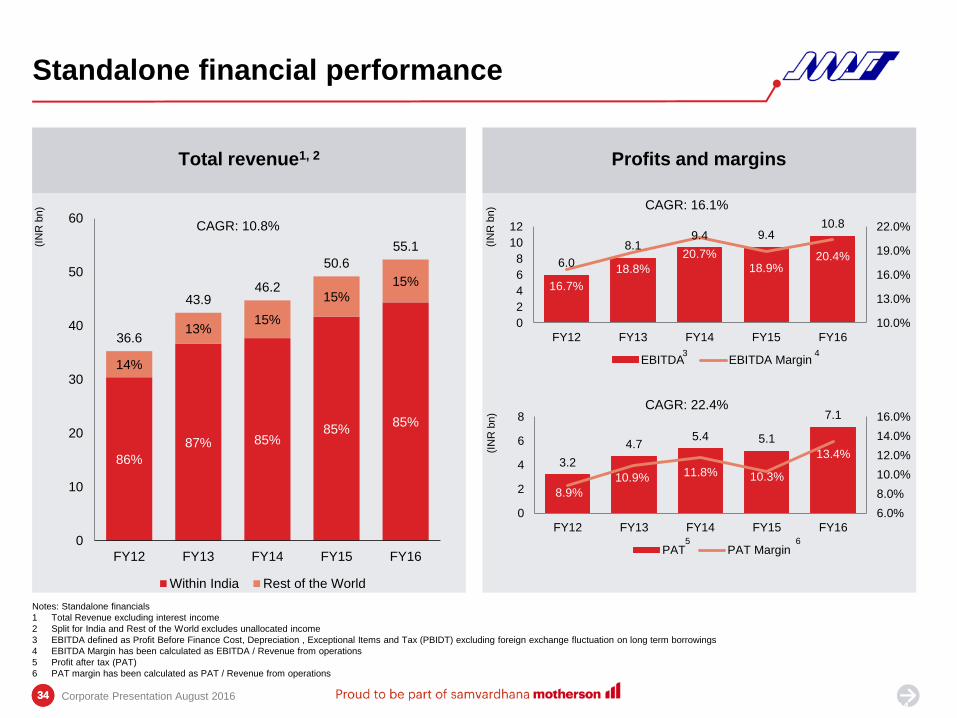
3.2
4.7 5.4 5.1
7.1
8.9%
10.9% 11.8% 10.3%
13.4%
6.0%
8.0%
10.0%
12.0%
14.0%
16.0%
0
2
4
6
8
FY12 FY13 FY14 FY15 FY16
PAT PAT Margin
6.0
8.1 9.4 9.4
10.8
16.7%
18.8%
20.7%
18.9% 20.4%
10.0%
13.0%
16.0%
19.0%
22.0%
0
2
4
6
8
10
12
FY12 FY13 FY14 FY15 FY16
EBITDA EBITDA Margin
86%
87% 85% 85%
85%
14%
13% 15%
15% 15%
36.6
43.9 46.2
50.6
55.1
0
10
20
30
40
50
60
FY12 FY13 FY14 FY15 FY16
Within India Rest of the World
Standalone financial performance
34
Total revenue1, 2 Profits and margins
CAGR: 10.8%
34
CAGR: 16.1%
(IN
R b
n)
(IN
R b
n)
(IN
R b
n)
CAGR: 22.4%
Notes: Standalone financials
1 Total Revenue excluding interest income
2 Split for India and Rest of the World excludes unallocated income
3 EBITDA defined as Profit Before Finance Cost, Depreciation , Exceptional Items and Tax (PBIDT) excluding foreign exchange fluctuation on long term borrowings
4 EBITDA Margin has been calculated as EBITDA / Revenue from operations
5 Profit after tax (PAT)
6 PAT margin has been calculated as PAT / Revenue from operations
Corporate Presentation August 2016
3 4
5 6

Investor Presentation August 2016 35
30% 35%
39% 41% 43%
0%
10%
20%
30%
40%
50%
FY12 FY13 FY14 FY15 FY16
Standalone financial performance
35
Conservative capital structure1, 2
ROCE (%)5
(IN
R b
n)
(IN
R b
n)
(x)
Debt maturity profile4
Capital expenditure3
(IN
R b
n)
3.6
3.1
1.5
2.0 1.6
0.0
0.8
1.6
2.4
3.2
4.0
FY12 FY13 FY14 FY15 FY16
1.5 1.4
0.5
0.0 0.1
0.0
0.5
1.0
1.5
2.0
FY17 FY18 FY19 FY20 FY21
Notes: Standalone financials
1 Total equity defined as Share capital plus reserves and surplus
2 Net debt defined as long-term borrowings + short-term borrowings+ current maturities of long-term borrowings net of cash and bank balances (excluding unpaid dividend account)
3 Capex defined as cash outflow from purchase of tangible/intangible assets less cash inflow from sale of tangible/intangible assets
4 Based on company information
5 Return on Capital Employed (ROCE) defined as Earnings Before Interest and Tax (excluding foreign exchange gain/ loss on long term borrowings, exceptional expenses, dividend income from JVs and
subsidiaries and impairment loss/ reversal) divided by Average Capital Employed (Capital + Reserves (excluding revaluation, amalgamation and capital reserves) + long-term borrowings + short-term borrowings+
current maturities of long-term borrowings – current investments – non current investments
Corporate Presentation August 2016
12.9 16.2 19.1 21.0 24.4
9.2
8.6 7.4 3.9
4.8 1.5
1.1 0.8 0.4 0.4
0.0
0.3
0.6
0.9
1.2
1.5
1.8
0.0
7.0
14.0
21.0
28.0
FY12 FY13 FY14 FY15 FY16
Total equity Net Debt Net Debt / EBITDA

Corporate Presentation August 2016
Group corporate structure
Sumitomo Wiring
Systems (SWS)
(Japan)
Public and Others Sehgal Family
Samvardhana Motherson
International Limited (SMIL)
Other JVs
and
subsidiaries
(Global Rear View Mirrors Business)
(Global Polymer Business)
25.6%
36.9%
3.1% 90.3% 34.4%
51%¹ 49%1
100% 98.5%
(MSSL)
(Wiring Harness and other businesses)
Note:
1 Shareholding held indirectly as on 31st March 2016—not a legal structure
36