Embed Size (px)
Citation preview

CORPORATE PRESENTATION
Kerr Mines TSX: KER I OTC: KERMF I FRA: 7AZ1
January 2018

FORWARD-LOOKING STATEMENTS
This presentation contains forward-looking information, including statements regarding: the proposed timing, schedule, and costs for restarting production at the
Copperstone Mine, rate of production, expected cash costs, expected increase in milling capacity, exploration potential at the Copperstone Mine, proposed debt
restructuring and financing, share capitalization and director ownership,. These forward-looking statements entail various risks and uncertainties that could cause
actual results to differ materially from those reflected in these forward-looking statements. Such statements are based on current expectations, are subject to a
number of uncertainties and risks, and actual results may differ materially from those contained in such statements. These uncertainties and risks include, but are
not limited to, the strength of the economy; the price of gold; operational, funding, and liquidity risks; the degree to which mineral resource and mineral reserve
estimates are reflective of actual mineral resources and mineral reserves; and the degree to which factors which would make a mineral deposit commercially viable
are present; assumptions with respect to the cost and availability of labour for the restart of operations are correct,; results of exploration and validity of geological
models; the risks and hazards associated with underground operations, and any specific risks or assumptions set out or referenced in this presentation. Risks and
uncertainties about Kerr Mines Inc. and its business are more fully discussed in its disclosure materials, including the annual information form, technical reports,
financial statements and MD&As, filed with the securities regulatory authorities in Canada and available at www.sedar.com and readers are urged to read these
materials. Kerr Mines Inc. assumes no obligation to update any forward-looking statements or to update the reasons why actual results could differ from such
statements unless required by law.
This presentation includes certain non-IFRS measures, including cash costs on a per gold ounce basis. Cash costs per gold ounce are defined as costs of
production (including refining costs) divided by the total number of gold equivalent ounces produced. The Company reports total cash costs on a production basis.
In the gold mining industry, these are common performance measures but do not have any standardized meaning, and are non-GAAP measures. As such, they are
unlikely to be comparable to similar measures presented by other issuers. In reporting cash costs per gold ounce, the Company follows the recommendations of the
Gold Institute standard. The Company believes that, in addition to conventional measures, prepared in accordance with IFRS, certain investors use this information
to evaluate the Company’s performance and ability to generate cash flow. Accordingly, it is intended to provide additional information and should not be considered
in isolation or as a substitute for measures of performance prepared in accordance with IFRS.
Technical information in this presentation has been reviewed and approved by Michael R. Smith P. Geo., who is a qualified person that is independent of the
Company, as defined in National Instrument 43-101.
2

INVESTMENT HIGHLIGHTS
3
Low Risk
• Past producer (over 500k Oz)
• Existing high grade gold resource (300k Oz, 10.3 g/tn)
• Safe, mining-friendly jurisdiction – Arizona, USA
• Production and environmental permits in place
• Significant capital infrastructure in place and ready to be utilized
Near term Upside
• Pre Feasibility Study on track & production decision in Q1 2018
• Accelerated timeframe and low CAPEX
• Monetization of Copper by-product
• Expansion of Copperstone and Footwall Zones
• 11,800 acres land package, significant exploration potential to grow resources exponentially
Expertise and Experience
• Experienced management team – delivering on strategy
Supportive Shareholder Base
• Insiders hold 30% of the company
• C$14 million raised in 2017
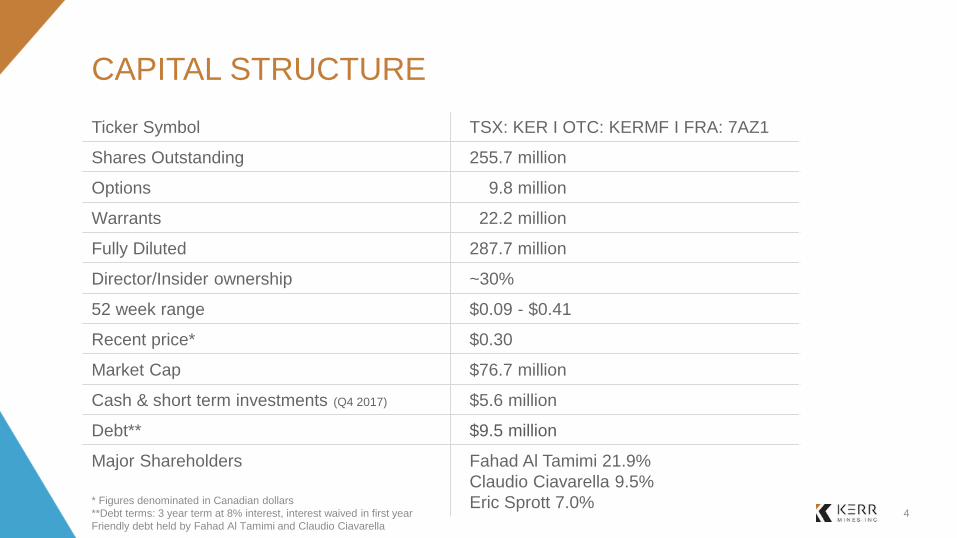
Ticker Symbol TSX: KER I OTC: KERMF I FRA: 7AZ1
Shares Outstanding 255.7 million
Options 9.8 million
Warrants 22.2 million
Fully Diluted 287.7 million
Director/Insider ownership ~30%
52 week range $0.09 - $0.41
Recent price* $0.30
Market Cap $76.7 million
Cash & short term investments (Q4 2017) $5.6 million
Debt** $9.5 million
Major Shareholders Fahad Al Tamimi 21.9%
Claudio Ciavarella 9.5%
Eric Sprott 7.0%* Figures denominated in Canadian dollars
**Debt terms: 3 year term at 8% interest, interest waived in first year
Friendly debt held by Fahad Al Tamimi and Claudio Ciavarella
4
CAPITAL STRUCTURE

Fahad Al Tamimi
Chairman
Saudi-based businessman with global investments in mining and real estate
Peter Damouni
Director
Investment banking. Led financings valued at more than $5 billion
Ayman Arekat
Director
Investment banking with Chase Manhattan, Merrill Lynch, Deutsche Bank
James McVicar
Director
Legal specialization in financings, mergers and acquisitions, corporate governance and commercial matters. Director of Monarca Minerals
Claudio Ciavarella CEO
& Director
CPA, 25 years private business owner. CEO of Kerr Mines since April, 2017
Martin Kostuik
President & Director
25 years mining experience. President of Kerr
Mines since April, 2017. CEO of Rupert Resources.
Operations & Engineering at Barrick’s Goldstrike
Mine
Carmelo Marrelli
CFO
20 year accounting and regulatory compliance
service in the natural resource sector on the TSX
and TSX-V
Brad Atkinson
Director, Exploration
20 years exploration and geology. Formerly with
Phelps Dodge, Newmont and CAT Finance
Michael R. Smith
Professional Geologist
38 years exploration and geology, Chief mine
Geologist, Barrick Goldstrike mine. Led the
Arizona Vulture Gold Mine back into production.
Magna Cum Laude Arizona State and MS
Geology Mackay School of Mines
TECHNICAL ADVISOR
5
MANAGEMENT BOARD OF DIRECTORS

Strategic Growth Vision
Expand current resources
• Expand Copperstone Zone at depth
• Expand Footwall Zone at strike and at depth
Regional Exploration
• Property Size: 11,800 acres
• South & SW target – follow up drilling
• NE geophysical target – new drill target generation
Extend mine life Increase production profile Increase resource ounces
6
• PFS on track for Q1 2018
• Over US$50 million spend on existing infrastructure and underground development increase NPV and IRR
Production Decision
COMPANY STRATEGY

7Accelerating Timeframe, Reducing CAPEX
• Underground mine development in place, access and utilities
• 450 tons per day processing plant
• Tailings storage facility with capacity for existing resource
• Power and water distribution systems
• Surface buildings including assay lab
• Roads and access to surface exploration sites
EXISTING INFRASTRUCTURE
8
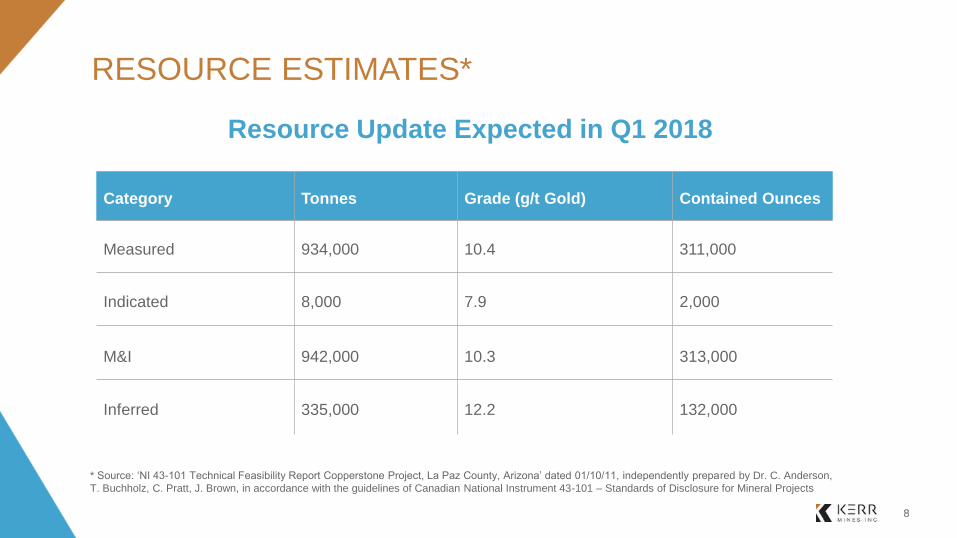
Category Tonnes Grade (g/t Gold) Contained Ounces
Measured 934,000 10.4 311,000
Indicated 8,000 7.9 2,000
M&I 942,000 10.3 313,000
Inferred 335,000 12.2 132,000
* Source: ‘NI 43-101 Technical Feasibility Report Copperstone Project, La Paz County, Arizona’ dated 01/10/11, independently prepared by Dr. C. Anderson,
T. Buchholz, C. Pratt, J. Brown, in accordance with the guidelines of Canadian National Instrument 43-101 – Standards of Disclosure for Mineral Projects
8
Resource Update Expected in Q1 2018
RESOURCE ESTIMATES*

9
2018
Phase II Program
PFS including Mine
Plan Optimization
Production Decision
Detailed Engineering
Construction &
Development
Progress towards
Production
✓Q1 Q2 Q3 Q4
TIMELINE – SIGNIFICANT NEAR-TERM CATALYSTS

Source: Michael R. Pawlowski P. Geo, January 2005
Schematic cross-section of the Moon Mountain Detachment Fault and
the Copperstone Listric Fault (depth unknown), Solid heavy lines are
observed faults; broken lines and projected faults
Copperstone Mine
Moss Mine
Gold Road
Mineral Park
Mesquite
Castle
Mountain
ARIZONA
NEVADA Detachment Fault
Known detachment fault-
related Mineralization
Source: USGS Keith R Long Preliminary descriptive deposit
model for detachment fault related model 10
SCALE POTENTIAL – REGIONAL SIGNIFICANCE

11
Objectives
Copperstone Zone
• Enhance continuity and resource
confidence within existing 1,500m strike
• Expansion of resources along strike with
in-fill and down-dip targets
Footwall Target
• Define and validate the Footwall Target as
a new gold zone – add to resources
• Establishing zones of mineralization up to
450m along strike & 180m along dip
• Build on previous successful results
Copperstone Zone
• Enhanced continuity and confirmed reliability
of previous drill results
• Expanded resource and extended the
Copperstone Zone along strike and depth
Footwall Zone
• Successfully established new Footwall Zone
• To date established 375m along strike and
350m along dip
• Demonstrated identical geology to previous
successful Copperstone Zone drill holes
Achievements
SUCCESSFUL PHASE I DRILLING PROGRAM
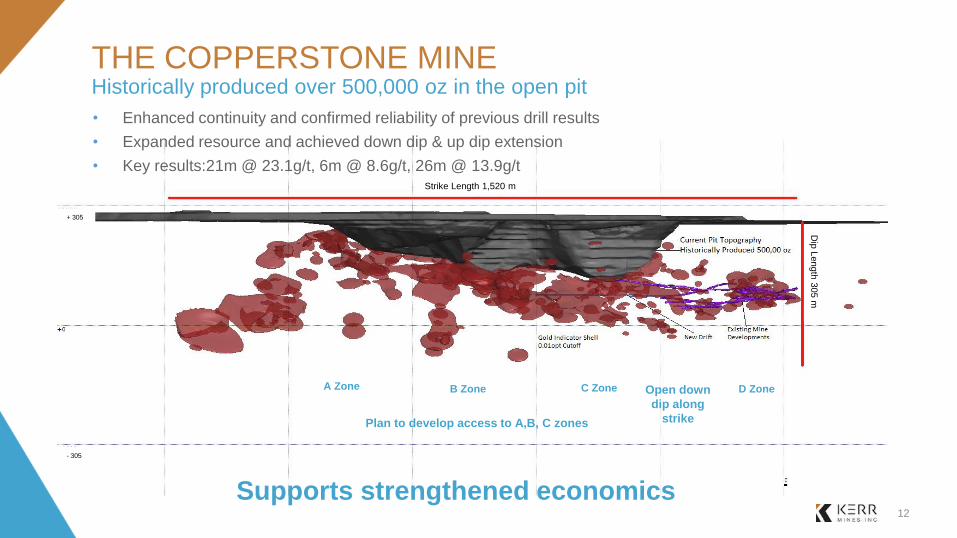
Strike Length 1,520 m
Dip
Length
305 m
- 305
+ 305
12
D ZoneC ZoneB ZoneA Zone Open down
dip along
strikePlan to develop access to A,B, C zones
Supports strengthened economics
• Enhanced continuity and confirmed reliability of previous drill results
• Expanded resource and achieved down dip & up dip extension
• Key results:21m @ 23.1g/t, 6m @ 8.6g/t, 26m @ 13.9g/t
THE COPPERSTONE MINEHistorically produced over 500,000 oz in the open pit

13
COPPERSTONE 2017 EXPLORATION UPDATEPlan View Underground Holes
Hole ID Interval* Au Cu AuEq
m g/tonne % g/tonne
KER-17U-04 4.6 5.1 0.51 5.9
KER-17U-05 3.1 7.9 0.36 8.5
KER-17U-06 6.4 8.6 0.15 8.8
KER-17U-11 3.2 7.6 0.72 8.8
KER-17U-12 21.6 23.1 0.10 23.2
includes 18.4 27.0 0.11 27.2
also 14.6 33.8 0.08 34.0
also 4.0 89.9 0.06 90.1
KER-17U-13 3.2 8.8 0.41 9.5
KER-17U-14 26.8 13.9 0.14 14.1
includes 8.8 38.6 0.02 38.6
also 2.7 5.6 0.12 5.8
KER-17U-16 32.0 4.0 0.29 4.4
includes 3.2 7.7 0.99 9.3
also 2.5 10.6 0.02 10.6
also 4.4 10.9 0.07 11.0
KER-17S-01 3.7 6.7 0.06 6.8
* not true width
Copperstone Zone Selected Intervals

14
Footwall Zone Selected Intervals
NEW MINERALIZED ZONE – FOOTWALL ZONEOblique View
Phase I Drilling
Historic Drilling
Hole ID Interval* Au Cu AuEq
m g/tonne % g/tonne
KER-17S-02 1.1 9.1 0.07 9.2
KER-17S-03 5.6 2.9 0.43 3.6
KER-17S-04 3.7 7.3 0.21 7.6
KER-17S-07 0.9 4.1 0.15 4.4
KER-17S-10 7.5 3.7 1.36 5.9
includes 4.1 6.6 2.29 10.4
also 3.4 7.9 2.78 12.5
also 2.4 10.9 3.79 17.1
KER-17S-11 3.0 3.9 0.16 4.1
includes 1.5 5.1 0.25 5.5
KER-17S-13 15.2 4.6 0.48 5.4
Includes 4.6 13.2 1.28 15.3
KER-17S-17 9.3 3.6 0.15 3.8
includes 4.3 6.8 0.19 7.2
also 1.8 7.7 0.15 8.0
KER-17S-19 10.7 2.8 0.02 2.9
includes 4.6 3.4 0.04 3.5
and 3.0 4.6 0.01 4.6
KER-17S-21 3.0 6.6 0.66 7.7
and 36.6 7.5 0.26 7.9
includes 3.0 5.0 0.85 6.4
also 7.6 31.2 0.15 31.4
also 3.0 74.9 0.13 75.1
* not true width
Gold Indicator Shell 0.137 gpt Cutoff Including 2017 Drilling
Footwall Zone
Copperstone
Open Pit Top of
Pit Outline
Expanded Footwall Zone
Meters

• South and South West
targets have previous
successful drilling
• Intercepts of 8 g/t to 32 g/t
over 2 – 4 metres
• Detachment fault regionFOOTWALL ZONE
EXISTING
RESOURCE
AND ACCESS
SOUTH WEST
TARGET
SOUTH
TARGET
15
REGIONAL EXPLORATION – SOUTH TARGETS

16
• South West Target – geophysical
signature identical to Copperstone and
Blue Pearls , supported by previous
drilling indicating identical geology,
inclination, width and grade to
Copperstone
• North East “Blue Pearl” Geophysical
targets – significant strength and similar
size to the geophysical anomaly under
the Copperstone Orebody. The blue
indicates a uniformly magnetic rock with
a very slow change in magnetic field. No
previous drilling
• Adding two exploration licenses totalling
541 hectares (1,331 acres)
REGIONAL EXPLORATION UPSIDE

17
• April 2017 – Claudio Ciavarella and Martin Kostuik appointed new CEO and President
• May 2017 – Technical team in place to execute operational plans
• June 2017 – Company closes oversubscribed non-brokered private placement for C$8,000,000
• August 2017 – Initiation of Phase I exploration program
• October 2017 – Released initial results of Phase I exploration program
• December 2017 – Company closes oversubscribed non-brokered private placement for C$6,000,000
• December 2017 – Phase I drilling program completed
• January 2018 – Phase II exploration and engineering program and progress towards production decision
Delivering on Strategy
KEY SUMMARY POINTS
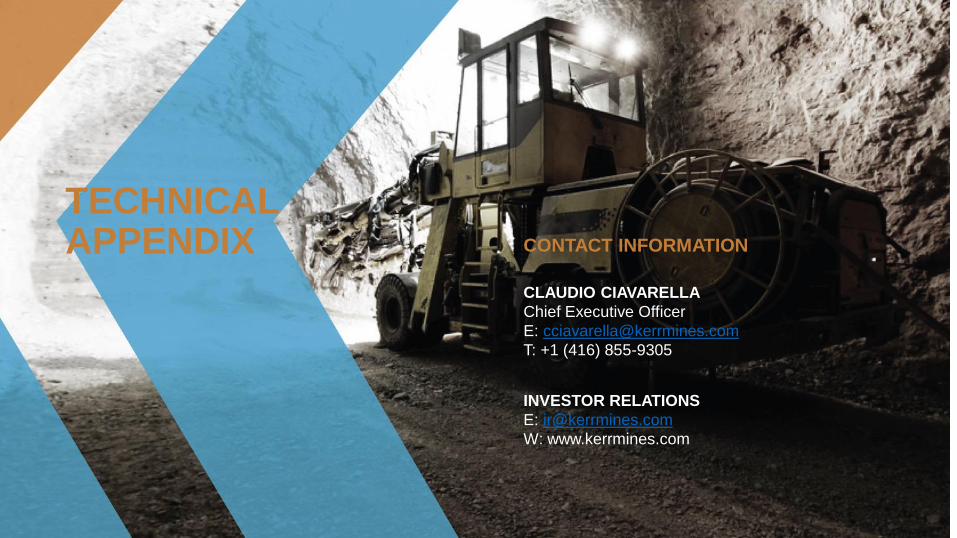
CONTACT INFORMATION
CLAUDIO CIAVARELLA
Chief Executive Officer
T: +1 (416) 855-9305
INVESTOR RELATIONS
W: www.kerrmines.com
TECHNICAL APPENDIX

19
LAND STATUS
Copperstone Mine
Southwest Target
Blue Pearls

20
Age Name Description
Early
Miocene
Basalt Contains gold mineralization.
Cut by mineralized amethyst-quartz-specularite veins and strongly altered. The
mineralization and brecciation observed in the unit is related to the Copperstone
Detachment Fault.
Early
Miocene
Monolithic Breccia
(MSB)Contains gold mineralization.
Monolithic fragments derived from Jurassic QLP. Locally mineralized above the
Copperstone Detachment Fault. Hematization and quartz-specularite mineralization.
Jurassic Quartz Latite
Porphyry (QLP)Contains gold mineralization.
Volcanic flows with well-developed metamorphic foliation. The principle ore host in
the pit where it extends into both the hanging wall and footwall of the Copperstone
Detachment Fault.
Triassic Marble Contains gold mineralization.
Marble occurs at the top of the Triassic meta-sediments in C and D areas. Hosts
intervals of massive specular hematite ± manganese oxide and Cu minerals. The
mineralization and brecciation observed in the unit is related to the Copperstone
Detachment Fault.
Triassic Quartzite Contains gold mineralization.
The mineralization and brecciation observed in the unit is related to the Copperstone
Detachment Fault. Observed in C and D areas.
Triassic Phyllite Contains gold mineralization.
The mineralization and brecciation observed in the unit is related to the Copperstone
Detachment Fault. Observed in C and D areas.
MINE GEOLOGY – LITHOLOGY & ALTERATION

21
• Induced polarization – gradient
array progress towards
production decision
REGIONAL EXPLORATION UPSIDE – I.P.

22
SW AREA TARGET – FUTURE EXPLORATION
5’ – 10’ +0.5 opt Au
SW Target believed parallel to
Copperstone and Footwall
Zones
May be high angle feeder above
Detachment Fault
Limestone present, like D zone
Copperstone Zone
Drilling only in 200’ x 300’ area
Associated with geophysical
Magnetic and IP anomalies

23
SW AREA TARGET – FUTURE EXPLORATIONHole-ID From (m) To (m) Interval* (m) oz/ton Au g/tonne Au
06CS-20 315.5 317.0 1.5 0.598 20.48
06CS-22 231.6 234.7 3.0 0.104 3.56
06CS-22 277.4 280.4 3.0 0.075 2.57
06CS-22 292.6 304.8 12.2 0.15 5.14
07CS-30 251.8 256.9 5.2 0.737 25.24
07CS-31 205.7 207.3 1.5 0.276 9.45
07CS-31 224.0 225.6 1.5 0.125 4.28
07CS-31 246.3 247.8 1.5 0.096 3.29
07CS-31 265.8 271.6 5.8 0.301 10.31
07CS-31 284.4 285.3 0.9 0.239 8.18
07CS-31 287.7 289.3 1.5 0.065 2.23
07CS-31 320.5 323.5 3.0 0.152 5.21
08CS-45 149.4 153.9 4.6 0.211 7.23
08CS-45 155.4 157.0 1.5 0.057 1.95
08CS-45 199.6 210.3 10.7 0.2 6.85
08CS-47 157.0 161.5 4.6 0.115 3.94
08CS-47 172.2 173.7 1.5 0.079 2.71
08CS-48 270.4 271.9 1.5 0.096 3.29
08CS-57 226.8 227.7 0.9 0.15 5.14
08CS-57 228.6 229.2 0.6 0.052 1.78
08CS-57 278.4 279.0 0.6 0.066 2.26
*not true width


![WORK PERFORMED FOR: Kerr Addison Mines Ltd....WORK PERFORMED FOR: Kerr Addison Mines Ltd. RECORDED HOLDER : SAME As ABOVE [x ]: OTHER [ ] CLAIM No, L 626015 L 626020 L 626021 HOLE](https://img.dokumen.tips/doc/110x75/5f0f9ba67e708231d4450181/work-performed-for-kerr-addison-mines-ltd-work-performed-for-kerr-addison.jpg)