Embed Size (px)
Citation preview

Corporate PresentationFebruary 2018
Knowledge
First Culture
Innovation & Technology Leaders
Value
Creators

Cre
scen
t P
oin
t E
nerg
y
Co
rpo
rate
Pre
se
nta
tio
n
2
Scaleable
Economic Growth
Long-Term
Value Creators
Financial
Discipline
Crescent Point Advantage

Cre
scen
t P
oin
t E
nerg
y
Co
rpo
rate
Pre
se
nta
tio
n
3
Crescent Point Overview
Scaleable Growth
• ~27 billion OOIP and 4 million net acres
• ~14,000 net drilling locations
(~8,100 risked)
• ~80,000 bbl/d of takeaway capacity via rail
New Play Development
• History of success in new discoveries
• Knowledge transfer across asset base
• Organic growth of drilling inventory
Financial Discipline
• Balancing cash flows
• Conservative hedging strategy
• Top quartile netbacks and low G&A
Value Creators
• Per share focus and operational execution
• Innovation driven by knowledge first culture
• Waterflood proprietary knowledge
Focused Core Areas(~93% of total production)
Williston
Basin106,000 boe/d
Southwest
Saskatchewan39,500 boe/d
Uinta Basin25,000 boe/d
Production figures shown above are approximations and represent annual averages based on 2018 guidance as of January 9, 2018

Cre
scen
t P
oin
t E
nerg
y
Co
rpo
rate
Pre
se
nta
tio
n
4
Business Strategy
GrowthAcquire high-quality, large resource-in-place pools with production and reserves upside
Manage RiskMaintain strong balance sheet, significant unutilized bank line capacity and 3 ½ - year hedging program
Develop & EnhanceIncrease recovery factors through infill drilling, waterflood optimization and improved technology
Cre
scen
t P
oin
t E
nerg
y
Co
rpo
rate
Pre
se
nta
tio
n
5
0
200
400
600
800
1000
20
02
20
03
20
04
20
05
20
06
20
07
20
08
20
09
20
10
20
11
20
12
20
13
20
14
20
15
20
16
0
40,000
80,000
120,000
160,000
200,000
20
03
20
04
20
05
20
06
20
07
20
08
20
09
20
10
20
11
20
12
20
13
20
14
20
15
20
16
20
17E
20
18E
-
2,000
4,000
6,000
8,000
10,000
12,000
14,000
16,000
20
03
20
04
20
05
20
06
20
07
20
08
20
09
20
10
20
11
20
12
20
13
20
14
20
15
20
16
20
17
-
5.0
10.0
15.0
20.0
25.0
30.020
02
20
03
20
04
20
05
20
06
20
07
20
08
20
09
20
10
20
11
20
12
20
13
20
14
20
15
20
16
20
17
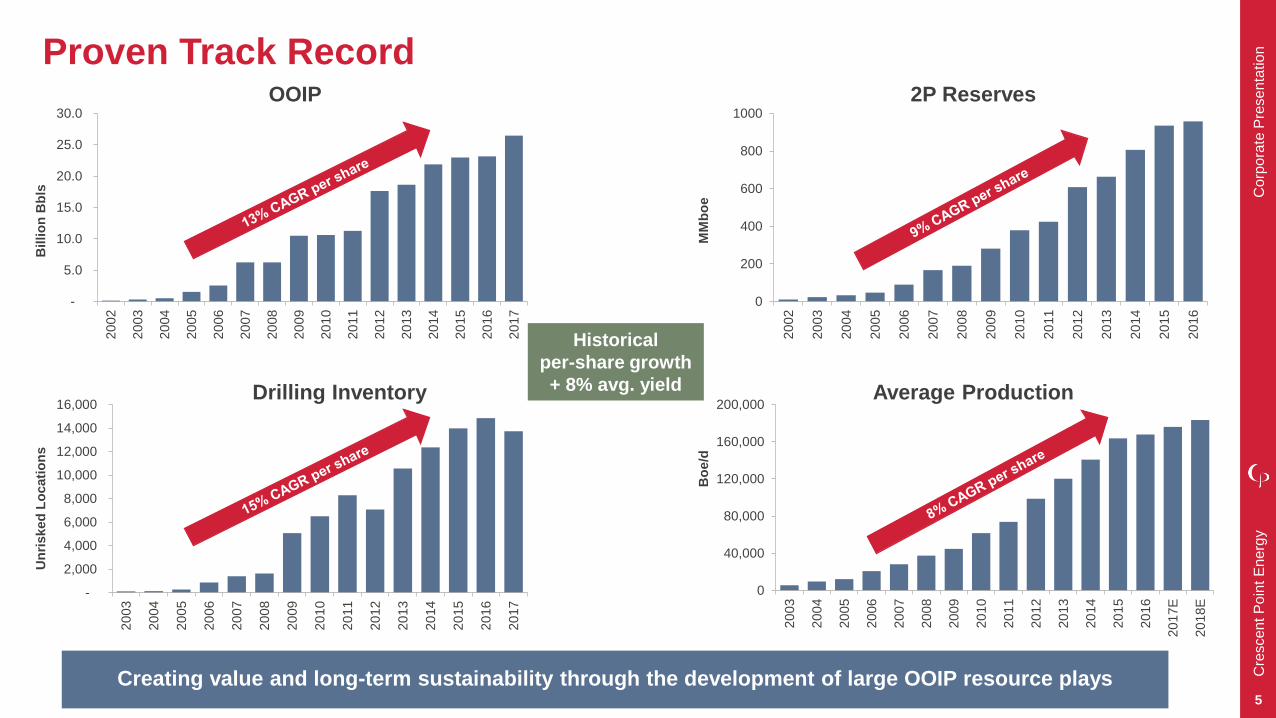
Proven Track Record
Creating value and long-term sustainability through the development of large OOIP resource playsM
Mb
oe
Billio
n B
bls
Un
risked
Lo
cati
on
s
Bo
e/d
Historical
per-share growth
+ 8% avg. yield
OOIP 2P Reserves
Drilling Inventory Average Production

Cre
scen
t P
oin
t E
nerg
y
Co
rpo
rate
Pre
se
nta
tio
n
6
Achieved exit guidance
of 183,000 boe/d and
growth target of 10% per share
Increased productive capacity by
~1.2 million boe/d
led by ~1,500 new
high-impact Uinta Hz locations
>400,000 net acres
added in core areas and transacted
>$320 million of
dispositions
Return-focused
with >75% of
net drills to payout in
<2 years
7% growth with exit guidance of
195,000 boe/d
Balancing
cash flows including ongoing dispositions of non-
core assets
Execution in 2017 & 2018 Outlook
2017
2018

Cre
scen
t P
oin
t E
nerg
y
Co
rpo
rate
Pre
se
nta
tio
n
7
YE 2016 YE2017
Uinta Inventory Growth Significantly Increases Productive Capacity
Uinta HZ IP30 (boe/d)Corporate (excl. Uinta HZ) IP30 (boe/d)
• Doubled average IP30 rate per well of corporate inventory vs. prior year
• Requires fewer future wells to be drilled to maintain production
Total Corporate Inventory
Productive Capacity (IP30)
3.0 MM boe/d
1.4 MM boe/d
0.2 MM boe/d
1.8 MM boe/d
1.6 MM boe/d1.6 MM boe/d
Productive capacity is defined as the total IP30 rate assuming all wells in inventory are brought on production at the same time
Inventory includes unrisked wells. All numbers shown above are approximations
Year-End 2016 Year-End 2017

Cre
scen
t P
oin
t E
nerg
y
Co
rpo
rate
Pre
se
nta
tio
n
8
2018 Capital Budget and Production Growth
Capital Expenditures ($ millions) $1,800
Drilling and Development (%) 89%
Facilities and Seismic (%) 11%
Average Annual Production (boe/d) 183,500
Exit Production (boe/d) 195,000
Funds Flow from Operations Netback ($/boe) ~$30.00
Total Payout (%) 99%
Net Debt to Funds Flow from Operations 1.9x
Number of Net Wells Drilled ~630
Production Growth
Capital expenditures excludes net land and property acquisitions
Netback, total payout and net debt to funds flow based on strip prices of US$60.14/bbl WTI and $0.80 USD/CAD exchange
Total payout is calculated on a percentage basis as capital expenditures and dividends declared divided by funds flow from operations
2017 production figures based on guidance as of October 26, 2017
2017 dividend yield based on share price as of market close on December 30, 2016
2018 dividend yield based on share price as of market close on December 29, 2017
Pro
du
cti
on
(B
oe
/d)
Exit ProductionAnnual Average Production
2018 Guidance
150,000
160,000
170,000
180,000
190,000
200,000
2016 2017E 2018E

Cre
scen
t P
oin
t E
nerg
y
Co
rpo
rate
Pre
se
nta
tio
n
9
35,000
40,000
45,000
2017 Exit 2018 Exit
20,000
25,000
30,000
2017 Exit 2018 Exit
80,000
100,000
120,000
2017 Exit 2018 Exit
2018 Budget – Balanced Growth Across Core Areas
Williston Basin Uinta Basin
SW Saskatchewan
Bo
e/d
Bo
e/d
Bo
e/d
Williston Basin SW Saskatchewan Uinta Basin Other
20%
20%
2018 Capital Budget Allocation
55%
All numbers shown above are approximations
20%
20%

Cre
scen
t P
oin
t E
nerg
y
Co
rpo
rate
Pre
se
nta
tio
n
10
Uinta Basin – High-Growth Resource Play
Large OOIP Basin
with Multi-Zone
Potential
High-Quality
Light Crude
Strong Well
Economics With
Significant
Productivity

Cre
scen
t P
oin
t E
nerg
y
Co
rpo
rate
Pre
se
nta
tio
n
11
Uinta Stacked Pay Comparison vs. Major North American Shale Plays
Midland Uinta Montney Eagle Ford Niobrara Bakken
Bakken
Three ForksNiobrara ANiobrara BNiobrara C
Codell
Upper
Lower
Lower
Lower
Upper
Wasatch
Black Shale
Castle Peak
Uteland Butte
Garden Gulch
Douglas Creek
Wolfcamp C
Wolfcamp B
Wolfcamp A
Middle
Spraberry
Lower
Spraberry
Upper
Spraberry
50 - 150mmbbl/sec
20 - 60mmbbl/sec
10 - 40mmbbl/sec
20 - 50mmbbl/sec
25 - 50mmbbl/sec
10 - 20mmbbl/sec
Entire Uinta Basin pool equates
to 55 billion barrels of OOIP

Cre
scen
t P
oin
t E
nerg
y
Co
rpo
rate
Pre
se
nta
tio
n
12
-
20,000
40,000
60,000
80,000
100,000
0 10 20 30 40 50 60 70 80 90
0
20,000
40,000
60,000
0 10 20 30 40 50 60 70 80 90
0
40,000
80,000
120,000
160,000
0 10 20 30 40 50 60 70 80 90
Uinta Basin: Horizontal Well Progression by Zone
Castle Peak
Gen 1 Frac (1-mile)
Gen 2 Frac (1-mile)
Gen 2 Frac (2-mile) Wasatch
Producing Days
Producing Days
Uteland Butte
Bo
e
Bo
e
Bo
e
Prior to refined
geological
mapping
Prior to refined
geological
mapping
Producing Days
2017 (1-mile) 2015 (1-mile)
2017 (1-mile) 2014 (1-mile)
Strong current economics with quick well payouts
Efficiencies to be realized during development phase

Cre
scen
t P
oin
t E
nerg
y
Co
rpo
rate
Pre
se
nta
tio
n
13
Uinta Basin: Recent Horizontal Well Results
Crescent Point and Industry Advancing Horizontal Development
Castle Peak (CP)(avg. depth 7,900’)
Wasatch (WS)(avg. depth 8,500’)
Uteland Butte (UB)(avg. depth 8,200’)
1. 15-9-4-3-1E-H1 (Castle Peak – First 2-mile)
Rig Release: Feb 2017
IP30: 1,010 boe/d; IP90: 760 boe/d
Crescent Point (1-mile & 2-mile)
2. 1-26-35-3-1W-H1 (Castle Peak – 2-mile)
Rig Release: May 2017
IP30: 900 boe/d; IP90: 870 boe/d
6. 2-18-3-1E-H2 (Wasatch – 1-mile)
Rig Release Sep 2017
IP30: 1,280 boe/d; IP90: N/A
(<90 days on-stream)
3. 13-29-20-3-1E-H1 (Castle Peak – 2-mile)
Rig Release: Jul 2017
IP30: 720 boe/d; IP90: 690 boe/d
5. 4-23-3-1W-H1 (Wasatch – 1-mile)
Rig Release: Apr 2017
IP30: 1,730 boe/d; IP90: 1,790 boe/d
4. 2-16-3-2E-H1 (Uteland Butte – 1-mile)
Rig Release: Jun 2017
IP30: 570 boe/d; IP90: 640 boe/d
11. 14-23-3-23-14-16H (Wasatch – 2-mile)
Rig Release: Dec 2016
IP30: 2,130 boe/d; IP90: 1,390 boe/d
Industry (2-mile)
10. 2-26-3-3-23-14-12H (Wasatch – 2-mile)
Rig Release: Mar 2017
IP30: 1,460 boe/d; IP90: 1,170 boe/d
7. 2-26-3-3-23-14-1H (Uteland Butte – 2-mile)
Rig Release: Mar 2017
IP30: 2,600 boe/d; IP90: 1,790 boe/d
8. 14-23-3-3-23-14-3H (Uteland Butte – 2-mile)
Rig Release: Nov 2016
IP30: 2,100 boe/d; IP90: 1,130 boe/d
9. 2-17-3-2-8-5-12H (Wasatch – 2-mile)
Rig Release: Feb 2017
IP30: 1,830 boe/d; IP90: 1,180 boe/d
Crescent Point also participates in non-operated
Uteland Butte and Wasatch wells with partners.
CP 1
CP 3CP 2
WS 5
WS 6
UB 8
UB 4
WS 11
WS 9
UB 7WS 10
CPG Lands(operated and non-operated)
RandlettRocky Point
Cre
scen
t P
oin
t E
nerg
y
Co
rpo
rate
Pre
se
nta
tio
n
14
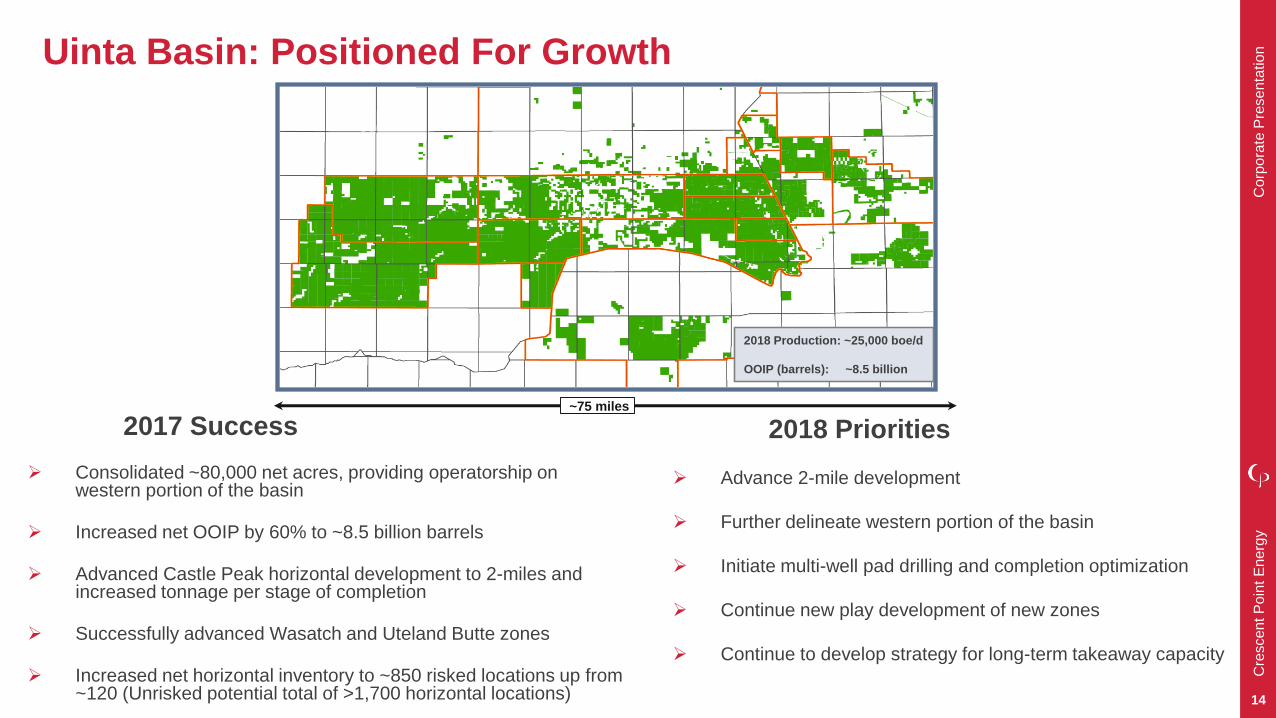
Uinta Basin: Positioned For Growth
2017 Success
Consolidated ~80,000 net acres, providing operatorship on western portion of the basin
Increased net OOIP by 60% to ~8.5 billion barrels
Advanced Castle Peak horizontal development to 2-miles and increased tonnage per stage of completion
Successfully advanced Wasatch and Uteland Butte zones
Increased net horizontal inventory to ~850 risked locations up from ~120 (Unrisked potential total of >1,700 horizontal locations)
2018 Priorities
Advance 2-mile development
Further delineate western portion of the basin
Initiate multi-well pad drilling and completion optimization
Continue new play development of new zones
Continue to develop strategy for long-term takeaway capacity
~75 miles
2018 Production: ~25,000 boe/d
OOIP (barrels): ~8.5 billion

Cre
scen
t P
oin
t E
nerg
y
Co
rpo
rate
Pre
se
nta
tio
n
15
0
30,000
60,000
90,000
120,000
1999 2001 2003 2005 2007 2009 2011 2013 2015 2017
Uinta Basin: Marketing
Refinery
capacity tight –
diffs widened
Basin production
dropped >35,000 bopd –
diffs tightening
~13,000 bopd
of excess
capacity
Uinta Basin Production
Oil Rate (Bopd) Refiner Capacity (Bopd)
Previous refinery
expansion plans
Uinta Basin production based on most recent public data as of January 2018
• Rail infrastructure provides additional ~70,000 bopd of takeaway capacity including CPG facilities (expandable to ~90,000 bopd)
• Refining capacity has the ability to increase (scheduled expansions previously planned)
• High-quality crude
Yellow wax (38 to 50 API)
Black wax (28 to 38 API)
Salt Lake City Refiners & Rail Facilities
Uinta Basin
UT
Salt Lake City
Oil R
ate
, R
efi
ner
Cap
acit
y (
bb
l/d
)

Cre
scen
t P
oin
t E
nerg
y
Co
rpo
rate
Pre
se
nta
tio
n
16
Williston Basin & SW Saskatchewan – Low-Risk Production
Free Cash Flow
Largest
Unconventional
Waterflood
Programs
Multi-zone
Growth Potential
Cre
scen
t P
oin
t E
nerg
y
Co
rpo
rate
Pre
se
nta
tio
n
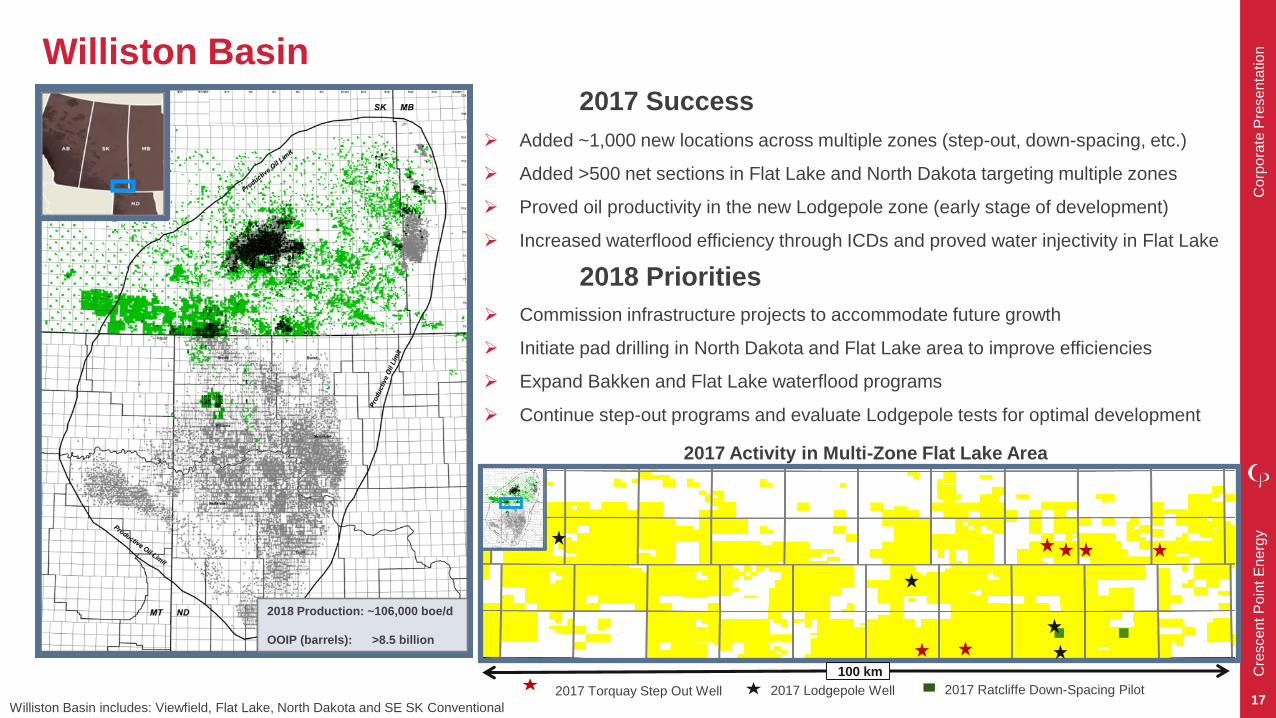
17
2018 Priorities
Commission infrastructure projects to accommodate future growth
Initiate pad drilling in North Dakota and Flat Lake area to improve efficiencies
Expand Bakken and Flat Lake waterflood programs
Continue step-out programs and evaluate Lodgepole tests for optimal development
Williston Basin
Williston Basin includes: Viewfield, Flat Lake, North Dakota and SE SK Conventional
2017 Torquay Step Out Well 2017 Lodgepole Well 2017 Ratcliffe Down-Spacing Pilot
2017 Activity in Multi-Zone Flat Lake Area
2017 Success
Added ~1,000 new locations across multiple zones (step-out, down-spacing, etc.)
Added >500 net sections in Flat Lake and North Dakota targeting multiple zones
Proved oil productivity in the new Lodgepole zone (early stage of development)
Increased waterflood efficiency through ICDs and proved water injectivity in Flat Lake
100 km
2018 Production: ~106,000 boe/d
OOIP (barrels): >8.5 billion

Cre
scen
t P
oin
t E
nerg
y
Co
rpo
rate
Pre
se
nta
tio
n
18
SW Saskatchewan
Shaunavon
Battrum /
Cantaur
SK Viking
SW Saskatchewan includes: Shaunavon, Battrum/Cantaur and Viking
2017 Success
Added ~100 locations in the Shaunavon play due to a successful step-out program and advancement in new technology (i.e. cemented liners)
Added new infrastructure in Shaunavon play to accommodate future growth
Improved economic development in the Viking play through ERH wells
Advanced waterflood program including a pilot in the Viking play
2018 Priorities
Continue to generate free cash flow
Advance waterflood program in Shaunavon and optimize pilots in the Viking
Continue step-out program to extend economic boundaries
Optimize completion processes
2018 Production: ~39,500 boe/d
OOIP (barrels): >7.8 billion

Cre
scen
t P
oin
t E
nerg
y
Co
rpo
rate
Pre
se
nta
tio
n
19
Financial Strategy
Risk Management Financial DisciplineStrong Capital
Allocation

Cre
scen
t P
oin
t E
nerg
y
Co
rpo
rate
Pre
se
nta
tio
n
20
Life Cycle of Core Resource Plays
Uinta BasinWilliston Basin
(Flat Lake + North Dakota) SW Sask. (Shaunavon)
Williston Basin
(Viewfield + Conventional)
2017
High-Growth PhaseMedium-Growth /
Development PhaseFree Cash Flow Phase
2017
2018
2017
&
2018
2017
&
2018
Exploit early stage,
large OOIP pools
Improve efficiencies,
implement waterflood
Lower decline,
increase recoveries
2018

Cre
scen
t P
oin
t E
nerg
y
Co
rpo
rate
Pre
se
nta
tio
n
21
Commodity Hedging StrategyO
il H
ed
ge V
olu
me (
bb
l/d
)
$ C
AD
Oil Hedges
• Added approximately 14.5 million bbls to hedging program since Q3/17
• Active hedging program reduces funds flow from operations (“funds flow”) volatility and provides greater stability to dividends and capital spending
As of January 4, 2018. Floor hedge price is calculated using the forward strip for the 3-way collar hedges
Floor hedge price of 3-way collar hedges are subject to change based on forward oil and f/x prices
2018 percentage hedged figures based on annual average liquids production guidance
2019 percentage hedged figures based on 2018 exit liquids production guidance as of January 9, 2018
49%
H1 2018
32%
H2 2018
Swaps 3-Way Collars Floor Hedge Price (3-way collars at market price)
11%
H1 2019
$50.00
$60.00
$70.00
$80.00
$90.00
0
10,000
20,000
30,000
40,000
50,000
60,000
70,000
80,000
Q1 18 Q2 18 Q3 18 Q4 18 Q1 19 Q2 19
Cre
scen
t P
oin
t E
nerg
y
Co
rpo
rate
Pre
se
nta
tio
n
22
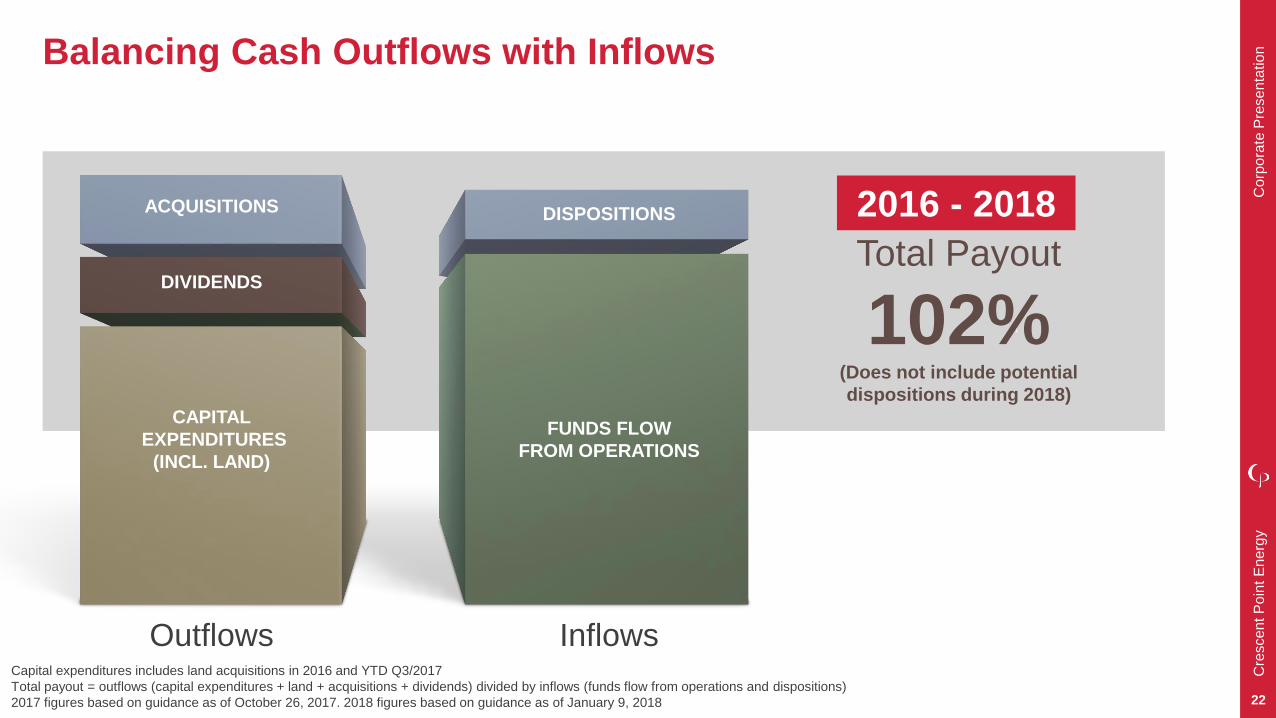
Capital expenditures includes land acquisitions in 2016 and YTD Q3/2017
Total payout = outflows (capital expenditures + land + acquisitions + dividends) divided by inflows (funds flow from operations and dispositions)
2017 figures based on guidance as of October 26, 2017. 2018 figures based on guidance as of January 9, 2018
Balancing Cash Outflows with Inflows
1
Total Payout
102%(Does not include potential
dispositions during 2018)
Outflows Inflows
FUNDS FLOW
FROM OPERATIONS
DISPOSITIONSACQUISITIONS
DIVIDENDS
CAPITAL
EXPENDITURES
(INCL. LAND)
2016 - 2018

Cre
scen
t P
oin
t E
nerg
y
Co
rpo
rate
Pre
se
nta
tio
n
23
150,000
200,000
250,000
300,000
350,000
2018 2019 2020 2021 2022
5-Year Organic Growth Plan
Net
Deb
t/F
un
ds F
low
Cap
ital E
xp
en
dit
ure
s (
$M
M)
90% Total Payout 100% Total Payout 110% Total Payout
Production by Total Payout (%) Scenario
Bo
e/d
90% Payout 100% Payout 110% Payout
2018 net debt / funds flow based on strip prices as of US$60.14/bbl WTI. 2019-2022 based on $55 WTI
2018 capital expenditures in the 90% and 100% payout scenarios equate to the Company’s guidance, as of January 9, 2018
Total payout = (capital expenditures + dividends) / (funds flow from operations)
Capital Expenditures & Net Debt/Funds Flow
by Total Payout (%) Scenario
Bars = Capital Expenditures
Lines = Net Debt to Funds Flow
3% CAGR
7% CAGR
12% CAGR
0.0
0.5
1.0
1.5
2.0
2.5
$0
$500
$1,000
$1,500
$2,000
$2,500
$3,000
$3,500
2018 2019 2020 2021 2022

Cre
scen
t P
oin
t E
nerg
y
Co
rpo
rate
Pre
se
nta
tio
n
24
Investment Thesis
Scaleable Economic Growth Value Creators Financial Discipline
• Scaleable organic growth:
~27 billion barrels OOIP,
~14,000 unrisked locations and
~4 million net acres of land
• Execution history:
~644 million boe of organic reserve
additions and consistent long-term
reserves growth per share as of
December 31, 2016
• Knowledge first culture and data
driven company resulting in
operational excellence
• Long-term outlook in development
strategy to maximize ultimate
recovery and reserves
• History of successful new play
discoveries and organic growth of
drilling inventory
• Non-core asset dispositions and a
continued focus on debt reduction
• ~$1.5 billion of liquidity with no
material near-term maturities as of
September 30, 2017
• Up to 3-½ year hedging program
Cre
scen
t P
oin
t E
nerg
y
Co
rpo
rate
Pre
se
nta
tio
n
25
Forward Looking InformationThis presentation contains "forward-looking statements" within the meaning of applicable securities legislation, such as section 27A of the Securities Act of 1933 and section 21E of the Securities Exchange Act of 1934, including estimates of future production, cash flows and reserves, business plans for drilling and exploration, the estimated amounts and timing of capital expenditures, the assumptions upon which estimates are based and related sensitivity analyses, and other expectations, beliefs, plans, objectives, assumptions or statements about future events or performance (often, but not always, using words or phrases such as "expects" or "does not expect", "is expected", "anticipates" or "does not anticipate", "plans", "estimated" or "intends", or stating that certain actions, events or results “may", "could", "would", "might" or "will" be taken, occur or be achieved). In particular, this presentation contains forward-looking statements pertaining to the following: the Corporation’s estimated drilling locations and OOIP; the Corporation’s three-tiered business strategy; estimated average production for 2018; the Corporation’s 2018 outlook, including plans to be return focused, achieve 7% per share growth with exit production of 195,000 boe/d and balance cash flows; the expected impact of inventory growth in Uinta on productive capacity and drilling needs to maintain production; 2018 guidance for capital expenditures, average annual and exit production, funds flow from operations netback, net debt to funds flow from operations and net wells to be drilled; estimated production growth; expected balanced production growth across core areas; planned 2018 capital allocation by core area; the Corporation’s 2018 priorities for the Uinta Basin; the expected ability to increase refining capacity in the Uinta Basin; the Corporation’s 2018 priorities for the Williston Basin and for SW Saskatchewan; the expected position of the Corporation’s core areas in their respective life cycles in 2018; the expected impact of the Corporation’s hedging program on funds flow volatility and the stability of dividends and capital spending; the Corporation’s expectation that it will balance cash inflows and outflows over the 2016-2018 period; the expected production by total payout and capital expenditures and net debt/funds flow by total payout under the Corporation’s five year organic growth plan; the scalability of the Corporation’s organic growth; the expected impact of the Corporation’s development strategy on long term outlook; the Corporation’s plans to continue to test additional methods to further increase recovery; the potential financial impact of a 100 annual injection well conversion program on production, incremental capex, incremental cash flow, and decline rates; expected future climate change initiatives; and the Corporations future plans for its Board renewal process.
There are numerous uncertainties inherent in estimating crude oil, natural gas and NGL reserves and the future cash flow attributed to such reserves. The reserve and associated cash flows therefrom are based upon a number of variable factors and assumptions, such as historical production from the properties, production rates, ultimate reserve recovery, timing and amount of capital expenditures, marketability of oil and natural gas, royalty rates, the assumed effects of regulation by governmental agencies and future operating expenses, all of which may vary materially. Actual reserve values may be greater than or less than the estimates provided herein. Also, estimates of reserves and future net revenue for individual properties may not reflect the same confidence level as estimates and future net revenue for all properties due to the effect of aggregation. Information relating to "reserves" is deemed to be forward-looking information, as it involves the implied assessment, based on certain estimates and assumptions, that the reserves described exist in the quantities predicted or estimated, and that the reserves described can be profitably produced in the future. All required reserve information for the Corporation is contained in its Annual Information Form for the year ended December 31, 2016, which is accessible at www.sedar.com. With respect to disclosure contained herein regarding resources other than reserves, there is uncertainty that it will be commercially viable to produce any portion of the resources and there is significant uncertainty regarding the ultimate recoverability of such resources.
All forward-looking statements are based on Crescent Point’s beliefs and assumptions based on information available at the time the assumption was made. Crescent Point believes that the expectations reflected in these forward-looking statements are reasonable but no assurance can be given that these expectations will prove to be correct and such forward-looking statements included in this report should not be unduly relied upon. By their nature, such forward-looking statements are subject to a number of risks, uncertainties and assumptions, which could cause actual results or other expectations to differ materially from those anticipated, expressed or implied by such statements, including those material risks discussed in the Corporation’s Annual Information Form for the year ended December 31, 2016 under "Risk Factors," in our Management’s Discussion and Analysis for the year ended December 31, 2016, under the headings "Risk Factors" and "Forward-Looking Information" and for the quarter ended September 30, 2017 under “Derivatives”, “Liquidity and Capital Resources”, “Changes in Accounting Policies” and “Outlook”. The material assumptions are disclosed in the Management’s Discussion and Analysis for the year ended December 31, 2016, under the headings "Capital Expenditures", "Liquidity and Capital Resources", "Critical Accounting Estimates", "Risk Factors", "Changes in Accounting Policies" and "Outlook" and are disclosed in the Management’s Discussion and Analysis for the quarter ended September 30, 2017 under the headings “Derivatives”, “Liquidity and Capital Resources”, “Changes in Accounting Policies” and “Outlook”. In addition, with respect to forward-looking information contained in this presentation, assumptions have been made regarding, among other things: future crude oil and natural gas prices; future interests rates and currency exchange rates; future cost escalation under different pricing scenarios; the Corporation's future production levels; the applicability of technologies for recovery and production of the Corporation's reserves and improvements therein; the recoverability of the Corporation's reserves; Crescent Point’s ability to market its production at acceptable prices; future capital expenditures; future cash flows from production meeting the expectations stated in this presentation; future sources of funding for the Corporation's capital program; the Corporation's future debt levels; geological and engineering estimates in respect of the Corporation's reserves; the geography of the areas in which the Corporation is conducting exploration and development activities; the impact of competition on the Corporation; the Corporation's ability to obtain financing on acceptable terms.
These assumptions, risks and uncertainties could cause actual results or other expectations to differ materially from those anticipated, expressed or implied by such statements. The impact of any one assumption, risk, uncertainty or factor on a particular forward-looking statement is not determinable with certainty as these are interdependent. Except as required by law, Crescent Point assumes no obligation to update forward-looking statements should circumstances or management's estimates or opinions change. Certain information contained herein has been prepared by third-party sources.
Included in this presentation are Crescent Point’s 2018 guidance in respect of capital expenditures, average annual production, exit production, funds flow from operations netback, total payout, net debt to funds flow from operations and number of wells to be drilled; and expectations under its 5-Year Plan, including with respect to CAGR + Yield, production by total payout and capital expenditures and net debt/funds flow by total payout, which are based on various assumptions as to production levels, commodity prices and other assumptions and are provided for illustration only and are based on budgets and forecasts that have not been finalized and are subject to a variety of contingencies including prior years' results. To the extent such estimates constitute a “financial outlook” or “future oriented financial information” in this presentation, as defined by applicable securities legislation, such information has been approved by management of Crescent Point in January 2018. Such financial outlook or future oriented financial information is provided for the purpose of providing information about management’s current expectations and plans relating to the future. Readers are cautioned that reliance on such information may not be appropriate for other purposes.
Cre
scen
t P
oin
t E
nerg
y
Co
rpo
rate
Pre
se
nta
tio
n
26
Appendix

Cre
scen
t P
oin
t E
nerg
y
Co
rpo
rate
Pre
se
nta
tio
n
27
Capital Markets Summary
CPG (TSX and NYSE)
Trading Price (Jan 4, 2018) C$10.46 (TSX), US$8.37 (NYSE)
Shares Outstanding 549.1 million
Average Daily Trading Volume ~5.9 million
Dividend (Yield) C$0.03 per month (3.4%)
Market Capitalization C$5.7 billion
Net Debt C$4.1 billion
Enterprise Value C$9.8 billion
Cash & Unutilized Credit Capacity C$1.5 billion
Net debt and cash and unutilized credit capacity as of September 30, 2017
Market capitalization and dividend yield based on share price as of market close on January 4, 2018 and 549.1 million fully diluted shares outstanding as of September 30, 2017
Average daily trading volume based on Canadian and US volumes from October 4, 2017 to January 4, 2018

Cre
scen
t P
oin
t E
nerg
y
Co
rpo
rate
Pre
se
nta
tio
n
28
$2.2B
Drawn on Bank
Credit Facilities
(~62% utilized)
$1.7B
Senior
Guaranteed
Notes*
$1.5B
Cash &
Unutilized
Credit
Capacity
$50
$74
$158
$185
-
50
100
150
200
2018 2019 2020 2021
Balance Sheet Strength
Significant amount of liquidity and financial flexibility
*Includes underlying currency swaps
• No material near-term debt maturities, cash and unutilized
credit capacity of ~$1.5 billion
• Bank credit facilities and senior guaranteed notes rank equal
and are unsecured and covenant-based. Bank credit facilities
have a June 2020 renewal date
• US$ denominated senior guaranteed notes fully hedged with
cross currency swaps
0.0x
1.0x
2.0x
3.0x
4.0x
2010 2011 2012 2013 2014 2015 2016
Debt Composition ($CAD) as of Sep 30, 2017
Senior Guaranteed Notes Maturity Schedule
Net Debt to Funds Flow From Operations
Millio
n $
CA
D

Cre
scen
t P
oin
t E
nerg
y
Co
rpo
rate
Pre
se
nta
tio
n
29
Waterflood Leaders: Realizing Gains from Waterflood Expertise
ICD improves recovery factor by controlling flow and creating even
water distribution through sleeves (50 ICDs installed as at YE 2017)
ICD pilots in the Viewfield Bakken have seen a rapid response,
offsetting oil production has increased 25% since installation
Testing additional methods to further increase recovery including
nanosurfactants, conformance gels and closeable sliding sleeves
INJECTION CONTROL DEVICE (ICD)
Improving Recovery Factors and Increasing Sustainability
Waterflood data normalized to first injection
0
100
200
300
400
500
600
10
20
30
40
50
-12 -10 -8 -6 -4 -2 0 2 4 6 8 10 12
Viewfield ICD Wells
(21 wells)
Oil R
ate
, b
bl/d
Inje
cti
on
Rate
, b
bl/d
Months (Pre and Post Install)
Oil Production Injection
0
100
200
300
400
500
600
10
20
30
40
50
-12 -6 0 6 12 18 24 30
Inje
cti
on
Rate
, B
bl/d
Oil R
ate
, B
bl/d
Months (Pre and Post Injection)
Historical Viewfield Water Injectors(85 wells ex. ICD)
Oil Production Injection

Cre
scen
t P
oin
t E
nerg
y
Co
rpo
rate
Pre
se
nta
tio
n
30
Financial Impact: 100 Annual Injection Well Conversions
Perc
en
t C
han
ge
Impact to Corporate Decline Rate
(100 Annual Conversions)
• 100 annual injector conversions equates to $40 million of annual capital expenditures
• Higher number of annual conversions provides greater impact to decline rate and ultimate recoveries
• Decline rates and incremental cash flow improve substantially long-termBased on $55 WTI pricing
Case #1 Historical Response Year 1 Year 2 Year 3 Year 4 Year 5
Injectors (net) 100 100 100 100 100
Production (boe/d) (491) (1,109) (134) 1,462 3,234
Incremental Capex ($MM) $40.0 $40.0 $40.0 $40.0 $40.0
Incremental Cash Flow ($MM) ($11.6) ($30.4) ($16.3) $10.7 $40.7
Case #2: Potential ICD Technology Year 1 Year 2 Year 3 Year 4 Year 5
Injectors (net) 100 100 100 100 100
Production (boe/d) (481) (954) 912 3,590 6,186
Incremental Capex ($MM) $40.0 $40.0 $40.0 $40.0 $40.0
Incremental Cash Flow ($MM) ($11.4) ($27.3) $5.1 $54.7 $103.6
Case #3: Simulation Scenario Year 1 Year 2 Year 3 Year 4 Year 5
Injectors (net) 100 100 100 100 100
Production (boe/d) (474) (829) 1,955 6,058 10,246
Incremental Capex ($MM) $40.0 $40.0 $40.0 $40.0 $40.0
Incremental Cash Flow ($MM) ($11.2) ($24.8) $26.3 $105.5 $189.6
-1.1%
-1.7%
-2.7%
-4.0%
-3.0%
-2.0%
-1.0%
0.0%
Year 5 Historical ResponseYear 5 Potential ICD
Technology Year 5 Simulation Scenario

Cre
scen
t P
oin
t E
nerg
y
Co
rpo
rate
Pre
se
nta
tio
n
31
Economics by Play
All figures are approximates and in CAD unless otherwise noted
Capital costs per well include drilling, completion, equipment and tie-in expenditures
Economics by play represent type wells expected to be drilled in 2018 program
$55 WTI Economics
Williston BasinType Well (EUR)
(mbbl)Cost per well ($MM)
NPV @ 10%
($MM)
IRR
(%)
Payout
(months)
Viewfield Bakken 50 – 125 1.4 0.4 – 3.4 33 – 239 24 – 9
Viewfield Bakken – Waterflood 350 1.4 5.7 267 7
Flat Lake – Torquay 100 – 175 2.4 1.6 – 3.8 57 - 126 17 – 12
Flat Lake – Conventional Ratcliffe 75 1.2 1.4 90 14
North Dakota ($US) 600 5.4 3.6 42 23
SE Saskatchewan Conventional 40 – 60 1.0 0.5 – 1.0 34 – 64 30 – 19
SW Saskatchewan Resource Play Type Well (EUR)
(mbbl)Cost per well ($MM)
NPV @ 10%
($MM)
IRR
(%)
Payout
(months)
Shaunavon 80 – 130 1.5 0.7 – 1.7 42 – 113 21 – 11
Shaunavon – Waterflood 264 1.5 2.4 53 20
Viking 41 – 54 0.9 0.4 – 0.7 32 – 50 29 – 21
Uinta Basin Type Well (EUR)
(mbbl)Cost per well ($MM)
NPV @ 10%
($MM)
IRR
(%)
Payout
(months)
Castle Peak (1-mile & 2-mile Hz) ($US) 350 – 620 5.5 - 8.5 1.6 – 4.9 27 – 64 30 – 14
Wasatch (1-mile Hz) ($US) 490 – 540 6.0 - 7.0 2.4 – 4.1 34 – 76 24 – 12

Cre
scen
t P
oin
t E
nerg
y
Co
rpo
rate
Pre
se
nta
tio
n
32
Example of CPG Resource Play vs. Oil Sands Projects
CPG Resource Play Including Waterflood
30+ Years
Oil Sands Projects data and economics from BMO Capital Markets Research
CPG resource play example based on a theoretical development of Viewfield and Shaunavon resource plays
Production held flat after reaching peak production of 30,000 boe/d for SAGD and 120,000 boe/d for mining project
Average pricing of US$61.49/bbl WTI and $0.78 USD/CAD exchange
Capital spent to reach peak production: $0.5 B for CPG Resource Play. $1.1B for SAGD and $7.4B for Mining
F&D Cost
($/Boe)
Project IRR
(%)
Payback
(Years, Undisc.)
Long-Term
Decline Rate
CPG RESOURCE PLAY
(Incl. Waterflood)
Low
Highest
Returns
Quickest
Payback
Low-Medium
SAGD OIL SANDS PROJECT
Low
Low
MINING OIL SANDS PROJECT
Low
30,000
Boe/d
30+ Years
30,000
Boe/d
SAGD Oil Sands Project Profile
30+ Years
120,000
Boe/d
Mining Oil Sands Project Profile
Cre
scen
t P
oin
t E
nerg
y
Co
rpo
rate
Pre
se
nta
tio
n
33
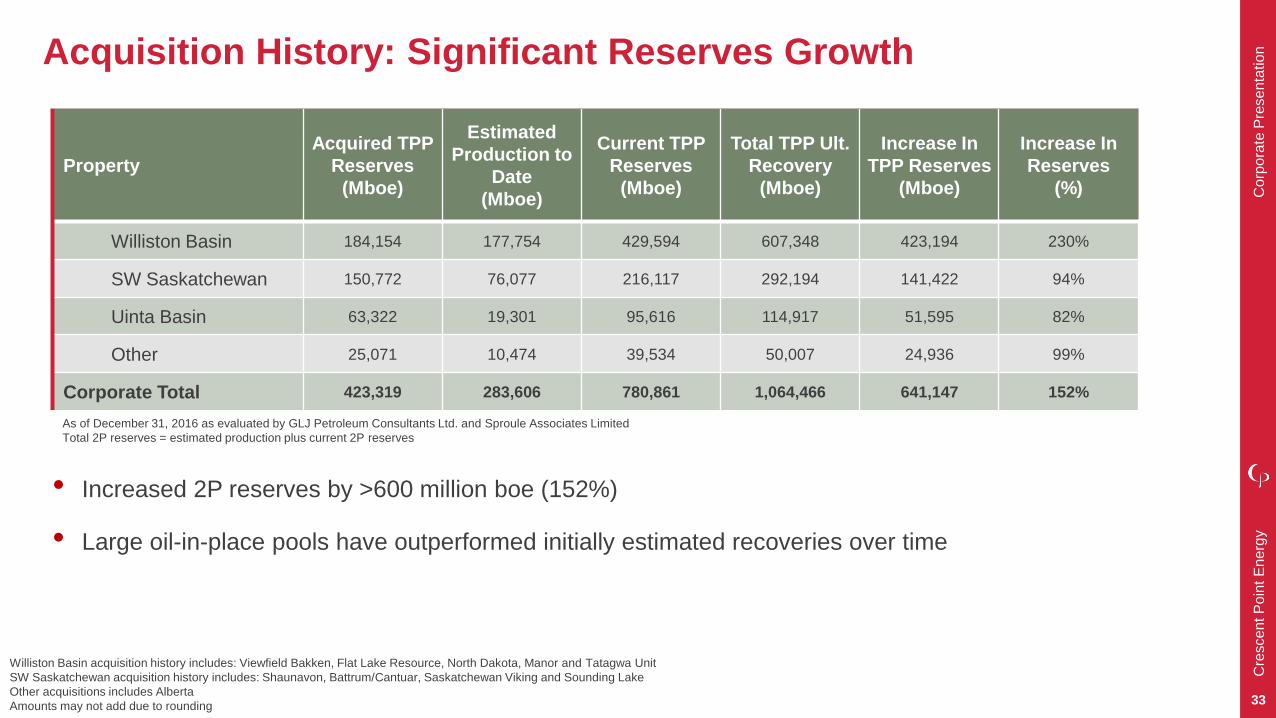
Acquisition History: Significant Reserves Growth
Property
Acquired TPP
Reserves
(Mboe)
Estimated
Production to
Date
(Mboe)
Current TPP
Reserves
(Mboe)
Total TPP Ult.
Recovery
(Mboe)
Increase In
TPP Reserves
(Mboe)
Increase In
Reserves
(%)
Williston Basin 184,154 177,754 429,594 607,348 423,194 230%
SW Saskatchewan 150,772 76,077 216,117 292,194 141,422 94%
Uinta Basin 63,322 19,301 95,616 114,917 51,595 82%
Other 25,071 10,474 39,534 50,007 24,936 99%
Corporate Total 423,319 283,606 780,861 1,064,466 641,147 152%
As of December 31, 2016 as evaluated by GLJ Petroleum Consultants Ltd. and Sproule Associates Limited
Total 2P reserves = estimated production plus current 2P reserves
• Increased 2P reserves by >600 million boe (152%)
• Large oil-in-place pools have outperformed initially estimated recoveries over time
Williston Basin acquisition history includes: Viewfield Bakken, Flat Lake Resource, North Dakota, Manor and Tatagwa Unit
SW Saskatchewan acquisition history includes: Shaunavon, Battrum/Cantuar, Saskatchewan Viking and Sounding Lake
Other acquisitions includes Alberta
Amounts may not add due to rounding

Cre
scen
t P
oin
t E
nerg
y
Co
rpo
rate
Pre
se
nta
tio
n
34
Climate Change Initiatives
Current Projects
• Piloting first solar facility in SE Saskatchewan
• Utilizing drilling rigs powered by cleaner burning natural gas
• Testing remote monitoring and automation
• Continual investment in gas conservation projects
• Contributed ~$200MM since inception to a voluntary fund for environmental clean up, emissions reductions and other climate change initiatives
Upcoming Projects
• Flare capture projects to generate power
• Expanding use of solar power on well sites, buildings and pneumatics
• Regenerative (hybrid) power for pump jacks
Regenerative (hybrid) power for pump jacks
Power generator using produced gas
First CPG solar facility in SE Saskatchewan
● Reduce Emissions ● Generate Clean Power ● Decrease Fuel Use

Cre
scen
t P
oin
t E
nerg
y
Co
rpo
rate
Pre
se
nta
tio
n
35
Climate Change Initiatives – Emissions Reduction
Crescent Point continually invests in facilities, pipelines and new technologies to conserve gas and
reduce emissions cost effectively and efficiently
Source: emissions and production data is from the latest available National Energy Board data
Emissions intensity is defined as the emission rate relative to the production of oil and gas (tonnes CO2e/annual boe production)
0.00
0.02
0.04
0.06
0.08
0.10
0.12
0.14
To
nn
es
CO
2e / b
oe
Emissions Intensity
~50% less than
Saskatchewan peers
Canadian Oil &
Gas Emissions
Intensity
Crescent Point
Canadian
Emissions
Intensity
Crescent Point
Saskatchewan
Emissions
Intensity
Saskatchewan
Emissions
Intensity
~40% less than
Canadian peers
Cre
scen
t P
oin
t E
nerg
y
Co
rpo
rate
Pre
se
nta
tio
n
36
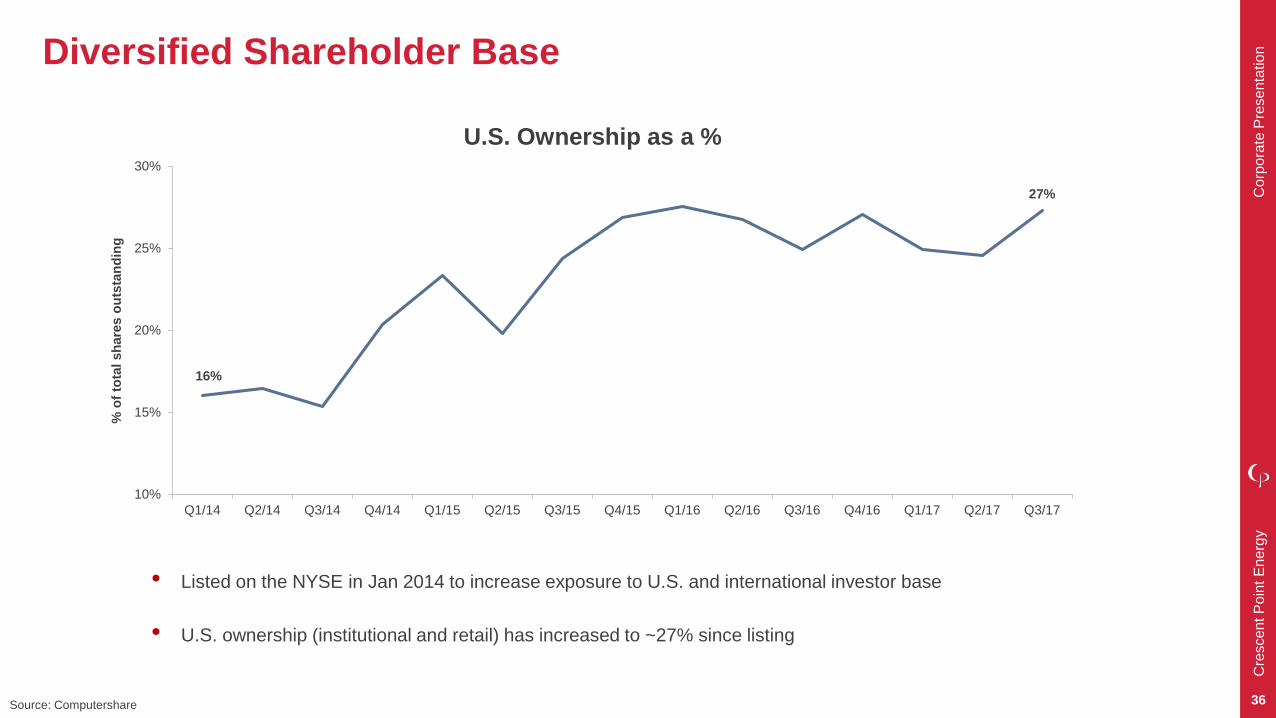
Diversified Shareholder Base
• Listed on the NYSE in Jan 2014 to increase exposure to U.S. and international investor base
• U.S. ownership (institutional and retail) has increased to ~27% since listing
Source: Computershare
16%
27%
10%
15%
20%
25%
30%
Q1/14 Q2/14 Q3/14 Q4/14 Q1/15 Q2/15 Q3/15 Q4/15 Q1/16 Q2/16 Q3/16 Q4/16 Q1/17 Q2/17 Q3/17
% o
f to
tal sh
are
s o
uts
tan
din
g
U.S. Ownership as a %

Cre
scen
t P
oin
t E
nerg
y
Co
rpo
rate
Pre
se
nta
tio
n
37
High Employee Engagement Contributes to Strong Corporate Governance• 10th annual employee survey delivered to all field and office staff (82% or 823 responded in 2016) measures perception of
management integrity, ethics and values; trends are consistently high
• 2016 survey responses demonstrate a highly engaged workforce with an entrepreneurial focus:
• Leads to enhanced organizational productivity and efficiency
• Lower rates of staff turnover builds team commitment and a foundation for innovation
“I am inspired to give
my very best”
94%
90%“I would recommend
Crescent Point as a great
place to work”
93%
“I have confidence in
the executive team”
91%
“Executives demonstrate
integrity and ethical
behaviour”
“Employees are inclined
to do the right thing”
96%“I am proud to tell people
I work for Crescent Point”
94%
“I am driven to make
a difference at
Crescent Point”
95%
We respond to survey results and make positive changes

Cre
scen
t P
oin
t E
nerg
y
Co
rpo
rate
Pre
se
nta
tio
n
38
Board Renewal Process Supported by Robust Orientation
Ongoing and Deliberate Board Renewal Process
• Board renewal process initiated in 2014
• Added 6 new members since process began
• New directors in 2017-2019 will continue to replace and build on skillsets of retiring members
Strong Director Orientation and Training
• Director orientation includes comprehensive handbook of responsibilities and corporate information as well as one-on-one meetings with
key executives on our business, financial model, operations, compensation and culture
• All directors provided with membership to the Institute of Corporate Directors
• Learning opportunities provided regularly through quarterly management presentations, field tours, mentoring (on request), various in-
house courses provided by technical experts and access to weekly executive meetings to maintain ongoing insight into daily operations
Impact of board renewal process on tenure
Under 7 Years Tenure Over 7 Years Tenure
2013 2017 2019
6 new
independent
members
since 2014
2 new
independent
members to be
added by 2019
Other key diversity enhancements:
International experience
Industry
Gender
Capital markets

Cre
scen
t P
oin
t E
nerg
y
Co
rpo
rate
Pre
se
nta
tio
n
39
8%
10% 10%
14%
0%
4%
8%
12%
16%
20%
CPG 2017E Peer Q3 YTD2017 Average
CPG 3-yearAverage
Peer 3-yearAverage
Peer average includes members of the S&P Capped Energy Index
Netback is prior to hedging
We manage our compensation costs to a competitive level vs our peers
Our philosophy is to pay-for-performance under a plan that is:
• Aligned
• Accountable
• Simple
Cash and Share-Based G&A as a Percentage of
Netback
To
tal G
&A
as a
perc
en
tag
e o
f n
etb
ack
$ p
er
bo
e
2018E: $1.45/boe
CPG 10 year average cash G&A = $1.48 / boe
10 Years of Consistently Low Cash G&A -
Under $1.65/boe
Entrepreneurial Culture Drives Low G&A
2018E: 6%
$1.00
$1.50
$2.00
2007 2008 2009 2010 2011 2012 2013 2014 2015 2016 2017E

Cre
scen
t P
oin
t E
nerg
y
Co
rpo
rate
Pre
se
nta
tio
n
40
Disclosure Committee
NOTE TO READER REGARDING DISCLOSURE
In addition to obtaining all necessary Board approvals, the Company’s long-established Disclosure Committee’s mandate is to review and confirm the accuracy of the data and information contained in the documents, including this presentation, Crescent Point uses to communicate to the public. This review and confirmation process is formally completed prior to any such disclosure being released. This Committee is comprised of senior representatives (including officers) from each of the following departments: accounting and finance; engineering and operations (including drilling and completions, environment, health and safety and regulatory); exploration and geosciences; investor relations; land; legal; marketing and reserves.
This presentation contains "forward-looking statements" within the meaning of applicable securities legislation, such as section 27A of the Securities Act of 1933 and section 21E of the Securities Exchange Act of 1934, including estimates of future production, cash flows and reserves, business plans for drilling and exploration, the estimated amounts and timing of capital expenditures, the assumptions upon which estimates are based and related sensitivity analyses, and other expectations, beliefs, plans, objectives, assumptions or statements about future events or performance. Please see the “Forward-Looking Statements” and “Endnotes” sections of this presentation for additional details regarding such statements.

Cre
scen
t P
oin
t E
nerg
y
Co
rpo
rate
Pre
se
nta
tio
n
41
Definitions / Non-GAAP Financial Measures
Drilling Locations
This presentation discloses drilling locations in three categories: (i) booked locations; (ii) unbooked locations; and (iii) an aggregate total of (i) and (ii), hereafter referred to as "total location inventory". In addition, unbookedlocations are subdivided into (a) risked locations; (b) unrisked locations; and an aggregate total of (a) and (b), hereafter referred to as "total unbooked location inventory". The booked locations are derived from the Corporation's most recent independent reserves evaluation as prepared by GLJ Petroleum Consultants Ltd. and Sproule Associates Limited, both as at December 31, 2016, and were aggregated by GLJ and account for drilling locations that have associated proved and/or probable reserves, as applicable, unless otherwise stated.
Of the ~8,100 risked total net corporate undrilled locations and the ~14,000 net total unrisked locations inventory disclosed in this presentation, 3,680 are booked as of December 31, 2016. The remaining net locations are internally identified and are unbooked.
Of the approximately ~850 risked net Uinta horizontal locations disclosed and the ~1,700 net total unrisked locations in this presentation, 23 are booked as of December 31, 2016. The remaining net locations are internally identified and are unbooked.
Unbooked locations are internal estimates based on the Corporation's prospective acreage and an assumption as to the number of wells that can be drilled per section based on industry practice and internal review. Unbooked locations do not have attributed reserves or resources (including contingent and prospective). Unbooked locations have been identified by management as an estimation of the Corporation's multi-year drilling activities based on evaluation of applicable geologic, seismic, engineering, production and reserves information. There is no certainty that the Corporation will drill all unbooked drilling locations and if drilled there is no certainty that such locations will result in additional oil and gas reserves, resources or production. The drilling locations on which the Corporation will actually drill wells, including the number and timing thereof is ultimately dependent upon the availability of funding, regulatory approvals, seasonal restrictions, oil and natural gas prices, costs, actual drilling results, additional reservoir information that is obtained and other factors.
The total unbooked location inventory contains risked future drilling locations that have a greater certainty of success due to these risked locations relative close proximity to current existing wells. The remainder of the unbooked drilling locations considered unrisked as they are farther away from existing wells, where management has less information about the characteristics of the reservoir and therefore there is more uncertainty whether wells will be drilled in such locations and if drilled, there is more uncertainty that such wells will result in additional oil and gas reserves, resources or production.
Well Economics
This presentation discloses well economic scenarios based on US $55 WTI constant pricing. Net present value (“NPV”) calculations are before tax.
Productive Capacity
Productive capacity is defined as the total IP30 rate assuming all wells in inventory are brought on production at the same time.

Cre
scen
t P
oin
t E
nerg
y
Co
rpo
rate
Pre
se
nta
tio
n
42
Definitions / Non-GAAP Financial Measures
Oil and Gas Metrics
This presentation includes oil and gas metrics including “drilling inventory” and “netback”, Such metrics do not have a standardized meaning and as such may not be reliable, and should not be used to make comparisons.
Drilling inventory and current inventory are calculated in years as net well count guidance divided by remainder of inventory. Drilling inventory and current inventory are used by management to assess the amount of available drilling opportunities. Internally identified unbooked drilling locations may include infill, lease-edge and undrilled tracts, based on current land holdings, geologic, geophysical and engineering analysis that result in mapped type-well groupings and optimized scheduling.
Netback is calculated on a per boe basis as oil and gas sales, less royalties, operating and transportation expenses. Netback is used by management to measure operating results on a per boe basis to better analyze performance against prior periods on a comparable basis.
Oil and Gas Definitions
1. Barrels of oil equivalent (“boe”) may be misleading, particularly if used in isolation. A boe conversion ratio of 6 Mcf : 1 Bbl is based on an energy equivalency conversion method primarily applicable at the burner tip
and does not represent a value equivalency at the wellhead. Given that the value ratio based on the current price of crude oil as compared to natural gas is significantly different from the energy equivalency of oil,
utilizing a conversion on a 6:1 basis may be misleading as an indication of value.
2. Original Oil-In-Place (OOIP) means Discovered Petroleum Initially-In-Place (DPIIP) as at December 31, 2016, but excluding gas. DPIIP, as defined in the Canadian Oil and Gas Evaluations Handbook (COGEH), is
that quantity of petroleum that is estimated, as of a given date, to be contained in known accumulations prior to production. The recoverable portion of DPIIP includes production, reserves and contingent resources;
the remainder is unrecoverable. OOIP/DPIIP estimates and recovery rates are as at December 31, 2016, and are based on current accepted technology and have been prepared by Crescent Point’s qualified
reservoir engineers. There is significant uncertainty regarding the ultimate recoverable OOIP/DPIIP. For further information see Crescent Point’s Annual Information Form for the year-ended December 31, 2016.
3. There is significant uncertainty regarding the ultimate recoverable OOIP/DPIIP. For further information see Crescent Point’s Annual Information Form for the year-ended December 31, 2016.
4. Net present values disclosed in this presentation are calculated before tax.
5. Enhanced Ultimate Recovery (or EUR) relates to the extraction of additional crude oil, natural gas, and related substances from reservoirs through a production process other than natural depletion, which includes
both secondary and tertiary recovery processes such as pressure maintenance, cycling, waterflooding, thermal methods, chemical flooding, and the use of miscible and immiscible displacement fluids.
6. Type wells are internally generated based on actual well results and data that is interpreted by internal qualified reserves evaluators.
7. Cash flow equates to funds flow from operations. Cash flow from operations per share equals funds flow from operations per share.

Cre
scen
t P
oin
t E
nerg
y
Co
rpo
rate
Pre
se
nta
tio
n
43
Definitions / Non-GAAP Financial Measures
Non-GAAP Measures
Throughout this presentation the Company uses the terms “funds flow from operations”, “funds flow from operations netback”, “total payout”, “market capitalization”, “net debt”, “enterprise value” and “net debt to funds flow from operations”. These terms do not have any standardized meaning as prescribed by IFRS and, therefore, may not be comparable with the calculation of similar measures presented by other issuers.
Funds flow from operations is calculated based on cash flow from operating activities before changes in non-cash working capital, transaction costs and decommissioning expenditures. Transaction costs are excluded as they vary based on the Company’s acquisition activity and to ensure that this metric is more comparable between periods. Decommissioning expenditures are excluded as the Company has a voluntary reclamation fund to fund decommissioning costs. Funds flow from operations netback is calculated on a per boe basis as funds flow from operations divided by total production. Management utilizes funds flow from operations as a key measure to assess the ability of the Company to finance dividends, operating activities, capital expenditures and debt repayments. Funds flow from operations as presented is not intended to represent cash flow from operating activities, net earnings or other measures of financial performance calculated in accordance with IFRS.
Total payout is calculated on a percentage basis as capital expenditures, capital acquisitions and dividends declared divided by funds flow from operations and proceeds from dispositions. Total payout is used by management to monitor the Company’s capital reinvestment and dividend policy, as a percentage of the amount of funds flow from operations, taking into account capital acquisition and disposition activity.
Market capitalization is an indication of enterprise value and is calculated by applying a recent share trading price to the number of diluted shares outstanding. Market capitalization is an indication of enterprise value.
Net debt is calculated as long-term debt plus accounts payable and accrued liabilities, dividends payable and long-term compensation liability, less cash, accounts receivable, prepaids and deposits and long-term investments, excluding the unrealized foreign exchange on translation of US dollar long-term debt. Management utilizes net debt as a key measure to assess the liquidity of the Company.
Enterprise value is calculated as market capitalization plus net debt. Management uses enterprise value to assess the valuation of the Company.
Net debt to funds flow from operations is calculated as the net debt divided by funds flow from operations for the trailing four quarters. The ratio of net debt to funds flow from operations is used by management to measure the Company’s overall debt position and to measure the strength of the Company’s balance sheet. Crescent Point monitors this ratio and uses this as a key measure in making decisions regarding financing, capital spending and dividend levels.
Management believes the presentation of the Non-GAAP measures above provide useful information to investors and shareholders as the measures provide increased transparency and the ability to better analyze performance against prior periods on a comparable basis. This information should not be considered in isolation or as a substitute for measures prepared in accordance with IFRS. For definitions of the non-GAAP measures listed above along with reconciliations from the non-GAAP measure to the most directly comparable GAAP measure, each of which is incorporated by reference please see the Company’s most recent annual Management’s Discussion & Analysis (“MD&A”) available on SEDAR at sedar.com, or EDGAR as www.sec.gov and on our website as www.crescentpointenergy.com.

Cre
scen
t P
oin
t E
nerg
y
Co
rpo
rate
Pre
se
nta
tio
n
44
Company Information
BANKER Bank of Nova Scotia
AUDITOR PricewaterhouseCoopers LLP
LEGAL COUNSEL Norton Rose Fulbright Canada LLP
EVALUATION ENGINEERS GLJ Petroleum Consultants Ltd.
Sproule Associates Limited
REGISTRAR & TRANSFER AGENT Computershare Trust Company
INVESTOR CONTACTS
403.767.6930
1.855.767.6923 (Toll Free)
Suite 2000, 585 – 8th Ave SW, Calgary, AB T2P 1G1
T: 403.693.0020 | F: 403.693.0070 | TF: (Canada & USA) 1.888.693.0020
www.crescentpointenergy.com