Embed Size (px)
Citation preview

CORPORATE PRESENTATION
4Q19
AS OF MARCH ´20

Disclaimer
2
This supplemental information, together with other statements and information publicly disseminated by us, contains “forward-looking statements” within the meaning of Section 27A of the
Securities Act of 1933, as amended, and Section 21E of the Securities Exchange Act of 1934, as amended. Such statements reflect management’s current views with respect to financial
results related to future events and are based on assumptions and expectations that may not be realized and are inherently subject to risks and uncertainties, many of which cannot be
predicted with accuracy and some of which might not even be anticipated. Future events and actual results, financial or otherwise, may differ from the results discussed in the forward-
looking statements. Risk factors and other factors that might cause differences, some of which could be material, include, but are not limited to, the impact of current lending and capital
market conditions on our liquidity, ability to finance or refinance projects and repay our debt, the impact of the current economic environment on the ownership, development and
management of our commercial real estate portfolio, general real estate investment and development risks, using modular construction as a new construction methodology, vacancies in
our properties, further downturns in the real estate market, competition, illiquidity of real estate investments, bankruptcy or defaults of tenants, anchor store consolidations or closings,
international activities, the impact of terrorist acts, our debt leverage and the ability to obtain and service debt, the impact of restrictions imposed by our credit lines and senior debt, the
level and volatility of interest rates, effects of a downgrade or failure of our insurance carriers, environmental liabilities, conflicts of interest, risks associated with the sale of tax credits,
risks associated with developing and managing properties in partnership with others, the ability to maintain effective internal controls, compliance with governmental regulations, increased
legislative and regulatory scrutiny of the financial services industry, changes in federal, state or local tax laws, volatility in the market price of our publicly traded securities, inflation risks,
litigation risks, cybersecurity risks and cyber incidents, as well as other risks listed from time to time in our reports filed with the Comisión Nacional Bancaria y de Valores. We have no
obligation to revise or update any forward-looking statements, other than imposed by law, as a result of future events or new information. Readers are cautioned not to place undue
reliance on such forward-looking statements.

3
Understanding FUNO’s DNA
Long Term Total Return Focus → Sustainable Shareholder Value Creation
Capital Appreciation through Active Management
of our Assets and Opportunities
High Occupancy
Rent Collections
=
Dividends
Dividend
Distributions
➢ Acquisitions
➢ Developments
➢ Re-Developments
Value Weight

4
Total Return Focus: Capital appreciation outweighs distributions
NAV per CBFI
Quarterly Distribution per CBFI
(1) Figures in Ps.$ mm as of 3Q’19. *CAGR from 2Q’11 to 3Q’19. NAV is calculated over Total Net Asset value (controlling and non-controlling interest)
CAGR:
8.0%
CAGR:
10.9%
+$16.51
per CBFI
distributed
$25.4 per
CBFI
value
created
42.6
17.2
0.30
0.5900
1Q
'11
2Q
'11
3Q
'11
4Q
'11
1Q
'12
2Q
'12
3Q
'12
4Q
'12
1Q
'13
2Q
'13
3Q
'13
4Q
'13
1Q
'14
2Q
'14
3Q
'14
4Q
'14
1Q
'15
2Q
'15
3Q
'15
4Q
'15
1Q
'16
2Q
'16
3Q
'16
4Q
'16
1Q
'17
2Q
'17
3Q
'17
4Q
'17
1Q
'18
2Q
'18
3Q
'18
4Q
'18
1Q
'19
2Q
'19
3Q
´19
4Q
´19
1Q
'11
2Q
'11
3Q
'11
4Q
'11
1Q
'12
2Q
'12
3Q
'12
4Q
'12
1Q
'13
2Q
'13
3Q
'13
4Q
'13
1Q
'14
2Q
'14
3Q
'14
4Q
'14
1Q
'15
2Q
'15
3Q
'15
4Q
'15
1Q
'16
2Q
'16
3Q
'16
4Q
'16
1Q
'17
2Q
'17
3Q
'17
4Q
'17
1Q
'18
2Q
'18
3Q
'18
4Q
'18
1Q
'19
2Q
´19
3Q
´19
4Q
´19

5
TRIED AND TESTED MODEL
“Location, location, location”
Always the best locations
Competitive rent levels =
high occupancyPrudent
Leverage Policy
3
“FUNO´s
Sustainable
Model”
2
1

6
1. Location
Our portfolio is focused in the largest and most dynamic states of Mexico
• Our top 5 states generate 80% of our ABR
33%
20%
9% 8%6% 4% 3% 3% 2%
12%
CDMX EDO MEX JAL NL QR CHIH QRO TAMPS COAH Others(23)
Retail Industrial Office Others

7
2. Competitive rent levels
19
29
Office
3.5
5.1
Industrial
153
800
Retail
Competitive Rent Drives Occupancy & Rent Growth
FUNO(1): 24
USD/sqm
Market Price Range
FUNO: 253
Ps./sqm USD/sqm
FUNO: 4.3
Office Occupancy:
FUNO (1): 87.9%
FUNO (2): 83.6%
Market 84.0%
Retail Occupancy:
FUNO 93.3%
Market 90.0%
Industrial Occupancy:
FUNO 96.6%
Market 94.6%
(1) Excluding Centrumpark (2) Including Centrumpark
FUNO(2): 18

8
• Constant GLA growth with consistent high occupancy rate.
2. Competitive rent levels & high occupancy levels
(1) NOI margin over rental income
5,951
7,079 7,370
8,448 8,615
10,130
95.30% 95% 94.40% 94.30%95.30%
94.50%
90.0%88.9% 89.5%
90.8%
88.0% 88.1%
50.00%
55.00%
60.00%
65.00%
70.00%
75.00%
80.00%
85.00%
90.00%
95.00%
100.00%
0
2,000
4,000
6,000
8,000
10,000
12,000
14,000
2014 2015 2016 2017 2018 2019
Total GLA Occupancy rate NOI Margin

9
3. Prudent leverage policy
Debt Profile(1)
100%
Short Long
Short vs Long Term
Fixed vs Floating
Currency Distribution
Secured vs Unsecured
(1) After “Titan” Acquisition
Fixed rate76%
Floating rate24%
Secured8%
Unsecured92%
Ps.50%
Us.50%

10
Average Cost of
Debt5.43%
3.1 yearsAverage Life of
Debt
3Q’13 Debt Maturity 4Q’19 Debt Maturity
Foreign Exchange
Rate12.2 Ps./USD
Average Cost of
Debt7.12%
11.7 yearsAverage Life of
Debt
Foreign Exchange
Rate18.87 Ps./USD
TIIE 28
4.0%TIIE 28
7.29%
3. Prudent leverage policy
Strategy to mitigate short term refinancing risk.
16.2%7.2% 4.1%
20.1%
52.5%
ShortTerm
13-24mths
25-36mths
37-48mths
49+mths
1.9% 0.2%7.7% 10.8%
79.4%
ShortTerm
13 - 24mths
25 - 36mths
37 - 48mths
49+ mths
11
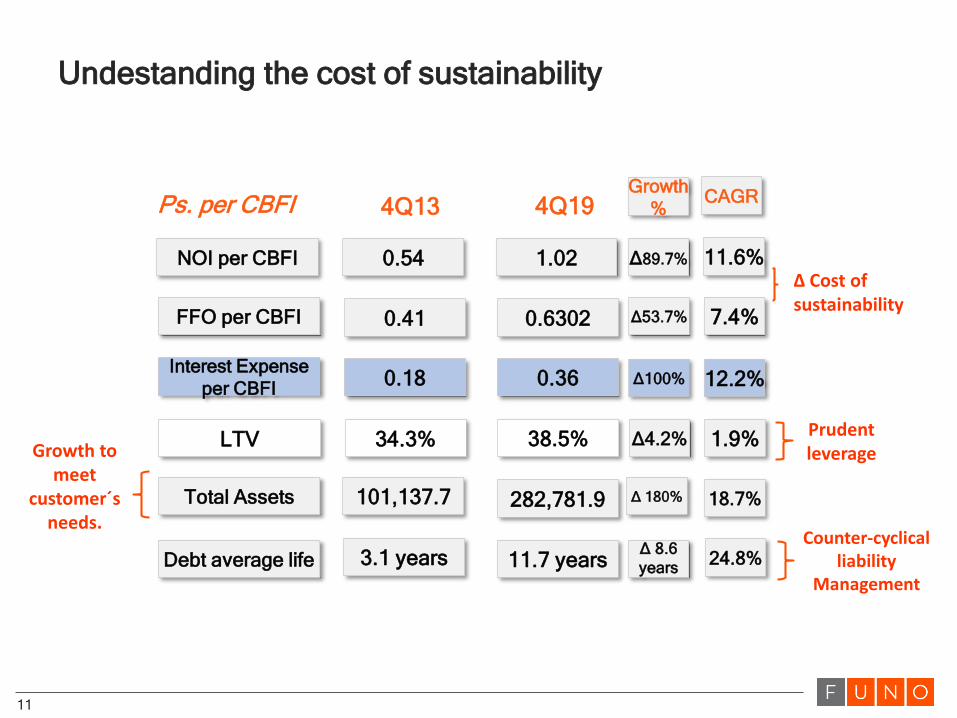
Undestanding the cost of sustainability
Ps. per CBFI 4Q13 4Q19
NOI per CBFI 0.54 1.02 Δ89.7% 11.6%
FFO per CBFI 0.41 0.6302 Δ53.7% 7.4%
Interest Expense
per CBFI0.18 0.36 Δ100% 12.2%
CAGRGrowth
%
LTV 34.3% 38.5% Δ4.2% 1.9%
Total Assets 101,137.7 282,781.9 Δ 180% 18.7%
Debt average life 3.1 years 11.7 yearsΔ 8.6
years24.8%
Counter-cyclical liability
Management
Growth to meet
customer´s needs.
Prudent leverage
∆ Cost of sustainability

12
Growth to meet Tenant’s Needs
Since our inception, we’ve been growing alongside our tenants
2011
# of States: 3
GLA: 21,849 m2
# of States: 22
GLA: 900,641 m2
# of States: 4
GLA: 20,032 m2
# of States: 20
GLA: 134,858 m2
2Q’19 2011 2Q’19
Δ 40.2x Δ 5.7x

13
Growth to meet Tenant’s Needs
2011
# of States: 3
GLA: 1,501m2
# of States: 23
GLA: 125,825m2
# of States: 1
GLA: 24,031m2
# of States: 8
GLA: 118,722m2
2Q’19 2011 2Q’19
Δ 82.8x Δ 4.0x

14
Adding Value Through Development
• 7 properties
• 166,932 sqm
• 5 states
• 5 properties
• 290,412 sqm
• 2 states
• 7 properties
• 711,912 sqm
• 1 state
• 1 property
• 115,324 sqm
• 1 state
Retail Office Industrial Mixed Use
FUNO has developed 20 properties for more tan 1.3 million sqm of our current GLA.

15
Current portfolio under development
5Properties
508,541.5 Sqm of additional GLA
Ps. 1.1 bn
Expected additional revenue
Ps. 5.1 bn
Pending CapEx
12%
Expected yield-on-cost
La isla cancún 2

16
Tepozpark / Frimax – First Phase out of 350,000 sqm

17
Mitikah – Torre M

18
Mitikah – Torre M

19
Mitikah – Condo Tower

20
Mitikah – Retail Area

21
Mitikah Update
Residential Retail Office Space
~85% units sold ~88% Leased ~88% Leased(1)
1 million sqm GBA Total Stabilized GLA: 337,410 sqm
• Mitikah is ahead of schedule on units sold as well as pre-leasing
(1) Includes Torre M´s LOIs

22
Ability to create value – Mitikah Investment Cost
Land Acquisition Price 4,400
Rents Collected (Colorado Portfolio) -600
Total Cost 3,800
Fund Management Fee 1.25% on Ps. 6,000 mm 750
Development Fee 3% on Ps. 21,000 mm 630
Total Fee Income 1,380
Total Asset Cost (Net of Fees) 2,420
FUNO’s Investment Cost
Helios Fee Structure Cost
Figures in Ps. mm
FUNO’s 62% ownership 2,420 1,240(1) 51.2%
COST MITIKAH’s NOI YOC
(1) FUNO’s share

23
Leasing Spread
Leasing Spread is the change in rent price per sqm of our different segments. It considers contracts that suffered
changes compared to the same contracts in the previous year.
Note: As Retail USD leases are not representative, they´re not included in the USD leasing spread.
10.0%11.5% 11.1% 11.1% 11.1%
4.1%
9.5%
13.8%
11.4%10.3%
11.0%12.5%
8.2%
12.4%
5.1%
7.1% 6.8% 6.3%
9.0%
-1.6%
2.5%
-4.0%
-2.0%
0.0%
2.0%
4.0%
6.0%
8.0%
10.0%
12.0%
14.0%
16.0%
2Q18 3Q18 4Q18 1Q19 2Q19 3Q19 4Q19
Leasing Spread (MXP)
INPC Retail Industrial Office
2.30% 2.4% 2.4% 2.3% 2.0% 1.9% 1.8%1.6%
2.3% 2.3%2.7%
4.6%
-0.9%
1.0%
2.0% 1.9%
4.2%
6.1%6.6%
4.0%
0.9%
-2.00%
-1.00%
0.00%
1.00%
2.00%
3.00%
4.00%
5.00%
6.00%
7.00%
2Q18 3Q18 4Q18 1Q19 2Q19 3Q19 4Q19
Leasing Spread (USD)
CPI Industrial Office
24
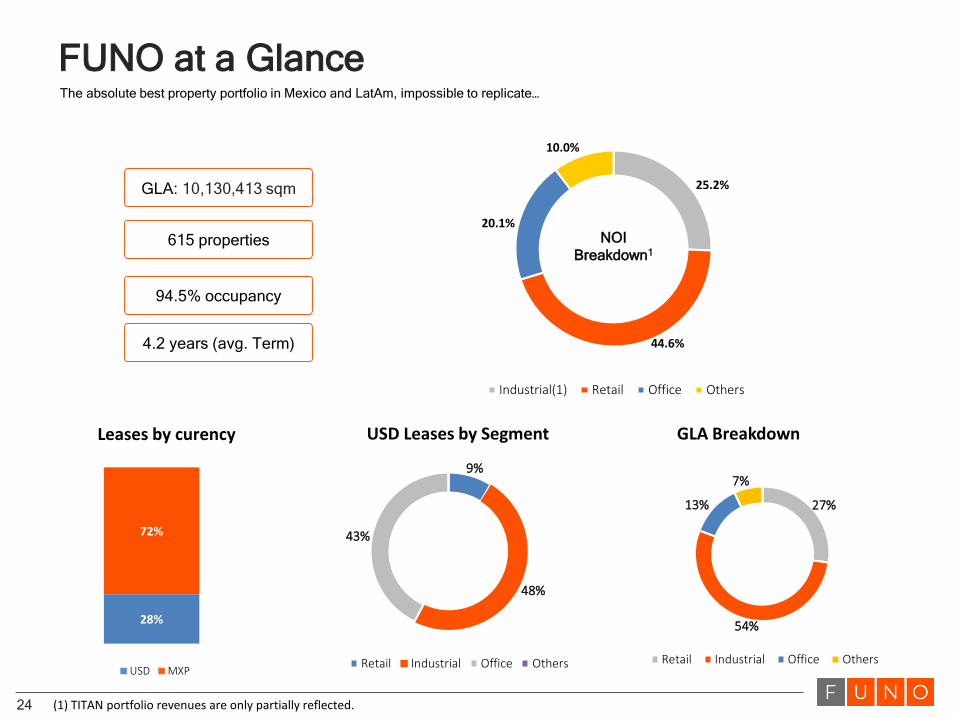
FUNO at a Glance
NOI
Breakdown1
GLA: 10,130,413 sqm
615 properties
94.5% occupancy
The absolute best property portfolio in Mexico and LatAm, impossible to replicate…
4.2 years (avg. Term)
Leases by curency USD Leases by Segment GLA Breakdown
(1) TITAN portfolio revenues are only partially reflected.
25.2%
44.6%
20.1%
10.0%
Industrial(1) Retail Office Others
28%
72%
USD MXP
9%
48%
43%
Retail Industrial Office Others
27%
54%
13%
7%
Retail Industrial Office Others

25
Prime Locations and High-Quality Assets – Industrial(1)
Newly developed, high-tech Industrial
parks located on key logistics and
manufacturing corridors
Industrial
▪ Logistics: 72% of industrial GLA
▪ Light manufacturing: 28% of industrial
GLA
▪ Strong footprint in Mexico City and its
Metropolitan Area
▪ Super-prime locations across the most
important logistics corridors and export
markets
▪ Proximity to main highways, roads and
connection points to the whole country
▪ State-of-the-art buildings
▪ One of the youngest portfolios in the
country, average building age: less than
6 years
▪ Segment occupancy: 96.6%
FUNO strives to own and develop high-quality real estate assets in prime locations across high-ranking cities in Mexico…
Source: Jones Lang LaSalle(1) As of 4Q19.

26
TITAN Portfolio – General Features
Occupancy Average lease term Monthly rent per sqm
95.1% 4.5 Years USD 4.6
74 Properties
1,262,457 GLA
Located in 10 Cities

27
Titan Portfolio
Logistics Light Manufacturing Office
10% 84% 6%
USD 89% MXP 11%
Income distribution
Top tenants by Country
USA 58%
Mexico 20%
Japan 7%
Korea 6%
Germany 3%
Ireland 2%

28
TITAN Acquisition Numbers
Purchase price: USD 822.0 M
Total NOI 2020: USD 66.3 M
Entry Cap Rate: 8.1%
Total Debt: USD 500.0 M
Cost of debt: Libor 3 months + 185 bps
LTV: 59.4 %
NOI: USD 66.3 M
Fx: 19.25
Debt Service: USD (19.3) M
FFO Impact: USD 47.0 M
FFO Impact: MXP 905.7 M
Accretion Analysis

Prime Locations and High-Quality Assets – Retail
The best options for shopping in
different formats and on several cities
across the country
Retail
▪ Diversified portfolio across all the
subsegments of retail
▪ Prime locations in primary and secondary
cities with high-traffic
▪ Significant footprint in Mexico City and its
Metropolitan Area
▪ Strong exposure to large retailers and
significant components of entertainemnt
options
▪ The only shopping centers in Chetumal,
Celaya, Taxco, Tuxtla Gutiérrez,
Downtown Cancun, Cozumel Tepic,
Aguascalientes
▪ The largest fashion mall in Guadalajara,
Chihuahua, Cancun, Monterrey, Saltillo,
Iguala and Chilpancingo
▪ Several stand-alones with enormous re-
conversión potential
▪ 450,000,000 pers´s./year: consolidated
FUNO´s shopping mall´s traffic.
… and to have high-quality assets on those locations with below-market rent prices…
28

30
Prime Locations and High-Quality Assets – Offices
Iconic and irreplaceable office buildings
on the most important corporate
corridors in Mexico City
Office
FUNO in the Reforma Corridor:
▪ 7 iconic, irreplaceable buildings on prime locations
▪ 319,106.5 sqm of office GLA
▪ 29.3% of market share
FUNO in the Santa Fe Corridor
▪ 3 iconic, irreplaceable buildings on prime locations
▪ More than 128,000 sqm of office GLA
▪ 11.2% of corridor market share
▪ 96.3% occupacy rate
FUNO in the Insurgentes Corridor:
▪ More than 121,000 sqm of office GLA
▪ 13 buildings across the corridor
▪ 17.5% market share in the corridor
▪ Largest avenue in Mexico and FUNO’s buildings
scattered across several neighborhoods
… ensuring high occupancies throughout the cycle and guaranteeing stable cash flows

31
Subsegment Breakdown
Occupancy by Subsegment (% GLA) 4Q19
NOI by Subsegment(% NOI) 4Q19
(1) Properties from the Red Portfolio are classified as Stand Alone, (2) NOI at property level(3) Excludes properties “in service” (3) Classification different from segment classification.
Subsegment(3) Total GLA Occupied GLA % Occupancy (5) $/sqm/month NOI(4) 4Q19
Logistics 3,911.7 3,777.5 96.6% 81.1 799,631.8
Light manufacturing 1,502.8 1,453.7 96.7% 93.0 306,988.1
Fashion mall 551.0 524.8 95.2% 358.8 525,867.0
Regional center 1,927.7 1,788.6 92.8% 230.2 1,091,862.9
Stand alone(1)
174.6 161.4 92.5% 118.1 47,661.3
Office 1,125.1 942.4 83.8% 360.9 825,201.2
Others 660.9 659.0 99.7% 202.5 442,706.4
Total 9,853.9 9,307.4 94.5% 164.8 4,039,918.6
96.6%
96.7%
95.2%
92.8%
92.5%
83.8%
99.7%Logistics
Light manufacturing
Fashion mall
Regional center
Stand alone(1)
Office
Others
19.8%
7.6%
13.0%
27.0%
1.2%
20.4%
11.0%Logistics
Light manufacturing
Fashion mall
Regional center
Stand alone(1)
Office
Others

32
ESG Achievements
2016 2017 2018 2019
• Materiality Analysis→ 2016-2020 Plan
• United Nations’ Global Compact
• Reports under Global Reporting Initiative
• Fundación FUNO started operations
• Member of the Dow Jones Sustainability
MILA Index
• External and independent whistleblowing
mechanism open to all employees and
suppliers
• Member of the FTSE4Good Index Series
• Disclosure of our carbon footprint to the Carbon
Disclosure Project
• Sustainability Committee
• Green credit line
• Confirmed as member of the Dow
Jones Sustainability MILA Index +
Emerging Markets


