Embed Size (px)
Citation preview

Journal uf Rusineis Finance & Accuuntiny, 20(3), April 1993, 0306-686X 41 7
CORPORATE OPERATING PERFORMANCE AROUND THE PROXY CONTEST
TARUN K. M U K H E R J E E A N D O S C A R V A R E L A *
INTRODUC'I 'ION
A proxy contest occurs when a dissident stockholder (or group thereof) attempts to persuade shareholders to sign a proxy transferring their authority to vote. The purpose of the contest is to gain either a majority (control contests) o r minority (representation contests) of seats on the board of directors, or to vote on various policy issues relevant to the firm. Dissident stockholder dissatisfaction with managerial decisions is the general motive for a contest; however, basic discontent with overall managerial performance is what specifically triggers a control contest.
Given that poor managerial performance is the primary reason for control contests, it is reasonable to expect an improvement in the performance of proxy contest firms in the post-contest period. Such an expectation is irrespective of contest outcome. New management in successful contests must seek to improve the performance record of prior management. Incumbent management in unsuccessful contests may, fearing the prospect of other contest(s), seek to improve its own performance record.
It may also be argued that the probability of a dissident group's success is higher the worse the contest firm's performance relative to its peers. Additionally, the scope for a post-contest turnaround is greater when a company has performed far worse in the pre-contest period, especially if such substandard performance was due primarily to the inefficiency of prior management.
Based on the above arguments, we test in this paper the following four hypotheses: (1) The performance of proxy-contest firms is significantly worse than that of comparable non-contest firms in the pre-contest period; (2) Proxy- contest firms show improved performance in the post-contest period such that no significant differences in performance exist during this period between contest and non-contest firms; (3) The performance of successful-proxy contest firms is worse relative to unsuccessful firms in the pre-contest period, and (4) Successful contest firms show better performance relative to unsuccessful firms in the post-contest period.
Since accounting performance, rather than market performance, appears to serve as a better motive' for the proxy contest, we have defined performance
* Both authors are Professors of Finance at the University of N e w Orleans, Louisiana. (Paper received November 1989, revised and accepted January 1991)
0 Basil Blackwell Ltd. 1993, 108 Cowley Road, Oxford OX4 IJF, UK and 238 Main Street, Cambridge, MA 02142, USA.
418 MUKHERJEE A N D VARELA
in terms of return on equity (ROE) for our purposcs. In addition to testing these four hypotheses, we have investigated by use of the Du Pont system of analysis which of the accounting components of R O E contribute to any performance variations in the pre- and post-contest periods.
The paper proceeds as follows: the next section reviews the literature; the third section discusses the sample, data, and methodology; the fourth section presents the results, and the final section the summary and conclusions.
I, 1‘1~ 1X A T U K E K l<V I E W
In various studies, Austin (1964, l965a and 196513) gcncrally found that contest firms had lower pre-contest R O E and profit margins relative to comparable non-contest firms. Further, control contests, while relatively difficult to win, often led to greater improvement in firm performance vis-a-vis representation contests. Austin concluded that proxy contests were generally effective in promoting better operating and managerial pcrformance. Wattel (1966) also found improvement in firm performance in thc post-contest period, and further, that when dissidents won, management changes most often included diversification, product line expansion, modernization and partial sell-off‘s.
Duvall and Austin (1965) studied both control and representation contests by utilizing discriminant analysis to distinguish between successful and unsuccessful outcomes in each category. They found, inter aliu, that firms with successful representation contest outcome had lower asset size and divided payouts, and were more inclined toward cumulative voting rules relative to unsuccessful outcomes. Moreover, successful control contests had significantly lower average R O E S and profit margins than unsuccessful ones.
Finally, De Angelo’s 1988 study examined the use of accounting performance measures in 86 contests for board scats between 1970-83. De Angelo found that, unlike stock returns, the pre-contest ROE is systematically below market; that incumbent management appears to exercise its accounting discretion to ‘window dress’ earnings in an apparent attempt to persuade voters during the election campaign; and that successful dissidents report an immediate decrease (‘bath’) in earnings, blaming such decline on poor decisions by prior management while positioning themselves for subsequent improvements (‘turnaround’) the following year. According to De Angelo, ‘these findings indicate that corporate earnings performance plays a role in the process through which alternative managers compete for stockholder support’ (p. 3) .
Comparison o j this Study 10 De Angelo’s
Since De Angelo’s study is the only contemporary study concerned with, among other issues, the accounting performance of proxy contest f i rms, i t seems appropriate to highlight thc similarities and differences between this study and
0 Basil Blackwell Ltd. 1993
OPERATING PERFORMANCE AND PROXY CONTESTS 419
De Angelo’s. Both studies hypothesize that firms involved in proxy contests exhibit poor pre-contest accounting performance as reflected in their ROEs. However, these studies differ with respect to the following key points.
First, De Angelo compared the contest firm’s R O E with the median R O E of all listed companies with data on COMPUSTAT for the relevant year. This study, however, compares contest firm’s R O E with that of a comparison firm having similar asset size and same industry classification as the contest company. Given that many contest firms are of small size and that R O E is influenced by industry, this study provides an alternate method of evaluating the relative performance of contest firms. Second, this study compares performances of contest and comparison firms for u p to three years after the contest. Third, this study investigates for significant performance differences between successful and unsuccessful contests in both the pre-and post-contest periods.
VARIABLES, SAMPLE, AND METHODOLOGY
Variables
Performance is measured, as in some previous studies, by R O E - Income before Extraordinary ItemdTotal Equity. The endogenous factors contributing to differences in ROEs between contest and comparison firms is examined by use of the Du Pont system, in which R O E is decomposed into Net Profit Margin (NPM), Total Asset Turnover (TATO), and Debt Ration (D/A).
Sample
Initially, we compiled all references to proxy contests between 1968-83 in the Wall Street Journal Index. Upon a review of relevant articles, we omitted firms in which the actual contest never materialized, the reason for the contest was ambiguous, or the contest was initiated for reasons other than control. We excluded representation contests so that the analysis would not be affected by the availability of cumulative voting, an exogenous variable for our purpose.‘
A list of 71 contests emerged from this process, including 8 that resulted in a compromise or truce. However, when multiple contests involving the same company took place within the 7 year study window (including the contest year (T) and both three years before ( T - 3) and after ( T + 3) the contest), only the first contest was considered. Contests involving banking firms were also excluded since the Du Pont model is more effectively applicable to industrial firms. As a result, the list of contests was reduced to 55. Finally, data availability over the study window in the 1987 COMPUSTAT Primary, Secondary, and Tertiary, and Research files further reduced the list to 37 contests for control over the 1968-83 period. These 37 contests, of which 10 were su~cess fu l ,~ comprise our sample.
@ Basil Blackwell Lid. 1993
420 MUKHERJEE AND VARELA
Testing Procedure
For each firm in the sample, we selected a comparison firm with the same four- digit SIC code and similar asset size in the contest year in order to control for the effects of industry and size.4 The ROE and its respective Du Pont components are compared between the test sample and comparison (or control) group. Statistical tests include the t-test, the Wilcoxon Matched-Pair Signed- Rank test and the Mann-Whitney test (MW). The results rely heavily on the latter two tests, since the Kolmogorov-Smirnov test clearly rejected normality for ROE and NPM for both test and comparison samples. The Wilcoxon test is primarily used here to facilitate comparison to De Angelo’s study, which also relied on this test. Finally, although the Wilcoxon test would have been sufficient given that the pairs were pre-matched, M W was also used to provide added safety in the event the matched pairs were less than perfect.
RESULTS
Pre-Contest Accounting Performance: Agpregate Sample
Results of both the Wilcoxon and M W tests5 indicate that the return on equity for the contest firms is significantly lower (at the five percent level) than that of the comparison group in years T - 2 and T - 1.
In the Du Pont framework, a poor R O E can result from lower NPM, lower T A T O , or lower D/A, or some combination thereof. Low NPM stands out as the major contributor to low R O E for proxy contest firms in pre-contest years. O u r tests indicate that the N P M of the contest firms is significantly lower (at the five percent level) than the control group in T- 1 and T. O n the other hand, T A T O of the contest firms was consistently higher than the control group in all years from T - 3 to T , and, according to the Wilcoxon test, significantly higher (at the ten percent level) in T-3 and T. No statistically significant difference was found in the D/A ratio of the two groups,
We conclude that it is not inefficient asset management or conservative leverage policy but rather the poor profit margin that was responsible for the substandard operating performance of the proxy contest firms in the pre-contest years. Further comparison between the operating profit margin of the contest firms and the control group reveals that this ratio was significantly lower for the former group in all three years prior to the contest.
PoJt-Contest Accounting Performance: A,gregate Sample
Our test results indicate, contrary to our second hypothesis, that the contest firms continue to underperform the control group in the post-contest period, especially in year T + 3 when the ROE of the former group is significantly lower
0 Basil Blackwell Ltd. 1993

OPERATING PERFORMANCE AND PROXY CONTESTS 42 1
(at the five percent level) than the latter. Once again the responsibility for subperformance lies with NPM as both Wilcoxon and MW tests indicate that contest firms’ NPM was significantly lower (some at ten percent, others at five percent) than the NPM of the control group in each of the three years after the contest.
Neither D/A nor T A T O appear to explain the differences in ROE between the two groups. In fact, the Wilcoxon test shows rather consistently that TATO of the contest firms was significantly higher than that of the control group in all three years following the contest.
Operating Performance: Successful us. Unsuccessful Contests
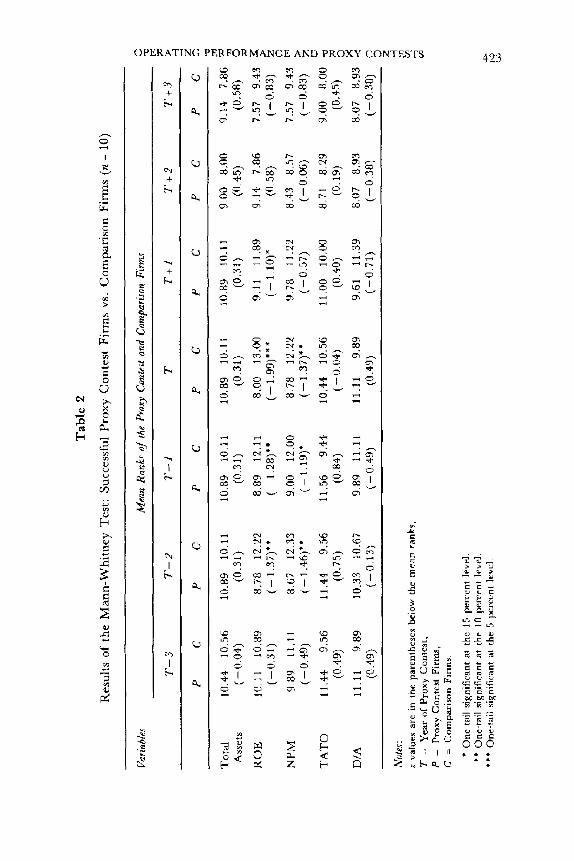
This section compares, in order to test hypotheses 3 and 4, the performance of successful and unsuccessful contest firms in the pre- and post- contest periods. Both of these hypotheses define bettedworse relative to a sample of comparable non-contest firms. MW test results are reported in Tables 1 and 2 and the following observations are made based on these results.
First, while R O E of unsuccessful firms was significantly lower than their non-contest counterparts in only one of the four years ending in the contest year, the ROE for successful firms was significantly lower in three of the four years. This finding seems to support the notion that successful contest firms had worse pre-contest performance than their unsuccessful counterparts, perhaps making the dissident group’s task of seeking stockholder support easier and ultimately Ieading to its victory.
Second, the performance (ROE) of unsuccessful contest firms was signifi- cantly worse (at the five percent level) than the relevant comparison group in the post-contest period, while the performance of the successful firms was not significantly different from their non-contest counterparts in the same years. This finding supports the notion that new management in successful contests is more apt to improve performance than incumbent management in unsuccessful contests.
‘l’hird, the new management appears to have addressed the real problem that contributed to the poor pre-contest performance. Specifically, NPM in successful contests is consistently and significantly lower than the relevant comparison group in the year of the contest and in each of the two years preceding it. However, no such differences are observed in the post-contest period. The opposite seems to be true for unsuccessful contests in that these firms’ NPM, while significantly lower than that of the comparison firms in only one (T - 1) pre-contest year, is nevertheless significantly lower in all three post-contest years.
Finally, unsuccessful contest firms had significantly (albeit at low levels of significance) higher TATO than that of the comparison firms in two of the three years after the contest, although no significant differences existed in the pre-contest period. This improvement may have resulted from asset writedowns
0 Basil Blackwell Ltd. 1993

.p
ro
ro
Tab
le 1
Res
ults
of
the
Man
n-W
hitn
ey T
est:
Uns
ucce
ssfu
l Pr
oxy
Con
test
Fir
ms
vs.
Com
pari
son
Firm
s (n
= 2
7)
Varia
bles
~ ~
~~~~
Mta
n R
anks
of
the
Prox
y Co
ntes
t an
d Co
mpa
rison
Fir
ms
T-3
T
- 2
T-1
T
T
+l
T+
2
T+
3
P C
P
C P
C
P c
P C
P
C
P c
To
tal
27.3
7 25
.63
Ass
ets
(0.4
1)
RO
E
24.3
7 28
.63
(-1.
02)
(-0.
57)
NPM
25
.31
27.6
9
TA
T0
27
.27
25.7
3
DIA
26
.23
26.7
7
(0.3
7)
(-0.
13)
28.2
2 26
.78
(0.3
4)
25.5
4 27
.46
(-0.
46)
27.7
0 27
.30
(0.0
9)
(0.1
9)
(-0.
09)
27.9
1 27
.09
27.3
0 27
.70
28.7
9 28
.21
(0.1
3)
25.1
8 31
.82
(-- 1
.52)
';
25.2
1 31
.79
(~
-
1.51
)**
29.9
6 27
.04
(0.6
7)
27.8
2 29
.18
(-0.
31)
26.0
8 26
.92
(-0.
20)
(-0.
02)
25-1
5 27
-85
26.4
6 26
.54
(-0.
64)
28.2
7 24
.73
(0.8
4)
26.0
0 27
.00
(-0.
24)
24.5
2 26
.48
(-0.
48)
23.7
9 25
.21
(-0.
35)
(-1.
32)*
' 21
.119
27
.17
27.1
7 21
.83
(1.3
2)'
* 24
.86
26.1
4 (-
0.31
)
22.1
3 24
.87
(-0.
69)
20.1
7 26
.83
(- 1
.68)
***
19.7
8 27
.22
(-l.
SS
)***
25.5
2 21
.48
(1.0
2)
24.4
3 22
.57
(0.4
7)
20.0
0 23
.00
g 2 (-
0.79
)
17.8
1 24
.35
(-1~
75)*
**
17.6
7 25
.33
m
m
(-2.
02)*
**
$ - 23
.57
19.4
3 (1
.09)
* & r
-
20.1
0 22
.90
F (-
0.74
)
@
Not
es:
g - ic p 7 X
=
Com
pari
son
Fir
ms.
- P
W
z va
lues
are
in
the
pare
nthe
ses
belo
w t
he m
ean
rank
s,
T =
Y
ear
of P
roxy
Con
test
, P
=
Prox
y C
onte
st F
irm
s,
L
2 -
* O
ne-t
ail s
igni
fica
nt a
t th
e 15
per
cent
lev
el.
** O
ne-t
ail
sign
ific
ant
at t
he 1
0 pe
rcen
t le
vel.
- **
* O
ne-t
ail s
igni
fica
nt a
t th
c 5
perc
ent
lcvc
l L
m
u3
w
Tab
le 2
Res
ults
of
the
Man
n-W
hitn
ey T
est:
Suc
cess
ful
Pro
xy C
onte
st F
irm
s vs
. C
ompa
riso
n Fi
rms (n
= 1
0)
Varia
bles
M
ean
Rank
s of
the
Prox
y Co
ntes
t and
Com
paris
on F
irms
% :: A P
C
P c
P C
P C
P
C
PC
P
c5
T
-3
T-2
T
- I
T
T+
l T
i2
T
i3
>
~~
~
Tot
al
10.4
4 10
.56
10.8
9 10
.11
10.8
9 10
.11
10.8
9 10
.11
10.8
9 10
.11
9.00
8.
00
9.14
7.
86
Ass
ets
(-0.
04)
(0.3
1)
(0.3
1)
(0.3
1)
(0.3
:)
(0.4
5)
(0.5
8)
RO
E
10.1
1 10
.89
8.78
12
.22
8.89
12
.11
8.00
13
.00
9.11
11
.89
9.14
7.
86
7.57
9.
43
5 (-
0.83
) z r:
(-0.
31)
( - 1
.3 7)
* *
( - 1
.28)
* (-
1.9
9) *
* ( - 1.
10)*
(0
58)
N
PM
9.
89
11.1
1 8.
67
12.3
3 9.
00
12.0
0 8.
78
12.2
2 9.
78
11.2
2 8.
43
8.57
7.
57
9.43
;
(-0.
49)
( - 1
.46)
* *
(-1.
19)*
(-
1.3
7)**
(-
0.57
) (--
0.U
6)
(-0.
83)
c T
AT
0 11
.44
9.56
11
.44
9.56
11
.56
9.44
10
.44
10.5
6 11
.00
10.0
0 8.
71
8.29
9.
00
8.00
q 8
D/A
11
.11
9.89
10
.33
10.6
7 9.
89
11.1
1 11
.11
9.89
9.
61
11.3
9 8.
07
8.93
8.
07
8.93
4
(a. 49
) (-0.13)
(- 0.49)
(0.4
9)
(-0.
71)
(- 0.38)
(-0.38)
C
3
(0.4
9)
(0.7
5)
(0.8
4)
(- 0
.04)
(0
.40)
(0
.19)
(0
.45)
Nr,
les:
z
valu
es a
re i
n th
e pa
rent
hese
s be
low
the
me
an
ran
ks,
T -
Yea
r of P
roxy
Con
test
, P
=
Pro
xy C
onte
st F
irm
s.
C =
C
om
pari
so
n F
irm
s.
* O
ne-t
ail
sign
ific
ant
at t
hc 1
5 pe
rccn
t le
vel.
** O
ne-t
ail
sign
ific
ant
at t
he 1
0 pe
rcen
t le
vel.
*’*
One
-rai
l sig
nifi
cant
at
the
5 pc
rccn
t le
vel
P
1.3
‘U
424 MUKHERJEE AND VARELA
(and/or divestitures) rather than from improved operating efficiency, since their total assets were higher than comparison firms in the pre-contest period and lower in the post-contest period (both results not statistically significant). Successful contest firms, on the other hand, did not show significant differences in TATO uis-a-uis the comparison group in either the pre- or post-contest periods.
CONCLUDING REMARKS
For the aggregate sample, our results show, similar to previous studies, that contest firms are indeed poor performers (lower ROE) in the pre-contest period. Further, ROES for the contest firms generally remained poor in the post-contest period. This result contrasts with Austin’s (1965a and 196513) findings in this regard. Only the NPM (rather than TATO or D/A) was found to be a significant contributor to the poor performance of the contest group in both pre- and post-contest periods.
The results are more revealing when the sample firms are segregated into successful and unsuccessful contests. The relative performance of successful contest firms was worse than unsuccessful ones in the pre-contest period, perhaps contributing to the dissident’s eventual success. Successful firms also show relative improvement in performance in the post-contest years. Further, the new management seems to accomplish this improvement by increasing its profit margin via more effective operating expenditure control. In contrast, unsuccessful contest firms’ performance deteriorates in the post-contest period primarily because of inefficient management of NPM. We conclude that the hypothesis of improved post-contest performance is true in regard only to successful proxy contest firms. This conclusion is in partial agreement with Austin (1965b) who suggested that, in general, proxy contests are effective in promoting better operating and managerial performance.
NOTES
1 In general either a market measure showing a declining stock price (see hlanne, 1962 and 1965) or an accounting measure showing declining firm profitability may provide evidence of poor managerial performance. Dodd and Warner (1983), Mukherjee (1985) and De Angelo (1988), have however, found that contest firms’ stock prices generally rise in the immediate pre-contest period. These results discount the use of a market measure as a motive for the proxy contest. However, the accounting measure, focusing on profitabilty, has provided a more viable motive. In fact, De Angelo (1988) states that ‘Dissident stockholders . . . typically cite poor earnings as necessitating the proposed management change, while they infrequently cite a stock price decline for the purpose’ (p.6). Cumulative voting may facilitate successful outcomes for representation contests, even in cases where management performance is not at issue. This is so because cumulative voting permits minority participation in that the total number of votes that each shareholder may cast is equal to the product of the number of shares and number of directors to be elected. Cumulative voting,
2
0 Basil Blackwell Ltd. 1993
OPERATING PERFORMANCE AND PROXY CONTESTS 425
however, is not a sufficient condition for success in control contests where majority participation is desired. Hence, the comparison of performance between successful and unsuccessful contests in these cases is invariant to this issue. A successful contest for control is defined as one in which dissidents win a majority of the total number of seats on the board or where a compromise is reached between the dissident group and the management regarding the slate of nominees for the board. Our statistical tests do not show any significant difference in the asset size between the contest firms and the comparison group. For excellent discussions on the tests employed in this paper, please see Siegel (1956). Detailed results for the aggregate sample in both the pre- and post-contest periods are available from the authors on request.
3
4
5 6
REFERENCES
Austin, D.V. (1964) The Causes of Proxy Contests: An Empirical Study, 1956-1960, unpublished Ph.D. dissertation in Economics (Indiana University, 1964).
~ (1965a) Proxy Contests and Corporate Rejorm (Bureau of Business Research, University of Michigan: Ann Arbor, Michigan, 1965).
__ (1965b), ‘The Proxy Contest and Corporate Performance, ’ Financial Executive (July 1965), pp. 20-30.
De Angelo, L.E. (1988), ‘Managerial Competition, Information Costs, and Corporate Governance - The Use of Accounting Performance Measures in Proxy Contests,’ Journal of Accounting and Economics (1988), pp. 3-36.
Dodd, P. and J.B. Warner (1983), ‘On Corporate Governance: A Study of Proxy Contests,’Journal of Financial Economics (April 1983), pp. 401-438.
Duvall, R .M. and D.V. Austin (1965), ‘Predicting the Results ofproxy Contests,’JounvllofFznance (September 1965), pp. 464-471.
Manne, H. (1962), ‘The Higher Criticism of the Modern Corporation,’ Columbia Law R e v i m (1962), pp. 399-432.
(1965), ‘Mergers and Market for Corporate Control,’ Journal of Political Economy (April 1965), pp. 110-120.
Mukherjee, T .K. (1985). ‘Stock Price Behavior Surrounding Proxy Contest for Control: A Non- Parametric Approach,’ Review of Business and Economic Research (Fall 1985).
Siegel, S. (1956), Nonparametric Statistics for the Behavioral Sciences (McGraw-Hill Book Company: New York, 1956).
Wattel, H.L. (ed.) (1966). Proxy Feh t s for Managerial Resolutions (Hofstra University Yearbook of Business: Hemstead, New York, 1966).
Whetten, L.C. (1959), Recent Proxy Contests: A Study in Management Stockholder Relations (Bureau of Business and Economics Research, Georgia State College of Business Admn.: Atlanta, 1959).
0 Basil Blackwell Ltd. 1993