Embed Size (px)
Citation preview
PAKISTAN LIMITED

2
1
Corporate Information
Notice of Meeting
Key Operating Highlights
Value Added and its Distribution
Operational Statistics
Chairman’s Review
Directors’ Report to the Members
Statement of Compliance with theCode of Corporate Governance
Review Report to the Members on Statement of Compliance with Best Practices of the Code of Corporate Governance
Auditors’ Report to the Members
Balance Sheet
Statement of Comprehensive Income
Cash Flow Statement
Statement of Changes in Equity
Notes to the Financial Statements
Pattern of Shareholding
FORM OF PROXY
10
15
16
41
44
45
47
46
27 30
33 34
37
18 23
11 14
79 80
48 77
17

2
3

4
5
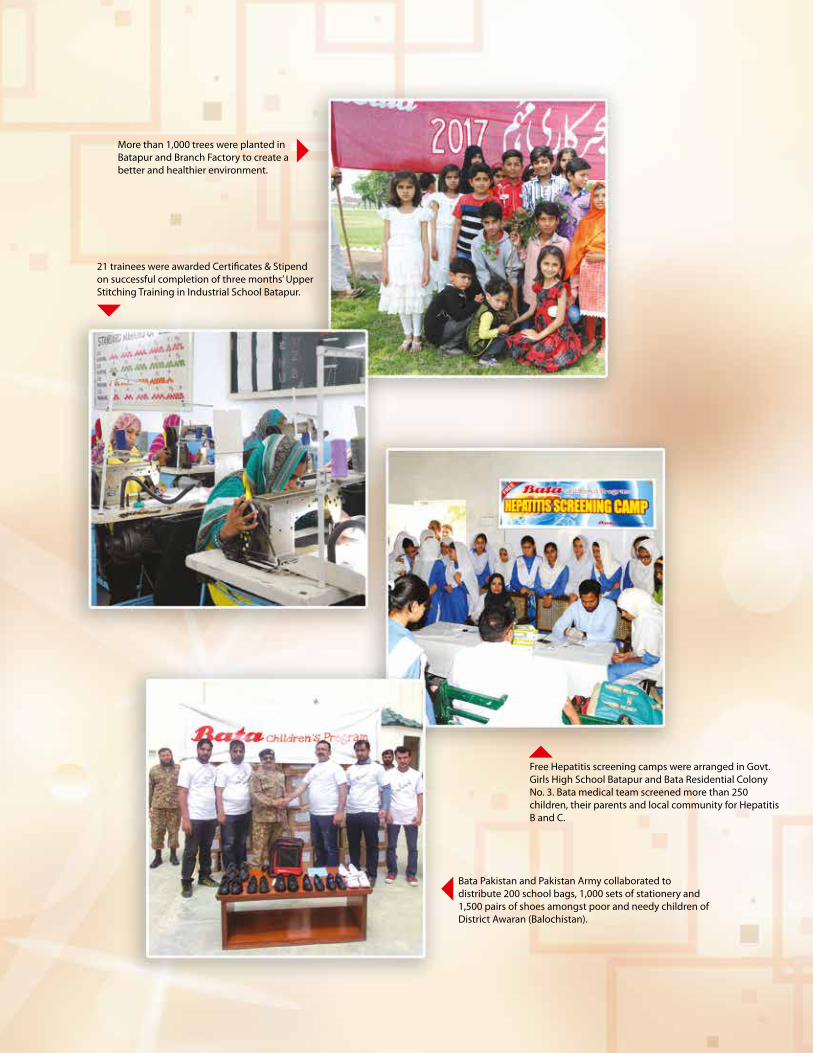
Bata Pakistan and Pakistan Army collaborated to distribute 200 school bags, 1,000 sets of stationery and 1,500 pairs of shoes amongst poor and needy children ofDistrict Awaran (Balochistan).
Free Hepatitis screening camps were arranged in Govt. Girls High School Batapur and Bata Residential Colony No. 3. Bata medical team screened more than 250 children, their parents and local community for Hepatitis B and C.
21 trainees were awarded Certificates & Stipend on successful completion of three months’ Upper Stitching Training in Industrial School Batapur.
More than 1,000 trees were planted in Batapur and Branch Factory to create a better and healthier environment.
6

7

8
VISIONTo make great shoes accessible to everyone

9
We help people look and feel goodby continuously focusing on product quality, innovation and value.
We become the customer’s destination of choiceby offering personal shopping experience to create long standing customer relationships.
We attract and retain the best peopleby showing great leadership, a passion for high standards our respect for diversity and commitment to create exceptional opportunities for professional growth.
We remain the most respected footwear companyby being socially responsible and ethical in everything we do and a credit to every community in which we operate.
MISSION
Corporate Information
Board of DirectorsMr. Roberto Longo ChairmanMr. Muhammad Imran Malik Chief ExecutiveMr. Cesar Alex Panduro Arevalo DirectorMr. Toh Guan Kiat Director Mr. Syed Asad Ali Zaidi DirectorMr. Muhammad Maqbool DirectorMr. Ijaz Ahmad Chaudhry DirectorMr. Shahid Anwar (Nominee of NIT) DirectorMr. Aamir Amin (Nominee of NIT) Director
Audit CommitteeMr. Muhammad Maqbool ChairmanMr. Roberto Longo MemberMr. Ijaz Ahmad Chaudhry Member
Human Resource and Remuneration CommitteeMr. Ijaz Ahmad Chaudhry ChairmanMr. Muhammad Imran Malik MemberMr. Muhammad Maqbool Member
Chief Financial Officer (CFO)Mr. Cesar Panduro
Company SecretaryMr. Amjad Farooq
AuditorsEY Ford Rhodes Chartered Accountants 4th Floor Pace Mall Building, 96-B-1, Gulberg II, M.M. Alam Road, Lahore.
Legal AdvisorSurridge & Beecheno60, Shahrah-e-Quaid-e-Azam, Ghulam Rasool Building,Lahore.
Stock Exchange ListingBata Pakistan Limited is listed on PakistanStock Exchange.
The Company's shares are quoted in leadingNewspapers under "Leather and Tanneries" sector.
BankersHabib Bank LimitedHabib Metropolitan Bank LimitedMCB Bank LimitedBank Al Habib LimitedNational Bank of Pakistan LimitedUnited Bank Limited
Registered OfficeBatapur, G. T. Road,P.O. Batapur, Lahore.
Share RegistrarCorplink (Pvt.) Ltd.Wings Arcade, 1-K Commercial,Model Town, Lahore.
Factories
Batapur,G. T. Road,P.O. Batapur, Lahore.
Maraka,
26 - Km, Multan Road, Lahore.
Liaison Office138 C-II Commercial Area,P.E.C.H.S., Tariq Road, Karachi.
10
Corporate Information
Board of DirectorsMr. Roberto Longo ChairmanMr. Muhammad Imran Malik Chief ExecutiveMr. Cesar Alex Panduro Arevalo DirectorMr. Toh Guan Kiat Director Mr. Syed Asad Ali Zaidi DirectorMr. Muhammad Maqbool DirectorMr. Ijaz Ahmad Chaudhry DirectorMr. Shahid Anwar (Nominee of NIT) DirectorMr. Aamir Amin (Nominee of NIT) Director
Audit CommitteeMr. Muhammad Maqbool ChairmanMr. Roberto Longo MemberMr. Ijaz Ahmad Chaudhry Member
Human Resource and Remuneration CommitteeMr. Ijaz Ahmad Chaudhry ChairmanMr. Muhammad Imran Malik MemberMr. Muhammad Maqbool Member
Chief Financial Officer (CFO)Mr. Cesar Panduro
Company SecretaryMr. Amjad Farooq
AuditorsEY Ford Rhodes Chartered Accountants 4th Floor Pace Mall Building, 96-B-1, Gulberg II, M.M. Alam Road, Lahore.
Legal AdvisorSurridge & Beecheno60, Shahrah-e-Quaid-e-Azam, Ghulam Rasool Building,Lahore.
Stock Exchange ListingBata Pakistan Limited is listed on PakistanStock Exchange.
The Company's shares are quoted in leadingNewspapers under "Leather and Tanneries" sector.
BankersHabib Bank LimitedHabib Metropolitan Bank LimitedMCB Bank LimitedBank Al Habib LimitedNational Bank of Pakistan LimitedUnited Bank Limited
Registered OfficeBatapur, G. T. Road,P.O. Batapur, Lahore.
Share RegistrarCorplink (Pvt.) Ltd.Wings Arcade, 1-K Commercial,Model Town, Lahore.
Factories
Batapur,G. T. Road,P.O. Batapur, Lahore.
Maraka,
26 - Km, Multan Road, Lahore.
Liaison Office138 C-II Commercial Area,P.E.C.H.S., Tariq Road, Karachi.
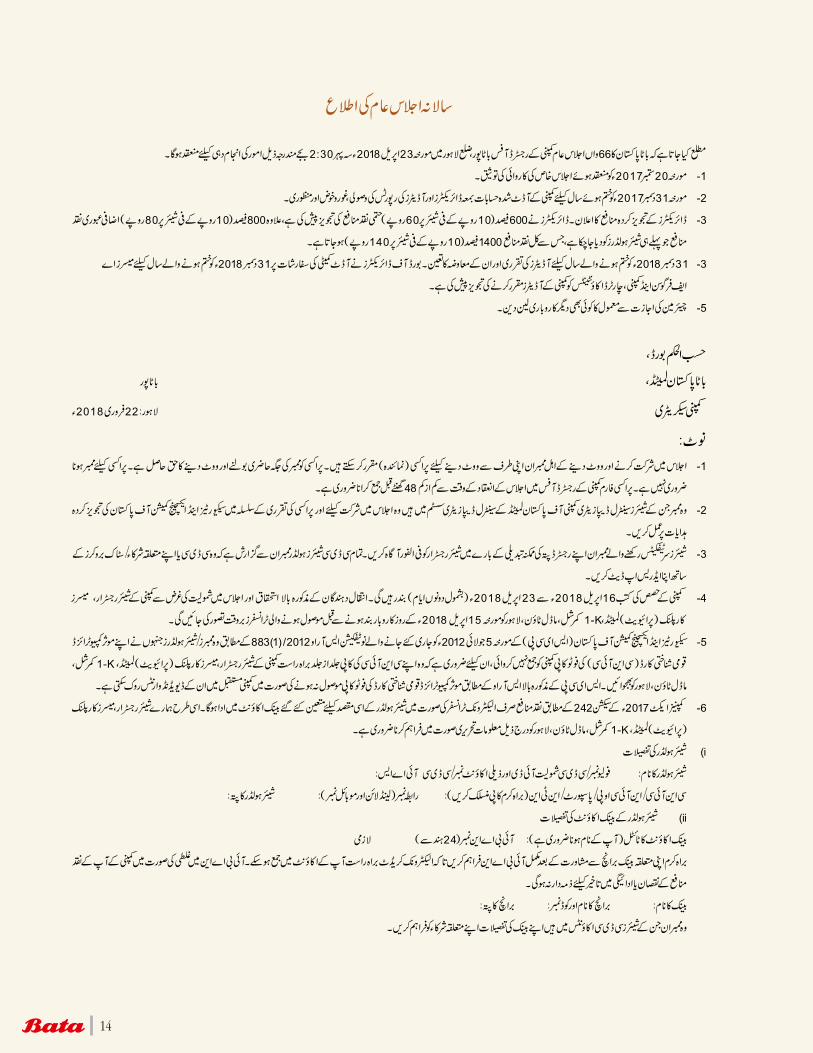
NOTICE IS HEREBY GIVEN that the 66th Annual General Meeting of Bata Pakistan Limited will be held at the Registered Office of the Company at Batapur, District Lahore on 23rd April, 2018 at 2.30pm to transact the following business:
1. To confirm the minutes of the Extra Ordinary General Meeting held on 20th September, 2017.
2. To receive, consider, and adopt the Directors’ Report, Audited Accounts of the Company and Auditors’ Reports thereon, for the year ended 31 December, 2017.
3. To approve dividend as recommended by the Directors. The Directors have recommended a Final Cash Dividend of 600% (Rs.60 per share of Rs.10) in addition to the Interim Cash Dividend of 800% (Rs.80 per share of Rs.10) already paid to the shareholders making total cash dividend of 1,400% (Rs.140 per share of Rs.10).
4. To appoint Auditors and fix their remuneration for the year ending 31 December, 2018. The Board of Directors, on the recommendations of the Audit Committee, has proposed the appointment of M/s A.F. Ferguson & Co. Chartered Accountants as Auditors of the Company for the year ending 31 December, 2018.
5. To transact any ordinary business of the Company with the permission of the Chairman.
By order of the BoardBata Pakistan Limited
Batapur Company SecretaryLahore: 22nd February, 2018
NOTES:1. A member entitled to attend, speak and vote at the meeting may appoint any person as his proxy to attend the meeting and vote instead of him. The
proxy shall have the right to attend, speak and vote in place of the member appointing him at the meeting. A proxy need not be a member of the Company. Proxy form must be deposited at the Company’s Registered Office not less than 48 hours before the time for holding the meeting.
2. The members whose shares are maintained on Central Depository System with the Central Depository Company of Pakistan Limited should follow the guidelines for attending the General Meetings and appointment of proxies as laid down by the Securities and Exchange Commission of Pakistan.
3. Members who hold shares certificates should notify any changes in their registered address to the Share Registrar. Members who hold shares in CDC / participant accounts should update their address to the CDC or their respective participants / stockbrokers.
4. The Share Transfer Books of the Company will remain closed from 16th April, 2018 to 23rd April, 2018 (both days inclusive). Transfers received at the office of the Share Registrar of the Company, M/s. Corplink (Pvt) Ltd. 1-K Commercial, Model Town, Lahore before the close of business on 15th April, 2018 will be treated in time for the purpose of above entitlement to the transferees and of attending meeting by the transferees.
5. With reference to the notification of Securities and Exchange Commission of Pakistan (SECP), SRO 883(1)/2012 dated July 5, 2012, the Members/Shareholders who have not yet submitted photo copy of their valid CNIC to the Company are required to send the same at the earliest directly to the Company’s Share Registrar M/s. Corplink (Pvt) Ltd. 1-K Commercial, Model Town, Lahore. In case of non-receipt of the copy of valid CNIC and non-compliance of the above mentioned SRO of SECP, the Company may be constrained to withhold transfer of dividend in the future.
6. Pursuant to Section 242 of the Companies Act, 2017 cash dividend shall be paid only by electronic transfer into the bank account of the shareholder designated for the purpose. Accordingly the following information must be provided to our Share Registrar M/s. Corplink (Pvt) Ltd. 1-K Commercial, Model Town, Lahore, in writing as follows:
i) Shareholder details
Name of the Shareholder:
Folio No. / CDC participant ID & Sub Account No./CDC IAS:
CNIC/NICOP/Passport/NTN No. (Please attach copy):
Contact Number (landline & Cell Nos.):
Shareholder Address:
ii) Shareholder’s Bank Account details
Title of Bank Account (must be in your name):
Notice of Annual General Meeting
11
IBAN Number Mandatory”
Please provide complete IBAN after consulting with your respective bank branch to enable electronic credit directly into your bank account. In case of any error or omission in given IBAN, the company will not be held responsible in any manner for loss or delay in your cash dividend payment.
Bank’s Name:
Branch Name & Code Number:
Branch Address:
Members who hold shares in CDC accounts should provide their bank mandates to their respective participants.
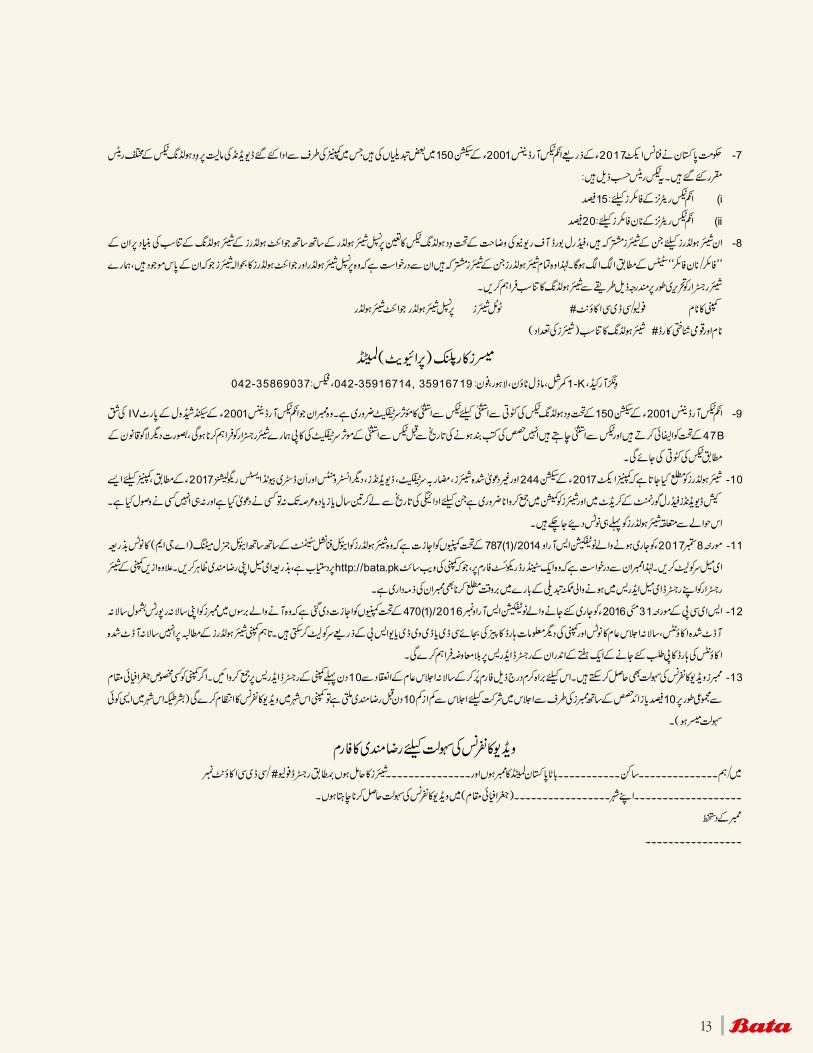
7. The Government of Pakistan through Finance Act, 2017 has made certain amendments in Section 150 of the Income Tax Ordinance, 2001 whereby different rates are prescribed for deduction of withholding tax on the amount of dividend paid by the Companies. Tax rates are as under:
i) For filers of income tax returns : 15% ii) For non-filers of income tax returns : 20%
8. For shareholders holding their shares jointly as per the clarification issued by the Federal Board of Revenue withholding tax will be determined separately on ‘Filer Non-filer’ status of Principal shareholder as well as joint-holder(s) based on their shareholding proportions. Therefore, all shareholders who hold shares jointly are required to provide shareholding proportions of Principal shareholder and joint-holder(s) in respect of shares held by them to our Share Registrar in writing as follows:
Company NameFolio/CDC Account #
Total Shares
Principal Shareholder Joint Shareholder
Name and CNIC #
Shareholding Proportion
(No. of Shares)
Name and CNIC #
Shareholding Proportion
(No. of Shares)
Messrs Corplink (Pvt) Ltd.
Wings Arcade, 1-K Commercial, Model Town, Lahore Ph: 042-35916714, 35916719, Fax: 042-35869037
9. A valid Tax Exemption Certificate is necessary for exemption from the deduction of withholding tax under Section 150 of the Income Tax ordinance, 2001. Members who qualify under Clause 47B of Part IV of the Second Schedule to the Income Tax ordinance, 2001and wish to seek an exemption should provide a copy of their valid Tax Exemption Certificate to the Share Registrar prior to the date of book closure, otherwise tax will be deducted according to applicable law.
10. The Shareholders are hereby informed that in accordance with Section 244 of the Companies Act, 2017 and the Unclaimed Shares, Modaraba Certificate, Dividends, Others Instruments and Undistributed Assets Regulations, 2017, the companies are required to deposit cash dividends to the credit of the Federal Government and the shares to the Commission, which are unclaimed/un-collected for a period of three (3) years or more from the date it is due and payable. The notices to this fact have already been dispatched to the relevant shareholders.
11. Pursuant to Notification vide S.R.O.787(1)/2014 dated 8th September, 2014 has allowed companies to circulate Annual Financial Statements to shareholders along with notice of Annual General Meeting (AGM) through email. In this respect, members are hereby requested to convey their consent via e-mail on a standard request form which is available at the Company’s website http://bata.pk. Further it is responsibility of the members to timely update the Company’s Shares Registrar of any change in their registered e-mail addresses.
12. In pursuance of SECP notification S.R.O. No.470(1)/2016 dated 31st May, 2016 the companies have been allowed to circulate their annual reports including annual audited accounts, notice of annual general meetings and other information contained therein of the Company to the members for future years through CD or DVD or USB instead of transmitting the same in hard copies. However, the Company will supply the hard copy of the Annual Audited Accounts to the shareholders on demand at their registered addresses, free of cost, within one week of such demand.
13. Members can also avail video conference facility. In this regard, please fill the following form and submit to registered address of the Company 10 days before holding of the annual general meeting. If the Company receives consent from members holding in aggregate 10% or more shareholding residing at that geographical location, to participate in the meeting through conference at least 10 days prior to meeting. The Company will arrange the video conference facility in that city (subject to availability of such facility in that city).
Consent Form for Video Conference Facility
I/We, _________________ of _____ being a member of Bata Pakistan Limited, holder of _____________ Ordinary shares as per Registered Folio #/ CDC Account No.___________________ hereby opt for video conference facility at ________________________ (geographical location).
____________________
Signature of member
(24 digits)
12
13
14
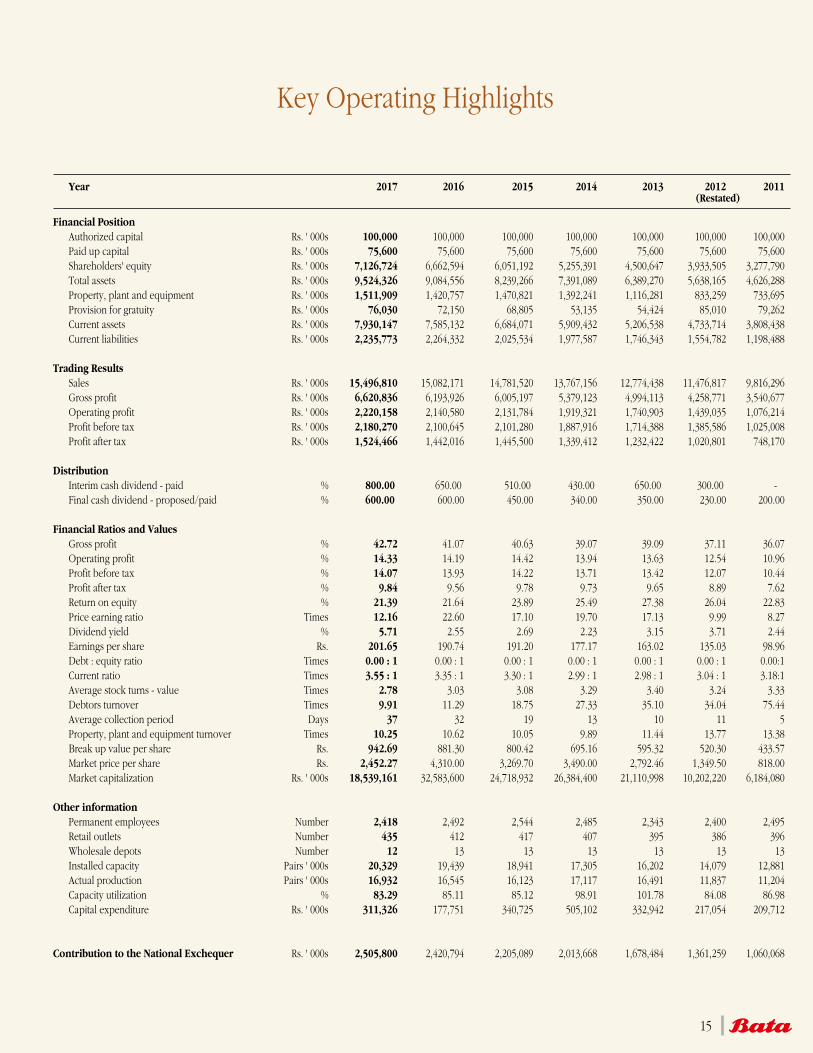
Key Operating Highlights
Year 2017 2016 2015 2014 2013 2012 2011 (Restated)
Financial Position Authorized capital Rs. ' 000s 100,000 100,000 100,000 100,000 100,000 100,000 100,000 Paid up capital Rs. ' 000s 75,600 75,600 75,600 75,600 75,600 75,600 75,600 Shareholders' equity Rs. ' 000s 7,126,724 6,662,594 6,051,192 5,255,391 4,500,647 3,933,505 3,277,790 Total assets Rs. ' 000s 9,524,326 9,084,556 8,239,266 7,391,089 6,389,270 5,638,165 4,626,288 Property, plant and equipment Rs. ' 000s 1,511,909 1,420,757 1,470,821 1,392,241 1,116,281 833,259 733,695 Provision for gratuity Rs. ' 000s 76,030 72,150 68,805 53,135 54,424 85,010 79,262 Current assets Rs. ' 000s 7,930,147 7,585,132 6,684,071 5,909,432 5,206,538 4,733,714 3,808,438 Current liabilities Rs. ' 000s 2,235,773 2,264,332 2,025,534 1,977,587 1,746,343 1,554,782 1,198,488 Trading Results Sales Rs. ' 000s 15,496,810 15,082,171 14,781,520 13,767,156 12,774,438 11,476,817 9,816,296 Gross profit Rs. ' 000s 6,620,836 6,193,926 6,005,197 5,379,123 4,994,113 4,258,771 3,540,677 Operating profit Rs. ' 000s 2,220,158 2,140,580 2,131,784 1,919,321 1,740,903 1,439,035 1,076,214 Profit before tax Rs. ' 000s 2,180,270 2,100,645 2,101,280 1,887,916 1,714,388 1,385,586 1,025,008 Profit after tax Rs. ' 000s 1,524,466 1,442,016 1,445,500 1,339,412 1,232,422 1,020,801 748,170 Distribution Interim cash dividend - paid % 800.00 650.00 510.00 430.00 650.00 300.00 - Final cash dividend - proposed/paid % 600.00 600.00 450.00 340.00 350.00 230.00 200.00 Financial Ratios and Values Gross profit % 42.72 41.07 40.63 39.07 39.09 37.11 36.07 Operating profit % 14.33 14.19 14.42 13.94 13.63 12.54 10.96 Profit before tax % 14.07 13.93 14.22 13.71 13.42 12.07 10.44 Profit after tax % 9.84 9.56 9.78 9.73 9.65 8.89 7.62 Return on equity % 21.39 21.64 23.89 25.49 27.38 26.04 22.83 Price earning ratio Times 12.16 22.60 17.10 19.70 17.13 9.99 8.27 Dividend yield % 5.71 2.55 2.69 2.23 3.15 3.71 2.44 Earnings per share Rs. 201.65 190.74 191.20 177.17 163.02 135.03 98.96 Debt : equity ratio Times 0.00 : 1 0.00 : 1 0.00 : 1 0.00 : 1 0.00 : 1 0.00 : 1 0.00:1 Current ratio Times 3.55 : 1 3.35 : 1 3.30 : 1 2.99 : 1 2.98 : 1 3.04 : 1 3.18:1 Average stock turns - value Times 2.78 3.03 3.08 3.29 3.40 3.24 3.33 Debtors turnover Times 9.91 11.29 18.75 27.33 35.10 34.04 75.44 Average collection period Days 37 32 19 13 10 11 5 Property, plant and equipment turnover Times 10.25 10.62 10.05 9.89 11.44 13.77 13.38 Break up value per share Rs. 942.69 881.30 800.42 695.16 595.32 520.30 433.57 Market price per share Rs. 2,452.27 4,310.00 3,269.70 3,490.00 2,792.46 1,349.50 818.00 Market capitalization Rs. ' 000s 18,539,161 32,583,600 24,718,932 26,384,400 21,110,998 10,202,220 6,184,080 Other information Permanent employees Number 2,418 2,492 2,544 2,485 2,343 2,400 2,495 Retail outlets Number 435 412 417 407 395 386 396 Wholesale depots Number 12 13 13 13 13 13 13 Installed capacity Pairs ' 000s 20,329 19,439 18,941 17,305 16,202 14,079 12,881 Actual production Pairs ' 000s 16,932 16,545 16,123 17,117 16,491 11,837 11,204 Capacity utilization % 83.29 85.11 85.12 98.91 101.78 84.08 86.98 Capital expenditure Rs. ' 000s 311,326 177,751 340,725 505,102 332,942 217,054 209,712
Contribution to the National Exchequer Rs. ' 000s 2,505,800 2,420,794 2,205,089 2,013,668 1,678,484 1,361,259 1,060,068
15
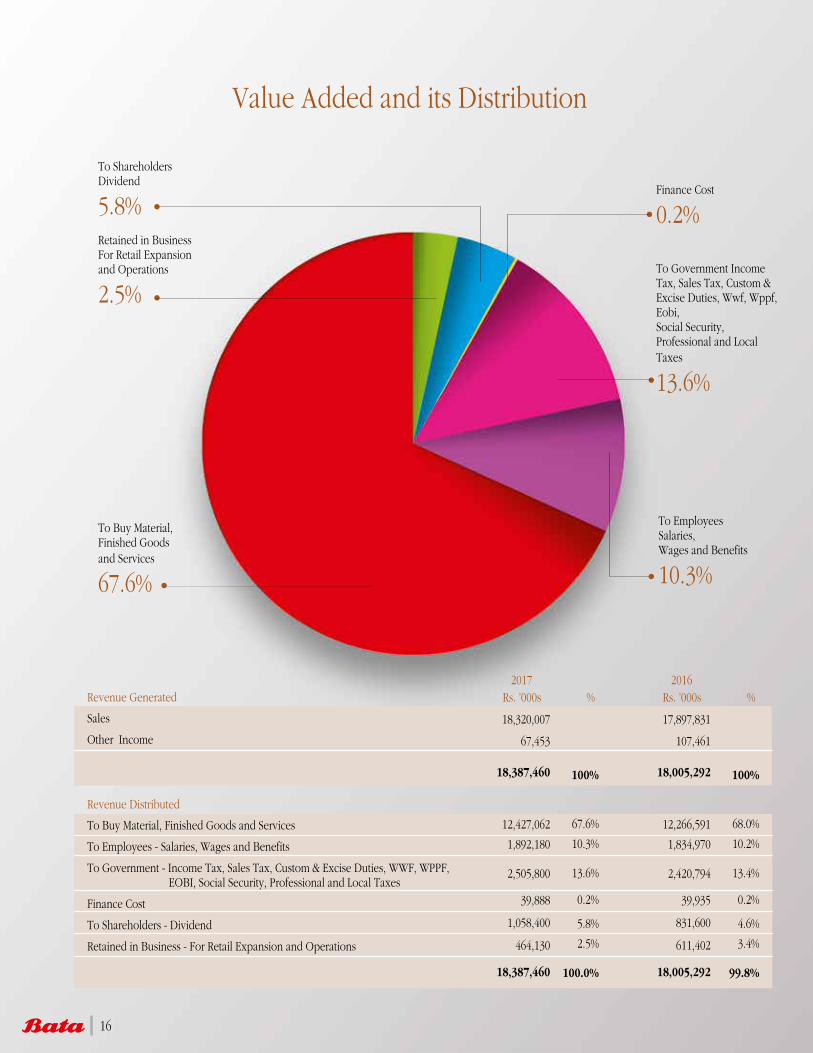
Value Added and its Distribution
To Buy Material, Finished Goodsand Services
67.6%
To Government Income Tax, Sales Tax, Custom & Excise Duties, Wwf, Wppf, Eobi, Social Security, Professional and Local Taxes
13.6%
Finance Cost
0.2%
To Employees Salaries,Wages and Benefits
10.3%
To ShareholdersDividend
5.8%Retained in BusinessFor Retail Expansion and Operations
2.5%
Revenue Distributed
To Buy Material, Finished Goods and Services
To Employees - Salaries, Wages and Benefits
To Government - Income Tax, Sales Tax, Custom & Excise Duties, WWF, WPPF, EOBI, Social Security, Professional and Local Taxes
Finance Cost
To Shareholders - Dividend
Retained in Business - For Retail Expansion and Operations
Revenue Generated
Sales
Other Income
%
67.6%
10.3%
13.6%
0.2%
5.8%
2.5%
100.0%
12,427,062
1,892,180
2,505,800
39,888
1,058,400
464,130
18,387,460
18,320,007
67,453
18,387,460
2017 Rs. ’000s
2016 Rs. ’000s
100%
68.0%
10.2%
13.4%
0.2%
4.6%
3.4%
99.8%
12,266,591
1,834,970
2,420,794
39,935
831,600
611,402
18,005,292
17,897,831
107,461
18,005,292 100%
%
16
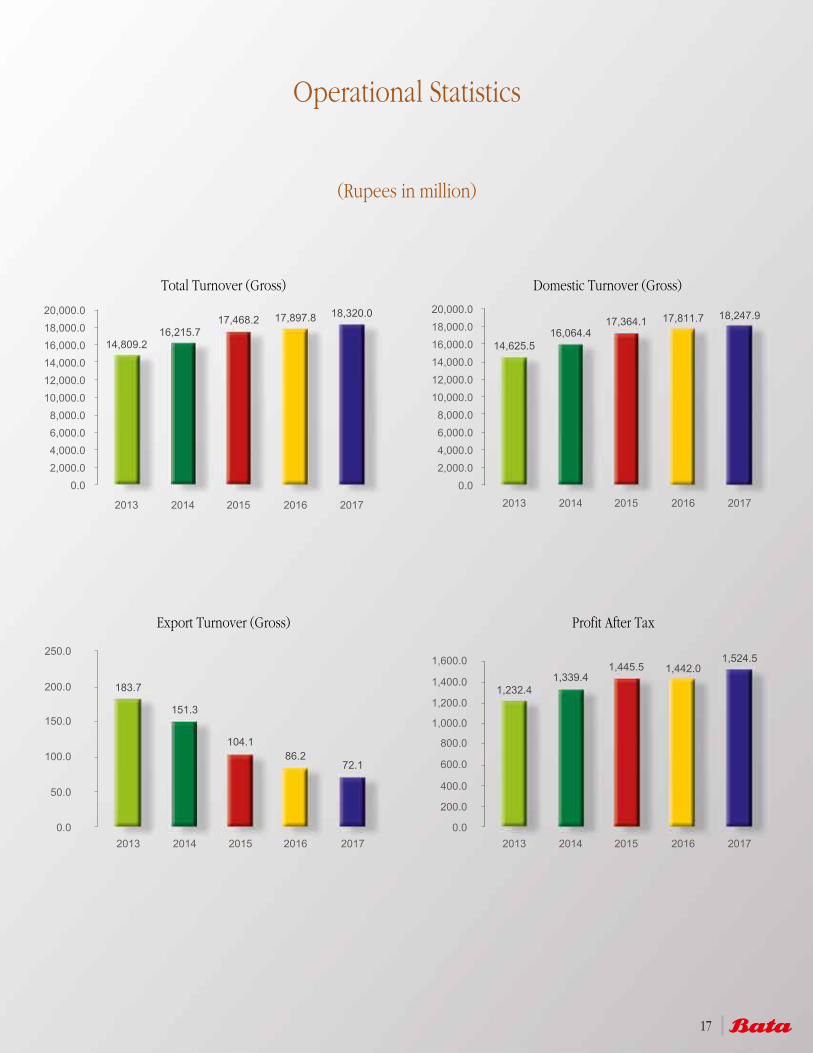
Operational Statistics
(Rupees in million)
Export Turnover (Gross) Profit After Tax
Domestic Turnover (Gross)Total Turnover (Gross)
14,809.216,215.7
17,468.2 17,897.8 18,320.0
0.0 2,000.0 4,000.0 6,000.0 8,000.0
10,000.0 12,000.0 14,000.0 16,000.0 18,000.0 20,000.0
2013 2014 2015 2016 2017
14,625.516,064.4
17,364.1 17,811.7 18,247.9
0.0 2,000.0 4,000.0 6,000.0 8,000.0
10,000.0 12,000.0 14,000.0 16,000.0 18,000.0 20,000.0
2013 2014 2015 2016 2017
1,232.41,339.4
1,445.5 1,442.01,524.5
0.0
200.0
400.0
600.0
800.0
1,000.0
1,200.0
1,400.0
1,600.0
2013 2014 2015 2016 2017
183.7
151.3
104.186.2
72.1
0.0
50.0
100.0
150.0
200.0
250.0
2013 2014 2015 2016 2017
17
Chairman’s Review
On behalf of the Board, I welcome you all to the 66th Annual General Meeting of the Company and feel pleased to present the annual review of the Company’s performance and the audited financial statements for the year ended 31 December, 2017.
The Company’s business achieved net turnover of Rs. 15.497 billion showing a growth of 3% over last year. The gross profit was recorded at Rs. 6.621 billion (43% of the trunover) against last year of Rs. 6.194 billion (41% of the trunover). Operating profit increased from Rs. 2.141 billion to Rs. 2.220 billion. Profit after taxation was Rs. 1.524 billion compared to Rs. 1.442 billion of last year. Company achieved earnings per share of Rs. 201.65 (Rs. 190.74 in 2016).
The Company has during 2017, an effective cash flow management system in place whereby cash inflows and outflows are projected on regular basis. The profit on short term investment and bank deposits along with income from discounting of supplier invoices was Rs. 56.542 million. The Board is satisfied that there are no short or long term financial constraints at the close of the year.
Based on the performance and progress made by the Company, your Directors have decided to recommend a final dividend of Rs. 60 per share which in addition to an interim dividend of Rs. 80 per share totalize Rs. 140 of total dividend for the year 2017 and also proposed that Rs. 465 million to be transferred to general reserve to utilize for further growth of the business in the coming years.
Although non-retail division remained under stress during the period due to competition and bleak market conditions, our Retail division continues to grow with the current setup along with the new stores and achieved a growth of 8%. In order to sustain this growth and to provide friendly and modern atmosphere in the stores, an amount of Rs. 186 million has been spent to open new stores and to renovate existing stores at key business locations. Much of the expansion was focused on our modern format of stores concept.
In our manufacturing operations we undertook some further restructuring in line with Company objectives. As a result, our production facilities at Batapur and Maraka remained fully loaded
18
throughout the period to meet the demand of higher value products particularly in PU and DIP footwear.
The Company continued to be a significant contributor to the National Exchequer and during 2017, paid Rs. 2.506 billion in Corporate Tax, Sales Tax, Custom Duty and other levies.
The growth of our business is highly dependent on the skills imparted to our personnel through sound training. The Company has invested a considerable time and money on human resource during the period to acquire latest development in the field of technology and business administration. This would be the ongoing process for future periods. Training of our employees has always been considered as an investment for the future with the objective to provide them with safe and healthy working environment.
During the year, the newly elected Collective Bargaining Agent (C.B.A.) served the Company with a Charter of Demand. A two-year agreement, expiring on January 25, 2019 was negotiated and signed with them, which would provide increased benefits and higher income to our unionized staff. I hope that Management and the C.B.A. will maintain a satisfactory relationship to achieve better results for the benefit of all concerned.
The Company continued its Corporate Social Responsibilities (CSR) activities during the period under review. To impart our role for better environment, we planted more than 1,000 trees in Batapur and Branch Factory Maraka. 21 trainees were awarded Certificates & Stipend on successful completion of Upper Stitching Training in Industrial School, Batapur. Free Hepatitis screening camps in Govt. Girls High School Batapur and Bata Residential Colony No. 3 were arranged, where our medical team screened more than 250 children, their parents and local community against Hepatitis B and C.
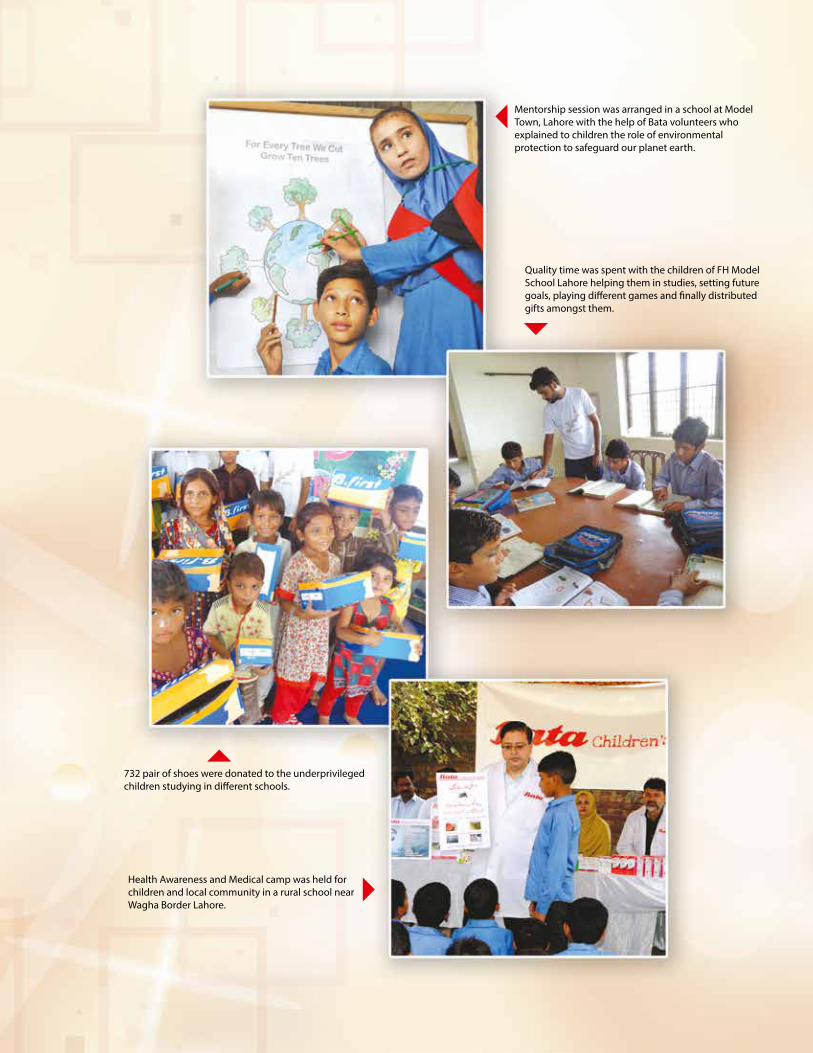
In coordination with Pakistan Army, Company distributed school bags, stationery sets and pairs of shoes amongst deserving children of District Awaran (Balochistan). Company also arranged mentorship sessions for school children to signify the role of environmental protection to safeguard our planet earth.
19
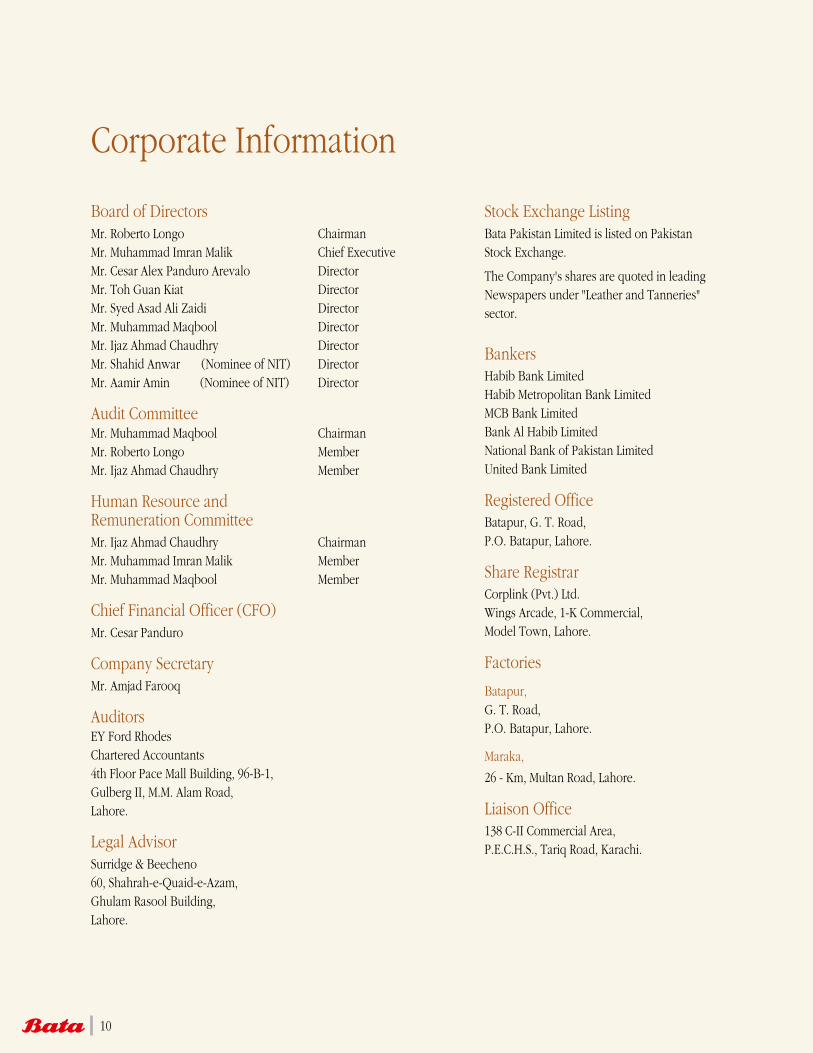
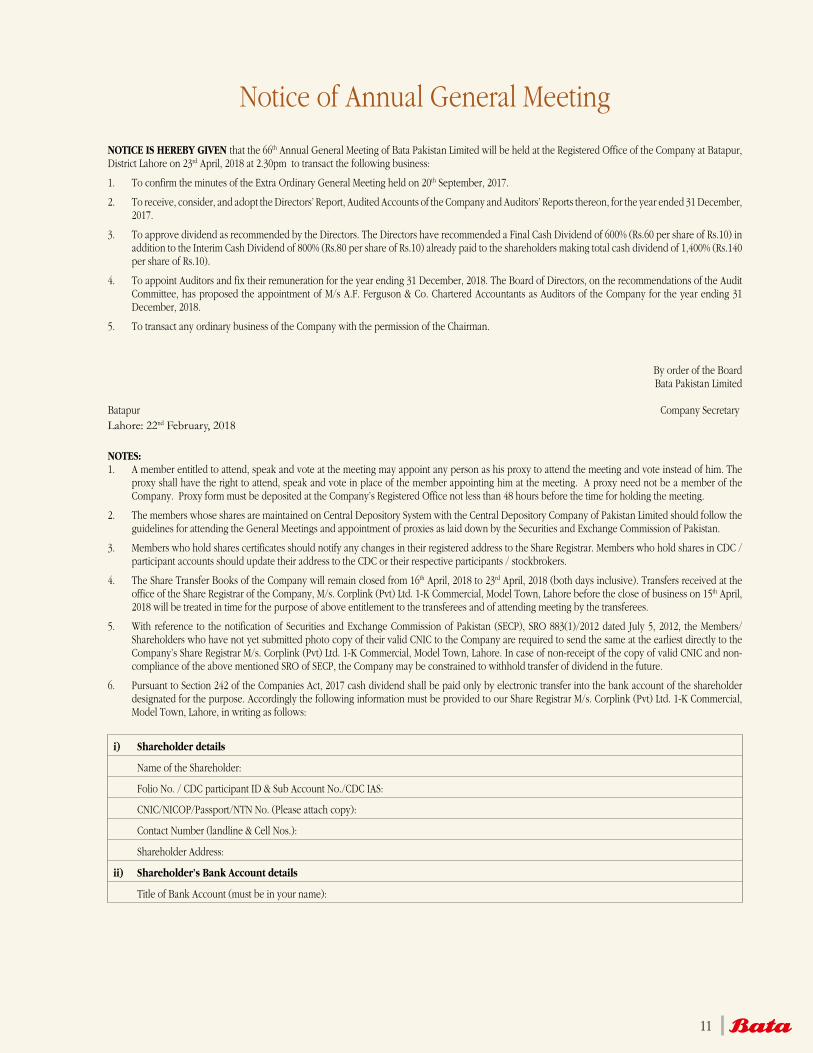
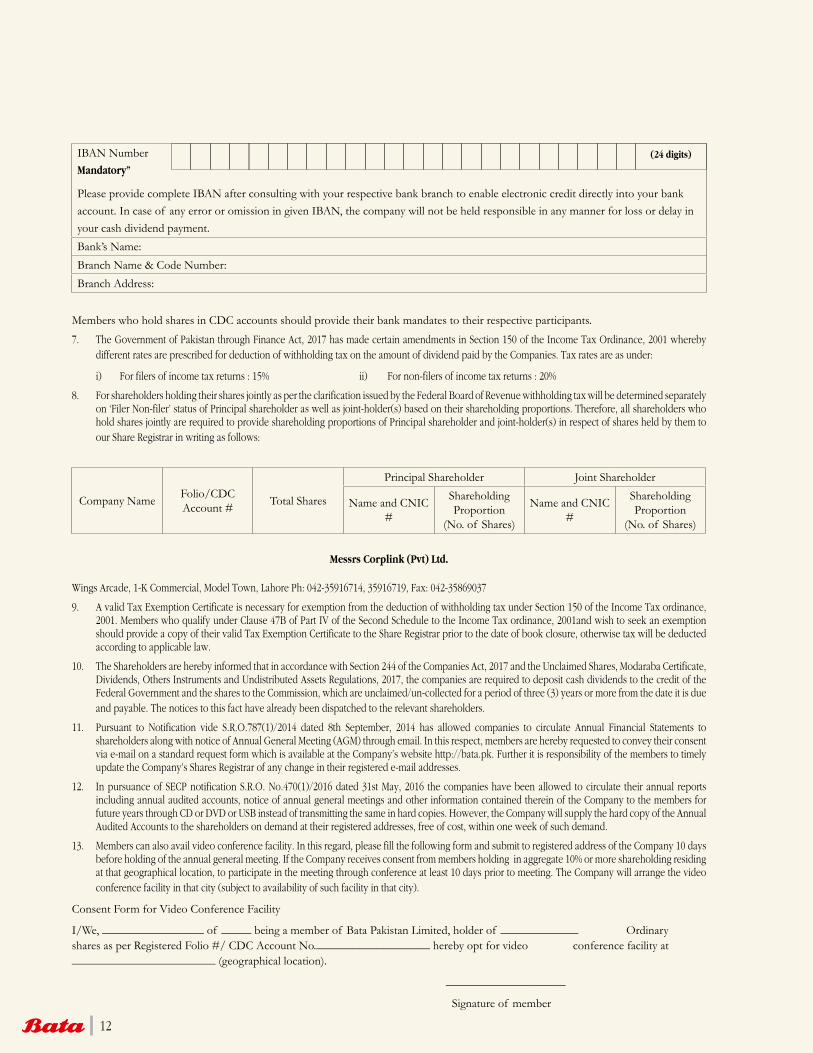
Company also donated shoes to the underprivileged children studying in different schools, our volunteers spent joyous moments of Eid with the orphans / abandoned children and presented gifts and shoes. Company also organized health awareness and medical camp for children and local community in a rural school near Wahga Border, Lahore.
The Company is also investing a considerable time and money on human resource. Training of employees has always been considered as an investment for the future with the objective to provide them with safe and healthy work place.
For sport activities, the Company this year organized events, where the employees were involved. The sports played during this year were badminton and cricket at our own premises.
On 20 September, 2017 at an Extraordinary General Meeting, the following nine Directors were elected for a three year term, under the provisions of the Company Act 2017:
Mr. Roberto LongoMr. M. Imran MalikMr. Cesar PanduroMr. Syed Asad Ali ZaidiMr. Amjad FarooqMr. Muhammad MaqboolMr. Ijaz Ahmad ChaudhryMr. Shahid AnwarMr. Syed Haroon Rashid
20
As we move forward, we are certain to face competitions and challenges due to ever changing economic and marketing conditions. General elections which are expected to be held in mid of the year 2018 may have a positive impact on economy in shape of increasing government expenditures and consumer spending but at the same time can have adverse impact on economy in case of hung parliament or political parties not accepting the elections results. Your Company in either of the situations will be ready to grab the opportunity or successfully overcome the challenge.
On behalf of your Board, I take this opportunity to express my gratitude and appreciation to our customers for their confidence in our products, our employees for their efforts and all other stakeholders for their continued support.
Roberto Longo Chairman
21

22
23

24

25
Directors’Reportto theMembers

26
DIRECTORS’ REPORT TO THE MEMBERS
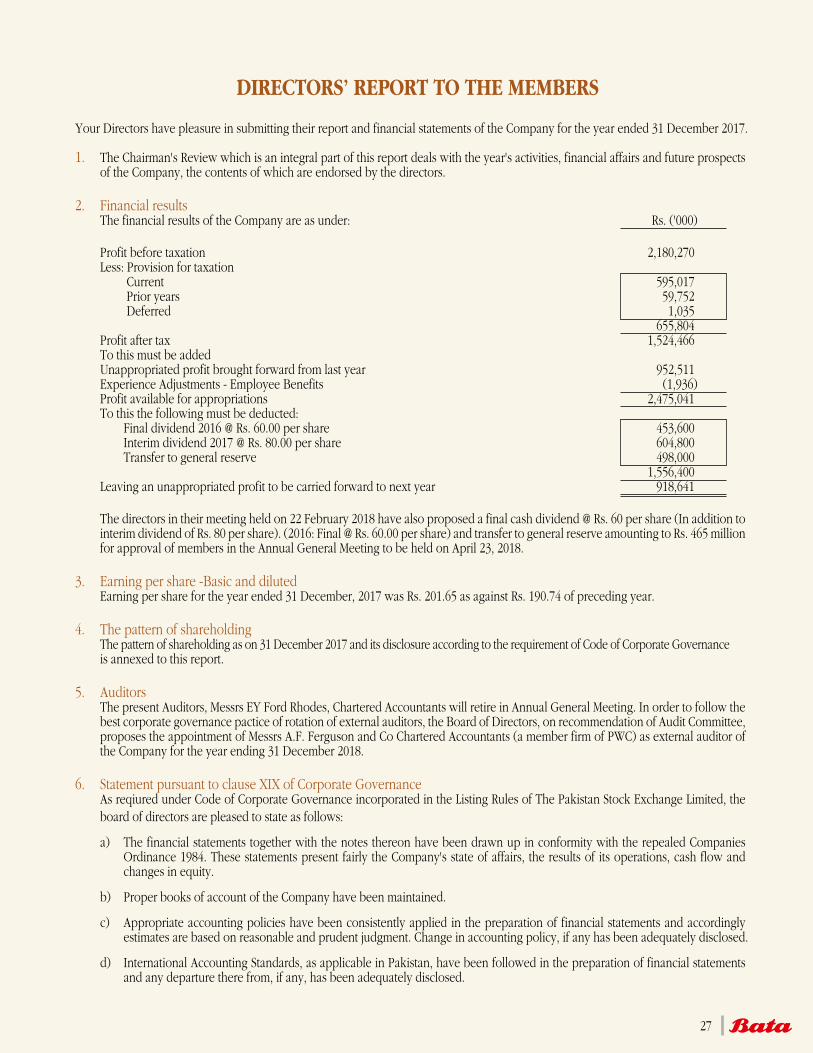
Your Directors have pleasure in submitting their report and financial statements of the Company for the year ended 31 December 2017. 1. The Chairman's Review which is an integral part of this report deals with the year's activities, financial affairs and future prospects
of the Company, the contents of which are endorsed by the directors.
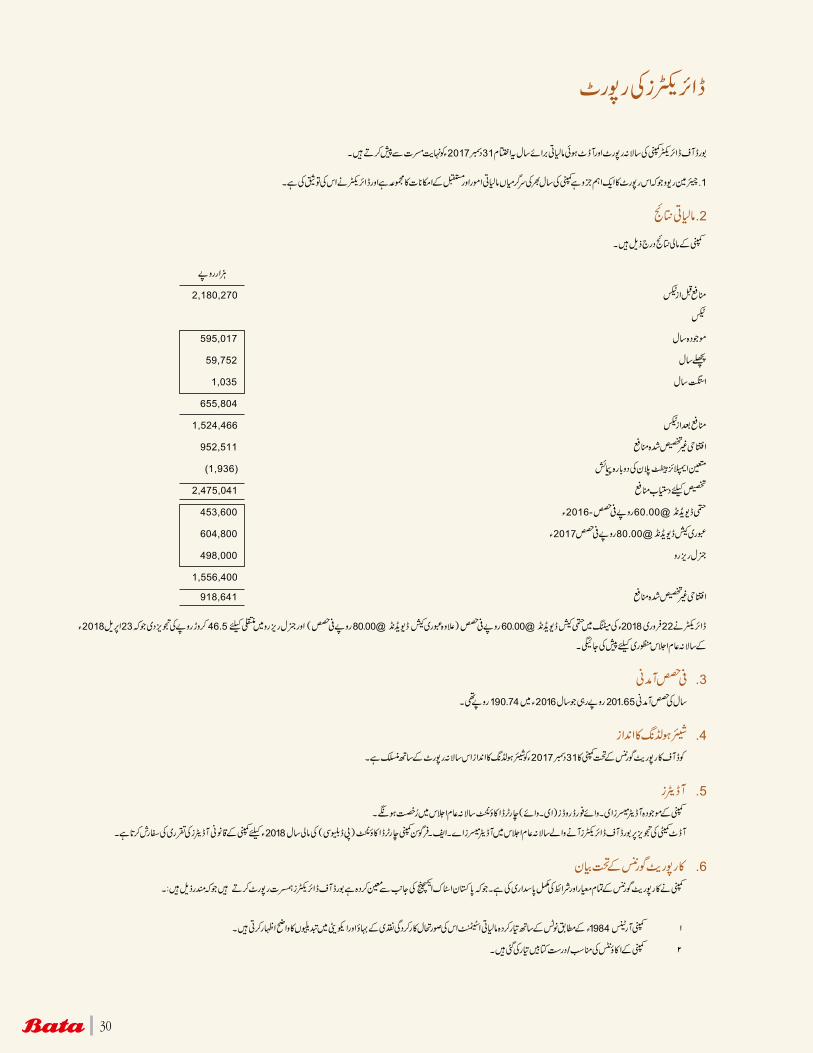
2. Financial results The financial results of the Company are as under: Rs. ('000)
Profit before taxation 2,180,270 Less: Provision for taxation Current 595,017 Prior years 59,752 Deferred 1,035 655,804 Profit after tax 1,524,466 To this must be added Unappropriated profit brought forward from last year 952,511 Experience Adjustments - Employee Benefits (1,936) Profit available for appropriations 2,475,041 To this the following must be deducted: Final dividend 2016 @ Rs. 60.00 per share 453,600 Interim dividend 2017 @ Rs. 80.00 per share 604,800 Transfer to general reserve 498,000 1,556,400 Leaving an unappropriated profit to be carried forward to next year 918,641
The directors in their meeting held on 22 February 2018 have also proposed a final cash dividend @ Rs. 60 per share (In addition to interim dividend of Rs. 80 per share). (2016: Final @ Rs. 60.00 per share) and transfer to general reserve amounting to Rs. 465 million for approval of members in the Annual General Meeting to be held on April 23, 2018.
3. Earning per share -Basic and diluted Earning per share for the year ended 31 December, 2017 was Rs. 201.65 as against Rs. 190.74 of preceding year. 4. The pattern of shareholding The pattern of shareholding as on 31 December 2017 and its disclosure according to the requirement of Code of Corporate Governance
is annexed to this report. 5. Auditors The present Auditors, Messrs EY Ford Rhodes, Chartered Accountants will retire in Annual General Meeting. In order to follow the
best corporate governance pactice of rotation of external auditors, the Board of Directors, on recommendation of Audit Committee, proposes the appointment of Messrs A.F. Ferguson and Co Chartered Accountants (a member firm of PWC) as external auditor of the Company for the year ending 31 December 2018.
6. Statement pursuant to clause XIX of Corporate Governance As reqiured under Code of Corporate Governance incorporated in the Listing Rules of The Pakistan Stock Exchange Limited, the board of directors are pleased to state as follows:
a) The financial statements together with the notes thereon have been drawn up in conformity with the repealed Companies Ordinance 1984. These statements present fairly the Company's state of affairs, the results of its operations, cash flow and changes in equity.
b) Proper books of account of the Company have been maintained.
c) Appropriate accounting policies have been consistently applied in the preparation of financial statements and accordingly estimates are based on reasonable and prudent judgment. Change in accounting policy, if any has been adequately disclosed.
d) International Accounting Standards, as applicable in Pakistan, have been followed in the preparation of financial statements and any departure there from, if any, has been adequately disclosed.
27
e) The system of internal controls is sound in design and has been effectively implemented and is being consistently reviewed by the internal audit department.
f) There are no significant doubts upon the Company's ability to continue as a going concern.
g) There has been no material departure from the best practices of corporate governance as detailed in listing regulations of Pakistan Stock Exchange except as stated in para 1 of the statement of compliance with code of corporate governance.
h) Key operating and financial data of last six years is annexed to this report.
i) Statement of compliance with the Code of Corporate Governance is annexed.
j) Value of assets of Provident Fund Trusts was Rupees ('000) 1,554,486 as on 31 December 2017 as per its audited accounts. The value of assets includes accrued mark up.
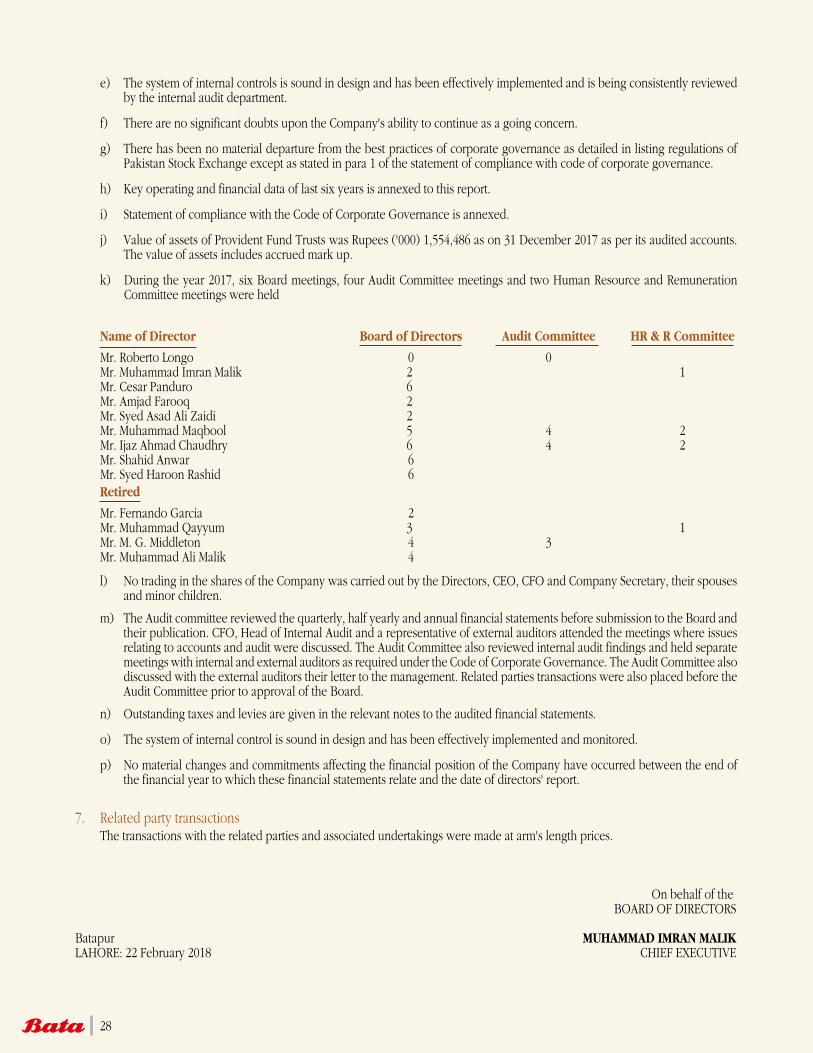
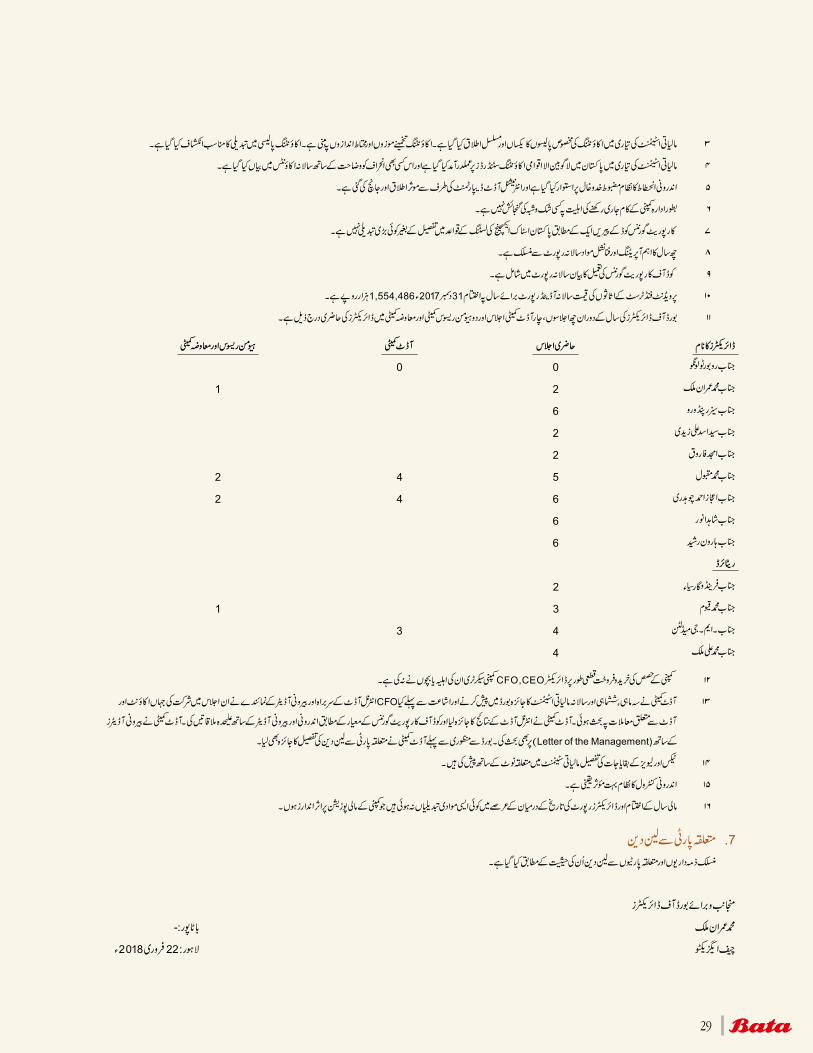
k) During the year 2017, six Board meetings, four Audit Committee meetings and two Human Resource and Remuneration Committee meetings were held
Name of Director Board of Directors Audit Committee HR & R Committee
Mr. Roberto Longo 0 0 Mr. Muhammad Imran Malik 2 1 Mr. Cesar Panduro 6 Mr. Amjad Farooq 2 Mr. Syed Asad Ali Zaidi 2 Mr. Muhammad Maqbool 5 4 2 Mr. Ijaz Ahmad Chaudhry 6 4 2 Mr. Shahid Anwar 6 Mr. Syed Haroon Rashid 6 Retired
Mr. Fernando Garcia 2 Mr. Muhammad Qayyum 3 1 Mr. M. G. Middleton 4 3 Mr. Muhammad Ali Malik 4
l) No trading in the shares of the Company was carried out by the Directors, CEO, CFO and Company Secretary, their spouses and minor children.
m) The Audit committee reviewed the quarterly, half yearly and annual financial statements before submission to the Board and their publication. CFO, Head of Internal Audit and a representative of external auditors attended the meetings where issues relating to accounts and audit were discussed. The Audit Committee also reviewed internal audit findings and held separate meetings with internal and external auditors as required under the Code of Corporate Governance. The Audit Committee also discussed with the external auditors their letter to the management. Related parties transactions were also placed before the Audit Committee prior to approval of the Board.
n) Outstanding taxes and levies are given in the relevant notes to the audited financial statements.
o) The system of internal control is sound in design and has been effectively implemented and monitored.
p) No material changes and commitments affecting the financial position of the Company have occurred between the end of the financial year to which these financial statements relate and the date of directors' report.
7. Related party transactions The transactions with the related parties and associated undertakings were made at arm's length prices.
On behalf of the BOARD OF DIRECTORS Batapur MUHAMMAD IMRAN MALIKLAHORE: 22 February 2018 CHIEF EXECUTIVE
28
29
30

31
CorporateGovernance

32
STATEMENT OF COMPLIANCE WITH THE CODE OF CORPORATE GOVERNANCE FOR THE YEAR ENDED 31st DECEMBER, 2017
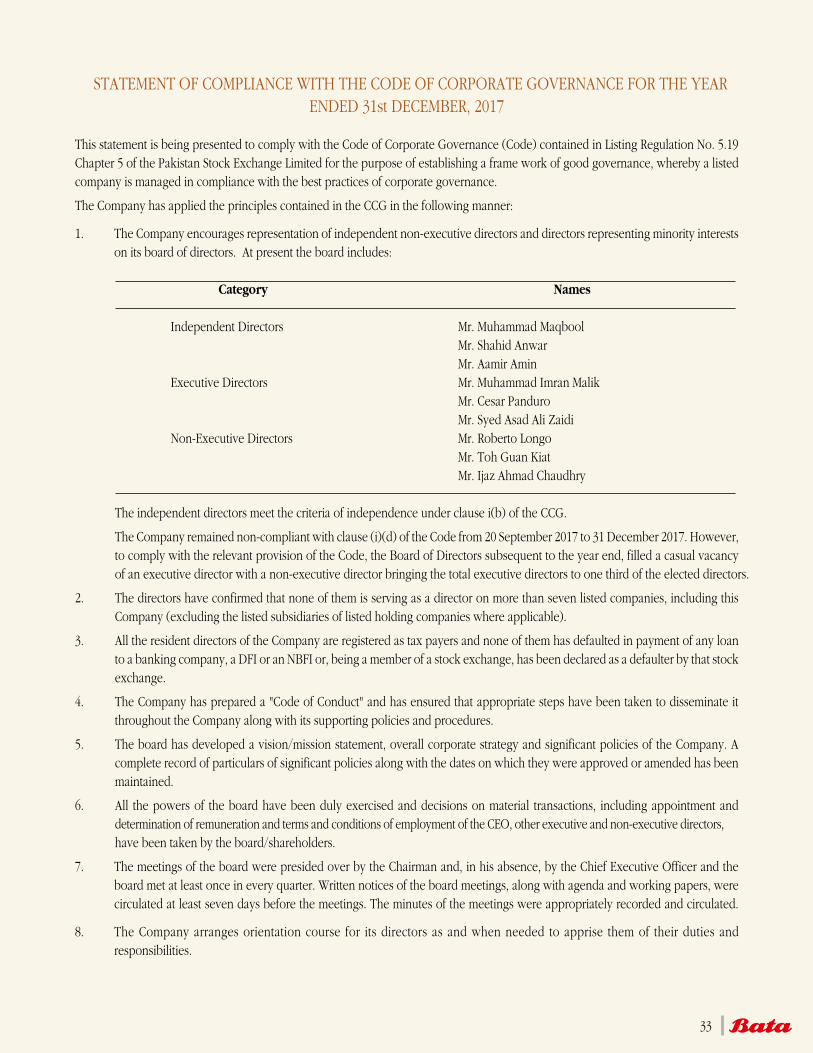
This statement is being presented to comply with the Code of Corporate Governance (Code) contained in Listing Regulation No. 5.19 Chapter 5 of the Pakistan Stock Exchange Limited for the purpose of establishing a frame work of good governance, whereby a listed company is managed in compliance with the best practices of corporate governance.
The Company has applied the principles contained in the CCG in the following manner:
1. The Company encourages representation of independent non-executive directors and directors representing minority interests on its board of directors. At present the board includes:
Category Names Independent Directors Mr. Muhammad Maqbool Mr. Shahid Anwar Mr. Aamir Amin Executive Directors Mr. Muhammad Imran Malik Mr. Cesar Panduro Mr. Syed Asad Ali Zaidi Non-Executive Directors Mr. Roberto Longo Mr. Toh Guan Kiat Mr. Ijaz Ahmad Chaudhry
The independent directors meet the criteria of independence under clause i(b) of the CCG.
The Company remained non-compliant with clause (i)(d) of the Code from 20 September 2017 to 31 December 2017. However, to comply with the relevant provision of the Code, the Board of Directors subsequent to the year end, filled a casual vacancy of an executive director with a non-executive director bringing the total executive directors to one third of the elected directors.
2. The directors have confirmed that none of them is serving as a director on more than seven listed companies, including this Company (excluding the listed subsidiaries of listed holding companies where applicable).
3. All the resident directors of the Company are registered as tax payers and none of them has defaulted in payment of any loan to a banking company, a DFI or an NBFI or, being a member of a stock exchange, has been declared as a defaulter by that stock exchange.
4. The Company has prepared a "Code of Conduct" and has ensured that appropriate steps have been taken to disseminate it throughout the Company along with its supporting policies and procedures.
5. The board has developed a vision/mission statement, overall corporate strategy and significant policies of the Company. A complete record of particulars of significant policies along with the dates on which they were approved or amended has been maintained.
6. All the powers of the board have been duly exercised and decisions on material transactions, including appointment and determination of remuneration and terms and conditions of employment of the CEO, other executive and non-executive directors, have been taken by the board/shareholders.
7. The meetings of the board were presided over by the Chairman and, in his absence, by the Chief Executive Officer and the board met at least once in every quarter. Written notices of the board meetings, along with agenda and working papers, were circulated at least seven days before the meetings. The minutes of the meetings were appropriately recorded and circulated.
8. The Company arranges orientation course for its directors as and when needed to apprise them of their duties and responsibilities.
33
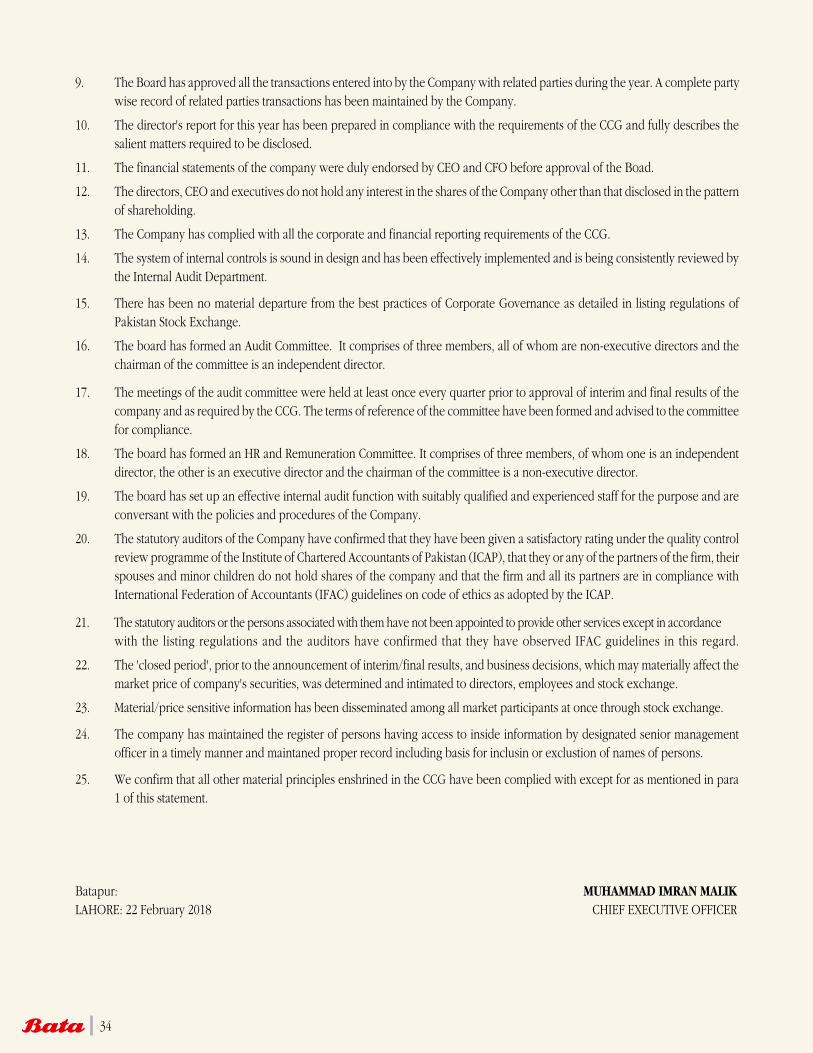
9. The Board has approved all the transactions entered into by the Company with related parties during the year. A complete party wise record of related parties transactions has been maintained by the Company.
10. The director's report for this year has been prepared in compliance with the requirements of the CCG and fully describes the salient matters required to be disclosed.
11. The financial statements of the company were duly endorsed by CEO and CFO before approval of the Boad.
12. The directors, CEO and executives do not hold any interest in the shares of the Company other than that disclosed in the pattern of shareholding.
13. The Company has complied with all the corporate and financial reporting requirements of the CCG.
14. The system of internal controls is sound in design and has been effectively implemented and is being consistently reviewed by the Internal Audit Department.
15. There has been no material departure from the best practices of Corporate Governance as detailed in listing regulations of Pakistan Stock Exchange.
16. The board has formed an Audit Committee. It comprises of three members, all of whom are non-executive directors and the chairman of the committee is an independent director.
17. The meetings of the audit committee were held at least once every quarter prior to approval of interim and final results of the company and as required by the CCG. The terms of reference of the committee have been formed and advised to the committee for compliance.
18. The board has formed an HR and Remuneration Committee. It comprises of three members, of whom one is an independent director, the other is an executive director and the chairman of the committee is a non-executive director.
19. The board has set up an effective internal audit function with suitably qualified and experienced staff for the purpose and are conversant with the policies and procedures of the Company.
20. The statutory auditors of the Company have confirmed that they have been given a satisfactory rating under the quality control review programme of the Institute of Chartered Accountants of Pakistan (ICAP), that they or any of the partners of the firm, their spouses and minor children do not hold shares of the company and that the firm and all its partners are in compliance with International Federation of Accountants (IFAC) guidelines on code of ethics as adopted by the ICAP.
21. The statutory auditors or the persons associated with them have not been appointed to provide other services except in accordance with the listing regulations and the auditors have confirmed that they have observed IFAC guidelines in this regard.
22. The 'closed period', prior to the announcement of interim/final results, and business decisions, which may materially affect the market price of company's securities, was determined and intimated to directors, employees and stock exchange.
23. Material/price sensitive information has been disseminated among all market participants at once through stock exchange.
24. The company has maintained the register of persons having access to inside information by designated senior management officer in a timely manner and maintaned proper record including basis for inclusin or exclustion of names of persons.
25. We confirm that all other material principles enshrined in the CCG have been complied with except for as mentioned in para 1 of this statement.
Batapur: MUHAMMAD IMRAN MALIKLAHORE: 22 February 2018 CHIEF EXECUTIVE OFFICER
34
35
Review Reportto theMembers

36
REVIEW REPORT TO THE MEMBERS ON STATEMENT OF COMPLIANCE WITH THE CODE OF CORPORATE GOVERNANCE
We have reviewed the enclosed Statement of Compliance with the best practices contained in the Code of Corporate Governance (the Code) prepared by the Board of Directors of Bata Pakistan Limited (the Company) for the year ended 31 December 2017 to comply with the requirements of Listing Regulation 5.19 of the rule book of Pakistan Stock Exchange, where the Company is listed.
The responsibility for compliance with the Code is that of the Board of Directors of the Company. Our responsibility is to review, to the extent where such compliance can be objectively verified, whether the Statement of Compliance reflects the status of the Company’s compliance with the provisions of the Code and report if it does not and to highlight any non-compliance with the requirements of the Code. A review is limited primarily to inquiries of the Company’s personnel and review of various documents prepared by the Company to comply with the Code.
As part of our audit of financial statements we are required to obtain an understanding of the accounting and internal control systems sufficient to plan the audit and develop an effective audit approach. We are not required to consider whether the Board of Director’s statement on internal control covers all risks and controls, or to form an opinion on the effectiveness of such internal controls, the Company’s corporate governance procedures and risks.
The Code requires the Company to place before the Audit Committee, and upon recommendation of the Audit Committee, place before the board of Directors for their review and approval of its related party transactions, distinguishing between transactions carried out on terms equivalent to those that prevail in arm’s length transactions and transactions which are not executed at arm’s length price and recording proper justification for using such alternate pricing mechanism. We are only required and have ensured compliance of requirement to the extent of approval of related party transactions by the Board of Directors upon recommendation of the Audit Committee. We have not carried out any procedures to determine whether the related party transactions were undertaken at arm’s length price or not.
Based on our review, nothing has come to our attention, which causes us to believe that the Statement of Compliance does not appropriately reflect the Company’s compliance, in all material respects, with the best practices contained in the Code as applicable to the Company for the year ended 31 December 2017.
Further, we highlight below instance of non-compliance with the requirement of the Code as reflected in the paragraph reference where these are stated in the statement of Compliance:
Paragraph Reference Description
1 The Company remained non-compliant with clause (i)(d) of the Code from 20 September 2017 to 31 December 2017. However, to comply with the relevant provision of the Code, the Board of Directors subsequent to the year end, filled a casual vacancy of an executive director with a non-executive director bringing the total executive directors to one third of the elected directors.
EY Ford Rhodes Chartered AccountantsLAHORE: 15 March 2018 Audit Engagement Partner: Farooq Hameed
37

38
39
Auditors’Reportto theMembers

40
INDEPENDENT AUDITOR’S REPORT TO THE MEMBERSWe have audited the annexed balance sheet of Bata Pakistan Limited (the Company) as at 31 December 2017 and the related statement of comprehensive income, cash flow statement and statement of changes in equity together with the notes forming part thereof (hereinafter referred to as the ‘financial statements’), for the year then ended and we state that we have obtained all the information and explanations which, to the best of our knowledge and belief, were necessary for the purposes of our audit.
It is the responsibility of the Company’s management to establish and maintain a system of internal control, and prepare and present the above said statements in conformity with the approved accounting standards and the requirements of the Companies Ordinance, 1984. Our responsibility is to express an opinion on these statements based on our audit.
We conducted our audit in accordance with the auditing standards as applicable in Pakistan. These standards require that we plan and perform the audit to obtain reasonable assurance about whether the financial statements are free of any material misstatement. An audit includes examining on a test basis, evidence supporting the amounts and disclosures in the above said statements. An audit also includes assessing the accounting policies and significant estimates made by management, as well as, evaluating the overall presentation of the above said statements. We believe that our audit provides a reasonable basis for our opinion and, after due verification, we report that: (a) in our opinion, proper books of account have been kept by the Company as required by the Companies
Ordinance, 1984;
(b) in our opinion:
(i) the balance sheet and statement of comprehensive income together with the notes thereon have been drawn up in conformity with the Companies Ordinance, 1984, and are in agreement with the books of account and are further in accordance with accounting policies consistently applied, except for the changes as stated in note 2.2 with which we concur;
(ii) the expenditure incurred during the year was for the purpose of the Company’s business; and
(iii) the business conducted, investments made and the expenditure incurred during the year were in accordance with the objects of the Company;
(c) in our opinion and to the best of our information and according to the explanations given to us, the balance sheet, statement of comprehensive income, cash flow statement and statement of changes in equity together with the notes forming part thereof conform with approved accounting standards as applicable in Pakistan, and, give the information required by the Companies Ordinance, 1984, in the manner so required and respectively give a true and fair view of the state of the Company’s affairs as at 31 December 2017 and of the total comprehensive income, its cash flows and changes in equity for the year then ended; and
(d) in our opinion, Zakat deductible at source under the Zakat and Ushr Ordinance, 1980 (XVIII of 1980) was deducted by the Company and deposited in the Central Zakat Fund established under Section 7 of that Ordinance
EY Ford Rhodes Chartered AccountantsLAHORE: 15 March 2018 Audit Engagement Partner: Farooq Hameed
41

42
43
FinancialStatements
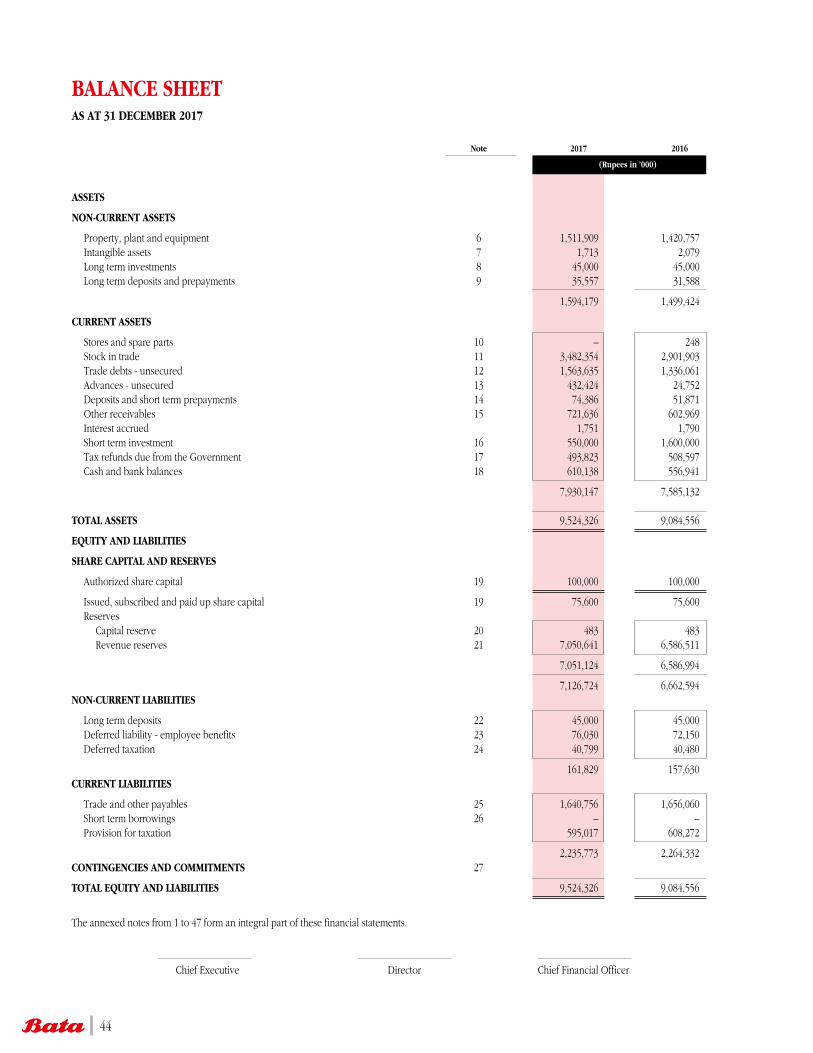
BALANCE SHEETAS AT 31 DECEMBER 2017
Note 2017 2016
(Rupees in ’000)
ASSETS
NON-CURRENT ASSETS
Property, plant and equipment 6 1,511,909 1,420,757 Intangible assets 7 1,713 2,079 Long term investments 8 45,000 45,000 Long term deposits and prepayments 9 35,557 31,588
1,594,179 1,499,424
CURRENT ASSETS
Stores and spare parts 10 – 248 Stock in trade 11 3,482,354 2,901,903 Trade debts - unsecured 12 1,563,635 1,336,061 Advances - unsecured 13 432,424 24,752 Deposits and short term prepayments 14 74,386 51,871 Other receivables 15 721,636 602,969 Interest accrued 1,751 1,790 Short term investment 16 550,000 1,600,000 Tax refunds due from the Government 17 493,823 508,597 Cash and bank balances 18 610,138 556,941
7,930,147 7,585,132
TOTAL ASSETS 9,524,326 9,084,556
EQUITY AND LIABILITIES
SHARE CAPITAL AND RESERVES
Authorized share capital 19 100,000 100,000
Issued, subscribed and paid up share capital 19 75,600 75,600 Reserves Capital reserve 20 483 483 Revenue reserves 21 7,050,641 6,586,511
7,051,124 6,586,994
7,126,724 6,662,594 NON-CURRENT LIABILITIES
Long term deposits 22 45,000 45,000 Deferred liability - employee benefits 23 76,030 72,150 Deferred taxation 24 40,799 40,480
161,829 157,630 CURRENT LIABILITIES
Trade and other payables 25 1,640,756 1,656,060 Short term borrowings 26 – – Provision for taxation 595,017 608,272
2,235,773 2,264,332CONTINGENCIES AND COMMITMENTS 27
TOTAL EQUITY AND LIABILITIES 9,524,326 9,084,556
The annexed notes from 1 to 47 form an integral part of these financial statements.
Chief Executive Director Chief Financial Officer
44
Chief Executive Director Chief Financial Officer
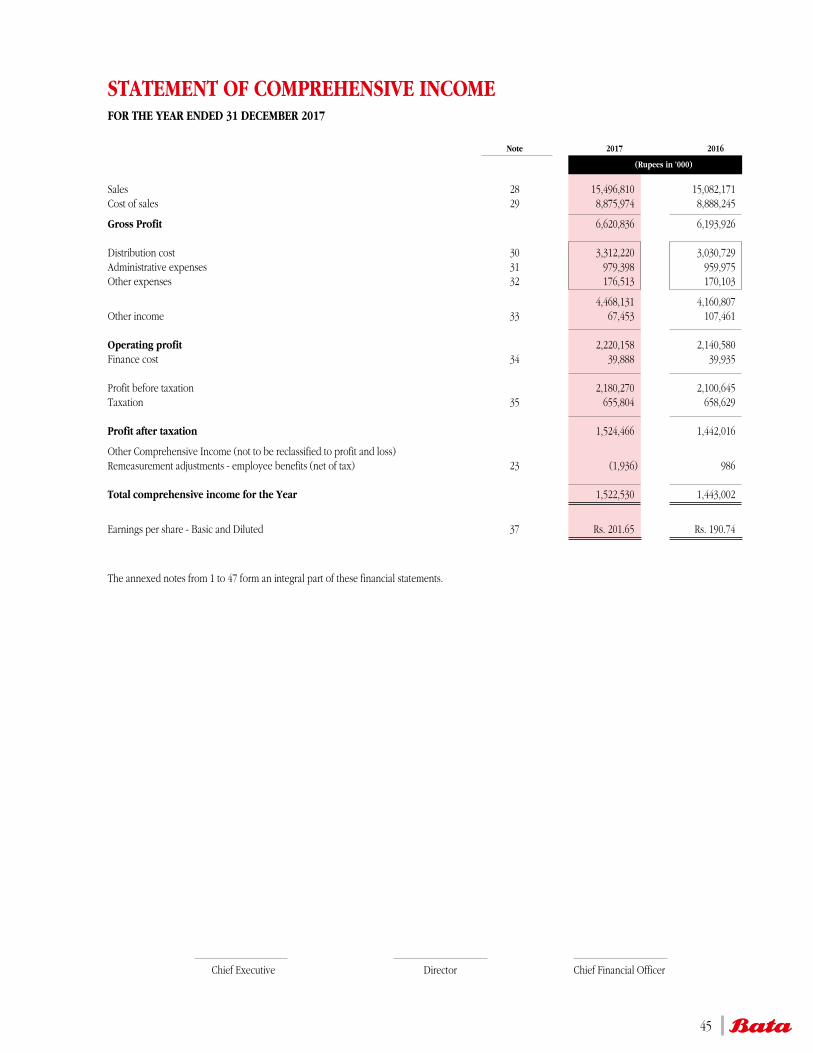
STATEMENT OF COMPREHENSIVE INCOMEFOR THE YEAR ENDED 31 DECEMBER 2017
Note 2017 2016
(Rupees in ’000)
Sales 28 15,496,810 15,082,171 Cost of sales 29 8,875,974 8,888,245
Gross Profit 6,620,836 6,193,926 Distribution cost 30 3,312,220 3,030,729 Administrative expenses 31 979,398 959,975 Other expenses 32 176,513 170,103
4,468,131 4,160,807 Other income 33 67,453 107,461
Operating profit 2,220,158 2,140,580 Finance cost 34 39,888 39,935
Profit before taxation 2,180,270 2,100,645 Taxation 35 655,804 658,629
Profit after taxation 1,524,466 1,442,016
Other Comprehensive Income (not to be reclassified to profit and loss)Remeasurement adjustments - employee benefits (net of tax) 23 (1,936) 986
Total comprehensive income for the Year 1,522,530 1,443,002
Earnings per share - Basic and Diluted 37 Rs. 201.65 Rs. 190.74
The annexed notes from 1 to 47 form an integral part of these financial statements.
45
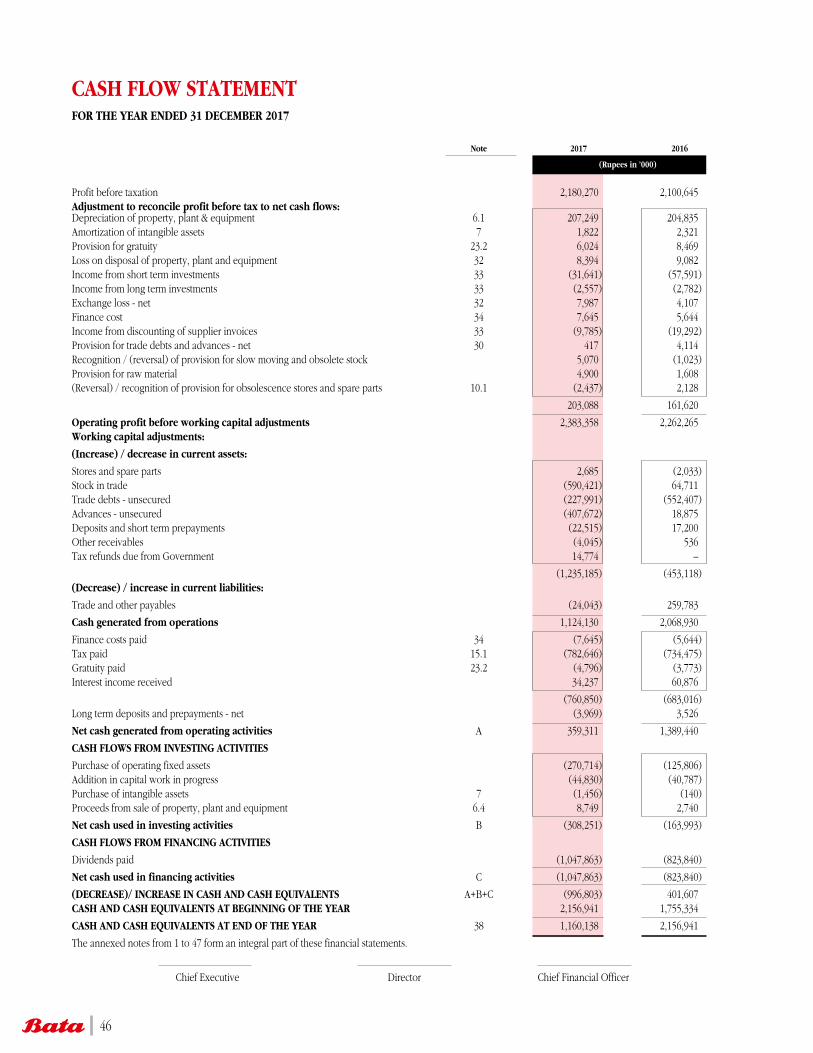
CASH FLOW STATEMENTFOR THE YEAR ENDED 31 DECEMBER 2017
Note 2017 2016
(Rupees in ’000)
Profit before taxation 2,180,270 2,100,645 Adjustment to reconcile profit before tax to net cash flows: Depreciation of property, plant & equipment 6.1 207,249 204,835 Amortization of intangible assets 7 1,822 2,321 Provision for gratuity 23.2 6,024 8,469 Loss on disposal of property, plant and equipment 32 8,394 9,082 Income from short term investments 33 (31,641) (57,591)Income from long term investments 33 (2,557) (2,782)Exchange loss - net 32 7,987 4,107 Finance cost 34 7,645 5,644 Income from discounting of supplier invoices 33 (9,785) (19,292)Provision for trade debts and advances - net 30 417 4,114 Recognition / (reversal) of provision for slow moving and obsolete stock 5,070 (1,023)Provision for raw material 4,900 1,608 (Reversal) / recognition of provision for obsolescence stores and spare parts 10.1 (2,437) 2,128
203,088 161,620
Operating profit before working capital adjustments 2,383,358 2,262,265 Working capital adjustments:
(Increase) / decrease in current assets:
Stores and spare parts 2,685 (2,033)Stock in trade (590,421) 64,711 Trade debts - unsecured (227,991) (552,407)Advances - unsecured (407,672) 18,875 Deposits and short term prepayments (22,515) 17,200 Other receivables (4,045) 536 Tax refunds due from Government 14,774 –
(1,235,185) (453,118)(Decrease) / increase in current liabilities:
Trade and other payables (24,043) 259,783
Cash generated from operations 1,124,130 2,068,930
Finance costs paid 34 (7,645) (5,644)Tax paid 15.1 (782,646) (734,475)Gratuity paid 23.2 (4,796) (3,773)Interest income received 34,237 60,876
(760,850) (683,016)Long term deposits and prepayments - net (3,969) 3,526
Net cash generated from operating activities A 359,311 1,389,440
CASH FLOWS FROM INVESTING ACTIVITIES
Purchase of operating fixed assets (270,714) (125,806)Addition in capital work in progress (44,830) (40,787)Purchase of intangible assets 7 (1,456) (140)Proceeds from sale of property, plant and equipment 6.4 8,749 2,740
Net cash used in investing activities B (308,251) (163,993)
CASH FLOWS FROM FINANCING ACTIVITIES
Dividends paid (1,047,863) (823,840)
Net cash used in financing activities C (1,047,863) (823,840)
(DECREASE)/ INCREASE IN CASH AND CASH EQUIVALENTS A+B+C (996,803) 401,607 CASH AND CASH EQUIVALENTS AT BEGINNING OF THE YEAR 2,156,941 1,755,334
CASH AND CASH EQUIVALENTS AT END OF THE YEAR 38 1,160,138 2,156,941
The annexed notes from 1 to 47 form an integral part of these financial statements.
Chief Executive Director Chief Financial Officer
46
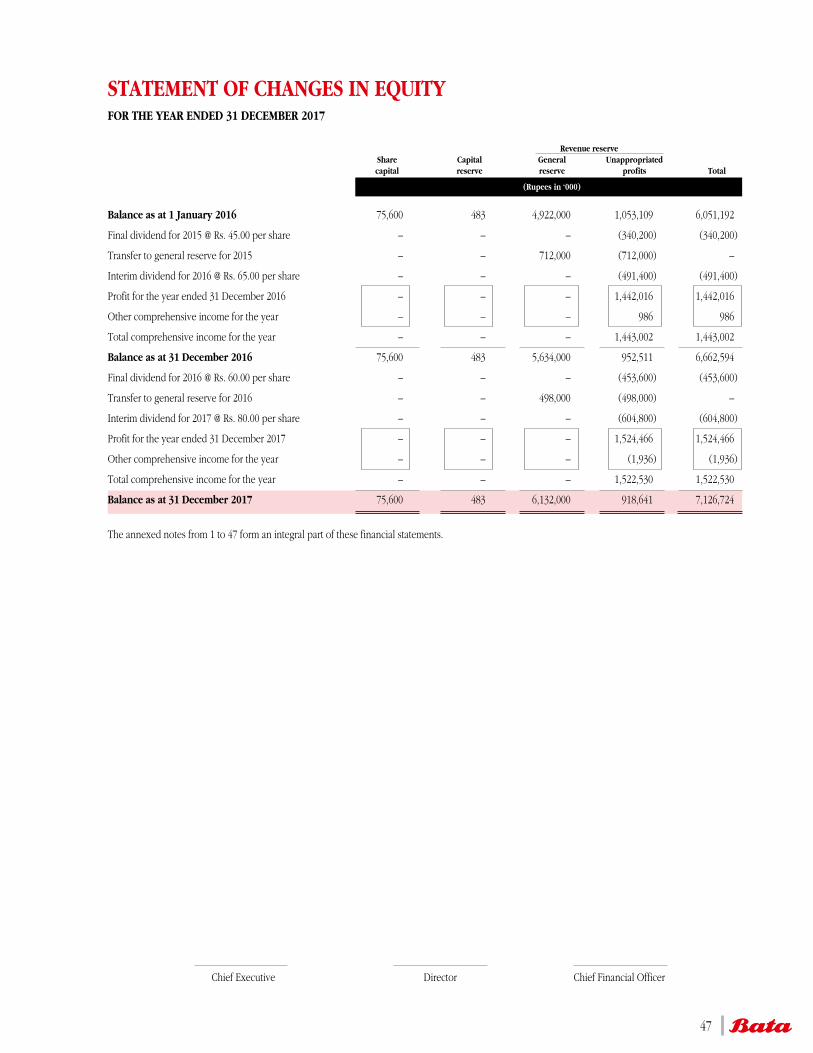
STATEMENT OF CHANGES IN EQUITYFOR THE YEAR ENDED 31 DECEMBER 2017
Revenue reserve Share Capital General Unappropriated capital reserve reserve profits Total
(Rupees in ‘000)
Balance as at 1 January 2016 75,600 483 4,922,000 1,053,109 6,051,192
Final dividend for 2015 @ Rs. 45.00 per share – – – (340,200) (340,200)
Transfer to general reserve for 2015 – – 712,000 (712,000) –
Interim dividend for 2016 @ Rs. 65.00 per share – – – (491,400) (491,400)
Profit for the year ended 31 December 2016 – – – 1,442,016 1,442,016
Other comprehensive income for the year – – – 986 986
Total comprehensive income for the year – – – 1,443,002 1,443,002
Balance as at 31 December 2016 75,600 483 5,634,000 952,511 6,662,594
Final dividend for 2016 @ Rs. 60.00 per share – – – (453,600) (453,600)
Transfer to general reserve for 2016 – – 498,000 (498,000) –
Interim dividend for 2017 @ Rs. 80.00 per share – – – (604,800) (604,800)
Profit for the year ended 31 December 2017 – – – 1,524,466 1,524,466
Other comprehensive income for the year – – – (1,936) (1,936)
Total comprehensive income for the year – – – 1,522,530 1,522,530
Balance as at 31 December 2017 75,600 483 6,132,000 918,641 7,126,724
The annexed notes from 1 to 47 form an integral part of these financial statements.
Chief Executive Director Chief Financial Officer
47
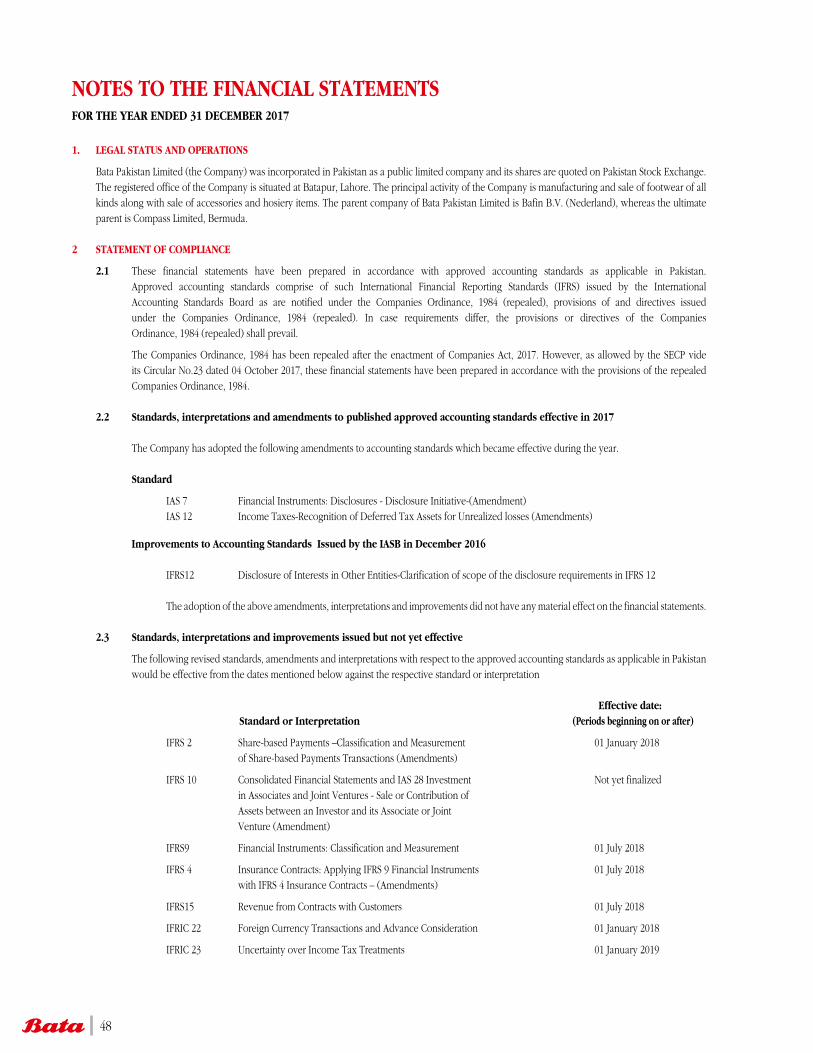
1. LEGAL STATUS AND OPERATIONS
Bata Pakistan Limited (the Company) was incorporated in Pakistan as a public limited company and its shares are quoted on Pakistan Stock Exchange. The registered office of the Company is situated at Batapur, Lahore. The principal activity of the Company is manufacturing and sale of footwear of all kinds along with sale of accessories and hosiery items. The parent company of Bata Pakistan Limited is Bafin B.V. (Nederland), whereas the ultimate parent is Compass Limited, Bermuda.
2 STATEMENT OF COMPLIANCE
2.1 These financial statements have been prepared in accordance with approved accounting standards as applicable in Pakistan. Approved accounting standards comprise of such International Financial Reporting Standards (IFRS) issued by the International Accounting Standards Board as are notified under the Companies Ordinance, 1984 (repealed), provisions of and directives issued under the Companies Ordinance, 1984 (repealed). In case requirements differ, the provisions or directives of the Companies Ordinance, 1984 (repealed) shall prevail.
The Companies Ordinance, 1984 has been repealed after the enactment of Companies Act, 2017. However, as allowed by the SECP vide its Circular No.23 dated 04 October 2017, these financial statements have been prepared in accordance with the provisions of the repealed Companies Ordinance, 1984.
2.2 Standards, interpretations and amendments to published approved accounting standards effective in 2017
The Company has adopted the following amendments to accounting standards which became effective during the year. Standard
IAS 7 Financial Instruments: Disclosures - Disclosure Initiative-(Amendment) IAS 12 Income Taxes-Recognition of Deferred Tax Assets for Unrealized losses (Amendments)
Improvements to Accounting Standards Issued by the IASB in December 2016
IFRS12 Disclosure of Interests in Other Entities-Clarification of scope of the disclosure requirements in IFRS 12
The adoption of the above amendments, interpretations and improvements did not have any material effect on the financial statements.
2.3 Standards, interpretations and improvements issued but not yet effective
The following revised standards, amendments and interpretations with respect to the approved accounting standards as applicable in Pakistan would be effective from the dates mentioned below against the respective standard or interpretation Effective date: Standard or Interpretation (Periods beginning on or after)
IFRS 2 Share-based Payments –Classification and Measurement 01 January 2018 of Share-based Payments Transactions (Amendments)
IFRS 10 Consolidated Financial Statements and IAS 28 Investment Not yet finalized in Associates and Joint Ventures - Sale or Contribution of Assets between an Investor and its Associate or Joint Venture (Amendment)
IFRS9 Financial Instruments: Classification and Measurement 01 July 2018
IFRS 4 Insurance Contracts: Applying IFRS 9 Financial Instruments 01 July 2018 with IFRS 4 Insurance Contracts – (Amendments)
IFRS15 Revenue from Contracts with Customers 01 July 2018
IFRIC 22 Foreign Currency Transactions and Advance Consideration 01 January 2018
IFRIC 23 Uncertainty over Income Tax Treatments 01 January 2019
NOTES TO THE FINANCIAL STATEMENTSFOR THE YEAR ENDED 31 DECEMBER 2017
48
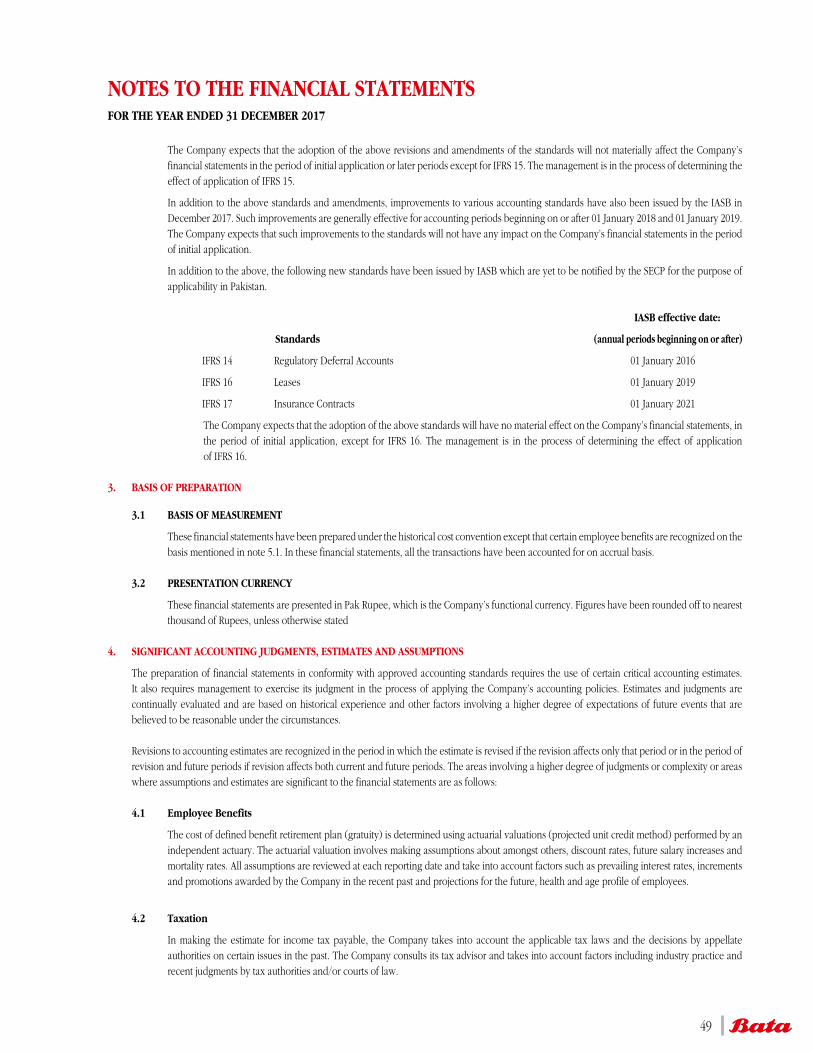
The Company expects that the adoption of the above revisions and amendments of the standards will not materially affect the Company’s financial statements in the period of initial application or later periods except for IFRS 15. The management is in the process of determining the effect of application of IFRS 15.
In addition to the above standards and amendments, improvements to various accounting standards have also been issued by the IASB in December 2017. Such improvements are generally effective for accounting periods beginning on or after 01 January 2018 and 01 January 2019. The Company expects that such improvements to the standards will not have any impact on the Company’s financial statements in the period of initial application.
In addition to the above, the following new standards have been issued by IASB which are yet to be notified by the SECP for the purpose of applicability in Pakistan.
IASB effective date:
Standards (annual periods beginning on or after)
IFRS 14 Regulatory Deferral Accounts 01 January 2016
IFRS 16 Leases 01 January 2019
IFRS 17 Insurance Contracts 01 January 2021
The Company expects that the adoption of the above standards will have no material effect on the Company’s financial statements, in the period of initial application, except for IFRS 16. The management is in the process of determining the effect of application of IFRS 16.
3. BASIS OF PREPARATION
3.1 BASIS OF MEASUREMENT
These financial statements have been prepared under the historical cost convention except that certain employee benefits are recognized on the basis mentioned in note 5.1. In these financial statements, all the transactions have been accounted for on accrual basis.
3.2 PRESENTATION CURRENCY
These financial statements are presented in Pak Rupee, which is the Company’s functional currency. Figures have been rounded off to nearest thousand of Rupees, unless otherwise stated
4. SIGNIFICANT ACCOUNTING JUDGMENTS, ESTIMATES AND ASSUMPTIONS
The preparation of financial statements in conformity with approved accounting standards requires the use of certain critical accounting estimates. It also requires management to exercise its judgment in the process of applying the Company’s accounting policies. Estimates and judgments are continually evaluated and are based on historical experience and other factors involving a higher degree of expectations of future events that are believed to be reasonable under the circumstances.
Revisions to accounting estimates are recognized in the period in which the estimate is revised if the revision affects only that period or in the period of revision and future periods if revision affects both current and future periods. The areas involving a higher degree of judgments or complexity or areas where assumptions and estimates are significant to the financial statements are as follows:
4.1 Employee Benefits
The cost of defined benefit retirement plan (gratuity) is determined using actuarial valuations (projected unit credit method) performed by an independent actuary. The actuarial valuation involves making assumptions about amongst others, discount rates, future salary increases and mortality rates. All assumptions are reviewed at each reporting date and take into account factors such as prevailing interest rates, increments and promotions awarded by the Company in the recent past and projections for the future, health and age profile of employees.
4.2 Taxation
In making the estimate for income tax payable, the Company takes into account the applicable tax laws and the decisions by appellate authorities on certain issues in the past. The Company consults its tax advisor and takes into account factors including industry practice and recent judgments by tax authorities and/or courts of law.
NOTES TO THE FINANCIAL STATEMENTSFOR THE YEAR ENDED 31 DECEMBER 2017
49
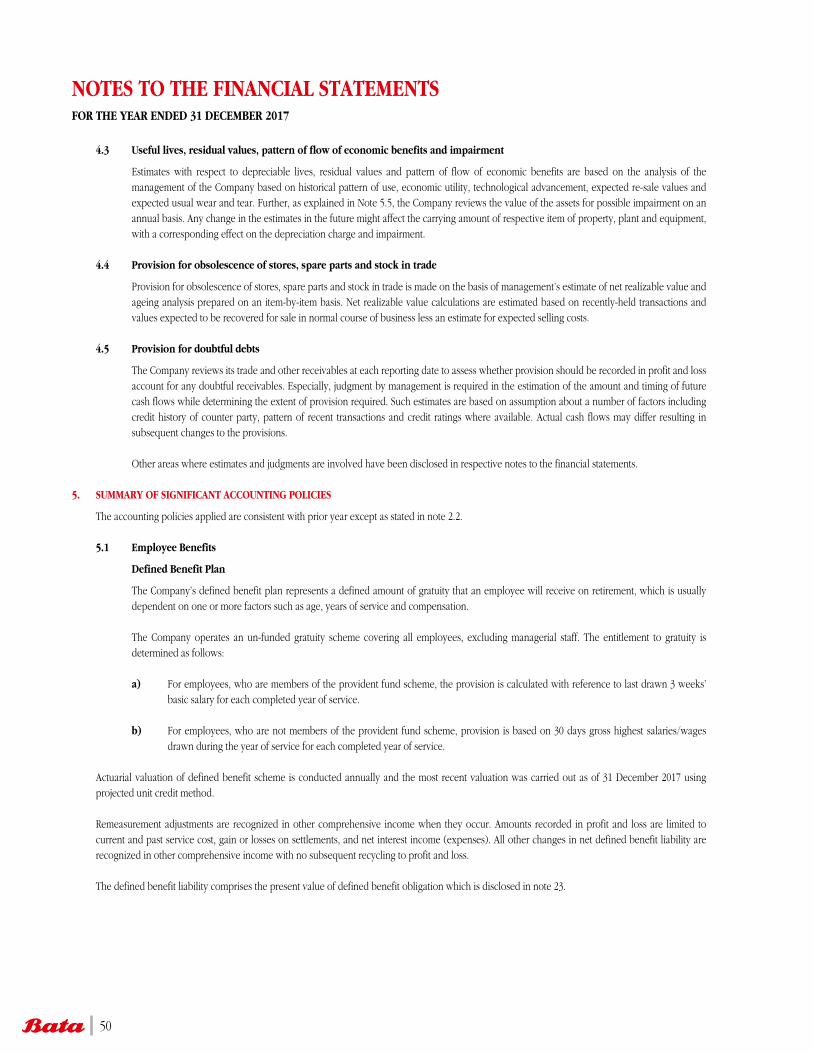
4.3 Useful lives, residual values, pattern of flow of economic benefits and impairment
Estimates with respect to depreciable lives, residual values and pattern of flow of economic benefits are based on the analysis of the management of the Company based on historical pattern of use, economic utility, technological advancement, expected re-sale values and expected usual wear and tear. Further, as explained in Note 5.5, the Company reviews the value of the assets for possible impairment on an annual basis. Any change in the estimates in the future might affect the carrying amount of respective item of property, plant and equipment, with a corresponding effect on the depreciation charge and impairment.
4.4 Provision for obsolescence of stores, spare parts and stock in trade
Provision for obsolescence of stores, spare parts and stock in trade is made on the basis of management’s estimate of net realizable value and ageing analysis prepared on an item-by-item basis. Net realizable value calculations are estimated based on recently-held transactions and values expected to be recovered for sale in normal course of business less an estimate for expected selling costs.
4.5 Provision for doubtful debts
The Company reviews its trade and other receivables at each reporting date to assess whether provision should be recorded in profit and loss account for any doubtful receivables. Especially, judgment by management is required in the estimation of the amount and timing of future cash flows while determining the extent of provision required. Such estimates are based on assumption about a number of factors including credit history of counter party, pattern of recent transactions and credit ratings where available. Actual cash flows may differ resulting in subsequent changes to the provisions.
Other areas where estimates and judgments are involved have been disclosed in respective notes to the financial statements.
5. SUMMARY OF SIGNIFICANT ACCOUNTING POLICIES
The accounting policies applied are consistent with prior year except as stated in note 2.2.
5.1 Employee Benefits
Defined Benefit Plan
The Company’s defined benefit plan represents a defined amount of gratuity that an employee will receive on retirement, which is usually dependent on one or more factors such as age, years of service and compensation.
The Company operates an un-funded gratuity scheme covering all employees, excluding managerial staff. The entitlement to gratuity is determined as follows: a) For employees, who are members of the provident fund scheme, the provision is calculated with reference to last drawn 3 weeks’
basic salary for each completed year of service.
b) For employees, who are not members of the provident fund scheme, provision is based on 30 days gross highest salaries/wages drawn during the year of service for each completed year of service.
Actuarial valuation of defined benefit scheme is conducted annually and the most recent valuation was carried out as of 31 December 2017 using projected unit credit method.
Remeasurement adjustments are recognized in other comprehensive income when they occur. Amounts recorded in profit and loss are limited to current and past service cost, gain or losses on settlements, and net interest income (expenses). All other changes in net defined benefit liability are recognized in other comprehensive income with no subsequent recycling to profit and loss.
The defined benefit liability comprises the present value of defined benefit obligation which is disclosed in note 23.
NOTES TO THE FINANCIAL STATEMENTSFOR THE YEAR ENDED 31 DECEMBER 2017
50
Defined Contribution Plan
The Company operates a recognized provident fund schemes for its employees. Equal monthly contributions by the Company and employees at the rates of 8% and 10% of the basic salary are made to Employees’ Provident Fund and Managerial Staff Provident Fund, respectively.
5.2 Taxation
Current
Provision of current tax is based on the taxable income, alternative corporate tax or minimum tax provisions in accordance with Income Tax Ordinance 2001. The charge for current tax is calculated using prevailing tax rates or tax rates expected to apply to the profit for the year if enacted. The charge for current tax also includes adjustments, where considered necessary, to provision for tax made in previous years arising from assessments framed during the year for such years.
Deferred Deferred income tax is provided using the balance sheet liability method for all temporary differences at the balance sheet date between tax
base of assets and liabilities and their carrying amounts for financial reporting purposes.
Deferred tax liability is recognized for all taxable temporary differences and deferred tax assets are recognized for all deductible temporary differences, carry forward of unused tax credits and unused tax losses, if any, to the extent that it is probable that future taxable profit will be available against which the deductible temporary difference, carry-forward of unused tax credits and unused tax losses can be utilized.
The carrying amount of deferred income tax asset is reviewed at each balance sheet date and reduced to the extent that it is no longer probable that sufficient taxable profit will be available to allow all or part of the deferred income tax assets to be utilized.
Deferred tax assets and liabilities are measured at the tax rates that are expected to apply to the period when the liability is settled based on tax rates that have been enacted or substantially enacted at the balance sheet date.
Sales tax Revenues, expenses, assets and liabilities are recognized net of the amount of sales tax except:
• Where the sales tax incurred on purchase of assets or services is not recoverable from the taxation authority, the sales tax is recognized as part of the cost of acquisition of the asset or as part of expense as applicable.
• Receivables and payable are stated with the amount of sales tax included. 5.3 Property, plant and equipment
Property, plant and equipment are stated at cost less accumulated depreciation and impairment losses, if any, except land which is stated at cost.
Depreciation is charged to income applying reducing balance method at the rates prescribed in note 6.1 of these financial statements to write off the cost over the useful lives of these assets. Depreciation on additions to property, plant and equipment is charged from the month in which an asset is available for use while no depreciation is charged for the month in which the asset is disposed off.
Subsequent expenditure relating to an item of property, plant and equipment that has already been recognized is added to the carrying amount of the asset when it is probable that future economic benefits, in excess of the originally assessed standard of performance of the existing asset, will flow to the Company as per recognition criteria. All other expenditure in the form of normal repair and maintenance is charged to profit and loss account as and when incurred.
An item of property, plant and equipment is derecognized upon disposal or when no future economic benefits are expected from its use or disposal. The gain or loss on disposal or retirement of an asset represented by the difference between the sale proceeds and the carrying amount of the asset is recognized as an income or expense.
NOTES TO THE FINANCIAL STATEMENTSFOR THE YEAR ENDED 31 DECEMBER 2017
51
Capital work in progress
Capital work in progress represents expenditure on property, plant and equipment in course of construction, installation and/or in transit. Transfers are made to relevant category of operating fixed assets as and when assets become available for use. Capital work in progress is stated at cost, less any identified impairment loss.
5.4 Intangible assets
Intangible assets acquired separately are measured on initial recognition at cost. Following initial recognition, intangible assets are carried at cost less any accumulated amortization and accumulated impairment losses, if any.
Intangible assets with finite lives are amortized over their useful economic life and assessed for impairment whenever there is an indication
that the intangible asset may be impaired. The amortization period and the amortization method for an intangible asset with a finite useful life are reviewed at least at each financial year end. Changes in the expected useful life or the expected pattern of consumption of future economic benefits embodied in the asset is accounted for by changing the amortization period or method, as appropriate, and are treated as changes in accounting estimates. The amortization expense on intangible assets with finite lives is recognized in the profit and loss account in the expense category consistent with the function of the intangible asset.
Gains or losses arising from de-recognition of an intangible asset, being the difference between the net disposal proceeds and the carrying amount of the asset, are recognized in the profit and loss account when the asset is derecognized.
5.5 Impairment of non-financial assets
At each balance sheet date, the carrying amount of assets (except for stores and spare parts and stock in trade) is reviewed to determine whether there is any indication that those assets have suffered an impairment loss. If any such indication exists the recoverable amount of the asset is estimated in order to determine the extent of the impairment loss, if any. Impairment losses are recognized as expense in the profit and loss account as incurred. The recoverable amount is higher of an asset’s fair value less cost to sell and value in use.
When conditions giving rise to impairment loss subsequently reverse, impairment loss is reversed and carrying amount of the asset is increased to the revised recoverable amount. Revised carrying amount is limited to carrying amount that would have been determined had no impairment loss been recognized for the asset in prior years. A reversal of impairment loss is recognized in profit and loss account.
5.6 Investments- Held to maturity
These represent investments with fixed maturity in respect of which Company has the positive intent and ability to hold till maturity. These are initially recognized at cost including transaction costs and are subsequently carried at amortized cost.
5.7 Stores and spare parts
These have been valued on the following basis subject to an estimated obsolescence reserve for net realizable value.
Purchased - at weighted average cost In transit - at actual cost
5.8 Stock in trade
These are stated at lower of cost and net realizable value. The methods used for calculation of cost are as follows:
Raw material
Own production - at weighted average cost Purchased - at weighted average cost In transit - at actual cost
Goods in process - at production cost
Finished goods Own production - at production cost on first in first out (FIFO) basis. Purchased - at actual cost on first in first out (FIFO) basis In transit - at actual cost
NOTES TO THE FINANCIAL STATEMENTSFOR THE YEAR ENDED 31 DECEMBER 2017
52
Cost is calculated as the cost of materials, direct labour and appropriate production overheads estimation based on normal capacity levels. Net realizable value is based on estimated selling price in the ordinary course of business less estimated cost to completion and estimated cost necessary to make the sale.
5.9 Provision for doubtful debts
A provision for doubtful debts / other receivables is based on management’s assessment of customers’ outstanding balances and credit worthiness. The amount of the provision is recognized in the statement of comprehensive income. Trade debts and other receivables are written off when considered irrecoverable.
5.10 Contingencies and commitments
Contingent liabilities are disclosed when:
• There is a possible obligation that arises from past events and whose existence will be confirmed only by the occurrence or non occurrence of one or more uncertain future events not wholly within the control of the Company.
• There is a present obligation that arises from past events but it is not probable that an outflow of resources embodying economic benefits will be required to settle the obligation or the amount of the obligation cannot be measured with sufficient reliability.
5.11 Foreign currency transactions and translations
Foreign currency transactions are recorded at the rate of exchange approximating those prevailing on the date of transactions. Monetary assets and liabilities in foreign currency are reported in Pak rupees at the rate of exchange approximating those prevailing at the balance sheet date. Foreign exchange gains and losses resulting from settlement of such transactions and from the translation at year end exchange rates of monetary assets and liabilities denominated in foreign currencies are recognized in the profit and loss account.
Foreign exchange gains and losses are presented in the profit and loss account within ‘other income’ and ‘other expenses’ respectively. 5.12 Borrowings
Borrowings are recognized initially at fair value, net of transaction costs incurred. Borrowings are subsequently carried at amortized cost; any difference between the proceeds (net of transaction costs) and the redemption value is recognized in the profit and loss account over the period of borrowings using the effective interest method.
5.13 Provisions
Provisions are recognized when the company has a present obligation as a result of a past event, it is probable that the Company will be required to settle the obligation, and a reliable estimate can be made of the amount of the obligation. The amount recognized as a provision is the best estimate of the consideration required to settle the present obligation at the end of the reporting period, taking into account the risks and uncertainties surrounding the obligation. Where a provision is made using the cash flows estimated to settle the present obligation, its carrying amount is the present value of those cash flows.
When some or all of the economic benefits required to settle a provision are expected to be recovered from a third party, a receivable is recognized as an asset if it is virtually certain that reimbursement will be received and the amount of the receivable can be measured reliably.
5.14 Revenue recognition
(i) Sale of goods - Wholesale
The Company manufactures, imports and sells a range of footwear products in the wholesale market. Sales of goods are recognized when the Company has delivered products to the wholesaler.
(ii) Sale of goods - Retail
The Company operates a chain of retail outlets for selling shoes and other products. Sales are recognized when product is sold to the customer. Sales are usually in cash or by credit card.
NOTES TO THE FINANCIAL STATEMENTSFOR THE YEAR ENDED 31 DECEMBER 2017
53
(iii) Loyalty Programmes
IFRIC 13 requires customer loyalty credits to be accounted for as a separate component of the sales transaction in which they are granted. A portion of the fair value of the consideration received is allocated to the award credits and deferred. This is then recognized as revenue over the period that the award credits are redeemed.
(iv) Profit on investments
Profit on investments is accounted for on accrual basis using effective interest method.
(v) Profit on bank deposits
Profit on bank deposits is accounted for on accrual basis. (vi) Operating lease arrangement
Rental income is recognized on accrual basis over the period of lease agreement.
5.15 Cash and cash equivalents
Cash and cash equivalents includes cash in hand, deposits with banks, other short term investments with original maturities of three months or less and bank overdrafts.
For the purposes of cash flow statement, cash and cash equivalents comprise of cash in hand, cash in transit, bank balances and short term investments.
5.16 Financial Instruments
Recognition and measurement
All the financial assets and liabilities are recognized at the time when the Company becomes a party to the contractual provisions of the instrument. All the financial assets and liabilities are initially measured at fair value. These financial assets and liabilities are subsequently measured at fair value or amortised cost as the case may be.
Major categories of financial assets represent investments, deposits, trade debts, other receivables, advances and cash and bank balances.
Financial liabilities are classified according to substance of the contractual arrangements entered into and mainly comprise of creditors, accrued expenses, deposits and other payables.
The Company derecognizes financial assets or a portion of financial assets when, and only when, the Company loses control of the contractual rights that comprise the financial asset or portion of financial asset. A financial liability or part of financial liability is de-recognized from the balance sheet when, and only when it is extinguished, i.e. when the obligation specified in the contract is discharged, cancelled or expires.
Any gain / (loss) on the recognition and de-recognition of the financial assets and liabilities is included in the profit and loss for the period in which they arise.
Held-to-maturity investments represent financial instruments which the Company has the positive intent and ability to hold to maturity. These are measured at amortized cost using the effective interest method, less any impairment.
5.17 Offsetting of financial assets and financial liabilities
A financial asset and liability is offset against each other and the net amount is reported in the balance sheet if the Company has a legally enforceable right to set off the recognized amounts and intends either to settle on net basis or to realize the asset and settle the liability simultaneously.
NOTES TO THE FINANCIAL STATEMENTSFOR THE YEAR ENDED 31 DECEMBER 2017
54
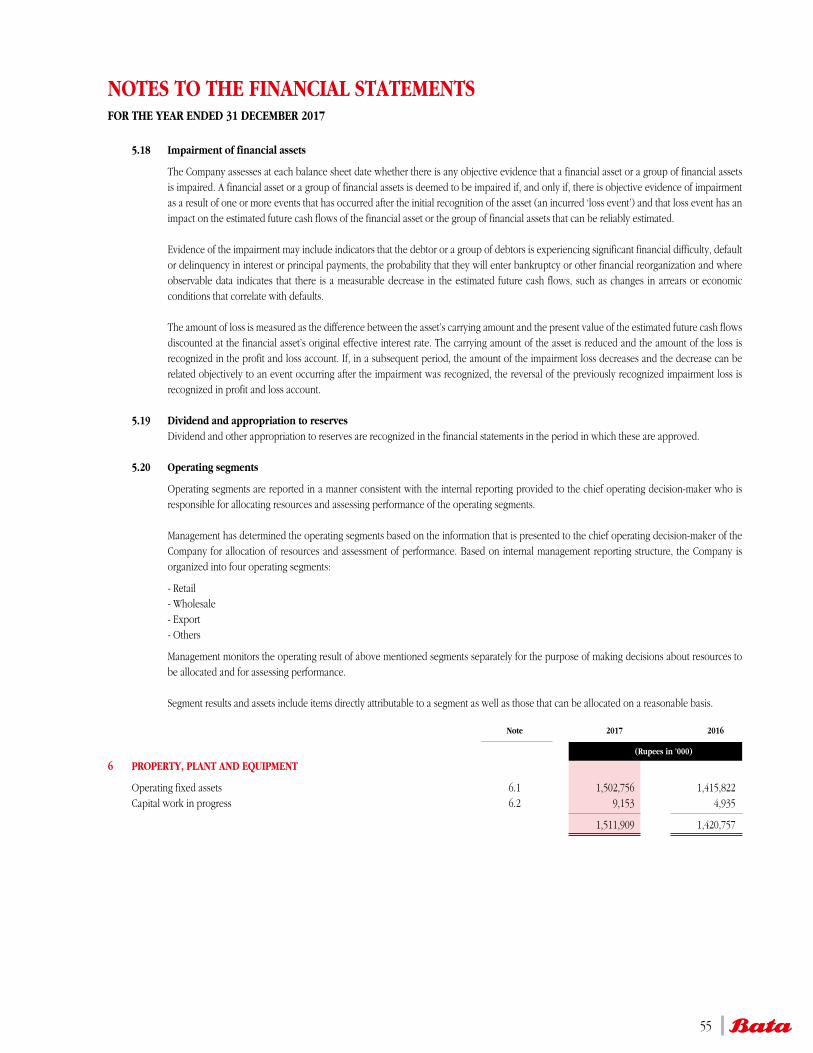
5.18 Impairment of financial assets
The Company assesses at each balance sheet date whether there is any objective evidence that a financial asset or a group of financial assets is impaired. A financial asset or a group of financial assets is deemed to be impaired if, and only if, there is objective evidence of impairment as a result of one or more events that has occurred after the initial recognition of the asset (an incurred ‘loss event’) and that loss event has an impact on the estimated future cash flows of the financial asset or the group of financial assets that can be reliably estimated.
Evidence of the impairment may include indicators that the debtor or a group of debtors is experiencing significant financial difficulty, default or delinquency in interest or principal payments, the probability that they will enter bankruptcy or other financial reorganization and where observable data indicates that there is a measurable decrease in the estimated future cash flows, such as changes in arrears or economic conditions that correlate with defaults.
The amount of loss is measured as the difference between the asset’s carrying amount and the present value of the estimated future cash flows discounted at the financial asset’s original effective interest rate. The carrying amount of the asset is reduced and the amount of the loss is recognized in the profit and loss account. If, in a subsequent period, the amount of the impairment loss decreases and the decrease can be related objectively to an event occurring after the impairment was recognized, the reversal of the previously recognized impairment loss is recognized in profit and loss account.
5.19 Dividend and appropriation to reserves Dividend and other appropriation to reserves are recognized in the financial statements in the period in which these are approved.
5.20 Operating segments
Operating segments are reported in a manner consistent with the internal reporting provided to the chief operating decision-maker who is responsible for allocating resources and assessing performance of the operating segments.
Management has determined the operating segments based on the information that is presented to the chief operating decision-maker of the Company for allocation of resources and assessment of performance. Based on internal management reporting structure, the Company is organized into four operating segments:
- Retail - Wholesale - Export - Others
Management monitors the operating result of above mentioned segments separately for the purpose of making decisions about resources to be allocated and for assessing performance.
Segment results and assets include items directly attributable to a segment as well as those that can be allocated on a reasonable basis.
Note 2017 2016
(Rupees in ’000)
6 PROPERTY, PLANT AND EQUIPMENT
Operating fixed assets 6.1 1,502,756 1,415,822 Capital work in progress 6.2 9,153 4,935
1,511,909 1,420,757
NOTES TO THE FINANCIAL STATEMENTSFOR THE YEAR ENDED 31 DECEMBER 2017
55
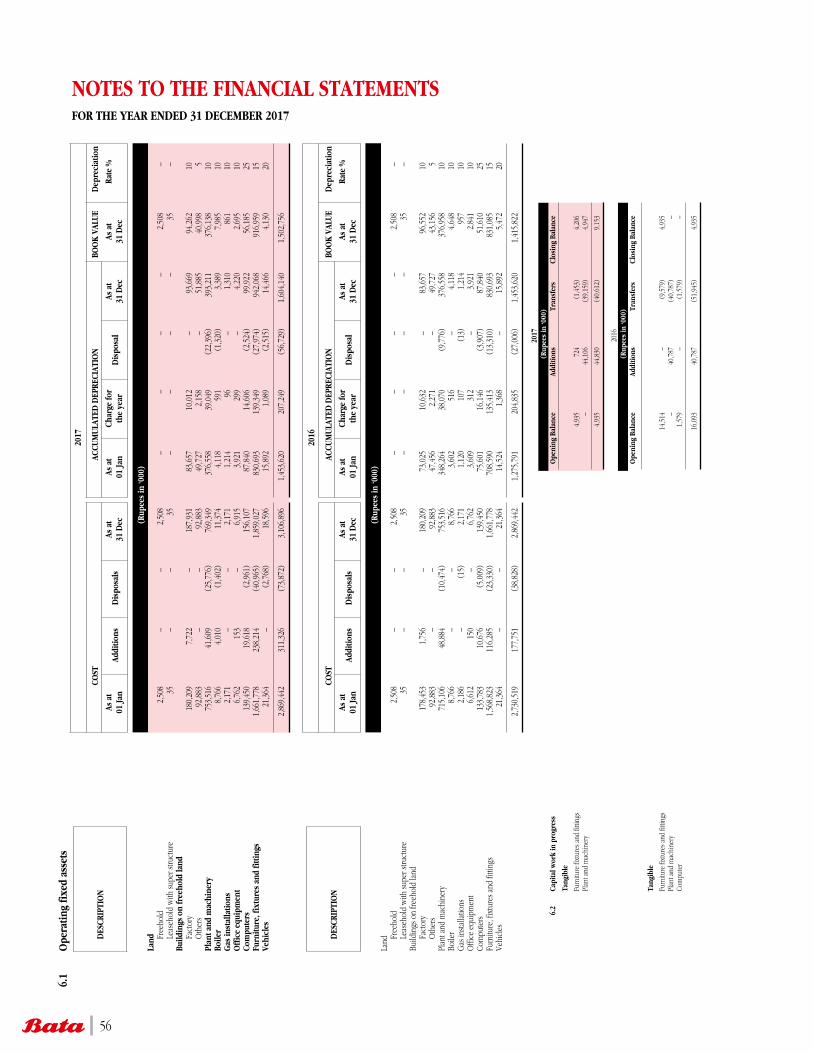
NOTES TO THE FINANCIAL STATEMENTS FOR THE YEAR ENDED 31 DECEMBER 2017
6.1
Ope
ratin
g fix
ed a
sset
s
2017
DES
CRIP
TIO
N
CO
ST
ACCU
MU
LATE
D D
EPRE
CIAT
ION
BOO
K V
ALU
E D
epre
ciat
ion
As
at
Addi
tions
D
ispo
sals
As
at
As a
t Ch
arge
for
D
ispo
sal
As a
t As
at
Rate
%
01 Ja
n
31
Dec
01
Jan
the
year
31 D
ec
31 D
ec
(R
upee
s in
‘000
)
Land
Fr
eeho
ld
2
,508
–
–
2
,508
–
–
–
–
2,
508
–
Leas
ehol
d w
ith su
per s
truct
ure
3
5
–
–
35
–
–
–
–
35
–
Build
ings
on
free
hold
land
Fa
ctor
y
180
,209
7
,722
–
187
,931
8
3,65
7
10,
012
–
93,6
69
94,2
62
10
O
ther
s
92,
883
–
–
9
2,88
3
49,
727
2
,158
–
51,8
85
40,9
98
5
Plan
t and
mac
hine
ry
7
53,5
16
41,
609
(2
5,77
6)
769
,349
3
76,5
58
39,
049
(2
2,39
6)
393,
211
376,
138
10
Boile
r
8,7
66
4,0
10
(1,4
02)
11,
374
4
,118
5
91
(1,3
20)
3,38
9 7,
985
10
Gas
inst
alla
tions
2,1
71
–
–
2,1
71
1,2
14
96
–
1,31
0 86
1 10
O
ffic
e eq
uipm
ent
6
,762
1
53
–
6
,915
3
,921
2
99
–
4,
220
2,69
5 10
Co
mpu
ters
139
,450
1
9,61
8
(2,9
61)
156
,107
8
7,84
0
14,
606
(2
,524
) 99
,922
56
,185
25
Fu
rnitu
re, f
ixtu
res
and
fittin
gs
1
,661
,778
2
38,2
14
(40,
965)
1
,859
,027
8
30,6
93
139
,349
(2
7,97
4)
942,
068
916,
959
15
Vehi
cles
21,
364
–
(2,7
68)
18,
596
1
5,89
2
1,0
89
(2,5
15)
14,4
66
4,13
0 20
2,86
9,44
2 3
11,3
26
(73,
872)
3,
106,
896
1,45
3,62
0 2
07,2
49
(56,
729)
1
,604
,140
1,
502,
756
20
16
DES
CRIP
TIO
N
CO
ST
ACCU
MU
LATE
D D
EPRE
CIAT
ION
BOO
K V
ALU
E D
epre
ciat
ion
As
at
Addi
tions
D
ispo
sals
As
at
As a
t Ch
arge
for
D
ispo
sal
As a
t As
at
Rate
%
01 Ja
n
31
Dec
01
Jan
the
year
31 D
ec
31 D
ec
(R
upee
s in
‘000
)
Land
Fr
eeho
ld
2
,508
–
–
2
,508
–
–
–
– 2,
508
–
Leas
ehol
d w
ith su
per s
truct
ure
3
5
–
–
35
–
–
–
– 35
–
Build
ings
on
freeh
old
land
Fa
ctor
y
178
,453
1
,756
–
180
,209
7
3,02
5
10,
632
–
83,6
57
96,5
52
10
O
ther
s
92,
883
–
–
9
2,88
3
47,
456
2
,271
–
49,7
27
43,1
56
5
Plan
t and
mac
hine
ry
7
15,1
06
48,
884
(1
0,47
4)
753
,516
3
48,2
64
38,
070
(9
,776
) 37
6,55
8 37
6,95
8 10
Bo
iler
8
,766
–
–
8
,766
3
,602
5
16
–
4,
118
4,64
8 10
G
as in
stalla
tions
2,1
86
–
(1
5)
2,1
71
1,1
20
107
(1
3)
1,21
4 95
7 10
O
ffice
equ
ipm
ent
6
,612
1
50
–
6
,762
3
,609
3
12
–
3,
921
2,84
1 10
Co
mpu
ters
133
,783
1
0,67
6
(5,0
09)
139
,450
7
5,60
1
16,
146
(3
,907
) 87
,840
51
,610
25
Fu
rnitu
re, f
ixtu
res a
nd fi
tting
s
1,5
68,8
23
116
,285
(2
3,33
0)
1,6
61,7
78
708
,590
1
35,4
13
(13,
310)
83
0,69
3 83
1,08
5 15
Ve
hicl
es
2
1,36
4
–
–
21,
364
1
4,52
4
1,3
68
–
15
,892
5,
472
20
2,73
0,51
9
177
,751
(3
8,82
8)
2,8
69,4
42
1,2
75,7
91
204
,835
(2
7,00
6)
1,4
53,6
20
1,4
15,8
22
20
17
(Rup
ees
in ‘0
00)
6.
2
Capi
tal w
ork
in p
rogr
ess
O
peni
ng B
alan
ce
Addi
tions
Tr
ansf
ers
Clos
ing
Bala
nce
Tang
ible
Furn
iture
fixt
ures
and
fitti
ngs
4,
935
7
24
(1,4
53)
4,2
06
Pl
ant a
nd m
achi
nery
–
4
4,10
6
(39,
159)
4
,947
4,
935
4
4,83
0
(40,
612)
9
,153
20
16
(R
upee
s in
‘000
)
O
peni
ng B
alan
ce
Addi
tions
Tr
ansf
ers
Clos
ing
Bala
nce
Tang
ible
Furn
iture
fixt
ures
and
fitti
ngs
14
,514
–
(9,5
79)
4,9
35
Plan
t and
mac
hine
ry
–
40,
787
(4
0,78
7)
–
Co
mpu
ter
1
,579
–
(1,5
79)
–
16,
093
4
0,78
7
(51,
945)
4
,935
56
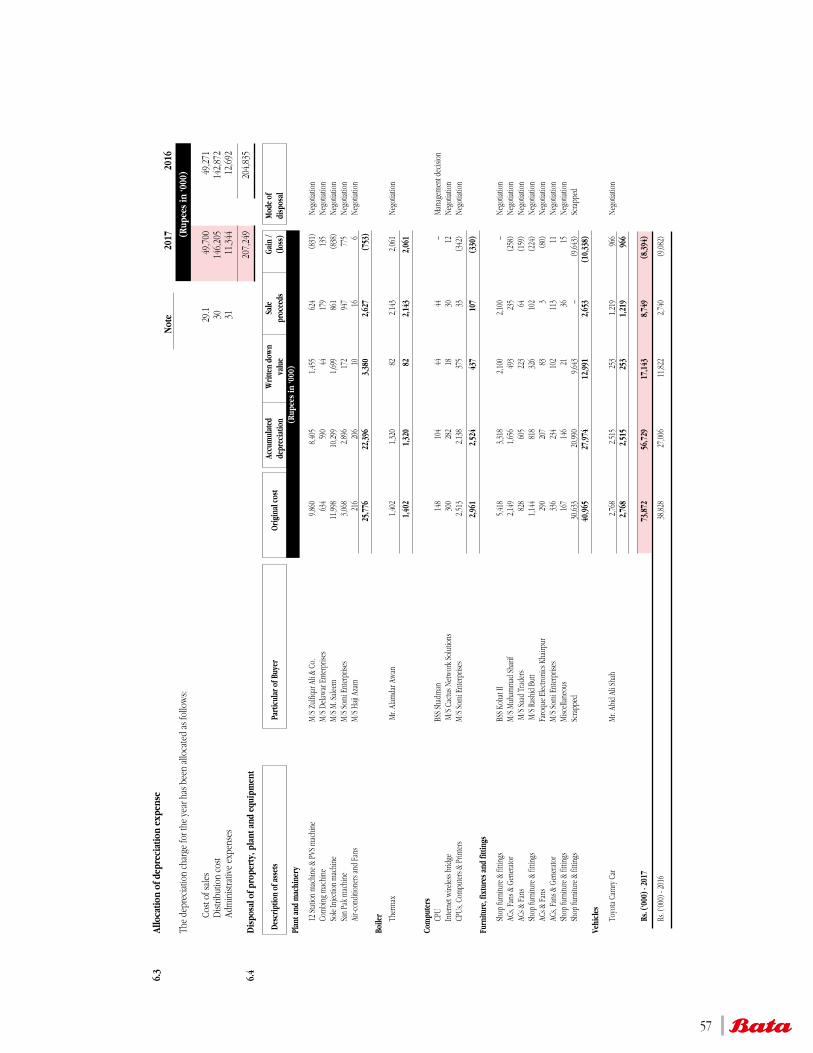
6.3
Allo
catio
n of
dep
reci
atio
n ex
pens
e
N
ote
2017
20
16
Th
e de
prec
iatio
n ch
arge
for t
he y
ear h
as b
een
allo
cate
d as
follo
ws:
(Rup
ees
in ‘0
00)
C
ost o
f sal
es
29.1
4
9,70
0
49,
271
Dist
ribut
ion
cost
30
146
,205
1
42,8
72
A
dmin
istra
tive
expe
nses
31
1
1,34
4
12,
692
2
07,2
49
204
,835
6.
4 D
ispo
sal o
f pro
pert
y, p
lant
and
equ
ipm
ent
Ac
cum
ulat
ed
Wri
tten
dow
n Sa
le
Gain
/ M
ode
of
Desc
ript
ion
of a
sset
s
Par
ticul
ar o
f Buy
er
Orig
inal
cos
t de
prec
iatio
n va
lue
proc
eeds
(lo
ss)
disp
osal
Pl
ant a
nd m
achi
nery
12 St
ation
mac
hine
& P
VS m
achi
ne
M/S
Zul
fiqar
Ali
& Co
. 9,
860
8,40
5 1,
455
624
(831
)
Nego
tiatio
n
Co
mbi
ng m
achi
ne
M/S
Dela
war
Ent
erpr
ises
634
590
44
179
135
Ne
gotia
tion
Sole
Injec
tion
mac
hine
M/S
M. S
aleem
11
,998
10,29
9 1,
699
861
(838
)
Nego
tiatio
n
Sa
n Pa
k m
achi
ne
M/S
Som
i Ent
erpr
ises
3,06
8 2,
896
172
947
775
Ne
gotia
tion
Air-c
ondi
tione
rs an
d Fa
ns
M/S
Haji
Aza
m
216
206
10
16
6
Ne
gotia
tion
25,
776
2
2,39
6
3,3
80
2,6
27
(753
)
Bo
iler
Ther
max
Mr.
Alam
dar A
wan
1,
402
1,32
0 82
2,
143
2,06
1
Nego
tiatio
n
1
,402
1
,320
8
2
2,1
43
2,0
61
Co
mpu
ters
CPU
BSS S
hadm
an
148
104
44
44
–
M
anag
emen
t dec
ision
Inte
rnet
wire
less b
ridge
M/S
Cac
tus N
etw
ork
Solu
tions
30
0 28
2 18
30
12
Nego
tiatio
n
CP
Us, C
ompu
ters
& Pr
inte
rs
M
/S So
mi E
nter
prise
s 2,
513
2,13
8 37
5 33
(3
42)
Ne
gotia
tion
2
,961
2
,524
4
37
107
(3
30)
Furn
iture
, fix
ture
s and
fitti
ngs
Shop
furn
iture
& fi
tting
s
BSS K
ohat
II 5,
418
3,31
8 2,
100
2,10
0 –
Nego
tiatio
n
AC
s, Fa
ns &
Gen
erato
r
M
/S M
uham
mad
Shar
if 2,
149
1,65
6 49
3 23
5 (2
58)
Ne
gotia
tion
ACs &
Fan
s
M/S
Saad
Tra
ders
828
605
223
64
(159
)
Nego
tiatio
n
Shop
furn
iture
& fi
tting
s
M/S
Ras
hid
Butt
1,14
4 81
8 32
6 10
2 (2
24)
Ne
gotia
tion
ACs &
Fan
s
Fa
roqu
e Elec
troni
cs K
hairp
ur
290
207
83
3
(80)
Nego
tiatio
n
AC
s, Fa
ns &
Gen
erato
r
M/S
Som
i Ent
erpr
ises
336
234
102
113
11
Ne
gotia
tion
Shop
furn
iture
& fi
tting
s
M
iscell
aneo
us
167
146
21
36
15
Ne
gotia
tion
Shop
furn
iture
& fi
tting
s
Sc
rapp
ed
30,63
3 20
,990
9,64
3 –
(9
,643)
Scra
pped
4
0,96
5
27,
974
1
2,99
1
2,6
53
(10,
338)
Ve
hicl
es
Toyo
ta Ca
mry
Car
M
r. Ab
id A
li Sh
ah
2,76
8 2,
515
253
1,21
9 96
6
Nego
tiatio
n
2,76
8
2,5
15
253
1
,219
9
66
Rs. (
‘000
) - 2
017
73,
872
56,7
29
17,
143
8
,749
(8
,394
)
Rs. (
‘000)
- 20
16
38,82
8 27
,006
11,82
2 2,7
40
(9,08
2)
(Rup
ees
in ‘0
00)
57
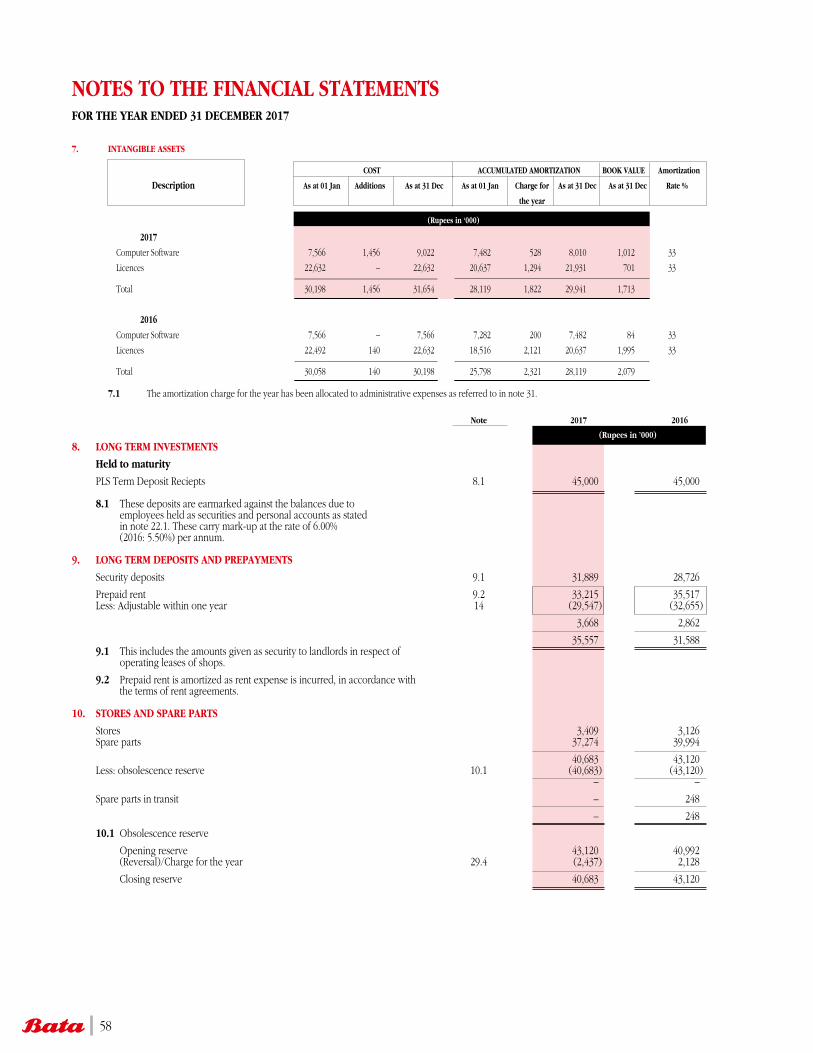
NOTES TO THE FINANCIAL STATEMENTSFOR THE YEAR ENDED 31 DECEMBER 2017
7. INTANGIBLE ASSETS 2010
COST ACCUMULATED AMORTIZATION BOOK VALUE Amortization
Description As at 01 Jan Additions As at 31 Dec As at 01 Jan Charge for As at 31 Dec As at 31 Dec Rate %
the year
(Rupees in ‘000)
2017
Computer Software 7,566 1,456 9,022 7,482 528 8,010 1,012 33
Licences 22,632 – 22,632 20,637 1,294 21,931 701 33
Total 30,198 1,456 31,654 28,119 1,822 29,941 1,713
2016
Computer Software 7,566 – 7,566 7,282 200 7,482 84 33
Licences 22,492 140 22,632 18,516 2,121 20,637 1,995 33
Total 30,058 140 30,198 25,798 2,321 28,119 2,079
7.1 The amortization charge for the year has been allocated to administrative expenses as referred to in note 31.
Note 2017 2016
(Rupees in ’000)8. LONG TERM INVESTMENTS
Held to maturity
PLS Term Deposit Reciepts 8.1 45,000 45,000
8.1 These deposits are earmarked against the balances due to employees held as securities and personal accounts as stated in note 22.1. These carry mark-up at the rate of 6.00% (2016: 5.50%) per annum.
9. LONG TERM DEPOSITS AND PREPAYMENTS
Security deposits 9.1 31,889 28,726
Prepaid rent 9.2 33,215 35,517 Less: Adjustable within one year 14 (29,547) (32,655)
3,668 2,862
35,557 31,588 9.1 This includes the amounts given as security to landlords in respect of operating leases of shops.
9.2 Prepaid rent is amortized as rent expense is incurred, in accordance with the terms of rent agreements.
10. STORES AND SPARE PARTS
Stores 3,409 3,126 Spare parts 37,274 39,994
40,683 43,120 Less: obsolescence reserve 10.1 (40,683) (43,120) – –
Spare parts in transit – 248
– 248
10.1 Obsolescence reserve
Opening reserve 43,120 40,992 (Reversal)/Charge for the year 29.4 (2,437) 2,128
Closing reserve 40,683 43,120
58

NOTES TO THE FINANCIAL STATEMENTSFOR THE YEAR ENDED 31 DECEMBER 2017
Note 2017 2016
(Rupees in ’000)11. STOCK IN TRADE
Raw material
In hand 104,899 98,261 In transit 71,197 71,398
176,096 169,659 Less: Provision for raw material 11.1 (12,406) (7,506)
163,690 162,153 Goods in process 11.2 49,498 40,996
Finished goods
Own production 1,319,515 1,166,576 Purchased 1,977,251 1,554,708
11.3 3,269,766 2,721,284 Less: Provision for slow moving and obsolete items 11.4 (27,600) (22,530)
3,269,166 2,698,754
3,482,354 2,901,903
11.1 Provision for raw material
Opening provision 7,506 5,898 Charge for the year 14,652 7,994 Reversal during the year (9,752) (6,386) Closing provision 12,406 7,506 11.2 This includes amounts aggregating to Rs. (‘000) 11,142 (2016: Rs. (‘000) 9,796) representing stock held by third parties. 11.3 This includes amounts aggregating to Rs. (‘000) 219,975 (2016: Rs. (‘000) 166,666) representing stock held by third parties.
11.4 Provision for slow moving and obsolete items
Opening provision 22,530 23,553 Charge for the year 27,284 22,497 Reversal during the year (22,214) (23,520) Closing provision 27,600 22,530
12. TRADE DEBTS - UNSECURED
Considered good Due from customers 12.1 1,561,668 1,333,464 Due from associated undertakings 12.2 1,967 2,597
1,563,635 1,336,061 Considered doubtful
Due from customers 12.3 30,527 30,110 Less: Provision for doubtful debts (30,527) (30,110) – –
1,563,635 1,336,061 12.1 These customers have no recent history of default. For age analysis of these trade debts, referred to Note 40.2.3.
12.2 Due from associated undertakings - unsecured
Empresas Comersiales S.a (Bata Peru) 1,765 1,319 Bata Shoe (Singapore) Pte Limited 202 1,278
1,967 2,597
12.2.1 Maximum aggregate amount due from associated undertakings at the end of any month in the year was Rs. (‘000) 1,967 (2016: Rs. (‘000) 6,753). No interest has been charged on the amounts due from associated undertakings.
59

NOTES TO THE FINANCIAL STATEMENTSFOR THE YEAR ENDED 31 DECEMBER 2017
Note 2017 2016
(Rupees in ’000)
12.3 Movement in the provision for doubtful debts is as follows:
Balance as at 01 January 30,110 25,359 Charge for the year 9,353 9,353 Reversals during the year (8,936) (4,602)
Balance as at 31 December 30,527 30,110
12.4 Aggregate amount due from Directors, Chief Executives and Executives of the Company is Rs. Nil (2016: Nil)
13. ADVANCES - UNSECURED
Considered Good, non-intresting bearing
Advances to employees 11,663 6,292 Advances to suppliers 31,846 18,460 Letters of Credit - Margin 388,915 –
432,424 24,752 Considered doubtful, non-interest bearing
Advances to suppliers – – Less: Provision for doubtful debts 13.3 – –
432,424 24,752
13.1 Aggregate amount due from Directors, Chief Executives and
Executives of the Company is Rs. Nil (2016: Rs. Nil)
13.2 Aggregate amount due from related parties is Rs. Nil (2016: Rs. Nil)
13.3 Provision for doubtful debds
Opening provision – 637 Reversals during the year – (637)
Closing provision – –
14. DEPOSITS AND SHORT TERM PREPAYMENTS
Deposits - Considered good, unsecured
Custom duty and taxes 643 1,125 Letters of guarantee - Margin 3,234 3,234 Others 6,253 4,360
10,130 8,719
Short term prepayments Current portion of long term prepaid rent 9 29,547 32,655
Prepaid sales tax 22,555 3,915 Other prepaid expenses 12,154 6,582
64,256 43,152
74,386 51,871
15. OTHER RECEIVABLES
Considered good - unsecured
Export rebates 5,989 5,456 Insurance claims 1,804 1,382 Advance tax 15.1 703,220 588,598 Others 15.2 10,623 7,533
721,636 602,969 Considered doubtful
Advance rent 1,584 1,584 Others 3,838 3,838
5,422 5,422 Less: Provision for doubtful balances 15.3 (5,422) (5,422)
– –
721,636 602,969
60
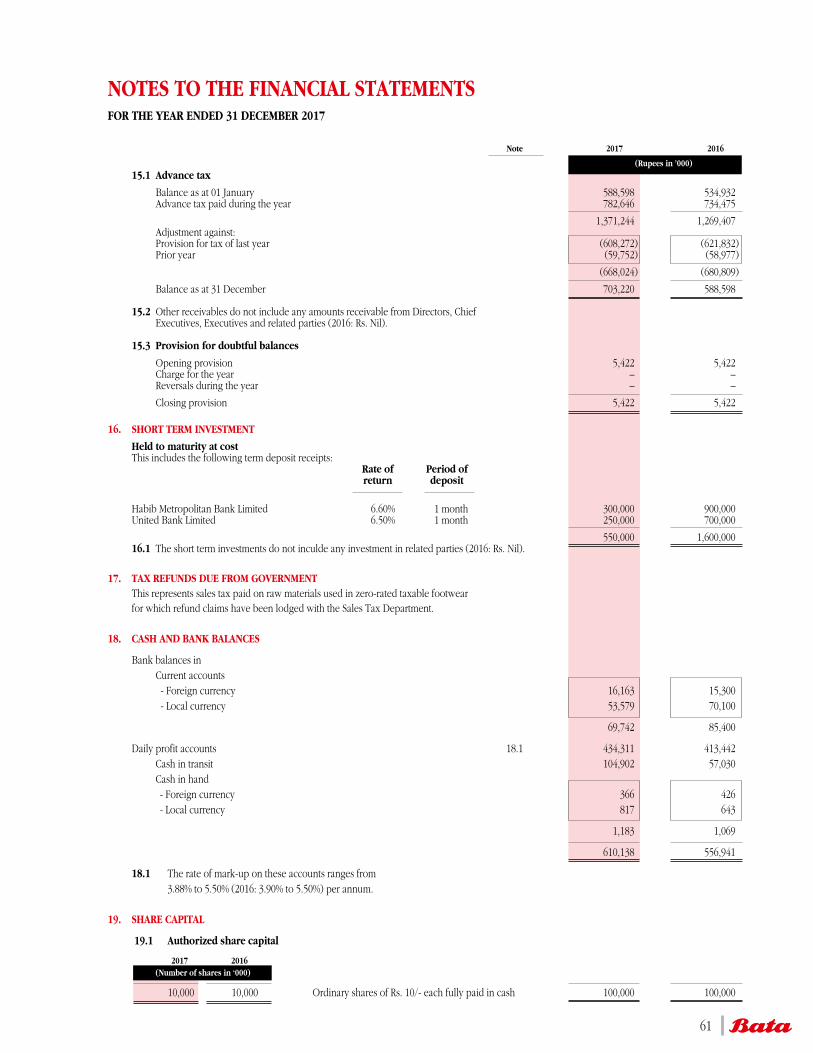
NOTES TO THE FINANCIAL STATEMENTSFOR THE YEAR ENDED 31 DECEMBER 2017
Note 2017 2016
(Rupees in ’000) 15.1 Advance tax
Balance as at 01 January 588,598 534,932 Advance tax paid during the year 782,646 734,475
1,371,244 1,269,407 Adjustment against: Provision for tax of last year (608,272) (621,832) Prior year (59,752) (58,977)
(668,024) (680,809)
Balance as at 31 December 703,220 588,598 15.2 Other receivables do not include any amounts receivable from Directors, Chief Executives, Executives and related parties (2016: Rs. Nil).
15.3 Provision for doubtful balances
Opening provision 5,422 5,422 Charge for the year – – Reversals during the year – –
Closing provision 5,422 5,422
16. SHORT TERM INVESTMENT
Held to maturity at cost This includes the following term deposit receipts: Rate of Period of return deposit
Habib Metropolitan Bank Limited 6.60% 1 month 300,000 900,000 United Bank Limited 6.50% 1 month 250,000 700,000
550,000 1,600,000 16.1 The short term investments do not inculde any investment in related parties (2016: Rs. Nil).
17. TAX REFUNDS DUE FROM GOVERNMENT This represents sales tax paid on raw materials used in zero-rated taxable footwear for which refund claims have been lodged with the Sales Tax Department.
18. CASH AND BANK BALANCES
Bank balances in Current accounts - Foreign currency 16,163 15,300 - Local currency 53,579 70,100
69,742 85,400
Daily profit accounts 18.1 434,311 413,442 Cash in transit 104,902 57,030 Cash in hand - Foreign currency 366 426 - Local currency 817 643
1,183 1,069
610,138 556,941
18.1 The rate of mark-up on these accounts ranges from 3.88% to 5.50% (2016: 3.90% to 5.50%) per annum.
19. SHARE CAPITAL
19.1 Authorized share capital
2017 2016
(Number of shares in ‘000)
10,000 10,000 Ordinary shares of Rs. 10/- each fully paid in cash 100,000 100,000
61
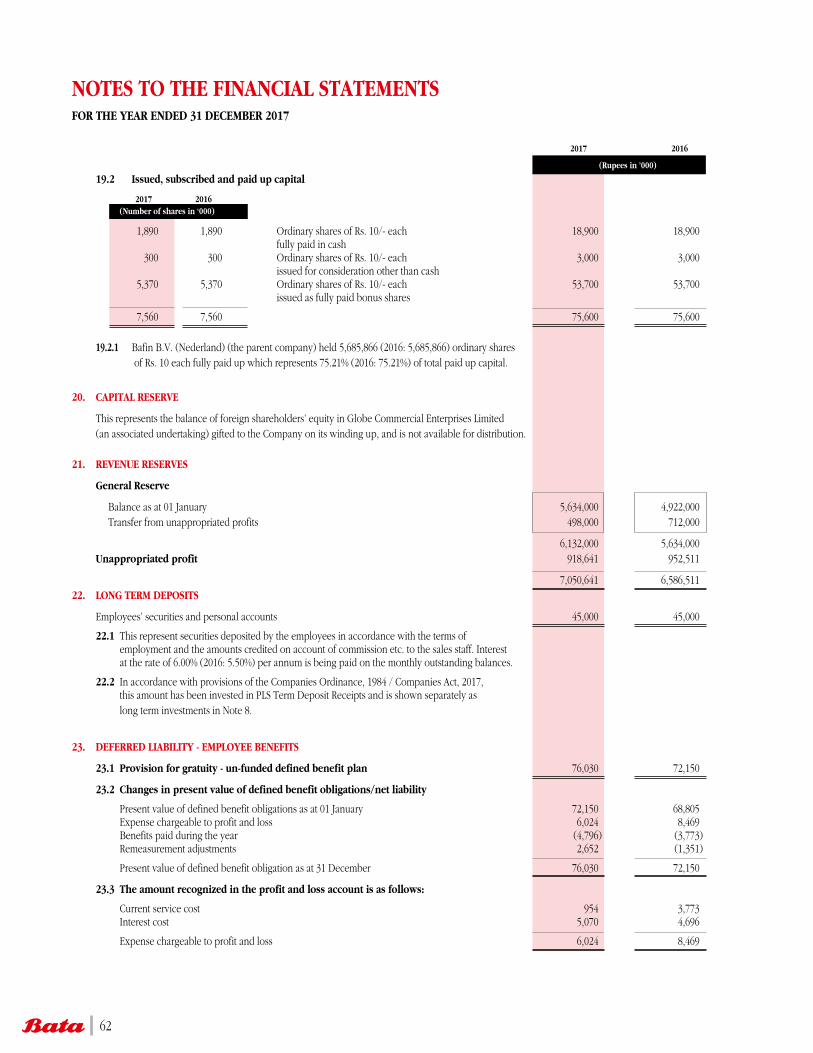
NOTES TO THE FINANCIAL STATEMENTSFOR THE YEAR ENDED 31 DECEMBER 2017
2017 2016
(Rupees in ’000)
19.2 Issued, subscribed and paid up capital
2017 2016
(Number of shares in ‘000)
1,890 1,890 Ordinary shares of Rs. 10/- each 18,900 18,900 fully paid in cash 300 300 Ordinary shares of Rs. 10/- each 3,000 3,000 issued for consideration other than cash 5,370 5,370 Ordinary shares of Rs. 10/- each 53,700 53,700 issued as fully paid bonus shares
7,560 7,560 75,600 75,600
19.2.1 Bafin B.V. (Nederland) (the parent company) held 5,685,866 (2016: 5,685,866) ordinary shares of Rs. 10 each fully paid up which represents 75.21% (2016: 75.21%) of total paid up capital.
20. CAPITAL RESERVE
This represents the balance of foreign shareholders’ equity in Globe Commercial Enterprises Limited (an associated undertaking) gifted to the Company on its winding up, and is not available for distribution.
21. REVENUE RESERVES
General Reserve
Balance as at 01 January 5,634,000 4,922,000 Transfer from unappropriated profits 498,000 712,000
6,132,000 5,634,000 Unappropriated profit 918,641 952,511
7,050,641 6,586,511 22. LONG TERM DEPOSITS
Employees’ securities and personal accounts 45,000 45,000
22.1 This represent securities deposited by the employees in accordance with the terms of employment and the amounts credited on account of commission etc. to the sales staff. Interest at the rate of 6.00% (2016: 5.50%) per annum is being paid on the monthly outstanding balances.
22.2 In accordance with provisions of the Companies Ordinance, 1984 / Companies Act, 2017, this amount has been invested in PLS Term Deposit Receipts and is shown separately as long term investments in Note 8.
23. DEFERRED LIABILITY - EMPLOYEE BENEFITS
23.1 Provision for gratuity - un-funded defined benefit plan 76,030 72,150
23.2 Changes in present value of defined benefit obligations/net liability
Present value of defined benefit obligations as at 01 January 72,150 68,805 Expense chargeable to profit and loss 6,024 8,469 Benefits paid during the year (4,796) (3,773) Remeasurement adjustments 2,652 (1,351)
Present value of defined benefit obligation as at 31 December 76,030 72,150
23.3 The amount recognized in the profit and loss account is as follows:
Current service cost 954 3,773 Interest cost 5,070 4,696
Expense chargeable to profit and loss 6,024 8,469
62

NOTES TO THE FINANCIAL STATEMENTSFOR THE YEAR ENDED 31 DECEMBER 2017
2017 2016
23.4 Principal actuarial assumptions The principal actuarial assumptions used in the actuarial valuation of this scheme by applying projected unit credit method as on 31 December are as follows: Expected rate of salary increase in future years 7.00% 6.25% Discount rate 8.00% 7.25% Expected mortality rate (Mortality table) SLIC 2001-2005 SLIC 2001-2005 Average duration of plan 3 years 3 years
23.5 Historical information
As at 31 December 2017 2016 2015 2014 2013
(Rupees in ‘000)
Present value of defined benefit obligation 76,030 72,150 68,805 53,135 54,424
Remeasurement adjustments on plan liabilities 2,652 (1,351) 10,289 (7,480) – Remeasurement adjustments on plan liabilities as a percentage of defined benefit obligation 3% 2% 15% 14% 0%
(Rupees in ’000)
23.6 Estimated expense to be charged to Profit and Loss in 2018
Current service cost 2,911 Interest cost on define benefit obligation 5,755 Amount chargeable to profit and loss 8,666
23.7 Sensitivity Analysis
Significant assumptions for the determination of the defined obligation are discount rate and expected salary increase. The sensitivity analysis below have been determined based on reasonably possible changes of the respective assumptions occuring at the end of the reporting period, while holding all other assumptions constant.
2017 2016
(Rupees in ’000)
23.8 Year and sesitivity analysis (± 50 bps) on defined benefit obligation
Discount rate + 50 bps (927) (2,372) Discount rate - 50 bps 1,068 2,540 Salary increase + 50 bps 747 841 Salary increase - 50 bps (771) (816)
24. DEFERRED TAXATION
Deferred tax liabilities Accelerated tax depreciation 92,819 89,307 Deferred tax assets Deferred Liability - Employee Benefits (20,528) (19,481) Stores and spare parts (10,985) (11,642) Stock in trade (10,801) (8,110) Trade debts (8,242) (8,130) Other debts (1,464) (1,464)
(52,020) (48,827)
Net deferred tax liability 40,799 40,480
63
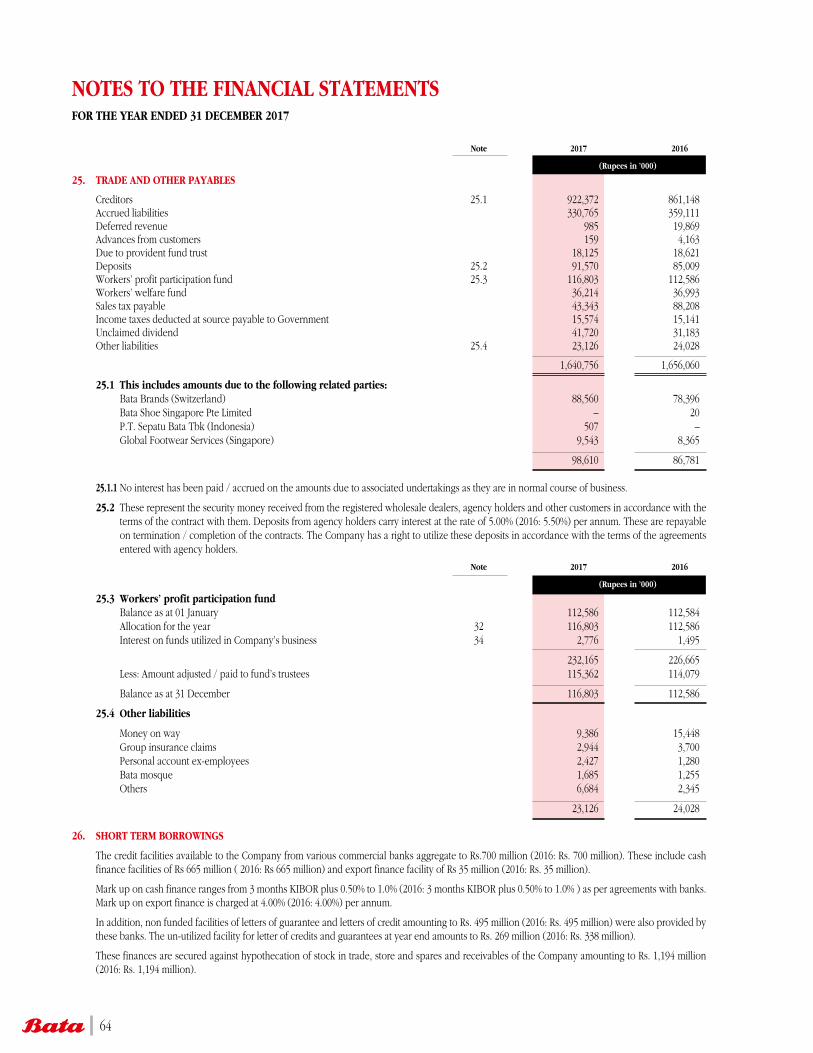
NOTES TO THE FINANCIAL STATEMENTSFOR THE YEAR ENDED 31 DECEMBER 2017
Note 2017 2016
(Rupees in ’000)
25. TRADE AND OTHER PAYABLES
Creditors 25.1 922,372 861,148 Accrued liabilities 330,765 359,111 Deferred revenue 985 19,869 Advances from customers 159 4,163 Due to provident fund trust 18,125 18,621 Deposits 25.2 91,570 85,009 Workers’ profit participation fund 25.3 116,803 112,586 Workers’ welfare fund 36,214 36,993 Sales tax payable 43,343 88,208 Income taxes deducted at source payable to Government 15,574 15,141 Unclaimed dividend 41,720 31,183 Other liabilities 25.4 23,126 24,028
1,640,756 1,656,060
25.1 This includes amounts due to the following related parties: Bata Brands (Switzerland) 88,560 78,396
Bata Shoe Singapore Pte Limited – 20 P.T. Sepatu Bata Tbk (Indonesia) 507 – Global Footwear Services (Singapore) 9,543 8,365
98,610 86,781
25.1.1 No interest has been paid / accrued on the amounts due to associated undertakings as they are in normal course of business.
25.2 These represent the security money received from the registered wholesale dealers, agency holders and other customers in accordance with the terms of the contract with them. Deposits from agency holders carry interest at the rate of 5.00% (2016: 5.50%) per annum. These are repayable on termination / completion of the contracts. The Company has a right to utilize these deposits in accordance with the terms of the agreements entered with agency holders.
Note 2017 2016
(Rupees in ’000)
25.3 Workers’ profit participation fund Balance as at 01 January 112,586 112,584 Allocation for the year 32 116,803 112,586 Interest on funds utilized in Company’s business 34 2,776 1,495
232,165 226,665 Less: Amount adjusted / paid to fund’s trustees 115,362 114,079
Balance as at 31 December 116,803 112,586
25.4 Other liabilities
Money on way 9,386 15,448 Group insurance claims 2,944 3,700 Personal account ex-employees 2,427 1,280 Bata mosque 1,685 1,255 Others 6,684 2,345
23,126 24,028
26. SHORT TERM BORROWINGS
The credit facilities available to the Company from various commercial banks aggregate to Rs.700 million (2016: Rs. 700 million). These include cash finance facilities of Rs 665 million ( 2016: Rs 665 million) and export finance facility of Rs 35 million (2016: Rs. 35 million).
Mark up on cash finance ranges from 3 months KIBOR plus 0.50% to 1.0% (2016: 3 months KIBOR plus 0.50% to 1.0% ) as per agreements with banks. Mark up on export finance is charged at 4.00% (2016: 4.00%) per annum.
In addition, non funded facilities of letters of guarantee and letters of credit amounting to Rs. 495 million (2016: Rs. 495 million) were also provided by these banks. The un-utilized facility for letter of credits and guarantees at year end amounts to Rs. 269 million (2016: Rs. 338 million).
These finances are secured against hypothecation of stock in trade, store and spares and receivables of the Company amounting to Rs. 1,194 million (2016: Rs. 1,194 million).
64
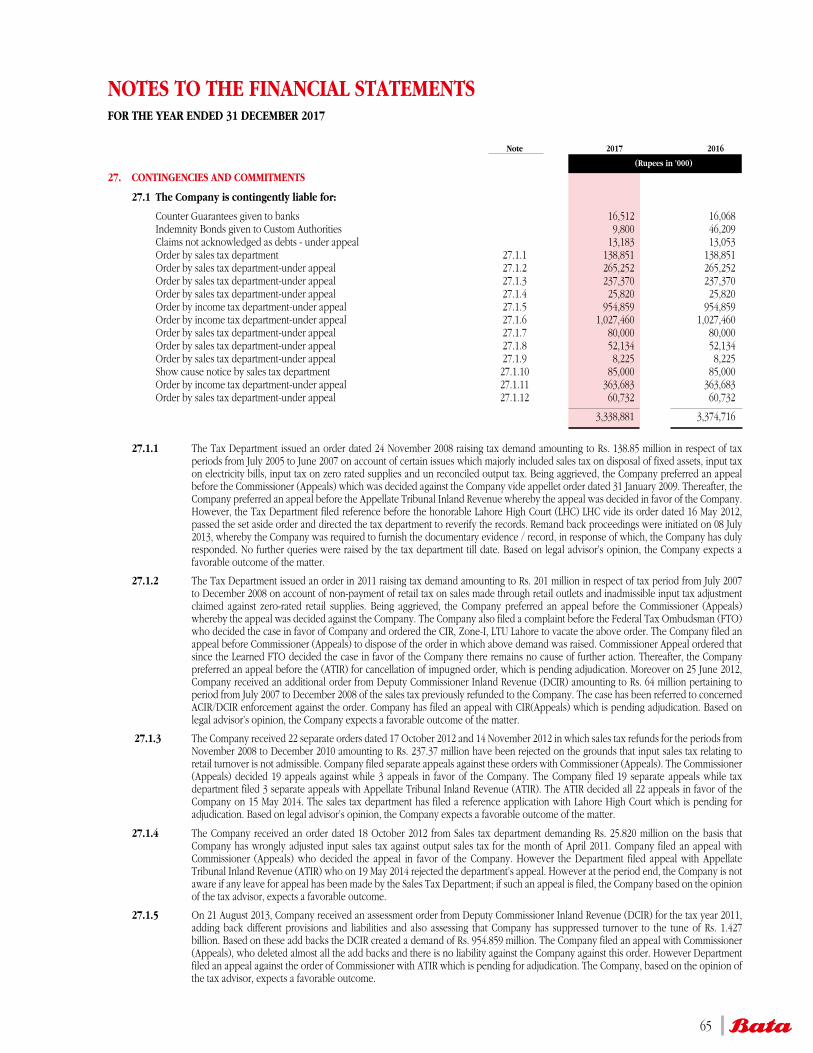
NOTES TO THE FINANCIAL STATEMENTSFOR THE YEAR ENDED 31 DECEMBER 2017
Note 2017 2016
(Rupees in ’000)
27. CONTINGENCIES AND COMMITMENTS
27.1 The Company is contingently liable for:
Counter Guarantees given to banks 16,512 16,068 Indemnity Bonds given to Custom Authorities 9,800 46,209 Claims not acknowledged as debts - under appeal 13,183 13,053 Order by sales tax department 27.1.1 138,851 138,851 Order by sales tax department-under appeal 27.1.2 265,252 265,252 Order by sales tax department-under appeal 27.1.3 237,370 237,370 Order by sales tax department-under appeal 27.1.4 25,820 25,820 Order by income tax department-under appeal 27.1.5 954,859 954,859 Order by income tax department-under appeal 27.1.6 1,027,460 1,027,460 Order by sales tax department-under appeal 27.1.7 80,000 80,000 Order by sales tax department-under appeal 27.1.8 52,134 52,134 Order by sales tax department-under appeal 27.1.9 8,225 8,225 Show cause notice by sales tax department 27.1.10 85,000 85,000 Order by income tax department-under appeal 27.1.11 363,683 363,683 Order by sales tax department-under appeal 27.1.12 60,732 60,732
3,338,881 3,374,716
27.1.1 The Tax Department issued an order dated 24 November 2008 raising tax demand amounting to Rs. 138.85 million in respect of tax periods from July 2005 to June 2007 on account of certain issues which majorly included sales tax on disposal of fixed assets, input tax on electricity bills, input tax on zero rated supplies and un reconciled output tax. Being aggrieved, the Company preferred an appeal before the Commissioner (Appeals) which was decided against the Company vide appellet order dated 31 January 2009. Thereafter, the Company preferred an appeal before the Appellate Tribunal Inland Revenue whereby the appeal was decided in favor of the Company. However, the Tax Department filed reference before the honorable Lahore High Court (LHC) LHC vide its order dated 16 May 2012, passed the set aside order and directed the tax department to reverify the records. Remand back proceedings were initiated on 08 July 2013, whereby the Company was required to furnish the documentary evidence / record, in response of which, the Company has duly responded. No further queries were raised by the tax department till date. Based on legal advisor’s opinion, the Company expects a favorable outcome of the matter.
27.1.2 The Tax Department issued an order in 2011 raising tax demand amounting to Rs. 201 million in respect of tax period from July 2007 to December 2008 on account of non-payment of retail tax on sales made through retail outlets and inadmissible input tax adjustment claimed against zero-rated retail supplies. Being aggrieved, the Company preferred an appeal before the Commissioner (Appeals) whereby the appeal was decided against the Company. The Company also filed a complaint before the Federal Tax Ombudsman (FTO) who decided the case in favor of Company and ordered the CIR, Zone-I, LTU Lahore to vacate the above order. The Company filed an appeal before Commissioner (Appeals) to dispose of the order in which above demand was raised. Commissioner Appeal ordered that since the Learned FTO decided the case in favor of the Company there remains no cause of further action. Thereafter, the Company preferred an appeal before the (ATIR) for cancellation of impugned order, which is pending adjudication. Moreover on 25 June 2012, Company received an additional order from Deputy Commissioner Inland Revenue (DCIR) amounting to Rs. 64 million pertaining to period from July 2007 to December 2008 of the sales tax previously refunded to the Company. The case has been referred to concerned ACIR/DCIR enforcement against the order. Company has filed an appeal with CIR(Appeals) which is pending adjudication. Based on legal advisor’s opinion, the Company expects a favorable outcome of the matter.
27.1.3 The Company received 22 separate orders dated 17 October 2012 and 14 November 2012 in which sales tax refunds for the periods from November 2008 to December 2010 amounting to Rs. 237.37 million have been rejected on the grounds that input sales tax relating to retail turnover is not admissible. Company filed separate appeals against these orders with Commissioner (Appeals). The Commissioner (Appeals) decided 19 appeals against while 3 appeals in favor of the Company. The Company filed 19 separate appeals while tax department filed 3 separate appeals with Appellate Tribunal Inland Revenue (ATIR). The ATIR decided all 22 appeals in favor of the Company on 15 May 2014. The sales tax department has filed a reference application with Lahore High Court which is pending for adjudication. Based on legal advisor’s opinion, the Company expects a favorable outcome of the matter.
27.1.4 The Company received an order dated 18 October 2012 from Sales tax department demanding Rs. 25.820 million on the basis that Company has wrongly adjusted input sales tax against output sales tax for the month of April 2011. Company filed an appeal with Commissioner (Appeals) who decided the appeal in favor of the Company. However the Department filed appeal with Appellate Tribunal Inland Revenue (ATIR) who on 19 May 2014 rejected the department’s appeal. However at the period end, the Company is not aware if any leave for appeal has been made by the Sales Tax Department; if such an appeal is filed, the Company based on the opinion of the tax advisor, expects a favorable outcome.
27.1.5 On 21 August 2013, Company received an assessment order from Deputy Commissioner Inland Revenue (DCIR) for the tax year 2011, adding back different provisions and liabilities and also assessing that Company has suppressed turnover to the tune of Rs. 1.427 billion. Based on these add backs the DCIR created a demand of Rs. 954.859 million. The Company filed an appeal with Commissioner (Appeals), who deleted almost all the add backs and there is no liability against the Company against this order. However Department filed an appeal against the order of Commissioner with ATIR which is pending for adjudication. The Company, based on the opinion of the tax advisor, expects a favorable outcome.
65
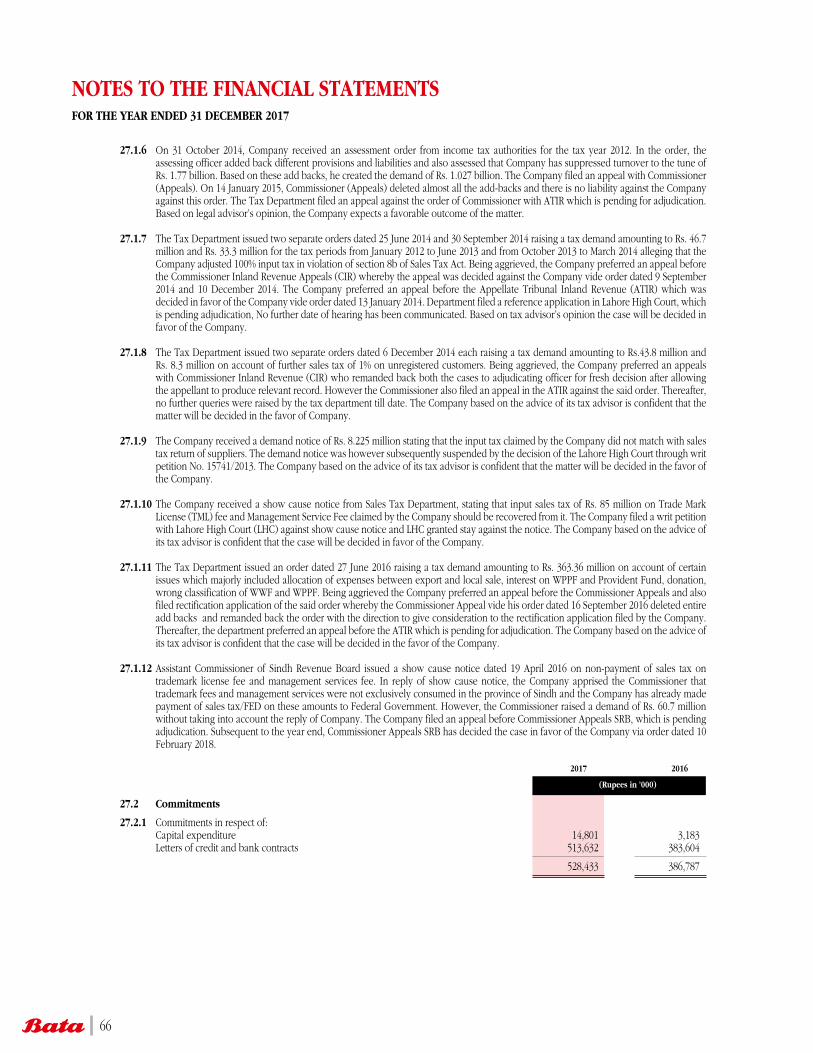
NOTES TO THE FINANCIAL STATEMENTSFOR THE YEAR ENDED 31 DECEMBER 2017
27.1.6 On 31 October 2014, Company received an assessment order from income tax authorities for the tax year 2012. In the order, the assessing officer added back different provisions and liabilities and also assessed that Company has suppressed turnover to the tune of Rs. 1.77 billion. Based on these add backs, he created the demand of Rs. 1.027 billion. The Company filed an appeal with Commissioner (Appeals). On 14 January 2015, Commissioner (Appeals) deleted almost all the add-backs and there is no liability against the Company against this order. The Tax Department filed an appeal against the order of Commissioner with ATIR which is pending for adjudication. Based on legal advisor’s opinion, the Company expects a favorable outcome of the matter.
27.1.7 The Tax Department issued two separate orders dated 25 June 2014 and 30 September 2014 raising a tax demand amounting to Rs. 46.7
million and Rs. 33.3 million for the tax periods from January 2012 to June 2013 and from October 2013 to March 2014 alleging that the Company adjusted 100% input tax in violation of section 8b of Sales Tax Act. Being aggrieved, the Company preferred an appeal before the Commissioner Inland Revenue Appeals (CIR) whereby the appeal was decided against the Company vide order dated 9 September 2014 and 10 December 2014. The Company preferred an appeal before the Appellate Tribunal Inland Revenue (ATIR) which was decided in favor of the Company vide order dated 13 January 2014. Department filed a reference application in Lahore High Court, which is pending adjudication, No further date of hearing has been communicated. Based on tax advisor’s opinion the case will be decided in favor of the Company.
27.1.8 The Tax Department issued two separate orders dated 6 December 2014 each raising a tax demand amounting to Rs.43.8 million and Rs. 8.3 million on account of further sales tax of 1% on unregistered customers. Being aggrieved, the Company preferred an appeals with Commissioner Inland Revenue (CIR) who remanded back both the cases to adjudicating officer for fresh decision after allowing the appellant to produce relevant record. However the Commissioner also filed an appeal in the ATIR against the said order. Thereafter, no further queries were raised by the tax department till date. The Company based on the advice of its tax advisor is confident that the matter will be decided in the favor of Company.
27.1.9 The Company received a demand notice of Rs. 8.225 million stating that the input tax claimed by the Company did not match with sales
tax return of suppliers. The demand notice was however subsequently suspended by the decision of the Lahore High Court through writ petition No. 15741/2013. The Company based on the advice of its tax advisor is confident that the matter will be decided in the favor of the Company.
27.1.10 The Company received a show cause notice from Sales Tax Department, stating that input sales tax of Rs. 85 million on Trade Mark License (TML) fee and Management Service Fee claimed by the Company should be recovered from it. The Company filed a writ petition with Lahore High Court (LHC) against show cause notice and LHC granted stay against the notice. The Company based on the advice of its tax advisor is confident that the case will be decided in favor of the Company.
27.1.11 The Tax Department issued an order dated 27 June 2016 raising a tax demand amounting to Rs. 363.36 million on account of certain issues which majorly included allocation of expenses between export and local sale, interest on WPPF and Provident Fund, donation, wrong classification of WWF and WPPF. Being aggrieved the Company preferred an appeal before the Commissioner Appeals and also filed rectification application of the said order whereby the Commissioner Appeal vide his order dated 16 September 2016 deleted entire add backs and remanded back the order with the direction to give consideration to the rectification application filed by the Company. Thereafter, the department preferred an appeal before the ATIR which is pending for adjudication. The Company based on the advice of its tax advisor is confident that the case will be decided in the favor of the Company.
27.1.12 Assistant Commissioner of Sindh Revenue Board issued a show cause notice dated 19 April 2016 on non-payment of sales tax on
trademark license fee and management services fee. In reply of show cause notice, the Company apprised the Commissioner that trademark fees and management services were not exclusively consumed in the province of Sindh and the Company has already made payment of sales tax/FED on these amounts to Federal Government. However, the Commissioner raised a demand of Rs. 60.7 million without taking into account the reply of Company. The Company filed an appeal before Commissioner Appeals SRB, which is pending adjudication. Subsequent to the year end, Commissioner Appeals SRB has decided the case in favor of the Company via order dated 10 February 2018.
2017 2016
(Rupees in ’000)
27.2 Commitments
27.2.1 Commitments in respect of: Capital expenditure 14,801 3,183 Letters of credit and bank contracts 513,632 383,604
528,433 386,787
66
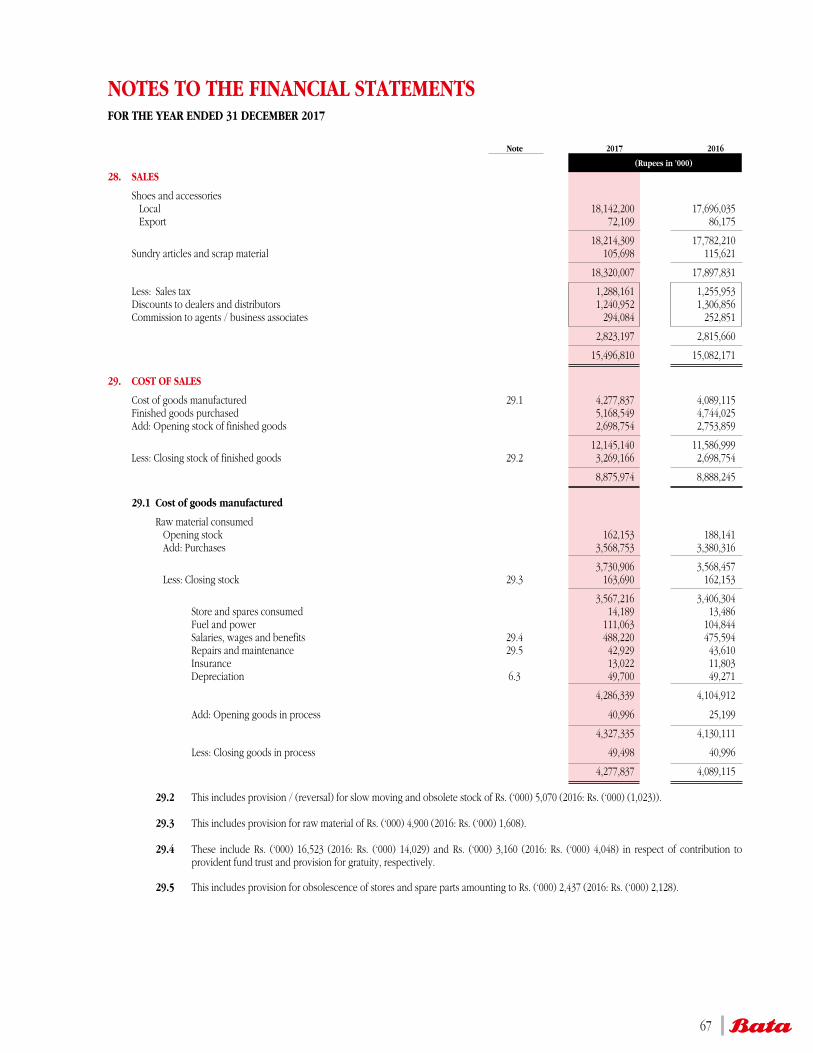
NOTES TO THE FINANCIAL STATEMENTSFOR THE YEAR ENDED 31 DECEMBER 2017
Note 2017 2016
(Rupees in ’000)
28. SALES
Shoes and accessories Local 18,142,200 17,696,035 Export 72,109 86,175
18,214,309 17,782,210 Sundry articles and scrap material 105,698 115,621
18,320,007 17,897,831
Less: Sales tax 1,288,161 1,255,953 Discounts to dealers and distributors 1,240,952 1,306,856 Commission to agents / business associates 294,084 252,851
2,823,197 2,815,660
15,496,810 15,082,171
29. COST OF SALES
Cost of goods manufactured 29.1 4,277,837 4,089,115 Finished goods purchased 5,168,549 4,744,025 Add: Opening stock of finished goods 2,698,754 2,753,859
12,145,140 11,586,999 Less: Closing stock of finished goods 29.2 3,269,166 2,698,754
8,875,974 8,888,245
29.1 Cost of goods manufactured
Raw material consumed Opening stock 162,153 188,141 Add: Purchases 3,568,753 3,380,316
3,730,906 3,568,457 Less: Closing stock 29.3 163,690 162,153
3,567,216 3,406,304 Store and spares consumed 14,189 13,486 Fuel and power 111,063 104,844 Salaries, wages and benefits 29.4 488,220 475,594 Repairs and maintenance 29.5 42,929 43,610 Insurance 13,022 11,803 Depreciation 6.3 49,700 49,271
4,286,339 4,104,912
Add: Opening goods in process 40,996 25,199
4,327,335 4,130,111
Less: Closing goods in process 49,498 40,996
4,277,837 4,089,115
29.2 This includes provision / (reversal) for slow moving and obsolete stock of Rs. (‘000) 5,070 (2016: Rs. (‘000) (1,023)).
29.3 This includes provision for raw material of Rs. (‘000) 4,900 (2016: Rs. (‘000) 1,608).
29.4 These include Rs. (‘000) 16,523 (2016: Rs. (‘000) 14,029) and Rs. (‘000) 3,160 (2016: Rs. (‘000) 4,048) in respect of contribution to provident fund trust and provision for gratuity, respectively.
29.5 This includes provision for obsolescence of stores and spare parts amounting to Rs. (‘000) 2,437 (2016: Rs. (‘000) 2,128).
67
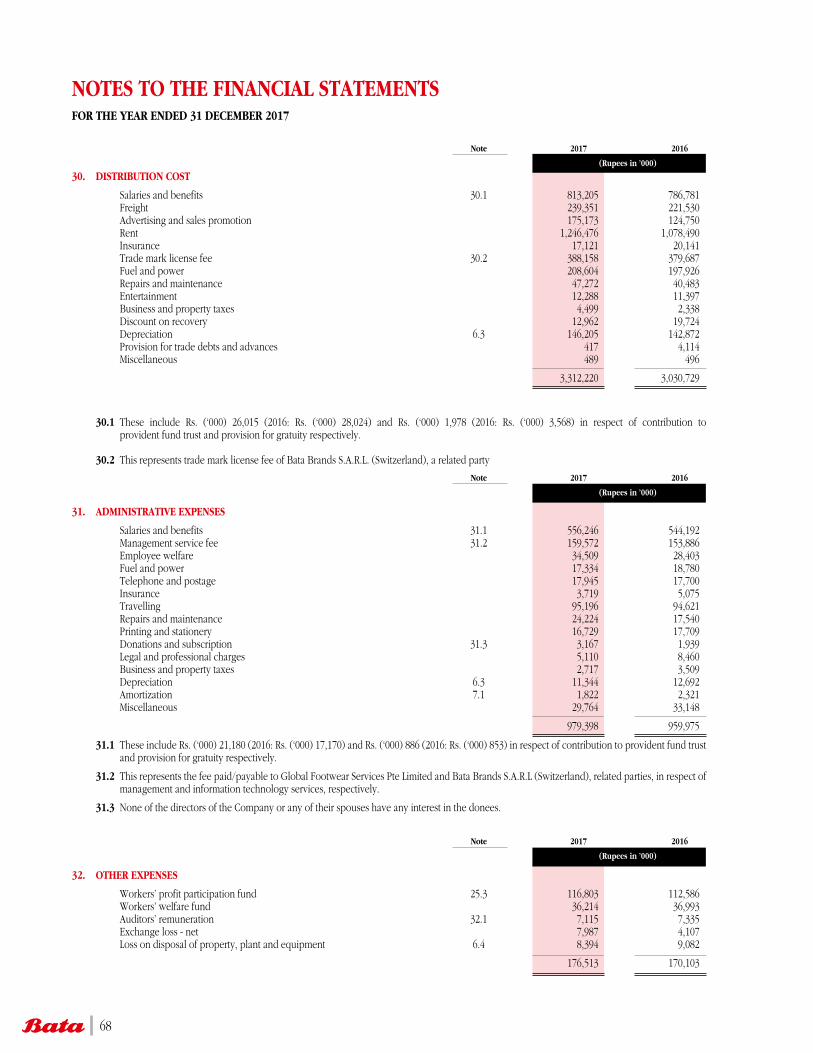
NOTES TO THE FINANCIAL STATEMENTSFOR THE YEAR ENDED 31 DECEMBER 2017
Note 2017 2016
(Rupees in ’000)
30. DISTRIBUTION COST
Salaries and benefits 30.1 813,205 786,781 Freight 239,351 221,530 Advertising and sales promotion 175,173 124,750 Rent 1,246,476 1,078,490 Insurance 17,121 20,141 Trade mark license fee 30.2 388,158 379,687 Fuel and power 208,604 197,926 Repairs and maintenance 47,272 40,483 Entertainment 12,288 11,397 Business and property taxes 4,499 2,338 Discount on recovery 12,962 19,724 Depreciation 6.3 146,205 142,872 Provision for trade debts and advances 417 4,114 Miscellaneous 489 496
3,312,220 3,030,729
30.1 These include Rs. (‘000) 26,015 (2016: Rs. (‘000) 28,024) and Rs. (‘000) 1,978 (2016: Rs. (‘000) 3,568) in respect of contribution to
provident fund trust and provision for gratuity respectively.
30.2 This represents trade mark license fee of Bata Brands S.A.R.L. (Switzerland), a related party
Note 2017 2016
(Rupees in ’000)
31. ADMINISTRATIVE EXPENSES
Salaries and benefits 31.1 556,246 544,192 Management service fee 31.2 159,572 153,886 Employee welfare 34,509 28,403 Fuel and power 17,334 18,780 Telephone and postage 17,945 17,700 Insurance 3,719 5,075 Travelling 95,196 94,621 Repairs and maintenance 24,224 17,540 Printing and stationery 16,729 17,709 Donations and subscription 31.3 3,167 1,939 Legal and professional charges 5,110 8,460 Business and property taxes 2,717 3,509 Depreciation 6.3 11,344 12,692 Amortization 7.1 1,822 2,321 Miscellaneous 29,764 33,148
979,398 959,975
31.1 These include Rs. (‘000) 21,180 (2016: Rs. (‘000) 17,170) and Rs. (‘000) 886 (2016: Rs. (‘000) 853) in respect of contribution to provident fund trust and provision for gratuity respectively.
31.2 This represents the fee paid/payable to Global Footwear Services Pte Limited and Bata Brands S.A.R.L (Switzerland), related parties, in respect of management and information technology services, respectively.
31.3 None of the directors of the Company or any of their spouses have any interest in the donees.
Note 2017 2016
(Rupees in ’000)
32. OTHER EXPENSES
Workers’ profit participation fund 25.3 116,803 112,586 Workers’ welfare fund 36,214 36,993 Auditors’ remuneration 32.1 7,115 7,335 Exchange loss - net 7,987 4,107 Loss on disposal of property, plant and equipment 6.4 8,394 9,082
176,513 170,103
68
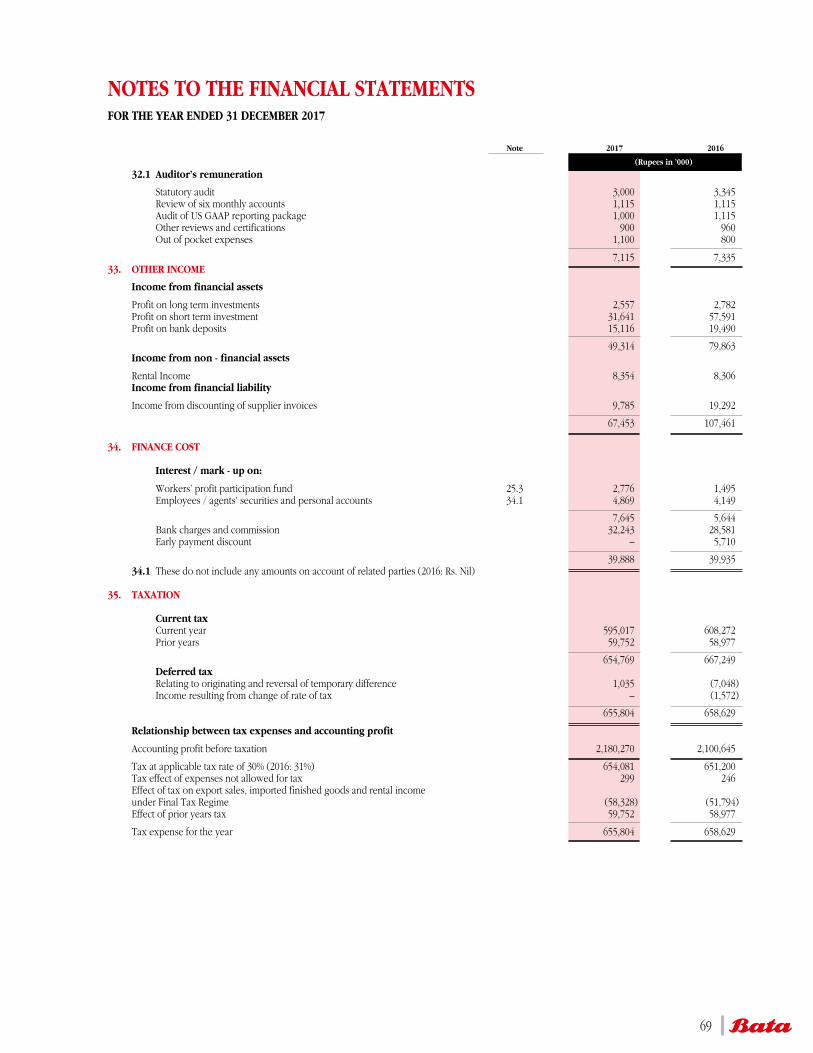
Note 2017 2016
(Rupees in ’000)
32.1 Auditor’s remuneration
Statutory audit 3,000 3,345 Review of six monthly accounts 1,115 1,115 Audit of US GAAP reporting package 1,000 1,115 Other reviews and certifications 900 960 Out of pocket expenses 1,100 800
7,115 7,335 33. OTHER INCOME
Income from financial assets
Profit on long term investments 2,557 2,782 Profit on short term investment 31,641 57,591 Profit on bank deposits 15,116 19,490
49,314 79,863 Income from non - financial assets
Rental Income 8,354 8,306 Income from financial liability
Income from discounting of supplier invoices 9,785 19,292
67,453 107,461 34. FINANCE COST
Interest / mark - up on:
Workers’ profit participation fund 25.3 2,776 1,495 Employees / agents’ securities and personal accounts 34.1 4,869 4,149
7,645 5,644 Bank charges and commission 32,243 28,581 Early payment discount – 5,710
39,888 39,935 34.1 These do not include any amounts on account of related parties (2016: Rs. Nil)
35. TAXATION
Current tax Current year 595,017 608,272 Prior years 59,752 58,977
654,769 667,249 Deferred tax Relating to originating and reversal of temporary difference 1,035 (7,048) Income resulting from change of rate of tax – (1,572)
655,804 658,629
Relationship between tax expenses and accounting profit
Accounting profit before taxation 2,180,270 2,100,645
Tax at applicable tax rate of 30% (2016: 31%) 654,081 651,200 Tax effect of expenses not allowed for tax 299 246 Effect of tax on export sales, imported finished goods and rental income under Final Tax Regime (58,328) (51,794) Effect of prior years tax 59,752 58,977
Tax expense for the year 655,804 658,629
NOTES TO THE FINANCIAL STATEMENTSFOR THE YEAR ENDED 31 DECEMBER 2017
69
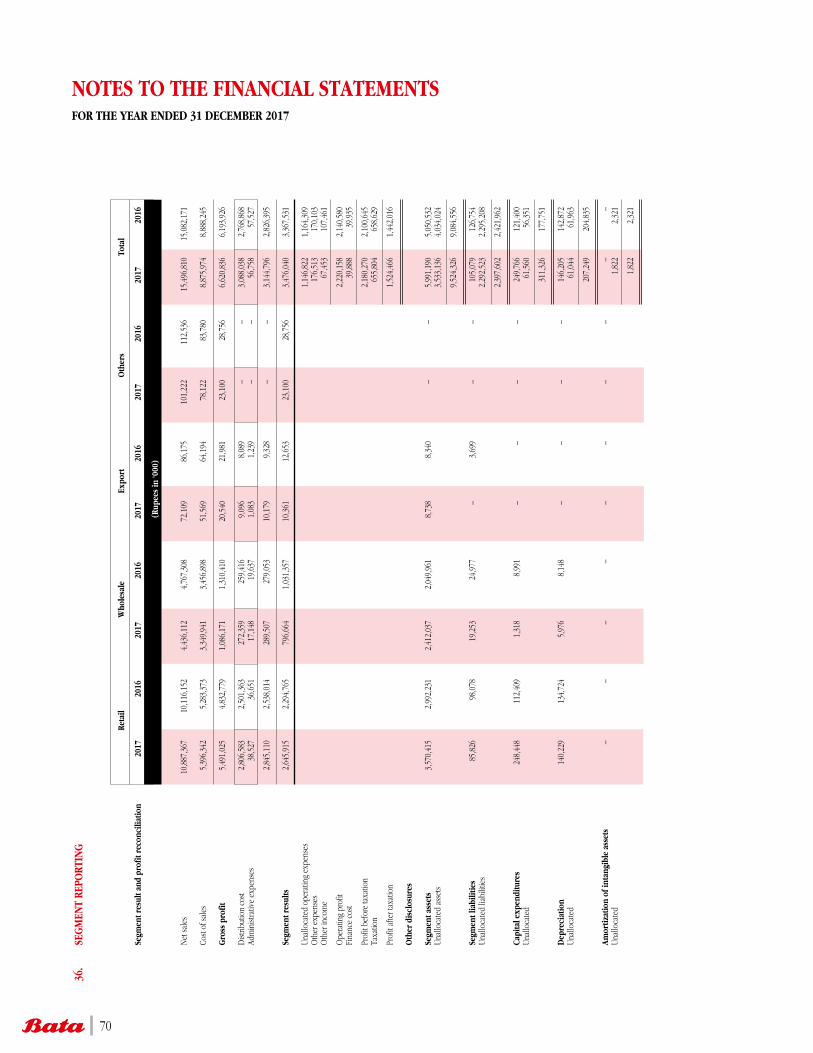
NOTES TO THE FINANCIAL STATEMENTSFOR THE YEAR ENDED 31 DECEMBER 2017
36.
SEG
MEN
T RE
PORT
ING
Re
tail
Who
lesa
le
Expo
rt
Oth
ers
Tota
l
Se
gmen
t res
ult a
nd p
rofit
rec
onci
liatio
n 20
17
2016
20
17
2016
20
17
2016
20
17
2016
20
17
2016
(R
upee
s in
‘000
)
N
et sa
les
10
,887
,367
1
0,11
6,15
2
4,4
36,1
12
4,7
67,3
08
72,
109
8
6,17
5
101
,222
1
12,5
36
15,
496,
810
1
5,08
2,17
1
Co
st of
sale
s
5,39
6,34
2
5,2
83,3
73
3,3
49,9
41
3,4
56,8
98
51,
569
6
4,19
4
78,
122
8
3,78
0
8,8
75,9
74
8,8
88,2
45
Gro
ss p
rofit
5,49
1,02
5
4,8
32,7
79
1,0
86,1
71
1,3
10,4
10
20,
540
2
1,98
1
23,
100
2
8,75
6
6,6
20,8
36
6,1
93,9
26
Dist
ribut
ion
cost
2,
806,
583
2
,501
,363
2
72,3
59
259
,416
9
,096
8
,089
–
–
3
,088
,038
2
,768
,868
Adm
inist
rativ
e ex
pens
es
3
8,52
7
36,
651
1
7,14
8
19,
637
1
,083
1
,239
–
–
5
6,75
8
57,
527
2,84
5,11
0
2,5
38,0
14
289
,507
2
79,0
53
10,
179
9
,328
–
–
3
,144
,796
2
,826
,395
Se
gmen
t res
ults
2,64
5,91
5
2,2
94,7
65
796
,664
1
,031
,357
1
0,36
1
12,
653
2
3,10
0
28,
756
3
,476
,040
3
,367
,531
U
nallo
cate
d op
erat
ing
expe
nses
1,14
6,82
2
1,1
64,3
09
O
ther
exp
ense
s
176,
513
1
70,1
03
O
ther
inco
me
6
7,45
3
107
,461
O
pera
ting
prof
it
2,22
0,15
8
2,1
40,5
80
Fi
nanc
e co
st
39,8
88
39,
935
Pr
ofit
befo
re ta
xatio
n
2,18
0,27
0
2,1
00,6
45
Ta
xatio
n
655
,804
6
58,6
29
Pr
ofit
afte
r tax
atio
n
1,52
4,46
6
1,4
42,0
16
Oth
er d
iscl
osur
es
Se
gmen
t ass
ets
3
,570
,415
2
,992
,231
2
,412
,037
2
,049
,961
8
,738
8
,340
–
–
5
,991
,190
5
,050
,532
Una
lloca
ted
asse
ts
3,53
3,13
6
4,0
34,0
24
9,52
4,32
6
9,0
84,5
56
Segm
ent l
iabi
litie
s
85,8
26
98,
078
1
9,25
3
24,
977
–
3,6
99
–
–
105
,079
1
26,7
54
U
nallo
cate
d lia
bilit
ies
2,
292,
523
2
,295
,208
2,39
7,60
2
2,4
21,9
62
Capi
tal e
xpen
ditu
res
2
48,4
48
112
,409
1
,318
8
,991
–
–
–
–
2
49,7
66
121
,400
Una
lloca
ted
6
1,56
0
56,
351
311,
326
1
77,7
51
Dep
reci
atio
n
140
,229
1
34,7
24
5,9
76
8,1
48
–
–
–
–
146
,205
1
42,8
72
U
nallo
cate
d
61,
044
6
1,96
3
207,
249
2
04,8
35
Amor
tizat
ion
of in
tang
ible
ass
ets
–
–
–
–
–
–
–
–
–
–
U
nallo
cate
d
1,82
2
2,3
21
1,82
2
2,3
21
70
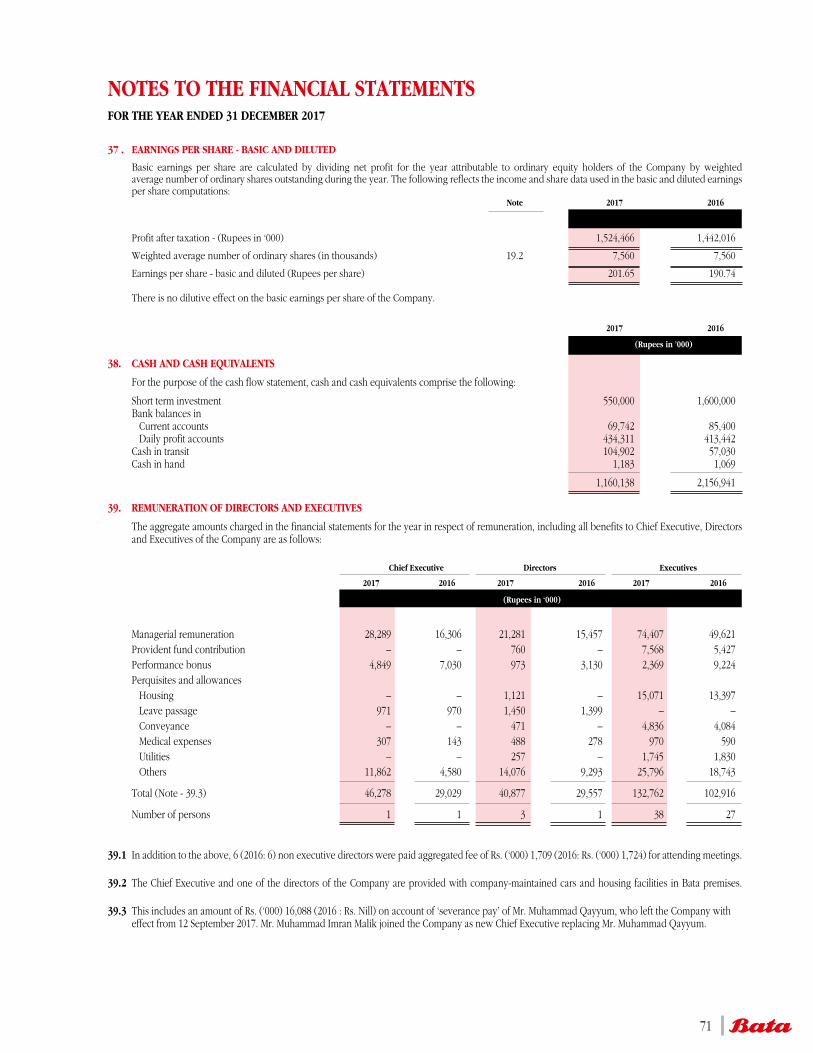
NOTES TO THE FINANCIAL STATEMENTSFOR THE YEAR ENDED 31 DECEMBER 2017
37 . EARNINGS PER SHARE - BASIC AND DILUTED
Basic earnings per share are calculated by dividing net profit for the year attributable to ordinary equity holders of the Company by weighted average number of ordinary shares outstanding during the year. The following reflects the income and share data used in the basic and diluted earnings per share computations: Note 2017 2016
Profit after taxation - (Rupees in ‘000) 1,524,466 1,442,016
Weighted average number of ordinary shares (in thousands) 19.2 7,560 7,560
Earnings per share - basic and diluted (Rupees per share) 201.65 190.74
There is no dilutive effect on the basic earnings per share of the Company.
2017 2016
(Rupees in ’000)
38. CASH AND CASH EQUIVALENTS
For the purpose of the cash flow statement, cash and cash equivalents comprise the following:
Short term investment 550,000 1,600,000 Bank balances in Current accounts 69,742 85,400 Daily profit accounts 434,311 413,442 Cash in transit 104,902 57,030 Cash in hand 1,183 1,069
1,160,138 2,156,941 39. REMUNERATION OF DIRECTORS AND EXECUTIVES
The aggregate amounts charged in the financial statements for the year in respect of remuneration, including all benefits to Chief Executive, Directors and Executives of the Company are as follows:
Chief Executive Directors Executives
2017 2016 2017 2016 2017 2016
(Rupees in ‘000)
Managerial remuneration 28,289 16,306 21,281 15,457 74,407 49,621 Provident fund contribution – – 760 – 7,568 5,427 Performance bonus 4,849 7,030 973 3,130 2,369 9,224 Perquisites and allowances Housing – – 1,121 – 15,071 13,397 Leave passage 971 970 1,450 1,399 – – Conveyance – – 471 – 4,836 4,084 Medical expenses 307 143 488 278 970 590 Utilities – – 257 – 1,745 1,830 Others 11,862 4,580 14,076 9,293 25,796 18,743
Total (Note - 39.3) 46,278 29,029 40,877 29,557 132,762 102,916
Number of persons 1 1 3 1 38 27 39.1 In addition to the above, 6 (2016: 6) non executive directors were paid aggregated fee of Rs. (‘000) 1,709 (2016: Rs. (‘000) 1,724) for attending meetings. 39.2 The Chief Executive and one of the directors of the Company are provided with company-maintained cars and housing facilities in Bata premises.
39.3 This includes an amount of Rs. (‘000) 16,088 (2016 : Rs. Nill) on account of ‘severance pay’ of Mr. Muhammad Qayyum, who left the Company with effect from 12 September 2017. Mr. Muhammad Imran Malik joined the Company as new Chief Executive replacing Mr. Muhammad Qayyum.
71
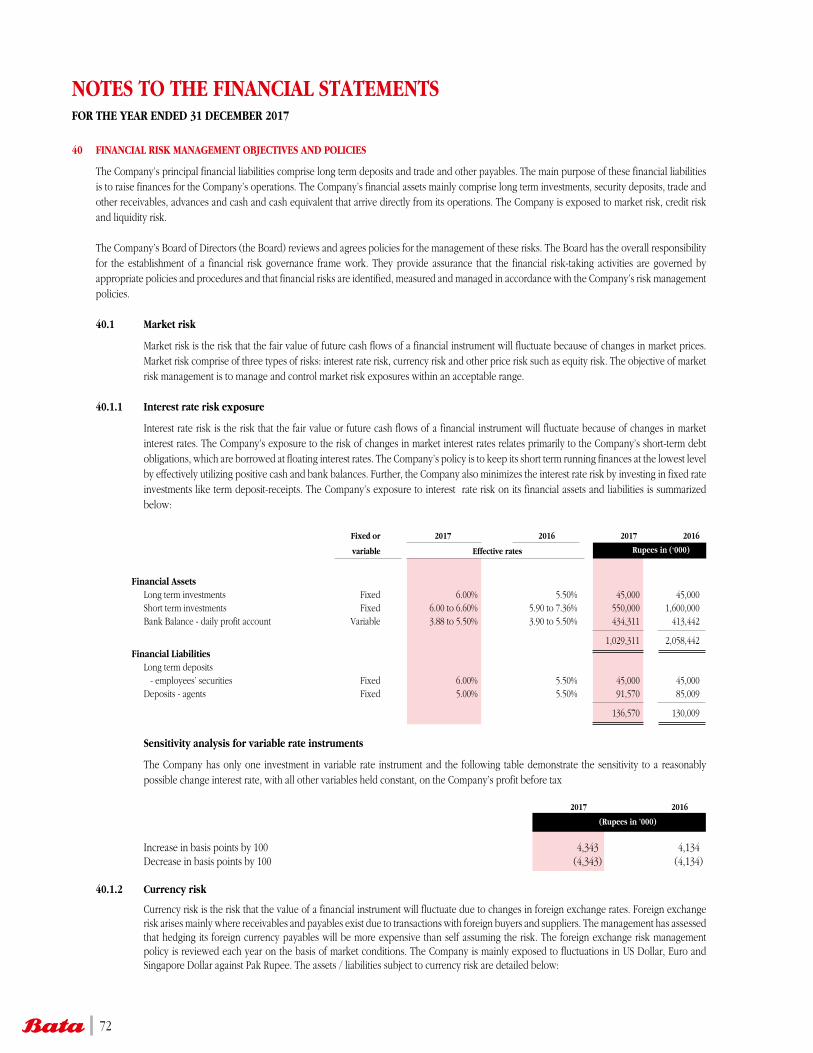
NOTES TO THE FINANCIAL STATEMENTSFOR THE YEAR ENDED 31 DECEMBER 2017
40 FINANCIAL RISK MANAGEMENT OBJECTIVES AND POLICIES
The Company’s principal financial liabilities comprise long term deposits and trade and other payables. The main purpose of these financial liabilities is to raise finances for the Company’s operations. The Company’s financial assets mainly comprise long term investments, security deposits, trade and other receivables, advances and cash and cash equivalent that arrive directly from its operations. The Company is exposed to market risk, credit risk and liquidity risk.
The Company’s Board of Directors (the Board) reviews and agrees policies for the management of these risks. The Board has the overall responsibility for the establishment of a financial risk governance frame work. They provide assurance that the financial risk-taking activities are governed by appropriate policies and procedures and that financial risks are identified, measured and managed in accordance with the Company’s risk management policies.
40.1 Market risk
Market risk is the risk that the fair value of future cash flows of a financial instrument will fluctuate because of changes in market prices. Market risk comprise of three types of risks: interest rate risk, currency risk and other price risk such as equity risk. The objective of market risk management is to manage and control market risk exposures within an acceptable range.
40.1.1 Interest rate risk exposure
Interest rate risk is the risk that the fair value or future cash flows of a financial instrument will fluctuate because of changes in market interest rates. The Company’s exposure to the risk of changes in market interest rates relates primarily to the Company’s short-term debt obligations, which are borrowed at floating interest rates. The Company’s policy is to keep its short term running finances at the lowest level by effectively utilizing positive cash and bank balances. Further, the Company also minimizes the interest rate risk by investing in fixed rate investments like term deposit-receipts. The Company’s exposure to interest rate risk on its financial assets and liabilities is summarized below:
Fixed or 2017 2016 2017 2016
variable Effective rates Rupees in (‘000)
Financial Assets Long term investments Fixed 6.00% 5.50% 45,000 45,000 Short term investments Fixed 6.00 to 6.60% 5.90 to 7.36% 550,000 1,600,000 Bank Balance - daily profit account Variable 3.88 to 5.50% 3.90 to 5.50% 434,311 413,442
1,029,311 2,058,442 Financial Liabilities Long term deposits - employees’ securities Fixed 6.00% 5.50% 45,000 45,000 Deposits - agents Fixed 5.00% 5.50% 91,570 85,009
136,570 130,009
Sensitivity analysis for variable rate instruments
The Company has only one investment in variable rate instrument and the following table demonstrate the sensitivity to a reasonably possible change interest rate, with all other variables held constant, on the Company’s profit before tax
2017 2016
(Rupees in ’000)
Increase in basis points by 100 4,343 4,134 Decrease in basis points by 100 (4,343) (4,134) 40.1.2 Currency risk
Currency risk is the risk that the value of a financial instrument will fluctuate due to changes in foreign exchange rates. Foreign exchange risk arises mainly where receivables and payables exist due to transactions with foreign buyers and suppliers. The management has assessed that hedging its foreign currency payables will be more expensive than self assuming the risk. The foreign exchange risk management policy is reviewed each year on the basis of market conditions. The Company is mainly exposed to fluctuations in US Dollar, Euro and Singapore Dollar against Pak Rupee. The assets / liabilities subject to currency risk are detailed below:
72
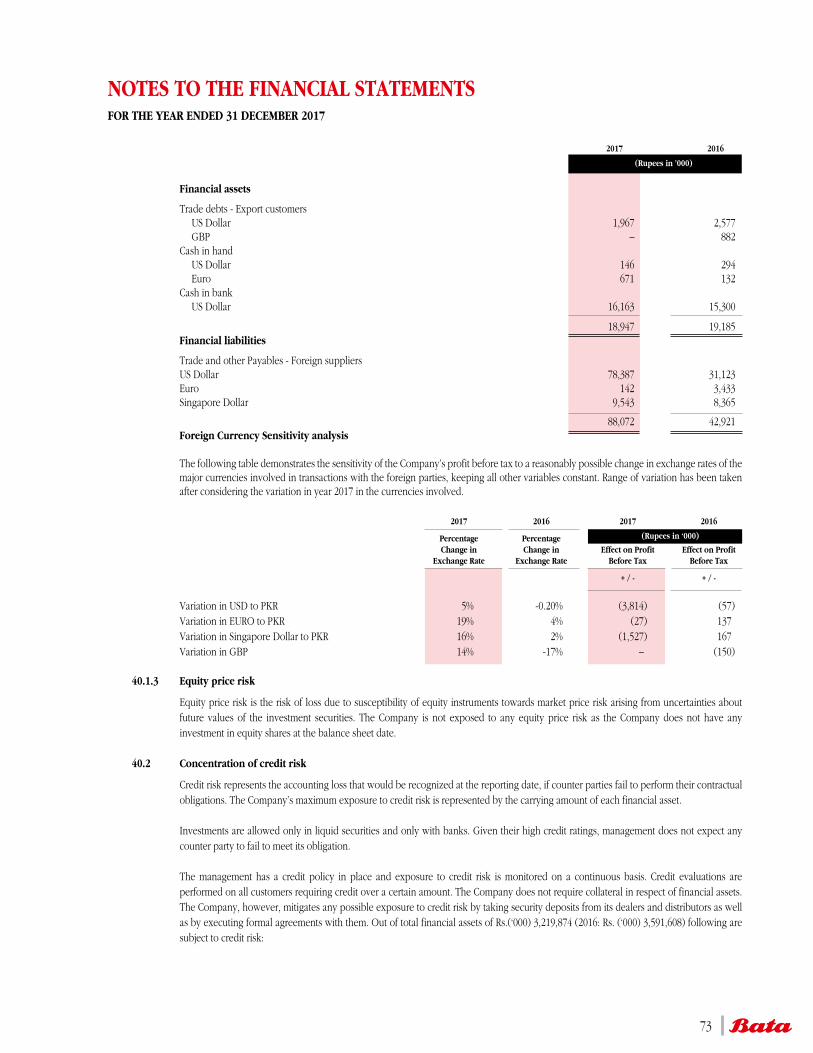
NOTES TO THE FINANCIAL STATEMENTSFOR THE YEAR ENDED 31 DECEMBER 2017
2017 2016
(Rupees in ’000)
Financial assets
Trade debts - Export customers US Dollar 1,967 2,577 GBP – 882 Cash in hand US Dollar 146 294 Euro 671 132 Cash in bank US Dollar 16,163 15,300
18,947 19,185 Financial liabilities
Trade and other Payables - Foreign suppliers US Dollar 78,387 31,123 Euro 142 3,433 Singapore Dollar 9,543 8,365
88,072 42,921 Foreign Currency Sensitivity analysis The following table demonstrates the sensitivity of the Company’s profit before tax to a reasonably possible change in exchange rates of the
major currencies involved in transactions with the foreign parties, keeping all other variables constant. Range of variation has been taken after considering the variation in year 2017 in the currencies involved.
2017 2016 2017 2016
Percentage Percentage (Rupees in ‘000)
Change in Change in Effect on Profit Effect on Profit Exchange Rate Exchange Rate Before Tax Before Tax
+ / - + / -
Variation in USD to PKR 5% -0.20% (3,814) (57) Variation in EURO to PKR 19% 4% (27) 137 Variation in Singapore Dollar to PKR 16% 2% (1,527) 167 Variation in GBP 14% -17% – (150)
40.1.3 Equity price risk
Equity price risk is the risk of loss due to susceptibility of equity instruments towards market price risk arising from uncertainties about future values of the investment securities. The Company is not exposed to any equity price risk as the Company does not have any investment in equity shares at the balance sheet date.
40.2 Concentration of credit risk
Credit risk represents the accounting loss that would be recognized at the reporting date, if counter parties fail to perform their contractual obligations. The Company’s maximum exposure to credit risk is represented by the carrying amount of each financial asset.
Investments are allowed only in liquid securities and only with banks. Given their high credit ratings, management does not expect any counter party to fail to meet its obligation.
The management has a credit policy in place and exposure to credit risk is monitored on a continuous basis. Credit evaluations are performed on all customers requiring credit over a certain amount. The Company does not require collateral in respect of financial assets. The Company, however, mitigates any possible exposure to credit risk by taking security deposits from its dealers and distributors as well as by executing formal agreements with them. Out of total financial assets of Rs.(‘000) 3,219,874 (2016: Rs. (‘000) 3,591,608) following are subject to credit risk:
73
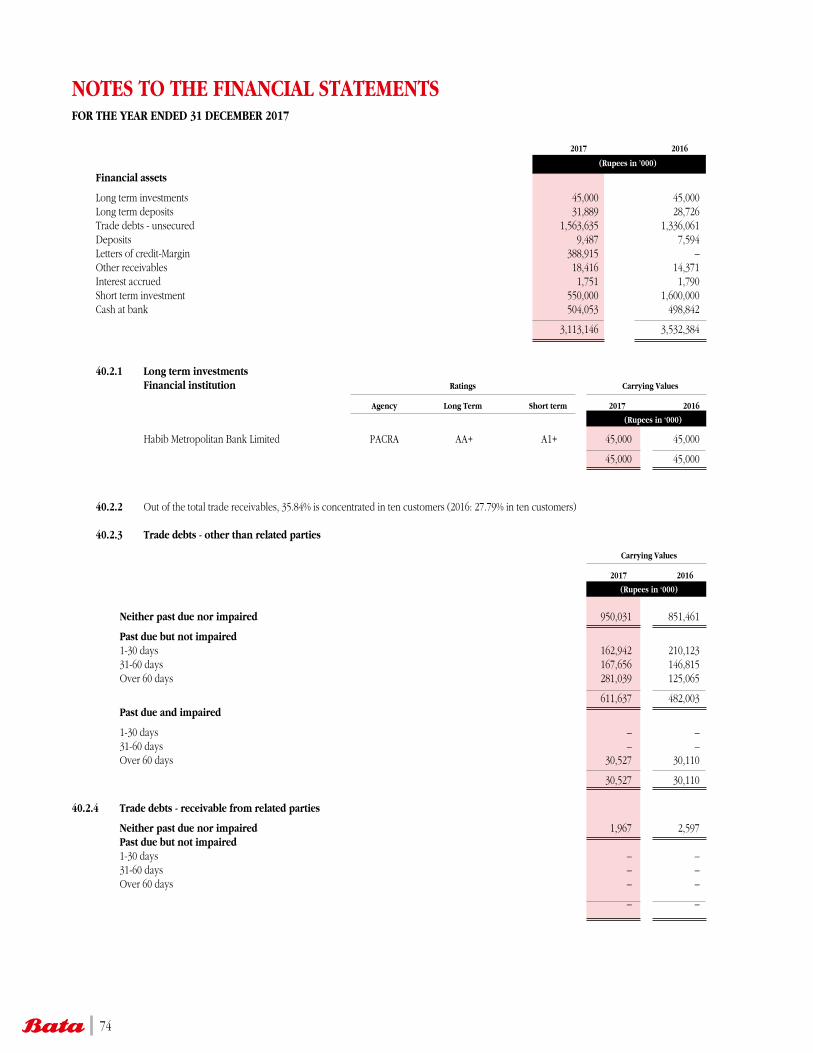
NOTES TO THE FINANCIAL STATEMENTSFOR THE YEAR ENDED 31 DECEMBER 2017
2017 2016
(Rupees in ’000)
Financial assets
Long term investments 45,000 45,000 Long term deposits 31,889 28,726 Trade debts - unsecured 1,563,635 1,336,061 Deposits 9,487 7,594 Letters of credit-Margin 388,915 – Other receivables 18,416 14,371 Interest accrued 1,751 1,790 Short term investment 550,000 1,600,000 Cash at bank 504,053 498,842
3,113,146 3,532,384
40.2.1 Long term investments Financial institution Ratings Carrying Values
Agency Long Term Short term 2017 2016
(Rupees in ‘000)
Habib Metropolitan Bank Limited PACRA AA+ A1+ 45,000 45,000
45,000 45,000
40.2.2 Out of the total trade receivables, 35.84% is concentrated in ten customers (2016: 27.79% in ten customers) 40.2.3 Trade debts - other than related parties
Carrying Values
2017 2016
(Rupees in ‘000)
Neither past due nor impaired 950,031 851,461
Past due but not impaired 1-30 days 162,942 210,123 31-60 days 167,656 146,815 Over 60 days 281,039 125,065
611,637 482,003 Past due and impaired
1-30 days – – 31-60 days – – Over 60 days 30,527 30,110
30,527 30,110 40.2.4 Trade debts - receivable from related parties
Neither past due nor impaired 1,967 2,597 Past due but not impaired 1-30 days – – 31-60 days – – Over 60 days – –
– –
74
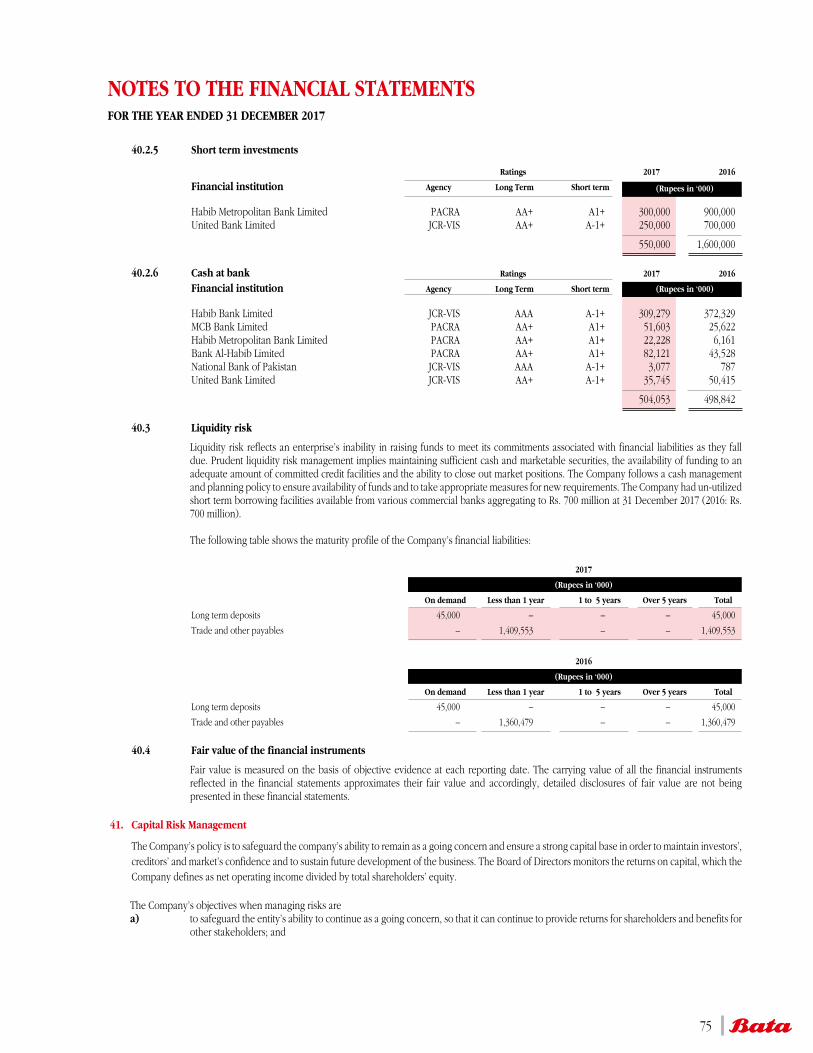
NOTES TO THE FINANCIAL STATEMENTSFOR THE YEAR ENDED 31 DECEMBER 2017
40.2.5 Short term investments
Ratings 2017 2016
Financial institution Agency Long Term Short term (Rupees in ‘000)
Habib Metropolitan Bank Limited PACRA AA+ A1+ 300,000 900,000 United Bank Limited JCR-VIS AA+ A-1+ 250,000 700,000
550,000 1,600,000 40.2.6 Cash at bank Ratings 2017 2016
Financial institution Agency Long Term Short term (Rupees in ‘000)
Habib Bank Limited JCR-VIS AAA A-1+ 309,279 372,329 MCB Bank Limited PACRA AA+ A1+ 51,603 25,622 Habib Metropolitan Bank Limited PACRA AA+ A1+ 22,228 6,161 Bank Al-Habib Limited PACRA AA+ A1+ 82,121 43,528 National Bank of Pakistan JCR-VIS AAA A-1+ 3,077 787 United Bank Limited JCR-VIS AA+ A-1+ 35,745 50,415
504,053 498,842
40.3 Liquidity risk
Liquidity risk reflects an enterprise’s inability in raising funds to meet its commitments associated with financial liabilities as they fall due. Prudent liquidity risk management implies maintaining sufficient cash and marketable securities, the availability of funding to an adequate amount of committed credit facilities and the ability to close out market positions. The Company follows a cash management and planning policy to ensure availability of funds and to take appropriate measures for new requirements. The Company had un-utilized short term borrowing facilities available from various commercial banks aggregating to Rs. 700 million at 31 December 2017 (2016: Rs. 700 million).
The following table shows the maturity profile of the Company’s financial liabilities:
2017
(Rupees in ‘000)
On demand Less than 1 year 1 to 5 years Over 5 years Total
Long term deposits 45,000 – – – 45,000
Trade and other payables – 1,409,553 – – 1,409,553
2016
(Rupees in ‘000)
On demand Less than 1 year 1 to 5 years Over 5 years Total
Long term deposits 45,000 – – – 45,000
Trade and other payables – 1,360,479 – – 1,360,479 40.4 Fair value of the financial instruments
Fair value is measured on the basis of objective evidence at each reporting date. The carrying value of all the financial instruments reflected in the financial statements approximates their fair value and accordingly, detailed disclosures of fair value are not being presented in these financial statements.
41. Capital Risk Management
The Company’s policy is to safeguard the company’s ability to remain as a going concern and ensure a strong capital base in order to maintain investors’, creditors’ and market’s confidence and to sustain future development of the business. The Board of Directors monitors the returns on capital, which the Company defines as net operating income divided by total shareholders’ equity.
The Company’s objectives when managing risks are a) to safeguard the entity’s ability to continue as a going concern, so that it can continue to provide returns for shareholders and benefits for
other stakeholders; and
75
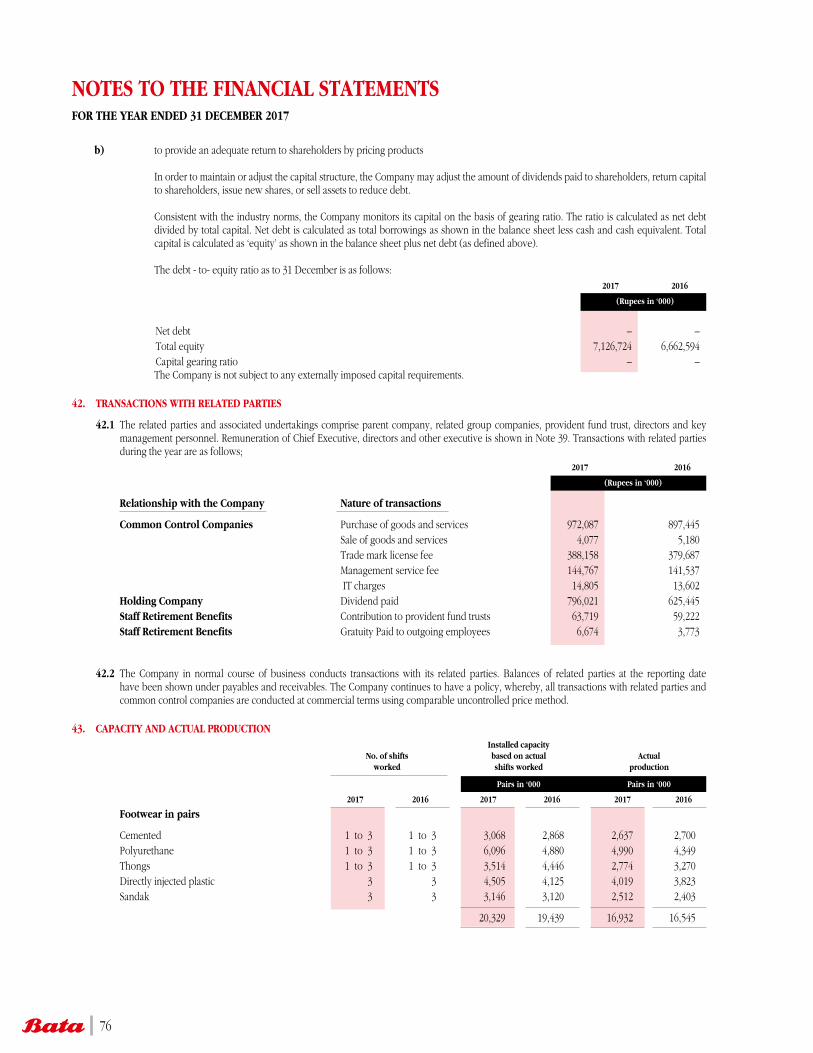
NOTES TO THE FINANCIAL STATEMENTSFOR THE YEAR ENDED 31 DECEMBER 2017
b) to provide an adequate return to shareholders by pricing products In order to maintain or adjust the capital structure, the Company may adjust the amount of dividends paid to shareholders, return capital
to shareholders, issue new shares, or sell assets to reduce debt. Consistent with the industry norms, the Company monitors its capital on the basis of gearing ratio. The ratio is calculated as net debt
divided by total capital. Net debt is calculated as total borrowings as shown in the balance sheet less cash and cash equivalent. Total capital is calculated as ‘equity’ as shown in the balance sheet plus net debt (as defined above).
The debt - to- equity ratio as to 31 December is as follows:
2017 2016
(Rupees in ‘000)
Net debt – – Total equity 7,126,724 6,662,594 Capital gearing ratio – –
The Company is not subject to any externally imposed capital requirements.
42. TRANSACTIONS WITH RELATED PARTIES
42.1 The related parties and associated undertakings comprise parent company, related group companies, provident fund trust, directors and key management personnel. Remuneration of Chief Executive, directors and other executive is shown in Note 39. Transactions with related parties during the year are as follows;
2017 2016
(Rupees in ‘000)
Relationship with the Company Nature of transactions
Common Control Companies Purchase of goods and services 972,087 897,445 Sale of goods and services 4,077 5,180 Trade mark license fee 388,158 379,687 Management service fee 144,767 141,537 IT charges 14,805 13,602 Holding Company Dividend paid 796,021 625,445 Staff Retirement Benefits Contribution to provident fund trusts 63,719 59,222 Staff Retirement Benefits Gratuity Paid to outgoing employees 6,674 3,773
42.2 The Company in normal course of business conducts transactions with its related parties. Balances of related parties at the reporting date
have been shown under payables and receivables. The Company continues to have a policy, whereby, all transactions with related parties and common control companies are conducted at commercial terms using comparable uncontrolled price method.
43. CAPACITY AND ACTUAL PRODUCTION Installed capacity No. of shifts based on actual Actual worked shifts worked production
Pairs in ‘000 Pairs in ‘000
2017 2016 2017 2016 2017 2016
Footwear in pairs
Cemented 1 to 3 1 to 3 3,068 2,868 2,637 2,700 Polyurethane 1 to 3 1 to 3 6,096 4,880 4,990 4,349 Thongs 1 to 3 1 to 3 3,514 4,446 2,774 3,270 Directly injected plastic 3 3 4,505 4,125 4,019 3,823 Sandak 3 3 3,146 3,120 2,512 2,403
20,329 19,439 16,932 16,545
76
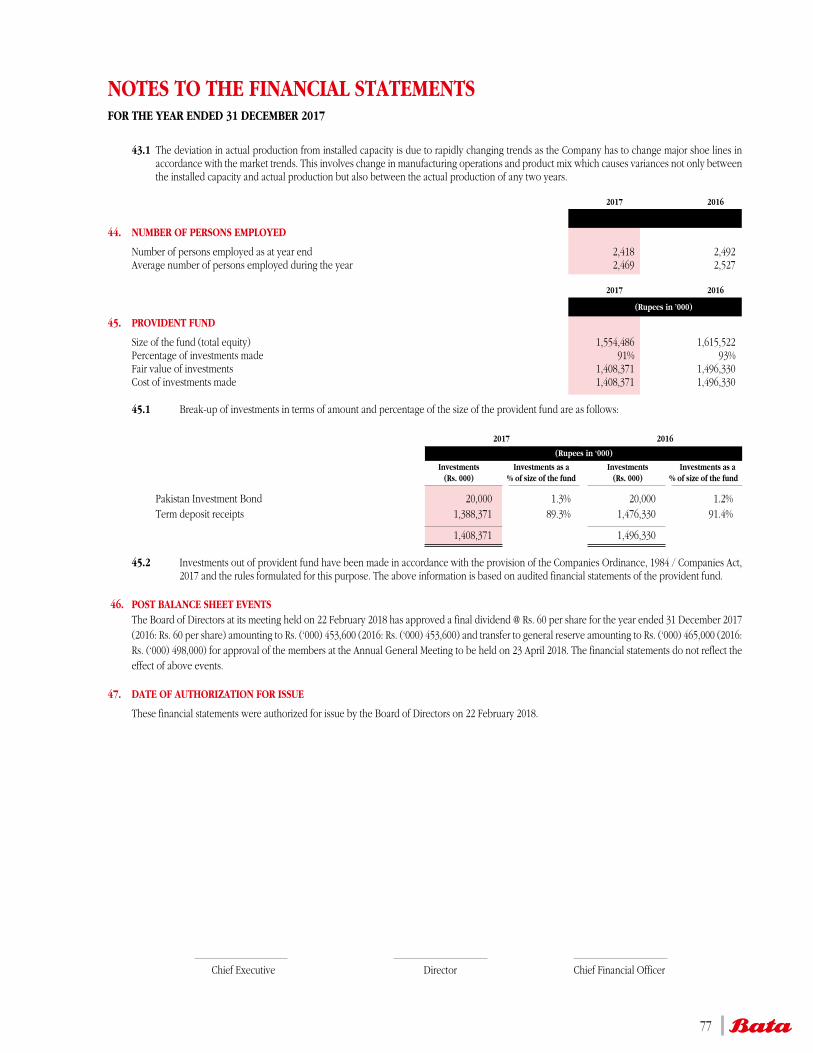
NOTES TO THE FINANCIAL STATEMENTSFOR THE YEAR ENDED 31 DECEMBER 2017
Chief Executive Director Chief Financial Officer
43.1 The deviation in actual production from installed capacity is due to rapidly changing trends as the Company has to change major shoe lines in accordance with the market trends. This involves change in manufacturing operations and product mix which causes variances not only between the installed capacity and actual production but also between the actual production of any two years.
2017 2016
44. NUMBER OF PERSONS EMPLOYED
Number of persons employed as at year end 2,418 2,492 Average number of persons employed during the year 2,469 2,527
2017 2016
(Rupees in ’000)
45. PROVIDENT FUND
Size of the fund (total equity) 1,554,486 1,615,522 Percentage of investments made 91% 93% Fair value of investments 1,408,371 1,496,330 Cost of investments made 1,408,371 1,496,330 45.1 Break-up of investments in terms of amount and percentage of the size of the provident fund are as follows: 2017 2016
(Rupees in ‘000)
Investments Investments as a Investments Investments as a (Rs. 000) % of size of the fund (Rs. 000) % of size of the fund
Pakistan Investment Bond 20,000 1.3% 20,000 1.2% Term deposit receipts 1,388,371 89.3% 1,476,330 91.4%
1,408,371 1,496,330 45.2 Investments out of provident fund have been made in accordance with the provision of the Companies Ordinance, 1984 / Companies Act,
2017 and the rules formulated for this purpose. The above information is based on audited financial statements of the provident fund. 46. POST BALANCE SHEET EVENTS The Board of Directors at its meeting held on 22 February 2018 has approved a final dividend @ Rs. 60 per share for the year ended 31 December 2017
(2016: Rs. 60 per share) amounting to Rs. (‘000) 453,600 (2016: Rs. (‘000) 453,600) and transfer to general reserve amounting to Rs. (‘000) 465,000 (2016: Rs. (‘000) 498,000) for approval of the members at the Annual General Meeting to be held on 23 April 2018. The financial statements do not reflect the effect of above events.
47. DATE OF AUTHORIZATION FOR ISSUE
These financial statements were authorized for issue by the Board of Directors on 22 February 2018.
77
Pattern ofShareholding
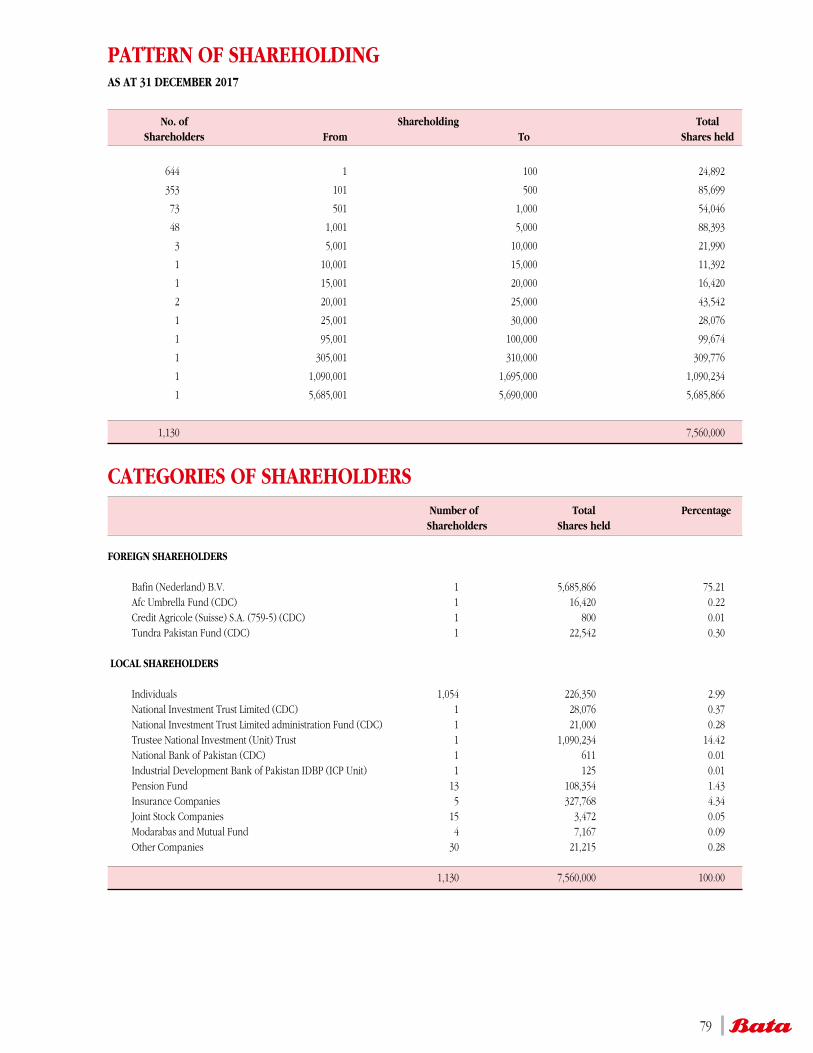
No. of Shareholding Total Shareholders From To Shares held
644 1 100 24,892
353 101 500 85,699
73 501 1,000 54,046
48 1,001 5,000 88,393
3 5,001 10,000 21,990
1 10,001 15,000 11,392
1 15,001 20,000 16,420
2 20,001 25,000 43,542
1 25,001 30,000 28,076
1 95,001 100,000 99,674
1 305,001 310,000 309,776
1 1,090,001 1,695,000 1,090,234
1 5,685,001 5,690,000 5,685,866
1,130 7,560,000
CATEGORIES OF SHAREHOLDERS Number of Total Percentage Shareholders Shares held FOREIGN SHAREHOLDERS Bafin (Nederland) B.V. 1 5,685,866 75.21 Afc Umbrella Fund (CDC) 1 16,420 0.22 Credit Agricole (Suisse) S.A. (759-5) (CDC) 1 800 0.01 Tundra Pakistan Fund (CDC) 1 22,542 0.30 LOCAL SHAREHOLDERS Individuals 1,054 226,350 2.99 National Investment Trust Limited (CDC) 1 28,076 0.37 National Investment Trust Limited administration Fund (CDC) 1 21,000 0.28 Trustee National Investment (Unit) Trust 1 1,090,234 14.42 National Bank of Pakistan (CDC) 1 611 0.01 Industrial Development Bank of Pakistan IDBP (ICP Unit) 1 125 0.01 Pension Fund 13 108,354 1.43 Insurance Companies 5 327,768 4.34 Joint Stock Companies 15 3,472 0.05 Modarabas and Mutual Fund 4 7,167 0.09 Other Companies 30 21,215 0.28
1,130 7,560,000 100.00
PATTERN OF SHAREHOLDINGAS AT 31 DECEMBER 2017
79
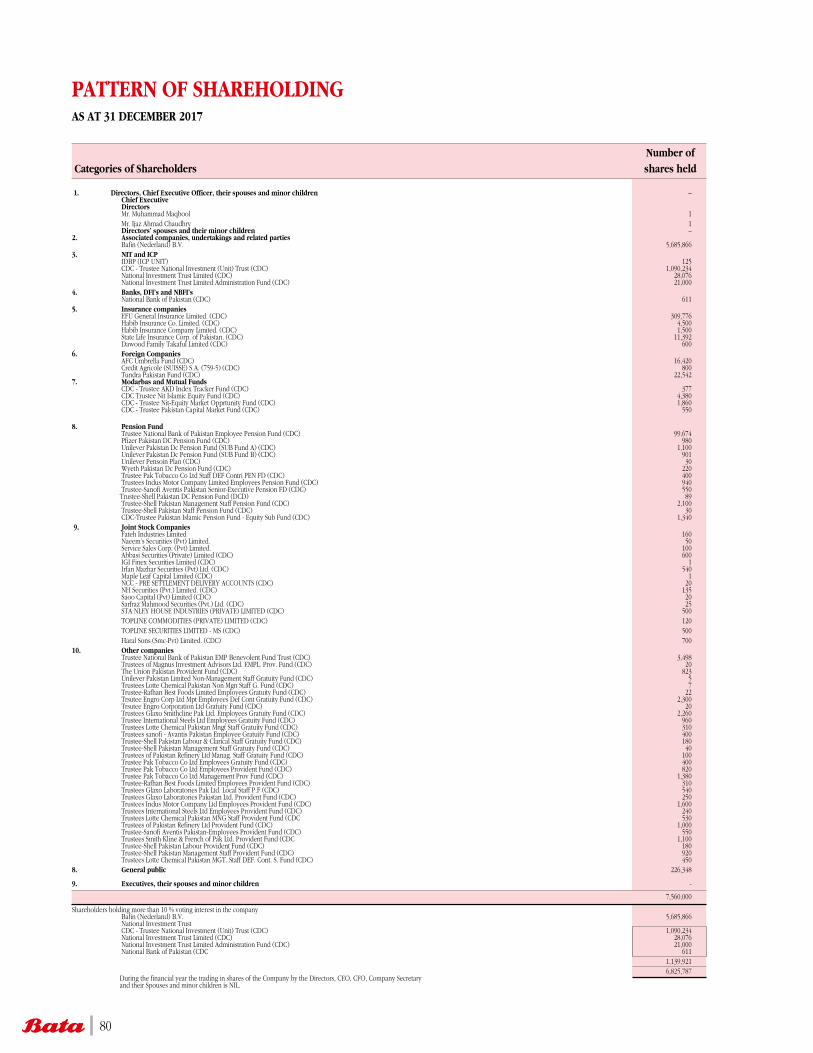
Number of Categories of Shareholders shares held 1. Directors, Chief Executive Officer, their spouses and minor children – Chief Executive Directors Mr. Muhammad Maqbool 1 Mr. Ijaz Ahmad Chaudhry 1 Directors’ spouses and their minor children –2. Associated companies, undertakings and related parties Bafin (Nederland) B.V. 5,685,8663. NIT and ICP IDBP (ICP UNIT) 125 CDC - Trustee National Investment (Unit) Trust (CDC) 1,090,234 National Investment Trust Limited (CDC) 28,076 National Investment Trust Limited Administration Fund (CDC) 21,000 4. Banks, DFI’s and NBFI’s National Bank of Pakistan (CDC) 611 5. Insurance companies EFU General Insurance Limited. (CDC) 309,776 Habib Insurance Co. Limited. (CDC) 4,500 Habib Insurance Company Limited. (CDC) 1,500 State Life Insurance Corp. of Pakistan. (CDC) 11,392 Dawood Family Takaful Limited (CDC) 600 6. Foreign Companies AFC Umbrella Fund (CDC) 16,420 Credit Agricole (SUISSE) S.A. (759-5) (CDC) 800 Tundra Pakistan Fund (CDC) 22,542 7. Modarbas and Mutual Funds CDC - Trustee AKD Index Tracker Fund (CDC) 377 CDC Trustee Nit Islamic Equity Fund (CDC) 4,380 CDC - Trustee Nit-Equity Market Opprtunity Fund (CDC) 1,860 CDC - Trustee Pakistan Capital Market Fund (CDC) 550
8. Pension Fund Trustee National Bank of Pakistan Employee Pension Fund (CDC) 99,674 Pfizer Pakistan DC Pension Fund (CDC) 980 Unilever Pakistan Dc Pension Fund (SUB Fund A) (CDC) 1,100 Unilever Pakistan Dc Pension Fund (SUB Fund B) (CDC) 901 Unilever Pensoin Plan (CDC) 30 Wyeth Pakistan Dc Pension Fund (CDC) 220 Trustee Pak Tobacco Co Ltd Staff DEF Contri PEN FD (CDC) 400 Trustees Indus Motor Company Limited Employees Pension Fund (CDC) 940 Trustee-Sanofi Aventis Pakistan Senior-Executive Pension FD (CDC) 550 Trustee-Shell Pakistan DC Pension Fund (DCD) 89 Trustee-Shell Pakistan Management Staff Pension Fund (CDC) 2,100 Trustee-Shell Pakistan Staff Pension Fund (CDC) 30 CDC-Trustee Pakistan Islamic Pension Fund - Equity Sub Fund (CDC) 1,340 9. Joint Stock Companies Fateh Industries Limited 160 Naeem’s Securities (Pvt) Limited. 50 Service Sales Corp. (Pvt) Limited. 100 Abbasi Securities (Private) Limited (CDC) 600 IGI Finex Securities Limited (CDC) 1 Irfan Mazhar Securities (Pvt) Ltd. (CDC) 540 Maple Leaf Capital Limited (CDC) 1 NCC - PRE SETTLEMENT DELIVERY ACCOUNTS (CDC) 20 NH Securities (Pvt.) Limited. (CDC) 135 Saoo Capital (Pvt) Limited (CDC) 20 Sarfraz Mahmood Securities (Pvt.) Ltd. (CDC) 25 STA NLEY HOUSE INDUSTRIES (PRIVATE) LIMITED (CDC) 500 TOPLINE COMMODITIES (PRIVATE) LIMITED (CDC) 120 TOPLINE SECURITIES LIMITED - MS (CDC) 500 Haral Sons (Smc-Pvt) Limited. (CDC) 700 10. Other companies Trustee National Bank of Pakistan EMP Benevolent Fund Trust (CDC) 3,498 Trustees of Magnus Investment Advisors Ltd. EMPL. Prov. Fund (CDC) 20 The Union Pakistan Provident Fund (CDC) 823 Unilever Pakistan Limited Non-Management Staff Gratuity Fund (CDC) 5 Trustees Lotte Chemical Pakistan Non Mgn Staff G. Fund (CDC) 7 Trustee-Rafhan Best Foods Limited Employees Gratuity Fund (CDC) 22 Trsutee Engro Corp Ltd Mpt Employees Def Cont Gratuity Fund (CDC) 2,300 Trsutee Engro Corporation Ltd Gratuity Fund (CDC) 20 Trustees Glaxo Smithcline Pak Ltd. Employees Gratuity Fund (CDC) 2,260 Trustee International Steels Ltd Employees Gratuity Fund (CDC) 960 Trustees Lotte Chemical Pakistan Mngt Staff Gratuity Fund (CDC) 310 Trustees sanofi - Avantis Pakistan Employee Gratuity Fund (CDC) 400 Trustee-Shell Pakistan Labour & Clarical Staff Gratuity Fund (CDC) 180 Trustee-Shell Pakistan Management Staff Gratuity Fund (CDC) 40 Trustees of Pakistan Refinery Ltd Manag. Staff Gratuity Fund (CDC) 100 Trustee Pak Tobacco Co Ltd Employees Gratuity Fund (CDC) 400 Trustee Pak Tobacco Co Ltd Employees Provident Fund (CDC) 820 Trustee Pak Tobacco Co Ltd Management Prov Fund (CDC) 1,380 Trustee-Rafhan Best Foods Limited Employees Provident Fund (CDC) 310 Trustees Glaxo Laboratories Pak Ltd. Local Staff P.F (CDC) 540 Trustees Glaxo Laboratories Pakistan Ltd. Provident Fund (CDC) 250 Trustees Indus Motor Company Ltd Employees Provident Fund (CDC) 1,600 Trustees International Steels Ltd Employees Provident Fund (CDC) 240 Trustees Lotte Chemical Pakistan MNG Staff Provident Fund (CDC 530 Trustees of Pakistan Refinery Ltd Provident Fund (CDC) 1,000 Trustee-Sanofi Aventis Pakistan-Employees Provident Fund (CDC) 550 Trustees Smith Kline & French of Pak Ltd. Provident Fund (CDC 1,100 Trustee-Shell Pakistan Labour Provident Fund (CDC) 180 Trustee-Shell Pakistan Management Staff Provident Fund (CDC) 920 Trustees Lotte Chemical Pakistan MGT. Staff DEF. Cont. S. Fund (CDC) 4508. General public 226,348 9. Executives, their spouses and minor children -
7,560,000
Shareholders holding more than 10 % voting interest in the company Bafin (Nederland) B.V. 5,685,866 National Investment Trust CDC - Trustee National Investment (Unit) Trust (CDC) 1,090,234 National Investment Trust Limited (CDC) 28,076 National Investment Trust Limited Administration Fund (CDC) 21,000 National Bank of Pakistan (CDC 611 1,139,921 6,825,787 During the financial year the trading in shares of the Company by the Directors, CEO, CFO, Company Secretary and their Spouses and minor children is NIL.
PATTERN OF SHAREHOLDINGAS AT 31 DECEMBER 2017
80
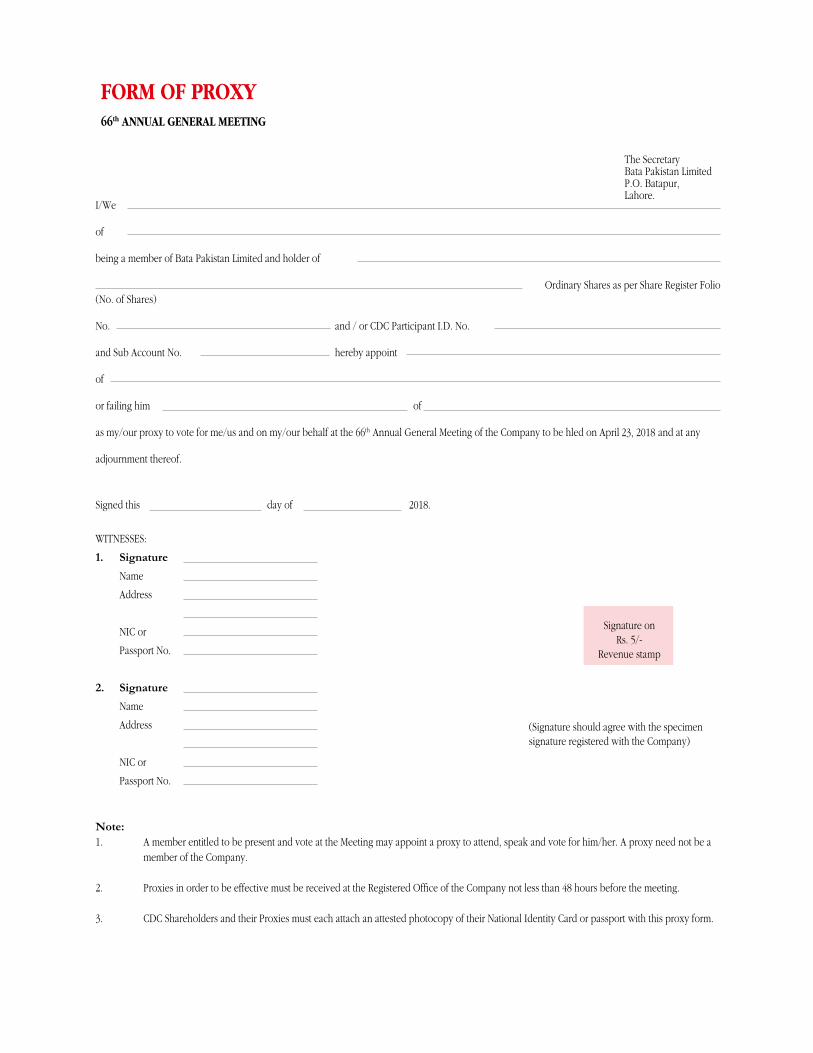
FORM OF PROXY66th ANNUAL GENERAL MEETING
The SecretaryBata Pakistan LimitedP.O. Batapur,Lahore.
66th 23, 2018
2018.
(Signature should agree with the specimensignature registered with the Company)
Signature onRs. 5/-
Revenue stamp
A member entitled to be present and vote at the Meeting may appoint a proxy to attend, speak and vote for him/her. A proxy need not be a member of the Company.
AFFIX
CORRECT
POSTAGE
The Company Secretary
BATA PAKISTAN LIMITEDP.O. BATAPUR,LAHROE.
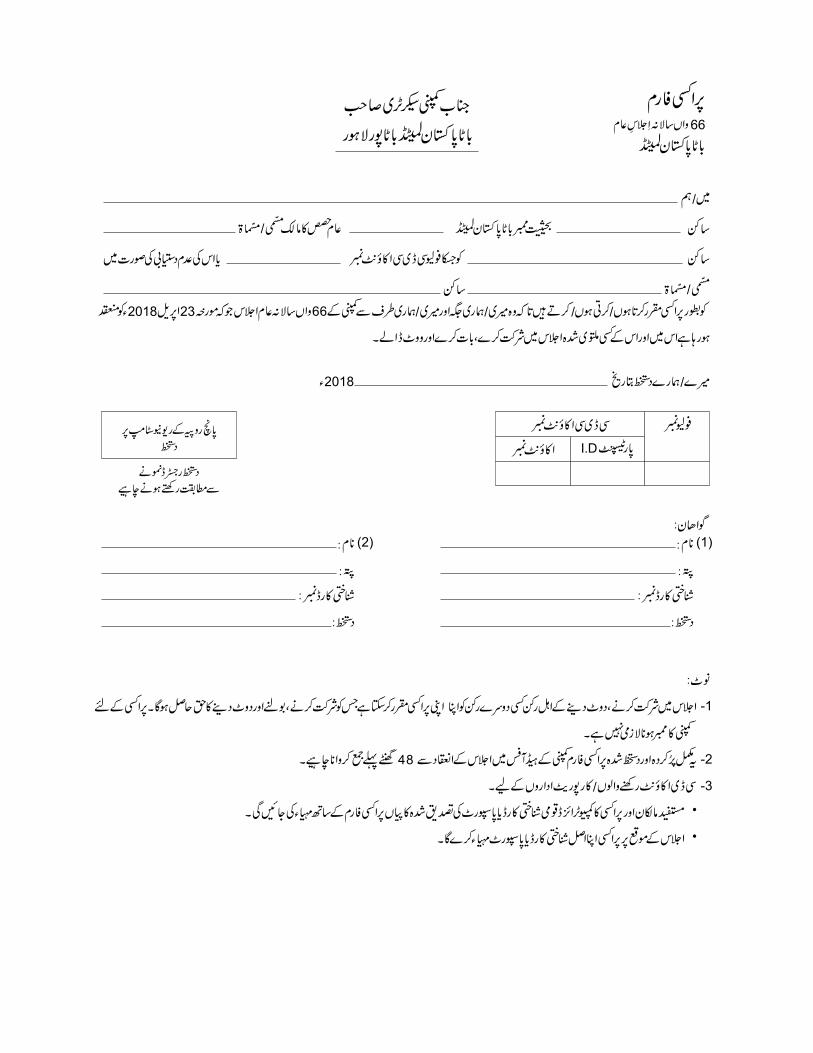
2018
66
232018
(1)(2)
-1
-2
-3
•
•

NOTES


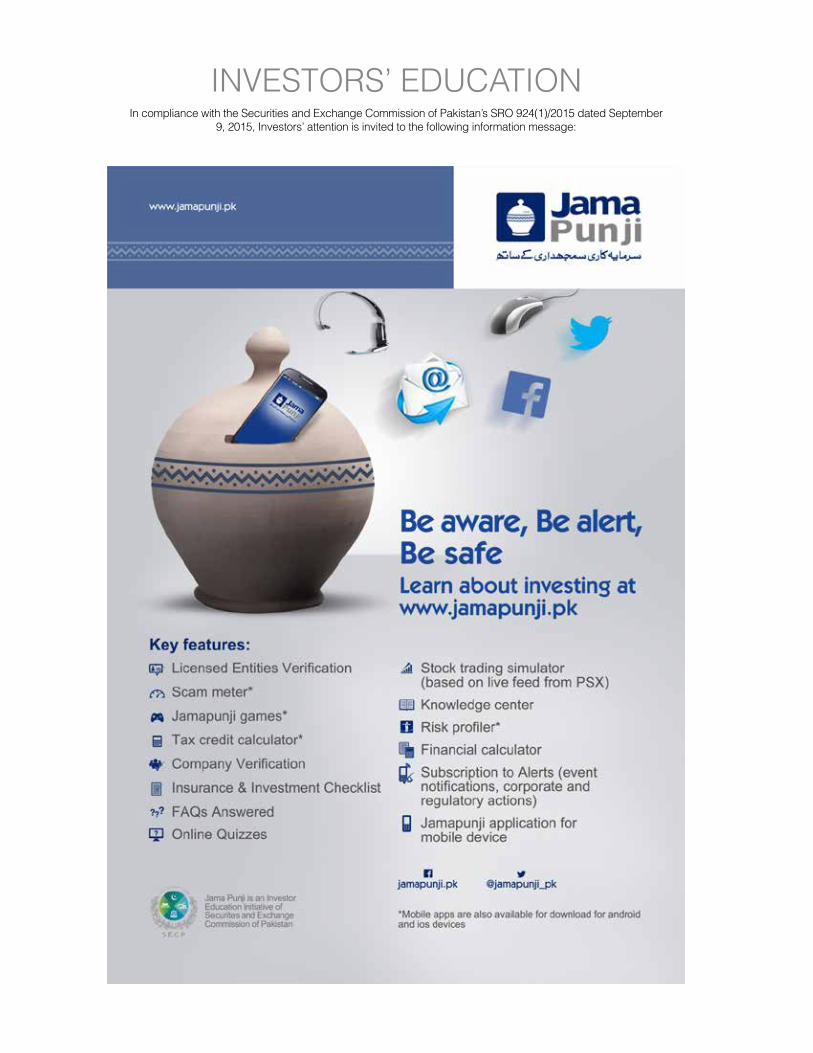
INVESTORS’ EDUCATIONIn compliance with the Securities and Exchange Commission of Pakistan’s SRO 924(1)/2015 dated September
9, 2015, Investors’ attention is invited to the following information message:

PAKISTAN LIMITEDP.O. Batapur, Lahore, PakistanUAN: +92-42-111-044-055 Fax: +92-42-36581176Web: www.bata.pkE-mail: [email protected]