Embed Size (px)
Citation preview


CORPORATE GOVERNANCE, INVESTOR PROTECTION, AND FIRM PERFORMANCE IN MENA COUNTRIES
Iftekhar Hasan, Nada Kobeissi and Liang Song
Working Paper 600
July 2011
I wish to thank Dr. Jeffrey Nugent (discussant) and other participants at the ERF 17th Annual Conference.
Send correspondence to: Iftekhar Hasan The Lally School of Management and Technology of Rensselaer Polytechnic Institute [email protected]

First published in 2011 by The Economic Research Forum (ERF) 21 Al-Sad Al-Aaly Street Dokki, Giza Egypt www.erf.org.eg Copyright © The Economic Research Forum, 2011 All rights reserved. No part of this publication may be reproduced in any form or by any electronic or mechanical means, including information storage and retrieval systems, without permission in writing from the publisher. The findings, interpretations and conclusions expressed in this publication are entirely those of the author(s) and should not be attributed to the Economic Research Forum, members of its Board of Trustees, or its donors.

2
Abstract
This paper will examine the relationship between firm level governance, country level governance (investor protection) and firm performance. It will further analyze to what extent firm-level corporate governance and country-level investor protection can be complements or substitutes in determining firm performance. The paper will be organized as follows: Section 2 describes related literature and develops corresponding hypotheses. Section 3 describes the data source and methodology. Section 4 outlines the results. Section 5 presents the conclusion.
ملخص
بالد ةآم و، والح لمؤسسةعلى مستوى ا ةآمووسوف تدرس هذه الورقة العالقة بين الح ى مستوى ال تثمر (عل ة المس . لمؤسسة وأداء ا) حماي
ى المستوى القطري على حماية المستثمراستخدام مدى امكانية فسيتم إجراء مزيد من التحليل على مستوى الشرآات وإدارة الشرآات عل
يصف األدب ذات الصلة ، وتطور فرضيات 2الباب : وسيتم تنظيم هذه الورقة على النحو التالي . ل في تحديد أداء الشرآاتديكمل أو بآم
.االستنتاج 5ويعرض الباب . لخطوط العريضة للنتائجا يعرض 4الباب . يصف مصدر البيانات والمنهجية 3القسم . المقابلة

3
1. Introduction There have been a number of studies analyzing the relationship between law and finance. Many of these studies have focused on country level investor protection and differences in legal systems across countries. In recent years, authors began to explore above relationship at the more micro level by examining the impact of firm level corporate governance on firm performance (see Shleifer and Vishny, 1997 for comprehensive surveys). Authors have pointed out that in many countries firms have the flexibility in their corporate charters to either opt out of certain provisions in investor protection laws or to choose to adopt additional ones (Easterbrook and Fischel, 1991; Black and Gilson, 1998, Klapper and Love 2004).
This suggests that firms within the same country might adopt a varying degree of corporate governance. As such, a firm in a country with weak corporate governance and enforcement of legal system might be able to compensate for such environment by incorporating stronger measures to protect their investors and in turn positively affect firm performance. While Shleifer and Wolfensohn (2002) argued that firms on their own are unable to duplicate a good legal environment without the support of efficient judicial system at the national level, Klapper and Love (2004) found evidence to the contrary. They noted that although firm level efforts do not fully substitute for the absence of a good legal infrastructure, they can however, to a certain degree, independently improve their investor protection and minority shareholder rights.
To date, while a large number of studies have examined corporate governance, the majority however have tended to focus on developed countries in Europe or North America (e.g. Stafsudd, 2009; Easterbrook and Fischel, 1991; Kang and Shivdasani, 1995) or on emerging or transition countries (Campos, Newell, and Wilson, 2002; Denis and McConnell, 2003; Klapper and Love, 2004). To our knowledge no research have so far examined above issue within the context of the Middle East and North Africa (MENA) region, a gap that we propose to explore. The institutional infrastructure in the MENA countries, i.e. their economic, political, legal, and corporate governance structures differs from other regions and limits the generalizability of results. Evidence suggests that firm value will depend on the choice of internal governance mechanisms that are made by the firm and are affected by the institutional framework in which it is embedded (Castrillo et al 2010). As the region is trying to improve its corporate governance, analyzing the impact of certain practices is important because the success or failure of implementing or investing in certain practices may be influenced by their market value and the rewards and punishment levied on those companies that adopt them.
This paper therefore, will examine the relationship between firm level governance, country level governance (investor protection) and firm performance. It will further analyse to what extent firm-level corporate governance and country-level investor protection can be complements or substitutes in determining firm performance. The paper will be organized as follows: Section 2 describes related literature and develops corresponding hypotheses. Section 3 describes the data source and methodology. Section 4 outlines the results. Section 5 presents the conclusion.
2. Literature Review - Hypothesis Development Governance depends on both country-level as well as firm-level mechanisms. The former include laws, culture and norms, and the institutions that enforce the laws. The latter refer to internal mechanisms that operate within the firm3. Laws and regulations imposing specific choices of governance attributes explain why a firm in a given country has certain governance attributes (Aggarwal, et al 2009). In addition to formal governance mechanism, several

4
researchers have found that informal governance mechanisms, such as media exposure (Dyck and Zingales, 2002), trust (Franks et al., 2009), social norms (Kreps, 1990; Coffee, 2001,) and to some extent reputation (Allen, Qian, and Qian, 2005) play a role in a firm’s governance practices and could complement or at least substitute for some formal governance attributes (Aggarwal, et al 2009, Stafsudd, 2009).
There has been a vast amount of scholarship on corporate governance. For the most part studies have suggested a positive relationship between good governance and firm performance (Chidambaran et al., 2006). Initially, country level studies tended to focus on macro aspect and provided valuable insights into the effects of regulatory environment (La Porta et al. 2002). However, more recently scholars began examining the effect of micro firm attributes as well as analyzing the interactions between macro and micro factors and their effect on the governance performance relationship (Shleifer and Vishny, 1997). Studies revealed variability in corporate governance across countries as well as within countries (see, e.g.,Doidge, Karolyi, and Stulz 2007; Fulghieri and Suominen 2006; John and Kedia 2006). Authors suggested that under certain conditions firms were able to adjust their internal governance mechanisms in effort to compensate for a poor legal environment and enhance investors’ protection (Shleifer and Wolfensohn, 2002; Klapper and Love, 2004). For example, attributes such as ownership concentration, board compositions or the level of debt could be adjusted to bring about greater alignment between managers and shareholders’ interests and in turn improve firm value (Castrillo et al, 2010; Yermack 1996; and Gompers et al., 2003). Adopting and investing in certain mechanism can be costly and the payoffs from that investment differ across countries and across firms (e.g.,Doidge, Karolyi, and Stulz 2007; Fulghieri and Suominen 2006; John and Kedia 2006).
A recent report analyzing global best practices noted that leading companies are devising creative strategies for leveraging their governance, risk and compliance attribute to derive better value1. Among the strategies to compensate for weakness in corporate governance environment and enjoy higher valuation was to participate in more developed markets by listing in foreign stock markets - more specifically in the US; instead of only local exchange (Reese and Weisbach, 2002; Doidge et al., 2001 ).
Although these research have furthered our understanding of the relationship between governance and performance, their relevance however has been limited to few countries as they tended to focus on the developed economies, or on a single market mainly the United States (Denis and McConnell, 2003). There has been a lack of comprehensive research focusing on developing countries. Evidence from developed economies does not fully explain governance- performance relationships in developing countries. In fact studies found variations in corporate governance and legal investor protection among developed countries, i.e. between the Anglo-Saxon, common law system and the Continental European civil law system. Legal investor protections were found to be higher in countries where common law prevails (La Porta et al., 1997, 1998).
In recent years, studies began focusing on some developing and emerging countries such as in South Eastern Asia and Eastern Europe (Denis and McConnell, 2003). Overall, the empirical investigations on these economies have tended to be concerned with the overall quality of corporate governance rather than with any specific aspect of such governance (Nam and Nam, 1 PricewaterhouseCoopers Global Best Practices Governance, risk, and compliance series

5
2004). Among the recent research, a study based on a sample of 540 Korean firms (Black, Jang, and Kim, 2003), and another analyzing a sample of 188 companies from six emerging countries (India, Korea, Malaysia, Mexico, Taipei, China, and Turkey) (Campos, Newell, and Wilson, 2002) found the market rewarded good governance with higher valuation. A more extensive study ranking 495 from 25 emerging countries found better corporate governance to be highly correlated with better operating performance and market valuation (Klapper and Love, 2004). In terms of attracting investors, evidence from the latter study suggested that the quality of corporate governance mattered more in countries with weak legal environment.
In addition to Asia and Eastern Europe, empirical research focusing on Latin America also began to emerge. In recent years studies have examined corporate governance and firm valuation in Brazil (Leal and Carvalhal-da-Silva, 2007); Mexico (Chong and López-de-Silanes, 2007); Chile (Lefort and Walker, 2007) and Venezuela (Garay and González, 2008). On average, these studies showed a positive relation between good corporate governance practices and policies and firm value. The environment in Latin America with weak investor protection and high inter firm variation created a good setting to corroborate the effect good corporate governance practices have on firm valuation (Garay and González, 2008).
Corporate Governance in MENA Region Authors have noted that it is not clear if the experiences of the socially or centrally planned economies would apply to those countries that have not followed similar trajectories (Wright et al., 2005). The institutional infrastructures in the MENA countries, i.e. their economic, political, legal, and corporate governance structures; differ from those of the formerly planned emerging countries. These kinds of variations between transition and MENA economies puts into question the generalizability and practical application of findings derived from developed or from transition countries and underscore the need for a separate analysis focusing on the MENA region.
A recent MENA wide corporate governance survey conducted between July 2006- July 2007 and published by the International Finance Corporation2 noted a growing awareness about the importance of corporate governance and continuing effort and commitment to improve governance mechanism, however it also highlighted findings which raises concern about the existing conditions and the need for considerable improvement in order to bring the governance environment in line with best practices. Among the significant findings, the report noted that none of the respondents could reasonably be qualified as following “best practices”. Only 3% or five respondents could be deemed to follow “good practice”, while the great majority (92%) falls under “emerging” or “improved” practices. Interestingly 53% of respondents were unable to properly define corporate governance. Only 26.4% of boards have audit committees with a majority of independent directors. Less than 37% of companies have implemented company level code of corporate governance or code of ethics. Finally, close to 55% of respondents thought that directors failed to avoid conflict of interest situations, and over 62% noted that board members used inside information for their benefit.
2 A Corporate Governance Survey of Listed Companies and Banks Across the Middle East and North Africa – 2008: http://www.ifc.org/ifcext/mena.nsf/AttachmentsByTitle/CG+Survey+of+Listed+Companies+and+Banks+across+MENA/$FILE/MENA+Corporate+Governance+Survey.pdf
6
Another significant feature of corporate governance in MENA is the prevalence of family ownership. In Turkey for example one share holder controlled more than 50% of voting right in 45% of listed companies. In majority of the cases, the dominant shareholder was a holding company controlled by a family (Aytac and Sak, 2000). Families control 198 of the 257 listed companies. In majority of the cases individual family members exercised control on cash flow rights through pyramid and cascading ownership structures (Yurtoglu, 2000).
While above survey provide a descriptive overview of corporate governance in MENA countries, to date however, a comprehensive empirical research on the MENA region remains very scant. We know little about the potential impact of certain corporate governance practices on company value. Nevertheless findings from Asia and Latin America offer a good point of reference for the MENA region. Following, we examine relevant practices and propose related hypotheses:
Investor Protection A country-level investor protection is a crucial determinant of the intensity of investment in internal governance. Strong investor protection has been declared as the most important factor associated with promoting good corporate governance (La Porta et al. 1997, 1998, 2000]. It creates an environment which deters managers from opportunistic behavior, reduces the risk of mismanagement and increases shareholder’s confidence and their willingness to participate in the capital markets (DeFond and Hung, 2004). Studies found corporate governance practices play a more important role in countries where legal protection is weak (Klapper and Love, 2004; Durnev and Kim, 2005). Some of the practices associated with weak investor protection and in turn impacting firm values are managerial entrenchment, cash holding and dividend payout.
Managerial Entrenchment Entrenchment is a mechanism which protects manager from removal or the consequences of removal. Entrenchment can have adverse effects on management behavior and incentives. Insulating managers from removal or the disciplinary threat of removal could lead to suboptimal behaviors such as shirking, empire-building and extraction of private benefits (Bebchuck, Cohen and Ferrell, 2004). Using an entrenchment index based on 6 entrenchment related provisions3 above study found that increases in the index level are positively associated with economically significant reductions in firm valuation as well as large negative abnormal returns.
Cash Holding In addition the presence or lack of entrenchment related provisions another practice related to corporate governance is cash holding. Harford, Mansi, and Maxwell, (2008) noted that any discussion of the efficacy of corporate governance mechanisms to control managers must address this issue. They explained that as cash reserves increases, manager must make one of several strategic decisions: distribute the cash to shareholders; spend it within the firm; invest it in acquisition or hold it. The decision of a self interested manager will be affected by whether the likelihood of discipline is greater from excess spending or from visibly holding too much cash. In order to mitigate agency conflicts over cash deployments, the free cash flow theory (Jensen, 1986; Stulz, 1990) suggests that shareholders will limit managers’ access to free cash flow by
3 Using a list of 24 provisions included in the governance index followed by the Investor Responsibility Research Center (IRRC), the authors investigated the relative importance of these provisions and developed an entrenchment index based on 6 of the 24 provisions, namely: staggered boards, limits to shareholder bylaw amendments, poison pills, golden parachutes, and supermajority requirements for mergers and charter amendments.

7
providing sufficient internal capital to efficiently fund good projects, while at the same time restricting excess internal capital in such a way so as to curb activities that benefit managers at the expense of shareholders. Evidence from various cross country studies have shown that greater shareholder rights are associated with lower cash holdings (Dittmar, Mahrt-Smith, Servaes, 2003; Lins and Kalcheva, 2004; Pinkowitz, Stulz and Williamson, 2004). Using a sample of more than 11,000 firms from 45 countries Dittmar et al, (2003) found corporations in countries with poor investors’ protection hold up twice as much cash as corporations in countries with good investors’ protection.
Dividend Payout Finally, related to the free cash flow theory and cash holding decision, is the dividend payment behavior. Jirapong and Ning (2006) put forward two related hypotheses: 1) the management opportunism hypothesis suggests that companies with weak shareholder protection will offer lower payouts in order to provide more perks to management; 2) the substitution hypothesis suggests that dividends act as a substitute for shareholder rights. Therefore companies with weak shareholder protection will offer high dividend payments to compensate for having weak shareholder protection. Using governance index as a proxy the authors found an inverse relationship between dividends and shareholder rights, thus supporting the substitution hypothesis. Another study using a sample of 365 firms from 19 emerging countries, found that firms with stronger corporate governance have higher dividend payouts and are more profitable. However, the positive relationship between corporate governance and dividend payouts was only limited to countries with strong investor protection (Milton, 2004). Finally, using a sample that spans 35 countries and 11 years, Pinkowitz et al. (2006) analyzed the impact of cash holding and dividend payout on firm value. They found that in countries with high investor protection, a dollar of liquid assets is worth roughly a dollar to minority investors. In contrast, in countries with poor investor protection, a dollar of liquid assets is worth much less. In terms of dividend the authors found that that minority shareholders value dividends more in countries with worse investor protection than in other countries.
Therefore, in light of above research findings and considering the generally poor legal environment and low level of investor protection in the MENA region we propose the following five hypotheses:
• H1: Firm in a country with higher investor protection performs better.
• H2: Firm with lower managerial entrenchment performs better.
• H3: In a country with lower investor protection, the relationship between managerial entrenchment and firm performance is likely to be more evident.
• H4: In a country with lower investor protection, firm value is likely to be lower when manager hold more cash
• H5: In a country with lower investor protection firm value is likely to be higher when controlling manager pay dividend.

8
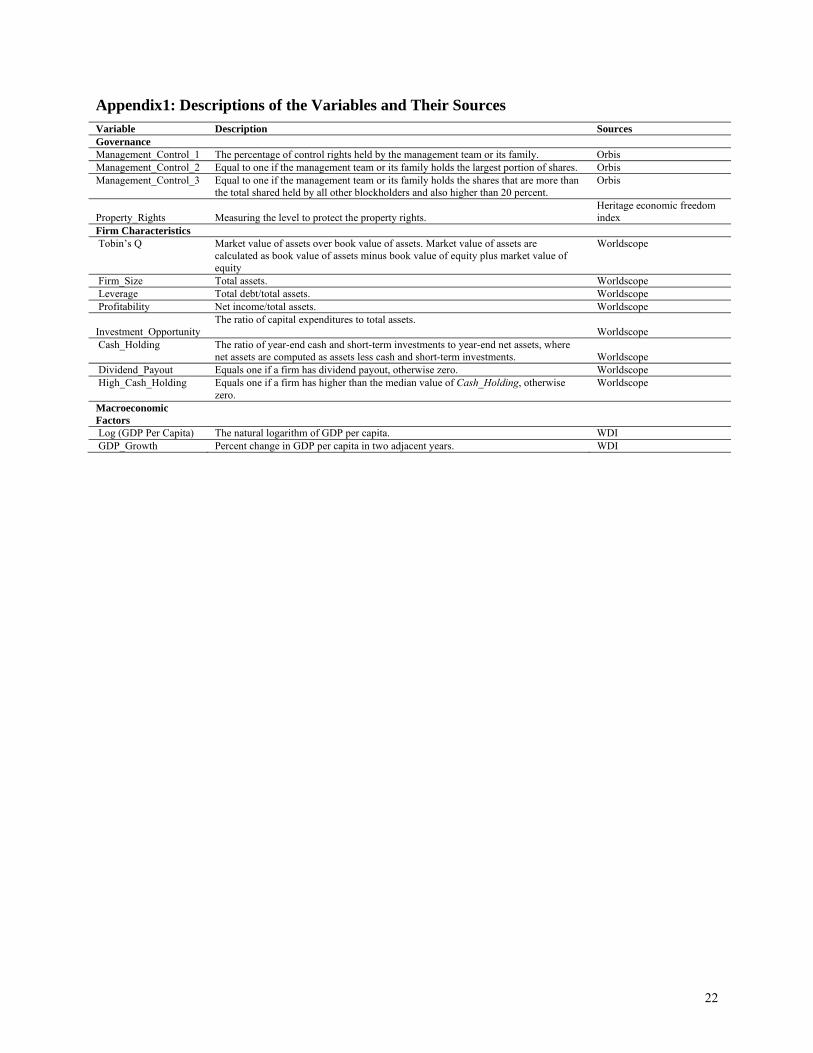
3. Data A. Sample and Variable Construction. Our sample is based on 1921 non financial public firms in the MENA regions (Bahrain, Egypt, Israel, Kuwait, Morocco, Oman, Saudi Arabia, and Tunisia), which have available data to construct our variables in Datastream and Worldscope. Our sample covers the time period between 2005 and 2009 and includes 6971 observations. We collect ownership structure data from Orbis dataset and companies’ websites. Specifically, we use management/family control rights to measure firm-level corporate governance. When management/ family have more control rights of the firm, they are more likely to expropriate outside shareholders. Following the existing literature (e.g., Kalcheva and Lin, 2007), we construct three measures of managerial entrenchment. First, we create a variable Management_Control_1, which is measured as the percentage of control rights held by the management team or its family. However, control rights also depend on the shares by other blockholders. Thus, we construct two other measures Managerment_Control_2 and Managerment_Control_3. The dummy variable Managerment_Control_2 is equal to one if the management team or its family holds the largest portion of shares. The dummy variable Managerment_Control_3 is equal to one if the management team or its family holds the shares that are more than the total shared held by all other blockholders and also higher than 20%.
We use property rights from heritage economic freedom index to measure country-level investor protection and construct the variable Property_Rights. Bae and Goyal (2009) argue that property right is a measure of enforcement of the laws, which is more important than the existence of the laws. We also include the two variables to control for macroeconomic effects. The variable Log (GDP Per Capita) is measured as the natural logarithm of GDP per capita, which measures a country’s overall economic status. The variable GDP_Growth is measured as percent change in GDP per capita in two adjacent years, which measures the business cycle of a country.
We use stock market measure such as Tobin’s Q to measure firm performance. We obtain our firm characteristics data from Worldscope. Specifically, the variable Firm_Size is measured as the total assets in thousands of U.S. dollars. The variable Leverage is measured as the sum of short-term debt and long-term debt scaled by total assets. The variable Profitability is measured as the ratio of cash flow scaled by total assets. The variable Investment Opportunity is measured as the ratio of capital expenditures to total assets.
Appendix 1 below provides descriptions of the variables and their sources.
B. Summary Statistics Table 1 reports the summary statistics of firm-level and country-level indices in the full sample and by country. Panel A reports number of firms, country-level indices including average value from 2005 to 2019 of Property_Rights, GDP Growth, and Log (GDP Per Capita). Panel B reports average value of Tobin’s Q and the three managerial entrenchment indices. Panel C reports average value of firm characteristics. As shown in Panel A, the mean of Property_Rights, is 51.13, and this measure displays wide dispersion.
The Panel B shows that a firm’s officers and directors and their families hold a big proportion of the control rights. Management control averages 24.13 percentage points. The next two columns report statistics for the other two measures of managerial entrenchment. Managers and their families are the largest blockholder in 25.13% of sample firms, and management/family group

9
control exceeds 20 percentage points and exceeds the control held by all other blockholders combined in 24.13% of sample firms.
Panel C reports average value of firm characteristics. To make sure that our results do not suffer from outlier problem, all financial variables are winsorized at the 1st and 99th percentile of the full sample. The summary statistics for these variables used in our regression analysis closely track those found in other studies.
4. Results In this section, we report the results of our firm-value regression models. We test our hypothesis by estimating a regression model in which firm performance is the dependent variable. Besides the key variables, the control variables include Log (Firm_Size), Leverage, Profitability, and Investment_Opportunity. We include industry and year fixed effects to control for the variation in firm performance across industries and years. We use country random effects models because we employ interactions with property rights in our regressions to test our hypotheses. Hausman test is employed to verify whether random country effects are appropriate.
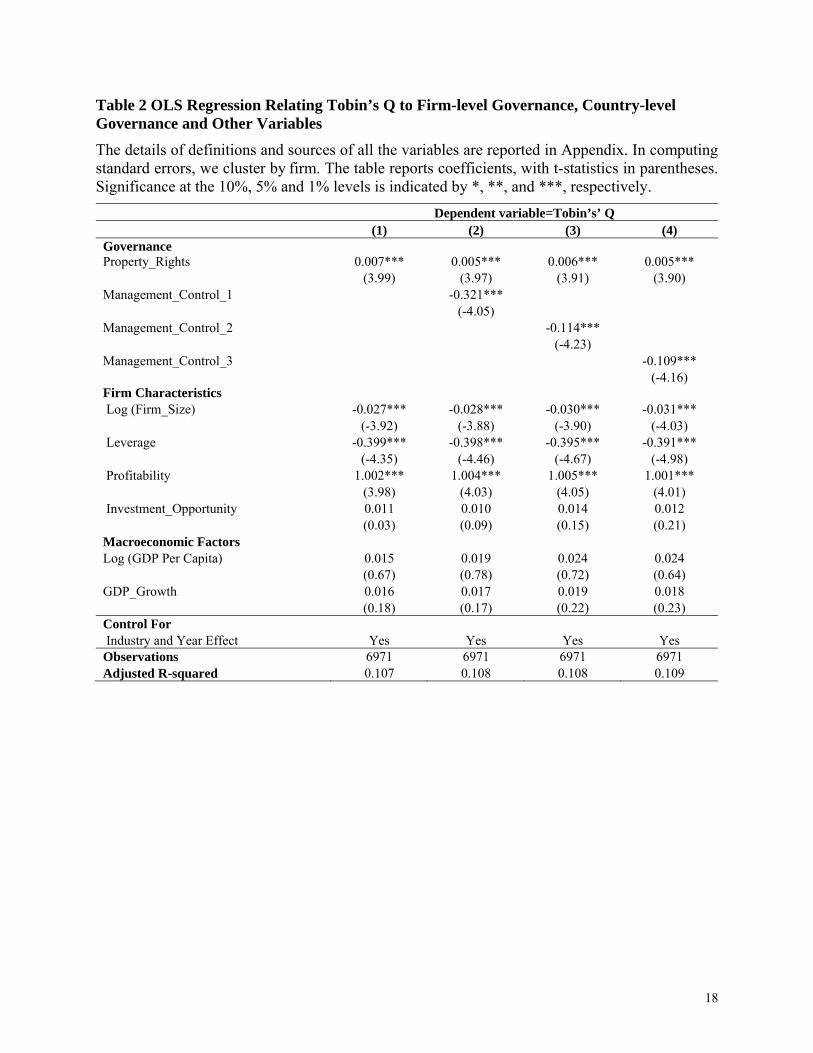
A. Country-level and firm-level governance Table 2 reports the results of models in which the Tobin’s Q is the dependent variable to test Hypothesis 1 and 2. The basic model is as follows:
Firm performance = β0 + β1Firm-level governance + β2Country-level investor protection + β3 Control Variables + ε (1)
The first column contains Rroperty_Rights; the second column contains Management_Control_1 as the managerial entrenchment variable of interest, columns (3) and (4) incorporate Management_Control_2, and Management_Control_3 respectively. Country-level and firm-level governance are key independent variables.
The results are consistent with our hypothesis 1 and 2. For example, as shown in Column (1), the coefficient on the variable Property_Rights is significantly positive (0.007, t-statistic =3.99). These results are not only statistically significant, but also economically significant. For instance, based on the results as shown in Column (1), for a country with mean value of (51.13), a rise in Property_Rights from the 25th percentile (40) to the 75th percentile (65) and corresponds to a 0.175 rise in Tobin’s Q (0.007*(65-40)). With a mean sample Tobin’s Q of 1.27, this means a 13.8% increase in Tobin’s Q on average.
As shown in Column (2), (3), and (4), the coefficient on the variable Management_Control_1, Management_Control_2, and Management_Control_3 are all significantly negative. These results are not only statistically significant, but also economically significant. For instance, based on the results as shown in Column (2), a rise in Management_Control_1 from the 25th percentile (0.00) to the 75th percentile (0.42) and corresponds to a decline 0.135 rise in Tobin’s Q (0.321*(0.42-0.00)). With a mean sample Tobin’s Q of 1.27, this means a 10.6% reduction in Tobin’s Q on average.
B. The interaction between country-level and firm-level governance Table 3 reports the results of models in which the Tobin’s Q is the dependent variable to test Hypothesis 3. The model is as follows:

10
Firm performance = β0 + β1Firm-level governance + β2Country-level investor protection + β3 Firm-level governance * Country-level investor protection + β4Control Variables + ε (2)
The interaction term between firm-level governance and country-level investor protection are key independent variables. The results are consistent with our hypothesis 3. For example, as shown in Column (1), the stand-alone coefficient on the variable Manangement_Control_1 is significantly negative (-0.421. T-statistic =-3.99) and the Property_Rights*Manangement_Control_1 interaction coefficient is significantly positive (0.002, T-statistic =4.03). The positive interaction coefficient indicates that the positive effects of property rights on firm performance are more pronounced for firms with higher managerial entrenchment. This suggests that country-level and firm-level governance are substitutes to determine firm performance. These results are not only statistically significant, but also economically significant. For instance, based on the results as shown in Column (1), for a country with 25th percentile of Property_Rights (40), a rise in managerial control rights from the 25th percentile (0.00) to the 75th percentile (0.42) corresponds to a 0.143 decline in Tobin’s Q ((-0.421+0.002*40)*(0.42-0.00)). With a mean sample Tobin’s Q of 1.27, this means an 11.3% reduction in Tobin’s Q on average. In contrast, for a country with 75th percentile of Property_Rights (65), a rise in managerial control rights from the 25th percentile (0.00) to the 75th percentile (0.42) corresponds to a 0.145 decline in Tobin’s Q ((-0.421+0.002*65)*(0.42-0.00)). With a mean sample Tobin’s Q of 1.27, this means a 9.6% reduction in Tobin’s Q on average.
C. Cash holding As shown in Table 4, we regress Tobin’s Q on interactions between property rights, managerial entrenchment, and high cash holding dummy. Our cash holding measure is the ratio of year-end cash and short-term investments to year-end net assets, where net assets are computed as assets less cash and short-term investments. The dummy variable High_Cash_Holding equals one if a firm has higher than the median value of Cash_Holding, otherwise zero. The model is as follows:
Firm performance = β0 + β1Firm-level governance + β2Country-level investor protection + β3 Firm-level governance * Country-level investor protection + β4 Firm-level governance * Country-level investor protection*High_Cash_Holding + β5Control Variables + ε (3)
The results are consistent with our hypothesis 4. For example, as shown in Column (1), the stand-alone coefficient on the variable Property_Rights is significantly positive (0.004, t-statistic =4.36) and the Property_Rights*Manangement_Control_1 interaction coefficient is significantly positive (0.002, t-statistic =4.24). The positive interaction coefficient indicates that the positive effects of property rights on firm performance are more pronounced for firms with higher managerial entrenchment. Further, the three-way interaction between Property_Rights, Manangement_Control_1, and High_Cash_Holding is significantly positive (0.001, t-statistic =4.36). This positive coefficient indicates that the positive effects of property rights on firm performance are additionally more significant for firms with higher managerial entrenchment and higher cash holding.
D. Dividend payout As shown in Table 5, we regress Tobin’s Q on interactions between property rights, managerial entrenchment, and dividend payout dummy. The dummy variable Dvidend_Payout equals one if a firm pays dividend, otherwise zero. The model is as follows:

11
Firm performance = β0 + β1Firm-level governance + β2Country-level investor protection + β3 Firm-level governance * Country-level investor protection + β4 Firm-level governance * Country-level investor protection*Dividend_Payout + β5Control Variables + ε (4)
The results are consistent with our hypothesis 5. For example, as shown in Column (1), the stand-alone coefficient on the variable Property_Rights is significantly positive (0.005, t-statistic =4.99) and the Property_Rights*Manangement_Control_1 interaction coefficient is significantly positive (0.002, t-statistic =3.88). The positive interaction coefficient indicates that the positive effects of property rights on firm performance are more pronounced for firms with higher managerial entrenchment. Further, the three-way interaction between Property_Rights, Manangement_Control_1, and High_Cash_Holding is significantly negative (-0.001, t-statistic =-2.89). This negative coefficient indicates that the positive effects of property rights on firm performance are additionally less significant for firms with higher managerial entrenchment and dividend payout.
Robustness Tests To make sure our results are robust, we conduct the following robustness tests:.
• We use accounting measures such as ROA and ROE instead of Tobin’s Q to measure firm performance. We find that in all cases our results continue to hold with these new firm performance measures.
• In the reported results, all financial variables are winsorized at the 1st and 99th percentile of the full sample. When we try different winsorization methods, we find that our results are still robust.
• We also try different sample period such as 2005-2007 to avoid the financial crisis period, we obtain similar results.
Although these results are not reported, they are available upon request.
5. Conclusion and Policy Implications One size does not “fit all.” Evidence from recent research have pointed to the nonexistence of an optimal system of governance for all corporations and all countries (Castrillo, et al 2010). Governance mechanisms do not function independently of each other, and their application is determined to a great extent by the prevailing institutional framework in each country (Castrillo et al 2010). A view that has also been confirmed by previous research (Roe, 2000; Francis et al., 2003; Denis and McConnell, 2003).
The recent economic crisis has given high priority to the implementation of sound regulatory frameworks. Policy makers in MENA as well as in other developing and emerging countries are constantly being advised of the need to reform their investor protection laws and improve the quality of their legal environment. As some MENA countries are fast developing and perusing variety of best practice measures, the recent corporate scandals and economic crisis in the US suggest flaws in the Anglo-American model of corporate governance. Some critics believe that reform measures, based largely on Anglo-American model, are likely to be cosmetic in economies with concentrated ownership structure and diverse institutional and sociocultural norms (Nam and Nam, 2004).

12
The appropriate style of corporate governance in any business is a strategic consideration4. When it comes to good corporate governance mechanisms, it is important to remember that legal mandates and regulatory requirements are just one part of the story. The findings of this paper suggest that in addition to the long term goal of promoting reform at the country level, a parallel and short term goal of improving corporate governance at the firm level should also be encouraged. Furthermore, it is important to remember that companies not only need to be well governed, but also to be perceived in the market as being well governed. Therefore, managers can potentially add significant shareholder value by developing good governance practices5. Thus rather than helplessly waiting for regulatory reform to take effect, by establishing credible investor protection provisions, firms in the MENA region can - to a certain extent - take matters into their own hand and affect their performance. Such action might also have positive impact in attracting FDI especially in MENA countries with weak legal/institutional environment.
4 Alex Todd, Corporate Governance Best Practices: One size does not fit all http://www.trustenablement.com/local/Corporate_Governance_Practices-One_size_does_not_fit_all.pdf. 5 Developing corporate governance codes of best practices - The International Bank for Reconstruction and Development . www.ifc.org/ifcext/cgf.nsf/AttachmentsByTitle/...read.../Toolkit2-read.pdf

13
References
Aggarwal, R.; Erel, I.; Stulz, R., and Williamson, R., 2009, “Differences in governance practices between U.S. and foreign firms: measurement, causes, and consequences.” Review of Financial Studies, 22 (8): 3131-3169.
Allen, F.; Qian, J., and Qian, M., 2005, “Law, finance, and economic growth in China.” Journal of Financial Economics, 77:57–116
Aytac, Z. and Sak, G., 2000, “Corporate governance assessment: The Turkish equity market.” Mimeo, available on line at http://www.worldbank.org/ifa/rosc
Bae, K. and Goyal, V. K., 2009, “Creditor Rights, Enforcement, and Bank Loans.” Journal of Finance, 84:823-860
Bebchuk, L.; Cohen, A. and Ferrell, A., 2004, “What matters in corporate governance?” Harvard Law School, John M. Olin Center. Discussion Paper No. 491
Black, B., and Gilson, R., 1998, “Venture capital and the structure of capital markets: Banks versus stock markets.” Journal of Financial Economics, 47:243–277
Black, B.; Jang, H. and Kim, W., 2003, “Does Corporate Governance Matter? Evidence from the Korean Market.” Working Paper no. 209. Stanford
Campos, C.; Newell, R. and Wilson, G., 2002, “Corporate Governance Develops in Emerging Markets.” McKinsey on Finance (Winter):15-18
Castrillo, L.; Marcos, S., and San Martin, J., 2010, “Corporate Governance, Legal Investor Protection, and Performance in Spain and the United Kingdom.” Corporate Ownership & Control, 7(4):416-429
Chidambaran, N.; Palia, D., and Zheng, Y., 2006, “Does better corporate governance “cause” better firm performance?” Working Paper Rutgers Business
Chong, A. and López-de-Silanes, F., 2007, “Investor Protection and Corporate Governance: Firm level Evidence across Latin America”. Washington, DC: Stanford University Press and The World Bank
Chong, A. and López-de-Silanes, F., 2007, “Corporate Governance and Firm Valuation in Mexico”, In A. Chong and F. López -de-Silanes (eds.) Investor Protection and Corporate Governance: Firm level Evidence Across Latin America. Washington, DC: Standford University Press and The World Bank
Coffee, J., 2001, “Do Norms Matter? A Cross-country Examination of Private Benefits of Control.” Columbia University Law School Working Paper
DeFond, M. and Hung, M., 2004, “Investor Protection and Corporate Governance: Evidence from Worldwide CEO Turnover.” Journal of Accounting Research 42(2):269-312

14
Denis, D., and McConnell, J., 2003, “International Corporate Governance.” Journal of Financial and Quantitative Analysis, 38(1):1-36
Dittmar, A.; Mahrt-Smith, J., and Servaes, H., 2003, “International corporate governance and cash holdings.” Journal of Financial and Quantitative Analysis, 38(1):111-133
Doidge, C.; Karolyi, A. and Stulz, R., 2001, “Why Are Foreign Firms Listed in the US Worth More?” Working Paper no. 8538. National Bureau of Economic Research, Cambridge, MA
Doidge, C.; Karolyi, A., and Stulz, R., 2007. “Why do countries matter so much for corporate governance?” Journal of Financial Economics, 86(1):1-39
Durnev, A., and Kim, E., 2005, “To steal or not to steal: Firm attributes, legal environment, and valuation,” Journal of Finance, 60, 1461-1493
Dyck, A. and Zingales, L., 2002, “Private Benefits of Control: An International Comparison.” NBER Working Paper 8711. Cambridge, United States: National Bureau of Economic Research
Easterbrook, F. and Fischel, D., 1991, “The Economic Structure of Corporate Law.” Harvard University. Press, Cambridge, MA.
Francis, J.; Khurana, I. and Pereira, R., 2003, “The Role of Accounting Auditing in Corporate Governance and the Development of Financial Markets around the World,” Asia-Pacific Journal of Accounting & Economics, 9:135-157
Francis, J.; Khurana, I. and Pereira, R., 2001, “Investor protection Laws, Accounting and Auditing around the World.” Working Paper (SSRN)
Franks, J.; Meyer, C. and Rossi, S., 2009, “Ownership: Evolution and Regulation.” Review of Financial Studies, 22(10):4009-4056
Fulghieri, P., and Suominen, M., 2006, “Corporate Governance, Finance, and the Real Sector.” Working Paper, University of North Carolina, Chapel Hill
Garay, U. and González, M., 2008, “Corporate Governance and Firm Value: The Case of Venezuela.” Corporate Governance, 16(3):194-209
Gompers, P.; Ishii, J. and Metrick, A., 2003, “Corporate governance and equity prices.” Quarterly Journal of Economics, 118:107-155
Harford, J.; Mansi, S., and Maxwell, W., 2008, “Corporate Governance and Firm Cash Holding.” Journal of Financial Economics, 87:535-555
International Country Risk Guide, 2000. The PRS Group, New York
Jensen, M., 1986, “Agency costs of the free cash flow, corporate finance and takeovers.” American Economic Review ,76:323-329.
15
Jiraporn, P., and Ning, Y., 2006, “Dividend Policy, Shareholder Rights, and Corporate Governance.” Journal of Applied Finance, 16(2):24-36
John, K., and Kedia, S., 2006, “Institutions, Markets and Growth: A Theory of Comparative Corporate Governance.” Working Paper, New York University
Kalcheva, I., and Lin, K. V., 2007, “International Evidence on Cash Holdings and Expected Managerial Agency Problems.” The Review of Financial Studies, 20(4):1087-1112
Kang, J. and Shivdasani, A., 1995, “Firm performance, corporate governance, and top executive turnover in Japan.” Journal of Financial Economics, 38(1):29-58
Klapper, L. and Love, I., 2004, “Corporate governance, investor protection and performance in emerging markets,” Journal of Corporate Finance, 10(5):703–728
Kobeissi, N. and Sun, X., 2010, “Ownership Structure and Bank Performance: Evidence from Middle East and Nothr5th Africa Region.” Comparative Economic Studies, 52(3):287-323
Kreps, D. M, 1990, “Corporate culture and economic theory.” In: J.E. Alt and K.A. Shepsle, eds., Perspectives on Positive Political Economy (Cambridge University Press):90–143
La Porta, R.; Lopez-de-Silanes, F.; Shleifer, A. and Vishny, R., 1997, “Legal determinants of external finance.” Journal of Finance 52:1113-1132
La Porta, R.; Lopez-de-Silanes, F.; Shleifer, A., and Vishny, R., 1998, “Law and finance.” Journal of Political Economy, 106: 1113-1155
La Porta, R.; Lopez-de-Silanes, F.; Shleifer, A. and Vishny, R., 2000, “Investor protection and corporate governance.” Journal of Financial Economics, 58:3−27
La Porta, R;, Lopez-de-Silanes, F.; Shleifer, and Vishny, R., 2002.,”Investor protection and corporate valuation.” Journal of Finance, 57:1147−1170
Leal, R., and Carvalhal-da-Silva, A., 2007, Corporate Governance and Value in Brazil (and Chile)”, In A. Chong and F. López -de-Silanes (eds.) Investor Protection and Corporate Governance: Firm level Evidence Across Latin America. Washington, DC: Standford University Press and The World Bank
Lefort, F., and Walker, E., 2007, “The Effect of Corporate Governance Practices on Company Market Valuation and Payout Policy in Chile”, In A. Chong and F. López -de-Silanes (eds.) Investor Protection and Corporate Governance: Firm level Evidence Across Latin America. Washington, DC: Standford University Press and The World Bank
Lins, K. & Kalcheva, I. 2004. “International evidence on cash holdings and expected managerial agency problems.” Working Paper, University of Utah, 1-45
Milton, T., 2004, “Corporate Governance and Dividend Policy in Emerging Markets.” Emerging Markets Review, 5: 409-426
16
Nam, S., and Nam, I., 2004, “Corporate governance in Asia: Recent evidence from Indonesia, Republic of Korea, Malaysia, and Thailand.” Report by the Asian Development Bank Institute, Tokyo
Pinkowitz, L.; Stulz, R. and Williamson, R., 2004, “Do firms with poor protection of investor rights hold more cash?” Working Paper. Georgetown University, 1-45
Pinkowitz, L.; Stulz, R. and Williamson, R., 2006, “Does the Contribution of Corporate Cash Holdings and Dividends to Firm Value Depend on Governance? A Cross-country Analysis.” Journal of Finance. 61(6):2725-2751
Reese, W. A., Jr., and Weisbach, M. S., 2002, “Protection of Minority Shareholder Interests, Cross-Listings in the United States, and Subsequent Equity Offerings.” Journal of Financial Economics, 66:65–104
Roe, M., 2000, “Political preconditions to separating ownership from corporate control.” Stanford Law Review 53:539–606
Shleifer, A. and Vishny, R., 1997, “A survey of corporate governance.” Journal of Finance, 52:737–783
Shleifer, A. and Wolfenson, D., 2002, “Investor Protection and Equity Markets,” Journal of Financial Economics, 66(1):3-27
Stulz, R., 1990, “Managerial discretion and optimal financing policies.” Journal of Financial Economics, 26:3-27
Stafsudd, A., 2009, “Corporate Networks as Informal Governance Mechanisms: A Small Worlds Approach to Sweden.” Corporate Governance: An International Review, 17(1):62–76
Wright, M.; Filatotchev, I.; Hoskisson, R. and Peng, M., 2005, “Strategy research in emerging economies: Challenging the conventional wisdom.” Journal of Management Studies, 42(1):1-33
Yermack, D., 1996, “Higher market valuation companies with a small board of directors.” Journal of Financial Economics, 40:185-212
Yurtoglu, B., 2000, ‘‘Ownership, control and performance of Turkish listed firms’’, Emprica, 27:193-222, Kluwer Academic Publishers, Netherlands

17
Table 1 Summary Statistics
This table presents summary statistics of firm-level and country-level indices in the full sample and by country. Panel A reports number of firms, country-level indices including average value from 2005 to 2009 of Property_Rights, GDP Growth, and Log (GDP Per Capita). Panel B reports average value of Tobin’s Q and the three managerial entrenchment indices. Panel C reports average value of firm characteristics. The details of definitions and sources of all the variables are reported in Appendix.
Panel A No. of Property GDP Growth Log (GDP firms Rights (Percentage) Per Capita) All Sample 1921 51.13 2.19 4.01 BAHRAIN 45 64 3.36 4.30 EGYPT 827 44 4.56 3.39 ISRAEL 635 70 0.89 4.42 KUWAIT 132 51 -3.25 4.60 MOROCCO 72 32 4.90 3.46 OMAN 85 50 3.56 4.19 SAUDI ARABIA 91 48 0.52 4.17 TUNISIA 34 50 3.01 3.58 Panel B Tobin’s Management_ Management_ Management_ Q Control_1 (%) Control_2 (%) Control_3 (%) All Sample 1.27 25.13 35.13 24.13 BAHRAIN 1.13 34 45 31 EGYPT 1.03 25 36 21 ISRAEL 1.45 24 31 22 KUWAIT 1.98 32 42 30 MOROCCO 1.03 14 25 17 OMAN 0.94 26 37 28 SAUDI ARABIA 1.36 14 23 19 TUNISIA 1.26 32 42 25 Panel C Firm_ leverage Profitability Investment_ Size Opportunity All Sample 2495.13 0.28 0.08 0.06 BAHRAIN 3562 0.25 0.10 0.09 EGYPT 2451 0.33 0.12 0.07 ISRAEL 987 0.38 0.08 0.06 KUWAIT 3581 0.29 0.09 0.05 MOROCCO 2689 0.28 0.07 0.04 OMAN 2912 0.24 0.06 0.08 SAUDI ARABIA 1789 0.21 0.07 0.03 TUNISIA 1990 0.26 0.08 0.07
18
Table 2 OLS Regression Relating Tobin’s Q to Firm-level Governance, Country-level Governance and Other Variables
The details of definitions and sources of all the variables are reported in Appendix. In computing standard errors, we cluster by firm. The table reports coefficients, with t-statistics in parentheses. Significance at the 10%, 5% and 1% levels is indicated by *, **, and ***, respectively.
Dependent variable=Tobin’s’ Q (1) (2) (3) (4)
Governance Property_Rights 0.007*** 0.005*** 0.006*** 0.005*** (3.99) (3.97) (3.91) (3.90) Management_Control_1 -0.321*** (-4.05) Management_Control_2 -0.114*** (-4.23) Management_Control_3 -0.109*** (-4.16) Firm Characteristics Log (Firm_Size) -0.027*** -0.028*** -0.030*** -0.031*** (-3.92) (-3.88) (-3.90) (-4.03) Leverage -0.399*** -0.398*** -0.395*** -0.391*** (-4.35) (-4.46) (-4.67) (-4.98) Profitability 1.002*** 1.004*** 1.005*** 1.001*** (3.98) (4.03) (4.05) (4.01) Investment_Opportunity 0.011 0.010 0.014 0.012 (0.03) (0.09) (0.15) (0.21) Macroeconomic Factors Log (GDP Per Capita) 0.015 0.019 0.024 0.024 (0.67) (0.78) (0.72) (0.64) GDP_Growth 0.016 0.017 0.019 0.018 (0.18) (0.17) (0.22) (0.23) Control For Industry and Year Effect Yes Yes Yes Yes Observations 6971 6971 6971 6971 Adjusted R-squared 0.107 0.108 0.108 0.109

19
Table 3 OLS Regression Relating Tobin’s Q to the Interaction between Firm-level and Country-level Governance and Other Variables
The details of definitions and sources of all the variables are reported in Appendix. In computing standard errors, we cluster by firm. The table reports coefficients, with t-statistics in parentheses. Significance at the 10%, 5% and 1% levels is indicated by *, **, and ***, respectively.
Dependent variable=Tobin’s’ Q (1) (2) (3) Governance Property_Rights 0.005*** 0.004*** 0.003*** (4.25) (4.03) (4.13) Management_Control_1 -0.421*** (-3.99) Management_Control_2 -0.211*** (-3.92) Management_Control_3 -0.262*** (-3.89) Property_Rights *Management_Control_1 0.002*** (4.03) Property_Rights *Management_Control_2 0.002*** (3.99) Property_Rights *Management_Control_3 0.002*** (4.92) Firm Characteristics Log (Firm_Size) -0.031*** -0.032*** -0.033*** (-4.25) (-4.34) (-4.15) Leverage -0.402*** -0.406*** -0.401*** (-4.67) (-4.34) (-4.47) Profitability 1.011*** 1.003*** 1.007*** (4.14) (4.24) (4.16) Investment_Opportunity 0.014 0.013 0.011 (0.24) (0.21) (0.28) Macroeconomic Factors Log (GDP Per Capita) 0.021 0.021 0.024 (0.45) (0.41) (0.47) GDP_Growth 0.011 0.013 0.015 (0.30) (0.25) (0.21) Control For Industry and Year Effect Yes Yes Yes Observations 6971 6971 6971 Adjusted R-squared 0.107 0.108 0.101

20
Table 4 Regression Relating Tobin’s Q to the Interaction between Firm-level Governance, Country-level Governance, Cash Holding and Other Variables The details of definitions and sources of all the variables are reported in Appendix. In computing standard errors, we cluster by firm. The table reports coefficients, with t-statistics in parentheses. Significance at the 10%, 5% and 1% levels is indicated by *, **, and ***, respectively.
Dependent variable=Tobin’s’ Q (1) (2) (3) Governance Property_Rights 0.004*** 0.003*** 0.002*** (4.36) (3.90) (4.36) Management_Control_1 -0.511*** (-3.01) Management_Control_2 -0.301*** (-3.98) Management_Control_3 -0.312*** (-3.94) Property_Rights *Management_Control_1 0.002*** (4.24) Property_Rights *Management_Control_2 0.002*** (4.51) Property_Rights *Management_Control_3 0.002*** (4.03) Property_Rights *Management_Control_1*High_Cash_Holding 0.001*** (4.36) Property_Rights *Management_Control_2*High_Cash_Holding 0.001*** (4.56) Property_Rights *Management_Control_3*High_Cash_Holding 0.001*** (4.10) Firm Characteristics High_Cash_Holding -0.210 -0.203 -0.200 (-0.25) (-0.29) (-0.26) Log (Firm_Size) -0.030*** -0.031*** -0.034*** (-4.14) (-4.26) (-4.34) Leverage -0.410*** -0.403*** -0.405*** (-4.52) (-4.45) (-4.67) Profitability 1.002*** 1.006*** 1.001*** (4.02) (4.05) (4.07) Investment_Opportunity 0.011 0.015 0.017 (0.29) (0.24) (0.22) Macroeconomic Factors Log (GDP Per Capita) 0.020 0.022 0.023 (0.51) (0.44) (0.43) GDP_Growth 0.012 0.016 0.014 (0.33) (0.27) (0.19) Control For Industry and Year Effect Yes Yes Yes Observations 6971 6971 6971 Adjusted R-squared 0.107 0.108 0.101

21
Table 5 Regression Relating Tobin’s Q to the Interaction between Firm-level Governance, Country-level Governance, Dividend Payout and Other Variables
The details of definitions and sources of all the variables are reported in Appendix. In computing standard errors, we cluster by firm. The table reports coefficients, with t-statistics in parentheses. Significance at the 10%, 5% and 1% levels is indicated by *, **, and ***, respectively.
Dependent variable=Tobin’s’ Q (1) (2) (3) Governance Property_Rights 0.005*** 0.004*** 0.003*** (4.99) (3.99) (4.01) Management_Control_1 -0.401*** (-3.99) Management_Control_2 -0.251*** (-3.98) Management_Control_3 -0.412*** (-4.03) Property_Rights *Management_Control_1 0.002*** (3.88) Property_Rights *Management_Control_2 0.002*** (3.92) Property_Rights *Management_Control_3 0.002*** (3.99) Property_Rights *Management_Control_1*Dividend_Payout -0.001** (-2.89) Property_Rights *Management_Control_2* Dividend_Payout -0.001** (-2.76) Property_Rights *Management_Control_3* Dividend_Payout -0.001** (-2.85) Firm Characteristics Dividend_Payout -0.192 0.187 0.199 (-0.56) (0.63) (0.42) Log (Firm_Size) -0.028** -0.029** -0.027** (-2.78) (-2.74) (-2.73) Leverage -0.407*** -0.412*** -0.403*** (-4.24) (-4.01) (-4.34) Profitability 1.000*** 1.002*** 1.004*** (4.13) (4.14) (4.16) Investment_Opportunity 0.010 0.012 0.013 (0.13) (0.18) (0.17) Macroeconomic Factors Log (GDP Per Capita) 0.018 0.024 0.021 (0.46) (0.49) (0.41) GDP_Growth 0.015 0.018 0.016 (0.19) (0.27) (0.25) Control For Industry and Year Effect Yes Yes Yes Observations 6971 6971 6971 Adjusted R-squared 0.107 0.108 0.101
22
Appendix1: Descriptions of the Variables and Their Sources Variable Description Sources Governance Management_Control_1 The percentage of control rights held by the management team or its family. Orbis Management_Control_2 Equal to one if the management team or its family holds the largest portion of shares. Orbis Management_Control_3 Equal to one if the management team or its family holds the shares that are more than
the total shared held by all other blockholders and also higher than 20 percent. Orbis
Property_Rights Measuring the level to protect the property rights. Heritage economic freedom index
Firm Characteristics Tobin’s Q Market value of assets over book value of assets. Market value of assets are
calculated as book value of assets minus book value of equity plus market value of equity
Worldscope
Firm_Size Total assets. Worldscope Leverage Total debt/total assets. Worldscope Profitability Net income/total assets. Worldscope Investment_Opportunity
The ratio of capital expenditures to total assets. Worldscope
Cash_Holding The ratio of year-end cash and short-term investments to year-end net assets, where net assets are computed as assets less cash and short-term investments. Worldscope
Dividend_Payout Equals one if a firm has dividend payout, otherwise zero. Worldscope High_Cash_Holding Equals one if a firm has higher than the median value of Cash_Holding, otherwise
zero. Worldscope
Macroeconomic Factors Log (GDP Per Capita) The natural logarithm of GDP per capita. WDI GDP_Growth Percent change in GDP per capita in two adjacent years. WDI


![Corporate Governance Manualpaisalo.in/pdf/corporate-governance-en.pdf · [ 1 ] DEFINITIONS Corporate Governance Corporate Governance is the system of internal controls and procedures](https://img.dokumen.tips/doc/110x75/60457b037dc32d128b177c66/corporate-governance-1-definitions-corporate-governance-corporate-governance.jpg)