Embed Size (px)
Citation preview

Corporate & Economic Development Committee
Meeting
Wednesday, 22 April 20155:00pm
Business Papers

[Type text]
To the Lord Mayor and Aldermen You are invited to attend a Corporate & Economic Development Committee Meeting to be held in the Council Chambers, Level 1, Civic Centre, Harry Chan Avenue, Darwin, on Wednesday, 22 April 2015, commencing at 5.00 pm.
DIANA LEEDER ACTING CHIEF EXECUTIVE OFFICER
Office Use Only Placed on Public Notice Board: ___________________________________ Removed from Public Notice Board: ___________________________________
Notice of Meeting

OPEN SECTION CORP04/1
Wednesday, 22 April 2015 CORP04/1
Reports, recommendations and supporting documentation can be accessed via the City of Darwin Council Website at www.darwin.nt.gov.au, at Council Public Libraries or contact the Committee Administrator on (08) 8930 0670.
CITY OF DARWIN
CORPORATE & ECONOMIC DEVELOPMENT COMMITTEE
WEDNESDAY, 22 APRIL 2015
MEMBERS: Member R K Elix (Chairman); The Right Worshipful, The Lord Mayor, Ms K M Fong Lim; Member J A Glover; Member G A Lambert; Member G J Haslett.
OFFICERS: Chief Executive Officer, Mr B P Dowd; General Manager Corporate Services, Dr D Leeder; Manager Business Services, Mr L Carroll; Manager People, Culture & Capability, Ms J Wheeler; Manager Information Technology, Mr R Iap; Manager Finance, Mr M Craighead; Records Manager, Mr K Sohl; Committee Administrator, Mrs P Hart.
Enquiries and/or Apologies: Penny Hart E-mail [email protected] - PH: 89300 670
OR Phone Committee Room 1, for Late Apologies - PH: 89300 519
Committee's Responsibilities
Business Services Contract Administration On and Off Street Parking
Operations Property Management Records and Information
Management Employee Relations Regulatory Services Animal Management
Risk Audit and Safety Financial & Management Fleet Management Strategic Services Communications & Engagement Governance Darwin Entertainment Committee Information Technology
THAT effective as of 16 April 2012 Council pursuant to Section 32 (2)(b) of the Local Government Act 2008 hereby delegates to the Corporate & Economic Development Committee the power to make recommendations to Council and decisions relating to Corporate & Economic Development matters within the approved budget.
* * * INDEX * * * PAGE
1. MEETING DECLARED OPEN .....................................................................5
2. APOLOGIES AND LEAVE OF ABSENCE ..................................................5
3
3

OPEN SECTION CORP04/2
Wednesday, 22 April 2015 CORP04/2
Reports, recommendations and supporting documentation can be accessed via the City of Darwin Council Website at www.darwin.nt.gov.au, at Council Public Libraries or contact the Committee Administrator on (08) 8930 0670.
3. ELECTRONIC MEETING ATTENDANCE ...................................................5
4. DECLARATION OF INTEREST OF MEMBERS AND STAFF ....................5
5. CONFIDENTIAL ITEMS ...............................................................................6
6. WITHDRAWAL OF ITEMS FOR DISCUSSION ...........................................6
7. CONFIRMATION OF MINUTES PERTAINING TO THE PREVIOUSCORPORATE & ECONOMIC DEVELOPMENT COMMITTEE MEETING
Wednesday, 25 March 2015 ...................................................................6
8. BUSINESS ARISING FROM THE MINUTES PERTAINING TO THEPREVIOUS CORPORATE & ECONOMIC DEVELOPMENT COMMITTEEMEETING .....................................................................................................6
9. OFFICERS REPORTS
9.1 Car Sharing Scheme .....................................................................................7 9.2 Monthly Financial Report - March 2015 .........................................................59 9.3 Listing of Cheques/EFT Payments - March 2015 ..........................................81 9.4 Depreciation Expense 2015 ...........................................................................94 9.5 Evaluation of Risk Management & Audit Committee Performance ................142 9.6 Payment of Sitting Fees for Risk Management & Audit Committee ...............149 9.7 Register of Invitations Accepted and Declined by the Lord Mayor
from January - March 2015 ............................................................................152 9.8 Register of Elected Members Professional Development for
2014/2015 ......................................................................................................162
10. INFORMATION ITEMS
10.1 Draft Minutes - Risk Management & Audit Committee 27 March 2015 ..........165 10.2 Darwin City Waterfront Retailers Association - Progress Report ...................179
11. GENERAL BUSINESS....................................................................................182
4
4

OPEN SECTION CORP04/3
Corporate & Economic Development Committee Meeting – Wednesday, 22 April 2015
Wednesday, 22 April 2015 CORP04/3
Reports, recommendations and supporting documentation can be accessed via the City of Darwin Council Website at www.darwin.nt.gov.au, at Council Public Libraries or contact Penny Hart on (08) 8930 0670.
1. MEETING DECLARED OPEN 2. APOLOGIES AND LEAVE OF ABSENCE
Common No. 2695036 2.1 Apologies 2.2 Leave of Absence Granted THAT it be noted Member G J Haslett is an apology due to a Leave of Absence previously granted on 14 April 2015 for the period 14 April 2015 to 19 June 2015. 3. ELECTRONIC MEETING ATTENDANCE
Common No. 2221528 3.1 Electronic Meeting Attendance Granted THAT Council note that pursuant to Section 61 (4) of the Local Government Act and Decision No. 21\0009 – 16/04/12, the following member was granted permission for Electronic Meeting Attendance at this the Corporate & Economic Development Committee Meeting held on Wednesday, 22 April 2015:
Member G J Haslett 4. DECLARATION OF INTEREST OF MEMBERS AND STAFF 4.1 Declaration of Interest by Members 4.2 Declaration of Interest by Staff
5
5

OPEN SECTION CORP04/4
Corporate & Economic Development Committee Meeting – Wednesday, 22 April 2015
Wednesday, 22 April 2015 CORP04/4
Reports, recommendations and supporting documentation can be accessed via the City of Darwin Council Website at www.darwin.nt.gov.au, at Council Public Libraries or contact Penny Hart on (08) 8930 0670.
5. CONFIDENTIAL ITEMS 5.1 Closure to the Public for Confidential Items
Common No. 1944604 THAT pursuant to Section 65(2) of the Local Government Act and Regulation 8 of the Local Government (Administration) Regulations the meeting be closed to the public to consider the following Items:-
Item Regulation Reason
C13 8(c)(iv) information that would, if publicly disclosed, be likely to prejudice the interests of the council or some other person
C15.1 8(b) information about the personal circumstances of a resident or ratepayer
5.2 Moving Open Items Into Confidential 5.3 Moving Confidential Items Into Open 6. WITHDRAWAL OF ITEMS FOR DISCUSSION THAT the Committee resolve under delegated authority that all Information Items and Officers Reports to the Corporate & Economic Development Committee Meeting held on Wednesday, 22 April 2015 be received and considered individually. 7. CONFIRMATION OF MINUTES PERTAINING TO THE PREVIOUS
CORPORATE & ECONOMIC DEVELOPMENT COMMITTEE MEETING THAT the Committee resolve that the minutes of the previous Corporate & Economic Development Committee Meeting held on Wednesday, 25 March 2015, tabled by the Chairman, be received and confirmed as a true and correct record of the proceedings of that meeting. 8. BUSINESS ARISING FROM THE MINUTES PERTAINING TO THE
PREVIOUS CORPORATE & ECONOMIC DEVELOPMENT COMMITTEE MEETING
8.1 Business Arising
6
6

ENCL: YES
CORPORATE & ECONOMIC DEVELOPMENT COMMITTEE/OPEN
AGENDA ITEM: 9.1
CAR SHARING SCHEME
REPORT No.: 15A0044 LC:mp COMMON No.: 2925935 DATE: 22/04/2015
Presenter: Manager Business Services, Liam Carroll Approved: General Manager Corporate Services, Diana Leeder PURPOSE The purpose of this report is to present Council information regarding car sharing in the Darwin CBD. LINK TO STRATEGIC PLAN The issues addressed in this Report are in accordance with the following Goals/Strategies of the City of Darwin 2012 – 2016 as outlined in the ‘Evolving Darwin Towards 2020 Strategic Plan’:- Goal 2 Vibrant, Flexible and Tropical Lifestyle Outcome 2.4 Economic growth supported Key Strategies 2.4.1 Deliver, advocate for, and partner in infrastructure and services that support
Darwin’s economic growth KEY ISSUES Council at its meeting on 14 October 2014 requested a report considering the
feasibility of a car sharing scheme in Darwin A car share scheme is currently underway as part of the student accommodation
at Casuarina Square called “Car Share Darwin”. Following preliminary discussions with the operator of Car Share Darwin this
report recommends in principle agreement to trial a car share scheme in the CBD providing up to four car parking bays free of charge for a 12 month period
7
7
PAGE: 2 REPORT NUMBER: 15A0044 LC:mp SUBJECT: CAR SHARING SCHEME RECOMMENDATIONS THAT it be a recommendation to Council:- A. THAT Report Number 15A0044 LC:mp entitled Car Sharing Scheme, be
received, and noted. B. THAT Council support in principle the provision of four car bays in the CBD free
of charge for 12 months to trial a car share scheme.
C. THAT a further report be brought detailing the terms and conditions of a car share scheme in Darwin.
BACKGROUND Council at its meeting on 14 October 2014 resolved as follows: DECISION NO 21\2714 (14/10/14) Car-Sharing Common No. 2925935 THAT a report be prepared for the Corporate & Economic Development Committee to consider the feasibility of car-sharing in Darwin including electric vehicles DISCUSSION Council officers have completed some preliminary desk top analysis on the possibility of a car sharing scheme in Darwin. At the moment Council officers are now aware of any such schemes operating outside of the larger metropolitan area of Brisbane, Sydney, Melbourne, Adelaide and Perth. A car sharing policy and cost benefit analysis from the City of Sydney are set out at Attachment A and B. The key planning objectives for such a scheme are as follows: More efficient use of car parking in the City Reduced greenhouse emission Support the economy Reduced congestion Reduced private vehicle ownership The scheme works particularly well in jurisdictions where there is little or no off-street car parking within residential developments, supported by a quality public transport network. Surry Hills in Sydney was sighted as a prime example by Julie Gee the Transport Planner from the City of Sydney.
8
8
PAGE: 3 REPORT NUMBER: 15A0044 LC:mp SUBJECT: CAR SHARING SCHEME The demographic profile and maturity of the city play a key determining factor in the take up of the scheme; with the 30 year old still renting being a typical user. To be financially sustainable a car share provider requires 20 people to support each vehicle. In a start-up phase proposal a car share provider would typically require a two year trial period with a minimum of five vehicles which would need to be financially underwritten. GTP / Casuarina Square Student Lodge has introduced a car sharing scheme and initially selected “Go Get” one the main national providers as the preferred supplier. However the company decided it is not commercially appropriate for it to operate in Darwin at this point. GPT has however identified a local provider, “The Scooter Shop” which is prepared to provide the service, and has acquired access to the Go Get systems and processes. Following discussions with a representative from “The Scooter Shop” “Car Share Darwin” is now operating at The Student Lodge at Casuarina Square. Initial discussions with The Scooter Shop indicate an interest in operating the system in the CBD. This would require Council’s support through the provision of four car bays in the CBD free of charge for a period of 12 months. Should Council agree in principle with the car sharing scheme proposal a more detailed report addressing options for where the bays will be located, conditions of the car sharing agreement, and use of bays will be provided to Council. CONSULTATION PROCESS This report was considered by the Chief Officers Group on 23 March 2015 and is now presented to Council for consideration; GPT – General Property Trust – General Manager Sydney City Council - Transport Planner POLICY IMPLICATIONS Nil BUDGET AND RESOURCE IMPLICATIONS The estimated lost revenue for four bays in Zone A in the CBD is $8,000 per annum. RISK/LEGAL/LEGISLATIVE IMPLICATIONS Nil
9
9

PAGE: 4 REPORT NUMBER: 15A0044 LC:mp SUBJECT: CAR SHARING SCHEME ENVIRONMENTAL IMPLICATIONS Successful car sharing programs reduce the level of greenhouse emissions. COUNCIL OFFICER CONFLICT OF INTEREST DECLARATION We the Author and Approving Officers declare that we do not have a Conflict of Interest in relation to this matter. LIAM CARROLL DIANA LEEDERMANAGER BUSINESS SERVICES GENERAL MANAGER
CORPORATE SERVICES For enquiries, please contact Liam Carroll on 8930 0559 or email: [email protected]. Attachments: Attachment A: Car Sharing Policy – City of Sydney Attachment B: Car Sharing Cost Analysis – City of Sydney
10
10

Car Sharing Policy
11
11

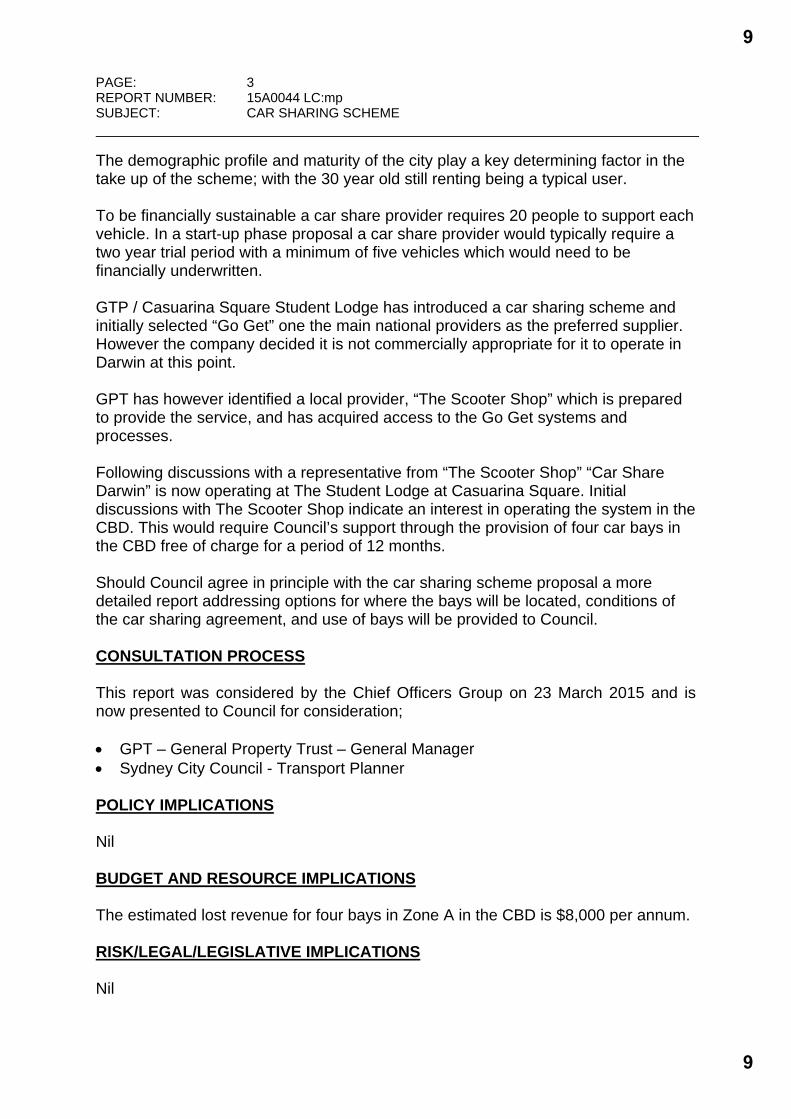
PURPOSE Car sharing is crucial complement to a sustainable transport system for Sydney. The availability of shared cars provides the peace-of-mind and flexibility needed for residents who have chosen to base their travel predominantly on public transport, walking and cycling. Car share programs allow members to book a nearby vehicle for a short time, unlock it with a membership card, and later return the vehicle at the end of the booking. Cost is calculated on time and trip distance. The City of Sydney is committed to increasing the uptake of car sharing to 10% of all households by 2016. We will achieve this target by continued support for on-street car sharing and the placement of shared cars in city car parks; new planning controls to integrate car sharing into urban renewal areas; greater marketing and education, and continued enforcement of dedicated car share spaces. Many cities have recognised the opportunity to integrate car sharing with public transport, public bicycle schemes, publicly owned vehicle fleets, and other transport sustainability programs. The City will actively investigate these options, and will collaborate on further studies of the benefits and opportunities associated with car sharing. 1. INTENDED OUTCOMES The City of Sydney’s Sustainable Sydney 2030 strategy envisages a sustainable and efficient transport network with more options to walk, cycle, and use public transport. Car sharing is a key program to complement sustainable travel modes, and allow City residents to reduce their reliance on private vehicles. The specific objectives of the car share policy are to: Use street parking more efficiently. In many areas of the City, growing resident parking demand has exhausted the available kerbside parking space. Car sharing is a much more efficient use of parking space, allowing a single vehicle to be used frequently by a large number of households. Reduce City greenhouse emissions. Car share vehicles are typically much newer and more fuel-efficient than the average vehicle. They emit fewer greenhouse gases and fewer urban air pollutants such as carbon monoxide and nitrogen oxides. In addition to driving less overall, a car share driver will consequently produce fewer emissions per kilometre than the average private driver. Increased uptake of car sharing will contribute to the realisation of the City’s target of reducing greenhouse emissions by 70% by 2030. Support the City economy. Many city businesses, especially small businesses, operate in neighbourhoods with limited off street parking & high parking costs. Use of shared vehicles (including vans) is a realistic option for many of these businesses, and contributes to the viability of small business in inner-city neighbourhoods. Reduce congestion. Trips in shared cars tend to be planned in advance rather than last minute, and charges increase in proportion to trip distance and duration. For this reason, those who share a vehicle make fewer and shorter trips than private drivers. Greater uptake of car sharing will consequently reduce total driving and on-road congestion. Slow growth in private vehicle ownership. The City of Sydney has the lowest rate of household car ownership in Metropolitan Sydney, at just 0.72 cars per household (in 2006). In many City neighbourhoods, however, household car ownership levels are rising quickly,
2
12
12
with serious implications for parking availability, traffic congestion and resource consumption. Increased car sharing can slow growth in household vehicle holdings. 2. CAR SHARE TARGETS The City of Sydney will work to increase penetration of car sharing to 10% of all households by 2016. In support of the 10% car share target, the City will develop transport, traffic management, enforcement and land use policies that limit new parking supply, integrate land use and transport, support public transport, and improve conditions for walking and cycling. As of September 2010, there were approximately 4000 residential car share members, accounting for an estimated 2500 households. At current rates of population growth, a 10% target implies approximately 9,500 households using a shared car by 2016. Many households will have more than one eligible car share driver, so total membership may exceed 15,000. On the assumption that a new car is needed for every 20-30 registered drivers, 500 to 750 cars may be required. This amounts to between 0.6 and 1% of total private vehicles forecast to be registered in the City of Sydney in 2016. Because car sharing complements, rather than competes with, sustainable transport modes, the uptake of car sharing will be influenced heavily by the quality of the transport alternatives, particularly the bus, train and light-rail network, and the cycle network. When public transport, walking and cycling are convenient options, many households will be able to use car sharing instead of a private car. These households in turn enter a ‘virtuous cycle’, driving less while increasing their walking, cycling and public transport trips. The ratio of on-street to off-street car share spaces will vary significantly between City neighbourhoods depending on the scope for new commercial and residential development, and the precise controls adopted in the City’s Development Control Plan. 3. DEDICATED CAR SHARE SPACES On-street spaces The City will provide dedicated and exclusive on-street space for authorised car share vehicles. The quantity and location of on-street spaces will be commensurate with membership levels in the City of Sydney. The use of dedicated on-street spaces allows for convenient and equitable provision of car sharing across the City’s different neighbourhoods. The benefits include: i) Efficiency: A greater number of City residents and businesses can use finite on-street
space, with a car-sharing household occupying up to 15 times less street space than it would occupy with a private vehicle parked on-street.
ii) Equity: Access to street parking is extended to a greater proportion of households,
including those who choose not to buy, or cannot afford, a private vehicle. iii) Convenience. On-street parking allows cars to be located close to residents, and
evenly distributed throughout neighbourhoods. The City reserves the right to reject any application for establishment of an on-street car share space. The City may also refuse speculative and large scale placement of car share vehicles in the absence of reasonably foreseeable resident and business demand. City car parks
3
13
13

The City will provide car-share spaces in City-owned car parks, in convenient and secure locations close to car park entrances. Where specific state taxes apply to parking space, such as the Parking Space Levy, these will be payable by the car share operator. The City will seek reform to the NSW Government’s Parking Space Levy to reduce the rate payable by shared vehicles. Off-street spaces The City of Sydney will encourage on-site car share spaces where feasible, safe and accessible to the surrounding community and upon agreement with the owners’ corporation. 4. MANAGEMENT OF CAR SHARE PROVIDERS Agreements Car share operators will be required to enter legal agreements with the City governing the terms of their use of on-street spaces. Definition of a car share provider The City will dedicate on-street car share spaces only to genuine car share companies or service providers. To qualify, the provider must:
i) Have, or be developing, a network of cars in locations that are accessible to all members.
ii) Allow, until 1 July 2012, at a minimum, any licensed driver over age 21 to join, subject to reasonable creditworthiness and driving history checks.
iii) Allow, from 1 July 2012, at a minimum, any licensed driver over age 18 to join, subject to reasonable creditworthiness and driving history checks.
iv) Supply an internet and phone-based booking system available to members 24 hours per day, allowing immediate booking of vehicles.
v) Offer minimum booking durations of one hour or less.
vi) Ensure that no on-street space is booked for longer than four days unless a replacement vehicle is provided for the space.
vii) Prohibit the routine long-duration reservation or exclusive use, including overnight use, of an on-street vehicle by any one nearby member, either individual or business.
Obligations of car share providers Agreements between the City of Sydney and car share operators will include the following obligations on the part of car share providers: i) Quarterly reports – Car share providers must provide a detailed usage report,
itemised by location, indicating number of bookings per month, average trip distance, and length of bookings. The report must also identify membership levels in the City of Sydney by postcode, and composition of membership between businesses and individuals.
ii) Financial soundness - A car share provider must submit to an independent financial audit by a City-approved auditor. The audit, which will remain commercial in confidence, must demonstrate to the satisfaction of the City that the operator is financially sound, and capable of meeting obligations to members.
4
14
14

iii) Availability of vehicles – Cars will be available for 95% of confirmed bookings.
iv) Vehicle Environmental Impact – An operator must not use any passenger vehicle in a dedicated on-street space with less than a 4-star rating in the Australian Green Vehicle Guide. In the case of other vehicle types, such as vans or utilities, an operator must demonstrate that the vehicle is a high environmental performer for its class.
Withdrawal of spaces In the case of non-compliance with these obligations, the City may impose sanctions to remedy the breach, and deter future non-compliance. Sanctions, if applied, will be progressively escalated, and may include: i) Suspension of an operator’s right to use one or more dedicated car share spaces.
ii) Suspension of processing of requests for new spaces and/or requests for renewal of parking permits.
iii) Termination of an operator’s agreement with the City of Sydney, and rescission of all spaces provided to the operator by the City.
Authority to terminate an agreement rests with the Chief Executive Officer. The CEO is also authorised to reallocate spaces on-street or in car parks to another car share operator. Recovery of costs The City has made a substantial in-kind contribution to the early viability of car sharing. Fees and charges will maintain the incentive for residents to share vehicles, while balancing support for car sharing with reasonable recovery of public costs: i) Where per-vehicle fees are levied to recoup the administrative costs of issuing
resident parking permits, these fees will apply to car share vehicles.
ii) The City will not impose other charges on car share vehicles intended for use by residents or small businesses unless these charges are also incurred by private vehicles.
iii) The City will fund in full the line-marking and signage of car share spaces until financial year 2011/12. Repayment of these costs may be sought in cases where a car share operator has breached their agreement with the City, or a space is withdrawn at the operator’s request.
iv) From financial year 2011/12 onwards, car share operators may be required to pay the partial or full cost of line-marking and signposting of on-street spaces. Costs will be determined through the annual Fees and Charges review.
5. COMPETITION AND NEW ENTRANTS The City of Sydney car sharing program is open to both existing and new car share operators. Potential new operators must meet the requirements of this policy. The City of Sydney will treat all commercial car share operators consistently. The Chief Executive Officer may authorise the waiving of fees or charges for non-profit car share operators.
5
15
15

6. PROMOTION The City will work to promote community awareness and understanding of car sharing. Where appropriate, this marketing will be incorporated into the City’s promotion of walking, cycling, and public transport. 7. ENFORCEMENT Recognising that illegal parking is particularly problematic for car sharing, the City of Sydney will consistently enforce existing regulation that prohibits non-car share vehicles parking in car share spaces. Levels of non-compliance will be recorded and further actions taken if frequent patrols and high-visibility line marking are not sufficient. 8. CONSULTATION The City will consult with residents in the immediate vicinity of a proposed on-street space. Recognising that car sharing is most viable and beneficial in areas with a high demand for parking, the City will not reject car share spaces based solely on existing parking demand. However, the City will consider alternative locations. 9. RESEARCH AND EVALUATION In-depth studies of the transport and environmental outcomes of car sharing programs in Australia will contribute to better and more effective policy development and advocacy. The City of Sydney will collaborate with other public agencies, research institutions and stakeholders to quantify these outcomes and raise awareness of the findings. . 10. AUTHORISATION This policy is to be authorised by resolution of the Council of the City of Sydney. 11. REFERENCES Studies and Papers Bergmaier, R., Mason, C., McKenzie, M., Campbell, S., and Hobson, A., (2004), Car Sharing: An Overview, Australian Government, Canberra
United States Transportation Research Board of the National Academies (2005) Car-Sharing: Where and How It Succeeds, Washington. Elliot, M., Shaheen, S., & Lidicker, J. Carsharing’s Impact on Household Vehicle Holdings: Results from North American Shared-Use Vehicle Survey, Transportation Research Board Annual Meeting 2010 Paper #10-3437 Related Legislation & Standards Guidelines for the Implementation of On-Street Car Share Parking, Technical Direction, TDT 2007/04, NSW Roads and Traffic Authority, September 2007 Related Policies and Procedures City of Sydney Local Environmental Plan City of Sydney Development Control Plan Review Period Manager City Access Unit will review this policy every two years.
6
16
16

Next Review Date April 2012 12. AUTHORISATION Approved by Council on 4 April 2011
7
17
17
20120076-Final Report-200712
Benefit-Cost Analysis of Car Share within the City of Sydney Final Report The Council of City of Sydney June 2012
18
18

20120076-Final Report-200712
This report has been prepared on behalf of The Council of City of Sydney. SGS Economics and Planning and its associated consultants are not liable to any person or entity for any damage or loss that has occurred, or may occur, in relation to that person or entity taking or not taking action in respect of any representation, statement, opinion or advice referred to herein. SGS Economics and Planning Pty Ltd ACN 007 437 729 www.sgsep.com.au Offices in Brisbane, Canberra, Hobart, Melbourne, Sydney
19
19

City of Sydney
TABLE OF CONTENTS
EXECUTIVE SUMMARY I 1 INTRODUCTION & PROJECT CONTEXT 1 1.1 Project Background 1 1.2 Project Objectives 1 1.3 Car Share Membership/ Usage 1 1.4 GoGet Member Survey Summary 3
Reasons for car share use 3 Deferred car purchase 3 Mode share split 4
1.5 SGS Approach 6 1.6 SGS Report Structure 6
2 CAR SHARE - COSTS & BENEFITS 7 2.1 Introduction 7 2.2 Costs and Benefits of Car Sharing 7 2.3 Assessment Framework 10
Base Case (‘Do Nothing’) Scenario 10 Project Case Scenario 10 Marginal Costs & Benefits 11
3 FORECASTING & VALUATION ASSUMPTIONS 12 3.1 Usage Forecasts 12
Estimates of On-Street Car Share Bays 12 Resident Membership Projections 12 Business Membership Projections 13 Reduction in private car ownership 14
3.2 Key Monetisation Assumptions 16 Deferred Car Purchase Savings 16 Estimated Change in Carbon Emissions 16 Estimated Change in Physical Activity 18 Estimated Change in Parking Time 18
3.3 Key Monetisation Values 19
4 PERFORMANCE RESULTS 21 4.1 Performance Measured Generated 21 4.2 Un-quantified Items 22 4.3 Sensitivity Tests 22 4.4 Distributional Analysis 23 4.5 Conclusions 25
5 REFERENCES 26 6 APPENDIX 28 6.1 Derivation of on-street membership 28 6.2 Estimation of Resident Members 29 6.3 Estimation of Business Members 30 6.4 Parking revenue foregone 32 6.5 Cost Benefit Analysis Spreadsheet 33
20
20

City of Sydney
21
21

City of Sydney i
EXECUTIVE SUMMARY
This report has been prepared by SGS Economics & Planning (SGS) on behalf of the City of Sydney Council (the Council). The report has used a social cost benefit framework to determine the economic, social and environmental costs and benefits of the re-purposing of on-street car parks for car-share member’s exclusive use. For the purposes of this assessment, the geographical scope was considered to be the City of Sydney (LGA). The timeframe of analysis is from 2009, i.e. the commencement year of analysis coinciding with the year of the scheme’s introduction, to 2023. Off-street car share bays were considered outside the scope of this study. In preparing this report, SGS:
Reviewed relevant literature with a view to identifying costs and benefits of car share schemes and subsequently preparing an assessment framework that isolated legitimate costs and benefits from a strict cost benefit analysis (CBA) perspective.
Analysed the monthly statistics on Sydney car share scheme usage provided by Council (for the 2009-12 timeframe), as well as the results of the GoGet member car share scheme survey (from April 2010 and December 2011).
Forecast usage (car share bay provision, membership and mode share splits of alternate modes of transport) ‘with’ and ‘without’ car-share member ‘exclusive use’ parking spaces.
Populated the CBA framework and generated performance measures (benefit cost ratio (BCR), net present value (NPV)) associated with moving to the Project Scenario, i.e. ‘with’ exclusive use car spaces, from the Base Case Scenario of ‘without’ exclusive use car spaces.
Developed a distributional/ equity analysis to identify the spread of costs and benefits across various identified stakeholders.
Whilst the literature suggests several costs and benefits of car share schemes, some of these can be considered to be ‘transfer effects’ (i.e. transfer of resources from one stakeholder to another), and consequently, they have not been included in the CBA. Furthermore, only public (and external) costs and benefits are included in our framework, as it has been assumed that the private benefits of operating car share schemes outweigh their costs. If this was not the case, the car share schemes would not be commercially feasible and would therefore not be provided by the private sector without direct subsidy. The CBA framework adopted is summarised in Table 1 overleaf. The following usage forecasts were derived and have been used to populate the CBA framework with a sensitivity analysis performed to check the robustness of each of these forecasts:
10 additional exclusive car share bays will be provided monthly (i.e. 120 annually). This is based on Council’s stated policy. By 2023, approximately 1,782 exclusive car share bays would be provided in the LGA rising from a base of 392 as of May 2012.
1,532 additional city residents will become members of a car share provider annually beyond 2013, i.e. an increase of approximately 13 additional resident-members for each additional space provided. This is based on SGS’s forecasting estimate using historic data where resident membership in the current period is based on membership in the previous period (word of mouth effect) and the additional number of bays provided in the current period (supply effect).
1,071 additional city businesses will become members of a car share provider annually beyond 2013, i.e. an increase of approximately 9 additional business members for each additional bay provided. Similar to the method for forecasting resident membership, business membership is based on the word of mouth effect and supply effect.
22
22

City of Sydney ii
By 2023, there will be approximately 38,800 City members (including 23,800 residents and 15,000 businesses) of a car share provider. That is, the ratio of members to car share bays would remain at current levels of approximately 22.
956 fewer additional cars would be on the road annually due to resident members deferring a car purchase. The figure for commercial users was estimated at 641 annually (or 1,597 fewer cars collectively) assuming that 60% of resident members and 62% of commercial members would defer car purchase based on GoGet survey data.
TABLE 1 . MARGI NAL CO ST S & BE N E FITS O F PROVI DI NG E XCLU SI VE U SE C AR SH ARE MEMBER SPACES
Relevant Party
Costs Description Present Value (PV)
City of Sydney
Planning & administration costs
Costs of planning for the conversion of on street parking bays to exclusive use car share bays.
$0.23 million
Conversion costs
Costs of converting existing on street parking bays to exclusive use
car share bays.
$0.96 million
Foregone parking revenue
Loss in parking revenues from otherwise paid on street parking bays (i.e. the opportunity cost of dedicated bays).
$9.85 million
Wider community
Increased congestion on public transport
Nuisance costs of increased congestion, as car share members substitute private car use with other modes, particularly public transport.
Not quantified
Total Costs
$11.05 million
Relevant Party
Benefits Description
Car share members
Deferral of car purchase savings
Annual savings to City members as car purchasing is deferred. $171.86 million
Reduction in parking time
Relative availability of car spaces increases, as resident members defer car purchasing and reduce demands on ‘on-street’ car parks.
$4.55 million
Health benefits Health cost savings as resident members opt for more walking/ cycling and consequently lead a more active lifestyle.
$29.44 million
Improved transport choice
Some lower-income resident members enjoy improved transport options, as private vehicle use becomes more affordable through car sharing.
Not quantified
Wider community
Reduced travel time on roads
Resident members defer car purchasing and substitute other modes of transport, including public transport. Consequently, road congestion declines.
Not quantified
Reduced travel externalities
Due to the lower number of cars on the road, travel related externalities reduce (only reduced GHG emissions quantified).
$8.47 million
Total Benefits
$214.31 million
Net Present Value (Total PV benefits - Total PV costs) $203.26 million
Benefit-Cost Ratio (BCR) 19.40
As is evident in Table 1, the net present value of the Project Scenario is $203.26 million, which represents a significant return on community capital. Benefits outweigh costs by a factor of 19. These performance measures suggest that the Project would yield significant society wide benefits compared to the costs of delivery. Hence dedicating additional exclusive use car share member bays is a worthy project from a triple bottom line perspective.
23
23

City of Sydney iii
The majority of benefits relate to the cost saving associated with deferring car purchases. On its own, the cost saving from this ($171.86 million) outweighs the costs of the project. Health benefits associated with increased walking are also key benefits. These performance results have been estimated using plausible assumptions. SGS has taken steps to test the robustness of these assumptions and has presented a sensitivity analysis to this end. The assumptions of greatest significance are the assumed membership rates per dedicated bay (~22) and the rate at which members defer car purchases (~60%); both of these are assumed to experience no diminishing returns over the forecast period. If these assumed rates are halved, both separately (BCR 9.7) and in a combined fashion (BCR 5.7), the performance results decline but still remain at robust levels. A number of other assumptions ranging from conservative to plausible were tested too including testing results over a reduced timeframe. Altering the timeframe of analysis does not bring about a material change in results either. The BCR is highest for the shorter timeframes because growth in membership peaks at 2012 with consequent growth in benefits not being as high. On the other hand, costs of provision are not as high in the initial periods of the analysis with costs of foregone parking revenue rising over time as more on-street car spaces are lost to exclusive car share bay use. The benefit cost ratio ranged between 5.7 and 19.4 after testing for the impact of changing assumptions.
24
24

City of Sydney 1
1 INTRODUCTION & PROJECT CONTEXT
1.1 Project Background
Car sharing provides short-term hire of passenger and light commercial vehicles for personal and business uses. It offers an alternative option to car ownership, access and use, while transferring the costs and troubles of purchasing and maintaining a private vehicle to the car sharing provider. The membership-based business model provides members with access to a network of vehicles from unstaffed and distributed neighbourhood locations, with minimal effort to check in and out. The City of Sydney Council (the Council) has implemented dedicated parking for car share vehicles on and off street. Since January 2009, the Council has approved 392 on-street parking spaces for conversion into car share bays. As of May 2012, approximately 6,200 resident households (~6.4%) of the City of Sydney were registered members of the car share schemes and the Council is committed to increasing membership to 10% by 2016.
1.2 Project Objectives
The Council wished to determine the economic (triple bottom line) costs and benefits of the re-purposing of on-street car parking spaces to exclusive use car-share member bays. For the purposes of this assessment, the geographical scope was considered to be the City of Sydney (LGA). The timeframe of analysis adopted is from 2009, the commencement year of analysis coinciding with the year of the scheme’s introduction, to 2024. That is, the costs and benefits of the re-purposing were determined partially retrospectively. Off-street car share spaces were considered outside the scope of this study. That is not to say that the Council will not provide or make provision for exclusive car share spaces in off-street car parks in future. However, this study is concerned only with the re-purposing of on-street car parking space.
1.3 Car Share Membership/ Usage
Council currently hosts three providers: GoGet, Greenshare and Flexicar. Figure 1 shows total on-street resident car share membership (left axis) and resident membership as a share of LGA households (right axis) from October 2010 to May 2012.1 The number of LGA households is sourced from Bureau and Transport Statistics (BTS) and adjusted to derive monthly figures. In October 2010, 3.8% of households in the City were car share members. Since then the membership base has grown further and approximately 6.4% of LGA households are members as at May 2012. Figure 2 shows the growth in total on-street membership (business and resident membership) (left axis) and provision of car share bays (right axis) from October 2010 to May 2012. The green line shows the number of on-street members per on-street space. Over the period shown, the average number of members per car share bay has stabilised at 22. This constitutes approximately 15 on-street resident members and 7 on-street business members per bay.
1 Note that on-street membership in this section refers to membership attributable to on-street Car share bays only. Due to data
limitations in the Operator Compliance Reports provided by the City of Sydney, SGS approximated the resident membership due to on-street spaces by applying the ratio of total resident GoGet members per GoGet vehicle, to the total number of on-street car share bays provided by the City, in effect assuming that the ratio of members to car share vehicle is the same due to both on-street and off-street car share bays. Refer to Table 17 in the Appendix
25
25
City of Sydney 2
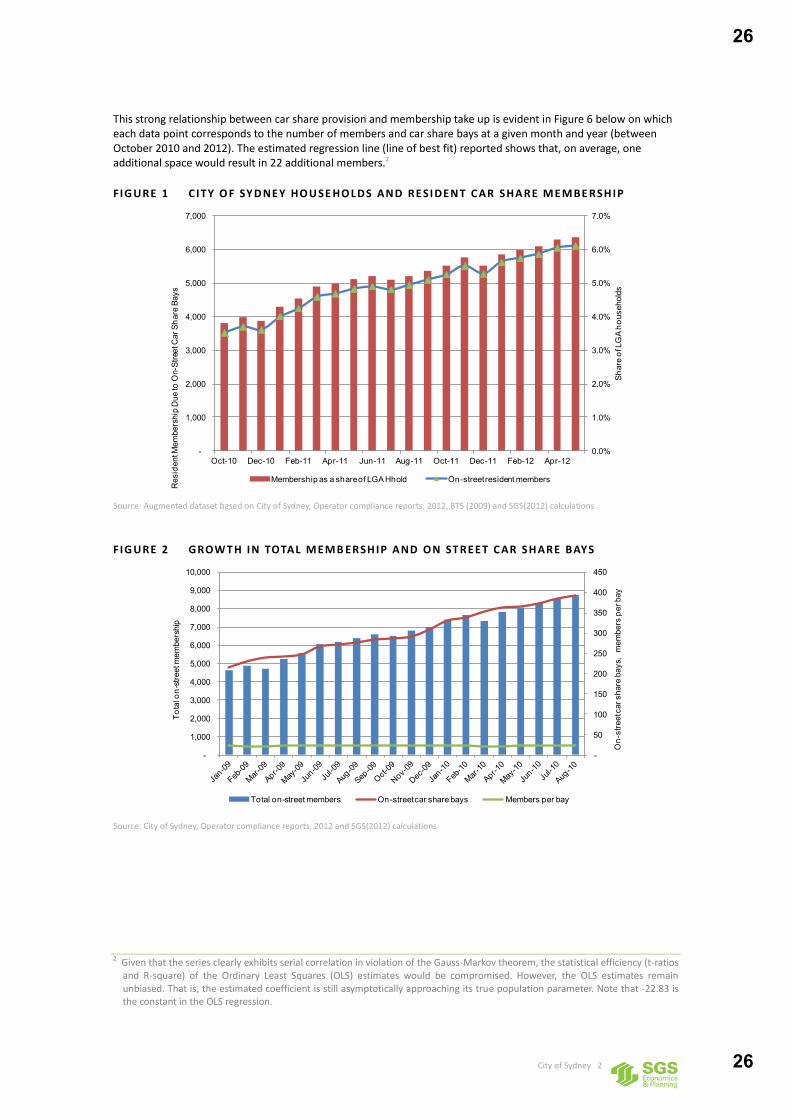
This strong relationship between car share provision and membership take up is evident in Figure 6 below on which each data point corresponds to the number of members and car share bays at a given month and year (between October 2010 and 2012). The estimated regression line (line of best fit) reported shows that, on average, one additional space would result in 22 additional members.2
FIG URE 1 C ITY O F SY D NEY HOU SE HO LDS AND RESI DENT C AR SHARE MEMBE RSH IP
Source: Augmented dataset based on City of Sydney, Operator compliance reports, 2012, BTS (2009) and SGS(2012) calculations
FIG URE 2 GROW T H I N TOTAL MEMB ERSH IP AND ON ST REET C AR SH ARE BAYS
Source: City of Sydney, Operator compliance reports, 2012 and SGS(2012) calculations
2 Given that the series clearly exhibits serial correlation in violation of the Gauss-Markov theorem, the statistical efficiency (t-ratios
and R-square) of the Ordinary Least Squares (OLS) estimates would be compromised. However, the OLS estimates remain unbiased. That is, the estimated coefficient is still asymptotically approaching its true population parameter. Note that -22.83 is the constant in the OLS regression.
0.0%
1.0%
2.0%
3.0%
4.0%
5.0%
6.0%
7.0%
-
1,000
2,000
3,000
4,000
5,000
6,000
7,000
Oct-10 Dec-10 Feb-11 Apr-11 Jun-11 Aug-11 Oct-11 Dec-11 Feb-12 Apr-12
Shar
e of
LG
A ho
useh
olds
Res
iden
t Mem
bers
hip
Due
to O
n-St
reet
Car
Sha
re B
ays
Membership as a share of LGA Hhold On-street resident members
-
50
100
150
200
250
300
350
400
450
-
1,000
2,000
3,000
4,000
5,000
6,000
7,000
8,000
9,000
10,000
On-
stre
et c
ar s
hare
bay
s, m
embe
rs p
er b
ay
Tota
l on-
stre
et m
embe
rshi
p
Total on-street members On-street car share bays Members per bay
26
26

City of Sydney 3
FIG URE 3 RELATIO NSH IP BETWEE N C AR SH ARE MEMBERSHIP AND CAR SH ARE BAY PROVI SIO N
Source: City of Sydney, Operator compliance reports, 2012 and SGS(2012) calculations
1.4 GoGet Member Survey Summary
This section provides a summary of key statistics from the two member surveys undertaken by GoGet in April 2010 and December 2011.3
Reasons for car share use
A significant proportion of respondents used a GoGet vehicle as the primary vehicle for personal use. The response rate was quite high in both of the examined years. A significant proportion of respondents (~20%) used the vehicles for both personal and business use.
Deferred car purchase
A significant proportion of respondents (both resident and business members) deferred purchasing a car since becoming a member of the GoGet car share scheme. In 2010, 62% (of 956 respondents) indicated that they had deferred purchasing a private car since becoming a GoGet member. By 2011, this proportion had risen to more than two-thirds of all respondents (i.e. 67% of 1,293 respondents). In order to examine whether the decision to defer purchase varies with the type of membership, the 2011 survey responses were disaggregated by member type4. This showed that 62% of resident-member respondents and 60% of business-member respondents indicated that they had deferred purchasing a private car since becoming a GoGet member. This response rate is based on the survey question, “Since joining GoGet, have you deferred purchasing a car?” it is acknowledged that some survey respondents may have over-stated their decision to defer, but this only reflects the perceived savings they have made, and consequently, their satisfaction from being a member. Unfortunately, the survey did not have sufficient information to identify members who have given up car ownership due to car share. In any case, the rate of deferred car purchase reflected in the GoGet survey is not too dissimilar from that observed elsewhere. Results of several car share member surveys summarised later in section 2.2 suggest that car sharing provides financial savings to households as they substitute car ownership. For example, the results of a North American car sharing member survey (Martin et al 2010) showed that the average number of vehicles per household of the sample dropped by more than half; most of this shift constituted one car households becoming
3 Given that survey data is aggregated, it must be noted that the discussion here is based on the unconditional mean of each
variable considered. That is, the summary statistics discussed are not conditional on particular characteristics of respondents. 4 Only detailed responses to the 2011 survey were made available. Of the 1,293 respondents 127 were business-members (on the
QuickStart plan) and 1,224 were resident-members.
y = 22.274x - 22.832
-
1,000
2,000
3,000
4,000
5,000
6,000
7,000
8,000
9,000
10,000
- 50 100 150 200 250 300 350 400 450
Tota
l Num
ber o
f mem
bers
(y)
Total CarShare spaces (x)
27
27

City of Sydney 4
carless. The analysis also suggested that car sharing had taken 9 to 13 vehicles off the road for each car sharing vehicle. Another study in San Francisco, California showed that two years into the introduction of City CarShare, nearly two-thirds (i.e. 66%) of its members stated that they opted not to purchase another car (Cervero and Tsai 2004). Other studies using data from Europe and North America have found that on average, 55% of car sharing members either sell their main or second car or forgo the purchase of a car altogether.
FIG URE 4. REASONS FOR US ING GO G ET CAR SH ARE
Source: Go Get Car Share surveys (2010), (2011)
FIG URE 5. DEFERRE D C AR PURCH AS E : ALL MEMBERS 201 0 AND 2011
Source: Go Get Car Share surveys (2010), (2011)
Mode share split
Examining the extent of transport usage by mode of GoGet members reveals the following:
Most respondents (approx. 75%) maintain the same level of cycling and walking activity.
Approx. 22% (12%) of respondents suggested that they were walking (cycling) more since becoming GoGet members. Only about 5% (8%) of respondents reported a decline in walking (cycling) activity since becoming members.
0%
10%
20%
30%
40%
50%
60%
70%
Business use Personal use - Primary vehicle
Personal use - Secondary vehicle
Both for personal and business use
Shar
e of
tota
l res
pond
ents
2010 2011
0%
10%
20%
30%
40%
50%
60%
70%
80%
Deferred car purchase Did not defer car purchase
Shar
e of
tota
l res
pond
ents
2010 2011
28
28
City of Sydney 5
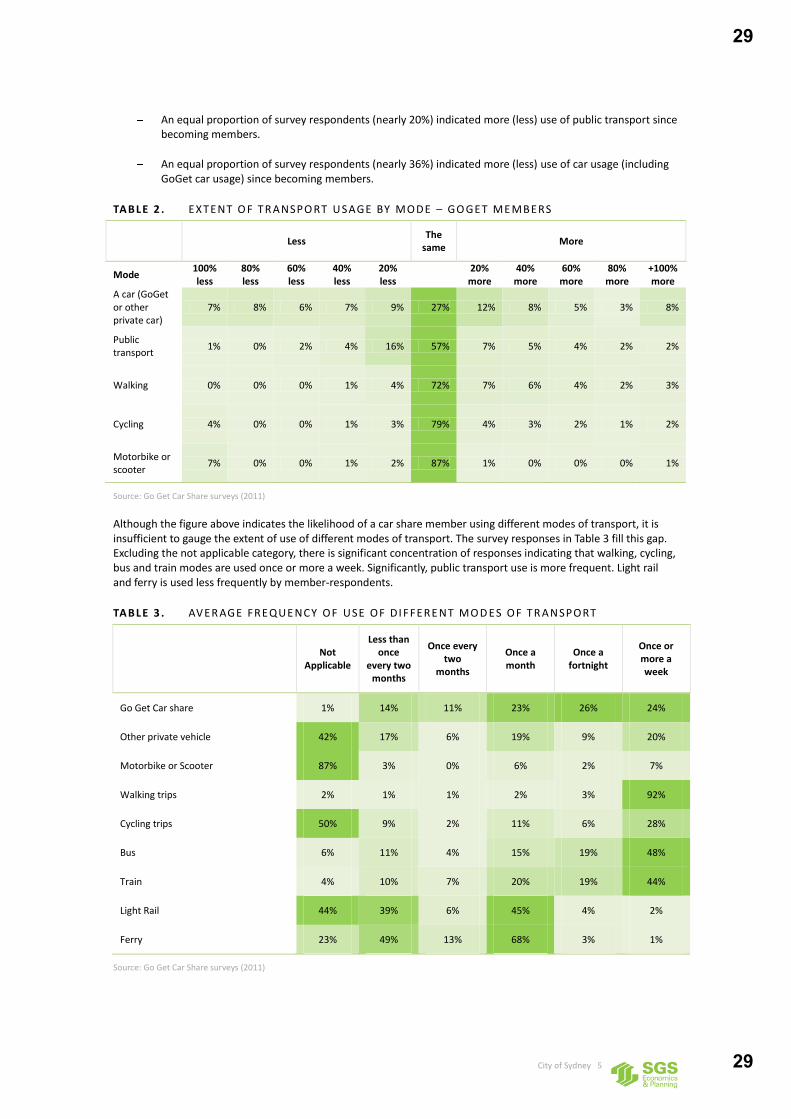
An equal proportion of survey respondents (nearly 20%) indicated more (less) use of public transport since becoming members.
An equal proportion of survey respondents (nearly 36%) indicated more (less) use of car usage (including GoGet car usage) since becoming members.
TABLE 2 . EXTENT O F TR ANSPO RT U SAGE BY MODE – GO GET ME MBERS
Less The
same More
Mode 100% less
80% less
60% less
40% less
20% less
20% more
40% more
60% more
80% more
+100% more
A car (GoGet or other private car)
7% 8% 6% 7% 9% 27% 12% 8% 5% 3% 8%
Public transport
1% 0% 2% 4% 16% 57% 7% 5% 4% 2% 2%
Walking 0% 0% 0% 1% 4% 72% 7% 6% 4% 2% 3%
Cycling 4% 0% 0% 1% 3% 79% 4% 3% 2% 1% 2%
Motorbike or scooter
7% 0% 0% 1% 2% 87% 1% 0% 0% 0% 1%
Source: Go Get Car Share surveys (2011)
Although the figure above indicates the likelihood of a car share member using different modes of transport, it is insufficient to gauge the extent of use of different modes of transport. The survey responses in Table 3 fill this gap. Excluding the not applicable category, there is significant concentration of responses indicating that walking, cycling, bus and train modes are used once or more a week. Significantly, public transport use is more frequent. Light rail and ferry is used less frequently by member-respondents.
TABLE 3 . AVER AGE FREQUE NCY OF USE OF DI FFERE NT MO D ES OF TR ANSPORT
Not
Applicable
Less than once
every two months
Once every two
months
Once a month
Once a fortnight
Once or more a week
Go Get Car share 1% 14% 11% 23% 26% 24%
Other private vehicle 42% 17% 6% 19% 9% 20%
Motorbike or Scooter 87% 3% 0% 6% 2% 7%
Walking trips 2% 1% 1% 2% 3% 92%
Cycling trips 50% 9% 2% 11% 6% 28%
Bus 6% 11% 4% 15% 19% 48%
Train 4% 10% 7% 20% 19% 44%
Light Rail 44% 39% 6% 45% 4% 2%
Ferry 23% 49% 13% 68% 3% 1%
Source: Go Get Car Share surveys (2011)
29
29

City of Sydney 6
1.5 SGS Approach
Following the inception meeting, SGS undertook a desktop research exercise to canvass the relevant costs and benefits of car share schemes. An assessment framework was drawn up after this to isolate which of these were legitimate costs and benefits from a social cost benefit analysis (CBA) perspective. Having scoped the identified costs and benefits of car share schemes into an appropriate assessment framework, SGS reviewed and analysed the monthly statistics on Sydney car share scheme usage provided by Council (for the 2009-12 timeframe) and the results of the GoGet member car share scheme survey (from April 2010 and February 2012). These results have been presented above. Based on these historic data and statistical techniques, SGS forecast usage (car share bays provision, membership and mode share splits of alternate modes of transport) ‘with’ and ‘without’ the provisioning of exclusive use car-share member parking bays. Once determined these forecasts were used to populate the CBA framework and performance measures (benefit cost ratio (BCR), net present value (NPV)) were generated. Checks were also performed to determine the sensitivity of results to the assumptions made. A qualitative description was provided for those benefits which were unable to be quantified. Having monetised the society wide costs and benefits, a distributional/ equity analysis was undertaken to identify the spread of costs and benefits across relevant stakeholders.
1.6 SGS Report Structure
This report is organised as follows:
TABLE 4 . REPORT STRU CTURE
Section Description
2 This section reviews the available literature to scope possible costs and benefits of car share schemes. It then takes a strict cost benefit analysis approach to isolate legitimate costs and benefits that arise in moving from the Base Case (doing nothing) to the Project Case Scenario (exclusive use car share bay provisioning), which collectively form the evaluation framework.
3 This section details how car share membership is forecast to grow given the continued growth of provisioning of exclusive use car share bays. It then goes onto forecast changes in the activities of car share members, before providing details of some of the key monetisation assumptions invoked.
4 This section presents the results of the CBA, generating project performance measures. It also presents the results of sensitivity testing and the distributional analysis, before making some broad conclusions about the project’s merit.
30
30
City of Sydney 7
2 CAR SHARE - COSTS & BENEFITS
SECTION OVERVIEW
This section reviews the available literature to scope possible costs and benefits of car share schemes. It then takes a strict cost benefit analysis approach to isolate legitimate costs and benefits that arise in moving from the Base Case (doing nothing) to the Project Case Scenario (exclusive use car share bay provisioning), which collectively form the evaluation framework.
2.1 Introduction
Despite car sharing being a relatively new urban mode of transportation, a considerable body of research on results of implementing car sharing programs is available. This research has typically concentrated on provision of car sharing services for residential neighbourhoods, organisations, commuters and college campuses. The international survey by Shaheen and Cohen (2007) identified that ‘neighbourhood residential’ was the predominant car sharing market in the majority of countries, followed by ‘business’; exceptions were Austria, Japan and Sweden with business as their largest market. University-based demand for car sharing services has also been growing internationally (Zheng et al 2009). Fewer studies on car sharing for tourists have been undertaken, although there is also a market for these services (May et al 2008). Despite the wide range of available literature on car sharing, the existing evidence to support car sharing costs and benefits has not been sufficiently comprehensive or objective (Costain et al 2012, Shaheen et al 2003). A significant number of studies on the impacts of car sharing have been based on small sample surveys, applied methods that are largely inconsistent, or conducted by operators themselves or other advocates with a strong interest in promoting car sharing (Transportation Research Board 2005). The following sections scan the literature to develop an exhaustive list of identified costs and benefits of providing dedicated spaces for shared vehicles. The assessment framework navigates through this list to identify welfare contributions which have a rightful place in a CBA.
2.2 Costs and Benefits of Car Sharing
Previous studies have identified an array of costs and benefits that are conferred by car sharing. These are summarised in Table 5 overleaf and discussed separately. The summary is structured so as to capture costs and benefits to relevant stakeholder groups. According to Bergmeier, the success of a car sharing business is largely dependent on its location, clients, the interests of various stakeholder groups and partners, its relationship to public transport and road networks, as well as the more technical aspects of its operations (Bergmeier et al 2004: 5). Most public support provided to car sharing comes from the interest of mitigating transportation-related problems, including traffic congestion, air pollution and parking shortages. In some cases support to car sharing has also been provided to address social disadvantage, such as expanding the mobility options available to the poor (Shaheen et al 2003). Various academic works (Cohen et al 2008; Huwer 2003; Katsev 2003, May et al 2008) have identified that car sharing schemes almost entirely remove the fixed cost associated with auto transport (e.g. purchase, vehicle
31
31
City of Sydney 8
registration, insurance) or reduce costs compared with public transport, taxi or car hire; hence car travel is more affordable for occasional drivers. Firms (as business customers) benefit by not having to devote investment into the sunk costs of automobiles. Moreover, promoting car sharing minimises the need for car parking spaces, with the potential to enable more land to be used for higher order activities. A key element then to the potential growth of car sharing is its ability to provide cost savings to those who opt for it in favour of vehicle ownership. Results of several empirical surveys confirm this. For example, the results of a North American car sharing member survey (Martin et al 2010) showed that car share members reduced their vehicle holdings to a degree that is statistically significant. The average number of vehicles per household of the sample dropped from 0.47 to 0.24; most of this shift constituted one car households becoming carless. The analysis also suggested that car sharing had taken 9 to 13 vehicles off the road for each car sharing vehicle. Another study in San Francisco, California showed that two years into the introduction of City CarShare, nearly 30% of members had disposed of one or more cars, and two-thirds stated that they opted not to purchase another car (Cervero and Tsai 2004). Other studies using data from Europe and North America have found that on average, 21% of car sharing members sell their main or second hand car and 34% forgo the purchase of a car altogether. 5 Because car sharing provides for a population segment with enhanced accessibility and mobility, it could play an important role in providing a seamless, integrated transportation service. More importantly, car sharing provides for an alternate means of transport thereby providing more transport options to residents and businesses of the serviced area. Research in Canada by Costain et al (2012), on the behaviour of car share members in Toronto, showed that car sharing was most often used for off-peak travel or on weekends, i.e. when public transit services are poor and traffic congestion is low. Car sharing has also been viewed as a way to reduce the environmental impacts of urban transportation. The associated economic and environmental benefits are seen in reduced vehicle kilometres, increased average speeds and savings in fuel, accidents and emissions (see for example, Fellows & Pitfield 2000, Frinkorn & Muller 2011). Car share members also tend to make fewer trips by car after becoming active in car sharing and their total mileage driven also decreases. The research in North America showed a 27% decline in the observed vehicle kilometres travelled (VKT) per year due to car sharing (Martin & Shaheen 2011). Because car share vehicles tend to be small and fuel-efficient, per capita gasoline consumption and greenhouse gas emissions among members also appear to go down (Cervero and Tsai 2004). The fixed costs of owning a vehicle are substituted by a slightly higher variable or ‘marginal’ cost of becoming a member of a car share scheme. This higher variable cost acts as an increased economic disincentive to travel by car; every trip resulting in fewer vehicle kilometres travelled - thereby reducing greenhouse gas emissions. By requiring conscious decisions regarding transport, car sharing may encourage greater use of public transport. In this regard, a research project in Germany showed that car sharing is suitable as a supplement to public transport (Huwer 2004). Car share members are also encouraged to walk/ cycle more, i.e. lead a more active lifestyle after becoming members.
5 City of Melbourne, Car Sharing Research. Final Report. September 2010. Prepared by GHD.
32
32
City of Sydney 9
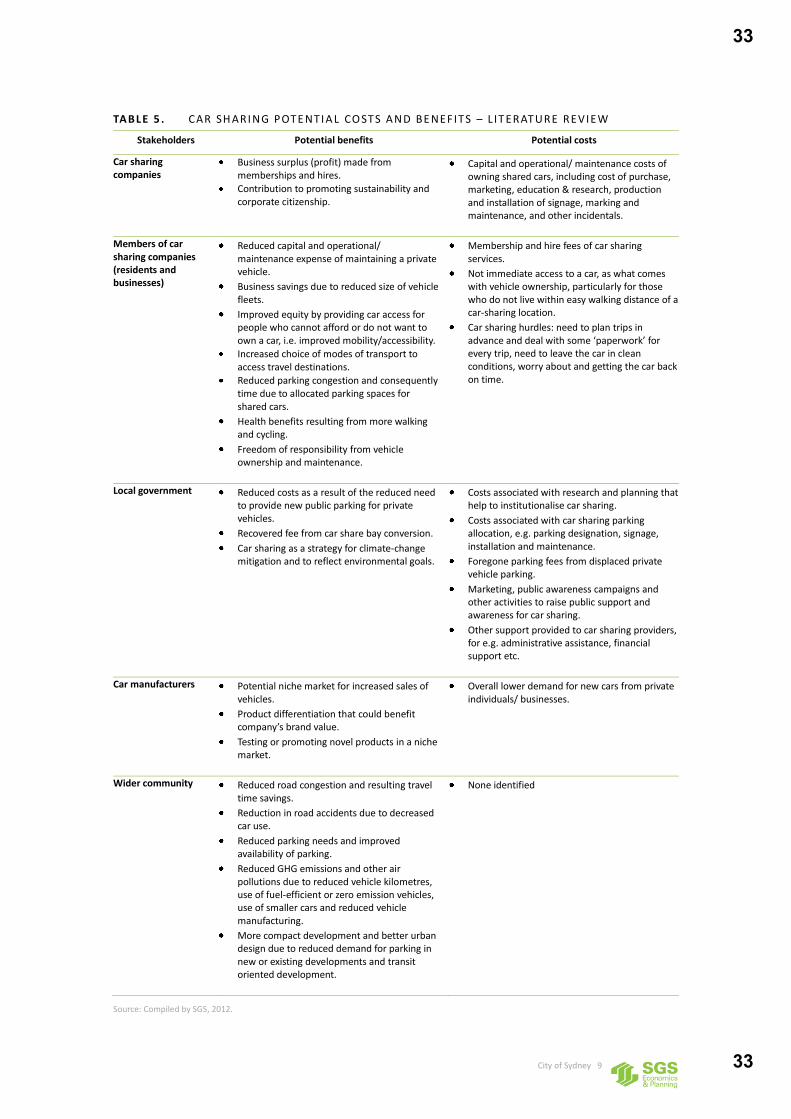
TABLE 5 . CAR SH ARI NG POTE NTI A L CO STS AND BE NEF ITS – L IT ERATURE REVIEW
Stakeholders Potential benefits Potential costs
Car sharing companies
Business surplus (profit) made from memberships and hires.
Contribution to promoting sustainability and corporate citizenship.
Capital and operational/ maintenance costs of owning shared cars, including cost of purchase, marketing, education & research, production and installation of signage, marking and maintenance, and other incidentals.
Members of car sharing companies (residents and businesses)
Reduced capital and operational/ maintenance expense of maintaining a private vehicle.
Business savings due to reduced size of vehicle fleets.
Improved equity by providing car access for people who cannot afford or do not want to own a car, i.e. improved mobility/accessibility.
Increased choice of modes of transport to access travel destinations.
Reduced parking congestion and consequently time due to allocated parking spaces for shared cars.
Health benefits resulting from more walking and cycling.
Freedom of responsibility from vehicle ownership and maintenance.
Membership and hire fees of car sharing services.
Not immediate access to a car, as what comes with vehicle ownership, particularly for those who do not live within easy walking distance of a car-sharing location.
Car sharing hurdles: need to plan trips in advance and deal with some ‘paperwork’ for every trip, need to leave the car in clean conditions, worry about and getting the car back on time.
Local government Reduced costs as a result of the reduced need to provide new public parking for private vehicles.
Recovered fee from car share bay conversion. Car sharing as a strategy for climate-change
mitigation and to reflect environmental goals.
Costs associated with research and planning that help to institutionalise car sharing.
Costs associated with car sharing parking allocation, e.g. parking designation, signage, installation and maintenance.
Foregone parking fees from displaced private vehicle parking.
Marketing, public awareness campaigns and other activities to raise public support and awareness for car sharing.
Other support provided to car sharing providers, for e.g. administrative assistance, financial support etc.
Car manufacturers Potential niche market for increased sales of
vehicles. Product differentiation that could benefit
company’s brand value.
Testing or promoting novel products in a niche market.
Overall lower demand for new cars from private individuals/ businesses.
Wider community Reduced road congestion and resulting travel time savings.
Reduction in road accidents due to decreased car use.
Reduced parking needs and improved availability of parking.
Reduced GHG emissions and other air pollutions due to reduced vehicle kilometres, use of fuel-efficient or zero emission vehicles, use of smaller cars and reduced vehicle manufacturing.
More compact development and better urban design due to reduced demand for parking in new or existing developments and transit oriented development.
None identified
Source: Compiled by SGS, 2012.
33
33
City of Sydney 10
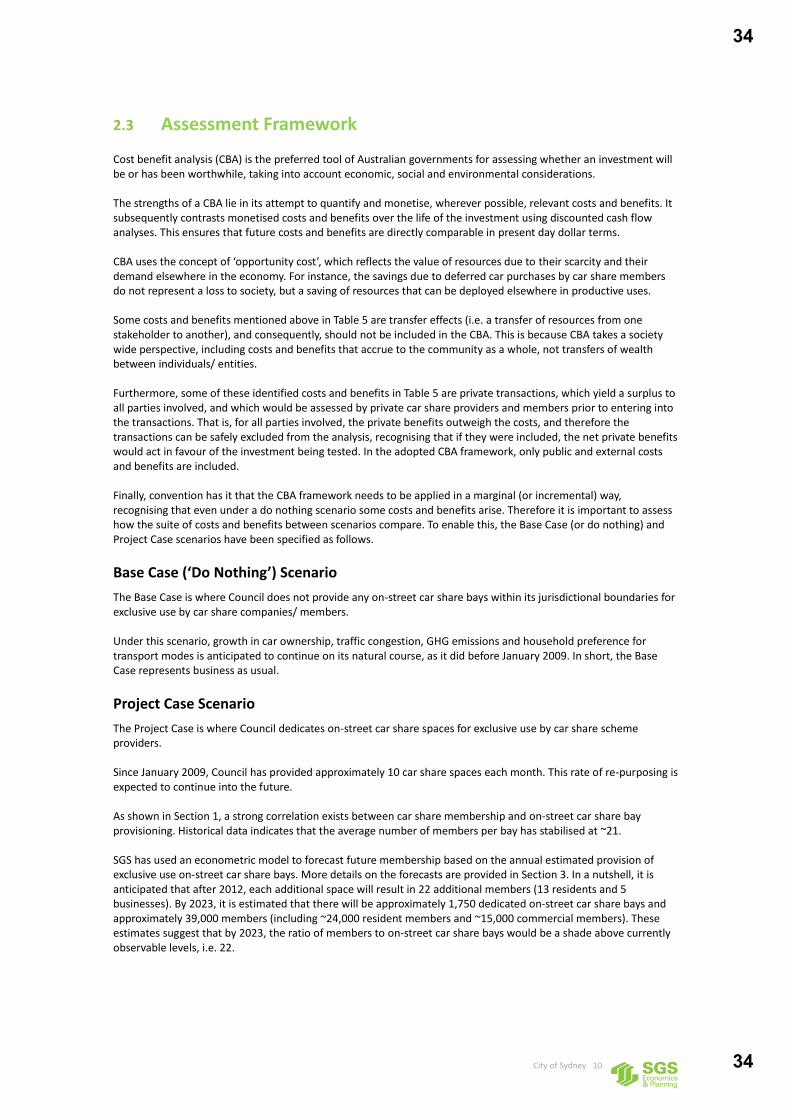
2.3 Assessment Framework
Cost benefit analysis (CBA) is the preferred tool of Australian governments for assessing whether an investment will be or has been worthwhile, taking into account economic, social and environmental considerations. The strengths of a CBA lie in its attempt to quantify and monetise, wherever possible, relevant costs and benefits. It subsequently contrasts monetised costs and benefits over the life of the investment using discounted cash flow analyses. This ensures that future costs and benefits are directly comparable in present day dollar terms. CBA uses the concept of ‘opportunity cost’, which reflects the value of resources due to their scarcity and their demand elsewhere in the economy. For instance, the savings due to deferred car purchases by car share members do not represent a loss to society, but a saving of resources that can be deployed elsewhere in productive uses. Some costs and benefits mentioned above in Table 5 are transfer effects (i.e. a transfer of resources from one stakeholder to another), and consequently, should not be included in the CBA. This is because CBA takes a society wide perspective, including costs and benefits that accrue to the community as a whole, not transfers of wealth between individuals/ entities. Furthermore, some of these identified costs and benefits in Table 5 are private transactions, which yield a surplus to all parties involved, and which would be assessed by private car share providers and members prior to entering into the transactions. That is, for all parties involved, the private benefits outweigh the costs, and therefore the transactions can be safely excluded from the analysis, recognising that if they were included, the net private benefits would act in favour of the investment being tested. In the adopted CBA framework, only public and external costs and benefits are included. Finally, convention has it that the CBA framework needs to be applied in a marginal (or incremental) way, recognising that even under a do nothing scenario some costs and benefits arise. Therefore it is important to assess how the suite of costs and benefits between scenarios compare. To enable this, the Base Case (or do nothing) and Project Case scenarios have been specified as follows.
Base Case (‘Do Nothing’) Scenario
The Base Case is where Council does not provide any on-street car share bays within its jurisdictional boundaries for exclusive use by car share companies/ members. Under this scenario, growth in car ownership, traffic congestion, GHG emissions and household preference for transport modes is anticipated to continue on its natural course, as it did before January 2009. In short, the Base Case represents business as usual.
Project Case Scenario
The Project Case is where Council dedicates on-street car share spaces for exclusive use by car share scheme providers. Since January 2009, Council has provided approximately 10 car share spaces each month. This rate of re-purposing is expected to continue into the future. As shown in Section 1, a strong correlation exists between car share membership and on-street car share bay provisioning. Historical data indicates that the average number of members per bay has stabilised at ~21. SGS has used an econometric model to forecast future membership based on the annual estimated provision of exclusive use on-street car share bays. More details on the forecasts are provided in Section 3. In a nutshell, it is anticipated that after 2012, each additional space will result in 22 additional members (13 residents and 5 businesses). By 2023, it is estimated that there will be approximately 1,750 dedicated on-street car share bays and approximately 39,000 members (including ~24,000 resident members and ~15,000 commercial members). These estimates suggest that by 2023, the ratio of members to on-street car share bays would be a shade above currently observable levels, i.e. 22.
34
34

City of Sydney 11
Marginal Costs & Benefits
The marginal costs and benefits of moving from the Base Case to the Project Case are shown In Table 6. As discussed earlier, this table excludes transfer effects and private transactions in which all parties benefit.
TABLE 6 . MARGI NAL CO STS & BENE F ITS O F REPU RPOS ING O N- STREET CAR PARKI NG
Relevant Party Costs Description
City of
Sydney Planning & administration
costs Costs of planning for the conversion of on street parking bays to exclusive use car
share spaces.
Conversion costs
Costs of converting existing on street parking bays to exclusive use car share spaces.
Foregone parking revenue
Loss in parking revenues from otherwise paid on street parking bays (i.e. the opportunity cost of dedicated bays).
Wider community
Increased congestion on public transport
Nuisance costs of increased congestion, as car share members substitute private car use with other modes, particularly public transport.
Relevant Party Benefits Description
Car share members
Deferral of car purchase savings
Annual savings to City members as car purchasing is deferred.
Reduction in parking time Relative availability of car spaces increase, as resident members defer car purchasing and reduce demands on ‘on-street’ car parks.
Health benefits Health cost savings as resident members opt for more walking/ cycling and consequently lead a more active lifestyle.
Improved transport choice Some lower-income resident members enjoy improved transport options, as private vehicle use becomes more affordable through car sharing.
Wider community
Reduced travel time on roads Resident members defer car purchasing and substitute other modes of transport, including public transport. Consequently, road congestion declines.
Reduced travel externalities Due to the lower number of cars on the road, travel related externalities reduce. This includes reduced pollution, noise, GHG emissions, traffic accidents, etc.
Source: SGS Economics & Planning
Note: Private transactions and transfer effects excluded.
35
35

City of Sydney 12
3 FORECASTING & VALUATION ASSUMPTIONS
SECTION OVERVIEW
This section details how car share membership is forecast to grow given the continued growth of provisioning of exclusive use car share bays. It then goes onto forecast changes in the activities of car share members, before providing details of some of the key monetisation assumptions invoked.
3.1 Usage Forecasts
Estimates of On-Street Car Share Bays
Since January 2009, Council has provided approximately 10 car share bays each month. This rate of re-purposing is expected to continue into the future. That is, it is assumed that 10 additional car share bays will be provided monthly (i.e. 120 annually). These additional bays will be used by both resident (household) and business car share members.
Resident Membership Projections
SGS has used an econometric model (regression equation) to forecast resident membership based on the estimated provision of on-street car share bays. It was assumed that demand for resident membership is supply driven6. The following regression equation (based on appropriate specification tests) was used: Resident members t = constant term + a × resident members t-1 + b × car share bays t This regression equation suggests that the number of resident members in period t is based on the number of resident members in the previous period (t-1) and the total number of dedicated on-street car share bays in that period. The lagged term of resident members (i.e. the number of resident members in the previous period) can be understood as the word-of-mouth effect that the previous period’s members have on the current period’s membership. The above model was used to produce a rolling forecast of monthly resident membership which was converted to annual projections7. The estimated regression equation is shown below:
t t-1 t Resident members = 455.87 + 0.657×Resident members +4.367×Total Car Share spaces
Following is an example of how the equation is used to predict resident membership for June 2012.
2012 2012 2012 Resident members = 455.87 + 0.657 6124 4.367 402 6240June May June
6 A regression model was used to forecast resident membership levels. The explanatory power of the model, reflected in
estimated R square (coefficient of determination), was 96% indicating that the explanatory model used successfully explained 96% of variation in the resident membership base.
7 Each year ends in December.
36
36
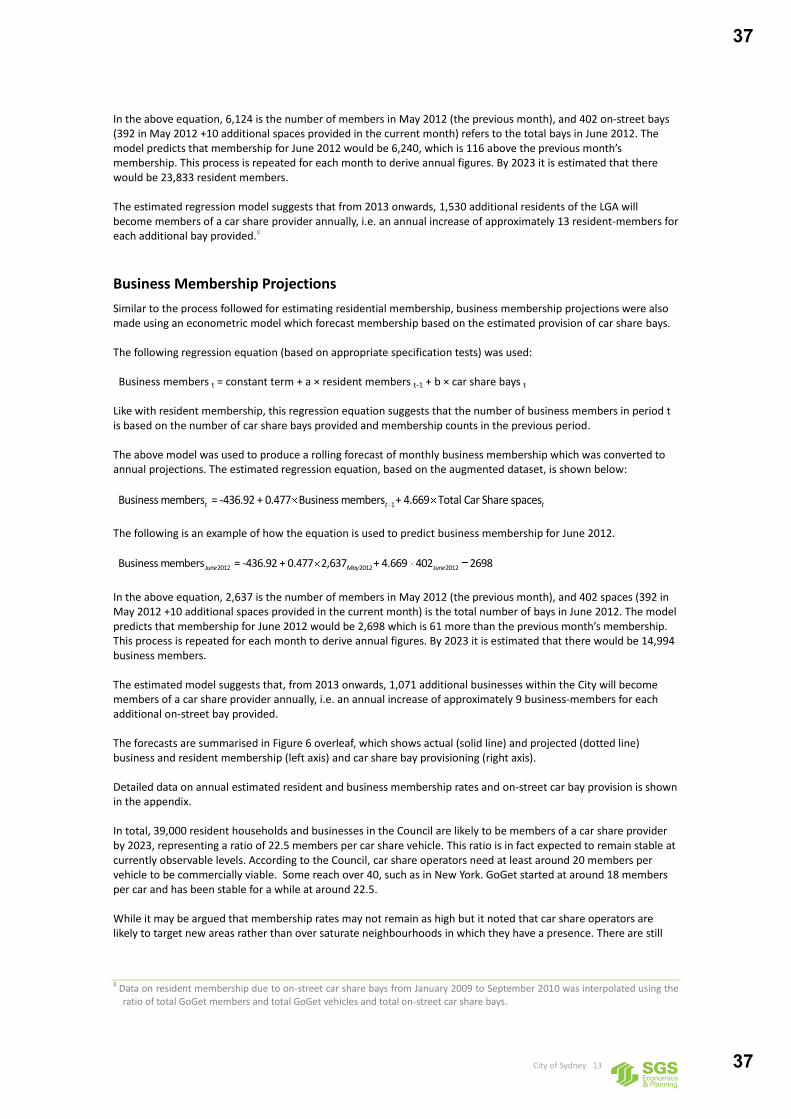
City of Sydney 13
In the above equation, 6,124 is the number of members in May 2012 (the previous month), and 402 on-street bays (392 in May 2012 +10 additional spaces provided in the current month) refers to the total bays in June 2012. The model predicts that membership for June 2012 would be 6,240, which is 116 above the previous month’s membership. This process is repeated for each month to derive annual figures. By 2023 it is estimated that there would be 23,833 resident members. The estimated regression model suggests that from 2013 onwards, 1,530 additional residents of the LGA will become members of a car share provider annually, i.e. an annual increase of approximately 13 resident-members for each additional bay provided.8
Business Membership Projections
Similar to the process followed for estimating residential membership, business membership projections were also made using an econometric model which forecast membership based on the estimated provision of car share bays. The following regression equation (based on appropriate specification tests) was used: Business members t = constant term + a × resident members t-1 + b × car share bays t Like with resident membership, this regression equation suggests that the number of business members in period t is based on the number of car share bays provided and membership counts in the previous period. The above model was used to produce a rolling forecast of monthly business membership which was converted to annual projections. The estimated regression equation, based on the augmented dataset, is shown below:
1 Business members = -436.92 + 0.477 Business members + 4.669 Total Car Share spacest t t
The following is an example of how the equation is used to predict business membership for June 2012.
2012 2012 2012 Business members = -436.92 + 0.477 2,637 + 4.669 402 2698June May June
In the above equation, 2,637 is the number of members in May 2012 (the previous month), and 402 spaces (392 in May 2012 +10 additional spaces provided in the current month) is the total number of bays in June 2012. The model predicts that membership for June 2012 would be 2,698 which is 61 more than the previous month’s membership. This process is repeated for each month to derive annual figures. By 2023 it is estimated that there would be 14,994 business members. The estimated model suggests that, from 2013 onwards, 1,071 additional businesses within the City will become members of a car share provider annually, i.e. an annual increase of approximately 9 business-members for each additional on-street bay provided. The forecasts are summarised in Figure 6 overleaf, which shows actual (solid line) and projected (dotted line) business and resident membership (left axis) and car share bay provisioning (right axis). Detailed data on annual estimated resident and business membership rates and on-street car bay provision is shown in the appendix. In total, 39,000 resident households and businesses in the Council are likely to be members of a car share provider by 2023, representing a ratio of 22.5 members per car share vehicle. This ratio is in fact expected to remain stable at currently observable levels. According to the Council, car share operators need at least around 20 members per vehicle to be commercially viable. Some reach over 40, such as in New York. GoGet started at around 18 members per car and has been stable for a while at around 22.5. While it may be argued that membership rates may not remain as high but it noted that car share operators are likely to target new areas rather than over saturate neighbourhoods in which they have a presence. There are still
8 Data on resident membership due to on-street car share bays from January 2009 to September 2010 was interpolated using the
ratio of total GoGet members and total GoGet vehicles and total on-street car share bays.
37
37

City of Sydney 14
neighbourhoods such as Glebe and Waterloo that have a relatively low proportion of car share bays (compared to Potts Point for example). At this rate, the Council would have achieved its target of 10% of the City households being members of a car share provider ahead of schedule, i.e. by 2014.
FIG URE 6. MEMBERSHIP AND C AR SH ARE SPACE P ROJECT I ON
Source: SGS (2012)
Reduction in private car ownership
The GoGet survey data examined in Section 1 shows that 62% of resident member respondents and 60% of business member respondents deferred the purchase of a car since becoming GoGet members in 2011. These data formed the basis for SGS to project the reduction in the number of vehicles due to the re-purposing of on-street car bays. In effect, the assumption implies that resident and business members in the future will be similar in profile to 2011 survey respondents. It is also assumed that the deferring behaviour is constant over time, i.e. the share of members who defer car purchase remains unchanged over time. This assumption is of great significance to the underlying results reported in this study and is explored further in the sensitivity analysis where two of the five alternative tested scenarios relax the assumption of no diminishing returns in deferring car purchase. These alternative scenarios test for the results when members who defer car purchase is reduced by half (separately) and where residents who are members and members who defer car purchase are reduced by half (combined). The performance results when testing these alternate scenarios decline markedly, though still remain at robust levels. Furthermore, it is assumed that a member who makes the choice to defer purchasing a private vehicle does not reverse their decision in the time frame of the analysis. In addition, the analysis is City-wide and does not account for the variability of demand and current supply of spaces within each suburb. For instance, one additional car share bay in a suburb which currently has a high number of car share bays is unlikely to induce a further reduction in the number of private cars, as the substitutability between a
-
200
400
600
800
1,000
1,200
1,400
1,600
1,800
2,000
-
5,000
10,000
15,000
20,000
25,000
30,000
20
09
20
10
20
11
20
12
20
13
20
14
20
15
20
16
20
17
20
18
20
19
20
20
20
21
20
22
20
23
Tota
l car
sh
are
sp
ace
s
Tota
l re
sid
en
t an
d b
usin
ess
me
mb
ers
Total car share spaces Total resident membership Total business membership
38
38

City of Sydney 15
shared car and a private car is likely to be exhausted. Persons that continue to own a private car in areas with high shared cars are likely to do so due to exogenous factors (e.g. high level of convenience required) and are unlikely to be influenced by additional car share spaces. It is important to note here that projections of deferred car purchasing are based solely on the survey sample response rate and the unconditional mean of the survey sample (i.e. without stratifying data in any category). It is likely that controlling for a variety of factors (and consequently deriving their conditional mean) may result in a different set of forecasts9. The results show that, from 2013 onwards, there would be 955 fewer additional cars due to resident members and 641 fewer additional cars due to business members each year. Assuming that the share of new members deferring the purchase of a car does not change over time, this implies a gross reduction of 13 additional private cars per annum per additional car share bay. However, one additional shared car will be provided for each bay too. Consequently, the net reduction in cars would be 12 cars per annum per additional car share bay. The following figure shows the estimated number of cars off the road and the number of car share bays provided annually.
FIG URE 7. EST IM ATED RED UCTIO N IN PRIVATE C ARS
Source: SGS (2012) based on Go Get survey 2011 response
9 Testing for the statistical significance (using discrete choice regression models such as Probit and Logit) of the conditional mean
of the responses was explored in the course of this analysis but the structure of the data (and questions) was unsuitable for regression analysis.
-
2,000
4,000
6,000
8,000
10,000
12,000
14,000
16,000
2009 2010 2011 2012 2013 2014 2015 2016 2017 2018 2019 2020 2021 2022 2023
Nu
mb
er
of c
ars
Car share bays Cars off the road - Resident members Cars off the road - Business members
39
39
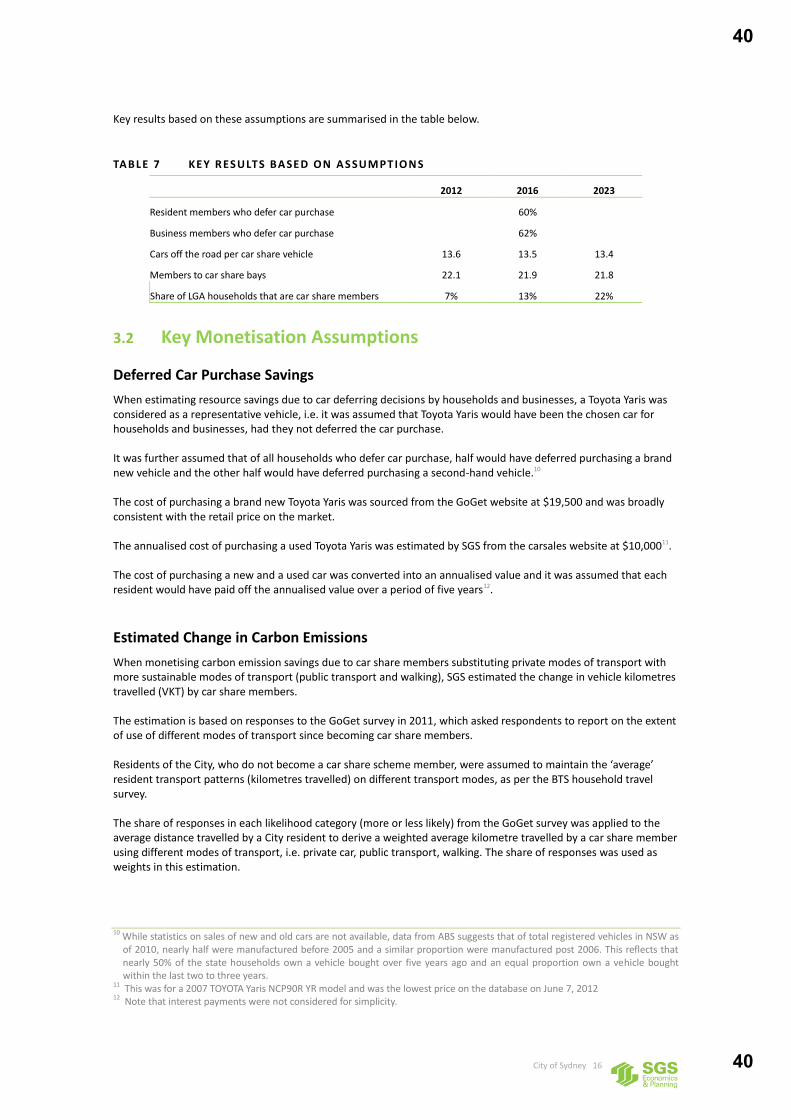
City of Sydney 16
Key results based on these assumptions are summarised in the table below.
TABLE 7 KEY R ESULTS BASED ON ASSUMPT IONS
2012 2016 2023
Resident members who defer car purchase 60%
Business members who defer car purchase 62%
Cars off the road per car share vehicle 13.6 13.5 13.4
Members to car share bays 22.1 21.9 21.8
Share of LGA households that are car share members 7% 13% 22%
3.2 Key Monetisation Assumptions
Deferred Car Purchase Savings
When estimating resource savings due to car deferring decisions by households and businesses, a Toyota Yaris was considered as a representative vehicle, i.e. it was assumed that Toyota Yaris would have been the chosen car for households and businesses, had they not deferred the car purchase. It was further assumed that of all households who defer car purchase, half would have deferred purchasing a brand new vehicle and the other half would have deferred purchasing a second-hand vehicle.10 The cost of purchasing a brand new Toyota Yaris was sourced from the GoGet website at $19,500 and was broadly consistent with the retail price on the market. The annualised cost of purchasing a used Toyota Yaris was estimated by SGS from the carsales website at $10,00011. The cost of purchasing a new and a used car was converted into an annualised value and it was assumed that each resident would have paid off the annualised value over a period of five years12.
Estimated Change in Carbon Emissions
When monetising carbon emission savings due to car share members substituting private modes of transport with more sustainable modes of transport (public transport and walking), SGS estimated the change in vehicle kilometres travelled (VKT) by car share members. The estimation is based on responses to the GoGet survey in 2011, which asked respondents to report on the extent of use of different modes of transport since becoming car share members. Residents of the City, who do not become a car share scheme member, were assumed to maintain the ‘average’ resident transport patterns (kilometres travelled) on different transport modes, as per the BTS household travel survey. The share of responses in each likelihood category (more or less likely) from the GoGet survey was applied to the average distance travelled by a City resident to derive a weighted average kilometre travelled by a car share member using different modes of transport, i.e. private car, public transport, walking. The share of responses was used as weights in this estimation.
10 While statistics on sales of new and old cars are not available, data from ABS suggests that of total registered vehicles in NSW as
of 2010, nearly half were manufactured before 2005 and a similar proportion were manufactured post 2006. This reflects that nearly 50% of the state households own a vehicle bought over five years ago and an equal proportion own a vehicle bought within the last two to three years.
11 This was for a 2007 TOYOTA Yaris NCP90R YR model and was the lowest price on the database on June 7, 2012 12 Note that interest payments were not considered for simplicity.
40
40
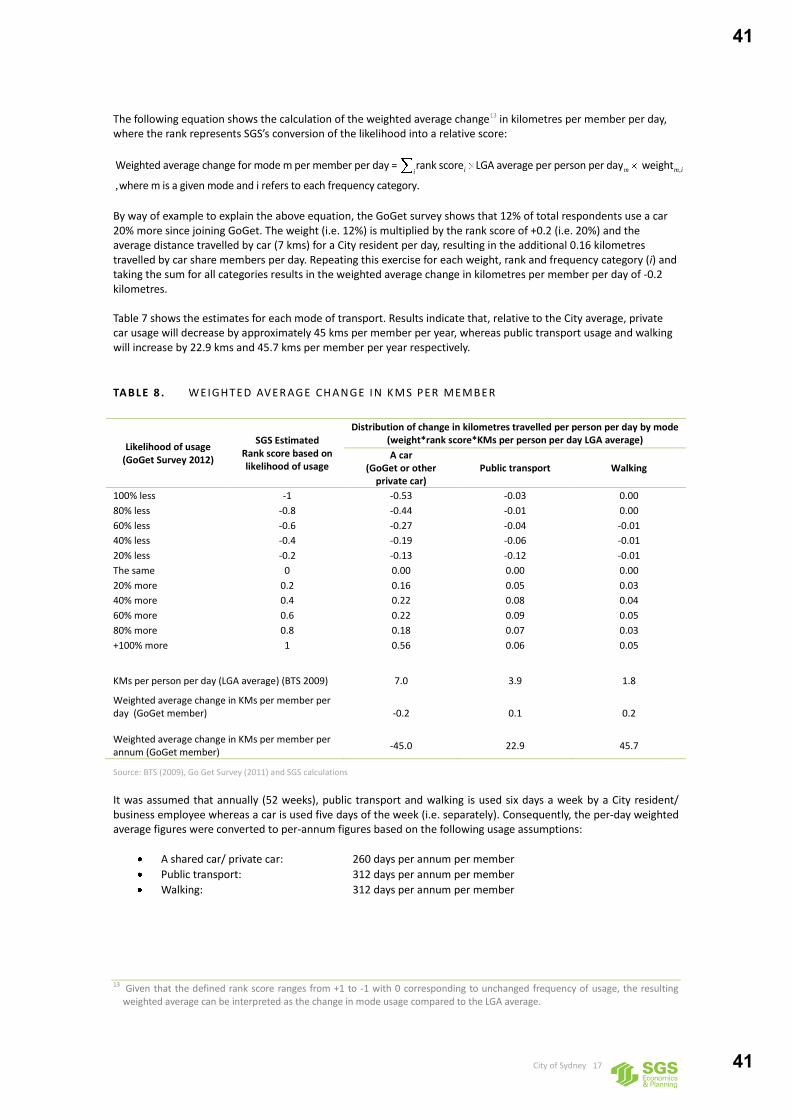
City of Sydney 17
The following equation shows the calculation of the weighted average change13 in kilometres per member per day, where the rank represents SGS’s conversion of the likelihood into a relative score:
,
, .
Weighted average change for mode m per member per day = rank score LGA average per person per day weight
where m is a given mode and i refers to each frequency category
i m m ii
By way of example to explain the above equation, the GoGet survey shows that 12% of total respondents use a car 20% more since joining GoGet. The weight (i.e. 12%) is multiplied by the rank score of +0.2 (i.e. 20%) and the average distance travelled by car (7 kms) for a City resident per day, resulting in the additional 0.16 kilometres travelled by car share members per day. Repeating this exercise for each weight, rank and frequency category (i) and taking the sum for all categories results in the weighted average change in kilometres per member per day of -0.2 kilometres. Table 7 shows the estimates for each mode of transport. Results indicate that, relative to the City average, private car usage will decrease by approximately 45 kms per member per year, whereas public transport usage and walking will increase by 22.9 kms and 45.7 kms per member per year respectively.
TABLE 8 . WEIGHTED AVER AGE CH ANGE I N K M S PER MEMBER
Likelihood of usage (GoGet Survey 2012)
SGS Estimated Rank score based on likelihood of usage
Distribution of change in kilometres travelled per person per day by mode (weight*rank score*KMs per person per day LGA average)
A car (GoGet or other
private car) Public transport Walking
100% less -1 -0.53 -0.03 0.00
80% less -0.8 -0.44 -0.01 0.00
60% less -0.6 -0.27 -0.04 -0.01
40% less -0.4 -0.19 -0.06 -0.01
20% less -0.2 -0.13 -0.12 -0.01
The same 0 0.00 0.00 0.00
20% more 0.2 0.16 0.05 0.03
40% more 0.4 0.22 0.08 0.04
60% more 0.6 0.22 0.09 0.05
80% more 0.8 0.18 0.07 0.03
+100% more 1 0.56 0.06 0.05
KMs per person per day (LGA average) (BTS 2009) 7.0 3.9 1.8
Weighted average change in KMs per member per day (GoGet member)
-0.2 0.1 0.2
Weighted average change in KMs per member per annum (GoGet member)
-45.0 22.9 45.7
Source: BTS (2009), Go Get Survey (2011) and SGS calculations
It was assumed that annually (52 weeks), public transport and walking is used six days a week by a City resident/ business employee whereas a car is used five days of the week (i.e. separately). Consequently, the per-day weighted average figures were converted to per-annum figures based on the following usage assumptions:
A shared car/ private car: 260 days per annum per member
Public transport: 312 days per annum per member
Walking: 312 days per annum per member
13 Given that the defined rank score ranges from +1 to -1 with 0 corresponding to unchanged frequency of usage, the resulting
weighted average can be interpreted as the change in mode usage compared to the LGA average.
41
41

City of Sydney 18
Estimated Change in Physical Activity
When monetising health benefits due to car share members substituting private modes of transport with more walking, SGS estimated the change in the time devoted to walking by car share members. The estimation is based on responses to the GoGet survey in 2011, which asked respondents to report the extent of use of different modes of transport since becoming car share members. In essence, this process is very similar to the one used to derive estimated reduction in carbon emissions described above. The only difference in this case is that, instead of deriving the change in distance travelled of a car share member relative to an average LGA resident, this analysis estimates the change in travel time for a car share member relative to an average LGA resident (sourced from BTS). Table 8 shows the average time travelled by mode in the LGA and change (increase or decrease) in time travelled by a car share member relative to the LGA average. The results indicate that a car share member spends 62 additional minutes walking (per annum) compared to a non-member City resident. Only walking is considered as physical activity. Time travelled by other modes is only reported for consistency.
TABLE 9 . MODE SH ARE CH ANGE: M I NUTES
Mode Minutes per person per day (LGA)14 (BTS 2009 and 2010)
Weighted average change in minutes per member per annum
A car (Go Get or other private car) 17.05 -109
Public transport 9.60 56
Walking 2.49 62
Source: Based on BTS (2009), (2010) and Go Get survey (2011), SGS calculations.
Estimated Change in Parking Time
SGS estimated that a proportion of resident households (based on cars off the road – refer footnote 13 on page 19) save 1 minute each day looking for parking because of the availability of more on street parking spaces relative to cars. This reflects the fact that cars are taken off the road by car share membership, reducing overall demand levels for on street spaces (non-shared spaces). The daily benefit was converted to an annual value assuming 260 days per annum (which is consistent with the usage assumptions for estimated change in carbon emissions) when a car is parked.
14 Note that this is derived as follows: trip per person in Sydney LGA by mode x minutes per trip in Sydney SD by mode. Sydney SD
travel duration is used since LGA data is not available.
42
42

City of Sydney 19
3.3 Key Monetisation Values
The following tables show the key units of value and the calculations applied to assess marginal costs and benefits, given the aforementioned forecast of usage.
TABLE 1 0. CO ST ASSUMPTIO NS AND C ALC UL ATIO NS
Cost assumption Unit of Measurement
Amount per unit Source Calculation
Cost of planning for on-street car share bays
Wage p.a. $25,786 (0.25 FTE of a Band 7 employee across the Council Access & Transport Strategy and Traffic Operations)
Council $25,786 per annum
Cost of re-purposing spaces to on-street car share bays
Per space $889 Council $889 × Additional spaces per annum (once off costs of re-purposing)
Parking revenue loss from car share spaces
Per space p.a $1,35615 Weighted average based on Council advice
$1,356 × Cumulative spaces per annum
Source: SGS (2012)
15 See appendix for a breakdown by tariff area. Currently, 24% of car share spaces are in the tariff areas and the remaining car
share spaces are located outside tariff areas. We assume that the current distribution of car share spaces would continue into the future and that there will be no expansion of tariff areas over the timeframe of this analysis.
43
43

City of Sydney 20
TABLE 1 1. BENE FIT ASSUMPTIO NS AND C ALC ULAT IONS
Benefit assumptions Unit of measurement Amount Source Calculation
Resident members who defer car purchase
Share of total resident members
62% GoGet survey 2011 0.62 × Total additional resident members per annum × Cost saving of car purchase
Business members who defer car purchase
Share of total Business members
60% GoGet survey 2011 0.60 × Total additional business members per annum × Cost saving of car purchase
Savings from deferred car purchase
Per car. $2,950 p.a.
for five years
GoGet and carsales websites
Cars off the road × annualised value of a car
Health benefit due to walking $ per hour p.a. $3.02 Trubka, R., Newman, P., & Bilsborough, D. (2009)
$3.02 × additional minutes of walking per person per annum × Total members per annum
Carbon emissions saved due to reduction in car use (either Car Share or private car)
Per Vehicle kilometre travelled (VKT)
$1.00 Australian Transport Council
$1.00 × change in vehicle kilometres travelled by car per member per annum × Total members per annum
Reduced time to find parking Minutes per annum per car taken off road
260 SGS assumption
1 minute saved per day × 260 days per annum
Reduced cost of finding parking16 (per minute)
$ per minute $0.18 Australian Transport Council
$0.18 × reduced time to find parking × Cars off the road
*it was assumed that 50% of the members (both resident and commercial) purchase a new car and the remainder purchase a used car.
Source: SGS (2012)
16 This assumes that for each vehicle off the road (due to a car share member deferring purchase), one vehicle remaining on the
road would spend one less minute per day looking for parking. That is, we assume a 1:1 relationship between a deferred car and a remaining car, when calculating the reduced time to find parking.
44
44

City of Sydney 21
4 PERFORMANCE RESULTS
SECTION OVERVIEW
This section presents the results of the CBA, generating project performance measures. It also presents the results of sensitivity testing and the distributional analysis, before making some broad conclusions about the project’s merit.
4.1 Performance Measured Generated
The performance measures generated by the application of the CBA framework are provided in the table below.
TABLE 1 2. PERFOR MANCE MEASUR ES (2009 -23 T IME FR AME)
Relevant Party Costs Present Value (PV)
City of Sydney Planning & administration costs $0.23 million
Conversion costs $0.96 million
Foregone parking revenue $9.85 million
Wider community Increased congestion on public transport Not quantified
Total Costs $11.05 million
Relevant Party Benefits
Car share Deferral of car purchase savings $171.86 million
members Reduction in parking time $2.82 million
Health benefits $29.44 million
Improved transport choice Not quantified
Wider community Reduced travel time on roads Not quantified
Reduced travel externalities $13.02 million
Total Benefit s $214.31 million
Net Present Value (NPV)( 7% real discount rate) $203.26 million
Benefit Cost Ratio (BCR) 19.40
As is evident in the table, the net present value of the Project Scenario is $203.26 million, which represents a significant return on community capital. Benefits outweigh costs by a factor of 19. The majority of benefits relate to the cost saving associated with deferring car purchases. On its own, the cost saving from this ($171.86 million) outweighs the costs of the project. Health benefits associated with increased walking is also a key benefit. Altering the timeframe of analysis does not bring about a material change in results either (results reported in Table 13 overleaf). The BCR is highest for the shorter timeframes because growth in membership peaks at 2012 with consequent growth in benefits not being as high. On the other hand, costs of provision are not as high in the initial periods of the analysis with costs of foregone parking revenue rising over time as more on-street car spaces are lost to exclusive car share bay use.
45
45
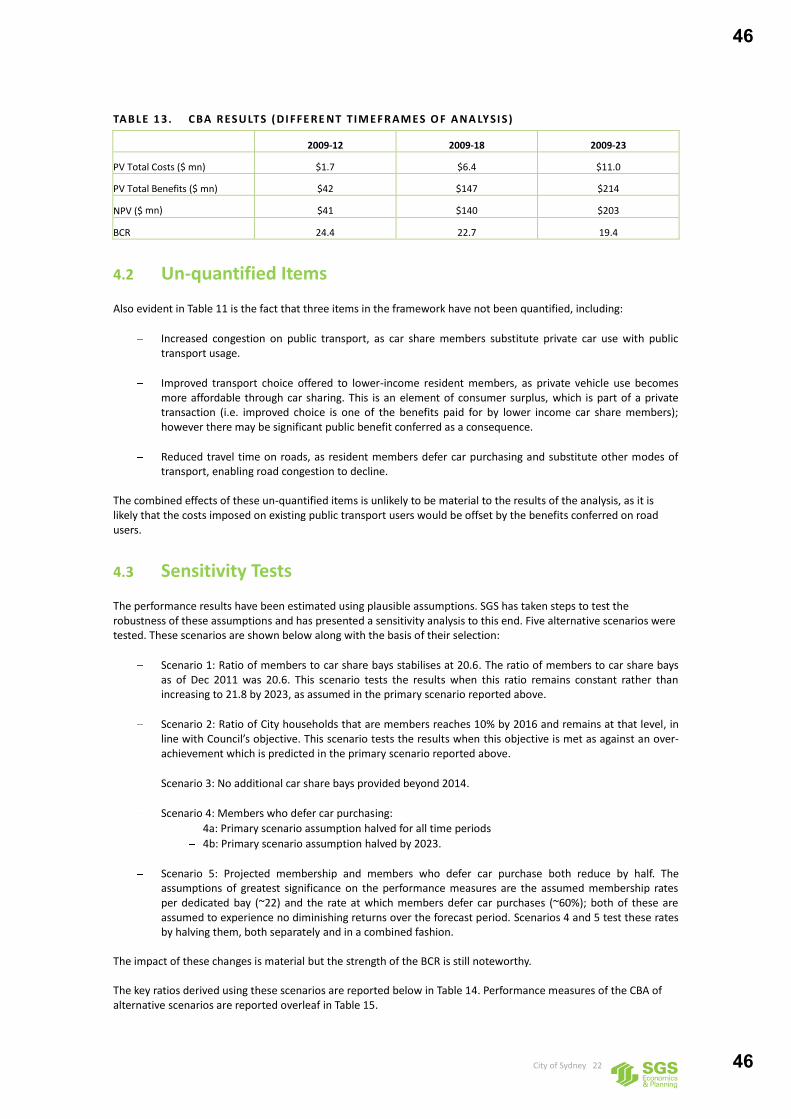
City of Sydney 22
TABLE 1 3. CBA R ESULTS ( DI FFE RE NT TIMEFR AMES O F ANA LYSI S )
2009-12 2009-18 2009-23
PV Total Costs ($ mn) $1.7 $6.4 $11.0
PV Total Benefits ($ mn) $42 $147 $214
NPV ($ mn) $41 $140 $203
BCR 24.4 22.7 19.4
4.2 Un-quantified Items
Also evident in Table 11 is the fact that three items in the framework have not been quantified, including:
Increased congestion on public transport, as car share members substitute private car use with public transport usage.
Improved transport choice offered to lower-income resident members, as private vehicle use becomes more affordable through car sharing. This is an element of consumer surplus, which is part of a private transaction (i.e. improved choice is one of the benefits paid for by lower income car share members); however there may be significant public benefit conferred as a consequence.
Reduced travel time on roads, as resident members defer car purchasing and substitute other modes of transport, enabling road congestion to decline.
The combined effects of these un-quantified items is unlikely to be material to the results of the analysis, as it is likely that the costs imposed on existing public transport users would be offset by the benefits conferred on road users.
4.3 Sensitivity Tests
The performance results have been estimated using plausible assumptions. SGS has taken steps to test the robustness of these assumptions and has presented a sensitivity analysis to this end. Five alternative scenarios were tested. These scenarios are shown below along with the basis of their selection:
Scenario 1: Ratio of members to car share bays stabilises at 20.6. The ratio of members to car share bays as of Dec 2011 was 20.6. This scenario tests the results when this ratio remains constant rather than increasing to 21.8 by 2023, as assumed in the primary scenario reported above.
Scenario 2: Ratio of City households that are members reaches 10% by 2016 and remains at that level, in line with Council’s objective. This scenario tests the results when this objective is met as against an over-achievement which is predicted in the primary scenario reported above.
Scenario 3: No additional car share bays provided beyond 2014.
Scenario 4: Members who defer car purchasing:
4a: Primary scenario assumption halved for all time periods
4b: Primary scenario assumption halved by 2023.
Scenario 5: Projected membership and members who defer car purchase both reduce by half. The assumptions of greatest significance on the performance measures are the assumed membership rates per dedicated bay (~22) and the rate at which members defer car purchases (~60%); both of these are assumed to experience no diminishing returns over the forecast period. Scenarios 4 and 5 test these rates by halving them, both separately and in a combined fashion.
The impact of these changes is material but the strength of the BCR is still noteworthy. The key ratios derived using these scenarios are reported below in Table 14. Performance measures of the CBA of alternative scenarios are reported overleaf in Table 15.
46
46

City of Sydney 23
TABLE 1 4. KEY R ATIO S AT 2 016 U NDE R P RIM ARY AND ALTER NATE SCENARIO S
Primary Scenario
Scenario 1 Scenario 2 Scenario 3 Scenario 4a Scenario 4b Scenario 5
Resident members who defer a car purchase
62% 62% 62% 62% 31% 47% 31%
Business members who defer a car purchase
60% 60% 60% 60% 30% 45% 30%
Cars taken off the road per car share vehicle
13.4 12.7 11.4 13.8 6.7 12.3 3.4
Members to car share bays 21.9 20.6 18.7 22.4 21.9 21.9 10.9
City households that are car share members
13% 12% 10% 10% 13% 13% 6.5%
TABLE 1 5. SE NSIT IV ITY ANALYSI S RESULTS (20 09 - 23 T I ME FRAME )
Primary Scenario
Scenario 1 Scenario 2 Scenario 3 Scenario 4a Scenario 4b Scenario 5
PV Total Costs ($ mn) $11.0 $11.0 $11.0 $7.3 $11.0 $11.0 $11.0
PV Total Benefits ($ mn) $214 $204 $162 $128 $126 $193 $63
NPV ($ mn) $203 $193 $151 $120 $115 $182 $52
BCR 19.4 18.5 14.7 17.3 11.4 17.4 5.7
PV Total Costs ($ mn) $11.0 $11.0 $11.0 $7.3 $11.0 $11.0 $11.0
4.4 Distributional Analysis
CBA takes a society wide approach, recognising that if the total benefits outweigh the costs then societal welfare, as a whole, improves with project delivery. Implicit in this approach is the assumption that either the costs and benefits are distributed evenly throughout society or, at least theoretically, it is possible to ‘tax’ the project beneficiaries and ‘compensate’ any geographic or demographic groups that are adversely affected by project implementation. Of course this is not always possible. Therefore, it is important that an understanding of the equity of the spread of costs and benefits is developed. The table overleaf discusses the distribution of costs and benefits associated with moving from the Base Case towards the Project Case scenario. Included also are some relevant transfer, which fall outside of the scope of the CBA framework but which will occur if project implementation proceeds. Mostly, the wider community and car share members stand to benefit from the project. There are also some benefits to car share operators. The majority of the costs of the project would be borne by Council, with some negative impacts also experienced by car manufacturers/ retailers and close substitutes to car share providers.
47
47

City of Sydney 24
TABLE 1 6. DI STRIB UTIO NAL (EQUI TY) ANALYSI S
ITEM COMMENTARY
Costs
Planning & administration costs
Borne by Council.
Conversion costs Borne by Council. From July 2012, costs of conversion may be borne by the provider.
Foregone parking revenue Allocating parking spaces to car share results in a direct loss of parking revenue to Council.
Increased congestion on public transport
The mode share change analysis suggests increased use of public transport by car share members. This will impose some costs on the existing public transport users. Any triggered service enhancements needed to cope with this change would be funded by NSW Government and in turn NSW residents and public transport users.
Benefits
Deferred car purchase savings Approx. 60% of car share members (resident and business) are anticipated to defer the purchase of a private car. This is likely to result in significant savings for these members. Generated resources can be used for alternative purposes.
Reduction in parking time City residents and (potentially, visitors) will find it easier to locate parking spaces, as the number of parking spaces relative to cars on the road increases.
Health benefits This benefit would be primarily enjoyed by members. However, the public health cost savings will apply to all levels of government along with business, through increased worker productivity and fewer sick days.
Improved transport choice This benefit applies to all car share members but would be enjoyed most by those with low incomes, who cannot afford a private vehicle under traditional ownership arrangements. This may flow through to wider public benefits as these individuals have access to opportunities that otherwise might not be available to them.
Reduced travel time on roads This benefit flows to existing road users, particularly those that travel in or through the City of Sydney.
Reduced travel externalities This benefit flows to road users and the broader community, as it includes reduced pollution, noise, GHG emissions, traffic accidents, etc. These externalities, under the Base Case, impose significant costs on the community.
Others
Niche marketing opportunities for car manufacturers/ retailers
A larger car share market may enable car manufacturers to increase sales, test or promote novel products and further improve product differentiation to enhance brand value.
Reduced demand for cars (and custom for car manufacturers/ retailers)
The reduction in demand for cars may adversely impact car manufacturers and retailers.
Reduced demand for car share substitutes
Increased usage of car share services is likely to reduce demand for taxi and car hire businesses which are close substitutes. Offsetting this is the higher revenue won by car share operators.
Better urban design outcomes Reduced demand for car parking is likely to result in better urban design outcomes which will benefit the City of Sydney residents, businesses and improve the perception of the Council in the eyes of constituent.
Membership tradeoffs While a car share member will potentially enjoy significant savings associated with deferring a car purchase, the offer to members does involve trading off the convenience of owning a car with the higher variable costs (out of pocket plus other less tangible costs such as increased trip planning requirements) of sharing cars.
48
48

City of Sydney 25
4.5 Conclusions
This study found that providing more on-street car share bays and consequently more shared vehicles in the City of Sydney would provide a range of benefits to car share members and the wider community, including:
Annual savings to households as car purchasing is deferred;
Reduction in parking time as relative availability of car spaces increases;
Health benefits as resident members opt for more walking/ cycling and consequently lead a more active lifestyle;
Improved transport choice as some lower-income resident members enjoy improved transport options;
Reduced travel time and congestion on roads as members defer car purchasing and substitute other modes of transport, including public transport; and
Reduced travel externalities including reduced pollution, noise, GHG emissions, traffic accidents, etc due to the lower number of cars on the road.
The study found that approximately 13 private cars would be taken off the road for each car share vehicle and approximately 22 members would share one car share vehicle by 2023. These results are consistent with the international literature which reveals that there are on average 23 members per car sharing vehicle and between 9 and 13 private vehicles are taken off the road per car sharing vehicle. The analysis assumes that the provision of on-street car share bays in the City of Sydney will continue at current conversion levels. If 10 car share bays are converted on an ongoing basis and membership rates continue on their trend rate of growth, the City is expected to achieve its target of 10% of City households becoming members of a car share provider ahead of schedule. Even when no car share bays are provided beyond 2014, the City is expected to meet this target, but only as scheduled in 2016. The performance measures generated by the quantitative analysis suggest that providing more on-street car share bays would yield significant society wide benefits compared to the costs of delivery. Inclusion of un-quantified costs and benefits are unlikely to materially impact this broad conclusion. Furthermore, the distribution of costs and benefits amongst stakeholder groups does not raise any particular alarms. A number of alternative assumptions ranging from conservative to plausible were tested as part of a robust sensitivity check. The benefit cost ratio ranged between 5.7 and 19.4 after testing for the impact of changing assumptions. In particular, the assumptions of greatest significance are the assumed membership rates per dedicated bay (~22) and the rate at which members defer car purchases (~60%); both of these are assumed to experience no diminishing returns over the forecast period. If these assumed rates are halved, both separately (BCR 9.7) and in a combined fashion (BCR 5.7), the performance results decline but still remain at robust levels. Since most benefits are achieved in relatively short timeframes with costs escalating slowly over time, the BCR of different tested scenarios were also quite high. Based on these collective findings, it can be confidently concluded that dedicating additional exclusive use car share member bays is a worthy project from a triple bottom line perspective. It is therefore a good use of community capital.
49
49

City of Sydney 26
5 REFERENCES
Bergmaier, R., Mason, C., McKenzie, M., Campbell, S., and Hobson, A., (2004), Car Sharing: An Overview, Australian Government, Canberra
Cervero R. & Tsai Y. (2004) “City CarShare in San Francisco, California second-year travel demand and car ownership impacts”. Transportation Research Record, (1887), pp. 117-127.
City of Melbourne (2011) Car sharing Research, September 2010, GHD
City of Melbourne (2011) Transport Strategy Update 2011, Planning For Future Growth
Costain C., Ardron C. & Habib K.N. (2012) “Synopsis of users' behaviour of a carsharing program: A case study in Toronto”, Transportation Research Part A: Policy and Practice, 46 (3), pp. 421-434.
Cohen, A., Shaheen, S. And McKenzie, R. (2008) Car Sharing: A Guide for Local Planners, Institute of Transportation Studies, University of California, Berkeley
Duncan, M. (2011) "The cost saving potential of carsharing in a US context", Transportation, vol. 38, no. 2, pp. 363-382.
Fellows N.T. & Pitfield D.E. (2000) “An economic and operational evaluation of urban car-sharing”, Transportation Research Part D, 5, (1), pp. 1–10.
Firnkorn, J. & Muller, M. (2011) “What will be the environmental effects of new free-floating car-sharing systems? The case of car2go in Ulm”. Ecological Economy 70, 1519–1528.
Firnkorn, J. & Muller, M. (2012) “Selling Mobility instead of Cars: New Business Strategies of Automakers and the Impact on Private Vehicle Holding” Business Strategy and the Environment, vol. 21, issue 4, May 2012, pp 264-280
Herodes, M. & Skinner, I. (2005) Car sharing: the motivations of industry. Institute for European Environmental Policy (IEEP).
Huwer, U. (2003) ‘Public transport and car-sharing—benefits and effects of combined services’, Transport Policy, Vol. 11, No. 1, pp. 77-87
Huwer, U. (2004) “Public transport and car-sharing: benefits and effects of combined service”, Transport Policy 11, 77–87.
Katsev, R. (2003) ‘Car Sharing: A New Approach to Urban Transportation Problems’, Analyses of Social Issues and Public Policy, Vol. 3, No. 1, pp. 65-86
Katzev, R. (2003) “Car sharing: A new approach to urban transportation problems” Analyses of Social Issues and Public Policy, vol. 3, No. 1, 2003, pp. 65—86.
Litman, T. (1999) Evaluating carsharing benefits. Victoria Transport Policy Institute.
Martin E.W., Shaheen S.A. (2011) Greenhouse gas emission impacts of carsharing in North America, IEEE Transactions on Intelligent Transportation Systems, 12 (4) , art. no. 5951778 , pp. 1074-1086.
Martin, E., Shaheen, S. & Lidicker, J. (2010) Impact of carsharing on household vehicle holdings.
May, A., Ross T., Grebert J. & Segarra G. (2008) “User reaction to car share and lift share within a transport 'marketplace'”, IET Intelligent Transport Systems, 2 (1) , pp. 47-60.
Meijkam R. (2000) “Changing consumer behavior through ecoefficient services: an empirical study on car sharing’, Delft University of Technology, The Netherlands.
Shaheen, S.A. & Cohen, A.P. (2007) “Growth in worldwide carsharing: an international comparison, Transp. Res. Rec, 1992/2007, pp. 81–89
Shaheen, S.A., Cohen, A.P. & Martin E.M. (2010) “Carsharing parking policy: a review of North American practices and San Francisco Bay area case study” Transportation Research Record, March 15.
Shaheen, S.A., Schwartz, A. & Wipyewski, K. (2003) “U.S. Carsharing & Station Car Policy Considerations: Monitoring Growth, Trends & Overall Impacts” Transportation Research Board (TRB).
50
50

City of Sydney 27
Transportation Research Board (2005) Car-Sharing: Where and How It Succeeds, Transit Cooperative Research Program TCRP Report 108.
Zheng J., Scott M., Rodriguez M., Sierzchula W., Platz D., Guo J.Y., Adams T.M. (2009) “Carsharing in a university community: Assessing potential demand and distinct market characteristics, Transportation Research Record, (2110), pp. 18-26.
51
51

City of Sydney 28
6 APPENDIX
6.1 Derivation of on-street membership
In order to derive on-street resident and on-street business membership, we apply the ratios of GoGet members per GoGet vehicle (F, G and H below) to total on street car share bay each month.
TABLE 1 7. RESI DE NT ME MBER PROJ ECT IO N MO DEL
A B C D A / D = F B / D = G C / D = H E E x F E x G E x H
GoGet
Resident Memebrs
GoGet Business
Members
GoGet Total
Members
Number of GoGet vehicles (on and
off street)
GoGet Resident
members per
GoGet vehicle
GoGet business
members per
GoGet vehicle
Total members
per GoGet
vehicle
Total On-street Car
Share spaces
installed
Total on-street
resident members
Total on-street
business members
Total on-street
members
Oct-10 3,334 1,047 4,381 202 17 5 21.7 214 3,532 1,109 4,641
Nov-10 3,464 1,099 4,563 215 16 5 21.2 230 3,706 1,176 4,881
Dec-10 3,627 1,121 4,748 240 15 5 19.8 239 3,612 1,116 4,728
Jan-11 4,002 1,231 5,233 241 17 5 21.7 242 4,019 1,236 5,255
Feb-11 4,063 1,249 5,312 236 17 5 22.5 247 4,252 1,307 5,560
Mar-11 4,234 1,346 5,580 245 17 5 22.8 266 4,597 1,461 6,058
Apr-11 4,454 1,425 5,879 258 17 6 22.8 272 4,696 1,502 6,198
May-11 4,604 1,478 6,082 263 18 6 23.1 276 4,832 1,551 6,383
Jun-11 4,668 1,604 6,272 270 17 6 23.2 284 4,910 1,687 6,597
Jul-11 4,716 1,677 6,393 280 17 6 22.8 286 4,817 1,713 6,530
Aug-11 4,849 1,794 6,643 285 17 6 23.3 291 4,951 1,832 6,783
Sep-11 5,005 1,859 6,864 303 17 6 22.7 309 5,104 1,896 7,000
Oct-11 5,028 2,054 7,082 317 16 6 22.3 332 5,266 2,151 7,417
Nov-11 5,334 2,087 7,421 327 16 6 22.7 338 5,513 2,157 7,671
Dec-11 5,565 2,136 7,701 373 15 6 20.6 354 5,282 2,027 7,309
Jan-12 5,778 2,271 8,049 374 15 6 21.5 364 5,624 2,210 7,834
Feb-12 5,994 2,425 8,419 382 16 6 22.0 366 5,743 2,323 8,066
Mar-12 6,175 2,573 8,748 394 16 7 22.2 374 5,862 2,442 8,304
Apr-12 6,310 2,617 8,927 401 16 7 22.3 385 6,058 2,513 8,571
May-12 6,452 2,778 9,230 413 16 7 22.3 392 6,124 2,637 8,761
Source: SGS (2012) based on Operator Compliance Reports provided by City of Sydney (2012).
52
52

City of Sydney 29
6.2 Estimation of Resident Members
Various iterations of the regression model were attempted. The model with the least amount of autocorrelation was chosen. Due to strong serial correlation in the monthly resident membership data, a two variable Auto Regressive (AR) regression model was used to project resident membership due to on-street spaces. Note that the augmented data set with resident members due to on-street spaces was used. In the final regression model reported below, the P-Value for the estimated coefficient of total car share spaces is 0.0034 implying that the hypothesis that membership is supply driven is valid at less than 1% significance level. In other words, the probability of the true (population) coefficient for total car share spaces being zero (i.e. car share space not impacting membership) is 0.11% (less than 1%). Furthermore, Heteroscedasticity and Autocorrelation Consistent (HAC) standard errors are used. It is important to note that, given that the sample is based on the ‘augmented dataset’ of 20 observations, the asymptotic properties of the standard errors (and P-values) are likely to be somewhat compromised. However, this trade-off that must is faced by any econometric modeller working with data constraints. The following table shows the key regression results for the final resident member projection model. The dependent variable in the model is resident membership t and Heteroscedasticity and Autocorrelation Consistent (HAC) standard errors (bandwidth 2 Bartlett Kernel) are used to account for any remaining heteroscedasticity and autocorrelation in the data.
TABLE 1 8. RESI DE NT ME MBER PROJ ECT IO N MO DEL
Variable Co-efficient Standard error t-ratio p-value
Constant 455.870 244.217 1.867 0.0804 Resident member t - 1 0.657860 0.115743 5.684 3.39e-05
Total car share spaces 4.36724 1.27162 3.434 0.0034
R-squared 0.965275
Source: SGS (2012)
The following table shows the autocorrelation tests for the resident member projection model. The null hypothesis for the test is that there is no autocorrelation in the residuals of the model. The P-value shows the probability of the null hypothesis (of autocorrelation) being true. P-values less than 5 percent are considered a rejection of the null hypothesis of autocorrelation at that significance level (5 percent). The tests do not reveal statistically significant evidence of autocorrelation suggesting that the model has been correctly specified. Again, note that since the sample is based on the ‘augmented dataset’ of 20 observations, the asymptotic properties of the standard errors (and P-values) are likely to be somewhat compromised.
TABLE 1 9. RESI DE NT ME MBE R PROJECT IO N MO DEL: AUTO CORR ELATIO N TEST S (P - VALUE)
Autocorrelation test 1st order 4th order 12th order
Lagrange Multiplier F test 0.306 0.21 0.697
Ljung-Box Q' 0.33 0.57 0.244
Source: SGS (2012)
The following table shows projected resident membership, members per space and additional members per additional space.
53
53

City of Sydney 30
TABLE 2 0. RESI DE NT ME MBER PROJ ECT IO NS
Year Total Resident members due to
on-street car share bays
Total on-street car share bays
Ratio of resident members to car
share bay
Total additional resident members
Total additional bays
Additional resident member per additional bay
2009 1,981 120 17 1,981 120 17
2010 3,612 239 15 1,631 119 14
2011 5,282 354 15 1,670 115 15
2012 6,986 462 15 1,704 108 16
2013 8,516 582 15 1,530 120 13
2014 10,048 702 14 1,532 120 13
2015 11,579 822 14 1,532 120 13
2016 13,111 942 14 1,532 120 13
2017 14,643 1,062 14 1,532 120 13
2018 16,175 1,182 14 1,532 120 13
2019 17,706 1,302 14 1,532 120 13
2020 19,238 1,422 14 1,532 120 13
2021 20,770 1,542 13 1,532 120 13
2022 22,302 1,662 13 1,532 120 13
2023 23,833 1,782 13 1,532 120 13
Source: SGS (2012)
6.3 Estimation of Business Members
Various iterations of the regression model were attempted. The model with the least amount of autocorrelation was chosen. The following table shows the key regression results for the final business member projection model. Note that the dependent variable in the model is business membership t and that Heteroscedasticity and Autocorrelation Consistent (HAC) standard errors (bandwidth 2 - Bartlett kernel) are used to account for any remaining heteroscedasticity and autocorrelation in the data. It is important to note that, given that the sample is based on the ‘augmented dataset’ of 20 observations, the asymptotic properties of the standard errors (and P-values) are likely to be somewhat compromised. However, this trade-off that must is faced by any econometric modeller working with data constraints.
TABLE 2 1. BUSINESS MEMBE R PROJ EC T ION MODEL
Variable Co-efficient Standard error t-ratio p-value
Constant -436.920 128.640 -3.396 0.0037
Business member t - 1 0.477062 0.116319 4.101 0.0008
Total car share spaces 4.66924 1.02497 4.555 0.0003
R-squared 0.975673
Source: SGS (2012)
The following table shows the autocorrelation tests for the business member projection model. The null hypothesis for the test is that there is no autocorrelation in the residuals of the model. The P-value shows the probability of the null hypothesis (of autocorrelation) being true. P-values less than 5 percent are considered a rejection of the null hypothesis of autocorrelation at that significance level (5 percent). The tests do not reveal statistically significant evidence of autocorrelation suggesting that the model has been correctly specified. Again, note that since the sample is based on the ‘augmented dataset’ of 20 observations, the asymptotic properties of the standard errors (and P-values) are likely to be somewhat compromised.
54
54

City of Sydney 31
TABLE 2 2. BUSINESS MEMBE R PROJ EC T ION MODEL: AUTOCO RRE LATIO N TEST S (P - VALUE)
Autocorrelation test 1st order 4th order 12th order
Lagrange Multiplier F test 0.704 0.95 0.457
Ljung-Box Q' 0.796 0.872 0.601
Source: SGS (2012)
The following table show projected business membership, members per space and additional members per additional space.
TABLE 2 3. BUSINESS MEMBE R PROJ EC T IONS
Year Business members total
Total on-street car share bays
Ratio of business members to car
share bays
Total additional business members
Total additional bays
Additional business member per additional bay
2009 622 120 5 622 120 5
2010 1,116 239 5 494 119 4
2011 2,027 354 6 911 115 8
2012 3,208 462 7 1,181 108 11
2013 4,280 582 7 1,071 120 9
2014 5,351 702 8 1,071 120 9
2015 6,423 822 8 1,071 120 9
2016 7,494 942 8 1,071 120 9
2017 8,565 1,062 8 1,071 120 9
2018 9,637 1,182 8 1,071 120 9
2019 10,708 1,302 8 1,071 120 9
2020 11,780 1,422 8 1,071 120 9
2021 12,851 1,542 8 1,071 120 9
2022 13,923 1,662 8 1,071 120 9
2023 14,994 1,782 8 1,071 120 9
Source: SGS (2012)
55
55
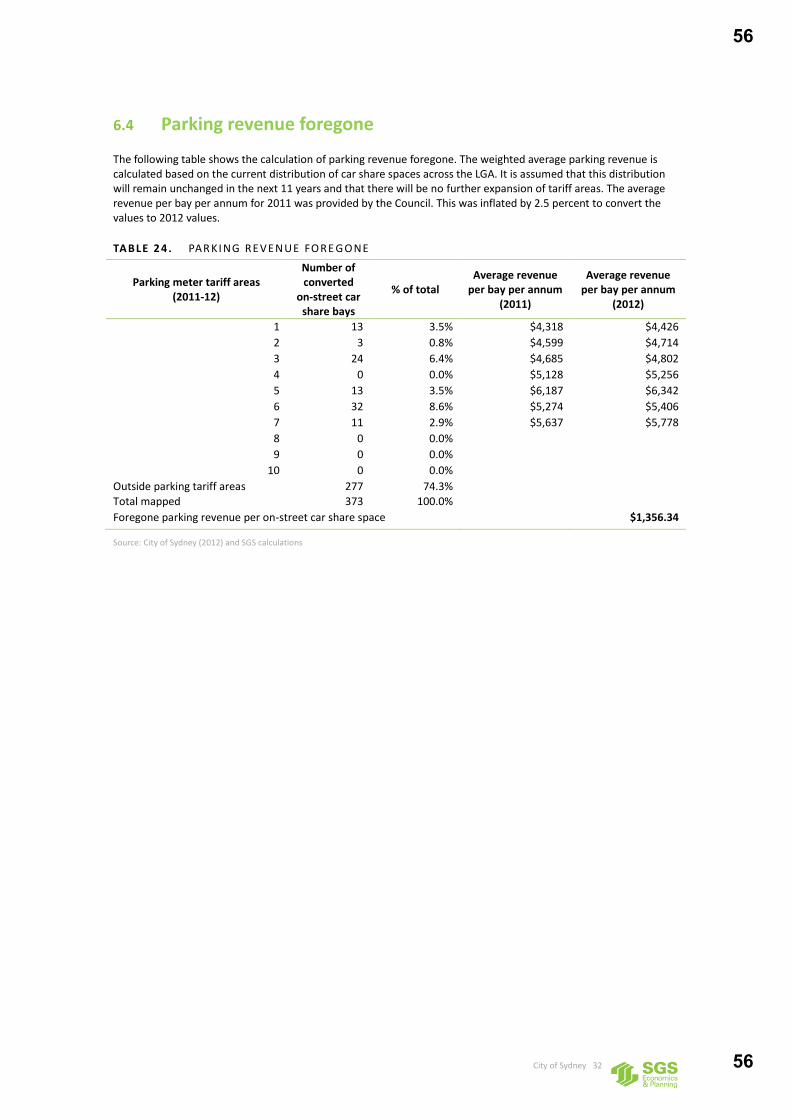
City of Sydney 32
6.4 Parking revenue foregone
The following table shows the calculation of parking revenue foregone. The weighted average parking revenue is calculated based on the current distribution of car share spaces across the LGA. It is assumed that this distribution will remain unchanged in the next 11 years and that there will be no further expansion of tariff areas. The average revenue per bay per annum for 2011 was provided by the Council. This was inflated by 2.5 percent to convert the values to 2012 values.
TABLE 2 4. PAR KI NG REVENUE FORE G ONE
Parking meter tariff areas (2011-12)
Number of converted
on-street car share bays
% of total Average revenue
per bay per annum (2011)
Average revenue per bay per annum
(2012)
1 13 3.5% $4,318 $4,426
2 3 0.8% $4,599 $4,714
3 24 6.4% $4,685 $4,802
4 0 0.0% $5,128 $5,256
5 13 3.5% $6,187 $6,342
6 32 8.6% $5,274 $5,406
7 11 2.9% $5,637 $5,778
8 0 0.0%
9 0 0.0%
10 0 0.0%
Outside parking tariff areas 277 74.3%
Total mapped 373 100.0%
Foregone parking revenue per on-street car share space $1,356.34
Source: City of Sydney (2012) and SGS calculations
56
56
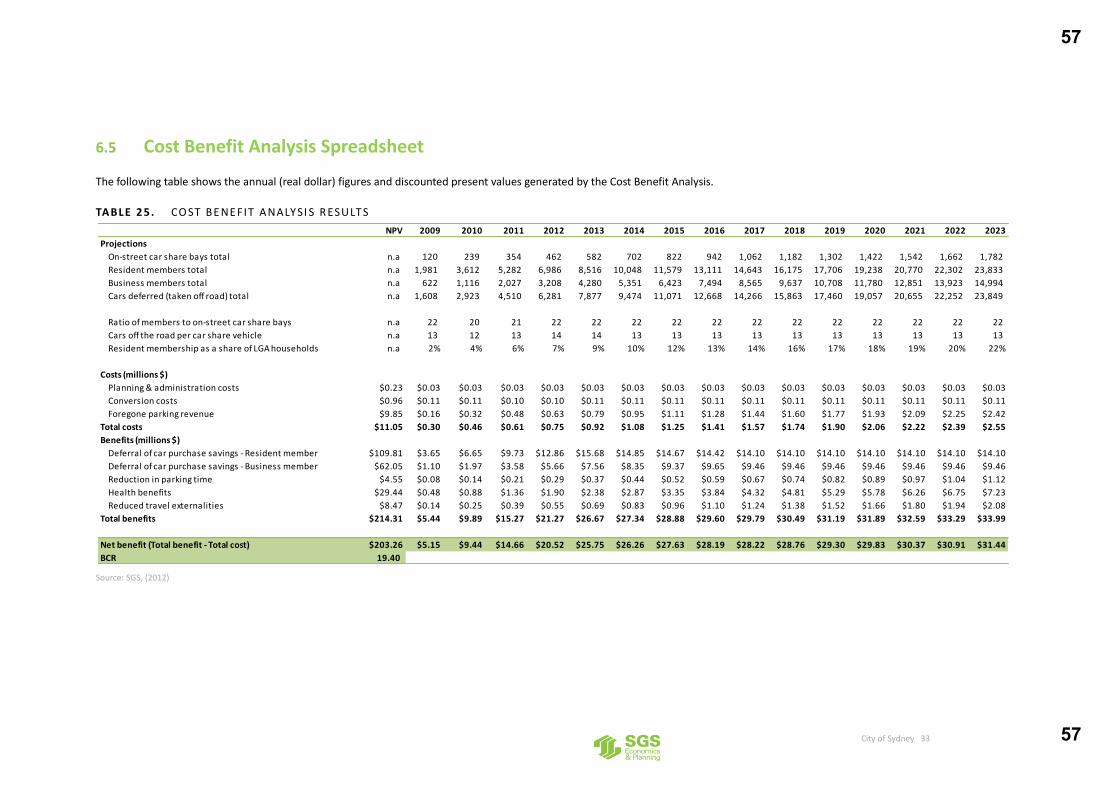
City of Sydney 33
6.5 Cost Benefit Analysis Spreadsheet
The following table shows the annual (real dollar) figures and discounted present values generated by the Cost Benefit Analysis.
TABLE 2 5. CO ST BE NE FIT ANALYSI S R ESULTS
Source: SGS, (2012)
NPV 2009 2010 2011 2012 2013 2014 2015 2016 2017 2018 2019 2020 2021 2022 2023
Projections
On-street car share bays total n.a 120 239 354 462 582 702 822 942 1,062 1,182 1,302 1,422 1,542 1,662 1,782
Resident members total n.a 1,981 3,612 5,282 6,986 8,516 10,048 11,579 13,111 14,643 16,175 17,706 19,238 20,770 22,302 23,833
Business members total n.a 622 1,116 2,027 3,208 4,280 5,351 6,423 7,494 8,565 9,637 10,708 11,780 12,851 13,923 14,994
Cars deferred (taken off road) total n.a 1,608 2,923 4,510 6,281 7,877 9,474 11,071 12,668 14,266 15,863 17,460 19,057 20,655 22,252 23,849
Ratio of members to on-street car share bays n.a 22 20 21 22 22 22 22 22 22 22 22 22 22 22 22
Cars off the road per car share vehicle n.a 13 12 13 14 14 13 13 13 13 13 13 13 13 13 13
Resident membership as a share of LGA households n.a 2% 4% 6% 7% 9% 10% 12% 13% 14% 16% 17% 18% 19% 20% 22%
Costs (millions $)
Planning & administration costs $0.23 $0.03 $0.03 $0.03 $0.03 $0.03 $0.03 $0.03 $0.03 $0.03 $0.03 $0.03 $0.03 $0.03 $0.03 $0.03
Conversion costs $0.96 $0.11 $0.11 $0.10 $0.10 $0.11 $0.11 $0.11 $0.11 $0.11 $0.11 $0.11 $0.11 $0.11 $0.11 $0.11
Foregone parking revenue $9.85 $0.16 $0.32 $0.48 $0.63 $0.79 $0.95 $1.11 $1.28 $1.44 $1.60 $1.77 $1.93 $2.09 $2.25 $2.42
Total costs $11.05 $0.30 $0.46 $0.61 $0.75 $0.92 $1.08 $1.25 $1.41 $1.57 $1.74 $1.90 $2.06 $2.22 $2.39 $2.55
Benefits (millions $)
Deferral of car purchase savings - Resident member $109.81 $3.65 $6.65 $9.73 $12.86 $15.68 $14.85 $14.67 $14.42 $14.10 $14.10 $14.10 $14.10 $14.10 $14.10 $14.10
Deferral of car purchase savings - Business member $62.05 $1.10 $1.97 $3.58 $5.66 $7.56 $8.35 $9.37 $9.65 $9.46 $9.46 $9.46 $9.46 $9.46 $9.46 $9.46
Reduction in parking time $4.55 $0.08 $0.14 $0.21 $0.29 $0.37 $0.44 $0.52 $0.59 $0.67 $0.74 $0.82 $0.89 $0.97 $1.04 $1.12
Health benefits $29.44 $0.48 $0.88 $1.36 $1.90 $2.38 $2.87 $3.35 $3.84 $4.32 $4.81 $5.29 $5.78 $6.26 $6.75 $7.23
Reduced travel externalities $8.47 $0.14 $0.25 $0.39 $0.55 $0.69 $0.83 $0.96 $1.10 $1.24 $1.38 $1.52 $1.66 $1.80 $1.94 $2.08
Total benefits $214.31 $5.44 $9.89 $15.27 $21.27 $26.67 $27.34 $28.88 $29.60 $29.79 $30.49 $31.19 $31.89 $32.59 $33.29 $33.99
Net benefit (Total benefit - Total cost) $203.26 $5.15 $9.44 $14.66 $20.52 $25.75 $26.26 $27.63 $28.19 $28.22 $28.76 $29.30 $29.83 $30.37 $30.91 $31.44
BCR 19.40
57
57
www.sgsep.com.au
Contact us BRISBANE
PO Box 117 Level 1, 76 McLachlan Street Fortitude Valley QLD 4006
+61 7 3124 9026 [email protected]
CANBERRA
Level 1, 55 Woolley Street Dickson ACT 2602
+61 2 6262 7603 [email protected]
HOBART
Unit 2, 5 King Street Bellerive TAS 7018
+61 (0)439 941 934 [email protected]
MELBOURNE
Level 5, 171 La Trobe Street Melbourne VIC 3000
+61 3 8616 0331 [email protected]
SYDNEY
Suite 12, 50 Reservoir Street Surry Hills NSW 2010
+61 2 8307 0121 [email protected]
58
58
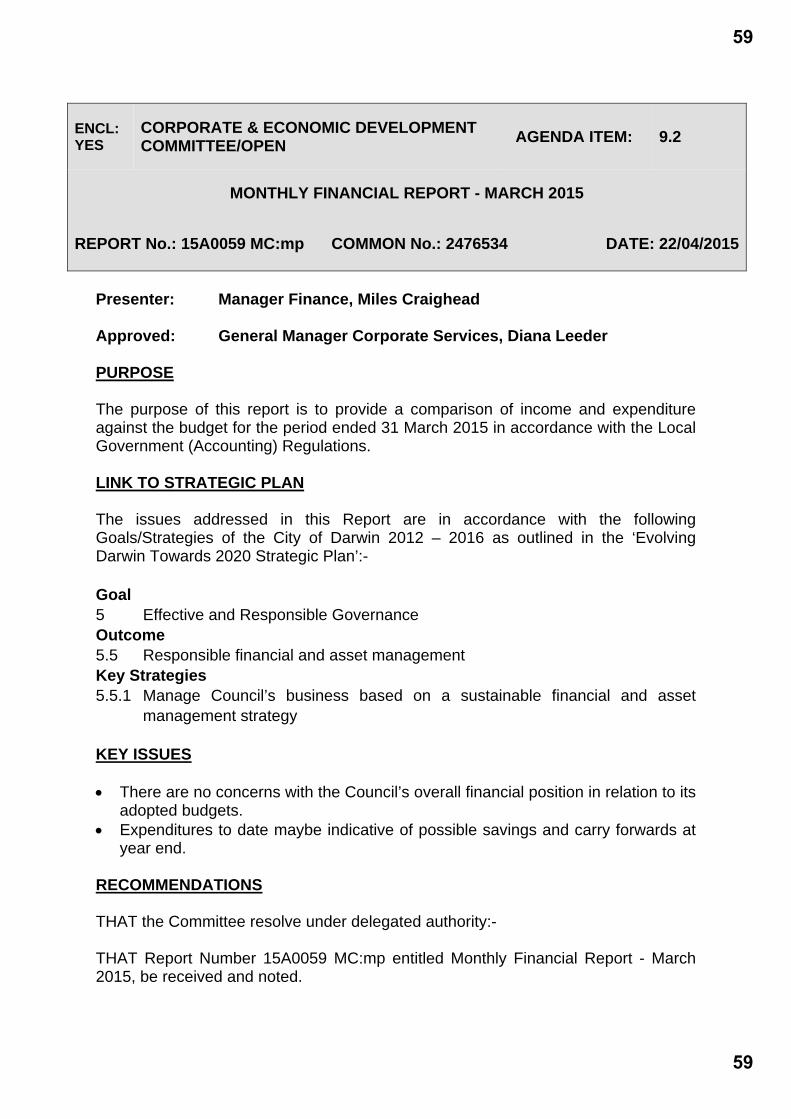
ENCL: YES
CORPORATE & ECONOMIC DEVELOPMENT COMMITTEE/OPEN
AGENDA ITEM: 9.2
MONTHLY FINANCIAL REPORT - MARCH 2015
REPORT No.: 15A0059 MC:mp COMMON No.: 2476534 DATE: 22/04/2015
Presenter: Manager Finance, Miles Craighead Approved: General Manager Corporate Services, Diana Leeder PURPOSE The purpose of this report is to provide a comparison of income and expenditure against the budget for the period ended 31 March 2015 in accordance with the Local Government (Accounting) Regulations. LINK TO STRATEGIC PLAN The issues addressed in this Report are in accordance with the following Goals/Strategies of the City of Darwin 2012 – 2016 as outlined in the ‘Evolving Darwin Towards 2020 Strategic Plan’:- Goal 5 Effective and Responsible Governance Outcome 5.5 Responsible financial and asset management Key Strategies 5.5.1 Manage Council’s business based on a sustainable financial and asset
management strategy KEY ISSUES There are no concerns with the Council’s overall financial position in relation to its
adopted budgets. Expenditures to date maybe indicative of possible savings and carry forwards at
year end. RECOMMENDATIONS THAT the Committee resolve under delegated authority:- THAT Report Number 15A0059 MC:mp entitled Monthly Financial Report - March 2015, be received and noted.
59
59

PAGE: 2 REPORT NUMBER: 15A0059 MC:mp SUBJECT: MONTHLY FINANCIAL REPORT - MARCH 2015 BACKGROUND The format of the monthly report has previously been consulted and endorsed. DISCUSSION Key Performance Indicators These indicators are based on the financial statement results, and following consultation it is not practicable or meaningful to provide results each month. Key Performance Indicators will be provided at year end. Financial Statements This report contains a set of financial statements comparing year to date actual with original and amended budgets. The amended budgets include the carry forwards from 2014 and the 1st quarter budgeted variation adopted at the 1st Ordinary Council Meeting on 11 November 2014 and the 2nd quarter budgeted variation adopted at the 1st Ordinary Council Meeting on the 17 March 2015. The following statements are included: Income Statement All sources of Council’s income (revenue) and all operating expenses. Statement of Financial Position The Statement of Financial Position outlines what the Council owns (assets) and what it owes (liabilities). Municipal Plan Summary The Municipal Plan Summary follows a similar format to the statement of cash flows, but is based on working capital rather than cash. It also discloses transfers to and from cash backed reserves. Reserves Summary A “Reserves Summary” is presented with this report. The Reserves Summary budget includes budget variations resolved by Council to date. Investments Report The Investments Report details all cash and investments held by institution, this also provides information on interest rate returns and maturities. Accounts Receivable Report This includes details of rate receipt collection, outstanding general debtors and performance on rates recovery compared to the previous year. This report also includes additional information on infringement debtors, rates arrears, rates struck and rates outstanding.
60
60

PAGE: 3 REPORT NUMBER: 15A0059 MC:mp SUBJECT: MONTHLY FINANCIAL REPORT - MARCH 2015 CONSULTATION PROCESS In preparing this report, the following City of Darwin officers were consulted: Officers responsible for budgets POLICY IMPLICATIONS Nil BUDGET AND RESOURCE IMPLICATIONS There are no concerns regarding the Council’s financial position in relation to its adopted budgets. Materials and services expenses are 70% spent, employee costs 69% and capital expenditure is 47% spent (or spent plus commitments 61%) with 75% of the year elapsed. This is indicative of possible savings and/or carry overs into the following year. Disclosures have been made within the detailed attachments in respect of areas where this is most likely to occur. Requests for variations will be addressed in the 3rd quarter budget review. Depreciation expense will exceed budget due to a number of factors including the revaluation of infrastructure as at 30 June 2014. This does not have any current funding implications (non cash) but will affect the statement of income result. This is a subject of a separate report. RISK/LEGAL/LEGISLATIVE IMPLICATIONS Part 8 of the Local Government (Accounting) Regulations require that a monthly financial report is presented to Council. Regulation 18 states:- 1. The CEO must, in each month, lay before a meeting of the council a report, in a
form approved by the council, setting out:
a) The actual income and expenditure of the council for the period from the commencement of the financial year to the end of the previous month; and
b) the forecast income and expenditure for the whole of the financial year. 2. The report must include:
a) Details of all cash and investments held by the council (including money held in trust); and
b) a statement on the debts owed to the council including the aggregate
amount owed under each category with a general indication of the age of the debts; and
61
61

PAGE: 4 REPORT NUMBER: 15A0059 MC:mp SUBJECT: MONTHLY FINANCIAL REPORT - MARCH 2015
c) other information required by the Council. 3. If a council does not hold a meeting in a particular month, the report is to be laid
before the council committee performing the council's financial functions for the particular month.
It should be noted that monthly financial reports are not independently audited, but are subject to internal control and review processes. ENVIRONMENTAL IMPLICATIONS Nil COUNCIL OFFICER CONFLICT OF INTEREST DECLARATION We the Author and Approving Officers declare that we do not have a Conflict of Interest in relation to this matter. MILES CRAIGHEAD DIANA LEEDERMANAGER FINANCE GENERAL MANAGER
CORPORATE SERVICES For enquiries, please contact Miles Craighead on 89300523 or email: [email protected]. Attachment: Attachment A: Monthly Financial Report - March 2015
62
62

Income StatementFor the Period Ended 31/03/2015
2013-14Audited Original Amended YTD YTDActual Budget Budget Actual$'000 $'000 $'000 $'000 %
Income from Continuing Operations Comment59,293 Rates & Annual Charges 62,243 62,306 63,096 101% Exceeds expectation
23,072 User Charges, Fees & Other 24,932 21,692 17,546 81% Exceeds expectation
2,921 Interest & Investment Revenue 2,636 2,636 2,189 83% Exceeds expectation
4,887 Grants & Contributions - Operating 5,880 6,007 4,926 82% Exceeds expectation
90,173 Total Income from Continuing Operations 95,690 92,641 87,756 95%
Less Expenses from Continuing Operations26,749 Employee Costs 28,336 28,854 19,827 69% No issues
268 Borrowing Costs 256 256 100 39% No issues
48,215 Materials and Services 50,511 48,315 33,815 70% No issues
16,446 Depreciation and Amortisation 16,812 16,812 17,356 103% Additional Exp
91,678 Total Expenses from Continuing Operations 95,915 94,237 71,098 75%
1,505- Operating Result - Continuing Operations (226) (1,595) 16,658
10,954 Grants & Contributions - Capital 1,945 2,598 7,184 277% Exceeds expectation
(621) Income (Loss) from Asset Disposal - - (328) 1000% Additional Exp
8,828 Net Operating Result For the Year 1,720 1,002 23,515
2014/15
Income Statement
Outlines income and operating expenses. Excludes capital expenditure and instead recognises depreciation expense. The net operating surplus or deficit for the reporting period is a measure of Council's financial performance. This figure is determined by deducting tot al operating expenses including depreciation from total operating revenue.
Operating income Rates are recognised at the start of the year hence more than 100% achieved, noting that rate revenue has exceeded growth expectation, this will be addressed at 3rd qtr review. User charges, fees and other revenue are also tracking above expectat ion for Weighbridge charges (offset by higher expenditure). Interest revenue is exceeding target, but this trend will decrease with declining interest rates. Some additional interest will be adjusted at 3rd qtr review. Operational grant income is on track, with remaining balance compri sing final FAA instalment and Mosquito control grant monies to be received in 4th qtr .
Operating expenses Employee costs are trending slightly below target at 69%, which is a combination of vacancies and timing of employee entitlements, this is partially offset by increases in temporary labour services (categorised in Materials & Services). Mate rials & Services are also below expectation at 70%, relating to Parks & Reserves, road maintenance ( incorporating expected savings in budgeted street lighting which will be a 3rd qtr variation), in addition to Libraries reference materials and IT Business Continuity Plan.
Capital income Developer contributions have exceeded budgets and will be addressed in 3rd qtr review. Contributions comprise non cash road and infrastructure assets, receipt of development car parking shortfall contributions and Lee Point Rd contributions.
Manager Finance: there are no concerns in relation to the budgets. Cost for employees is at 69% budget plus material and services 70% wherea s 75% of year has elapsed. This is indicative of possible year end savings and carry forwards. Depreciation expense (non cash) will exceed budget, a separate report has been presented to the Risk Management Audit Committee, thence to Corporate & Economic Development.
J:\FINANCE\ACCOUNTING\Monthly Reports\Monthly Reports 14_15\9. March 2015\CONSO March Report2.xlsxREPORT w link to raw data
15/04/2015 3:45 PM
63
63
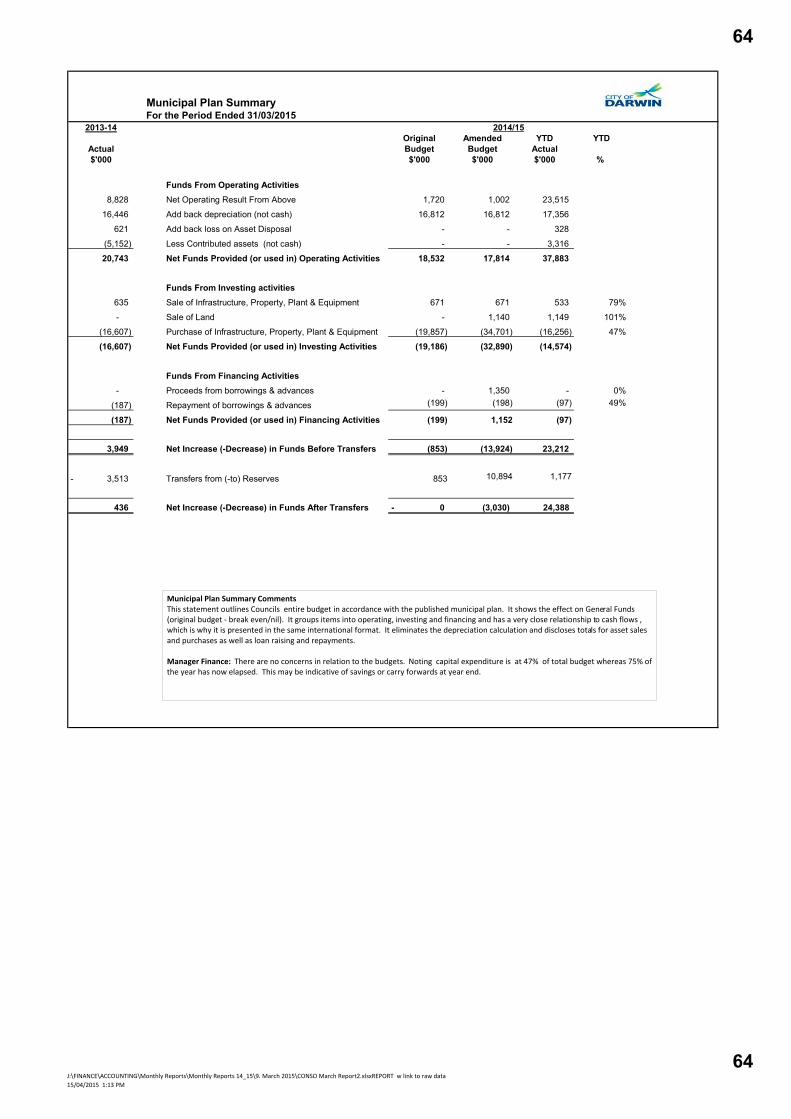
Municipal Plan SummaryFor the Period Ended 31/03/2015
2013-14Original Amended YTD YTD
Actual Budget Budget Actual$'000 $'000 $'000 $'000 %
Funds From Operating Activities8,828 Net Operating Result From Above 1,720 1,002 23,515
16,446 Add back depreciation (not cash) 16,812 16,812 17,356
621 Add back loss on Asset Disposal - - 328
(5,152) Less Contributed assets (not cash) - - 3,316
20,743 Net Funds Provided (or used in) Operating Activities 18,532 17,814 37,883
Funds From Investing activities635 Sale of Infrastructure, Property, Plant & Equipment 671 671 533 79%
- Sale of Land - 1,140 1,149 101%
(16,607) Purchase of Infrastructure, Property, Plant & Equipment (19,857) (34,701) (16,256) 47%
(16,607) Net Funds Provided (or used in) Investing Activities (19,186) (32,890) (14,574)
Funds From Financing Activities- Proceeds from borrowings & advances - 1,350 - 0%
(187) Repayment of borrowings & advances (199) (198) (97) 49%
(187) Net Funds Provided (or used in) Financing Activities (199) 1,152 (97)
3,949 Net Increase (-Decrease) in Funds Before Transfers (853) (13,924) 23,212
3,513- Transfers from (-to) Reserves 853 10,894 1,177
436 Net Increase (-Decrease) in Funds After Transfers 0- (3,030) 24,388
2014/15
Municipal Plan Summary Comments This statement outlines Councils entire budget in accordance with the published municipal plan. It shows the effect on General Funds (original budget - break even/nil). It groups items into operating, investing and financing and has a very close relationship to cash flows , which is why it is presented in the same international format. It eliminates the depreciation calculation and discloses totals for asset sales and purchases as well as loan raising and repayments. Manager Finance: There are no concerns in relation to the budgets. Noting capital expenditure is at 47% of total budget whereas 75% of the year has now elapsed. This may be indicative of savings or carry forwards at year end.
J:\FINANCE\ACCOUNTING\Monthly Reports\Monthly Reports 14_15\9. March 2015\CONSO March Report2.xlsxREPORT w link to raw data
15/04/2015 1:13 PM
64
64
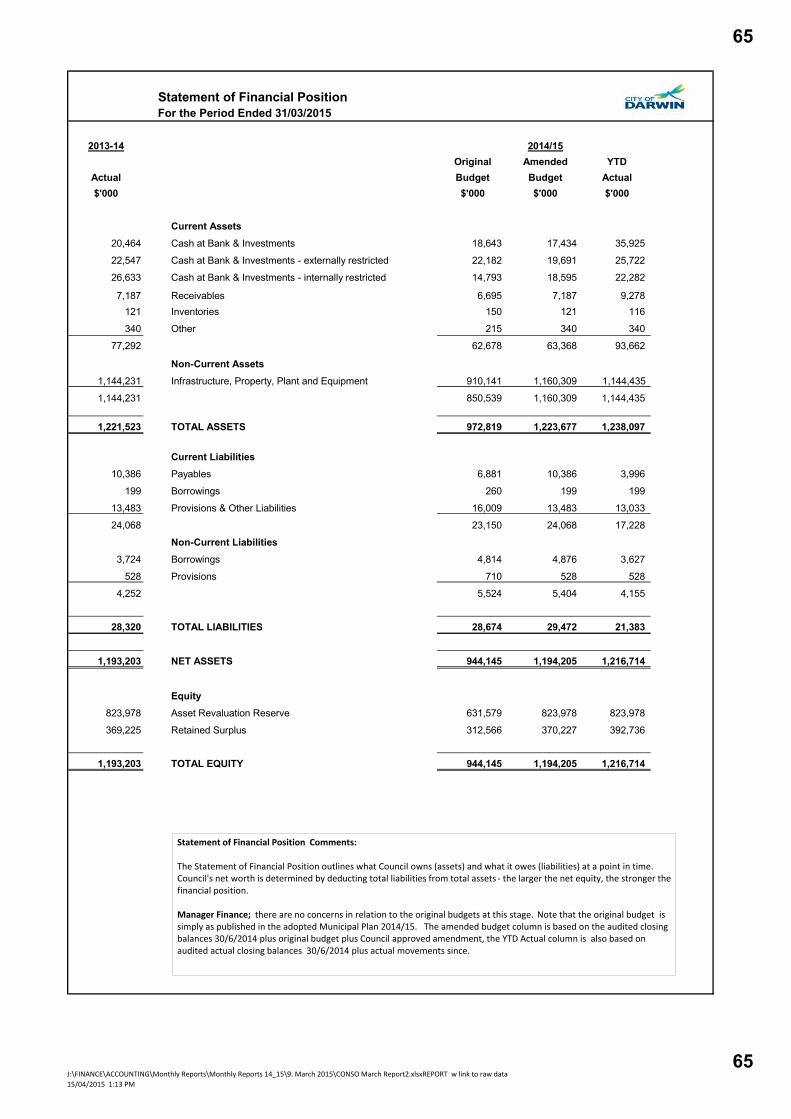
Statement of Financial PositionFor the Period Ended 31/03/2015
2013-14 2014/15Original Amended YTD
Actual Budget Budget Actual$'000 $'000 $'000 $'000
Current Assets20,464 Cash at Bank & Investments 18,643 17,434 35,925
22,547 Cash at Bank & Investments - externally restricted 22,182 19,691 25,722
26,633 Cash at Bank & Investments - internally restricted 14,793 18,595 22,282
7,187 Receivables 6,695 7,187 9,278 121 Inventories 150 121 116
340 Other 215 340 340
77,292 62,678 63,368 93,662
Non-Current Assets1,144,231 Infrastructure, Property, Plant and Equipment 910,141 1,160,309 1,144,435
1,144,231 850,539 1,160,309 1,144,435
1,221,523 TOTAL ASSETS 972,819 1,223,677 1,238,097
Current Liabilities10,386 Payables 6,881 10,386 3,996
199 Borrowings 260 199 199
13,483 Provisions & Other Liabilities 16,009 13,483 13,033
24,068 23,150 24,068 17,228
Non-Current Liabilities3,724 Borrowings 4,814 4,876 3,627
528 Provisions 710 528 528
4,252 5,524 5,404 4,155
28,320 TOTAL LIABILITIES 28,674 29,472 21,383
1,193,203 NET ASSETS 944,145 1,194,205 1,216,714
Equity823,978 Asset Revaluation Reserve 631,579 823,978 823,978
369,225 Retained Surplus 312,566 370,227 392,736
1,193,203 TOTAL EQUITY 944,145 1,194,205 1,216,714
Statement of Financial Position Comments: The Statement of Financial Position outlines what Council owns (assets) and what it owes (liabilities) at a point in time. Council's net worth is determined by deducting total liabilities from total assets - the larger the net equity, the stronger the financial position. Manager Finance; there are no concerns in relation to the original budgets at this stage. Note that the original budget is simply as published in the adopted Municipal Plan 2014/15. The amended budget column is based on the audited closing balances 30/6/2014 plus original budget plus Council approved amendment, the YTD Actual column is also based on audited actual closing balances 30/6/2014 plus actual movements since.
J:\FINANCE\ACCOUNTING\Monthly Reports\Monthly Reports 14_15\9. March 2015\CONSO March Report2.xlsxREPORT w link to raw data
15/04/2015 1:13 PM
65
65

Report on Capital Expenditure/Income for the period ended 31/03/2015 (Dr+ Cr -) $000's $000's $000's $000's $000's
Master Description
Original Budget 2014/15
Amended Budget 2014/15
YTD Actuals 31/03/2015
Budget Remaining 31/03/2015
% Spent YTD Committed Status Comment
Capital Expenditure
05/110060 Chief Executive Office Capital Projects 0 30 25 5 83% 0 No issues
Chief Executive Department Total 0 30 25 5 83% 0
05/221060 Swimming Pools Capital Projects Expenditure 40 712 799 -87 112% 17 Poss extra costs 3rd quarter variation submitted
05/221061 Community Projects Capital Expenditure 104 190 102 89 53% 8 No issues 3rd quarter variation submitted
05/223060 Recreation Capital Projects 135 1,336 721 615 54% 422 No issues Quotes being assessed
05/235060 Libraries Capital Expenditure 0 108 48 60 44% 29 No issues RFID Casuarina Library - to be completed May
Community & Cultural Services Department Total 279 2,347 1,669 677 71% 476
05/242060 Regulatory Services Capital Projects 20 20 0 20 0% 0 Delays
Budget is for Licence E Plate technology; currently exploring new technologies prior to trialling a system
05/332089 Darwin Entertainment Centre Capital Projects 276 402 37 365 9% 0 No issues
05/335060 Fleet Management Capital Projects 2,370 2,463 1,034 1,429 42% 734 No issues Waiting on vehicles to be supplied and received
05/431060 IT Capital Projects 286 483 32 451 7% 5 No issues A possible 3rd quarter budget variation.
05/431061 IT NBN Local Gov't Pgm Capital Projects 0 50 0 50 0% 0 No issues A possible 3rd quarter budget variation.
05/453065 Off Street Parking Capital Projects 360 474 479 -5 101% 44 Poss extra costs
05/455060 Property Capital Projects 0 0 -17 17 1000% 0 No issues 3rd quarter variation submitted
05/432060 Records Capital Expenditure 75 75 0 75 0% 0 No issuesInitial project management and software implementation costs could be as high as 50%
Corporate Services Department Total 3,387 3,967 1,566 2,401 39% 784
05/322060 Design Capital Projects 85 25 0 25 0% 0 No issues Design underway
05/322062 Minor Capital Works Program 136 132 97 35 73% 6 No issues
05/322063 Streetscape Development & Upgrade 522 890 99 791 11% 185 DelaysMajority of funding linked Esplanade resurfacing possible carryforward required
05/322064 Road Works Capital Projects Expenditure 0 40 0 40 0% 0 No issues
05/322067 LATM Capital Projects Expenditure 352 528 11 517 2% 13 Poss less revenue
3rd quarter variation submitted. Black Spot and LATM funding from NTG not received. Budget to be reduced by $176k
05/322068 Cyclepath Capital Projects 543 739 251 488 34% 0 Delays Awaiting adoption of Bike Plan
05/322069 Black Spot Program 0 12 0 12 0% 0 No issues
05/322070 Lee Point Road Upgrade 0 2,054 2,745 -692 134% 18 Poss extra costs
Lee Point Rd project completed, 3rd Qtr variation utilising Lee Point Rd Developer Contributions
05/331061 Footpaths Capital Projects 1,000 1,059 187 872 18% 137 No issues Program underway
05/331062 Disability Access Capital Projects (W/O ONLY) 52 91 40 50 44% 0 Poss savings
05/331064 Driveway Capital Projects 225 225 191 34 85% 22 No issues
05/331065 Road Reseal & Rehabilitation Capital Projects 3,524 2,489 673 1,816 27% 1,487 No issues Program underway will be delivered by June 30
66
66

Report on Capital Expenditure/Income for the period ended 31/03/2015 (Dr+ Cr -) $000's $000's $000's $000's $000's
Master Description
Original Budget 2014/15
Amended Budget 2014/15
YTD Actuals 31/03/2015
Budget Remaining 31/03/2015
% Spent YTD Committed Status Comment
05/331066 Streetlighting Capital Projects 110 123 10 113 8% 0 DelaysMajority of funding linked esplanade resurfacing possible carryforward required
05/331067 Parks Lighting Capital Projects 104 104 15 89 14% 9 No issues
05/331068 Kerbing Capital Projects 28 28 10 18 36% 0 No issues
05/331069 Traffic Signals Capital Projects 103 187 56 131 30% 0 No issues
05/332060 Building Maintenance Capital Projects 1,444 1,694 559 1,135 33% 304 No issues
Major works underway - Westlane Carpark fire service upgrade, back up power generators, solar power project and Nightcliff Community Hall aircon.
05/332063 Signage & Memorial Capital Projects 50 50 27 23 55% 12 No issues Project underway
05/332083 Toilet Block Capital Projects 454 552 33 519 6% 99 No issues Tender under assessment for CBD toilet
05/333060 Waste Management Capital Projects 625 6 6 0 100% 0 No issues
05/334060 Stormwater Drainage Capital Projects 611 1,470 603 867 41% 523 No issues
05/334065 Walkway Capital Projects 155 155 0 155 0% 0 No issues
Construction program is about to commence have been awaiting consultation process in accordance with policy
05/334068 Mosquito Control Capital Projects 121 150 63 87 42% 11 No issuesWaiting for areas to dry out before undertaking works
05/341061 Fencing Capital Projects 142 142 28 114 20% 79 No issues Works programmed
05/341062 Parks & Reserves Revitalisation Capital Projects 241 370 132 239 36% 0 No issues Quotes under assessment
05/341063 Parks Infrastructure Capital Projects 132 132 38 94 29% 72 No issues Majority of works to occur end of year
05/341064 Parks & Reserves General Capital Projects 10 67 4 63 6% 4 DelaysWorks programmed for August 2015 as negotiated with lease holder
05/341065 Parks Landscaping & Irrigation Capital Projects 398 398 220 179 55% 133 No issues
Slight delays to date scoping and documenting requirements for projects however progress will be swift within next quarter
05/322066 Roads to Recovery Capital Projects Expenditure 0 1,670 2 1,669 0% 21 No issues
Project staged across two financial years and expected to meet that. Detailed design underway. Project going to tender on 23 April 2015 and works commence May. 3rd Qtr Budget Variation submitted
05/332086 Open Spaces Capital Refurbishment Costs (W/O ONLY) 1,799 903 142 761 16% 41 No issuesDesign received tender documents being prepared
05/341060 Parks Masterplan Capital Projects 0 160 19 141 12% 32 No issues
05/311060 Infrastructure Capital Projects 3,000 3,042 90 2,952 3% 116 No issues Designs finalised tenders prepared
05/322061 Planning & Design Urban Enhancement Capital Exp 92 92 0 92 0% 0 No issues
05/332082 Investment Properties Capital Refurbish (W/O ONLY) 130 130 0 130 0% 0 No issuesQuotes obtained, project scheduled for finalisation April/May
05/333062 Shoal Bay Upgrade Works 0 7,000 6,646 354 95% 168 No issues
05/332065 Nightcliff Foreshore Cafe Capital Expense 0 1,450 0 1,450 0% 0 Delays3rd Qtr budget variation submitted. split over 2
years.
Infrastructure Total 16,190 28,358 12,995 15,362 46% 3,491
Grand Total 19,857 34,701 16,256 18,445 47% 4,751
67
67

Report on Capital Expenditure/Income for the period ended 31/03/2015 (Dr+ Cr -) $000's $000's $000's $000's $000's
Master Description
Original Budget 2014/15
Amended Budget 2014/15
YTD Actuals 31/03/2015
Budget Remaining 31/03/2015
% Spent YTD Committed Status Comment
% Achieved including Commitments 21,007 61%
Capital Income
05/321038 Developer Contributions - Car Parking Shortfall 0 0 -2,756 2,706 1000% 0 Add Revenue
05/322031 Road Works Capital Projects Income -183 -183 0 -183 0% 0 Poss less revenue
3rd quarter variation submitted preceived from the Northern Territory Government (NTG) for the 2014/2015 LATM Program however this funding was not forthcoming. 3rd quarter budget variation submitted.
05/322035 Developer Contribution Income 0 -643 -4,408 3,765 685% 0 Add Revenue 3rd quarter variation submitted
05/334038 Mosquito Control Capital Income -81 -81 0 -81 0% 0 No issues Funding to be received in 4th quarter
05/341033 Parks & Reserves Capital Income -10 -20 -20 0 100% 0 No issues
05/322032 Urban Enhancement Capital Income -1,670 -1,670 0 -1,670 0% 0 No issuesProject staged across two financial years and expected to meet that.
-1,944 -2,598 -7,184 4,537 277% 0
68
68
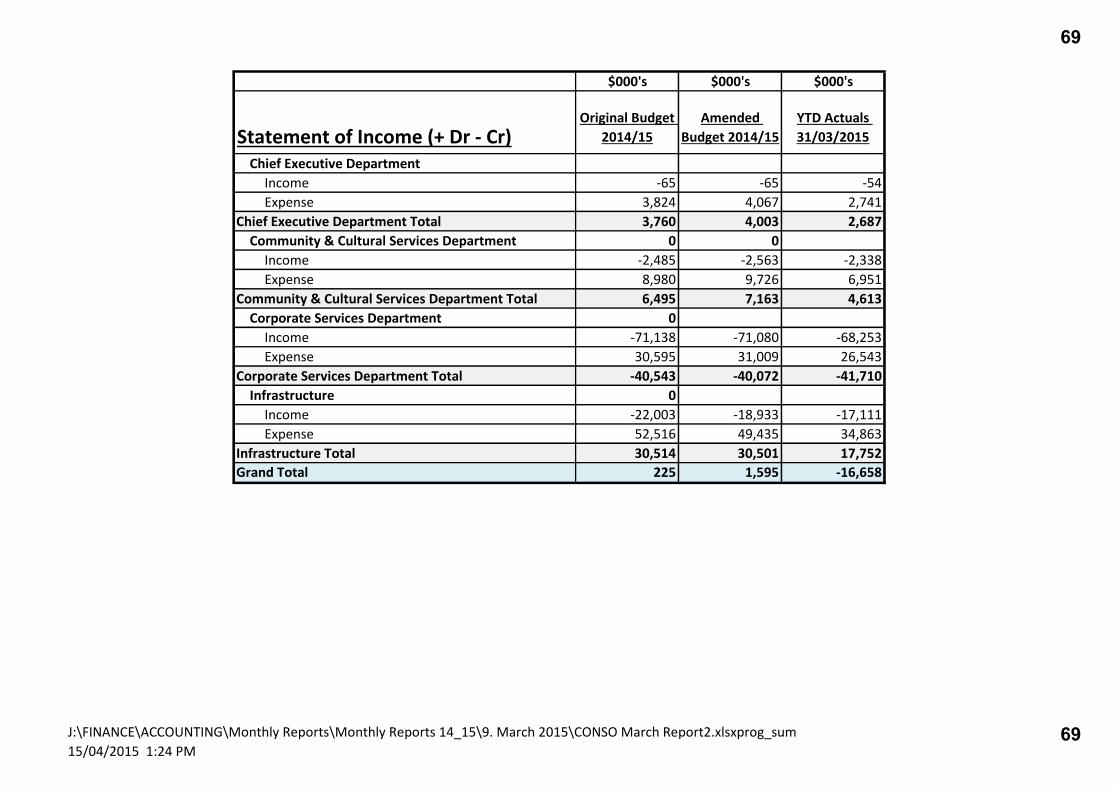
$000's $000's $000's
Statement of Income (+ Dr - Cr)Original Budget
2014/15
Amended
Budget 2014/15
YTD Actuals
31/03/2015
Chief Executive Department
Income -65 -65 -54
Expense 3,824 4,067 2,741
Chief Executive Department Total 3,760 4,003 2,687
Community & Cultural Services Department 0 0
Income -2,485 -2,563 -2,338
Expense 8,980 9,726 6,951
Community & Cultural Services Department Total 6,495 7,163 4,613
Corporate Services Department 0
Income -71,138 -71,080 -68,253
Expense 30,595 31,009 26,543
Corporate Services Department Total -40,543 -40,072 -41,710
Infrastructure 0
Income -22,003 -18,933 -17,111
Expense 52,516 49,435 34,863
Infrastructure Total 30,514 30,501 17,752
Grand Total 225 1,595 -16,658
J:\FINANCE\ACCOUNTING\Monthly Reports\Monthly Reports 14_15\9. March 2015\CONSO March Report2.xlsxprog_sum
15/04/2015 1:24 PM
69
69

$000's $000's $000's $000's $000's
Statement of Income (+ Dr - Cr) Original Budget
2014/15
Amended Budget 2014/15
YTD Actuals
31/03/2015
Budget Remaining 31/03/2015
% Spent YTD Committed Status Comment
Chief Executive OfficeIncome
Climate Change & Environment -50 -50 -41 -9 81% 0 Add Revenue
Competitive Grants receive from Dept of Environment and Science week East Point Signs. 3rd quarter variation submitted
Strategy & Outcomes -15 -15 -14 -1 94% 0 No issuesIncome Total -65 -65 -54 1 84% 0
Expense Chief Executive Officer Section 733 733 534 199 73% 1 No issues
Climate Change & Environment 546 595 393 202 66% 14 Poss extra costs
3rd quarter variation submitted (Increase in Revenue offset by program expenditure)
Communications & Marketing 731 850 482 369 57% 38 No issues Governance Section 1,463 1,513 1,041 472 69% 22 No issues Strategy & Outcomes 351 376 291 85 77% 1 No issues On track
Expense Total 3,824 4,067 2,741 1,326 67% 76Chief Executive Office Net Cost (-Surplus) 3,760 4,003 2,687 1,327 76
J:\FINANCE\ACCOUNTING\Monthly Reports\Monthly Reports 14_15\9. March 2015\CONSO March Report2.xlsxprog_CEO15/04/2015 3:16 PM
70
70

$000's $000's $000's $000's $000's
Statement of Income (+ Dr ‐ Cr)
Original Budget 2014/15
Amended Budget 2014/15
YTD Actuals
31/03/2015
Budget Remaining 31/03/2015
% Spent YTD Committed Status Comment
Community & Cultural ServicesIncome
Community & Cultural Services GM Section -35 -40 -42 2 105% 0 No issues
Community Development Section 0 -2 -5 4 351% 0 Add RevenueIncome contribution for International Women's Day 2015. 3rd quarter variation submitted
Customer Services -57 -57 -38 -19 66% 0 Poss less revenue Will monitor over coming month
Family & Children -152 -152 -136 -16 89% 0 Poss extra revenue Malak Community Centre projected income better than forecasted
Libraries -1559 -1605 -1596 -9 99% 0 No issuesAll on track
Recreation & Leisure -682 -682 -493 -189 72% 0 Poss less revenue 3rd quarter variation submitted - less revenue due to closure of Nightcliff Pool
Sister Cities 0 -15 -18 3 121% 0 No issues3rd quarter variation to be submitted for Halloween event fundraising
Youth Projects 0 -11 -9 -2 84% 0 No issuesIncome Total -2,485 -2,563 -2,338 -225 91% 0
Expense Community & Cultural Services GM Section 1094 1265 792 473 63% 17 No issues
Community Development Section 955 1378 1055 323 77% 15 Poss extra costs
Offsetting expenditure for contribution to International Women's Day 2015, 3rd quarter budget variation submitted
Customer Services 560 579 448 131 77% 15 No issues Family & Children 366 366 276 90 75% 15 No issues
Libraries 3460 3491 2618 873 75% 71 No issuesAll on track
Recreation & Leisure 1854 1898 1324 574 70% 445 No issues Sister Cities 175 222 129 93 58% 5 Poss savings Program currently under review Youth Projects 516 528 309 219 59% 28 No issues LAUNCH Youth Festival planned in AprilExpense Total 8,980 9,726 6,951 2,775 71% 612
Community & Cultural Services Net Cost (-Surplus) 6,495 7,163 4,613 2,550 612
J:\FINANCE\ACCOUNTING\Monthly Reports\Monthly Reports 14_15\9. March 2015\CONSO March Report2.xlsxprog_com15/04/2015 3:20 PM
71
71
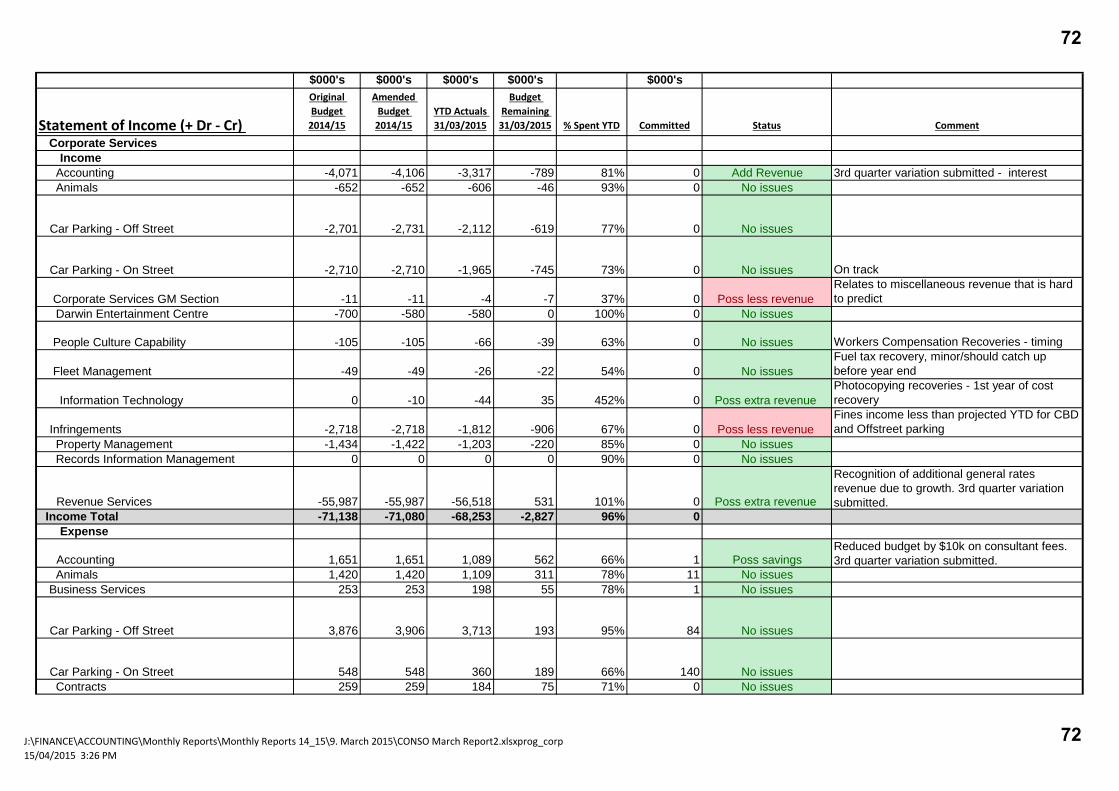
$000's $000's $000's $000's $000's
Statement of Income (+ Dr ‐ Cr)
Original Budget 2014/15
Amended Budget 2014/15
YTD Actuals 31/03/2015
Budget Remaining 31/03/2015 % Spent YTD Committed Status Comment
Corporate ServicesIncome
Accounting -4,071 -4,106 -3,317 -789 81% 0 Add Revenue 3rd quarter variation submitted - interest Animals -652 -652 -606 -46 93% 0 No issues
Car Parking - Off Street -2,701 -2,731 -2,112 -619 77% 0 No issues
Car Parking - On Street -2,710 -2,710 -1,965 -745 73% 0 No issues On track
Corporate Services GM Section -11 -11 -4 -7 37% 0 Poss less revenue Relates to miscellaneous revenue that is hard to predict
Darwin Entertainment Centre -700 -580 -580 0 100% 0 No issues
People Culture Capability -105 -105 -66 -39 63% 0 No issues Workers Compensation Recoveries - timing
Fleet Management -49 -49 -26 -22 54% 0 No issuesFuel tax recovery, minor/should catch up before year end
Information Technology 0 -10 -44 35 452% 0 Poss extra revenue Photocopying recoveries - 1st year of cost recovery
Infringements -2,718 -2,718 -1,812 -906 67% 0 Poss less revenue Fines income less than projected YTD for CBD and Offstreet parking
Property Management -1,434 -1,422 -1,203 -220 85% 0 No issues Records Information Management 0 0 0 0 90% 0 No issues
Revenue Services -55,987 -55,987 -56,518 531 101% 0 Poss extra revenue
Recognition of additional general rates revenue due to growth. 3rd quarter variation submitted.
Income Total -71,138 -71,080 -68,253 -2,827 96% 0Expense
Accounting 1,651 1,651 1,089 562 66% 1 Poss savingsReduced budget by $10k on consultant fees. 3rd quarter variation submitted.
Animals 1,420 1,420 1,109 311 78% 11 No issuesBusiness Services 253 253 198 55 78% 1 No issues
Car Parking - Off Street 3,876 3,906 3,713 193 95% 84 No issues
Car Parking - On Street 548 548 360 189 66% 140 No issues Contracts 259 259 184 75 71% 0 No issues
J:\FINANCE\ACCOUNTING\Monthly Reports\Monthly Reports 14_15\9. March 2015\CONSO March Report2.xlsxprog_corp15/04/2015 3:26 PM
72
72

Statement of Income (+ Dr ‐ Cr)
Original Budget 2014/15
Amended Budget 2014/15
YTD Actuals 31/03/2015
Budget Remaining 31/03/2015 % Spent YTD Committed Status Comment
Corporate Services
Corporate Services GM Section 507 516 349 167 68% 3 No issuesTravel and conference expenditures to come out in the last two quarters
Darwin Entertainment Centre 1,576 1,456 1,418 38 97% 0 No issues 3rd quarter variation submitted
Depreciation Expense 16,812 16,812 17,356 -544 103% 0 Poss extra costs
3rd quarter variation submitted. Separate report to Risk Management Audit Committee
Employee Overheads 211 172 -246 418 -143% 0 No issues
People Culture Capability 1,602 1,774 993 780 56% 77 Poss savings
3rd quarter variation submitted -Employee Relations Operational Costs & Recruitment Operational Costs Poss Savings; Apprentices & Trainees-Poss Savings,
Fleet Management -1,785 -1,785 -1,374 -411 77% 58 No issues
Information Technology 2,818 3,106 1,961 1,145 63% 12 No issuesStill awaiting invoices for software and photocopying
Infringements 2,637 2,637 1,986 651 75% 19 No issues
Property Management 109 109 31 78 28% 1 Poss savingsVacant position, possible savings. 3rd quarter budget variation to be submitted.
Records Information Management 616 616 428 187 70% 26 No issues Revenue Services 1,159 1,159 845 314 73% 0 No issues
Risk Management Section 1,106 1,181 923 258 78% 15 No issues
Business Risk Management Operational Costs - additional audit costs are expected in May & June.
Costs Charged to Other Accounts -4,781 -4,781 -4,781 0 100% 0 No issuesExpense Total 30,595 31,009 26,543 4,466 86% 449
Corporate Services Net Cost (-Surplus) -40,543 -40,072 -41,711 1,639 449
J:\FINANCE\ACCOUNTING\Monthly Reports\Monthly Reports 14_15\9. March 2015\CONSO March Report2.xlsxprog_corp15/04/2015 3:26 PM
73
73

$000's $000's $000's $000's $000's
Statement of Income (+ Dr - Cr) Original Budget
2014/15
Amended Budget 2014/15
YTD Actuals 31/03/2015
Budget Remaining 31/03/2015 % Spent YTD Committed Status Comment
InfrastructureIncome
Building Services -9 -9 0 -9 1% 0 Poss less revenue
Cemeteries Section -59 -59 -32 -27 54% 0 Poss less revenue Revenue is dependant on fees charged for services which has been reduced over the year
Development -571 -842 -681 -110 81% 0 Add Revenue Taken up in the 3rd Qtr Budget variation
Mosquito Control -139 -139 0 -139 0% 0 Poss less revenue
Income is received to part pay for services requested by NTG. Less requests = less income but has no effect on budget as resources are only applied to requested work
Parks & reserves -151 -151 -144 -8 95% 0 No issuesPlanning 0 0 -17 17 1000% 0 Add Revenue 3rd quarter variation submittedRoads Maintenance -1,712 -1,847 -1,386 -461 75% 0 No issues
Waste Management -19,362 -15,887 -14,852 -1,035 93% 0 Poss extra revenue
To be adjusted in the 4th Budget Variation possible additional income in Weighbridge charges due to higher actual tonnage going to the Weighbridge
Income Total -22,003 -18,933 -17,111 -1,772 90%Expense
Infrastructure GM 554 554 398 155 72% 10 No issues
Asset Management Section 511 631 291 340 46% 134 No issuesPurchase order will soon to be raised for most of the remaining of the budget
Building Services 4,180 4,184 2,902 1,282 69% 337 Poss savings3rd quarter variation submitted
Cleaning Services 2,809 2,797 2,065 732 74% 414 Poss extra costs3rd quarter variation submitted
Design 592 592 499 94 84% 71 Poss extra costs 3rd quarter variation prepared
Development 369 382 269 113 71% 52 Poss savings3rd quarter variation reducing cost based on the reduction on projected Recoverable works
Infrastructure Projects 825 874 452 422 52% 128 Poss savings Staff vacancy within area
Mosquito Control 193 219 40 178 18% 6 No issuesWill be spent at the end of the financial year as most of the works occurs 4th qtr.
Operations Administration 837 837 645 192 77% 33 No issues
Parks & reserves 14,705 14,698 9,884 4,813 67% 697 Poss savings 3rd quarter variation preparedPathways 876 876 657 220 75% 16 No issues
Planning 399 409 332 77 81% 0 Poss savings 3rd quarter variation prepared
Roads Maintenance 8,003 8,137 4,366 3,771 54% 747 Poss savingsStreet lighting under expenditure is the reason for the majority of underspend 3rd qtr budget variation submitted.
Stormwater Drainage 611 611 478 132 78% 100 Poss extra costs 3rd quarter variation prepared
Waste Management 17,053 13,635 11,585 2,050 85% 3,484 Poss extra costsPossible extra cost partially offset by additional income in Weighbridge
Expense Total 52,516 49,435 34,863 14,572 71% 6,247Infrastructure Net Cost (-Surplus) 30,514 30,501 17,752 12,799 6,247
J:\FINANCE\ACCOUNTING\Monthly Reports\Monthly Reports 14_15\9. March 2015\CONSO March Report2.xlsxprog_infra15/04/2015 3:32 PM
74
74
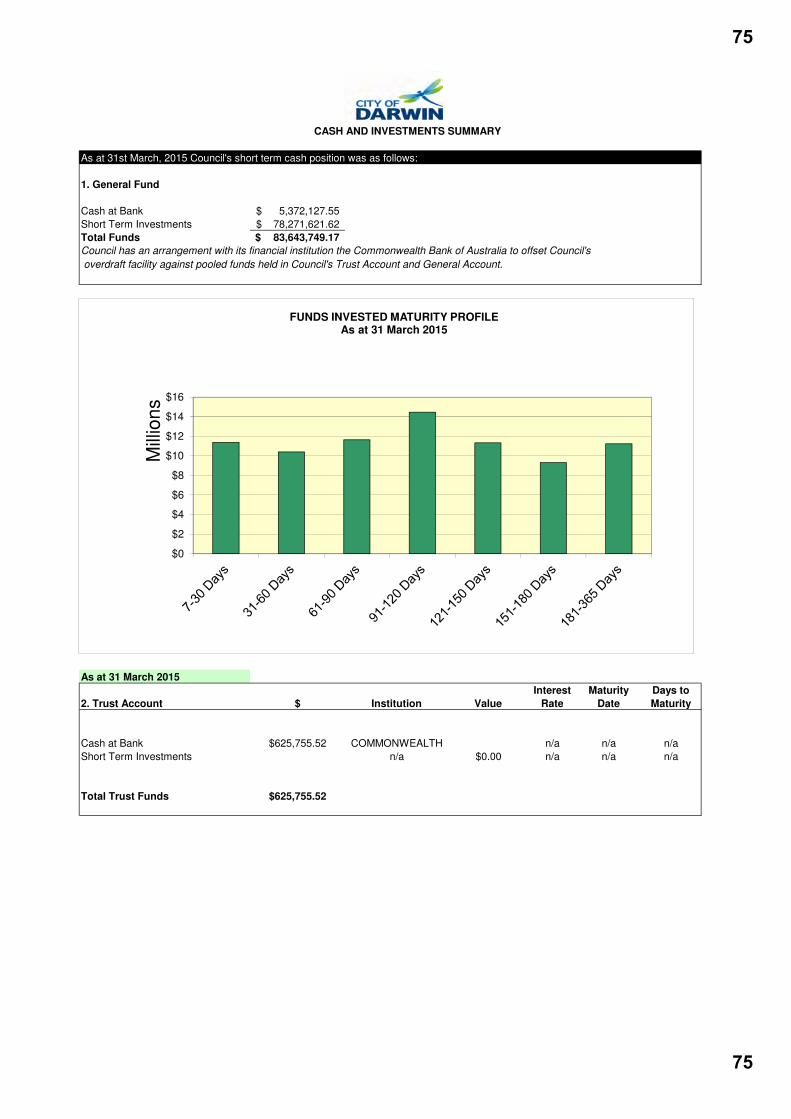
As at 31st March, 2015 Council's short term cash position was as follows:
1. General Fund
Cash at Bank 5,372,127.55$
Short Term Investments 78,271,621.62$
Total Funds 83,643,749.17$
Council has an arrangement with its financial institution the Commonwealth Bank of Australia to offset Council's
overdraft facility against pooled funds held in Council's Trust Account and General Account.
As at 31 March 2015
2. Trust Account $ Institution Value
Interest
Rate
Maturity
Date
Days to
Maturity
Cash at Bank $625,755.52 COMMONWEALTH n/a n/a n/a
Short Term Investments n/a $0.00 n/a n/a n/a
Total Trust Funds $625,755.52
CASH AND INVESTMENTS SUMMARY
$0
$2
$4
$6
$8
$10
$12
$14
$16
Mill
ion
s
FUNDS INVESTED MATURITY PROFILEAs at 31 March 2015
75
75

Short Term Policy Max. Actual Portfolio Counterparty Policy Min. Policy Max. Actual Portfolio
A1+ 100% 66% Major Banks 15% 100% 66%
A1 45% 12% Regional Banks 0% 45% 26%
A2 25% 23%
Unrated* 10% 0%
Note: City of Darwin's investment policy limit with any one bank cannot exceed 30% of the entire investment portfolio.
*unrated institutions must be an "ADI" with an asset base greater than $1B.
INVESTMENTS REPORT TO COUNCIL AS AT 31 March 2015
Investment Policy Limits
Credit Unions/Building Societies/ Other ADI's
0% 45% 8%
Bendigo & Adelaide Bank Ltd4%
Westpac16%
Commonwealth26%
NAB24%
People's Choice/Australian Central Credit Union
8%
Suncorp12%
ING Bank5%
ANZ0%
Bank of Queensland Limited5%
INVESTMENT FUNDS DISTRIBUTION PER INSTITUTION
76
76
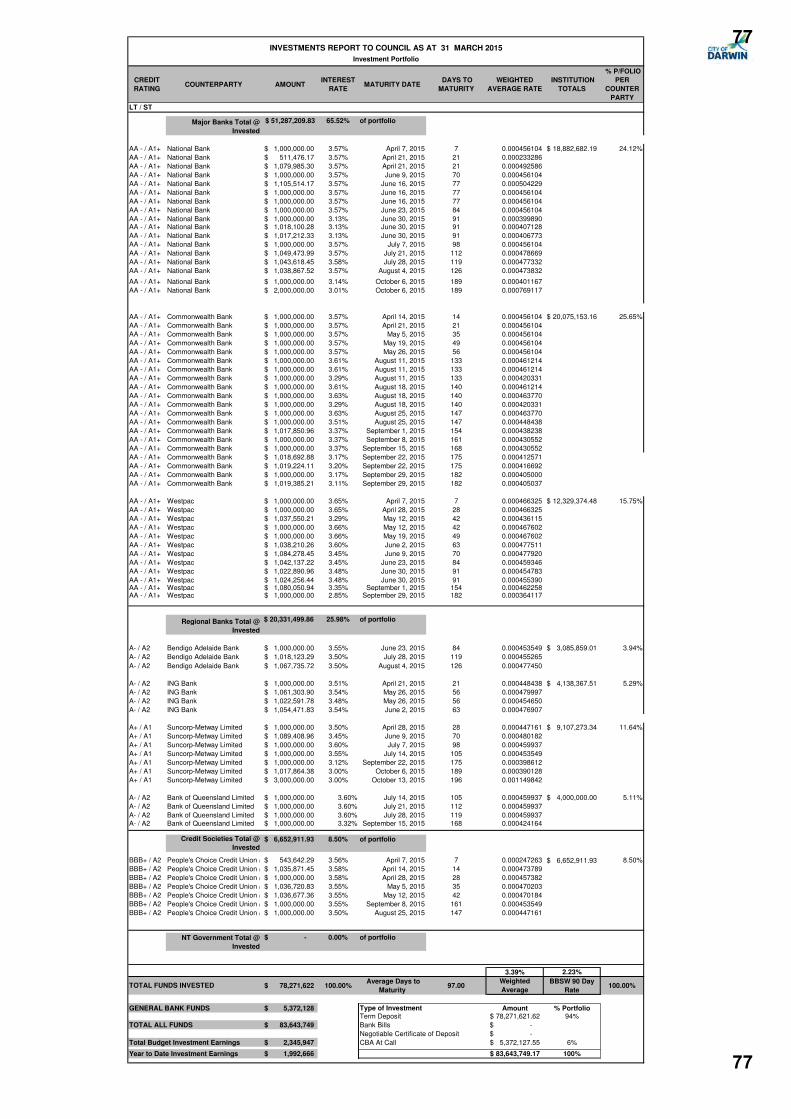
31/03/2015
CREDIT
RATINGCOUNTERPARTY AMOUNT
INTEREST
RATEMATURITY DATE
DAYS TO
MATURITY
WEIGHTED
AVERAGE RATE
INSTITUTION
TOTALS
% P/FOLIO
PER
COUNTER
PARTY
LT / ST
$ 51,287,209.83 65.52% of portfolio
AA - / A1+ National Bank 1,000,000.00$ 3.57% April 7, 2015 7 0.000456104 18,882,682.19$ 24.12%
AA - / A1+ National Bank 511,476.17$ 3.57% April 21, 2015 21 0.000233286
AA - / A1+ National Bank 1,079,985.30$ 3.57% April 21, 2015 21 0.000492586
AA - / A1+ National Bank 1,000,000.00$ 3.57% June 9, 2015 70 0.000456104
AA - / A1+ National Bank 1,105,514.17$ 3.57% June 16, 2015 77 0.000504229
AA - / A1+ National Bank 1,000,000.00$ 3.57% June 16, 2015 77 0.000456104
AA - / A1+ National Bank 1,000,000.00$ 3.57% June 16, 2015 77 0.000456104
AA - / A1+ National Bank 1,000,000.00$ 3.57% June 23, 2015 84 0.000456104
AA - / A1+ National Bank 1,000,000.00$ 3.13% June 30, 2015 91 0.000399890AA - / A1+ National Bank 1,018,100.28$ 3.13% June 30, 2015 91 0.000407128
AA - / A1+ National Bank 1,017,212.33$ 3.13% June 30, 2015 91 0.000406773
AA - / A1+ National Bank 1,000,000.00$ 3.57% July 7, 2015 98 0.000456104
AA - / A1+ National Bank 1,049,473.99$ 3.57% July 21, 2015 112 0.000478669
AA - / A1+ National Bank 1,043,618.45$ 3.58% July 28, 2015 119 0.000477332
AA - / A1+ National Bank 1,038,867.52$ 3.57% August 4, 2015 126 0.000473832
AA - / A1+ National Bank 1,000,000.00$ 3.14% October 6, 2015 189 0.000401167
AA - / A1+ National Bank 2,000,000.00$ 3.01% October 6, 2015 189 0.000769117
AA - / A1+ Commonwealth Bank 1,000,000.00$ 3.57% April 14, 2015 14 0.000456104 20,075,153.16$ 25.65%
AA - / A1+ Commonwealth Bank 1,000,000.00$ 3.57% April 21, 2015 21 0.000456104
AA - / A1+ Commonwealth Bank 1,000,000.00$ 3.57% May 5, 2015 35 0.000456104
AA - / A1+ Commonwealth Bank 1,000,000.00$ 3.57% May 19, 2015 49 0.000456104
AA - / A1+ Commonwealth Bank 1,000,000.00$ 3.57% May 26, 2015 56 0.000456104
AA - / A1+ Commonwealth Bank 1,000,000.00$ 3.61% August 11, 2015 133 0.000461214
AA - / A1+ Commonwealth Bank 1,000,000.00$ 3.61% August 11, 2015 133 0.000461214
AA - / A1+ Commonwealth Bank 1,000,000.00$ 3.29% August 11, 2015 133 0.000420331
AA - / A1+ Commonwealth Bank 1,000,000.00$ 3.61% August 18, 2015 140 0.000461214
AA - / A1+ Commonwealth Bank 1,000,000.00$ 3.63% August 18, 2015 140 0.000463770
AA - / A1+ Commonwealth Bank 1,000,000.00$ 3.29% August 18, 2015 140 0.000420331
AA - / A1+ Commonwealth Bank 1,000,000.00$ 3.63% August 25, 2015 147 0.000463770
AA - / A1+ Commonwealth Bank 1,000,000.00$ 3.51% August 25, 2015 147 0.000448438
AA - / A1+ Commonwealth Bank 1,017,850.96$ 3.37% September 1, 2015 154 0.000438238
AA - / A1+ Commonwealth Bank 1,000,000.00$ 3.37% September 8, 2015 161 0.000430552
AA - / A1+ Commonwealth Bank 1,000,000.00$ 3.37% September 15, 2015 168 0.000430552
AA - / A1+ Commonwealth Bank 1,018,692.88$ 3.17% September 22, 2015 175 0.000412571
AA - / A1+ Commonwealth Bank 1,019,224.11$ 3.20% September 22, 2015 175 0.000416692
AA - / A1+ Commonwealth Bank 1,000,000.00$ 3.17% September 29, 2015 182 0.000405000
AA - / A1+ Commonwealth Bank 1,019,385.21$ 3.11% September 29, 2015 182 0.000405037
AA - / A1+ Westpac 1,000,000.00$ 3.65% April 7, 2015 7 0.000466325 12,329,374.48$ 15.75%
AA - / A1+ Westpac 1,000,000.00$ 3.65% April 28, 2015 28 0.000466325
AA - / A1+ Westpac 1,037,550.21$ 3.29% May 12, 2015 42 0.000436115
AA - / A1+ Westpac 1,000,000.00$ 3.66% May 12, 2015 42 0.000467602
AA - / A1+ Westpac 1,000,000.00$ 3.66% May 19, 2015 49 0.000467602
AA - / A1+ Westpac 1,038,210.26$ 3.60% June 2, 2015 63 0.000477511
AA - / A1+ Westpac 1,084,278.45$ 3.45% June 9, 2015 70 0.000477920
AA - / A1+ Westpac 1,042,137.22$ 3.45% June 23, 2015 84 0.000459346
AA - / A1+ Westpac 1,022,890.96$ 3.48% June 30, 2015 91 0.000454783
AA - / A1+ Westpac 1,024,256.44$ 3.48% June 30, 2015 91 0.000455390AA - / A1+ Westpac 1,080,050.94$ 3.35% September 1, 2015 154 0.000462258AA - / A1+ Westpac 1,000,000.00$ 2.85% September 29, 2015 182 0.000364117
$ 20,331,499.86 25.98% of portfolio
A- / A2 Bendigo Adelaide Bank 1,000,000.00$ 3.55% June 23, 2015 84 0.000453549 3,085,859.01$ 3.94%
A- / A2 Bendigo Adelaide Bank 1,018,123.29$ 3.50% July 28, 2015 119 0.000455265
A- / A2 Bendigo Adelaide Bank 1,067,735.72$ 3.50% August 4, 2015 126 0.000477450
A- / A2 ING Bank 1,000,000.00$ 3.51% April 21, 2015 21 0.000448438 4,138,367.51$ 5.29%
A- / A2 ING Bank 1,061,303.90$ 3.54% May 26, 2015 56 0.000479997
A- / A2 ING Bank 1,022,591.78$ 3.48% May 26, 2015 56 0.000454650
A- / A2 ING Bank 1,054,471.83$ 3.54% June 2, 2015 63 0.000476907
A+ / A1 Suncorp-Metway Limited 1,000,000.00$ 3.50% April 28, 2015 28 0.000447161 9,107,273.34$ 11.64%
A+ / A1 Suncorp-Metway Limited 1,089,408.96$ 3.45% June 9, 2015 70 0.000480182
A+ / A1 Suncorp-Metway Limited 1,000,000.00$ 3.60% July 7, 2015 98 0.000459937
A+ / A1 Suncorp-Metway Limited 1,000,000.00$ 3.55% July 14, 2015 105 0.000453549
A+ / A1 Suncorp-Metway Limited 1,000,000.00$ 3.12% September 22, 2015 175 0.000398612
A+ / A1 Suncorp-Metway Limited 1,017,864.38$ 3.00% October 6, 2015 189 0.000390128
A+ / A1 Suncorp-Metway Limited 3,000,000.00$ 3.00% October 13, 2015 196 0.001149842
A- / A2 Bank of Queensland Limited 1,000,000.00$ 3.60% July 14, 2015 105 0.000459937 4,000,000.00$ 5.11%
A- / A2 Bank of Queensland Limited 1,000,000.00$ 3.60% July 21, 2015 112 0.000459937
A- / A2 Bank of Queensland Limited 1,000,000.00$ 3.60% July 28, 2015 119 0.000459937A- / A2 Bank of Queensland Limited 1,000,000.00$ 3.32% September 15, 2015 168 0.000424164
6,652,911.93$ 8.50% of portfolio
BBB+ / A2 People's Choice Credit Union / Australian Central Credit Union543,642.29$ 3.56% April 7, 2015 7 0.000247263 6,652,911.93$ 8.50%
BBB+ / A2 People's Choice Credit Union / Australian Central Credit Union1,035,871.45$ 3.58% April 14, 2015 14 0.000473789
BBB+ / A2 People's Choice Credit Union / Australian Central Credit Union1,000,000.00$ 3.58% April 28, 2015 28 0.000457382
BBB+ / A2 People's Choice Credit Union / Australian Central Credit Union1,036,720.83$ 3.55% May 5, 2015 35 0.000470203
BBB+ / A2 People's Choice Credit Union / Australian Central Credit Union1,036,677.36$ 3.55% May 12, 2015 42 0.000470184
BBB+ / A2 People's Choice Credit Union / Australian Central Credit Union1,000,000.00$ 3.55% September 8, 2015 161 0.000453549
BBB+ / A2 People's Choice Credit Union / Australian Central Credit Union1,000,000.00$ 3.50% August 25, 2015 147 0.000447161
-$ 0.00% of portfolio
3.39% 2.23%
78,271,622$ 100.00% Average Days to
Maturity 97.00
Weighted
Average
BBSW 90 Day
Rate100.00%
GENERAL BANK FUNDS 5,372,128$ Amount % PortfolioTerm Deposit 78,271,621.62$ 94%
TOTAL ALL FUNDS 83,643,749$ Bank Bills -$
Negotiable Certificate of Deposit -$
Total Budget Investment Earnings 2,345,947$ CBA At Call 5,372,127.55$ 6%
Year to Date Investment Earnings 1,992,666$ 83,643,749.17$ 100%
TOTAL FUNDS INVESTED
Type of Investment
NT Government Total @
Invested
INVESTMENTS REPORT TO COUNCIL AS AT 31 MARCH 2015
Regional Banks Total @
Invested
Credit Societies Total @
Invested
Major Banks Total @
Invested
Investment Portfolio
77
77
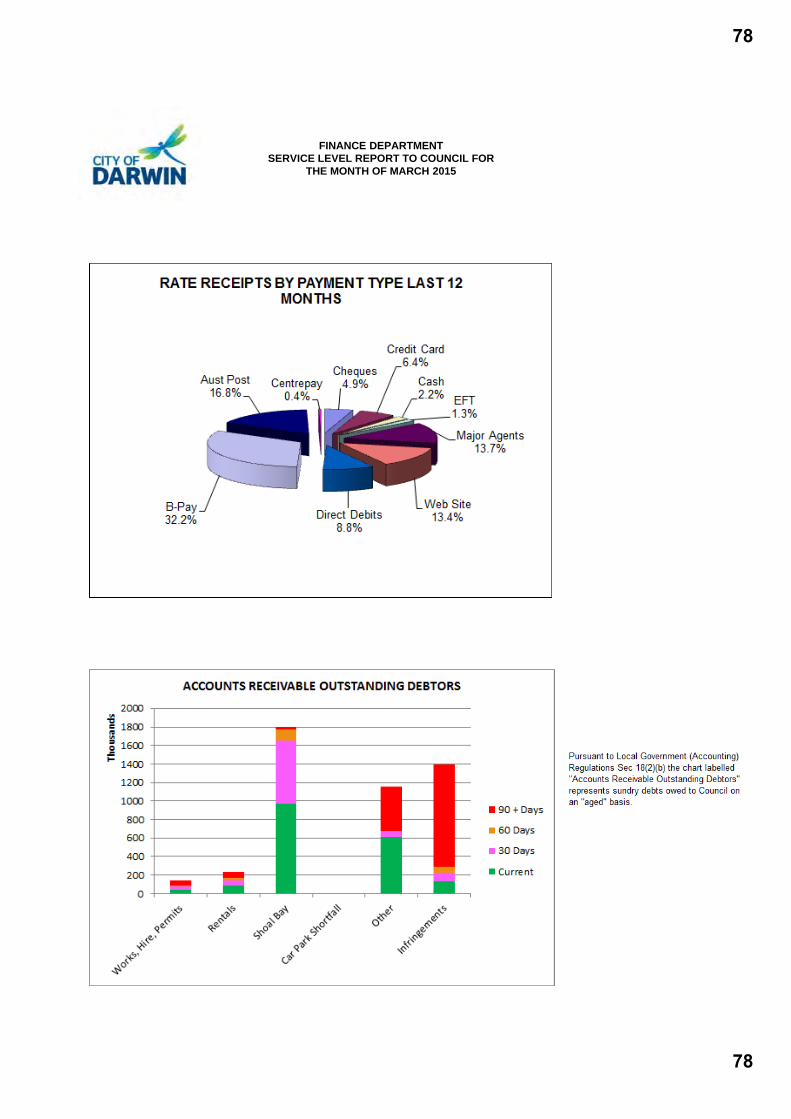
FINANCE DEPARTMENT SERVICE LEVEL REPORT TO COUNCIL FOR
THE MONTH OF MARCH 2015
78
78
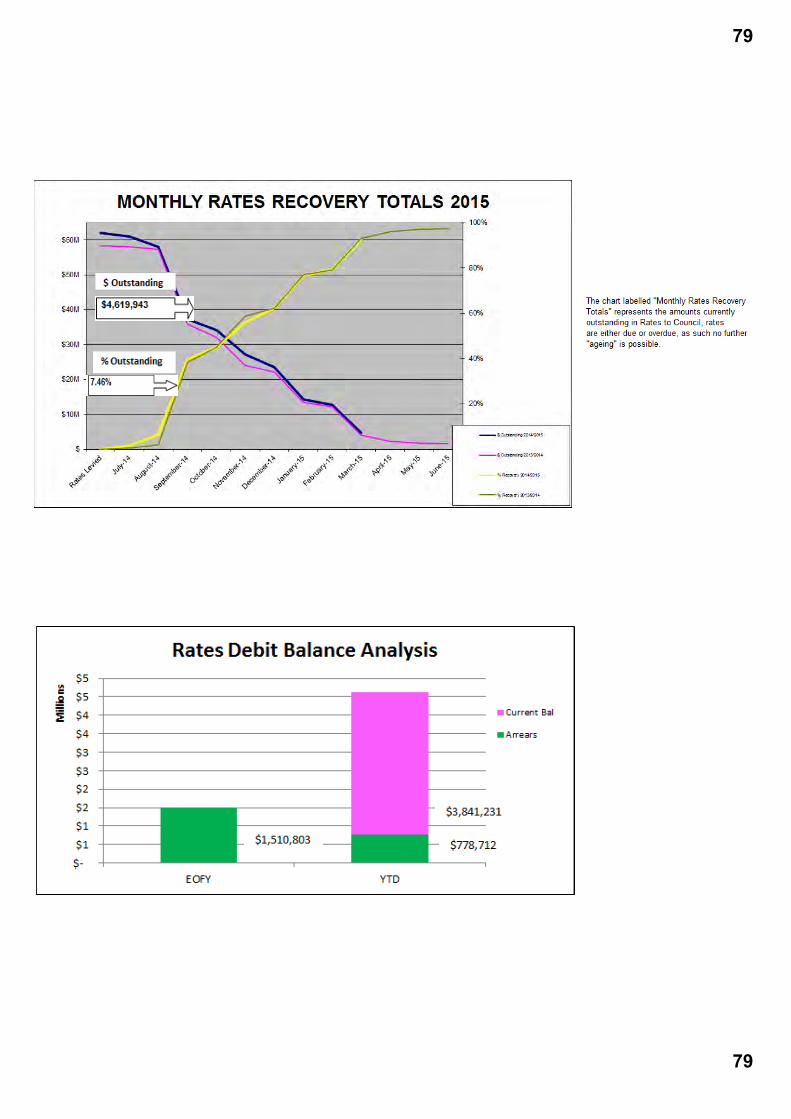
79
79

2014-15 Reserves SummaryFor the Year to Date 31 March 2015
Reserves - internally restricted Reserves - legally restricted Reserves - allTotal - internally restricted Budget Actual Total - legally restricted Budget Actual Total - all Budget ActualOpening Balance 26,632,302 26,632,302 Opening Balance 22,547,663 22,547,663 Opening Balance 49,179,965 49,179,965 Operating Transfers 2,855,326 1,244,225 Operating Transfers 3,562,639 7,556,902 Operating Transfers 6,417,965 8,801,128 Capital Transfers -10,892,343 -5,594,780 Capital Transfers -6,419,763 -4,383,052 Capital Transfers -17,312,106 -9,977,832 Net transfers -8,037,017 -4,350,555 Net transfers -2,857,124 3,173,850 Net transfers -10,894,141 -1,176,704 Closing Balance 18,595,285 22,281,747 Closing Balance 19,690,539 25,721,513 Closing Balance 38,285,824 48,003,261 Asset Replacement Budget Actual CBD Carparking - Cont. Budget ActualOpening Balance 5,197,436 5,197,436 Opening Balance 8,388,077 8,388,077 Operating Transfers -421,000 -137,941 Operating Transfers 405,354 3,154,178 Capital Transfers -1,607,165 1,487,327 Capital Transfers - - Closing Balance 3,169,271 6,546,823 Closing Balance 8,793,431 11,542,255 Carry Forward Cap Wks Budget Actual CBD Carparking - Rate Budget ActualOpening Balance 5,247,709 5,247,709 Opening Balance 7,754,293 7,754,293 Operating Transfers -1,479,148 -1,479,148 Operating Transfers 1,204,857 1,323,228 Capital Transfers -3,768,561 -3,768,561 Capital Transfers - - Closing Balance - - Closing Balance 8,959,150 9,077,521 Coastal Foreshore Mgt Budget Actual DEC Air-Conditioning Budget ActualOpening Balance 33,575 33,575 Opening Balance 324,000 324,000 Operating Transfers - - Operating Transfers 36,000 36,000 Capital Transfers -33,575 -33,575 Capital Transfers - - Closing Balance - - Closing Balance 360,000 360,000 Darwin Cemetery Budget Actual Developer Cont's Budget ActualOpening Balance 76,608 76,608 Opening Balance 2,065,051 2,065,051 Operating Transfers - - Operating Transfers 189,109 209,834 Capital Transfers -50,000 -27,330 Capital Transfers -1,910,320 -314,434 Closing Balance 26,608 49,278 Closing Balance 343,840 1,960,451 DEC Refurbishment Budget Actual Highway/Commercial Budget ActualOpening Balance 633,078 633,078 Opening Balance 63,286 63,286 Operating Transfers - - Operating Transfers 3,137 2,261 Capital Transfers - - Capital Transfers - - Closing Balance 633,078 633,078 Closing Balance 66,423 65,547 Disaster Contingency Budget Actual Market Development Budget ActualOpening Balance 2,518,680 2,518,680 Opening Balance 196,428 196,428 Operating Transfers - - Operating Transfers 47,572 41,304 Capital Transfers -1,500,000 -1,118,820 Capital Transfers -3,400 16,604 Closing Balance 1,018,680 1,399,860 Closing Balance 240,600 254,336 Election Expense Budget Actual Other Carparking Budget ActualOpening Balance 126,688 126,688 Opening Balance 386,809 386,809 Operating Transfers 17,012 20,773 Operating Transfers 14,570 13,822 Capital Transfers - - Capital Transfers -66,500 - Closing Balance 143,700 147,461 Closing Balance 334,879 400,631 Environmental Budget Actual Unspent Grants Budget ActualOpening Balance 107,130 107,130 Opening Balance 1,199,922 1,199,922 Operating Transfers -20,675 -17,605 Operating Transfers -142,691 -142,691 Capital Transfers - - Capital Transfers -497,658 -497,658 Closing Balance 86,455 89,525 Closing Balance 559,573 559,573 Nightcliff Hall Budget Actual Waste Management Budget ActualOpening Balance 60,494 60,494 Opening Balance 2,169,797 2,169,797 Operating Transfers 12,942 11,177 Operating Transfers 1,804,731 2,918,966 Capital Transfers -73,203 -7,484 Capital Transfers -3,941,885 -3,587,564 Closing Balance 233 64,188 Closing Balance 32,643 1,501,199 Off & On Street Parking Budget ActualOpening Balance 9,549,146 9,549,146 Operating Transfers 2,479,148 1,006,534 Capital Transfers -1,867,615 -1,584,155 Closing Balance 10,160,679 8,971,525 Plant Replacement Budget ActualOpening Balance 1,728,434 1,728,434 Operating Transfers 1,827,047 1,400,435 Capital Transfers -1,792,224 -501,922 Closing Balance 1,763,257 2,626,947 Public Art Budget ActualOpening Balance 380,970 380,970 Operating Transfers - - Capital Transfers - - Closing Balance 380,970 380,970 Purchase of Land Budget ActualOpening Balance 144,105 144,105 Operating Transfers - - Capital Transfers - - Closing Balance 144,105 144,105 Sale of Land Budget ActualOpening Balance 249,550 249,550 Operating Transfers 440,000 440,000 Capital Transfers - - Closing Balance 689,550 689,550 Watering Budget ActualOpening Balance 578,699 578,699 Operating Transfers - - Capital Transfers -200,000 -40,261 Closing Balance 378,699 538,438
80
80
ENCL: YES
CORPORATE & ECONOMIC DEVELOPMENT COMMITTEE/OPEN
AGENDA ITEM: 9.3
LISTING OF CHEQUES/EFT PAYMENTS - MARCH 2015
REPORT No.: 15A0056 MC:mp COMMON No.: 339125 DATE: 22/04/2015
Presenter: Manager Finance, Miles Craighead Approved: General Manager Corporate Services, Diana Leeder PURPOSE The purpose of this report is to provide Council with a listing of all payments made during March 2015. LINK TO STRATEGIC PLAN The issues addressed in this Report are in accordance with the following Goals/Strategies of the City of Darwin 2012 – 2016 as outlined in the ‘Evolving Darwin Towards 2020 Strategic Plan’:- Goal 5 Effective and Responsible Governance Outcome 5.5 Responsible financial and asset management Key Strategies 5.5.1 Manage Council’s business based on a sustainable financial and asset
management strategy KEY ISSUES The following amounts were paid during the month of March 2015: Payment Fund/Type Cheque/Batch Numbers $ General Fund From To Cheque Payments 916367 916399 18,142.91Account Payable EFT 90872 90900 15,750,423.51 Payroll MOA EFT PY01-18 PY01-19 912,825.50 Payroll MEA EFT PY02-18 PY02-19 400,838.37 Payroll MOA EFT Off Cycle Run
PY03-05 PY03-05 3,166.35
Cancelled Payments -1,109.90Total 17,084,286.74 Attachment A provides a detailed list of payees and amounts supporting the total for Cheques / EFT / Payroll payments.
81
81

PAGE: 2 REPORT NUMBER: 15A0056 MC:mp SUBJECT: LISTING OF CHEQUES/EFT PAYMENTS - MARCH 2015 RECOMMENDATION THAT the Committee resolve under delegated authority:- THAT Report Number 15A0056 MC:mp entitled Listing Of Cheques/EFT Payments - March 2015, be received and noted. BACKGROUND Nil DISCUSSION Nil CONSULTATION PROCESS Nil BUDGET AND RESOURCE IMPLICATIONS Nil RISK/LEGAL/LEGISLATIVE IMPLICATIONS Nil ENVIRONMENTAL IMPLICATIONS Nil COUNCIL OFFICER CONFLICT OF INTEREST DECLARATION We, the Author and Approving Officers, declare that we do not have a Conflict of Interest in relation to this matter. MILES CRAIGHEAD DIANA LEEDERMANAGER FINANCE GENERAL MANAGER
CORPORATE SERVICES For enquiries, please contact Miles Craighead on 8930 0523 or email: [email protected]. Attachments: Attachment A: Listing of Cheques/EFT Payments – March 2015
82
82

PAYMENTS SUMMARY REPORT FOR MONTH ENDING 31 MARCH 2015Item Payment
Reference or Cheque No.
Date Payee Warrant Description EFT/Cheque Value
Contract No.
General Cheques & EFT's Fund 5
Payments > $100,0001 90900/2013-01 31/03/2015 SUNCORP METWAY LIMITED INVESTMENT OF FUNDS $3,000,000.002 90900/916-01 31/03/2015 NATIONAL AUSTRALIA BANK INVESTMENT OF FUNDS $2,000,000.003 90872/916-01 03/03/2015 NATIONAL AUSTRALIA BANK INVESTMENT OF FUNDS $1,000,000.004 90879/2013-01 10/03/2015 SUNCORP METWAY LIMITED INVESTMENT OF FUNDS $1,000,000.005 90879/916-01 10/03/2015 NATIONAL AUSTRALIA BANK INVESTMENT OF FUNDS $1,000,000.006 90886/5940-01 17/03/2015 COMMONWEALTH BANK AUSTRALIA INVESTMENT OF FUNDS $1,000,000.007 90900/867-01 31/03/2015 WESTPAC BANKING CORPORATION INVESTMENT OF FUNDS $1,000,000.008 90885/5837-01 12/03/2015 TERRITORIA CIVIL CONSTRUCTION OF NORTH & SOUTH LEACHATE PONDS AND
ASSOCIATED INFRASTRUCTURE$776,355.92 2014/150
9 90898/5837-01 26/03/2015 TERRITORIA CIVIL OPERATION OF SHOAL BAY WASTE DISPOSAL SITE $495,379.19 2010/02710 PY01-18 11/03/2015 PAYROLL MOA EMPLOYEES PAYROLL $460,725.7511 PY01-19 25/03/2015 PAYROLL MOA EMPLOYEES PAYROLL $452,099.7512 90896/2528-01 26/03/2015 CLEANAWAY LIMITED COLLECTION OF DOMESTIC GARBAGE & RECYCLABLES $375,558.96 2007/06013 90890/6522-01 19/03/2015 GOLDER ASSOCIATES PTY LTD SHOAL BAY LEACHATE PROJECT TESTING, DISCUSSIONS,
ASSESSMENTS AND ADVICE$287,099.83
14 PY02-19 18/03/2015 PAYROLL MEA EMPLOYEES PAYROLL $200,977.4815 PY02-18 04/03/2015 PAYROLL MEA EMPLOYEES PAYROLL $199,860.8916 90895/906-01 26/03/2015 WOLPERS GRAHL PTY LTD STORMWATER DRAINAGE UPGRADE AND MAINTENANCE $173,651.08 2014/09717 90873/4-01 05/03/2015 AUSTRALIAN TAXATION OFFICE PAYROLL DEDUCTION $167,579.0018 90887/4-01 19/03/2015 AUSTRALIAN TAXATION OFFICE PAYROLL DEDUCTION $162,201.4519 90898/3664-01 26/03/2015 ASPHALT COMPANY AUSTRALIA PTY LTD ASPHALT OVERLAY AND REPLACEMENT PROGRAM $127,452.55 2013/07920 90898/5126-01 26/03/2015 PROGRAMMED PROPERTY SERVICES MUNICIPAL MOWING SERVICES $123,033.66 2011/06121 90898/4920-01 26/03/2015 DEMPSEY CONSOLIDATED PTY LTD SWIMMING POOLS MANAGEMENT $113,626.34 2011/04922 90898/6522-01 26/03/2015 GOLDER ASSOCIATES PTY LTD SHOAL BAY LEACHATE PROJECT TESTING, DISCUSSIONS,
ASSESSMENTS AND ADVICE$112,294.07
23 90877/5987-01 05/03/2015 CSG COMMUNICATIONS PTY LTD METER READINGS VARIOUS LOCATIONS $100,685.20
Payments $99,999 - $50,00024 90897/418-01 26/03/2015 POWER AND WATER CORPORATION PAWA SEWERAGE CHARGES MARCH 2015 $91,863.2525 90877/6522-01 05/03/2015 GOLDER ASSOCIATES PTY LTD SHOAL BAY LEACHATE PROJECT TESTING, DISCUSSIONS,
ASSESSMENTS AND ADVICE$95,279.25
26 90898/469-01 26/03/2015 GENERAL EXCAVATORS PTY LTD MINOR CIVIL WORKS $89,221.5627 90898/2464-01 26/03/2015 TERRITORY DEBT COLLECTORS PROVISION OF DEBT COLLECTION SERVICES $80,986.10 2014/02328 90898/7075-01 26/03/2015 RAY LAURENCE CONSTRUCTIONS PTY LTD STAGE 1 NIGHTCLIFF FORESHORE CAFÉ $75,625.00 2012/10129 90898/2562-01 26/03/2015 THINK WATER SUPPLY IRRIGATION PARTS AND MAINTENANCE $66,457.3130 90898/4285-01 26/03/2015 HAYS SPECIALIST RECRUITMENT PTY LTD PROVISION OF TEMPORARY LABOUR SERVICE $57,944.82 2013/018D31 90898/986-01 26/03/2015 MOUSELLIS & SONS PTY LTD PROVISION OF ROAD SHOULDER MAINTENANCE AND PLANT HIRE $45,406.90 2013/06532 90891/4-01 26/03/2015 AUSTRALIAN TAXATION OFFICE PAYROLL DEDUCTION $53,495.9533 90880/4-01 12/03/2015 AUSTRALIAN TAXATION OFFICE PAYROLL DEDUCTION $52,899.1534 90897/6694-01 26/03/2015 JACANA ENERGY ELECTRICITY CHARGES $50,874.38
Payments $49,999 - $10,00035 90898/6190-01 26/03/2015 SYNACO GLOBAL RECRUITMENT PTY LTD PROVISION OF TEMPORARY LABOUR SERVICE $46,742.96 2013/018B36 90898/2239-01 26/03/2015 G & T ELECTRICAL ENTERPRISES PTY LTD PROVISION OF ELECTRICAL SERVICES $46,220.83 2012/06437 90890/6561-01 19/03/2015 THE TRUSTEE FOR POULLAS BROTHERS FAMILY TRUST DRAINAGE WORKS VARIOUS LOCATIONS $45,620.00
38 90898/2320-01 26/03/2015 P & K PLUMBING PROVISION OF PLUMBING SERVICES $42,348.18 2014/052B39 90890/2316-01 19/03/2015 SCHNEIDER ELECTRIC BUILDINGS AUSTRALIA CoD BMS STRUXUREWARE UPGRADE $28,828.8040 90898/2316-01 26/03/2015 SCHNEIDER ELECTRIC BUILDINGS AUSTRALIA CCTV MAINTENANCE $40,852.9041 90898/4354-01 26/03/2015 RURAL RUBBISH REMOVAL SERVICE LITTER BINS DARWIN MUNICIPALITY $40,281.89 2013/55
83
83

42 90898/3916-01 26/03/2015 APARC PTY LTD PARKING MACHINE MAINTENANCE $38,233.05 2010/10143 90898/1465-01 26/03/2015 PARADISE LANDSCAPING GROUNDS MAINTENANCE LYONS ESTATE $35,481.80 2012/06344 90898/5289-01 26/03/2015 BMT WBM PTY LTD COASTAL REMEDIAL WORKS $34,650.0045 90898/377-01 26/03/2015 CLAYTON UTZ PROVISION OF LEGAL SERVICES $33,519.20 2012/00146 90898/1573-01 26/03/2015 MABINDI PTY LTD HIRE AND OPERATION OF ELEVATED WORK PLATFORM $30,973.48 2013/04547 90883/6675-01 12/03/2015 QENERGY LIMITED SUPPLY ELECTRICITY TO CIVIC CENTRE $30,301.86 2014/00248 90877/543-01 05/03/2015 KPMG INTERNAL AUDIT FEES $29,700.0049 90877/4341-01 05/03/2015 CHAINMESH SUPPLIES PTY LTD FENCING REPAIRS $29,610.5050 90898/5064-01 26/03/2015 ARAFURA TREE SERVICES AND CONSULTING PROVISION OF ABORICULTURAL SERVICES $26,310.50 2011/05451 90898/5082-01 26/03/2015 EZKO PROPERTY SERVICES PROVISION OF CLEANING SERVICE $24,158.48 2011/05752 90890/5197-01 19/03/2015 LOGICOIL SUPPLY BULK FUEL $23,974.9053 90896/403-01 26/03/2015 INDUSTRIAL POWER SWEEPING SERVICES PROVISION OF STREET SWEEPING SERVICE $22,971.73 2013/04754 90885/3441-01 12/03/2015 SMEC AUSTRALIA PTY LTD DESIGN & DOCUMENTATION SMITH STREET INTERSECTIONS $22,704.0055 90883/418-01 12/03/2015 POWER AND WATER CORPORATION WATER CHARGES 2 MARCH 2015 $21,638.4856 90883/3610-01 12/03/2015 OPTUS BILLING SERVICES PTY LTD MOBILE PHONE CHARGES $21,144.9757 90898/3664-01 26/03/2015 ASPHALT COMPANY AUSTRALIA PTY LTD SUPPLY HOTMIX ASPHALT $20,963.33 2014/04358 90885/1675-01 12/03/2015 CLOUSTON ASSOCIATES PROVISION OF DESIGN SERVICES $20,350.0059 90885/6604-01 12/03/2015 HUMAN SYNERGISTICS AUSTRALIA PTY LTD LEADERSHIP DEVELOPMENT PROGRAM $20,162.5060 90898/336-01 26/03/2015 WATERDYNAMICS SUPPLY IRRIGATION PARTS AND MAINTENANCE $19,876.8461 90896/4288-01 26/03/2015 SOUTHERN CROSS PROTECTION PTY LTD PROVISION OF SECURITY SERVICES $19,057.73 2012/04162 90877/4961-01 05/03/2015 REMOTE AREA TREE SERVICES PTY LTD PROVISION OF ARBORICULTURAL SERVICES $18,542.76 2014/05363 90896/2560-01 26/03/2015 AMCOM TELECOMMUNICATIONS COMMUNICATIONS CHARGES APRIL 2015 $17,681.3864 90877/5361-01 05/03/2015 PAUL MAHER SOLICITOR PROVISION OF LEGAL SERVICES $17,270.0065 90889/832-01 19/03/2015 STERLING NT PTY LTD LONG GRASS MOWING SERVICES $16,739.1466 90898/4961-01 26/03/2015 REMOTE AREA TREE SERVICES PTY LTD PROVISION OF ARBORICULTURAL SERVICES $16,014.78 2014/05367 90885/3426-01 12/03/2015 RENOFLO CCTV SURVEY INSPECTION STORMWATER PIPES $15,793.8068 90898/501-01 26/03/2015 H B CONCRETE SUPPLY AND DELIVERY OF READYMIX CONCRETE $15,592.03 2011/04269 90883/6694-01 12/03/2015 JACANA ENERGY ELECTRICITY CHARGES $15,076.3270 90898/5671-01 26/03/2015 MINTER ELLISON LAWYERS PROVISION OF LEGAL SERVICES $15,068.34 2012/00171 90898/4856-01 26/03/2015 NT RECYCLING SOLUTIONS RESOURCE RECOVERY OPERATIONS AND MANAGEMENT AT SHOAL BAY
WASTE DISPOSAL SITE$14,918.20 2010/026
72 90898/169-01 26/03/2015 AUSTRALIAN POSTAL CORPORATION BULK POSTAGE FEBRUARY 2015 $14,634.8973 90898/6287-01 26/03/2015 ACTIVE TREE SERVICES PROVISION OF ABORICULTURAL SERVICES $14,630.0074 90898/4569-01 26/03/2015 MIM INVESTMENTS (NT) PTY LTD BUILDING REPAIRS AND MAINTENANCE $14,629.00 2012/04475 90898/2935-01 26/03/2015 NATIONWIDE NEWS NT DIVISION ADVERTISING SERVICES $14,018.0876 90885/4476-01 12/03/2015 MR F TAM EXCAVATOR HIRE $13,760.0077 90890/2316-01 19/03/2015 SCHNEIDER ELECTRIC BUILDINGS AUSTRALIA CIVIC CENTRE FUNCTION ROOM BMS $13,083.4078 90898/507-01 26/03/2015 HASTINGS DEERING (AUST) LTD PLANT REPAIRS AND MAINTENANCE $12,938.5379 90898/4705-01 26/03/2015 GREENSPAN TECHNOLOGY PTY LTD SUPPLY IRRIGATION PARTS AND MAINTENANCE $12,855.1580 90877/5255-01 05/03/2015 BELLRIDGE PTY LIMITED IT SUBSCRIPTION MANAGE ENGINE SERVICE DESK $12,850.0081 90875/5354-01 05/03/2015 LORD MAYOR K FONG LIM LORD MAYOR ALLOWANCE FEBRUARY 2015 $12,743.6282 90884/832-01 12/03/2015 STERLING PROPERTY SERVICES PTY LTD LONG GRASS MOWING SERVICES $12,362.6383 90898/695-01 26/03/2015 PROTECTOR ALSAFE PTY LTD SAFETY WORKWEAR AND EQUIPMENT $12,334.3084 90898/6468-01 26/03/2015 AFL NORTHERN TERRITORY SPONSORSHIP OF NT THUNDER 2015 $12,000.0085 90877/3791-01 05/03/2015 LITCHFIELD GREEN WASTE RECYCLERS MULCH GREENWASTE AT EAST POINT $11,880.0086 90898/4733-01 26/03/2015 SOUTHERN STARR FIRE PROTECTION MONTHLY FIRE INSPECTIONS $11,778.4787 90890/7091-01 19/03/2015 MR J W ROPER PROFESSIONAL SERVICES SHOAL BAY LEACHATE BASINS $11,646.2588 90898/5824-01 26/03/2015 SERVER ROOM SPECIALISTS OPERATIONS CENTRE GENERATOR AND UPS WORKS $11,565.40 2012/08989 90898/5453-01 26/03/2015 MARINER TRAVEL PTY LTD PROVISION OF TRAVEL SERVICE $11,087.88 2012/02490 90885/5827-01 12/03/2015 LEISURE ENGINEERING PTY LTD NIGHTCLIFF POOL UPGRADE $11,000.0091 90898/2199-01 26/03/2015 VANDERFIELD MACHINERY PLANT PARTS AND REPAIRS $10,556.3192 90898/4895-01 26/03/2015 WILSON SECURITY PROVISION OF SECURITY SERVICE $10,328.77 2010/051
Payments < $10,00093 90885/802-01 12/03/2015 SHAMROCK CHEMICALS SUPPLY JANITORIAL PRODUCTS $9,839.7994 90885/4872-01 12/03/2015 CORE TRAFFIC CONTROL PTY LTD TRAFFIC MANAGEMENT VARIOUS LOCATIONS $9,790.2895 90898/4716-01 26/03/2015 BLIZZARD AIR & REFRIGERATION INSTALL AIR CONDITIONING UNITS HOLTZE ST $9,613.0196 90899/967-01 31/03/2015 CITY OF DARWIN CORPORATE CREDIT CARD WORKSHOP $9,332.9097 90890/4822-01 19/03/2015 TRAFFICWERX NT PTY LTD TRAFFIC MANAGEMENT VARIOUS LOCATIONS $9,223.5098 90898/986-01 26/03/2015 MOUSELLIS & SONS PTY LTD CCTV STORMWATER DRAIN MAINTENANCE $8,841.56
84
84

99 90898/713-01 26/03/2015 THE BIG MOWER PLANT PARTS AND REPAIRS $8,728.16100 90898/1333-01 26/03/2015 M & G PAINTERS AND PARTNERS PTY LTD PROVISION OF PAINTING SERVICES $8,690.00 2011/050101 90898/2233-01 26/03/2015 MOBILE ELECTRICS AIR CONDITIONING MAINTENANCE SERVICES $8,684.02102 90877/5819-01 05/03/2015 NEXTGEN NETWORKS PTY LTD INTERNET CORPORATE FEE $8,628.40103 90898/647-01 26/03/2015 NORSIGN PTY LTD SUPPLY OF ROAD SIGNS $8,325.49 2013/059104 90890/1606-01 19/03/2015 CULLEN BAY MARINA MANAGEMENT LANDSCAPING MAINTENANCE $8,312.56105 90877/4188-01 05/03/2015 AUSTRALIAN HOTELS ASSOCIATION NT BRANCH SECURE TAXI RANK CONTRIBUTION 1.3.15 - 31.5.15 $8,250.00106 90898/4952-01 26/03/2015 ENGSCRIBE PTY LTD NIGHTCLIFF COMMUNITY CENTRE AIR CONDITIONING $8,231.85107 90898/2352-01 26/03/2015 PROGRAMMED INTEGRATED WORK FORCE PROVISION OF TEMPORARY EMPLOYMENT SERVICES $8,078.64 2013/18108 90890/5064-01 19/03/2015 ARAFURA TREE SERVICES AND CONSULTING PROVISION OF ARBORICULTURAL SERVICES $8,056.25109 90890/5190-01 19/03/2015 VEG NORTH WEED CONTROL AND MANAGEMENT $7,994.94110 90899/967-01 31/03/2015 CITY OF DARWIN CORPORATE CREDIT CARD INFORMATION TECHNOLOGY $7,973.42111 90898/3398-01 26/03/2015 TOX FREE AUSTRALIA PTY LTD BIN CLEARANCE WESTLANE CARPARK, OPERATIONS CENTRE, ANIMAL
POUND$7,642.04
112 90885/5777-01 12/03/2015 GET SMART PROMOTIONAL PRODUCTS SUPPLY BAMBOO FANS $7,623.00113 90898/7033-01 26/03/2015 SEMCORP NT DARWIN ENTERTAINMENT CENTRE OFFICE REFURBISHMENT $7,230.00114 90898/6657-01 26/03/2015 NQ RESOURCE RECOVERY PTY LTD PAINT AND CHEMICAL REMOVAL SHOAL BAY $6,968.39115 90876/859-01 05/03/2015 TELSTRA CORPORATION LIMITED MAIN TELEPHONE ACCOUNT $6,867.96116 90898/5794-01 26/03/2015 FLOW SOLUTIONS DIVISION REPAIR IRRIGATION PUMPS $6,865.38117 90898/4341-01 26/03/2015 CHAINMESH SUPPLIES PTY LTD FENCING REPAIRS $6,800.00118 90898/6502-01 26/03/2015 OFF THE LEASH INCORPORATED ADVERTISING SERVICES $6,612.76119 90897/859-01 26/03/2015 TELSTRA CORPORATION LIMITED TELEPHONE CHARGES MARCH 2015 $6,257.02120 00916386 19/03/2015 PATTEMORE CONSTRUCTIONS PTY LTD REPLACEMENT DRIVEWAY CONTRIBUTION $6,056.16121 90899/967-01 31/03/2015 CITY OF DARWIN CORPORATE CREDIT CARD PEOPLE, CULTURE AND CAPABILITY $5,942.74122 90897/418-01 26/03/2015 POWER AND WATER CORPORATION PAWA WATER CHARGES MARCH 2015 $5,710.53123 90890/2566-01 19/03/2015 CARDNO (NT) PTY LTD ESPLANADE RECONSTRUCTION $5,690.85124 90898/5896-01 26/03/2015 TALENT PROPELLER TRUST ADVERTISING SERVICES $5,599.00125 90898/2549-01 26/03/2015 MAWPUMP DARWIN SUPPLY SUBMERSIBLE PUMP $5,453.80126 90885/4914-01 12/03/2015 PILA GROUP PTY LTD SUPPLY SEMI PERMANENT GOAL POSTS & NET $5,159.00127 90875/5332-01 05/03/2015 ALDERMAN R WANT DE ROWE ALDERMAN PAYMENT FEBRUARY 2015 $5,097.29128 90898/5298-01 26/03/2015 TRANSFURB EXCESS INSURANCE PAYMENT $5,000.00129 90898/2566-01 26/03/2015 CARDNO (NT) PTY LTD VIMY LANE UPGRADE $4,986.85130 90877/2320-01 05/03/2015 P & K PLUMBING PROVISION OF PLUMBING SERVICES $4,864.83 2014/052B131 90898/6653-01 26/03/2015 APPROVED PLUMBING SERVICE PROVISION OF PLUMBING SERVICES $4,665.75 2014/052132 90898/2215-01 26/03/2015 FENCE FACTORY FENCING REPAIRS $4,660.00133 90885/3445-01 12/03/2015 DELL AUSTRALIA PTY LTD SUPPLY 3 LATITUDE LAPTOPS $4,531.76134 90892/235-01 26/03/2015 CHILD SUPPORT AGENCY PAYROLL DEDUCTION $4,462.92135 90898/7015-01 26/03/2015 HEDENIG CONSULTING CONSTRUCTIVE CONVERSATIONS WORKSHOPS $4,400.00136 90898/1821-01 26/03/2015 LANE PRINT GROUP PRINTING SERVICES $4,315.86137 90898/3943-01 26/03/2015 KONE ELEVATORS PTY LTD ELEVATOR MAINTENANCE $4,282.25138 90898/6999-01 26/03/2015 TOP END GREENKEEPING PTY LTD HERBICIDE TREATMENTS BAGOT OVAL $4,200.00139 90898/958-01 26/03/2015 TOP END LINE MARKERS PROVISION OF LINE MARKING SERVICES $4,086.50140 90898/6820-01 26/03/2015 NT TOWING & RECOVERY TOWING SERVICES $4,048.00141 90898/3329-01 26/03/2015 CAPTOVATE WEB HOSTING & TECHNICAL SUPPORT $3,973.00142 90885/3260-01 12/03/2015 LARRAKIA NATION ABORIGINAL CORPORATION WATER SAMPLING STORMWATER DRAINS $3,943.50143 90898/4044-01 26/03/2015 BURKERT FLUID CONTROL SYSTEMS SUPPLY IRRIGATION PARTS AND MAINTENANCE $3,941.30144 90875/3244-01 05/03/2015 ALDERMAN A R MITCHELL ALDERMAN PAYMENT FEBRUARY 2015 $3,930.48145 90898/1535-01 26/03/2015 IRON MOUNTAIN AUSTRALIA PTY LTD RECORDS MANAGEMENT FEBRUARY 15 $3,886.74146 90875/5347-01 05/03/2015 ALDERMAN J M ANICTOMATIS ALDERMAN PAYMENT FEBRUARY 2015 $3,880.48147 90885/6379-01 12/03/2015 FLEET CHOICE NT SALARY SACRIFICE PAYMENTS 9.3.15 $3,866.95148 90898/6379-01 26/03/2015 FLEET CHOICE NT SALARY SACRIFICE PAYMENTS 23.3.15 $3,866.95149 90898/5532-01 26/03/2015 RGM MAINTENANCE DARWIN PLANT PARTS AND REPAIRS $3,816.55150 90890/7041-01 19/03/2015 NORTHERN TESTING POWER CORDS & APPLIANCE TEST & TAG OPERATIONS CENTRE $3,722.40151 90885/7032-01 12/03/2015 SUNDIALS AUSTRALIA SUPPLY OF SUNDIAL & PLAQUES $3,700.00152 90877/2493-01 05/03/2015 SAI GLOBAL LTD SUBSCRIPTION RENEWAL $3,578.64153 90898/668-01 26/03/2015 SBA DISTRIBUTORS PTY LTD SUPPLY A4 COPY PAPER $3,516.77154 90890/5972-01 19/03/2015 THE SMITH FAMILY YOUNG MOTHERS EDUCATION PROGRAM $3,500.00155 90898/5872-01 26/03/2015 ARNO'S TYRE SERVICE PTY LTD TYRE FITTING AND MAINTENANCE SERVICE $3,484.80156 90875/4064-01 05/03/2015 ALDERMAN G J HASLETT ALDERMAN PAYMENT FEBRUARY 2015 $3,443.96157 90875/5331-01 05/03/2015 ALDERMAN G LAMBRINIDIS ALDERMAN PAYMENT FEBRUARY 2015 $3,443.96
85
85

158 90890/2593-01 19/03/2015 ALL CAST (NT) DRAINAGE SYSTEMS PTY LTD SUPPLY CONCRETE TABLES AND SEATS $3,405.60159 90898/2229-01 26/03/2015 TERRITORY ASSET MANAGEMENT TRAFFIC DATA COLLECTION AND ANALYSIS $3,396.15160 90875/409-01 05/03/2015 ALDERMAN R K ELIX ALDERMAN PAYMENT FEBRUARY 2015 $3,372.80161 90898/286-01 26/03/2015 COONAWARRA PANEL WORKS PLANT PARTS AND REPAIRS $3,368.08162 90877/1675-01 05/03/2015 CLOUSTON ASSOCIATES PROVISION OF DESIGN SERVICES $3,300.00163 90885/7038-01 12/03/2015 VALUATIONS NT RENTAL VALUATION LOT 5435 MITCHELL STREET $3,300.00164 90890/4603-01 19/03/2015 TONKIN CONSULTING PROFESSIONAL SERVICES CHIN QUAN ROAD BARRIER REVIEW $3,300.00165 90898/705-01 26/03/2015 TERRITORY TELEVISION PTY LTD ADVERTISING SERVICES $3,300.00166 90898/4731-01 26/03/2015 SOUTHERN CROSS AUSTEREO PTY LTD ADVERTISING SERVICES $3,294.50167 90875/4684-01 05/03/2015 ALDERMAN R M KNOX ALDERMAN PAYMENT FEBRUARY 2015 $3,265.12168 90875/3243-01 05/03/2015 ALDERMAN H I GALTON ALDERMAN PAYMENT FEBRUARY 2015 $3,215.12169 90875/5344-01 05/03/2015 ALDERMAN K J WORDEN ALDERMAN PAYMENT FEBRUARY 2015 $3,215.12170 90875/6925-01 05/03/2015 ALDERMAN J A GLOVER ALDERMAN PAYMENT FEBRUARY 2015 $3,215.12171 90877/6182-01 05/03/2015 JR BUSINESS COMMUNICATIONS PTY LTD SUPPLY AND INSTALL HANDSETS $3,194.40172 PY03-05 26/03/2015 PAYROLL MOA PAYROLL $3,166.35173 90875/2365-01 05/03/2015 ALDERMAN G A LAMBERT ALDERMAN PAYMENT FEBRUARY 2015 $3,086.28174 90875/5349-01 05/03/2015 ALDERMAN S J NIBLOCK ALDERMAN PAYMENT FEBRUARY 2015 $3,086.28175 90877/140-01 05/03/2015 BARNYARD TRADING SUPPLY TREE WEBBING AND PICK-UP STIX $3,052.57176 90877/715-01 05/03/2015 QUICKPRINT PRINTING SERVICES $3,014.00177 90898/3445-01 26/03/2015 DELL AUSTRALIA PTY LTD SUPPLY DELL VENUE 8 7840 $2,997.50178 90898/5215-01 26/03/2015 POOL & SPA SUPERSTORE SUPPLY & INSTALL NEW INLET COVERS $2,976.90179 90877/6657-01 05/03/2015 NQ RESOURCE RECOVERY PTY LTD PAINT AND CHEMICAL REMOVAL SHOAL BAY $2,949.82180 90898/6976-01 26/03/2015 NT TYRE SERVICE STUART PARK TYRE FITTING AND MAINTENANCE SERVICE $2,902.00181 90885/4716-01 12/03/2015 BLIZZARD AIR & REFRIGERATION INSTALL AIR CONDITIONING UNIT CORRUGATED IRON $2,865.26182 90890/2654-01 19/03/2015 TERRITORY DOOR SERVICES ROLLER DOOR SERVICE AND MAINTENANCE $2,772.19183 90898/406-01 26/03/2015 INTEGRATED SWITCHGEAR & SYSTEMS PTY LTD SUPPLY ENCLOSURES $2,761.00184 90898/4975-01 26/03/2015 OFFICEWORKS AUSTRALIA PTY LTD SUPPLY STATIONERY ITEMS AND EQUIPMENT $2,722.74185 90898/3787-01 26/03/2015 BEAUREPAIRES FOR TYRES TYRE FITTING AND MAINTENANCE SERVICE $2,654.54186 90898/5361-01 26/03/2015 PAUL MAHER SOLICITOR PROVISION OF LEGAL SERVICES $2,640.00187 90898/6656-01 26/03/2015 DARWIN & DISTRICT PLUMBING PTY LTD PROVISION OF PLUMBING SERVICES $2,563.00 2014/052A188 90885/2837-01 12/03/2015 MS C A VERNON AUTHORITY CONSULTING SERVICES $2,541.00189 90893/6694-01 26/03/2015 JACANA ENERGY PAYROLL DEDUCTION $2,510.00190 90885/6998-01 12/03/2015 STORYPROJECTS.COM.AU COMMISSION PUBLIC ART PROJECT $2,500.00191 90898/6274-01 26/03/2015 MS K BROOKER CONTRIBUTION FOR GRADUATE DIPLOMA IN INFORMATION SERVICES $2,500.00192 90898/3756-01 26/03/2015 KAREN SHELDON CATERING CATERING SERVICES $2,495.00193 90898/3580-01 26/03/2015 TOLL PRIORITY COURIER SERVICES $2,443.64194 90881/6694-01 12/03/2015 JACANA ENERGY PAYROLL DEDUCTION $2,410.00195 90898/5145-01 26/03/2015 TERRITORY SURGICAL SUPPLIES SUPPLY SHARPS CONTAINERS $2,403.00196 90898/5753-01 26/03/2015 QTURF MACHINERY PTY LTD PLANT PARTS AND REPAIRS $2,388.43197 90890/6973-01 19/03/2015 WEX AUSTRALIA SUPPLY FUEL $2,373.29198 90898/199-01 26/03/2015 IMAGE OFFSET PTY LTD PRINTING SERVICES $2,343.00199 90885/1821-01 12/03/2015 LANE PRINT GROUP ADJUSTMENT TO ORIGINAL INVOICE $2,328.48200 90898/5224-01 26/03/2015 C BAKER & J MANGOHIG PERFORMANCE FROM SERINA PECK $2,300.00201 90898/413-01 26/03/2015 HARVEY DISTRIBUTORS SUPPLY JANITORIAL PRODUCTS $2,268.06202 90898/3962-01 26/03/2015 JOBFIT HEALTH GROUP PROVISION OF MEDICAL SERVICES $2,214.20203 90898/654-01 26/03/2015 NORTHERN TERRITORY BROADCASTERS PTY LTD ADVERTISING SERVICES $2,200.00204 90890/6976-01 19/03/2015 NT TYRE SERVICE STUART PARK TYRE FITTING AND MAINTENANCE SERVICE $2,180.00205 90898/6351-01 26/03/2015 CHEMICAL ESSENTIALS PTY LTD VETERINARY DISINFECTANT PRODUCTS $2,175.80206 90877/1573-01 05/03/2015 MABINDI PTY LTD HIRE AND OPERATION OF ELEVATED WORK PLATFORM $2,143.04 2013/045207 90890/277-01 19/03/2015 AREA9 IT SOLUTIONS SUPPLY APPLE MACBOOK $2,122.42208 90898/6106-01 26/03/2015 SAFEMAN NT SAFETY WORKWEAR AND EQUIPMENT $2,095.50209 90877/5177-01 05/03/2015 JOONDANNA INVESTMENTS PTY LTD AIR CONDITIONING COSTS KARAMA LIBRARY JANUARY 2015 $2,044.19210 90898/3848-01 26/03/2015 DARWIN AUTO ELECTRICS PTY LTD PLANT PARTS AND REPAIRS $2,038.30211 90898/1361-01 26/03/2015 NT GENERAL STORE SUPPLY EXTREME TOOL BAGS $2,010.00212 90885/2682-01 12/03/2015 SPROUT CREATIVE PTY LTD SUPPLY PULL UP BANNER PLUS SKIN $2,008.60213 90898/498-01 26/03/2015 J BLACKWOOD & SON LTD SUPPLY STORES TOOLS AND EQUIPMENT $2,007.97214 90877/88-01 05/03/2015 AUSTRALIAN LOCAL GOVERNMENT WOMENS
ASSOCIATIONSILVER SPONSORSHIP INTERNATIONAL WOMEN'S DAY $2,000.00
215 90890/6271-01 19/03/2015 CROSS CULTURAL CONSULTANTS FACILITATION OF WORKSHOPS AMBON & ACHORAGE SCCC $2,000.00216 90898/4540-01 26/03/2015 ZONE 3 DARWIN YOUTH TEAMWORK SESSIONS $2,000.00
86
86

217 90898/2710-01 26/03/2015 FIGLEAF POOL PRODUCTS SERVICE NIGHTCLIFF POOL FEBRUARY 2015 $1,995.00218 90898/4822-01 26/03/2015 TRAFFICWERX NT PTY LTD TRAFFIC MANAGEMENT VARIOUS LOCATIONS $1,985.50219 90898/4587-01 26/03/2015 VIBE HOTEL DARWIN WATERFRONT DAY TRAINING PACKAGE $1,950.00220 90899/967-01 31/03/2015 CITY OF DARWIN CORPORATE CREDIT CARD CEO $1,921.01221 90877/1796-01 05/03/2015 RIDER LEVETT BUCKNALL NT PTY LTD QUANTITY SURVEYING SERVICES LEACHATE BASINS $1,914.00222 90898/6856-01 26/03/2015 ENVIRONMENTAL DEFENDERS OFFICE DEVELOPMENT OF DATABASE $1,910.00223 90877/1439-01 05/03/2015 SHADEWORKS HIRE SUPPLY PAVILION & CHAIRS BOMBING OF DARWIN EVENT $1,851.00224 90898/5349-01 26/03/2015 ALDERMAN S J NIBLOCK REIMBURSE REGISTRATION PLANNING INSTITUTE OF AUSTRALIA $1,830.00225 90899/967-01 31/03/2015 CITY OF DARWIN CORPORATE CREDIT CARD LIBRARIES $1,798.82226 90898/425-01 26/03/2015 FALCON ENGINEERING PTY LTD PLANT PARTS AND REPAIRS $1,760.00227 90885/591-01 12/03/2015 PACKARD GOOSE PTY LTD HIRE OF VACUUM PUMP TRUCK $1,725.00228 90898/3517-01 26/03/2015 MICHELS WARREN MUNDAY GENERAL COMMUNICATION FEES FEBRUARY 2015 $1,718.75229 90877/3643-01 05/03/2015 AUSURV PTY LTD SHOAL BAY SURVEY PERIMETER OF STAGE 3 $1,705.00230 90898/197-01 26/03/2015 BUNNINGS BUILDING SUPPLIES PTY LTD HARDWARE SUPPLIES $1,691.02231 90898/1158-01 26/03/2015 GEMINEX NORTHERN TERRITORY SUPPLY UNIFORMS $1,632.39232 90885/2781-01 12/03/2015 DEPT OF CORPORATE AND INFORMATION SERVICES WATER TESTING SWIMMING POOLS $1,625.37233 90877/5113-01 05/03/2015 SMART DISTRIBUTION SERVICES SUPPLY GRAFFITI REMOVER $1,617.00234 90877/4296-01 05/03/2015 EARTHWORKS TRAINING & ASSESSMENT WZ2 AND WZ3 REFRESHER TRAINING $1,600.00235 90877/1821-01 05/03/2015 LANE PRINT GROUP PRINTING AND DISTRIBUTION SERVICES $1,583.44236 90877/3266-01 05/03/2015 ID CONSULTING PTY LTD QUARTERLY SUBSCRIPTION FEBRUARY - APRIL 2015 $1,567.50237 90885/5990-01 12/03/2015 CROSS CULTURAL CONSULTANTS CROSS CULTURAL TRAINING $1,567.50238 90885/4995-01 12/03/2015 TERRITORY RURAL SUPPLY HERBICIDES AND PESTICIDES $1,562.00239 90890/6657-01 19/03/2015 NQ RESOURCE RECOVERY PTY LTD PAINT AND CHEMICAL REMOVAL SHOAL BAY $1,557.93240 90885/4920-01 12/03/2015 DEMPSEY CONSOLIDATED PTY LTD CHEMICAL COSTS NIGHTCLIFF POOL $1,520.00241 90877/6976-01 05/03/2015 NT TYRE SERVICE STUART PARK TYRE FITTING AND MAINTENANCE SERVICE $1,501.00242 90898/407-01 26/03/2015 REECE PTY LTD LIBRARY RESOURCES $1,483.35243 90898/3750-01 26/03/2015 DARWIN STEEL & PIPE SUPPLIES PTY LTD STEEL SUPPLIES $1,472.24244 90885/3032-01 12/03/2015 W & D M FONG NOMINEES PTY LTD LEASE PAYMENT 7 PAVONIA WAY MARCH 2015 $1,438.80245 90899/967-01 31/03/2015 CITY OF DARWIN CORPORATE CREDIT CARD WORKSHOP $1,438.35246 90885/7034-01 12/03/2015 EXTREME PRODUCTS PTY LTD SUPPLY 3G RUGGEAR MOBILE PHONES $1,420.27247 90898/2241-01 26/03/2015 HIDDEN VALLEY FORD PLANT PARTS AND REPAIRS $1,418.42248 90898/1819-01 26/03/2015 EMPLOYEE ASSISTANCE SERVICE COUNSELLING SERVICES FEBRUARY 2015 $1,410.01249 90885/3780-01 12/03/2015 EPAC SALARY SOLUTIONS PTY LTD SALARY SACRIFICE PAYMENTS 9.3.15 $1,396.52250 90898/3780-01 26/03/2015 EPAC SALARY SOLUTIONS PTY LTD SALARY SACRIFICE PAYMENTS 23.3.15 $1,396.52251 90898/250-01 26/03/2015 COATES HIRE OPERATIONS PTY LTD HIRE PORTABLE TOILETS BOMBING OF DARWIN EVENT $1,366.38252 90898/4995-01 26/03/2015 TERRITORY RURAL SUPPLY HERBICIDES AND PESTICIDES $1,352.34253 90885/4785-01 12/03/2015 CLEAN AS PROVISION OF CLEANING SERVICES $1,340.00254 90898/2654-01 26/03/2015 TERRITORY DOOR SERVICES ROLLER DOOR SERVICE AND MAINTENANCE $1,331.00255 90885/6976-01 12/03/2015 NT TYRE SERVICE STUART PARK TYRE FITTING AND MAINTENANCE SERVICE $1,330.00256 90898/1207-01 26/03/2015 SHORELANDS PTY LTD CRANE HIRE $1,328.25257 90890/908-01 19/03/2015 WOOLWORTHS LIMITED SUPPLY WATER FOR BOMBING OF DARWIN EVENT $1,325.89258 90877/4549-01 05/03/2015 ABP PERMITS PTY LTD ISSUE BUILDING PERMITS $1,320.00259 00916379 12/03/2015 AMOUR LIMESTONE CREATIONS REPAIR STONE PIER GARDENS OVAL $1,320.00260 90890/42-01 19/03/2015 AMALGAMATED PEST CONTROL INSECT AND PEST TREATMENT $1,303.50261 90898/4257-01 26/03/2015 104.1 TERRITORY FM ADVERTISING SERVICES $1,229.80262 90877/2445-01 05/03/2015 UGL SERVICES PTY LTD RENTAL LEANYER BOMBING RANGE $1,215.04263 90890/7038-01 19/03/2015 VALUATIONS NT RENTAL VALUATION LOT 3434 SMITH STREET $1,210.00264 90890/6470-01 19/03/2015 MULTICULTURAL YOUTH NT BUS FUEL ALLOWANCE FEBRUARY - JUNE 2015 $1,200.00265 90877/4603-01 05/03/2015 TONKIN CONSULTING PROFESSIONAL FEES SUBDIVISION GUIDELINES $1,193.50266 00916385 19/03/2015 HWL EBSWORTH LAWYERS PROVISION OF LEGAL SERVICES $1,188.00267 90890/3674-01 19/03/2015 MR B J SELLERS PART PAYMENT DIPLOMA FEES $1,152.00268 90890/4810-01 19/03/2015 MRS T SELLERS PART PAYMENT DIPLOMA FEES $1,152.00269 90885/254-01 12/03/2015 COLEMANS PRINTING PTY LTD PRINTING SERVICES $1,137.62270 90877/952-01 05/03/2015 ZIP PRINT PRINTING SERVICES $1,100.00271 90890/7095-01 19/03/2015 MS C M LONG RATES REFUND $1,100.00272 90898/3783-01 26/03/2015 WALLBRIDGE & GILBERT CIVIL ENGINEER SERVICES $1,100.00273 90882/967-01 12/03/2015 CITY OF DARWIN PAYROLL DEDUCTION $1,088.17274 90874/6694-01 05/03/2015 JACANA ENERGY PAYROLL DEDUCTION $1,080.00275 90888/6694-01 19/03/2015 JACANA ENERGY PAYROLL DEDUCTION $1,070.00276 90885/6820-01 12/03/2015 NT TOWING & RECOVERY TOWING SERVICES $1,056.00
87
87

277 90898/2250-01 26/03/2015 WINNELLIE HYRDAULICS PLANT PARTS AND REPAIRS $1,041.68278 90898/2589-01 26/03/2015 WINNELLIE CELLARS CATERING ALCOHOL VETERANS DINNER $1,012.90279 90885/7092-01 12/03/2015 MRS C D A KERR RATES REFUND $1,000.00280 90898/7111-01 26/03/2015 WILLIAM SINGE DEPOSIT FOR PERFORMANCE DARWIN YOUTH FESTIVAL $1,000.00281 90898/5338-01 26/03/2015 EPRINT PRINTING SERVICES $996.00282 90890/3445-01 19/03/2015 DELL AUSTRALIA PTY LTD SUPPLY 3 X LOGITECH DESKTOP $976.92283 00916395 26/03/2015 MPZ BUILDERS PTY LTD REIMBURSE ACCOUNT CREDIT BALANCE $973.61284 90877/4073-01 05/03/2015 HOLCO FINE MEATS SUPPLY MEAT FOR CYCLONE STOCK $963.41285 90899/967-01 31/03/2015 CITY OF DARWIN CORPORATE CREDIT CARD OFFICE OF THE CEO $960.28286 90898/67-01 26/03/2015 ACCESS HARDWARE PTY LTD SUPPLY CHAIN AND PADLOCK NIGHTCLIFF POOL $951.50287 90877/2682-01 05/03/2015 SPROUT CREATIVE PTY LTD UPDATE ALDERMEN BANNER $950.40288 90877/491-01 05/03/2015 JAPE KONG SU NOMINEES PTY LTD FURNITURE FOR NIGHTCLIFF LIBRARY $942.00289 90877/1946-01 05/03/2015 RAECO LIBRARY RESOURCES $941.06290 90885/7058-01 12/03/2015 SIMPLEPAY SOLUTIONS PTY LTD CREDIT CARD TRANSACTION FEE PARKING $938.74291 90877/4920-01 05/03/2015 DEMPSEY CONSOLIDATED PTY LTD LIFEGUARD HIRE POOL TOY DECEMBER 2014 $935.00292 90874/553-01 05/03/2015 LHMU - NT BRANCH PAYROLL DEDUCTION $930.60293 90888/553-01 19/03/2015 LHMU - NT BRANCH PAYROLL DEDUCTION $930.60294 90885/1898-01 12/03/2015 AUDIO TECHNOLOGY NT PTY LTD AUDIO TECHNICIAN INTERNATIONAL WOMEN'S DAY $928.40295 90898/5844-01 26/03/2015 LED SIGNS PTY LIMITED NEXT G DATA PLAN RENEWAL JULY 2014 - DECEMBER 2015 $924.00296 90898/6945-01 26/03/2015 ISENTIA PTY LTD MEDIA MONITORING $905.52297 00916368 05/03/2015 PETTY CASH PETTY CASH REIMBURSEMENT CUSTOMER SERVICES $887.20298 90898/5396-01 26/03/2015 HYDROCHEM PTY LTD WATER TREATMENT CASUARINA LIBRARY $883.30299 90898/4476-01 26/03/2015 MR F TAM EXCAVATOR AND OPERATOR HIRE $880.0055 90883/418-01 12/03/2015 POWER AND WATER CORPORATION SEWERAGE CHARGES 2 MARCH 2015 $872.39300 90885/7089-01 12/03/2015 MS B R RANKMORE RATES REFUND $870.84301 90899/967-01 31/03/2015 CITY OF DARWIN CORPORATE CREDIT CARD OFFICE OF THE CEO $855.53302 90898/2666-01 26/03/2015 ALL TOOLS NT PLANT PARTS AND REPAIRS $850.00303 90898/2389-01 26/03/2015 WURTH AUSTRALIA PLANT PARTS AND REPAIRS $847.34304 90877/254-01 05/03/2015 COLEMANS PRINTING PTY LTD PRINTING SERVICES $847.00305 90890/3270-01 19/03/2015 ISS FACILITY SERVICES AUSTRALIA LIMITED CLEANING SERVICES KARAMA LIBRARY $846.89306 90894/967-01 26/03/2015 CITY OF DARWIN PAYROLL DEDUCTION $838.69307 90898/42-01 26/03/2015 AMALGAMATED PEST CONTROL INSECT AND PEST TREATMENT $836.00308 00916372 12/03/2015 PETTY CASH ********** C A N C E L L E D ****** $817.05309 00916377 12/03/2015 PETTY CASH PETTY CASH REIMBURSEMENT CUSTOMER SERVICES $817.05310 90877/4924-01 05/03/2015 DREAMEDIA EVENTS PTY LTD HIRE ADDITIONAL INFRASTRUCTURE BOMBING OF DARWIN EVENT $808.06 2014/017311 90877/7082-01 05/03/2015 MRS P M SMITH RATES REFUND $800.00312 90898/3563-01 26/03/2015 QBD THE BOOKSHOP LIBRARY RESOURCES $798.90313 90890/380-01 19/03/2015 PHONOGRAPHIC PERFORMANCE COMPANY OF
AUSTRALIALICENSING FOR PUBLIC PERFORMANCES $797.50
314 90885/6356-01 12/03/2015 LUCID CONSULTING ENGINEERS (NT) PTY LTD PROVISION OF ENGINEERING SERVICES $792.00315 90890/5361-01 19/03/2015 PAUL MAHER SOLICITOR PROVISION OF LEGAL SERVICES $770.00316 90898/6100-01 26/03/2015 TROJON FENCING CONTRACTORS SUPPLY & INSTALL FENCING $767.80317 90898/1031-01 26/03/2015 GARRARDS PTY LTD SUPPLY HERBICIDES AND PESTICIDES $759.55318 90898/6006-01 26/03/2015 MARSHALL POWER AUSTRALIA LTD SUPPLY EXIDE BATTERIES $753.70319 90898/612-01 26/03/2015 STAPLES AUSTRALIA SUPPLY STATIONERY ITEMS $752.93320 90890/2215-01 19/03/2015 FENCE FACTORY FENCING REPAIRS $745.00321 90890/2314-01 19/03/2015 THE EXHIBITIONIST DESIGN 2015 AUSTRALIA DAY BOOKLET $742.50322 90898/2424-01 26/03/2015 ATOM PLANT PARTS AND REPAIRS $740.65323 90898/48-01 26/03/2015 THE BOOKSHOP DARWIN LIBRARY RESOURCES $728.18324 90885/42-01 12/03/2015 AMALGAMATED PEST CONTROL INSECT AND PEST TREATMENT $726.00325 90885/3691-01 12/03/2015 DARWIN CONSULTANT PSYCHOLOGISTS PSYCHOLOGICAL ASSESSMENT $721.60326 90877/3071-01 05/03/2015 AUSTRALIAN HUMAN RESOURCES INSTITUTE MEMBERSHIP RENEWAL $720.00327 90877/5494-01 05/03/2015 M & D KING ASSET TRUST SUPPLY VMS BOARDS $693.00328 90890/4163-01 19/03/2015 SIGN CITY SUPPLY SIGNAGE FOR LAUNCH $693.00329 90898/6253-01 26/03/2015 WILD SOUNDS PREPARATION FOR GIG GEAR TRAINING $690.00330 90898/1946-01 26/03/2015 RAECO SUPPLY SLATWALL FOR LIBRARY $676.56331 90898/2812-01 26/03/2015 MOBILE LOCKSMITHS KEY CUTTING AND LOCK SERVICE $665.50332 90898/1910-01 26/03/2015 ACE ARBOR SERVICES LAWN MOWING SERVICES MALAK COMMUNITY CENTRE $653.40333 90898/4813-01 26/03/2015 AUSTEC IRRIGATION PTY LTD SUPPLY IRRIGATION PARTS AND MAINTENANCE $650.61334 90890/3612-01 19/03/2015 JB HI-FI GROUP PTY LTD LIBRARY RESOURCES $642.03
88
88

335 90898/5506-01 26/03/2015 MURRAY PEST CONTROL INSECT AND PEST TREATMENT $635.00336 90877/5079-01 05/03/2015 SIMON GEORGE & SONS PTY LTD CATERING SERVICES $628.02337 90885/6657-01 12/03/2015 NQ RESOURCE RECOVERY PTY LTD PAINT AND CHEMICAL REMOVAL SHOAL BAY $623.15338 90890/7094-01 19/03/2015 STARLIGHT CHILDREN'S FOUNDATION REFUND SECURITY DEPOSIT NIGHTCLIFF COMMUNITY CENTRE $620.00339 90898/847-01 26/03/2015 NT RETAIL TECHNOLOGY SUPPLY BARCODES $616.00340 90877/1170-01 05/03/2015 H D PUMPS SUPPLY TRASH PUMP MECHANICAL SEAL KIT SHOAL BAY $611.00341 90898/4439-01 26/03/2015 ASIAN UNITED FOOD SERVICE CATERING SERVICES $606.68342 90877/1772-01 05/03/2015 TERRITORY UNIFORMS SUPPLY UNIFORMS $606.60343 90877/2654-01 05/03/2015 TERRITORY DOOR SERVICES ROLLER DOOR SERVICE AND MAINTENANCE $605.00344 90890/6502-01 19/03/2015 OFF THE LEASH INCORPORATED ADVERTISING MARCH 2015 EDITION $605.00345 90877/7088-01 05/03/2015 AUSTRALIAN LOCAL GOVERNMENT WOMENS
ASSOCIATIONCONFERENCE REGISTRATION $599.95
346 90885/4856-01 12/03/2015 NT RECYCLING SOLUTIONS CHANGEOVER LOCKED SECURE BINS CIVIC CENTRE, OPERATIONS CENTRE, CASUARINA LIBRARY
$596.61
347 90899/967-01 31/03/2015 CITY OF DARWIN CORPORATE CREDIT CARD INFRASTRUCTURE $571.00348 90898/182-01 26/03/2015 BRIDGE TOYOTA PLANT PARTS AND REPAIRS $570.10349 90881/125-01 12/03/2015 AUSTRALIAN SERVICES UNION PAYROLL DEDUCTION $565.80350 90893/125-01 26/03/2015 AUSTRALIAN SERVICES UNION PAYROLL DEDUCTION $565.80351 00916369 05/03/2015 GLYNIS LEE REIMBURSE PRO-RATA COST OF FLIGHTS TO HAIKOU $562.00352 00916383 19/03/2015 PETTY CASH PETTY CASH REIMBURSEMENT CASUARINA LIBRARY $561.55353 90898/1356-01 26/03/2015 GRACE REMOVALS GROUP HIRE REMOVALISTS $561.00354 90898/5143-01 26/03/2015 HAPPY YESS COMMUNITY ARTS CONTRIBUTION TO ALL AGES GIG $550.00355 90898/656-01 26/03/2015 NT ACRYLICS & PLASTICS SUPPLY 1200MM DISC $550.00356 90877/6098-01 05/03/2015 K&B ADAMS PTY LTD SUPPLY HERBICIDES AND PESTICIDES $546.81357 90898/6553-01 26/03/2015 NASKAM SECURITY SERVICES PTY LTD QUARTERLY VIDEO MONITORING CASUARINA $544.50358 90877/4785-01 05/03/2015 CLEAN AS CLEANING SERVICES NIGHTCLIFF COMMUNITY $540.00359 90898/4785-01 26/03/2015 CLEAN AS CLEANING SERVICES NIGHTCLIFF COMMUNITY $540.00360 90898/6180-01 26/03/2015 SKILLED GROUP LIMITED PROVISION OF TEMPORARY EMPLOYMENT SERVICES $537.23 2013/018C361 90898/2189-01 26/03/2015 CUMMINS PLANT PARTS AND REPAIRS $520.96362 90890/1772-01 19/03/2015 TERRITORY UNIFORMS SUPPLY UNIFORMS $505.60363 00916387 19/03/2015 NATHANIEL KELLY WELCOME TO DARWIN VIDEO PRODUCTION $500.00364 90890/7109-01 19/03/2015 MS J V BONSON REFUND SECURITY DEPOSIT RAINTREE PARK $500.00365 90893/418-01 26/03/2015 POWER AND WATER CORPORATION PAYROLL DEDUCTION $500.00366 90898/6865-01 26/03/2015 MELANOMA INSTITUTE AUSTRALIA REFUND SECURITY DEPOSIT BICENTENNIAL PARK $500.00367 90898/7025-01 26/03/2015 INTERSPORT CASUARINA SUPPLY MEN'S SAFETY SHOES $500.00368 90898/6203-01 26/03/2015 MR G D SMITH TOWING SERVICES $495.00369 90898/153-01 26/03/2015 BIG W DEPARTMENT STORE LIBRARY RESOURCES $491.60370 90898/3612-01 26/03/2015 JB HI-FI GROUP PTY LTD LIBRARY RESOURCES $489.98371 90898/2929-01 26/03/2015 BOLINDA PUBLISHING PTY LTD LIBRARY RESOURCES $489.50372 90890/5552-01 19/03/2015 GREEN BEING NT HEALTHY DARWIN COOKING WORKSHOP $488.20373 90885/3225-01 12/03/2015 CASUARINA NEXTRA NEWS SUPPLY NEWSPAPERS AND MAGAZINES $485.55374 90899/967-01 31/03/2015 CITY OF DARWIN CORPORATE CREDIT CARD LORD MAYOR $485.50375 90898/2907-01 26/03/2015 COMPLETE OFFICE SUPPLIES SUPPLY STATIONERY ITEMS $484.41376 90890/4932-01 19/03/2015 NORTHERN ROCK PEST CONTROL PTY LTD INSECT AND PEST TREATMENT $484.00377 90898/5154-01 26/03/2015 DATABANK TECHNOLOGIES IT DATA STORAGE CHARGES FEBRUARY 2015 $480.06378 90877/3962-01 05/03/2015 JOBFIT HEALTH GROUP PROVISION OF MEDICAL SERVICES $478.50379 90898/91-01 26/03/2015 AUSTRALASIAN PERFORMING RIGHT ASSOCIATION LICENCE RENEWAL DARWIN MALL BACKGROUND MUSIC $474.38380 90877/2392-01 05/03/2015 BUNZL LTD SUPPLY JANITORIAL PRODUCTS $471.24381 90898/3412-01 26/03/2015 SECURE PAY PTY LTD WEB PAYMENTS CHARGES $469.98382 90898/1177-01 26/03/2015 KONNECT SUPPLY TOOLS AND FIXINGS $469.79383 00916391 26/03/2015 PETTY CASH PETTY CASH REIMBURSEMENT OPERATIONS CENTRE $463.30384 00916390 26/03/2015 TELSTRA CORPORATION LIMITED PAYROLL DEDUCTION $460.00385 90898/1409-01 26/03/2015 ENZED SERVICE CENTRE DARWIN PLANT PARTS AND REPAIRS $458.90386 00916388 19/03/2015 CITY OF DARWIN CASH ADVANCE ANIMAL HEALTH PROGRAM CATERING $456.00387 90877/2316-01 05/03/2015 SCHNEIDER ELECTRIC BUILDINGS AUSTRALIA REPAIRS CARD READER CHINATOWN CARPARK $455.40388 00916392 26/03/2015 PETTY CASH PETTY CASH REIMBURSEMENT CUSTOMER SERVICES $449.05389 90898/3904-01 26/03/2015 TOP END TURF SUPPLY SIR WALTER TURF $448.00390 90898/34-01 26/03/2015 AIRPOWER PTY LTD PLANT PARTS AND REPAIRS $445.64391 90885/250-01 12/03/2015 COATES HIRE OPERATIONS PTY LTD HIRE FORKLIFT FOR SHOAL BAY WEIGHBRIDGE CALIBRATION $445.03392 90898/6648-01 26/03/2015 1300TEMPFENCE TEMPORARY FENCE HIRE $443.41
89
89

393 90877/1294-01 05/03/2015 JACOBS GROUP PROFESSIONAL ENGINEERING SERVICES $440.00394 90877/2354-01 05/03/2015 ANYWAIR ELECTRICS UNDERGROUND SERVICE LOCATION $440.00395 90898/2781-01 26/03/2015 DEPT OF CORPORATE AND INFORMATION SERVICES WATER TESTING GARDENS GOLF LINKS & LAKE ALEXANDER $436.14396 90898/5335-01 26/03/2015 MS R VAN DER POEL CONTRIBUTION FOR ADVANCED DIPLOMA OF MANAGEMENT $435.00397 90877/5083-01 05/03/2015 SOLARWISENSW SERVICE OF POOL CLEANER $431.93398 90898/859-01 26/03/2015 TELSTRA CORPORATION LIMITED FREECALL AND SATELLITE PLAN FEES $430.86399 90881/3103-01 12/03/2015 DARWIN COUNCIL SOCIAL CLUB PAYROLL DEDUCTION $428.50400 90885/1490-01 12/03/2015 DARWIN HUMAN RESOURCE & COMPUTER ACADEMY VISIO INTRODUCTION $425.00401 90893/3103-01 26/03/2015 DARWIN COUNCIL SOCIAL CLUB PAYROLL DEDUCTION $425.00402 90898/157-01 26/03/2015 HITACHI CONSTRUCTION MACHINERY PLANT PARTS AND REPAIRS $418.35403 90898/4549-01 26/03/2015 ABP PERMITS PTY LTD INSPECTION REPORT MALAK CHILD CARE CENTRE $418.00404 90898/178-01 26/03/2015 BP AUSTRALIA PTY LTD FUEL ACCOUNT FEBRUARY 2015 $417.70405 90885/491-01 12/03/2015 JAPE KONG SU NOMINEES PTY LTD SUPPLY OFFICE FURNITURE OPERATIONS CENTRE $414.00406 00916371 12/03/2015 TELSTRA CORPORATION LIMITED PAYROLL DEDUCTION $410.00407 90898/7037-01 26/03/2015 DARWIN LARGE ANIMAL MOBILE VET SERVICE VETERINARY SERVICES ANIMAL POUND $410.00408 90896/166-01 26/03/2015 OTIS ELEVATOR COMPANY PTY LTD ELEVATOR MAINTENANCE $405.04409 90877/6105-01 05/03/2015 ALDERMENS COMMUNITY SUPPORT FUND COMMUNITY SUPPORT FUND CONTRIBUTION FEBRUARY 2015 $400.00410 90881/418-01 12/03/2015 POWER AND WATER CORPORATION PAYROLL DEDUCTION $400.00411 90885/7093-01 12/03/2015 ROKA GRAPHICS PTY LTD REIMBURSE ACCOUNT CREDIT BALANCE $400.00412 90890/6459-01 19/03/2015 AMIABLE COMMUNICATIONS YOUTH EVENT CO-ORDINATORS $400.00413 90898/4877-01 26/03/2015 TOP END TRAINING LIGHT RIGID ASSESSMENT $400.00414 90877/42-01 05/03/2015 AMALGAMATED PEST CONTROL INSECT AND PEST TREATMENT $396.00415 90898/211-01 26/03/2015 BOC GASES AUSTRALIA LIMITED CONTAINER SERVICE FEBRUARY 2015 $388.73416 90890/591-01 19/03/2015 PACKARD GOOSE PTY LTD HIRE OF VACUUM PUMP TRUCK $385.00417 00916382 19/03/2015 PETTY CASH PETTY CASH REIMBURSEMENT CUSTOMER SERVICES $381.15418 90877/1865-01 05/03/2015 SPOTLIGHT SUPPLY MATERIALS FOR WELCOME TO DARWIN KIT $373.51419 90877/2487-01 05/03/2015 SCHWARZE INDUSTRIES AUSTRALIA PTY LTD PLANT PARTS AND REPAIRS $371.81420 90877/5194-01 05/03/2015 MAJESTIX MEDIA SERVICE PROJECTORS OPERATIONS CENTRE $363.00421 90885/6960-01 12/03/2015 MIRROR MIRROR ON THE WALL FACE PAINTING INTERNATIONAL WOMEN'S DAY EVENT $360.00422 90890/2011-01 19/03/2015 VEDA ADVANTAGE INFORMATION SERVICES COMPANY SEARCH CHARGES $359.76423 90898/5323-01 26/03/2015 TIGERS DISCOUNT POTS GARDENING SUPPLIES $356.00424 90898/6479-01 26/03/2015 MS S CRAMER ATTEND NATIONAL LOCAL GOVERNMENT CULTURAL FORUM $340.85425 90877/380-01 05/03/2015 PHONOGRAPHIC PERFORMANCE COMPANY OF
AUSTRALIALICENCE RENEWAL TO 29.2.16 $336.60
426 90898/3327-01 26/03/2015 DEE BEE CATERING CATERING SERVICES $330.00427 90898/5280-01 26/03/2015 MRS N A JUNG REIMBURSE KIDS RAINBOW CANDLE MAKING KIT $330.00428 90898/6450-01 26/03/2015 TENDERLINK.COM PUBLIC TENDER ADVERTISING $330.00429 90898/6668-01 26/03/2015 STATEWIDE POOL SERVICES PTY LTD CALL OUT NIGHTCLIFF POOL TO INVESTIGATE PUMP FAULT $330.00430 90888/418-01 19/03/2015 POWER AND WATER CORPORATION PAYROLL DEDUCTION $325.00431 90898/6949-01 26/03/2015 CHRIST CHURCH CATHEDRAL HIRE HARBOUR ROOM FOR LUNCHTIME CIRCUIT $325.00432 90885/4803-01 12/03/2015 MRS A K GARDEN LGMA MANAGEMENT CHALLENGE KATHERINE 16-19.3.15 $315.10433 90874/418-01 05/03/2015 POWER AND WATER CORPORATION PAYROLL DEDUCTION $315.00434 90877/6658-01 05/03/2015 MR J GREGORIO REFUND SECURITY DEPOSIT MALAK COMMUNITY CENTRE $310.00435 90877/6911-01 05/03/2015 MRS A M BLACKMORE REFUND SECURITY DEPOSIT LYONS COMMUNITY CENTRE $310.00436 90877/7021-01 05/03/2015 MS M H FERNANDEZ REFUND SECURITY DEPOSIT MALAK COMMUNITY CENTRE $310.00437 90877/7030-01 05/03/2015 MS P NGUYEN REFUND SECURITY DEPOSIT LYONS COMMUNITY CENTRE $310.00438 90877/7068-01 05/03/2015 B T ORTIZ REFUND SECURITY DEPOSIT LYONS COMMUNITY CENTRE $310.00439 90877/7073-01 05/03/2015 S JALLOH REFUND SECURITY DEPOSIT LYONS COMMUNITY CENTRE $310.00440 90890/7099-01 19/03/2015 MS I M LOPEZ REFUND SECURITY DEPOSIT LYONS COMMUNITY CENTRE $310.00441 00916398 26/03/2015 MRS A D SIMPKINS REFUND SECURITY DEPOSIT LYONS COMMUNITY CENTRE $310.00442 90898/7107-01 26/03/2015 MR L K CHEE REFUND SECURITY DEPOSIT MALAK COMMUNITY CENTRE $310.00443 90885/6844-01 12/03/2015 SLUMBERCORP NT STORAGE CHARGES MARCH 2015 $308.00444 90885/153-01 12/03/2015 BIG W DEPARTMENT STORE LIBRARY RESOURCES $307.00445 90877/2316-01 05/03/2015 SCHNEIDER ELECTRIC BUILDINGS AUSTRALIA REPAIRS CCTV CASUARINA LIBRARY $303.60446 90877/6842-01 05/03/2015 MR J L TARCA PERFORMANCE FOR FACING TRACY $300.00447 90885/7037-01 12/03/2015 DARWIN LARGE ANIMAL MOBILE VET SERVICE VETERINARY SERVICES $300.00448 90898/5317-01 26/03/2015 BALANCE DIET CENTRE SUPERMARKET TOUR HEALTHY DARWIN PROJECT $300.00449 90885/5067-01 12/03/2015 EASYWEB DIGITAL SUPPLY ROUTER FOR GUARDIAN SYSTEM $299.50450 90898/4816-01 26/03/2015 MS C E DANDIE REIMBURSE COST OF RECREATION CENTRE FURNITURE $299.00451 90890/3756-01 19/03/2015 KAREN SHELDON CATERING CATERING SERVICES $297.50
90
90
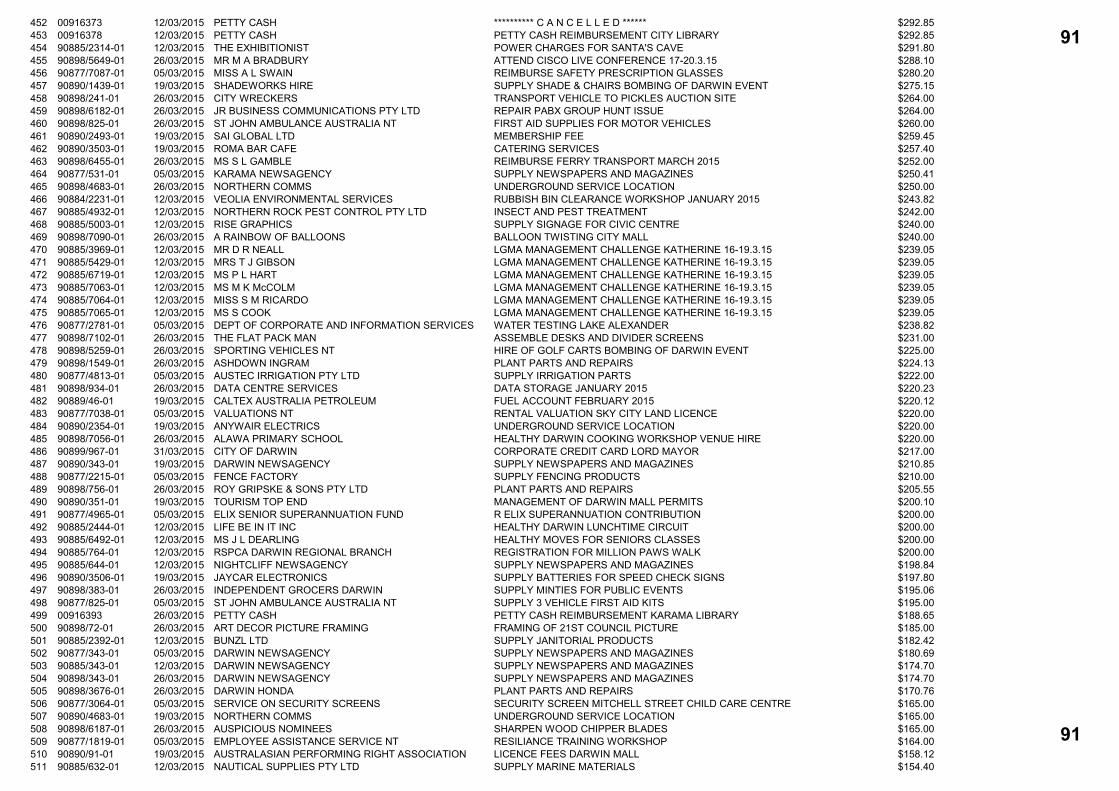
452 00916373 12/03/2015 PETTY CASH ********** C A N C E L L E D ****** $292.85453 00916378 12/03/2015 PETTY CASH PETTY CASH REIMBURSEMENT CITY LIBRARY $292.85454 90885/2314-01 12/03/2015 THE EXHIBITIONIST POWER CHARGES FOR SANTA'S CAVE $291.80455 90898/5649-01 26/03/2015 MR M A BRADBURY ATTEND CISCO LIVE CONFERENCE 17-20.3.15 $288.10456 90877/7087-01 05/03/2015 MISS A L SWAIN REIMBURSE SAFETY PRESCRIPTION GLASSES $280.20457 90890/1439-01 19/03/2015 SHADEWORKS HIRE SUPPLY SHADE & CHAIRS BOMBING OF DARWIN EVENT $275.15458 90898/241-01 26/03/2015 CITY WRECKERS TRANSPORT VEHICLE TO PICKLES AUCTION SITE $264.00459 90898/6182-01 26/03/2015 JR BUSINESS COMMUNICATIONS PTY LTD REPAIR PABX GROUP HUNT ISSUE $264.00460 90898/825-01 26/03/2015 ST JOHN AMBULANCE AUSTRALIA NT FIRST AID SUPPLIES FOR MOTOR VEHICLES $260.00461 90890/2493-01 19/03/2015 SAI GLOBAL LTD MEMBERSHIP FEE $259.45462 90890/3503-01 19/03/2015 ROMA BAR CAFE CATERING SERVICES $257.40463 90898/6455-01 26/03/2015 MS S L GAMBLE REIMBURSE FERRY TRANSPORT MARCH 2015 $252.00464 90877/531-01 05/03/2015 KARAMA NEWSAGENCY SUPPLY NEWSPAPERS AND MAGAZINES $250.41465 90898/4683-01 26/03/2015 NORTHERN COMMS UNDERGROUND SERVICE LOCATION $250.00466 90884/2231-01 12/03/2015 VEOLIA ENVIRONMENTAL SERVICES RUBBISH BIN CLEARANCE WORKSHOP JANUARY 2015 $243.82467 90885/4932-01 12/03/2015 NORTHERN ROCK PEST CONTROL PTY LTD INSECT AND PEST TREATMENT $242.00468 90885/5003-01 12/03/2015 RISE GRAPHICS SUPPLY SIGNAGE FOR CIVIC CENTRE $240.00469 90898/7090-01 26/03/2015 A RAINBOW OF BALLOONS BALLOON TWISTING CITY MALL $240.00470 90885/3969-01 12/03/2015 MR D R NEALL LGMA MANAGEMENT CHALLENGE KATHERINE 16-19.3.15 $239.05471 90885/5429-01 12/03/2015 MRS T J GIBSON LGMA MANAGEMENT CHALLENGE KATHERINE 16-19.3.15 $239.05472 90885/6719-01 12/03/2015 MS P L HART LGMA MANAGEMENT CHALLENGE KATHERINE 16-19.3.15 $239.05473 90885/7063-01 12/03/2015 MS M K McCOLM LGMA MANAGEMENT CHALLENGE KATHERINE 16-19.3.15 $239.05474 90885/7064-01 12/03/2015 MISS S M RICARDO LGMA MANAGEMENT CHALLENGE KATHERINE 16-19.3.15 $239.05475 90885/7065-01 12/03/2015 MS S COOK LGMA MANAGEMENT CHALLENGE KATHERINE 16-19.3.15 $239.05476 90877/2781-01 05/03/2015 DEPT OF CORPORATE AND INFORMATION SERVICES WATER TESTING LAKE ALEXANDER $238.82477 90898/7102-01 26/03/2015 THE FLAT PACK MAN ASSEMBLE DESKS AND DIVIDER SCREENS $231.00478 90898/5259-01 26/03/2015 SPORTING VEHICLES NT HIRE OF GOLF CARTS BOMBING OF DARWIN EVENT $225.00479 90898/1549-01 26/03/2015 ASHDOWN INGRAM PLANT PARTS AND REPAIRS $224.13480 90877/4813-01 05/03/2015 AUSTEC IRRIGATION PTY LTD SUPPLY IRRIGATION PARTS $222.00481 90898/934-01 26/03/2015 DATA CENTRE SERVICES DATA STORAGE JANUARY 2015 $220.23482 90889/46-01 19/03/2015 CALTEX AUSTRALIA PETROLEUM FUEL ACCOUNT FEBRUARY 2015 $220.12483 90877/7038-01 05/03/2015 VALUATIONS NT RENTAL VALUATION SKY CITY LAND LICENCE $220.00484 90890/2354-01 19/03/2015 ANYWAIR ELECTRICS UNDERGROUND SERVICE LOCATION $220.00485 90898/7056-01 26/03/2015 ALAWA PRIMARY SCHOOL HEALTHY DARWIN COOKING WORKSHOP VENUE HIRE $220.00486 90899/967-01 31/03/2015 CITY OF DARWIN CORPORATE CREDIT CARD LORD MAYOR $217.00487 90890/343-01 19/03/2015 DARWIN NEWSAGENCY SUPPLY NEWSPAPERS AND MAGAZINES $210.85488 90877/2215-01 05/03/2015 FENCE FACTORY SUPPLY FENCING PRODUCTS $210.00489 90898/756-01 26/03/2015 ROY GRIPSKE & SONS PTY LTD PLANT PARTS AND REPAIRS $205.55490 90890/351-01 19/03/2015 TOURISM TOP END MANAGEMENT OF DARWIN MALL PERMITS $200.10491 90877/4965-01 05/03/2015 ELIX SENIOR SUPERANNUATION FUND R ELIX SUPERANNUATION CONTRIBUTION $200.00492 90885/2444-01 12/03/2015 LIFE BE IN IT INC HEALTHY DARWIN LUNCHTIME CIRCUIT $200.00493 90885/6492-01 12/03/2015 MS J L DEARLING HEALTHY MOVES FOR SENIORS CLASSES $200.00494 90885/764-01 12/03/2015 RSPCA DARWIN REGIONAL BRANCH REGISTRATION FOR MILLION PAWS WALK $200.00495 90885/644-01 12/03/2015 NIGHTCLIFF NEWSAGENCY SUPPLY NEWSPAPERS AND MAGAZINES $198.84496 90890/3506-01 19/03/2015 JAYCAR ELECTRONICS SUPPLY BATTERIES FOR SPEED CHECK SIGNS $197.80497 90898/383-01 26/03/2015 INDEPENDENT GROCERS DARWIN SUPPLY MINTIES FOR PUBLIC EVENTS $195.06498 90877/825-01 05/03/2015 ST JOHN AMBULANCE AUSTRALIA NT SUPPLY 3 VEHICLE FIRST AID KITS $195.00499 00916393 26/03/2015 PETTY CASH PETTY CASH REIMBURSEMENT KARAMA LIBRARY $188.65500 90898/72-01 26/03/2015 ART DECOR PICTURE FRAMING FRAMING OF 21ST COUNCIL PICTURE $185.00501 90885/2392-01 12/03/2015 BUNZL LTD SUPPLY JANITORIAL PRODUCTS $182.42502 90877/343-01 05/03/2015 DARWIN NEWSAGENCY SUPPLY NEWSPAPERS AND MAGAZINES $180.69503 90885/343-01 12/03/2015 DARWIN NEWSAGENCY SUPPLY NEWSPAPERS AND MAGAZINES $174.70504 90898/343-01 26/03/2015 DARWIN NEWSAGENCY SUPPLY NEWSPAPERS AND MAGAZINES $174.70505 90898/3676-01 26/03/2015 DARWIN HONDA PLANT PARTS AND REPAIRS $170.76506 90877/3064-01 05/03/2015 SERVICE ON SECURITY SCREENS SECURITY SCREEN MITCHELL STREET CHILD CARE CENTRE $165.00507 90890/4683-01 19/03/2015 NORTHERN COMMS UNDERGROUND SERVICE LOCATION $165.00508 90898/6187-01 26/03/2015 AUSPICIOUS NOMINEES SHARPEN WOOD CHIPPER BLADES $165.00509 90877/1819-01 05/03/2015 EMPLOYEE ASSISTANCE SERVICE NT RESILIANCE TRAINING WORKSHOP $164.00510 90890/91-01 19/03/2015 AUSTRALASIAN PERFORMING RIGHT ASSOCIATION LICENCE FEES DARWIN MALL $158.12511 90885/632-01 12/03/2015 NAUTICAL SUPPLIES PTY LTD SUPPLY MARINE MATERIALS $154.40
91
91

512 90885/3374-01 12/03/2015 TAX ED PTY LTD FBT SEMINAR 2015 $154.00513 90885/825-01 12/03/2015 ST JOHN AMBULANCE AUSTRALIA NT ST JOHN VOLUNTEERS BOMBING OF DARWIN EVENT $150.00514 90890/6898-01 19/03/2015 AUSTRALIAN SCHOOL OF MEDITATION AND YOGA HATHA YOGA CLASSES $150.00515 90898/4986-01 26/03/2015 AUSTRALIA AND CHINA FRIENDSHIP SOCIETY TRADITIONAL DANCE PERFORMANCE HARMONY DAY $150.00516 90898/6683-01 26/03/2015 MR D COLLINS LAUNCH PAD ARTWORK $150.00517 90898/679-01 26/03/2015 CITY OF PALMERSTON RATES REFUND $150.00518 90898/7113-01 26/03/2015 MR A ROBINSON-STRANGE PHOTOGRAPHY SERVICES $150.00519 90877/3179-01 05/03/2015 CAFE 21 TRUST CATERING SERVICES $149.40520 90898/699-01 26/03/2015 TERRITORY PARTY HIRE HIRE EVENT EQUIPMENT $148.92521 90899/967-01 31/03/2015 CITY OF DARWIN CORPORATE CREDIT CARD INFRASTRUCTURE $147.00522 00916399 26/03/2015 ST MARYS FOOTBALL CLUB REFUND SECURITY DEPOSIT JINGILI AND MOIL OVALS $140.00523 90898/1771-01 26/03/2015 ACTION PRINT PTY LTD BUSINESS CARDS $140.00524 90899/967-01 31/03/2015 CITY OF DARWIN CORPORATE CREDIT CARD INFORMATION TECHNOLOGY $143.97525 90885/6362-01 12/03/2015 MR T K QUALL SUPERVISION OF WORKS MINDIL BEACH $135.00526 90885/1281-01 12/03/2015 DEPT OF LANDS AND PLANNING - LAND INFO CENTRE LAND TITLE SEARCHES $132.00527 90885/2105-01 12/03/2015 JAC TRADERS PTY LTD EMBROIDERY SERVICES $132.00528 90885/4684-01 12/03/2015 ALDERMAN R M KNOX REIMBURSE ALGWA REGISTRATION & BREAKFAST $130.30529 90898/310-01 26/03/2015 DARWIN BOLT SUPPLIES PLANT PARTS AND REPAIRS $127.05530 90890/5773-01 19/03/2015 INTERNODE BROADBAND NBNTP PLATINUM CHARGES $124.95531 90881/3160-01 12/03/2015 LITCHFIELD COUNCIL PAYROLL DEDUCTION $121.00532 90893/3160-01 26/03/2015 LITCHFIELD COUNCIL PAYROLL DEDUCTION $121.00533 90874/3103-01 05/03/2015 DARWIN COUNCIL SOCIAL CLUB PAYROLL DEDUCTION $120.00534 90888/3103-01 19/03/2015 DARWIN COUNCIL SOCIAL CLUB PAYROLL DEDUCTION $120.00535 90898/2427-01 26/03/2015 RHINO INDUSTRIAL PTY LTD PLANT PARTS AND REPAIRS $118.58536 90874/679-01 05/03/2015 CITY OF PALMERSTON PAYROLL DEDUCTION $110.00537 90888/679-01 19/03/2015 CITY OF PALMERSTON PAYROLL DEDUCTION $110.00538 90898/279-01 26/03/2015 ASSOCIATED MASONRY SUPPLIES PLANT PARTS AND REPAIRS $106.70539 90885/3961-01 12/03/2015 INTELLITRAC STREET SWEEPER TRACKING JANUARY 2015 $105.60540 90890/3961-01 19/03/2015 INTELLITRAC STREET SWEEPER TRACKING FEBRUARY 2015 $105.60541 90877/1555-01 05/03/2015 PALM SPRINGS DISTRIBUTORS SUPPLY BOTTLED SPRING WATER CONTAINERS $105.00542 90890/7104-01 19/03/2015 MRS M S JONES RATES REFUND $104.62543 90898/4504-01 26/03/2015 DON KYATT SPARE PARTS NT PTY LTD PLANT PARTS AND REPAIRS $103.62544 90877/4394-01 05/03/2015 K MCCARTHY MUSICAL PERFORMANCE CITY LIBRARY $100.00545 90877/6278-01 05/03/2015 SCOTT MURPHY MUSICAL PERFORMANCE CASUARINA LIBRARY $100.00546 90877/6705-01 05/03/2015 MS A L KENT RESEARCH CONSULTANCY YOUTH STRATEGY $100.00547 90877/7067-01 05/03/2015 L BLAKEMORE REFUND SECURITY DEPOSIT BICENTENNIAL PARK $100.00548 00916374 12/03/2015 CITY OF DARWIN REIMBURSE TEMPORARY MEMBERSHIP FLOAT $100.00549 90885/4607-01 12/03/2015 MR D GARNHAM MUSICAL PERFORMANCE CASUARINA LIBRARY $100.00550 90885/6472-01 12/03/2015 MR C POWLING MUSICAL PERFORMANCE CASUARINA LIBRARY $100.00551 90890/4607-01 19/03/2015 MR D GARNHAM MUSICAL PERFORMANCE CITY LIBRARY $100.00552 90890/6278-01 19/03/2015 SCOTT MURPHY MUSICAL PERFORMANCE CASUARINA LIBRARY $100.00553 00916396 26/03/2015 CITY OF DARWIN REIMBURSE TEMPORARY MEMBERSHIP FLOAT $100.00554 00916397 26/03/2015 CITY OF DARWIN REIMBURSE TEMPORARY MEMBERSHIP FLOAT $100.00555 90898/4394-01 26/03/2015 K MCCARTHY MUSICAL PERFORMANCE CITY LIBRARY $100.00556 90898/7115-01 26/03/2015 MR F MOMUAT REFUND SECURITY DEPOSIT EAST POINT RESERVE $100.00557 90881/553-01 12/03/2015 LHMU - NT BRANCH PAYROLL DEDUCTION $99.00558 90893/553-01 26/03/2015 LHMU - NT BRANCH PAYROLL DEDUCTION $99.00559 90898/908-01 26/03/2015 WOOLWORTHS LIMITED WEIGHBRIDGE SUPPLIES $98.43560 90890/6422-01 19/03/2015 MS C TAYLOR REIMBURSE PUBLIC TRANSPORT $98.00561 90877/6189-01 05/03/2015 DARWIN PODIATRY CLINIC PODIATRY SERVICES $95.00562 90890/1555-01 19/03/2015 PALM SPRINGS DISTRIBUTORS SUPPLY BOTTLED SPRING WATER CONTAINERS $94.50563 90885/5139-01 12/03/2015 COLD ROCK ICE CREAMERY CATERING SERVICES $93.00564 90898/3503-01 26/03/2015 ROMA BAR CAFE CATERING SERVICES $92.95565 90898/37-01 26/03/2015 ALL PETS VET HOSPITAL VETERINARY SERVICES $89.10566 90885/5069-01 12/03/2015 MS M A DONOHUE REIMBURSE PUBLIC TRANSPORT $86.00567 90898/1786-01 26/03/2015 BORAL PLASTERBOARD SUPPLY CEILING TILES CIVIC CENTRE $85.54568 90890/6814-01 19/03/2015 CULTURAL DEVELOPMENT NETWORK NATIONAL LOCAL GOVERNMENT CULTURAL FORUM $85.00569 90885/2423-01 12/03/2015 PRECISION ENGRAVING UPDATE ELECTED MEMBERS PLAQUE $84.00570 00916394 26/03/2015 TERRITORY LANDSCAPES REIMBURSE ACCOUNT CREDIT BALANCE $82.99571 90877/436-01 05/03/2015 CHUBB FIRE & SECURITY PTY LTD ALARM RESPONSE NIGHTCLIFF LIBRARY $82.50
92
92

572 90898/2417-01 26/03/2015 MRS K A CONWAY ATTEND PUBLIC LIBRARIES NT MEETING KATHERINE $81.50573 90885/7013-01 12/03/2015 MR M E LAUBE REIMBURSE ACCOUNT CREDIT BALANCE $81.00574 90899/967-01 31/03/2015 CITY OF DARWIN CORPORATE CREDIT CARD LIBRARIES $80.94575 90899/967-01 31/03/2015 CITY OF DARWIN CORPORATE CREDIT CARD FINANCE $80.00576 90889/2231-01 19/03/2015 VEOLIA ENVIRONMENTAL SERVICES RUBBISH BIN CLEARANCES $79.20577 90899/967-01 31/03/2015 CITY OF DARWIN CORPORATE CREDIT CARD CEO $75.10578 90890/7098-01 19/03/2015 CLONTARF FOUNDATION REFUND SECURITY DEPOSIT GARDENS OVAL $70.00579 90898/315-01 26/03/2015 DARWIN BUSINESS MACHINES PTY LTD SUPPLY CASH REGISTER ROLLS $69.90580 90877/6128-01 05/03/2015 MR R DYRTING REIMBURSE PUBLIC TRANSPORT $69.00581 90898/1013-01 26/03/2015 CABCHARGE AUSTRALIA PTY LTD TAXI FARES LIBRARIES $67.10582 90898/993-01 26/03/2015 WINDSCREEN TERRITORY PLANT PARTS AND REPAIRS $66.00583 90885/3612-01 12/03/2015 JB HI-FI GROUP PTY LTD LIBRARY RESOURCES $64.95584 90890/4398-01 19/03/2015 ABORIGINAL AREAS PROTECTION AUTHORITY APPLICATION FEE MINDIL BEACH DUNE FENCING $63.00585 90877/3173-01 05/03/2015 DARWIN METAL INDUSTRIES SUPPLY GALVANISED COVERS $60.50586 90890/6027-01 19/03/2015 WORKPRO NATIONAL POLICE CHECKS $60.50587 90898/2423-01 26/03/2015 PRECISION ENGRAVING SUPPLY NAME BADGES $60.00588 90877/3612-01 05/03/2015 JB HI-FI GROUP PTY LTD SUPPLY PROJECTOR CABLE $59.00589 90885/1066-01 12/03/2015 ALLORA GARDENS NURSERY SUPPLY HAY BALES $55.00590 90877/3563-01 05/03/2015 QBD THE BOOKSHOP LIBRARY RESOURCES $53.85591 00916367 05/03/2015 TELSTRA CORPORATION LIMITED PAYROLL DEDUCTION $50.00592 00916389 19/03/2015 TELSTRA CORPORATION LIMITED PAYROLL DEDUCTION $50.00593 00916384 19/03/2015 GENEVIEVE KEOGH REFUND DUPLICATE ANIMAL REGISTRATION $46.00594 90898/2895-01 26/03/2015 ENTITY 1 PTY LTD RENEWAL OF DOMAIN 2 YEARS TOPROC WEBSITE $45.10595 90898/2717-01 26/03/2015 REWARD DISTRIBUTION SUPPLY FORKS & TEA TOWELS $44.83596 90898/1555-01 26/03/2015 PALM SPRINGS DISTRIBUTORS SUPPLY BOTTLED SPRING WATER CONTAINERS $42.00597 90898/3914-01 26/03/2015 NT AUTOMOTIVE GROUP PLANT PARTS AND REPAIRS $40.13598 90899/967-01 31/03/2015 CITY OF DARWIN CORPORATE CREDIT CARD ANNUAL FEE $40.00599 90899/967-01 31/03/2015 CITY OF DARWIN CORPORATE CREDIT CARD ANNUAL FEE $40.00600 90899/967-01 31/03/2015 CITY OF DARWIN CORPORATE CREDIT CARD ANNUAL FEE $40.00601 90899/967-01 31/03/2015 CITY OF DARWIN CORPORATE CREDIT CARD ANNUAL FEE $40.00602 00916375 12/03/2015 NEAL ADAMS REFUND INFRINGEMENT NOTICE $40.00603 90898/6996-01 26/03/2015 MS J WONG REIMBURSE PUBLIC TRANSPORT $40.00604 00916370 05/03/2015 JPF & DL WHITFIELD REIMBURSE COSTS OF NEW LETTER BOX $39.95605 90898/744-01 26/03/2015 REPCO AUTO PARTS PLANT PARTS AND REPAIRS $38.41606 90898/1486-01 26/03/2015 A NOBLE & SON LTD PLANT PARTS AND REPAIRS $33.53607 90898/3021-01 26/03/2015 CITY TYRE SERVICE TYRE FITTING AND MAINTENANCE SERVICE $30.00608 90898/1170-01 26/03/2015 H D PUMPS PLANT PARTS AND REPAIRS $28.20609 90877/3143-01 05/03/2015 DARWIN FRESHAIR SENTINEL REFILLS WESTLANE CARPARK $28.15610 90885/157-01 12/03/2015 HITACHI CONSTRUCTION MACHINERY PLANT PARTS AND REPAIRS $27.06611 90881/597-01 12/03/2015 MERCANTILE MUTUAL LIFE PAYROLL DEDUCTION $25.00612 90893/597-01 26/03/2015 MERCANTILE MUTUAL LIFE PAYROLL DEDUCTION $25.00613 90874/600-01 05/03/2015 AUSTRALIAN MANUFACTURING WORKERS UNION PAYROLL DEDUCTION $24.40614 90881/600-01 12/03/2015 AUSTRALIAN MANUFACTURING WORKERS UNION PAYROLL DEDUCTION $24.40615 90888/600-01 19/03/2015 AUSTRALIAN MANUFACTURING WORKERS UNION PAYROLL DEDUCTION $24.40616 90893/600-01 26/03/2015 AUSTRALIAN MANUFACTURING WORKERS UNION PAYROLL DEDUCTION $24.40617 90890/153-01 19/03/2015 BIG W DEPARTMENT STORE LIBRARY RESOURCES $22.80618 90898/3344-01 26/03/2015 UES PTY LTD PLANT PARTS AND REPAIRS $22.27619 90885/1555-01 12/03/2015 PALM SPRINGS DISTRIBUTORS SUPPLY BOTTLED SPRING WATER CONTAINERS $21.00620 90890/7096-01 19/03/2015 MRS S S MCDOWALL REIMBURSE PUBLIC TRANSPORT $20.00621 90899/967-01 31/03/2015 CITY OF DARWIN CORPORATE CREDIT CARD PEOPLE, CULTURE AND CAPABILITY $8.95622 00916376 12/03/2015 SHEREE HANSEN REFUND PRO-RATA ANIMAL REGISTRATION $7.50623 90890/679-01 19/03/2015 CITY OF PALMERSTON RATES REFUND $1.67
Total $17,085,396.64Less: Value of CANCELLED Cheques included in Total $1,109.90Total for Fund 5 $17,084,286.74
Trust Cheques
Total $0.00Less: Value of CANCELLED Cheques included in Total $0.00Total for Fund 6 $0.00
93
93

ENCL: YES
CORPORATE & ECONOMIC DEVELOPMENT COMMITTEE/OPEN
AGENDA ITEM: 9.4
DEPRECIATION EXPENSE 2015
REPORT No.: 15A0060 MC:mp COMMON No.: 2999553 DATE: 22/04/2015
Presenter: Manager Finance, Miles Craighead Approved: General Manager Corporate Services, Diana Leeder PURPOSE The purpose of this report is to inform the Committee in relation to the projected depreciation expense 2014/15. LINK TO STRATEGIC PLAN The issues addressed in this Report are in accordance with the following Goals/Strategies of the City of Darwin 2012 – 2016 as outlined in the ‘Evolving Darwin Towards 2020 Strategic Plan’:- Goal 5 Effective and Responsible Governance Outcome 5.5 Responsible financial and asset management Key Strategies 5.5.1 Manage Council’s business based on a sustainable financial and asset
management strategy KEY ISSUES Actual depreciation expense 2014/15 is expected to significantly exceed original
budget. The original budget was based on the projected depreciation expense 2013/14
(in accord with the adopted budget parameters). The factors influencing actual depreciation expense this financial year are
complex and include; revaluation of infrastructure assets as at 30 June 2014, a review of components (mainly roads), reviews of useful/remaining lives and significant recognition of asset additions including past years works in progress etc.
Some of the increase is a one off effect and does not recur.
94
94
PAGE: 2 REPORT NUMBER: 15A0060 MC:mp SUBJECT: DEPRECIATION EXPENSE 2015 RECOMMENDATIONS THAT the Committee resolve under delegated authority:- THAT Report Number 15A0060 MC:mp entitled Depreciation Expense 2015, be received and noted. BACKGROUND Chief Officers Group, 2 December 2013 Accounting for Infrastructure Assets and Revaluation Report No. 13A0203 (02/12/2013) Common No. 2649595. A. THAT Report Number 13A0203 MC:ns entitled Accounting for Infrastructure
Assets and Revaluation, be received and noted. B. THAT the proposals to account for infrastructure assets be endorsed in
principle subject to further updates/advice including costs before a final commitment is made and as the project progresses.
C. THAT the proposed revaluation project timetable be endorsed.
Corporate & Economic Development Committee, 19 February 2014 DECISION NO.21\1805 (19/02/14) Revaluation Exercise for Roads and other Infrastructure Assets as at 30 June 2014 Report No. 14A0011 MC:ns (19/02/14) Common No. 2649595 THAT the Committee resolve under delegated authority:- THAT Report Number 14A0011 MC:ns entitled Revaluation Exercise for Roads and other Infrastructure Assets as at 30 June 2014, be received and noted. Both the above reports discussed in detail the need to ensure the infrastructure revaluation as at 30 June 2014 was prepared to facilitate improvements to Council’s practices in relation to accounting for infrastructural assets. In particular the recognition of horizontal and vertical components for roads where the useful lives are significantly different including: Identification of horizontal sections Formation, earthworks or cutting Road base or pavement Running/wearing surface
95
95

PAGE: 3 REPORT NUMBER: 15A0060 MC:mp SUBJECT: DEPRECIATION EXPENSE 2015 It should be noted that none of this is considered to alter the Council’s policies in relation to accounting for assets and depreciation. The work carried out has been a revaluation, an in depth review of relevant components and the associated useful lives. Thus it is an improvement and enhancement of the components and associated depreciation expense. The revaluation increased infrastructure assets “fair value” by:
Risk Management & Audit Committee, 27 March 2015 Depreciation Expense Report No. 15A0034 DL:mp (27/03/15) Common No. 2999553 THAT the Committee resolve under delegated authority:- A. THAT Report Number 15A0034 DL:mp entitled Depreciation Expense 2015, be
received and noted.
B. THAT a report be prepared on Depreciation Expense 2015 for the Corporate & Economic Development Committee.
DISCUSSION Actual depreciation 2014/15 is projected to significantly exceed budget as indicated in the following table:
2014/15 Depreciation Expense
2014/15 $
One off depreciation adjustments 1.7MPlus annual depreciation 20.8MTotal projected depreciation 22.5MOriginal budget 16.8M
Up to 31 January 2015 the depreciation expense recognised in monthly financial reports presented to Council was based on the original budget but with an explanatory note.
Revaluation (refer to note 14 to the Financial statements for the year ended 2014)
Fair value Less Reval. Fair valueInc reval Exc reval % inc
Roads & pathways 521,112 175,106 346,006 50.61%Stormwater drainage 320,821 8,659 312,162 2.77%Other infrastructure 28,638 8,634 20,004 43.16%
Total infrastructure 870,571 192,399 678,172 28.37%
96
96

PAGE: 4 REPORT NUMBER: 15A0060 MC:mp SUBJECT: DEPRECIATION EXPENSE 2015 The original budgeted depreciation expense in turn, was based on previous years actual costs/trends due to the difficulty of making a reliable prediction given the complex and unknown factors such as the implications of revaluations, additions, disposals, reviews of components and remaining lives etc. However Finance did suggest around the time of the commencement of revaluation that on balance there were likely to be significant increases. Within Local Government there are some different approaches including those which rely on a condition curve approach where depreciation recognised initially is less and then accelerates towards the end of the asset life. This is a complex area and was considered by the cross department revaluation team which ultimately preferred straight line depreciation as it was more transparent, could be easily managed internally and also considered a reasonable reflection of the decline in asset value over its life. The decisions and recommendations regarding useful asset lives and residual values were not within the expertise of Finance staff and thus came from recommendations by the Consultants in consultation with Infrastructure staff. The degree of confidence with the calculated infrastructure depreciation annual recurring expense 2014/15 is high. Based on the agreed assumptions and parameters Finance has processed the data independently through the integrated Civica assets accounting register to arrive at the same infrastructure depreciation expense figures for 2014/15 as the predictions supplied by the appointed valuers and advisers (APV). The degree of confidence with the one off implications (additional $1.7M) is lower and may require refinement. Attachment A to this report illustrates some of the detailed changes to take place in useful lives and depreciation rates as a result of the review in conjunction with the revaluation. These will be reflected at a summarised level in Note 1 in the audited Financial Statements 2014/15. Attachment B to this report is the independent report on the revaluation of assets for the City of Darwin 2015 (prepared by APV). CONSULTATION PROCESS Chief Officers Group, Corporate Economic Development Committee, Risk Management and Audit Committee, Infrastructure Staff, External Audit and Assets Accountant have been consulted at various times through the process of the 30 June 2014 infrastructure revaluation and decisions leading to the depreciation calculations.
97
97

PAGE: 5 REPORT NUMBER: 15A0060 MC:mp SUBJECT: DEPRECIATION EXPENSE 2015 POLICY IMPLICATIONS There are no proposed accounting policy changes from the point of view of the Financial Statement preparation. The policy continues to be one of identifying components and related useful lives. BUDGET AND RESOURCE IMPLICATIONS An additional depreciation expense of indicatively up to $5.7M (above original budget) does not affect the Council’s cash or fund flow budget. However it does require recognising a deterioration in Income Statement result by an indicative $5.7M (from original budget). This additional expense is being factored into the 3rd quarter budget review. In the meantime appropriate notes were built into the monthly financial reporting and the 2nd quarter budget review. Referring to the Long Term Financial Plan 2014-24 the depreciation expense of $20.6M in there for the current year (base) is far more reflective and allows for substantially all of these factors excluding the one off affect. RISK/LEGAL/LEGISLATIVE IMPLICATIONS The actions taken to improve the infrastructure asset accounting (mainly roads) are considered necessary and not simply a case of “best practice”. It is considered that Council would be risking audit qualification to not continually review, update and maintain its asset accounting in accordance with current generally accepted accounting practice ENVIRONMENTAL IMPLICATIONS Nil
98
98

PAGE: 6 REPORT NUMBER: 15A0060 MC:mp SUBJECT: DEPRECIATION EXPENSE 2015 COUNCIL OFFICER CONFLICT OF INTEREST DECLARATION We the Author and Approving Officers declare that we do not have a Conflict of Interest in relation to this matter. MILES CRAIGHEAD DIANA LEEDERMANAGER FINANCE GENERAL MANAGER
CORPORATE SERVICES For enquiries, please contact Miles Craighead on 89300523 or email: [email protected]. Attachments: Attachment A: Summary of Useful lives and Residual Values Attachment B: Valuation of City of Darwin (Infrastructure) 30 June 2014 (APV)
99
99
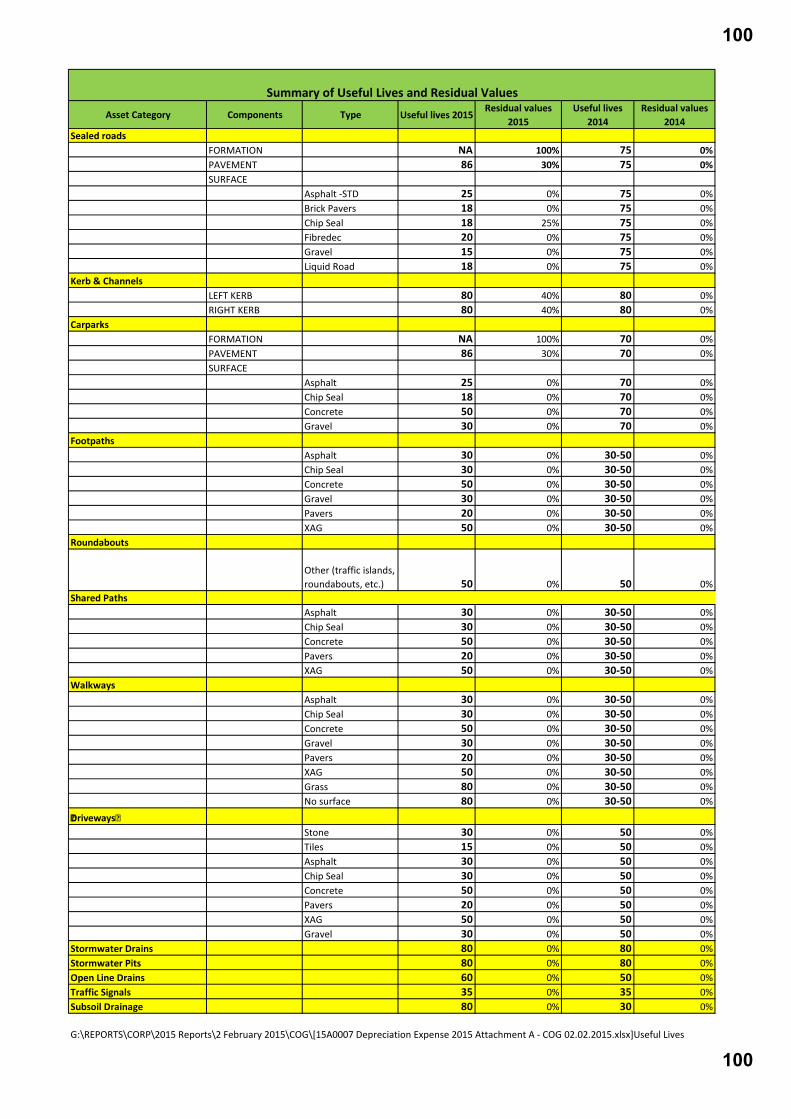
Asset Category Components Type Useful lives 2015Residual values
2015Useful lives
2014Residual values
2014Sealed roads
FORMATION NA 100% 75 0%PAVEMENT 86 30% 75 0%SURFACE
Asphalt -STD 25 0% 75 0%Brick Pavers 18 0% 75 0%Chip Seal 18 25% 75 0%Fibredec 20 0% 75 0%Gravel 15 0% 75 0%Liquid Road 18 0% 75 0%
Kerb & ChannelsLEFT KERB 80 40% 80 0%RIGHT KERB 80 40% 80 0%
CarparksFORMATION NA 100% 70 0%PAVEMENT 86 30% 70 0%SURFACE
Asphalt 25 0% 70 0%Chip Seal 18 0% 70 0%Concrete 50 0% 70 0%Gravel 30 0% 70 0%
FootpathsAsphalt 30 0% 30-50 0%Chip Seal 30 0% 30-50 0%Concrete 50 0% 30-50 0%Gravel 30 0% 30-50 0%Pavers 20 0% 30-50 0%XAG 50 0% 30-50 0%
Roundabouts
Other (traffic islands, roundabouts, etc.) 50 0% 50 0%
Shared PathsAsphalt 30 0% 30-50 0%Chip Seal 30 0% 30-50 0%Concrete 50 0% 30-50 0%Pavers 20 0% 30-50 0%XAG 50 0% 30-50 0%
WalkwaysAsphalt 30 0% 30-50 0%Chip Seal 30 0% 30-50 0%Concrete 50 0% 30-50 0%Gravel 30 0% 30-50 0%Pavers 20 0% 30-50 0%XAG 50 0% 30-50 0%Grass 80 0% 30-50 0%No surface 80 0% 30-50 0%
DrivewaysStone 30 0% 50 0%Tiles 15 0% 50 0%Asphalt 30 0% 50 0%Chip Seal 30 0% 50 0%Concrete 50 0% 50 0%Pavers 20 0% 50 0%XAG 50 0% 50 0%Gravel 30 0% 50 0%
Stormwater Drains 80 0% 80 0%Stormwater Pits 80 0% 80 0%Open Line Drains 60 0% 50 0%Traffic Signals 35 0% 35 0%Subsoil Drainage 80 0% 30 0%
G:\REPORTS\CORP\2015 Reports\2 February 2015\COG\[15A0007 Depreciation Expense 2015 Attachment A - COG 02.02.2015.xlsx]Useful Lives
Summary of Useful Lives and Residual Values
100
100
Valuation of City of Darwin Infrastructure Assets Roads, Stormwater & Other Assets Revaluation of Non Current Assets in Accordance with Australian Accounting Standards 30 June 2014 Reference: 11914 Final Report: 30 June 2014
101
101

APV Valuers and Asset Management 2
Table of Contents
Contents
Introduction ....................................................................................................................... 3
Instructions ....................................................................................................................... 4 Definitions ....................................................................................................................................... 4 Special Factors ............................................................................................................................... 5 Asset Recognition Thresholds ........................................................................................................ 5
Certificate of Value ........................................................................................................... 6
AASB 13 Fair Value Disclosures ..................................................................................... 7 Suggested Policy Note ................................................................................................................... 8 Specific Information ........................................................................................................................ 8 Highest and Best Use ..................................................................................................................... 8 Valuation Techniques and Inputs .................................................................................................... 9 Fair Value Sensitivity to Unobservable Inputs ............................................................................... 11 Suggested description of valuation processes .............................................................................. 12
Valuation Results ............................................................................................................ 14 General......................................................................................................................................... 14 Analysis of Results ....................................................................................................................... 14
Valuation Methodology .................................................................................................. 18 Basis of Valuation ......................................................................................................................... 18 Valuation Techniques ................................................................................................................... 21
Valuation Processes ....................................................................................................... 32 General......................................................................................................................................... 32 Project Staff .................................................................................................................................. 32 Quality Management..................................................................................................................... 33 Meetings and Discussions ............................................................................................................ 34 Confirmation of Assumptions ........................................................................................................ 34 Valuation of a Complete and Accurate Asset Register .................................................................. 35 Sources of Data ............................................................................................................................ 36
Limitations ...................................................................................................................... 39
Schedule of Values ......................................................................................................... 41
Date: Prepared by: Approved by:
30 June 2014 B McLaren / D Edgerton Alfio Ponticello
102
102

APV Valuers and Asset Management 3
Introduction
This valuation was completed by APV Valuers & Asset Management under instruction from City of Darwin. We have no financial interest (past, present or prospective) in the assets covered in this document and this valuation is free of any bias.
The valuation was undertaken on the following basis:
Asset class Basis of valuation Effective date of valuation
Roads & Pathways
Stormwater drainage
Other Infrastructure assets (traffic signals, car parks
Fair Value 30 June 2014
Assets Not Included within the Valuation Scope
There are a number of asset classes which are not included within this financial reporting
valuation. These are as follows:
Portable and attractive assets
Landscaping (soft)
Second or other additional driveways constructed on individual premises
Inspection and provision of this valuation is in advance of the valuation date and therefore it is
assumed that there is no material change in asset values within the intervening period. If material
changes to assets occur before 30 June 2014, we reserve the right to revise the valuation
accordingly. Changes may include:
Recognition of new assets or deletions (sold / demolished / written off) since inspection
Recognition of major capital works completed since inspection
Recognition of impairment issues within existing assets since inspection
103
103

APV Valuers and Asset Management 4
Instructions In accordance with the instructions issued by the City of Darwin we have inspected the Roads,
Storm Water & Other infrastructure assets situated within City of Darwin boundaries to carry out a
revaluation of the non-current assets for financial reporting purposes in accordance with the
Australian Accounting Standards. These included (where appropriate) –
AASB 13 Fair Value Measurement
AASB 116 Property Plant and Equipment
AASB 5 Assets Held for Sale
AASB 136 Impairment
The valuation was conducted in accordance with specific instructions provided by council. These
included using the straight-line method of depreciation and adopting Residual Values (where
indicted) for all calculations.
This assessment is solely for the use of the City of Darwin and cannot be relied on by any other
party for any purpose whatsoever without our express written permission. No responsibility
whatsoever will be accepted for photocopied signatures.
Definitions In accordance with AASB 13 Fair Value Measurement the following definition has been applied for
Fair Value. It should be noted that as a consequence of the adoption of AASB 13 Fair Value
Measurement the previous definition in all other accounting standards has been changed to reflect
the new definition.
The price that would be received to sell an asset or paid to transfer a liability in an
orderly transaction between market participants at the measurement date.
Fair value is a market-based measurement, not an entity-specific measurement. For some assets
and liabilities, observable market transactions or market information might be available. For other
assets and liabilities, observable market transactions and market information might not be
available. However, the objective of a fair value measurement in both cases is the same – to
estimate the price at which an orderly transaction to sell the asset or to transfer the liability would
take place between market participants at the measurement date under current market conditions
(i.e. an exit price at the measurement date from the perspective of a market participant that holds
the asset or owes the liability).
104
104

APV Valuers and Asset Management 5
Except in the circumstance of an asset held for sale (valued in accordance with AASB 5 Assets
Held for Sale), the balance of the portfolio is valued in accordance with AASB 116 Property Plant
and Equipment at Fair Value.
Special Factors
The Valuers declare that they have no pecuniary interest past, present or prospective in the
subject assets and this valuation is free of any bias.
Asset Recognition Thresholds After discussions with the City of Darwin asset recognition thresholds have been adopted for each
asset class at the following levels;
Table 1 - Asset Recognition Thresholds
Asset class Level
Roads & Pathways
Stormwater drainage
Other Infrastructure assets (traffic signals, car parks
$5000
105
105

APV Valuers and Asset Management 6
Certificate of Value LOCATION: City of Darwin
ASSET DESCRIPTION: The whole of the within described infrastructure assets
DATE OF INSPECTION: 8 May 2014
DATE OF VALUATION: 30 June 2014
VALUATION: In our opinion the respective fair values of the assets covered by this valuation report are assessed as follows. Depending on the nature of the asset and valuation approach adopted, the Gross is disclosed either at Replacement Cost (RC) or Market Value (MV):
These may be apportioned in accordance with the attached schedule of values. Signed for and on behalf of APV Valuers & Asset Management
Bryce McLaren 30/06/2014
Road 356,441,609 87,710,670 268,730,939 Kerb and Channel 71,221,732 13,431,283 57,790,449 Car Park 23,929,950 6,957,562 16,972,388 Footpath 44,965,830 9,660,615 35,305,214 Roundabout 722,304 288,173 434,131 Shared 13,370,583 4,025,546 9,345,037 Walkways 4,737,079 1,746,025 2,991,054 Stormwater Drain 282,582,125 131,739,494 150,842,631 Stormwater Pit 30,902,661 18,270,485 12,632,176 Driveway 29,652,533 5,073,666 24,578,867 Open Drain 5,734,089 1,870,309 3,863,780 Traffic Signal 4,708,500 2,454,100 2,254,400 Subsoil Drainage 1,601,877 116,241 1,485,636
Total $870,570,870 $283,344,168 $587,226,702
Asset Gross (RC or MV)
Accumulated Depreciation Fair Value
106
106
APV Valuers and Asset Management 7
AASB 13 Fair Value Disclosures
AASB 13 Fair Value Measurement introduces a range of –
New concepts
New processes
New disclosure requirements
The new concepts include maximising the use of relevant observable inputs and minimise the use
of unobservable inputs. There are three levels -
Level 1: are quoted prices (unadjusted) in active markets for identical assets or liabilities
that the entity can access at the measurement date.
Level 2: are other than quoted prices included within Level 1 that are observable for the
asset or liability, either directly or indirectly.
Level 3: are unobservable inputs for the asset or liability.
While superficially the changes from the pre-AASB 13 version of AASB 116 appear minor, the
impact of the changes results in the need for some subtle changes in the valuation process and
the presentation of data. These changes include –
the process to develop the valuations
the creation of different asset classes (Asset Hierarchy: based on level of valuation input
and nature of the assets and associated valuation techniques and inputs) for the purpose of
AASB 13 disclosures
additional information required to enable entities to fulfil new disclosure requirements.
As a consequence of the new requirements of AASB 13 Fair Value Measurement, the APV
methodology and outputs of the valuation have been enhanced. This includes –
Valuation Report incorporating –
o Analysis of the valuation results
o Detailed methodology and description about the valuation processes used
o Detailed description of valuation inputs and techniques
o Narrative description of the sensitivity of the fair value measurement to changes in
unobservable inputs
o Quantitative information about the significant unobservable inputs
o Details around the selection of highest and best use where it is deemed to be
different than its current use.
107
107
APV Valuers and Asset Management 8
Excel spreadsheets setting out –
o Significant valuation inputs and techniques
o Level of Valuation Input reported for each asset
o Asset Class for each asset to enable new disclosures per AASB13
Draft Disclosure Notes
o Suggests disclosures to be incorporated into the financial statements
o Designed to satisfy the requirements of AASB 13 Fair Value
Suggested Policy
o Covering key areas of the AASB 13 Fair Value Measurement
o Designed to simplify the valuation process and associated disclosure requirements
Suggested Policy Note
The policy of the entity is to recognise transfers into and transfers out of the fair value hierarchy
levels as at the end of the reporting period.
Specific Information The following information sets out a range of information required to be incorporated into the
disclosure notes. They include –
Details around the selection of highest and best use where it is deemed to be different than
its current use.
Suggested description of the valuation techniques and inputs
Sensitivity of the fair value measurement to changes in unobservable inputs
Suggested description of the valuation processes
Highest and Best Use There were no assets valued where it was assumed that the highest and best use was other than
its current use.
108
108

APV Valuers and Asset Management 9
Valuation Techniques and Inputs
The following table summarises in a tabular format the valuation inputs and techniques used to
determine the Fair value for each asset class.
Table 2 – Valuation Inputs and Techniques
The following provides some suggested disclosures. They will require tailoring by City of Darwin
council as appropriate.
Valuation techniques used to derive fair values
(i) Recurring fair value measurements
The following methods are used to determine the fair value measurements.
Road Network and Stormwater Infrastructure
All road network infrastructure assets were valued using level 3 valuation inputs using the
cost approach.
Road 3 Cost Approach 356,441,609 87,710,670 268,730,939 7,299,175
Kerb and Channel 3 Cost Approach 71,221,732 13,431,283 57,790,449 534,163
Car Park 3 Cost Approach 23,929,950 6,957,562 16,972,388 556,060
Footpath 3 Cost Approach 44,965,830 9,660,615 35,305,214 994,350
Roundabout 3 Cost Approach 722,304 288,173 434,131 14,446
Shared 3 Cost Approach 13,370,583 4,025,546 9,345,037 390,283
Walkways 3 Cost Approach 4,737,079 1,746,025 2,991,054 155,051
Stormwater Drain 3 Cost Approach 282,582,125 131,739,494 150,842,631 3,532,277
Stormwater Pit 3 Cost Approach 30,902,661 18,270,485 12,632,176 386,283
Driveway 3 Cost Approach 29,652,533 5,073,666 24,578,867 694,623
Open Drain 3 Cost Approach 5,734,089 1,870,309 3,863,780 95,223
Traffic Signal 3 Cost Approach 4,708,500 2,454,100 2,254,400 134,529
Subsoil Drainage 3 Cost Approach 1,601,877 116,241 1,485,636 20,023
Total $870,570,870 $283,344,168 $587,226,702 $14,806,485
Depreciaton Expense Asset Level of
Valuation Input Valuation Technique Gross (RC or MV) Accumulated Depreciation Fair Value
109
109

APV Valuers and Asset Management 10
The approach estimated the replacement cost for each asset by componentising the assets
into significant parts with different useful lives and taking into account a range of factors.
While the unit rates based on square metres or similar capacity could be supported from
market evidence (level 2) other inputs (such as estimates of residual value, useful life,
pattern of consumption and asset condition) required extensive professional judgement and
impacted significantly on the final determination of fair value. As such these assets were
classified as having been valued using level 3 valuation inputs. The observable market
evidence used to support the unit rates included evidence from actual construction
contracts, comparison to rates adopted by reference councils and against industry
construction cost guides.
During the year there were a number of new projects completed where the actual cost was
recorded and the impact of depreciation at year end was negligible. While these could be
classified as valued at level 2 given the low proportion of the total portfolio that these
represented and the likelihood that in future valuations they would most likely be valued at
level 3 we have adopted a policy that all road network infrastructure assets are deemed to
be valued at level 3.
The quantitative disclosures of the remaining service potential relating to each
corresponding condition score for each of the patterns of consumption utilised in this
valuation are as follows:
110
110
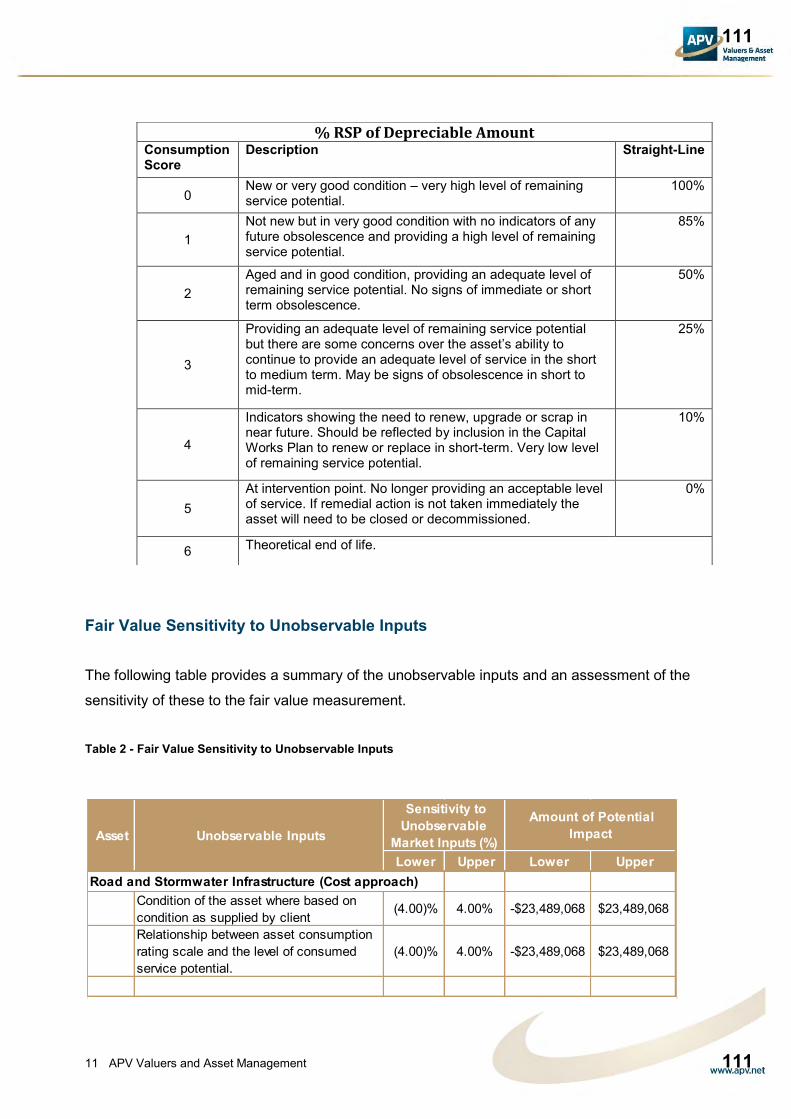
APV Valuers and Asset Management 11
Fair Value Sensitivity to Unobservable Inputs
The following table provides a summary of the unobservable inputs and an assessment of the
sensitivity of these to the fair value measurement.
Table 2 - Fair Value Sensitivity to Unobservable Inputs
Lower Upper Lower Upper Road and Stormwater Infrastructure (Cost approach)
Condition of the asset where based on condition as supplied by client
(4.00)% 4.00% -$23,489,068 $23,489,068
Relationship between asset consumption rating scale and the level of consumed service potential.
(4.00)% 4.00% -$23,489,068 $23,489,068
Asset Unobservable Inputs
Sensitivity to Unobservable
Market Inputs (%)
Amount of Potential Impact
% RSP of Depreciable Amount Consumption Score
Description Straight-Line
0 New or very good condition – very high level of remaining service potential.
100%
1 Not new but in very good condition with no indicators of any future obsolescence and providing a high level of remaining service potential.
85%
2 Aged and in good condition, providing an adequate level of remaining service potential. No signs of immediate or short term obsolescence.
50%
3
Providing an adequate level of remaining service potential but there are some concerns over the asset’s ability to continue to provide an adequate level of service in the short to medium term. May be signs of obsolescence in short to mid-term.
25%
4
Indicators showing the need to renew, upgrade or scrap in near future. Should be reflected by inclusion in the Capital Works Plan to renew or replace in short-term. Very low level of remaining service potential.
10%
5 At intervention point. No longer providing an acceptable level of service. If remedial action is not taken immediately the asset will need to be closed or decommissioned.
0%
6 Theoretical end of life.
111
111

APV Valuers and Asset Management 12
Suggested description of valuation processes
The following provides some suggested disclosures. They will require tailoring by council as
appropriate.
Valuation processes
The council engages external, independent and qualified Valuers to determine the fair value of the
entities land, buildings, infrastructure and major plant on a regular basis. An annual assessment is
undertaken to determine whether the carrying amount of the assets is materially different from the
fair value. If any variation is considered material a revaluation is undertaken either by
comprehensive revaluation or by applying an interim revaluation using appropriate indices.
Changes in level 2 and 3 fair values are analysed at the end of each reporting period and
discussed between the Finance Manager, CEO, valuation team, Council and Audit Committee. As
part of this process the team presents a report that explains the reasons for the fair value
movements.
As at 30 June 2014 a comprehensive revaluation was undertaken for all asset classes subject to
revaluation by APV Valuers and Asset Management.
The main level 3 inputs used are derived and evaluated as follows –
Asset Condition – The nature of road network infrastructure is that there are a very large
number of assets which comprise the network and as a result it is not physically possible to
inspect every asset for the purposes of completing a valuation. As a consequence reliance is
placed on the accuracy of data held in the asset management system and its associated
internal controls. This includes regular planned inspections and updates to the system
following maintenance activities and renewal treatments. Likewise, especially for storm water
network infrastructure, a large portion of the portfolio is located underground and may only be
inspected on an irregular basis.
To provide assurance over the accuracy of this information and taking into account the cost-
benefit of undertaking physical inspections the valuation relies upon a sampling approach
(APV conducted a 10% sample of each asset type) where the data held in the system is
verified by a physical inspection. While the sampling approach, combined with internal controls
associated with the asset management system, provides a high level of comfort over the
112
112
APV Valuers and Asset Management 13
condition data held in the asset management system it does not provide a guarantee that all
the data is correct and the condition as recorded is valid as at the date of valuation.
o Relationship between asset consumption rating scale and the level of consumed service potential – Under the cost approach the estimated cost to replace the asset is
calculated and then adjusted to take account of an accumulated depreciation. In order to
achieve this, the Valuer determines an asset consumption rating scale for each asset type
based on the inter-relationship between a range of factors. These factors and their relationship
to the fair value require professional judgment and include asset condition, legal and
commercial obsolescence and the determination of key depreciation related assumptions such
as residual value, useful life and pattern of consumption of the future economic benefit.
The consumption rating scales were based initially on the past experience of the valuation firm
and industry guides and were then updated to take into account the experience and
understanding of council’s own engineers, asset management and finance staff. The results of
the valuation were further evaluated by confirmation against council’s own understanding of
the assets and the level of remaining service potential.
113
113
APV Valuers and Asset Management 14
Valuation Results General
Darwin is Australia's most northern city boarding on the East Timor sea. The city is often referred
to as Australia's gateway to Asia. The city has a diverse community with large defence force base,
LNG and mining services driving the economy. Darwin port and Darwin -Adelaide rail link make an
important contribution to growth of the city. The council services a population of 77,000 people
over half of greater Darwin total population. The council covers the early infrastructure of roads
and storm water in Darwin development.
Analysis of Results
Fair Value as % of Gross (or Nominal) Replacement Cost
The results have been analysed in the following (Table 4) and confirm that the valuation results
are reasonable and within our expectations. This is based on –
The result reflect the ground stability and weather conditions as well as the council
maintenance programme and councils maintenance program of the storm water network
through the cleaning storm water facilities prior to the monsoon season. These conditions
are quite different from those experienced by councils on the east coast.
The results are comparable with the adjoining council (Palmerston Council) and also with
other councils throughout Australia that APV has provided the valuation for. The results are
comparable in terms of condition, remaining service potential, unit rates and the underlying
assumptions. This is to be expected as most councils tend to maintain their assets in a
reasonably good condition in order to satisfy the level of expectation (service level)
demanded by the residents.
114
114

APV Valuers and Asset Management 15
Table 3 - Analysis of Fair Value to Gross
Comparison to Previous Valuation
It should be noted that the previous valuation was not provided by APV. While we have attempted
to make comparison of the APV financial reporting valuation figures to existing asset register book
values there are a number of key factors which do not allow a reasonable comparison or explain
the reason for variation between the two. These include lack of understanding of the valuation
methodology and access to the work papers (including assumptions and algorithms) used to
determine the previous values. Any explanation between the two values would require additional
discussions directly with the previous valuer.
Road $356,441,609 $268,730,939 75.4%
Kerb and Channel $71,221,732 $57,790,449 81.1%
Car Park $23,929,950 $16,972,388 70.9%
Footpath $44,965,830 $35,305,214 78.5%
Roundabout $722,304 $434,131 60.1%
Shared $13,370,583 $9,345,037 69.9%
Walkways $4,737,079 $2,991,054 63.1%
Stormwater Drain $282,582,125 $150,842,631 53.4%
Stormwater Pit $30,902,661 $12,632,176 40.9%
Driveway $29,652,533 $24,578,867 82.9%
Open Drain $5,734,089 $3,863,780 67.4%
Traffic Signal $4,708,500 $2,254,400 47.9%
Subsoil Drainage $1,601,877 $1,485,636 92.7%
Total $870,570,870 $587,226,702 67.5%
Asset Class Gross (RC or MV) Fair Value WDV as % Gross
115
115

APV Valuers and Asset Management 16
The following table provides a summary of changes between the values reported in the previous
financial statements and this valuation. The results have been analysed and confirm that the
valuation results are reasonable and within our expectations. This is based on –
The change in Gross would generally appear reasonable and the increase in Fair Value is
also consistent with the first time application of residual values.
The result reflect the current replacement value of the asset
The assets condition has been taken into consideration
Table 4: Analysis to previous values
2013 2014 Var (%) 2013 2014 Var (%)
Road $277,732,318 $356,441,609 28.3% $138,967,372 $268,730,939 93.4%
Kerb and Channel $63,408,669 $71,221,732 12.3% $33,019,295 $57,790,449 75.0%
Car Park $12,281,654 $23,929,950 94.8% $10,198,945 $16,972,388 66.4%
Footpath $34,748,272 $44,965,830 29.4% $26,895,456 $35,305,214 31.3%
Roundabout $1,043,685 $722,304 -30.8% $726,272 $434,131 -40.2%
Shared $9,469,195 $13,370,583 41.2% $5,290,642 $9,345,037 76.6%
Walkways $3,034,474 $4,737,079 56.1% $1,944,709 $2,991,054 53.8%
Stormwater Drain $280,089,741 $282,582,125 0.9% $148,907,426 $150,842,631 1.3%
Stormwater Pit $22,682,533 $30,902,661 36.2% $12,648,656 $12,632,176 -0.1%
Driveway $24,760,959 $29,652,533 19.8% $21,040,262 $24,578,867 16.8%
Open Drains $5,511,638 $5,734,089 4.0% $1,481,479 $3,863,780 160.8%
Traffic Signal $1,592,779 $4,708,500 195.6% $599,442 $2,254,400 276.1%
Subsoil Drainage $1,105,522 $1,601,877 44.9% $930,472 $1,485,636 59.7%
TOTAL $737,461,438 $870,570,870 18.0% $402,650,426 $587,226,702 45.8%
Asset Gross (RC or MV) Fair Value
116
116
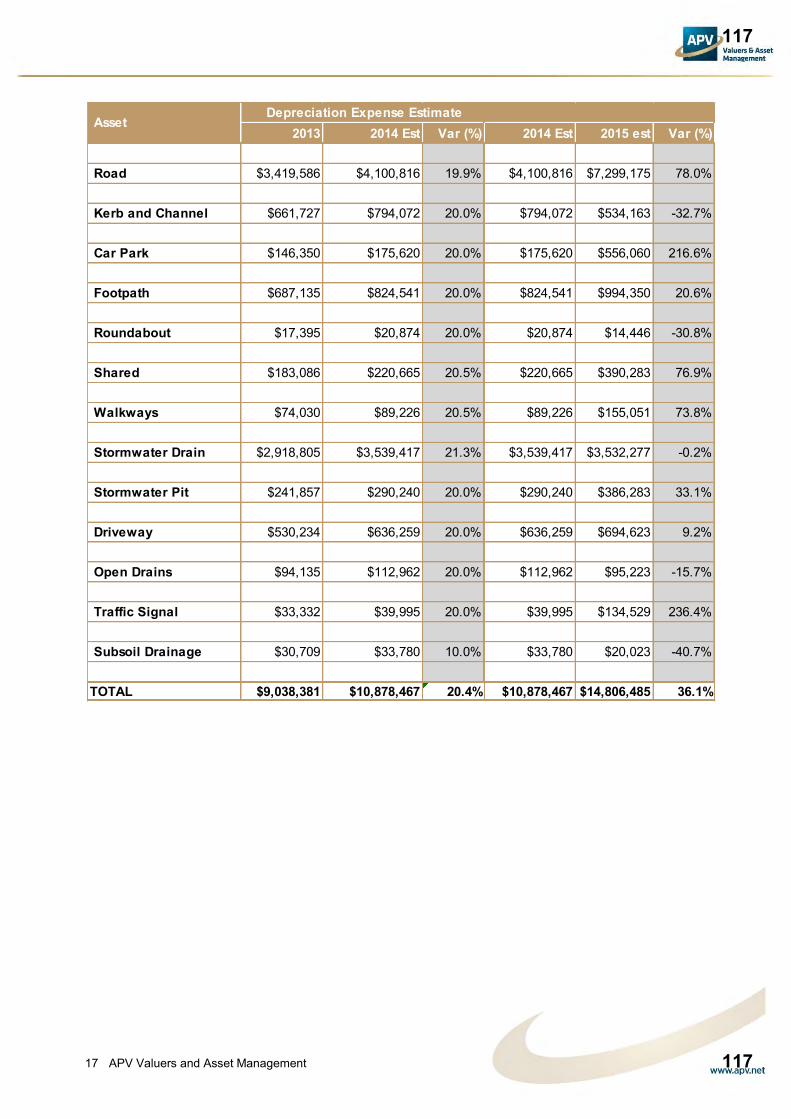
APV Valuers and Asset Management 17
2013 2014 Est Var (%) 2014 Est 2015 est Var (%)
Road $3,419,586 $4,100,816 19.9% $4,100,816 $7,299,175 78.0%
Kerb and Channel $661,727 $794,072 20.0% $794,072 $534,163 -32.7%
Car Park $146,350 $175,620 20.0% $175,620 $556,060 216.6%
Footpath $687,135 $824,541 20.0% $824,541 $994,350 20.6%
Roundabout $17,395 $20,874 20.0% $20,874 $14,446 -30.8%
Shared $183,086 $220,665 20.5% $220,665 $390,283 76.9%
Walkways $74,030 $89,226 20.5% $89,226 $155,051 73.8%
Stormwater Drain $2,918,805 $3,539,417 21.3% $3,539,417 $3,532,277 -0.2%
Stormwater Pit $241,857 $290,240 20.0% $290,240 $386,283 33.1%
Driveway $530,234 $636,259 20.0% $636,259 $694,623 9.2%
Open Drains $94,135 $112,962 20.0% $112,962 $95,223 -15.7%
Traffic Signal $33,332 $39,995 20.0% $39,995 $134,529 236.4%
Subsoil Drainage $30,709 $33,780 10.0% $33,780 $20,023 -40.7%
TOTAL $9,038,381 $10,878,467 20.4% $10,878,467 $14,806,485 36.1%
Depreciation Expense Estimate Asset
117
117

APV Valuers and Asset Management 18
Valuation Methodology
Basis of Valuation The valuation has been provided for financial reporting purposes and conducted in accordance
with the prescribed requirements including the various relevant Australian Accounting Standards.
AASB 13 Fair Value Measurement
AASB 116 Property Plant and Equipment
AASB 5 Assets Held for Sale
AASB117 Leases
AASB 136 Impairment
AASB 13 Fair Value
This new standard introduces the new definition for Fair Value and is defined as follows:
"The price that would be received to sell an asset or paid to transfer a liability in an orderly
transaction between market participants at the measurement date"
The valuation has been undertaken taking into account the requirements of AASB 13 Fair Value
Measurement. This included establishing the nature of the asset, characteristics important to
market participants, the appropriate market and the valuation premise. Having maximized the level
of valuation input the appropriate valuation technique was adopted to determine Fair Value.
The following approaches were deemed appropriate –
Specialised assets including infrastructure assets (cost approach)
The following decision trees set out the process for determining Fair Value under AASB 13 and the
key standards applied for this valuation.
118
118

APV Valuers and Asset Management 19
119
119

APV Valuers and Asset Management 20
120
120

APV Valuers and Asset Management 21
Valuation Techniques
The following valuation basis has been adopted for the various assets owned by the City of
Darwin. APV’s valuation spread sheets indicates the basis adopted for the valuation of each asset.
Cost Approach
As this method is based on determining the Depreciated Replacement Cost the valuation
methodology is intrinsically linked to the concept of Depreciation as defined in the Australian
Accounting Standards. Fair Value measures the relative level of remaining service potential
embodied within the asset whereas depreciation expense measures the rate of consumption of the
service potential.
In accordance with the depreciation requirements of AASB 116, “complex assets” are
componentised and depreciated separately. All assets above the revaluation threshold are
componentised.
To determine the Depreciated Replacement Cost we applied the following process –
Determine the Replacement Cost (Gross)
Determine the Depreciable Amount by assessing the Residual Value
Assessing the level of remaining service potential of the Depreciable Amount using a
Consumption Rating Scoring matrix. This provides an objective scoring method that
considers both the holistic factors (functionality, capacity, utilisation, obsolescence, etc)
and component specific factors (such as physical condition and maintenance history).
The process used by APV has been developed over many years taking into account our extensive
knowledge and experience of valuation as well as accounting and auditing. The process
essentially involves dissecting the asset lifecycle into a range of phases and using a stepped
approach to determine the rate of depreciation. It can be diagrammatically represented as follows.
121
121
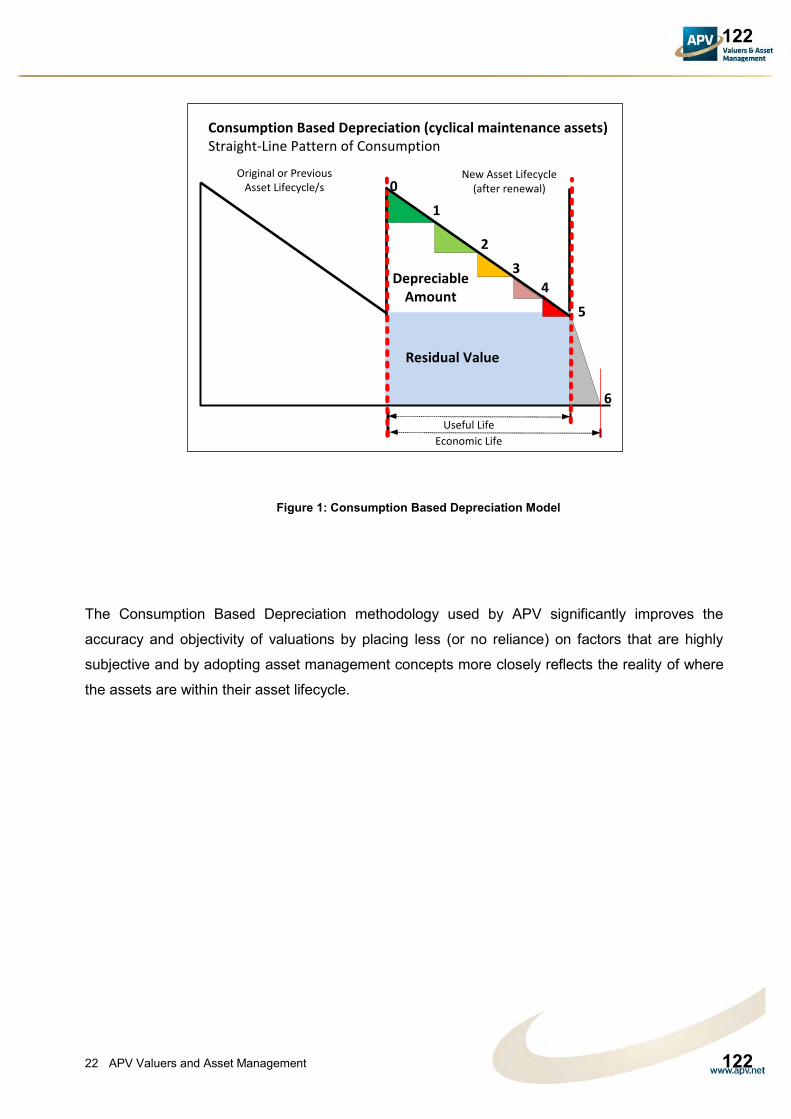
APV Valuers and Asset Management 22
Figure 1: Consumption Based Depreciation Model
The Consumption Based Depreciation methodology used by APV significantly improves the
accuracy and objectivity of valuations by placing less (or no reliance) on factors that are highly
subjective and by adopting asset management concepts more closely reflects the reality of where
the assets are within their asset lifecycle.
Depreciable Amount
Residual Value
0
1
2
3
4
5
6
Consumption Based Depreciation (cyclical maintenance assets)Straight-Line Pattern of Consumption
Original or Previous Asset Lifecycle/s
New Asset Lifecycle(after renewal)
Useful Life
Economic Life
122
122

APV Valuers and Asset Management 23
Components
Infrastructure assets valued using the cost approach have been componentised as per Table 6:
Components. These components have been determined based on the relative materiality of the
cost and that each typically reflects a different useful life or pattern of consumption. The
components also include a number of small services. While not necessarily material they have
been separated out due to the need to provide information into the asset management planning
process. Table 5: Components
Asset class Component
Sealed roads Seal Pavement Formation
Culverts RCBC RCP
Kerb and channel
Left kerb Right kerb Traffic islands Roundabout
Footpaths and cycleway
Concrete Bitumen Pavers
Valuation Inputs
The key valuation inputs used to determine the Depreciated Replacement Cost were –
Gross Replacement Cost (based on actual dimensions and unit rates derived from market
evidence)
Residual Value (based on consideration of likely future asset management treatment)
Pattern of Consumption (straight-line as instructed by council)
Consumption score (based on physical characteristics as well as potential impact of
changes in functionality, capacity, obsolescence and legal and other limits
Please note that under the Consumption Based Depreciation model Useful Life is not used as
an input in the calculation of the Fair Value (Depreciated Replacement Cost). This is because
the calculation is based on condition and other relevant factors. Typically age has little if no
impact on the level of remaining service potential.
123
123

APV Valuers and Asset Management 24
Unit Rates
The following unit rates were adopted in determining the Gross Replacement Cost.
Sealed Road Rates
Hierarchy Component Type Rate Unit
2 Sub Arterial Formation STD 11.77 sqm
3 Primary Formation STD 10.93 sqm
4 Secondary Formation STD 10.27 sqm
5 Local Formation STD 9.59 sqm
6 Industrial Collector Formation STD 10.27 sqm
7 Industrial Local Formation STD 9.59 sqm
8 Unclassified CBD Formation STD 10.27 sqm
9 Tourist Formation STD 10.27 sqm
2 Sub Arterial Pavement STD 56.90 sqm
3 Primary Pavement STD 51.91 sqm
4 Secondary Pavement STD 48.77 sqm
5 Local Pavement STD 44.40 sqm
6 Industrial Collector Pavement STD 48.77 sqm
7 Industrial Local Pavement STD 44.40 sqm
8 Unclassified CBD Pavement STD 48.77 sqm
9 Tourist Pavement STD 48.77 sqm
2 Sub Arterial Surface Asphalt 36.70 sqm
3 Primary Surface Asphalt 35.31 sqm
4 Secondary Surface Asphalt 33.09 sqm
5 Local Surface Asphalt 31.41 sqm
6 Industrial Collector Surface Asphalt 33.09 sqm
7 Industrial Local Surface Asphalt 31.41 sqm
8 Unclassified CBD Surface Asphalt 33.09 sqm
9 Tourist Surface Asphalt 33.09 sqm
5 Local Surface Brick Pavers 119.47 sqm
2 Sub Arterial Surface Chip Seal 39.00 sqm
3 Primary Surface Chip Seal 39.00 sqm
4 Secondary Surface Chip Seal 39.00 sqm
5 Local Surface Chip Seal 39.00 sqm
6 Industrial Collector Surface Chip Seal 39.00 sqm
7 Industrial Local Surface Chip Seal 39.00 sqm
8 Unclassified CBD Surface Chip Seal 39.00 sqm
9 Tourist Surface Chip Seal 39.00 sqm
3 Primary Surface Fibredec 39.19 sqm
4 Secondary Surface Fibredec 37.10 sqm
8 Unclassified CBD Surface Fibredec 36.10 sqm
7 Industrial Local Surface Gravel 19.16 sqm
4 Secondary Surface Liquid Road 7.00 sqm
8 Unclassified CBD Surface Liquid Road 7.00 sqm
124
124

APV Valuers and Asset Management 25
Kerb and Channel Rates
Hierarchy Component Type Rate Unit
URBAN STREETS Kerb KG 87.77 m
URBAN STREETS Kerb LB 87.77 m
URBAN STREETS Kerb KO 61.30 m
URBAN STREETS Kerb CO 87.77 m
URBAN STREETS Kerb SL 87.77 m
URBAN STREETS Kerb SG 87.77 m
URBAN STREETS Kerb SO 61.30 m
URBAN STREETS Kerb KB 87.77 m
URBAN STREETS Kerb FL 61.30 m
Car Park Rates
Hierarchy Component Type Rate Unit
On Formation STD 9.59 sqm
Off Formation STD 10.26 sqm
On Pavement STD 44.40 sqm
Off Pavement STD 47.51 sqm
On Surface ASPHALT 31.41 sqm
On Surface CHIPSEAL7 7.00 sqm
On Surface CONCRETE 157.43 sqm
On Surface GRAVEL 19.16 sqm
Off Surface ASPHALT 33.61 sqm
Off Surface CHIPSEAL7 7.49 sqm
Off Surface CONCRETE 168.45 sqm
Off Surface GRAVEL 20.50 sqm
Foot Paths
Hierarchy Component Type Rate Unit
Std Surface Concrete 70.00 sqm
Pedestrian Surface Concrete 83.37 sqm
Pedestrian Surface ASPHALT 59.73 sqm
Pedestrian Surface XAG 109.58 sqm
Pedestrian Surface PAVERS 137.25 sqm
Pedestrian Surface CHIPSEAL 52.63 sqm
Pedestrian Surface Gravel 22.10 sqm
125
125
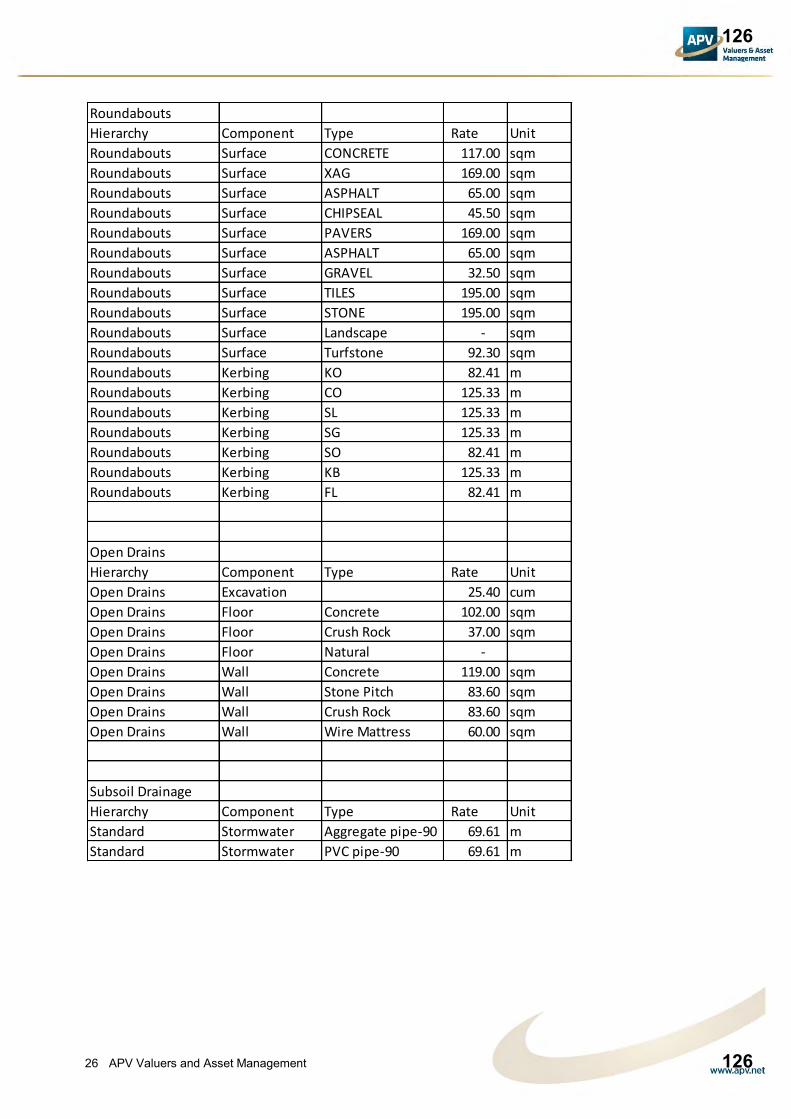
APV Valuers and Asset Management 26
Roundabouts
Hierarchy Component Type Rate Unit
Roundabouts Surface CONCRETE 117.00 sqm
Roundabouts Surface XAG 169.00 sqm
Roundabouts Surface ASPHALT 65.00 sqm
Roundabouts Surface CHIPSEAL 45.50 sqm
Roundabouts Surface PAVERS 169.00 sqm
Roundabouts Surface ASPHALT 65.00 sqm
Roundabouts Surface GRAVEL 32.50 sqm
Roundabouts Surface TILES 195.00 sqm
Roundabouts Surface STONE 195.00 sqm
Roundabouts Surface Landscape - sqm
Roundabouts Surface Turfstone 92.30 sqm
Roundabouts Kerbing KO 82.41 m
Roundabouts Kerbing CO 125.33 m
Roundabouts Kerbing SL 125.33 m
Roundabouts Kerbing SG 125.33 m
Roundabouts Kerbing SO 82.41 m
Roundabouts Kerbing KB 125.33 m
Roundabouts Kerbing FL 82.41 m
Open Drains
Hierarchy Component Type Rate Unit
Open Drains Excavation 25.40 cum
Open Drains Floor Concrete 102.00 sqm
Open Drains Floor Crush Rock 37.00 sqm
Open Drains Floor Natural -
Open Drains Wall Concrete 119.00 sqm
Open Drains Wall Stone Pitch 83.60 sqm
Open Drains Wall Crush Rock 83.60 sqm
Open Drains Wall Wire Mattress 60.00 sqm
Subsoil Drainage
Hierarchy Component Type Rate Unit
Standard Stormwater Aggregate pipe-90 69.61 m
Standard Stormwater PVC pipe-90 69.61 m
126
126

APV Valuers and Asset Management 27
Residual Value
Under AASB 116 Residual Value is defined as -
the estimated amount that an entity would currently obtain from disposal of the asset, after deducting the estimated costs of disposal, if the asset were already of the age and in the condition expected at the end of its useful life.
This results in an assessment of the Residual Value when the asset may be either renewed
(resulting in a new asset and therefore disposal of the existing asset) or a decision is made to
decommission the asset. This follows the asset management approach as demonstrated in Figure
1: Consumption Based Depreciation model.
The residual value is based on an assessment of the costs that would be involved to restore the
asset back to “as new” if it were ever to reach the “unacceptable level of service” phase due to
physical deterioration.
For example, when a pipe reaches a point in its lifecycle that it must be repaired, the entity
commonly has two choices. They can dig the pipe up and replace it or, they might use a sleeve to
reline it. If the cost of the re-sleeving is 60% of the gross Replacement Cost and it restores the
service potential back to 100% then it can be argued that the residual value (represented by the
existing hole and old pipe) represents a Residual Value of 40%.
Pattern of Consumption
In accordance with paragraph 60 of AASB 116 Property Plant & Equipment, depreciation is based
on the most appropriate pattern of consumption. The straight-line pattern was used for all
valuations as instructed by council.
127
127
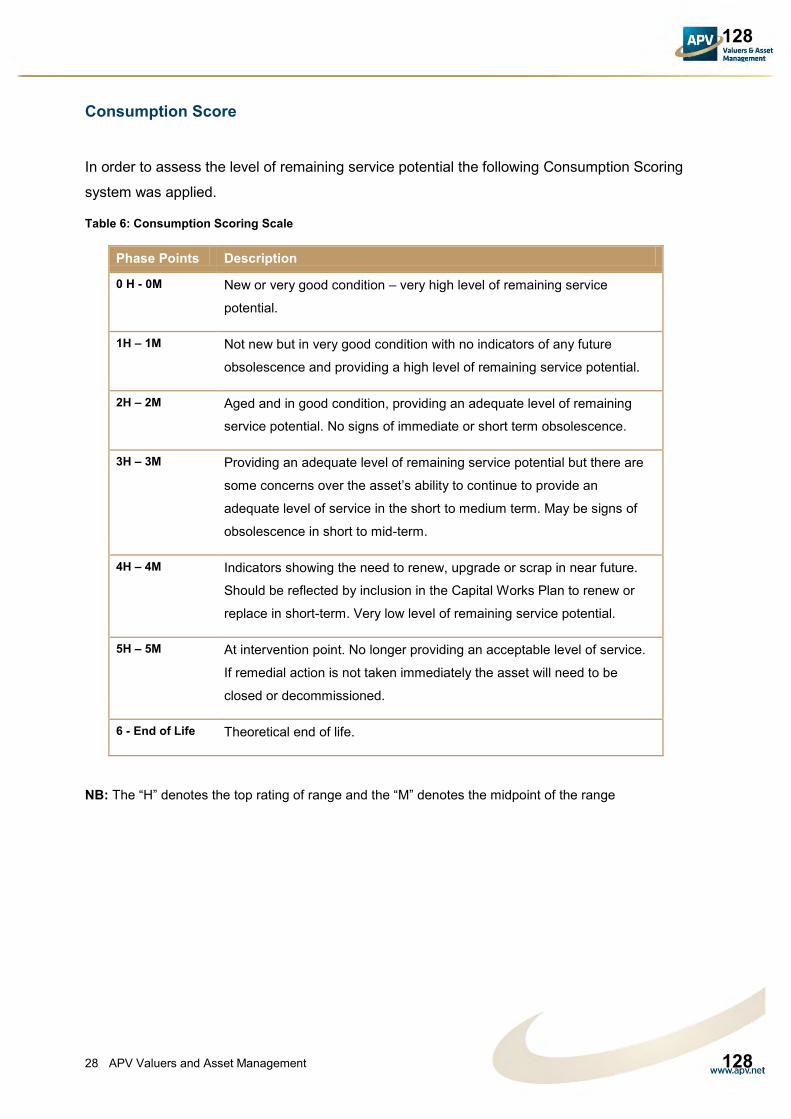
APV Valuers and Asset Management 28
Consumption Score
In order to assess the level of remaining service potential the following Consumption Scoring
system was applied.
Table 6: Consumption Scoring Scale
Phase Points Description
0 H - 0M New or very good condition – very high level of remaining service
potential.
1H – 1M Not new but in very good condition with no indicators of any future
obsolescence and providing a high level of remaining service potential.
2H – 2M Aged and in good condition, providing an adequate level of remaining
service potential. No signs of immediate or short term obsolescence.
3H – 3M Providing an adequate level of remaining service potential but there are
some concerns over the asset’s ability to continue to provide an
adequate level of service in the short to medium term. May be signs of
obsolescence in short to mid-term.
4H – 4M Indicators showing the need to renew, upgrade or scrap in near future.
Should be reflected by inclusion in the Capital Works Plan to renew or
replace in short-term. Very low level of remaining service potential.
5H – 5M At intervention point. No longer providing an acceptable level of service.
If remedial action is not taken immediately the asset will need to be
closed or decommissioned.
6 - End of Life Theoretical end of life.
NB: The “H” denotes the top rating of range and the “M” denotes the midpoint of the range
128
128
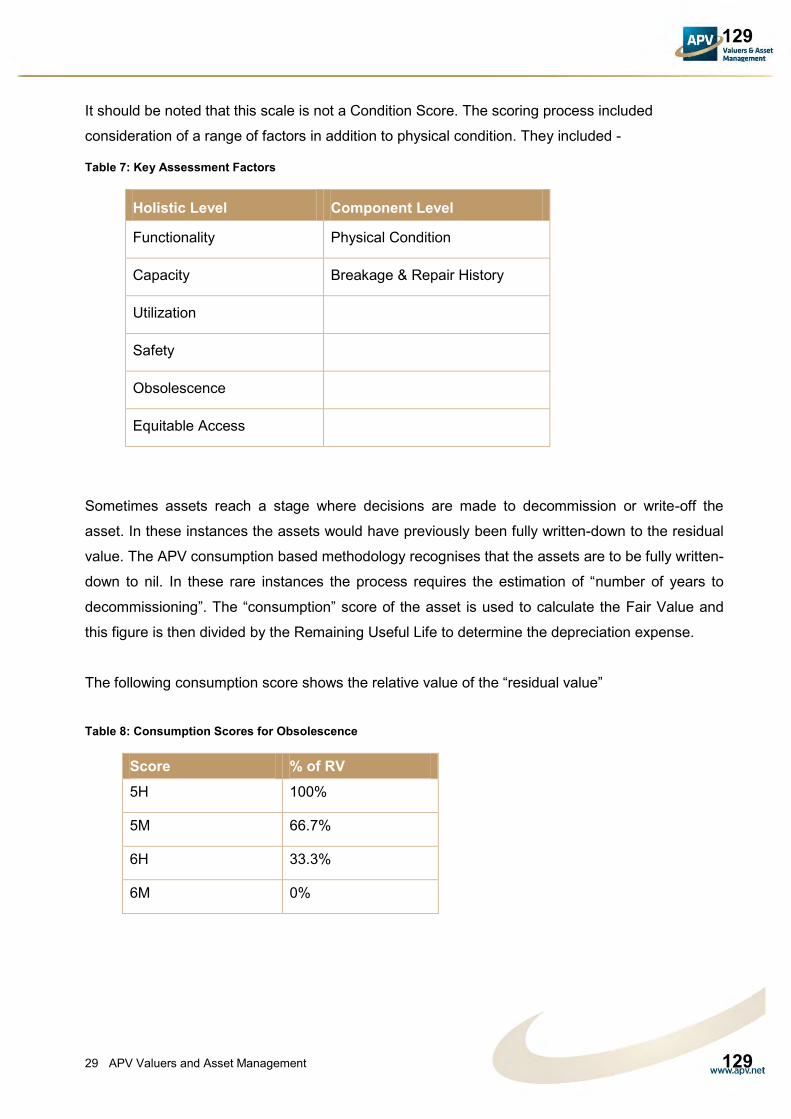
APV Valuers and Asset Management 29
It should be noted that this scale is not a Condition Score. The scoring process included
consideration of a range of factors in addition to physical condition. They included -
Table 7: Key Assessment Factors
Holistic Level Component Level
Functionality Physical Condition
Capacity Breakage & Repair History
Utilization
Safety
Obsolescence
Equitable Access
Sometimes assets reach a stage where decisions are made to decommission or write-off the
asset. In these instances the assets would have previously been fully written-down to the residual
value. The APV consumption based methodology recognises that the assets are to be fully written-
down to nil. In these rare instances the process requires the estimation of “number of years to
decommissioning”. The “consumption” score of the asset is used to calculate the Fair Value and
this figure is then divided by the Remaining Useful Life to determine the depreciation expense.
The following consumption score shows the relative value of the “residual value”
Table 8: Consumption Scores for Obsolescence
Score % of RV 5H 100%
5M 66.7%
6H 33.3%
6M 0%
129
129
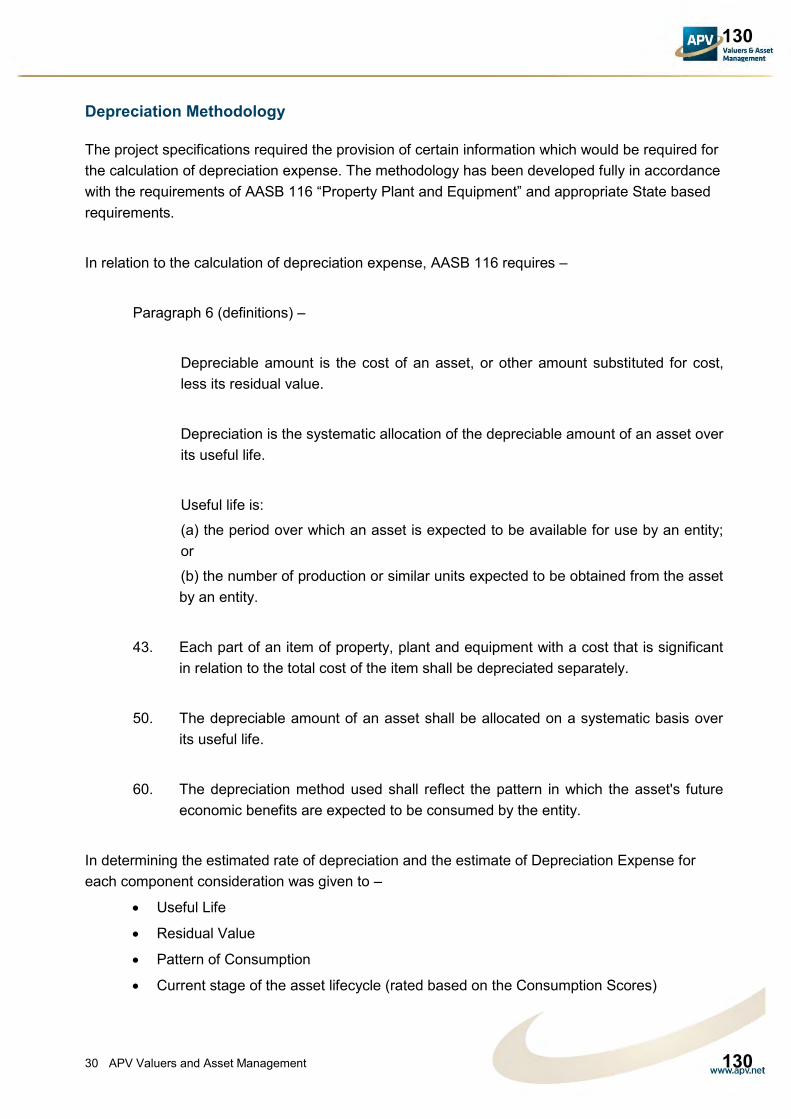
APV Valuers and Asset Management 30
Depreciation Methodology
The project specifications required the provision of certain information which would be required for the calculation of depreciation expense. The methodology has been developed fully in accordance with the requirements of AASB 116 “Property Plant and Equipment” and appropriate State based requirements.
In relation to the calculation of depreciation expense, AASB 116 requires –
Paragraph 6 (definitions) –
Depreciable amount is the cost of an asset, or other amount substituted for cost, less its residual value.
Depreciation is the systematic allocation of the depreciable amount of an asset over its useful life.
Useful life is:
(a) the period over which an asset is expected to be available for use by an entity; or
(b) the number of production or similar units expected to be obtained from the asset by an entity.
43. Each part of an item of property, plant and equipment with a cost that is significant in relation to the total cost of the item shall be depreciated separately.
50. The depreciable amount of an asset shall be allocated on a systematic basis over its useful life.
60. The depreciation method used shall reflect the pattern in which the asset's future economic benefits are expected to be consumed by the entity.
In determining the estimated rate of depreciation and the estimate of Depreciation Expense for each component consideration was given to –
Useful Life
Residual Value
Pattern of Consumption
Current stage of the asset lifecycle (rated based on the Consumption Scores)
130
130

APV Valuers and Asset Management 31
A depreciation rate (expressed as a percentage of the Depreciable Amount) was determined
based on the assessed Pattern of Consumption and Consumption Score.
This rate was then applied against the Depreciable Amount. The result of this approach is that
where the pattern of consumption applied was straight-line, the depreciation rate applied was
consistent irrespective of the assessed consumption rating of the component.
In the rare circumstances of assets deemed no longer required for use and identified as being
obsolete, depreciation expense was based on the assessed value divided by the estimated time to
demolition.
131
131

APV Valuers and Asset Management 32
Valuation Processes General APV has undertaken the financial reporting valuation for City of Darwin in accordance with the
Australian Accounting Standards. The valuation reporting has involved the confirmation of
completeness of asset registers, physical inspection of the assets and capturing data such as the
asset age, type, condition and then compiling information and assessing the value of the assets.
Throughout this process, APV ensured quality management procedures were implemented to
achieve the most accurate asset valuation reporting.
Project Staff The following table sets out the officers used to undertake the valuation along with details of their
experience and qualification.
PERSONNEL QUALIFICATIONS ROLE & EXPERIENCE MANAGEMENT Mr Alf Ponticello Managing Director Project Manager Registered Valuer
Registered Valuer: NSW: VAL14829 QLD: 1816 Bachelor of Business (RP. Val & Administration)
Experience :Senior Valuer – Over 22 years experience in carrying out Local Government and Public Body valuations
Mr David Edgerton Director Methodology
Asset Accounting, Asset Management & Methodology. Bachelor of Commerce Fellow CPA Australia Member – IPWEA CPA Australia’s Representative – AAMCoG
Experience: Author: CPA Australia’s “Guide to public sector physical asset valuation and depreciation under accrual based accounting standards” Contributing Author – IPWEA NAMS Australian Financial Management Guidelines Author – CPA Australia’s national Asset Accounting and Asset Management in the Public Sector program. Over 20 years with Qld Audit Office including Manager of Local Government and Contract Auditors Section
INFRASTRUCTURE, PLANT & EQUIPMENT VALUERS
Mr Bryce McLaren
Role: On Site Inspections
Technical Trade Qualifications Certificates in Pumping Technology, Pneumatics, Hydraulics, Electrical Design, Steam & Gas
Valuer – Plant, Equipment & Infrastructure Assets. 30+yrs experience in Civil & Mechanical Projects including Project management
132
132

APV Valuers and Asset Management 33
Quality Management Quality management processes involved taking a number of steps to ensure asset information was
accurate and complete, and that provided information could be relied upon with confidence. The
process followed by APV incorporated the following steps.
In undertaking the Financial Reporting Valuation for City of Darwin, APV were provided with the
following asset information from City of Darwin:
Financial Asset Register
Various asset management spreadsheets
Details of additions, disposals
APV liaised with City of Darwin to confirm that the above provided documents were accurate to the
best of their knowledge. Based on that confirmation, APV has undertaken a number of processes
to validate the accuracy of information of each of the documents as follows:
Request for Service Received
Proposal Prepared
Proposal Accepted
Job Number and File Created
Job Prepped and Planned
If required – preliminary meetings or workshops completed
Research &/or inspections completed
Confirmation of Assumptions sought
Draft calculations and Report prepared
Final Report prepared based on feedback
Reviewed by Client
Reviewed by Internal Reviewer
Issued to Client
Customer Feedback Sought from Client
SCOPING
JOB SET UP
COMPLETION OF WORK
DRAFT REPORT
FINAL REPORT
FEEDBACK
133
133

APV Valuers and Asset Management 34
Financial Asset Register
APV staff reviewed the financial register and queried certain assets before undertaking
inspections
APV staff were either accompanied by City of Darwin staff during inspections or the details
of unlisted potential assets were discussed with City of Darwin staff to correctly identify
assets. This ensured that assets contained within the register were crosschecked against
their description, location and ownership detail
Any additional assets that were found during the site inspections were captured and if they
were confirmed to be City of Darwin assets, then they were included with the valuation.
Meetings and Discussions
APV and City of Darwin have partaken in regular discussions regarding valuation methodology,
assumptions, completeness of asset data and information provided to APV. APV staff have further
communicated with personnel within specific City of Darwin departments to further clarify
information specific to a particular asset.
These discussions have been quite extensive and included conference calls on numerous
occasions which were subsequently supported by minutes. Typically these included discussions
on support for unit rates, appropriateness of assumptions, formulas and information to be included
in the report.
Confirmation of Assumptions
APV standard assumptions were sent to City of Darwin for validation and approval allowing for City
of Darwin input where changes reflect the particular nature of the City of Darwin assets. Validation
of changed assumptions is the responsibility of the council. In this instance, council have modified
the APV standard assumptions. Assumptions are attached to this report.
134
134

APV Valuers and Asset Management 35
Valuation of a Complete and Accurate Asset Register
APV have undertaken the previously described quality management processes to ensure all
assets for the relevant asset classes have been captured and included with the financial reporting
valuation. To provide assurance over the completeness and accuracy of the asset listing a number
of processes were employed. These included –
Seeking an understanding of the processes employed by City of Darwin to ensure the
asset listing provided to APV was complete an accurate. These included -
o Updating of maintenance records and the asset register where faults are reported
or maintenance/capex work undertaken
o Reconciliations between the Asset Register and Asset Management Systems
(including GIS systems)
o Reconciliations to ensure all new capital acquisitions are recorded on a timely basis
in the Asset Management system
o Reconciliations and process to ensure all contributed assets are recorded in the
asset register on a timely basis
APV selecting a number of random locations and by using either NearMaps or while
undertaking the physical inspections that all assets in that location were recorded in the
asset listing.
135
135
APV Valuers and Asset Management 36
Sources of Data
By nature the valuation process requires the capture of a range of data, research regarding a
range of assumptions and the exercise of significant professional judgement. Each valuation is
slightly different to others depending upon the quality of the asset register and data (including
asset management data) provided by the entity, geographical or environmental factors, and depth
of market to support market based assumptions.
In determining the valuations data was sourced from the following –
Indicators of Obsolescence or other high level factors
APV’s proposal stipulated that council is responsible for ensuring all relevant information is
provided to the valuer and that being external party to the council the valuer is not in a position to
know or understand all council policies, politics or intimate details of the future strategic direction of
the council. The proposal requests a range of information including and details of -
Obsolescence and impairment
Processes used to validate the completeness and accuracy of the asset register
Confirmation of Methodology and Data
During the valuation the valuer requested both verbal and where possible documentation
regarding these aspects. Where assets were identified as possibly being subject to obsolescence
further enquiries were made with council to ascertain the level and likelihood of such events.
Where relevant: appropriate comments were recorded in the valuation spreadsheet against the
relevant asset.
Replacement cost (including indices) where cost approach was used
We use a range of sources (in order of priority) including–
Actual construction or purchase prices for recent projects paid by the specific entity. This
may include further enquires with the supplier to ensure we have adjusted for any recent
price movements. Depending on the complexity of the project it may also involve
disaggregating the overall cost into greater detail.
Appropriate APV database where we record details of actual cost from recent projects that
we source directly from our clients. Preference is provided to nearby locations.
Rawlinson’s Construction Guide or similar guides (such as Cordells)
136
136
APV Valuers and Asset Management 37
Development of costs using first principles, to assist in this process we have developed a
number of models for specific asset types (such as fencing)
Benchmarking against other valuations
As per AASB 13 allowance was then made to adjust for condition and comparability.
Condition assessment and confirmation of attributes
The physical inspection of the asset is a critical aspect of the process. Apart from confirming
condition the process also involves validation of key attributes such as material type, dimensions,
etc.
For assets valued using the cost approach (except where noted below) all were physically
inspected. This included validation of physical dimensions and characteristics.
Sampling approach –
A sampling approach was used for lateral assets which were able to be visually inspevted
such as roads, footpaths, etc). For assets not inspected reliance on condition was placed
on information provided by council staff and reliance was placed on the GIS and other
asset management systems in relation to key attributes. The sample size was 10%
Assets Not Inspected -
Some assets (such as underground pipes and pits) were unable to be inspected due to
their nature and the cost involved in undertaking extensive engineering assessments
Where available, reliance was placed on condition assessment and attribute data
maintained within the council’s asset management and GIS systems. As this data is used
on a day-to-day basis to manage these assets it was considered to be the most reliable
(and available) source of information.
Where such data was not readily available we developed a range of assumptions based on the
expected physical condition and attributes given the age of the asset and typical design
characteristics. These assumptions were reviewed and confirmed as reasonable by council staff.
Relationship between consumption score and level of consumed service potential
The depreciation methodology employed is detailed above. Essentially it includes development of
a consumption profile. The consumption profile provides an objective mechanism to translate the
137
137

APV Valuers and Asset Management 38
assessed consumption score to an estimate of the depreciated replacement costs taking into
account the typical asset lifecycle phases and estimated pattern of consumption of the future
economic benefit. The consumption profile is based on the relationship between the percentage of
remaining useful life (%RUL) and percentage of remaining service potential (%RSP). As such they
involve a level of professional judgement and represent unobservable market evidence (level 3
inputs).
The straight-line pattern was used for all valuations as instructed by council.
138
138
APV Valuers and Asset Management 39
Limitations The warranty of the valuation fully complying with the accounting standards is limited
to the quality and extent of information supplied by the entity as requested in the proposal. This may include information such as the existence of assets, location, condition, potential obsolescence and confirmation of relevant assumptions relied upon by APV for the purposes of completing the valuation.
The valuation was prepared on the basis that full disclosure of all information and facts which may affect the valuation was made to us by all parties. We cannot accept any liability or responsibility whatsoever for the valuation unless full disclosure has been made.
In accordance with our standard practice, the valuation will be solely used by the party
to whom it is addressed. Reliance on it by a third party (other than for external audit purposes) cannot be regarded as reasonable, and no responsibility to any third party is or will be accepted for the whole or any part of its contents. No responsibility whatsoever will be accepted for photocopies of the whole or any part of the valuation or for photocopied signatures.
Other than for the purposes of financial statement disclosure, neither the whole nor any part of the valuation nor any reference thereto may be included in any document, circular or statement without our written approval of the form and context in which it will appear.
Physical inspections were undertaken to the extent required to enable APV to assess the level of remaining service potential. As a consequence, inspections did not include (unless specifically detailed in the scope of works):
o soil analysis or geological studies
o testing for substances such as asbestos, chemical or toxic wastes, or other potentially hazardous materials which could adversely affect the value of the asset. The value as assessed by us is on the assumption that there is no material within the property that would cause a loss in value. No responsibility is accepted or assumed with regard to the existence or otherwise of any such conditions, and the recipient of this report is advised that the valuers are not qualified to detect such substances. We would require separate instructions together with appropriate engineering advice to enable us to identify the existence and extent of such substances, quantify the impact on values or estimate the remedial cost.
o structural surveys of improvements or examinations for timber infestation.
139
139
APV Valuers and Asset Management 40
Where inspections were not undertaken by APV (such as where reliance was placed on a sampling approach) reliance was placed on either condition data supplied by the entity and/or the extrapolation of results from actual inspections.
Market Movement: This valuation is current as at the date of valuation only. The value assessed herein may change significantly and unexpectedly over a relatively short period (including as a result of general market movements or factors specific to the particular property). We do not accept liability for losses arising from such subsequent changes in value. Without limiting the generality of the above comment we do not assume any responsibility or accept any liability where this valuation is relied upon after the expiration of three months from the date of valuation.
140
140

APV Valuers and Asset Management 41
Schedule of Values
Roads, etc
Valuation Assumptions
141
141

ENCL: YES
CORPORATE & ECONOMIC DEVELOPMENT COMMITTEE/OPEN
AGENDA ITEM: 9.5
EVALUATION OF RISK MANAGEMENT & AUDIT COMMITTEE PERFORMANCE
REPORT No.: 15A0026 TS:mp COMMON No.: 3021961 DATE: 22/04/2015
Presenter: Team Coordinator Risk, Audit & Safety, Tony Simons Approved: General Manager Corporate Services, Diana Leeder PURPOSE The purpose of this report is to recommend to the Corporate & Economic Development Committee (CEDC) the preferred method of conducting the annual evaluation of the performance of the Risk Management & Audit Committee (RMAC). LINK TO STRATEGIC PLAN The issues addressed in this Report are in accordance with the following Goals/Strategies of the City of Darwin 2012 – 2016 as outlined in the ‘Evolving Darwin Towards 2020 Strategic Plan’:- Goal 5 Effective and Responsible Governance Outcome 5.3 Good governance Key Strategies 5.3.3 Understand and manage Council’s risk exposure KEY ISSUES RMAC has previously conducted reviews of its performance and reported
outcomes to Council Previous evaluations have used an evaluation tool comprising some fifty various
questions which were scored by the members of RMAC, the members of the Chief officers Group and senior officers who regularly interact with RMAC
The last evaluation was conducted in July 2014 and was of little value given the low response rate from participants
142
142
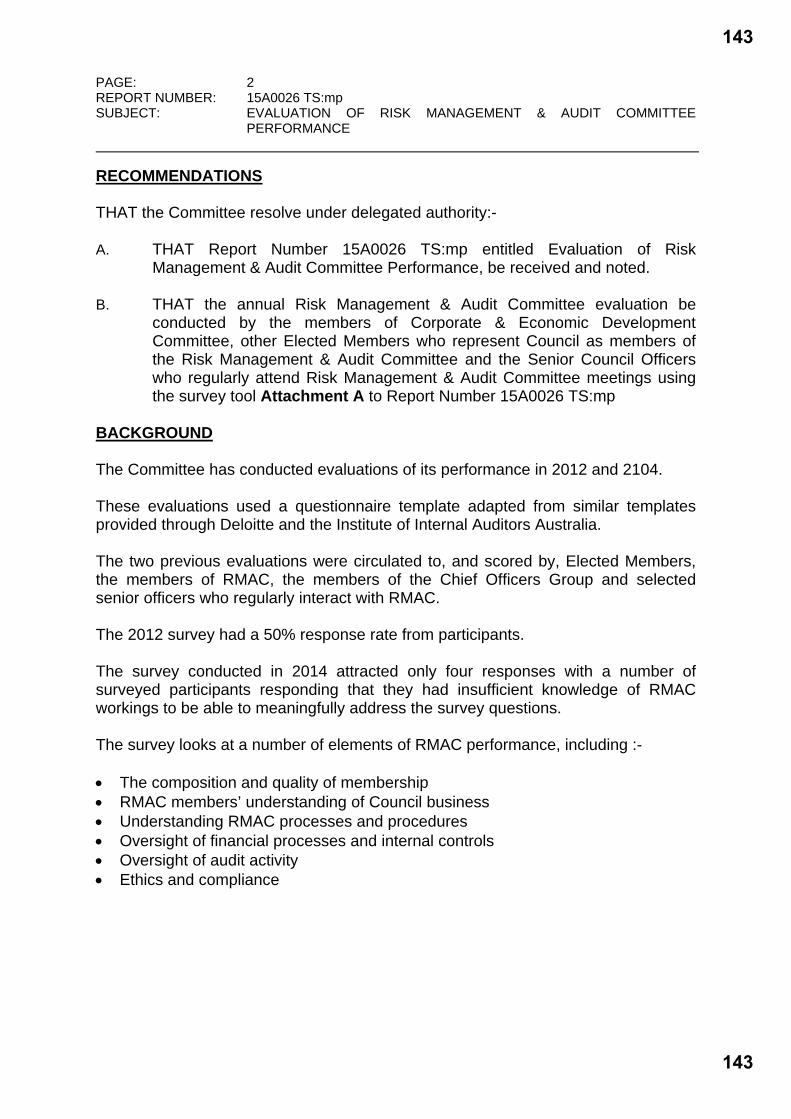
PAGE: 2 REPORT NUMBER: 15A0026 TS:mp SUBJECT: EVALUATION OF RISK MANAGEMENT & AUDIT COMMITTEE
PERFORMANCE RECOMMENDATIONS THAT the Committee resolve under delegated authority:- A. THAT Report Number 15A0026 TS:mp entitled Evaluation of Risk
Management & Audit Committee Performance, be received and noted. B. THAT the annual Risk Management & Audit Committee evaluation be
conducted by the members of Corporate & Economic Development Committee, other Elected Members who represent Council as members of the Risk Management & Audit Committee and the Senior Council Officers who regularly attend Risk Management & Audit Committee meetings using the survey tool Attachment A to Report Number 15A0026 TS:mp
BACKGROUND The Committee has conducted evaluations of its performance in 2012 and 2104. These evaluations used a questionnaire template adapted from similar templates provided through Deloitte and the Institute of Internal Auditors Australia. The two previous evaluations were circulated to, and scored by, Elected Members, the members of RMAC, the members of the Chief Officers Group and selected senior officers who regularly interact with RMAC. The 2012 survey had a 50% response rate from participants. The survey conducted in 2014 attracted only four responses with a number of surveyed participants responding that they had insufficient knowledge of RMAC workings to be able to meaningfully address the survey questions. The survey looks at a number of elements of RMAC performance, including :- The composition and quality of membership RMAC members’ understanding of Council business Understanding RMAC processes and procedures Oversight of financial processes and internal controls Oversight of audit activity Ethics and compliance
143
143
PAGE: 3 REPORT NUMBER: 15A0026 TS:mp SUBJECT: EVALUATION OF RISK MANAGEMENT & AUDIT COMMITTEE
PERFORMANCE The 2012 survey showed that only three of the fifty performance measures returned less than acceptable scores. RMAC provides for ongoing education programs to enhance members’
knowledge skills base New members to RMAC are provided with a comprehensive induction and
orientation program to ensure they are fully aware of their roles and responsibilities
A succession plan is in place for the RMAC chairman and members Corrective actions for these measures have been implemented, with the exception of succession planning for the chairman of the Committee. DISCUSSION It is recommended and accepted practice to undertake evaluations of the performance of internal audit committees. Elected members need to be assured that the Committee is not only achieving its objectives but is an effective tool in the overall context of Council’s governance framework. If a parallel is drawn with the governance requirements of publicly listed companies, a company’s audit committee will report to the board of directors, who in turn are responsible for determining whether audit committees perform to their satisfaction. Given that the Elected Members are effectively the “board of directors” for Council, it necessarily follows that they should be the ones who evaluate the performance of RMAC in meeting the needs of the Elected Members. In recognising the low rate of return on previous surveys, and especially the rate of “insufficient knowledge of RMAC workings” responses, it is recommended that the survey audience be contracted to include only those Elected Members who currently serve on RMAC, along with the Chair of RMAC and the senior Council officers who regularly attend RMAC meetings. The number of questions in the survey has been reduced and the coverage of questions now specifically addresses two key result areas :- Performance against the RMAC terms of reference Performance against accepted corporate governance elements CONSULTATION PROCESS Nil
144
144

PAGE: 4 REPORT NUMBER: 15A0026 TS:mp SUBJECT: EVALUATION OF RISK MANAGEMENT & AUDIT COMMITTEE
PERFORMANCE POLICY IMPLICATIONS Nil BUDGET AND RESOURCE IMPLICATIONS Nil RISK/LEGAL/LEGISLATIVE IMPLICATIONS Nil ENVIRONMENTAL IMPLICATIONS Nil COUNCIL OFFICER CONFLICT OF INTEREST DECLARATION We the Author and Approving Officers declare that we do not have a Conflict of Interest in relation to this matter. TONY SIMONS DIANA LEEDERTEAM COORDINATOR RISK, AUDIT & SAFETY
GENERAL MANAGER CORPORATE SERVICES
For enquiries, please contact Tony Simons on 8930 0573 or email: [email protected]. Attachments: Attachment A: RMAC Evaluation Questionnaire
145
145

CITY OF DARWIN
RISK MANAGEMENT & AUDIT COMMITTEE 2015 PERFORMANCE EVALUATION
146
146

KEY RESPONSIBILITIES of the COMMITTEE
1. The Committee monitors strategic and operational risk management and the adequacy of the internal control policies, practices and procedures established to manage identified risk.
0 1 2 3 4 5
2. The Committee oversees the internal audit function including development of audit programs with reference to the Council’s risk assessment, the conduct of internal audits by appropriately qualified personnel, the monitoring of audit outcomes and the implementation of recommendations.
0 1 2 3 4 5
3. The Committee reviews the quality of annual financial statements and other public accountability documents (such as annual reports) prior to their adoption by the Council.
0 1 2 3 4 5
4. The Committee reviews management’s responses to external and internal audit recommendations and monitors implementation of the agreed recommendations.
0 1 2 3 4 5
5. The Committee meets with the external and internal auditors at least once each year to receive direct feedback about any key risk and compliance issues, and to provide feedback about the auditor’s performance.
0 1 2 3 4 5
6. The Committee advises Council about the appointment of external auditors. 0 1 2 3 4 5
7. The Committee assesses the adequacy of audit scope and coverage. 0 1 2 3 4 5
COMMITTEE GOVERNANCE
8. RMAC operates under an approved terms of reference and those terms are reviewed regularly to ensure responsibilities and objectives are adequately described
0 1 2 3 4 5
9. RMAC members clearly understand their roles and responsibilities as set out in the terms of reference 0 1 2 3 4 5
10. New members are provided with a comprehensive induction and orientation program to ensure they are fully aware of their roles and responsibilities
0 1 2 3 4 5
11. The Committee chairman demonstrates effective leadership 0 1 2 3 4 5
12. RMAC has a scheduled calendar of meetings that ensures sufficient time and resources are available to meet its responsibilities under its charter
0 1 2 3 4 5
13. The frequency of committee meetings and time allocated for meetings allows the committee to fulfil its duties dealing with significant audit issues effectively
0 1 2 3 4 5
147
147

14. Committee agendas, minutes and supporting documentation are circulated in advance of meetings with sufficient time for members to study and comprehend information to be addressed
0 1 2 3 4 5
15. The committee maintains comprehensive minutes of its meetings 0 1 2 3 4 5
16. RMAC findings are reported at Council meetings 0 1 2 3 4 5
17. A register of attendance of committee members is maintained and reported annually to Council 0 1 2 3 4 5
18. Annual performance evaluation is undertaken of the audit committee and results reported to the elected members at Council meetings
0 1 2 3 4 5
19. Members’ session fees are approved by Council 0 1 2 3 4 5
20. Members of the committee adhere to independence and conflict of interest requirements 0 1 2 3 4 5
148
148
ENCL: NO
CORPORATE & ECONOMIC DEVELOPMENT COMMITTEE/OPEN
AGENDA ITEM: 9.6
PAYMENT OF SITTING FEES FOR RISK MANAGEMENT & AUDIT COMMITTEE
REPORT No.: 15A0061 TS:mp COMMON No.: 1624782 DATE: 22/04/2015
Presenter: Team Coordinator Risk, Audit & Safety, Tony Simons Approved: General Manager Corporate Services, Diana Leeder PURPOSE The purpose of this report is to recommend to the Corporate & Economic Development Committee that it approve the changes to sitting fees paid to independent members of Council’s Risk Management and Audit Committee (RMAC). LINK TO STRATEGIC PLAN The issues addressed in this Report are in accordance with the following Goals/Strategies of the City of Darwin 2012 – 2016 as outlined in the ‘Evolving Darwin Towards 2020 Strategic Plan’:- Goal 5 Effective and Responsible Governance Outcome 5.3 Good governance Key Strategies 5.3.3 Understand and manage Council’s risk exposure KEY ISSUES RMAC comprises two elected members of Council and two independent
members, one of whom is the Chairperson Remuneration is made to the independent members using the applicable rates as
set out in the NT Government schedule of statutory bodies maintained by the Department of the Chief Minister
RMAC is classed as a Statutory Body Class C1 (Advisory & Review Bodies)
149
149

PAGE: 2 REPORT NUMBER: 15A0061 TS:mp SUBJECT: PAYMENT OF SITTING FEES FOR RISK MANAGEMENT & AUDIT
COMMITTEE RECOMMENDATIONS THAT the Committee resolve under delegated authority:- A. THAT Report Number 15A0061 TS:mp entitled Payment Of Sitting Fees For
Risk Management & Audit Committee, be received and noted. B. THAT remuneration for the external members of Council’s Risk Management
& Audit Committee (RMAC) be increased in line with the current rates as set out in the NT Government Statutory Bodies Class C1 (Advisory & Review Bodies) to take effect immediately
BACKGROUND Council adopted the current rate of sitting fees at its First Ordinary Council meeting on 15 November 2011. DECISION NO.20\4586. (15/11/11) Review of Risk Management & Audit Committee Members Remuneration Report No. 11A0194 (04/11/11) Common No. 1624782 A. THAT Report Number 11A0194 entitled, Audit Committee – Review of
Remuneration of Risk Management & Audit Committee Members, be received and noted.
B. THAT meeting fees for independent members of the Risk Management &
Audit Committee be based on the NT Government Statutory Bodies Class C1, Advisory and Review Bodies – Critical Issues which is currently set at:
- $880.00 per meeting for the Chairperson; and - $660.00 per meeting for the Committee Members
C. THAT the meeting fees for independent members of the Risk Management &
Audit Committee be reviewed every two (2) years. DISCUSSION The current rate of fees is $880 per session for the Chairperson and $660 for the other independent committee member. NT Government revised the sitting fees for members of advisory and review bodies effective from 1 August 2014. The new rates are $959 for Chairpersons and $719 for other members. It is recommended that the new rates be applied commencing immediately.
150
150

PAGE: 3 REPORT NUMBER: 15A0061 TS:mp SUBJECT: PAYMENT OF SITTING FEES FOR RISK MANAGEMENT & AUDIT
COMMITTEE CONSULTATION PROCESS In preparing this report, the following City of Darwin officers were consulted: Chief Executive Officer, Brendan Dowd POLICY IMPLICATIONS Nil BUDGET AND RESOURCE IMPLICATIONS Increase in sitting fees is not material and the increases will be absorbed within the overall Risk Audit & Safety section’s budget. RISK/LEGAL/LEGISLATIVE IMPLICATIONS Nil ENVIRONMENTAL IMPLICATIONS Nil COUNCIL OFFICER CONFLICT OF INTEREST DECLARATION We the Author and Approving Officers declare that we do not have a Conflict of Interest in relation to this matter. TONY SIMONS DIANA LEEDERTEAM COORDINATOR RISK, AUDIT & SAFETY
GENERAL MANAGER CORPORATE SERVICES
For enquiries, please contact Tony Simons on 8930 0573 or email: [email protected].
151
151

ENCL: YES
CORPORATE & ECONOMIC DEVELOPMENT COMMITTEE/OPEN
AGENDA ITEM: 9.7
REGISTER OF INVITATIONS ACCEPTED AND DECLINED BY THE LORD MAYOR FROM JANUARY - MARCH 2015
REPORT No.: 15TC0030 MB:sv COMMON No.: 1381402 DATE: 22/04/2015
Presenter: Executive Assistant to the Lord Mayor , Sally Vasey Approved: Executive Manager, Mark Blackburn PURPOSE The purpose of this report is to present the register of invitations accepted and declined by the Lord Mayor from January - March 2015. LINK TO STRATEGIC PLAN The issues addressed in this Report are in accordance with the following Goals/Strategies of the City of Darwin 2012 – 2016 as outlined in the ‘Evolving Darwin Towards 2020 Strategic Plan’:- KEY ISSUES The issues addressed in this Report are in accordance with the following Goals/Strategies of the City of Darwin 2012-2016 as outlined in the “Evolving Darwin Towards 2020 Strategic Plan”:- Goal 5 Effective and Responsible Governance Outcome 5.3 Good governance Key Strategies 5.3.1 Demonstrate good corporate practice and ethical behaviour RECOMMENDATIONS THAT the Committee resolve under delegated authority:- THAT Report Number 15TC0030 MB:sv entitled Register of Invitations Accepted and Declined by the Lord Mayor from January - March 2015, be received and noted.
152
152
PAGE: 2 REPORT NUMBER: 15TC0030 MB:sv SUBJECT: REGISTER OF INVITATIONS ACCEPTED AND DECLINED BY THE LORD
MAYOR FROM JANUARY - MARCH 2015 BACKGROUND Nil DISCUSSION Nil CONSULTATION PROCESS Nil POLICY IMPLICATIONS Nil BUDGET AND RESOURCE IMPLICATIONS Nil RISK/LEGAL/LEGISLATIVE IMPLICATIONS Nil ENVIRONMENTAL IMPLICATIONS Nil COUNCIL OFFICER CONFLICT OF INTEREST DECLARATION We the Author and Approving Officers declare that we do not have a Conflict of Interest in relation to this matter. SALLY VASEY MARK BLACKBURNEXECUTIVE ASSISTANT TO THE LORD MAYOR
EXECUTIVE MANAGER
For enquiries, please contact Sally Vasey on 89300517 or email: [email protected]. Attachments: Attachment A - Invitations Accepted and Declined by the Lord Mayor
from January - March 2015.
153
153

Attachment A
Date Time Invitee/Company Function Venue Attended By
20/01/2015 9:00am Tennis NT Australian Open Hisense Arena Melbourne Lord Mayor Katrina Fong Lim
24/01/2015 6:30pm Daryl Manzie HR, Chairman of the Australia Day Council
Australia Day Ball 2015 Darwin Convention Centre Lord Mayor Katrina Fong Lim
26/01/2015 5:00pmRon Mitchell, Program Manager Multicultural Association NT
4th Annual OzFusion Community Event
Kalymnian Community Hall Marrara
Lord Mayor Katrina Fong Lim
28/01/2015 1:00pm
Robyn Batten Executive Director and Mark Diamon Director Australian Regional and Remote Community Services (ARRCS)
ARRCS Sharing and Consultation Meeting
Darwin Memorial Uniting Church 78 Smith Street Darwin
Lord Mayor Katrina Fong Lim
30/01/2015 5:00pmLen Greenwood, Secretary/Treasurer Lodge Foelsche, No 211
Foelsche Memorial Service for the Late Inspector Paul Foelsche the First NT Police Inspector who died on 31st January 1914
Pioneer Cemetry Goyder Road Lord Mayor Katrina Fong Lim
Date Time Invitee/Company Function Venue Reason
22/01/2015 9:00am
The President, Mr Steve Healy and the CEO Mr Craig Tiley along with the Board and Directors of Tennis Australia
Viewing Australian Open 2015 from the President's Reserve Thursday 22nd Day Sessions
Rod Laver Arena Melbourne
Lord Mayor Katrina Fong Lim unable to attend to to travel arrangements being finalised to leave Melbourne on 21st January 2015.
26/01/2015 3:00pm His Worship The Mayor of Palmerston Mr Ian Abbott
Flag Raising and Citizenship Ceremony
Recreation Centre Palmerston Lord Mayor Katrina Fong Lim unable to attend due to prior commitment for Australia Day
26/01/2015 5:00pm His Worship The Mayor of Palmerston Mr Ian Abbott
2015 Australia Day Ambassador's Reception
Council Chambers, Chung Wah Terrace Palmerston
Lord Mayor Katrina Fong Lim unable to attend due to prior commitment for Australia Day
Invitations Accepted by Lord Mayor or Representative during January 2015
Invitations Declined by Lord Mayor or Representative during January 2015
154
154
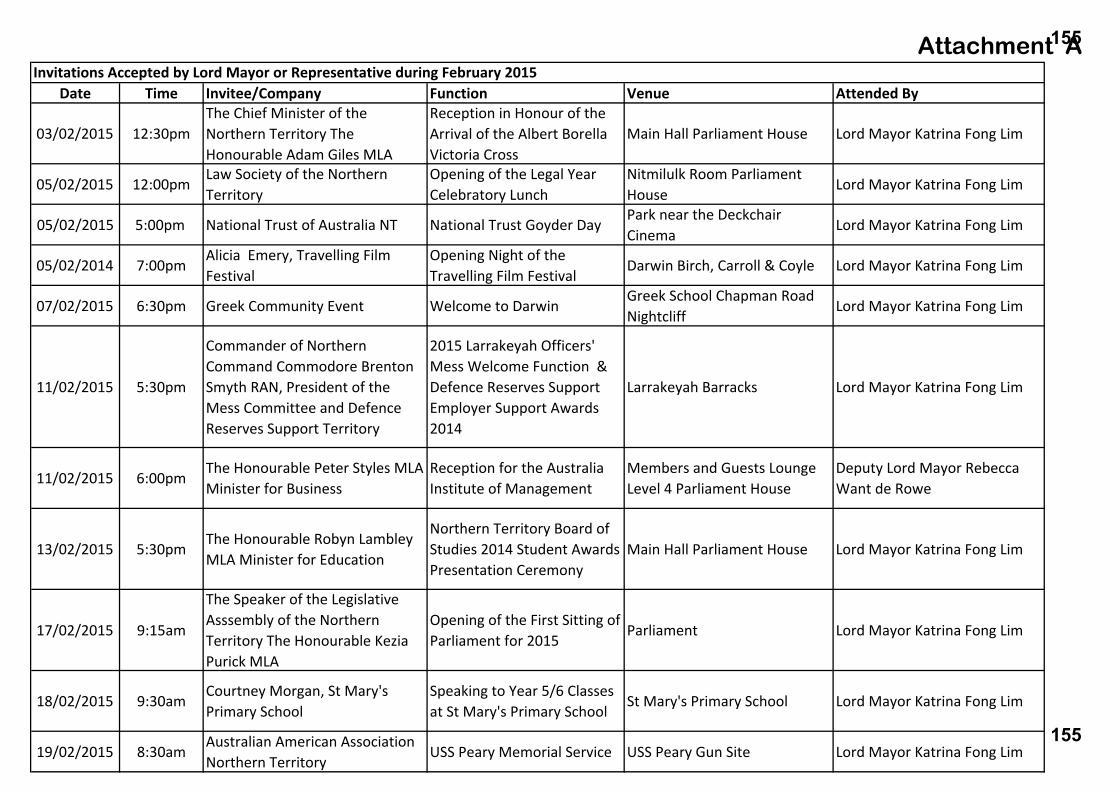
Attachment A
Date Time Invitee/Company Function Venue Attended By
03/02/2015 12:30pm The Chief Minister of the Northern Territory The Honourable Adam Giles MLA
Reception in Honour of the Arrival of the Albert Borella Victoria Cross
Main Hall Parliament House Lord Mayor Katrina Fong Lim
05/02/2015 12:00pmLaw Society of the Northern Territory
Opening of the Legal Year Celebratory Lunch
Nitmilulk Room Parliament House
Lord Mayor Katrina Fong Lim
05/02/2015 5:00pm National Trust of Australia NT National Trust Goyder Day Park near the Deckchair Cinema
Lord Mayor Katrina Fong Lim
05/02/2014 7:00pm Alicia Emery, Travelling Film Festival
Opening Night of the Travelling Film Festival
Darwin Birch, Carroll & Coyle Lord Mayor Katrina Fong Lim
07/02/2015 6:30pm Greek Community Event Welcome to Darwin Greek School Chapman Road Nightcliff
Lord Mayor Katrina Fong Lim
11/02/2015 5:30pm
Commander of Northern Command Commodore Brenton Smyth RAN, President of the Mess Committee and Defence Reserves Support Territory
2015 Larrakeyah Officers' Mess Welcome Function & Defence Reserves Support Employer Support Awards 2014
Larrakeyah Barracks Lord Mayor Katrina Fong Lim
11/02/2015 6:00pm The Honourable Peter Styles MLA Minister for Business
Reception for the Australia Institute of Management
Members and Guests Lounge Level 4 Parliament House
Deputy Lord Mayor Rebecca Want de Rowe
13/02/2015 5:30pm The Honourable Robyn Lambley MLA Minister for Education
Northern Territory Board of Studies 2014 Student Awards Presentation Ceremony
Main Hall Parliament House Lord Mayor Katrina Fong Lim
17/02/2015 9:15am
The Speaker of the Legislative Asssembly of the Northern Territory The Honourable Kezia Purick MLA
Opening of the First Sitting of Parliament for 2015
Parliament Lord Mayor Katrina Fong Lim
18/02/2015 9:30am Courtney Morgan, St Mary's Primary School
Speaking to Year 5/6 Classes at St Mary's Primary School
St Mary's Primary School Lord Mayor Katrina Fong Lim
19/02/2015 8:30am Australian American Association Northern Territory
USS Peary Memorial Service USS Peary Gun Site Lord Mayor Katrina Fong Lim
Invitations Accepted by Lord Mayor or Representative during February 2015
155
155
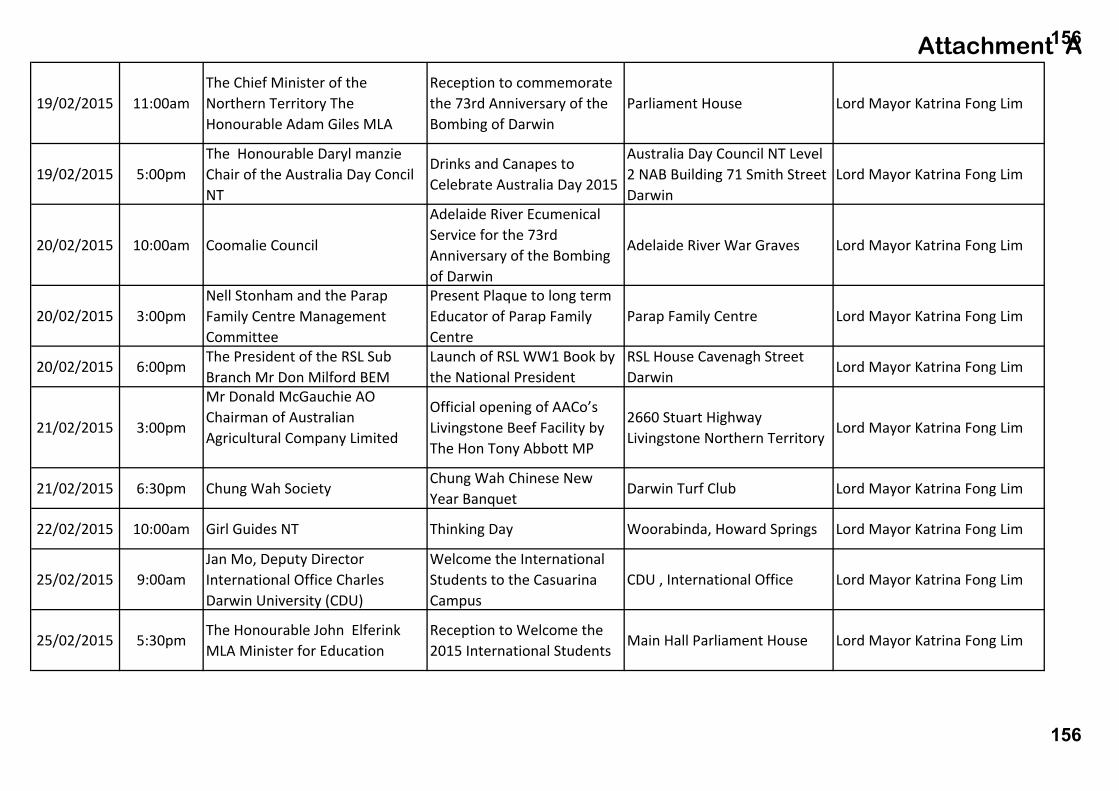
Attachment A
19/02/2015 11:00am The Chief Minister of the Northern Territory The Honourable Adam Giles MLA
Reception to commemorate the 73rd Anniversary of the Bombing of Darwin
Parliament House Lord Mayor Katrina Fong Lim
19/02/2015 5:00pm The Honourable Daryl manzie Chair of the Australia Day Concil NT
Drinks and Canapes to Celebrate Australia Day 2015
Australia Day Council NT Level 2 NAB Building 71 Smith Street Darwin
Lord Mayor Katrina Fong Lim
20/02/2015 10:00am Coomalie Council
Adelaide River Ecumenical Service for the 73rd Anniversary of the Bombing of Darwin
Adelaide River War Graves Lord Mayor Katrina Fong Lim
20/02/2015 3:00pm Nell Stonham and the Parap Family Centre Management Committee
Present Plaque to long term Educator of Parap Family Centre
Parap Family Centre Lord Mayor Katrina Fong Lim
20/02/2015 6:00pm The President of the RSL Sub Branch Mr Don Milford BEM
Launch of RSL WW1 Book by the National President
RSL House Cavenagh Street Darwin
Lord Mayor Katrina Fong Lim
21/02/2015 3:00pm
Mr Donald McGauchie AOChairman of Australian Agricultural Company Limited
Official opening of AACo’s Livingstone Beef Facility by The Hon Tony Abbott MP
2660 Stuart Highway Livingstone Northern Territory
Lord Mayor Katrina Fong Lim
21/02/2015 6:30pm Chung Wah Society Chung Wah Chinese New Year Banquet
Darwin Turf Club Lord Mayor Katrina Fong Lim
22/02/2015 10:00am Girl Guides NT Thinking Day Woorabinda, Howard Springs Lord Mayor Katrina Fong Lim
25/02/2015 9:00am Jan Mo, Deputy Director International Office Charles Darwin University (CDU)
Welcome the International Students to the Casuarina Campus
CDU , International Office Lord Mayor Katrina Fong Lim
25/02/2015 5:30pm The Honourable John Elferink MLA Minister for Education
Reception to Welcome the 2015 International Students
Main Hall Parliament House Lord Mayor Katrina Fong Lim
156
156

Attachment A
26/02/2015 Karen Schillermeer, Browns Mart
Officially launch our SHIMMER season of new, local theatre PLUS the launch of our Brown’s Mart ED (Education) program; announcement of the NT AIRPORTS BUILD UP grant recipients by Ian Kew.
Browns Mart Theatre Lord Mayor Katrina Fong Lim
27/02/2015 6:15am Host Commander 1st Brigade Brigadier Michael Ryan, AM
Army Birthday Cocktail Party Robertson Barracks Officers Mess
Lord Mayor Katrina Fong Lim
Date Time Invitee/Company Function Venue Reason
03/02/2015 5:30pm The Chief Minister of the Northern Territory The Honurable Adam Giles MLA
Reception in honour of the Albert Borella Victoria Cross
Main Hall Parliament House
Lord Mayor Katrina Fong Lim and Representative unable to attend due to Council Workshop that evening.
05/02/2015 5:15pmDarwin City and Waterfront Retailers Association
First Committee Meeting for 2015
Paspalis Centre Point Lord Mayor Katrina Fong Lim unable to attend due to prior commitment
13/02/2015 Mary Anne Butler Playwright Celebrity Karaoke night at Browns Mart Theatre on February 13, 2015
Browns Mart Theatre Lord Mayor unable to attend due to prior commitment
20/02/2015 8:30amThe Chief Minister of the Northern Territory The Honourable Adam Giles MLA
Witness the Commencement of the Borella Ride
Nyinkka Nyunyu Cultural Centre Tennant Creek
Lord Mayor Katrina Fong Lim unable due to commitments in Darwin
20/02/2015 6:30pm Michael Kuhn Church of Jesus Christ of Latter‐day Saints
Screening of Feature Documentary Meet The Mormons
The Church of Jesus Christ Latter‐day Saints Sabin Road and Trower Road Millner
Lord Mayor Katrina Fong Lim unable to attend due to prior commitment.
20/02/2015 7:30pmMohammed Raziuddin, Secretary Islamic Society of Darwin
Multi‐Faith Session Religions for Peace & Harmony
Charles Darwin University Blue 1.1.1
Lord Mayor unable to attend due to alternative commitment
Invitations Declined by Lord Mayor or Representative during February 2015
157
157
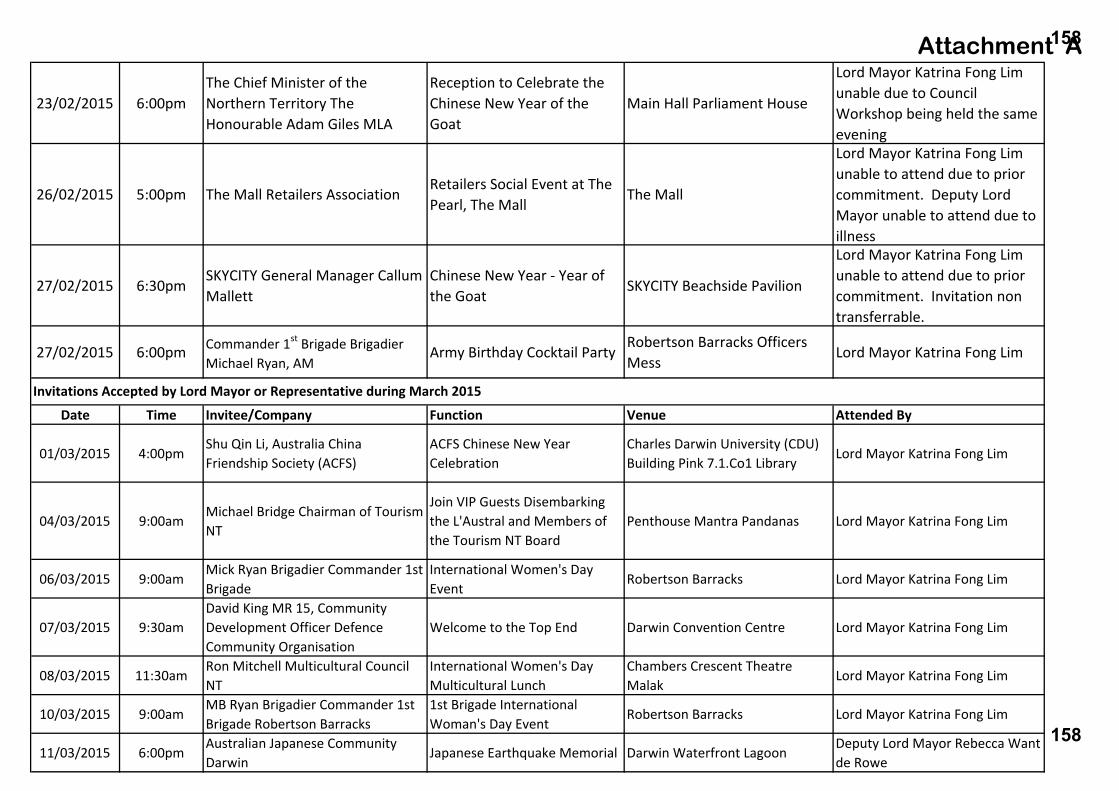
Attachment A
23/02/2015 6:00pm The Chief Minister of the Northern Territory The Honourable Adam Giles MLA
Reception to Celebrate the Chinese New Year of the Goat
Main Hall Parliament House
Lord Mayor Katrina Fong Lim unable due to Council Workshop being held the same evening
26/02/2015 5:00pm The Mall Retailers Association Retailers Social Event at The Pearl, The Mall
The Mall
Lord Mayor Katrina Fong Lim unable to attend due to prior commitment. Deputy Lord Mayor unable to attend due to illness
27/02/2015 6:30pm SKYCITY General Manager Callum Mallett
Chinese New Year ‐ Year of the Goat
SKYCITY Beachside Pavilion
Lord Mayor Katrina Fong Lim unable to attend due to prior commitment. Invitation non transferrable.
27/02/2015 6:00pm Commander 1st Brigade Brigadier Michael Ryan, AM
Army Birthday Cocktail Party Robertson Barracks Officers Mess
Lord Mayor Katrina Fong Lim
Date Time Invitee/Company Function Venue Attended By
01/03/2015 4:00pm Shu Qin Li, Australia China Friendship Society (ACFS)
ACFS Chinese New Year Celebration
Charles Darwin University (CDU) Building Pink 7.1.Co1 Library
Lord Mayor Katrina Fong Lim
04/03/2015 9:00amMichael Bridge Chairman of Tourism NT
Join VIP Guests Disembarking the L'Austral and Members of the Tourism NT Board
Penthouse Mantra Pandanas Lord Mayor Katrina Fong Lim
06/03/2015 9:00am Mick Ryan Brigadier Commander 1st Brigade
International Women's Day Event
Robertson Barracks Lord Mayor Katrina Fong Lim
07/03/2015 9:30am David King MR 15, Community Development Officer Defence Community Organisation
Welcome to the Top End Darwin Convention Centre Lord Mayor Katrina Fong Lim
08/03/2015 11:30amRon Mitchell Multicultural Council NT
International Women's Day Multicultural Lunch
Chambers Crescent Theatre Malak
Lord Mayor Katrina Fong Lim
10/03/2015 9:00am MB Ryan Brigadier Commander 1st Brigade Robertson Barracks
1st Brigade International Woman's Day Event
Robertson Barracks Lord Mayor Katrina Fong Lim
11/03/2015 6:00pm Australian Japanese Community Darwin
Japanese Earthquake Memorial Darwin Waterfront Lagoon Deputy Lord Mayor Rebecca Want de Rowe
Invitations Accepted by Lord Mayor or Representative during March 2015
158
158
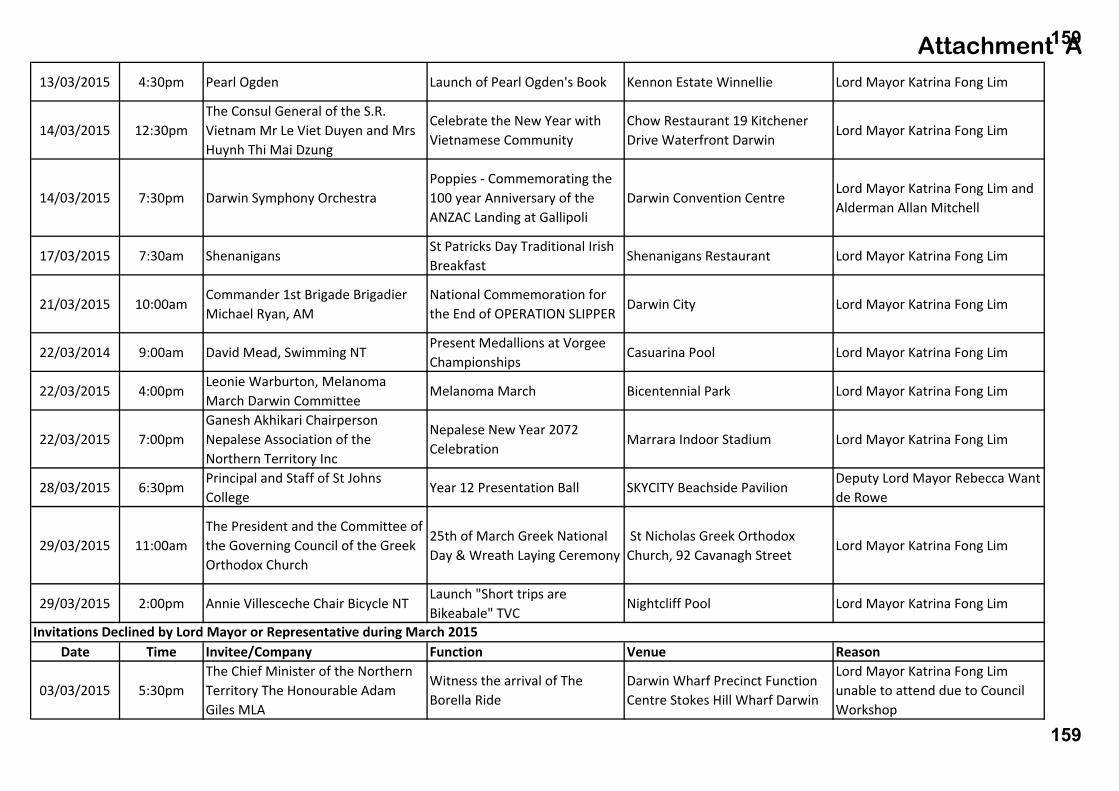
Attachment A 13/03/2015 4:30pm Pearl Ogden Launch of Pearl Ogden's Book Kennon Estate Winnellie Lord Mayor Katrina Fong Lim
14/03/2015 12:30pm The Consul General of the S.R. Vietnam Mr Le Viet Duyen and Mrs Huynh Thi Mai Dzung
Celebrate the New Year with Vietnamese Community
Chow Restaurant 19 Kitchener Drive Waterfront Darwin
Lord Mayor Katrina Fong Lim
14/03/2015 7:30pm Darwin Symphony Orchestra Poppies ‐ Commemorating the 100 year Anniversary of the ANZAC Landing at Gallipoli
Darwin Convention CentreLord Mayor Katrina Fong Lim and Alderman Allan Mitchell
17/03/2015 7:30am Shenanigans St Patricks Day Traditional Irish Breakfast
Shenanigans Restaurant Lord Mayor Katrina Fong Lim
21/03/2015 10:00am Commander 1st Brigade Brigadier Michael Ryan, AM
National Commemoration for the End of OPERATION SLIPPER
Darwin City Lord Mayor Katrina Fong Lim
22/03/2014 9:00am David Mead, Swimming NT Present Medallions at Vorgee Championships
Casuarina Pool Lord Mayor Katrina Fong Lim
22/03/2015 4:00pm Leonie Warburton, Melanoma March Darwin Committee
Melanoma March Bicentennial Park Lord Mayor Katrina Fong Lim
22/03/2015 7:00pm Ganesh Akhikari Chairperson Nepalese Association of the Northern Territory Inc
Nepalese New Year 2072 Celebration
Marrara Indoor Stadium Lord Mayor Katrina Fong Lim
28/03/2015 6:30pm Principal and Staff of St Johns College
Year 12 Presentation Ball SKYCITY Beachside Pavilion Deputy Lord Mayor Rebecca Want de Rowe
29/03/2015 11:00amThe President and the Committee of the Governing Council of the Greek Orthodox Church
25th of March Greek National Day & Wreath Laying Ceremony
St Nicholas Greek Orthodox Church, 92 Cavanagh Street
Lord Mayor Katrina Fong Lim
29/03/2015 2:00pm Annie Villesceche Chair Bicycle NT Launch "Short trips are Bikeabale" TVC
Nightcliff Pool Lord Mayor Katrina Fong Lim
Date Time Invitee/Company Function Venue Reason
03/03/2015 5:30pmThe Chief Minister of the Northern Territory The Honourable Adam Giles MLA
Witness the arrival of The Borella Ride
Darwin Wharf Precinct Function Centre Stokes Hill Wharf Darwin
Lord Mayor Katrina Fong Lim unable to attend due to Council Workshop
Invitations Declined by Lord Mayor or Representative during March 2015
159
159

Attachment A
06/03/2015 9:00am Paul Gibbs, Area Manager Defence Community Organisation Northern Territory
Welcome to the Top End Darwin Convention Centre Lord Mayor and Representative unable to attend due prior commitment
06/03/2015 12:30pm Vicki‐Leigh Lettice McDonalds Ronald McDonald House Fundraiser Long Lunch
SKYCITY Darwin Lord Mayor Katrina Fong Lim unable to attend due to prior commitment
07/03/2015 9:00am Annette Mertin, NT Police Fire and Emergency Services
Pink Stumps Day Marrara Cricket Complex Lord Mayor unable to attend due to prior commitment
07/03/2015 6:00pm Amanda Gunn, Darwin President Welcome Dinner Project, Joining the Dots
Melaleuca Refugee Centre Lord Mayor unable to attend due to prior commitment
06‐08/03/2015
6:00pm Ian Harkness Executive Officer Northern Territory Hockey Association
Hockey Marathon Fund Raiser Marrara Hockey Centre Lord Mayor unable to attend due to prior commitment
16/03/2015 6:00pm The Honourable Peter Styles MLA Minsiter for Multicultural Affairs
Reception for St Patrick's Day Nitmiluk Lounge Level 4 Parliament House
Lord Mayor and Representative unable to attend due to Council Workshop
18/03/2015 6:00pm Browns Mart Theatre Opening Night Broken Browns Mart Acting Lord Mayor unable to attend due to prior commitment
23/03/2015 5:30pm Guide Dogs SA/NT Chairman Joe Thorp and the Board
Cocktail Function The Atrium on the Avenue, 12 Salonika Street Parap
Acting Lord Mayor Rebecca Want de Rowe unable to attend due to illness
30/03/2014 6:00pm Judith Crompton Chief Commercial Officer Virgin Australia
Cocktail Reception to Celebrate the Opening of the New Virgin Australia Lounge, Darwin Airport
Virgin Lounge Australia Darwin Airport
Lord Mayor Katrina Fong Lim unable to attend due to Council Workshop
30/03/2015 30/03/2015
His Highness Sheikh Mohammed Bin Rashid Al Maktoum, UAE Vice President, Prime Minister and Ruler of Dubai
5th Annual Investment Meeting Dubai International Convention and Exhibition Building
Lord Mayor Katrina Fong Lim unable to attend due to prior commitments in Darwin
31/03/2015 7:00pm Senior ADF Officer RAAF Darwin, Wing Commander Wesley Perret ADC
94th Anniversary of the Royal Australian Air force
RAAF Base Darwin Lord Mayor Katrina Fong Lim and Representatives unable to attend due to Council Meeting
160
160

Attachment A Numbers of other Commitments for the Lord Mayor and her Representative for January ‐ March 2015
53 Internal Meetings44 External Meetings 13 Council Meetings and Workshops7 Council Committee Meetings9 City of Darwin Community Events attended3 Events Hosted including Citizenship Ceremonies 1 Visiting Dignitaries & Courtesy Visits1 Federal/Territory/Local Government Committee Meetings 0 Talk@TheTop ‐ Community Engagement 36 Media Commitments 1 Conferences attended by Lord Mayor
161
161

ENCL: YES
CORPORATE & ECONOMIC DEVELOPMENT COMMITTEE/OPEN
AGENDA ITEM: 9.8
REGISTER OF ELECTED MEMBERS PROFESSIONAL DEVELOPMENT FOR 2014/2015
REPORT No.: 15TC0029 MB:sv COMMON No.: 315321 DATE: 22/04/2015
Presenter: Executive Assistant to the Lord Mayor, Sally Vasey Approved: Executive Manager, Mark Blackburn PURPOSE The purpose of this report is to present the Register of Professional Development Expenditure for 2014/2015. LINK TO STRATEGIC PLAN The issues addressed in this Report are in accordance with the following Goals/Strategies of the City of Darwin 2012 – 2016 as outlined in the ‘Evolving Darwin Towards 2020 Strategic Plan’:- Goal 5 Effective and Responsible Governance Outcome 5.3 Good governance Key Strategies 5.3.1 Demonstrate good corporate practice and ethical behaviour KEY ISSUES The attachment provides the details of the Register of Professional Development Expenditure for 2014/2015. RECOMMENDATIONS THAT the Committee resolve under delegated authority:- THAT Report Number 15TC0029 MB:sv entitled Register of Elected Members Professional Development for 2014/2015, be received and noted. BACKGROUND Nil DISCUSSION Nil
162
162

PAGE: 2 REPORT NUMBER: 15TC0029 MB:sv SUBJECT: REGISTER OF ELECTED MEMBERS PROFESSIONAL DEVELOPMENT
FOR 2014/2015 CONSULTATION PROCESS In preparing this report, the following City of Darwin officers were consulted: Executive Manager Financial Accountant POLICY IMPLICATIONS Nil BUDGET AND RESOURCE IMPLICATIONS The Elected Members Professional Development Allowances were established in the Municipal Plan 2014/2015 as part of the budget deliberations. RISK/LEGAL/LEGISLATIVE IMPLICATIONS Nil ENVIRONMENTAL IMPLICATIONS Nil COUNCIL OFFICER CONFLICT OF INTEREST DECLARATION We the Author and Approving Officers declare that we do not have a Conflict of Interest in relation to this matter. SALLY VASEY MARK BLACKBURNEXECUTIVE ASSISTANT TO THE LORD MAYOR
EXECUTIVE MANAGER
For enquiries, please contact Sally Vasey on 89300517 or email: [email protected]. Attachments: Attachment A - Register of Professional Development Expenditure for 2014/2015
163
163
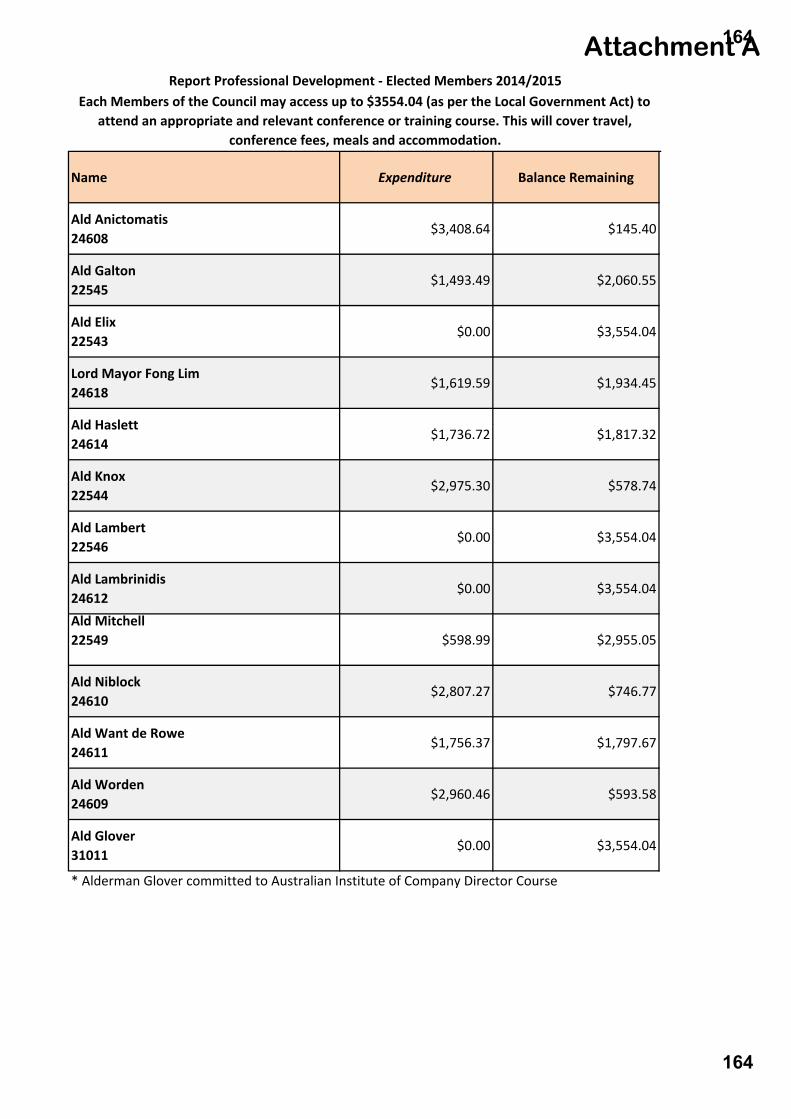
Attachment A
Name Expenditure Balance Remaining
Ald Anictomatis24608
$3,408.64 $145.40
Ald Galton 22545
$1,493.49 $2,060.55
Ald Elix22543
$0.00 $3,554.04
Lord Mayor Fong Lim24618
$1,619.59 $1,934.45
Ald Haslett24614
$1,736.72 $1,817.32
Ald Knox22544
$2,975.30 $578.74
Ald Lambert22546
$0.00 $3,554.04
Ald Lambrinidis24612
$0.00 $3,554.04
Ald Mitchell22549 $598.99 $2,955.05
Ald Niblock24610
$2,807.27 $746.77
Ald Want de Rowe24611
$1,756.37 $1,797.67
Ald Worden 24609
$2,960.46 $593.58
Ald Glover31011
$0.00 $3,554.04
* Alderman Glover committed to Australian Institute of Company Director Course
Report Professional Development ‐ Elected Members 2014/2015Each Members of the Council may access up to $3554.04 (as per the Local Government Act) to
attend an appropriate and relevant conference or training course. This will cover travel, conference fees, meals and accommodation.
164
164
OPEN SECTION CORP04/5
Corporate & Economic Development Committee Meeting – Wednesday, 22 April 2015
Wednesday, 22 April 2015 CORP04/5
Reports, recommendations and supporting documentation can be accessed via the City of Darwin Council Website at www.darwin.nt.gov.au, at Council Public Libraries or contact Penny Hart on (08) 8930 0670.
10. INFORMATION ITEMS 10.1 Draft Minutes - Risk Management & Audit Committee 27 March 2015
Document No. 3074647 (27/03/2015) Common No. 2948316 The draft minutes from the Risk Management & Audit Committee held on 27 March 2015, are Attachment A.
165
165

CONFIDENTIAL RMAC03/1
FRIDAY, 27 MARCH 2015
CONFIDENTIAL – Friday, 27 March 2015 RMAC03\1
`With the consent of the Committee on Friday 27 March 2015, (Decision 21\3171) all Decisions and Supporting Documents were moved from the Confidential Section of Council’s Minutes into the Open Section.
CITY OF DARWIN
MINUTES OF THE RISK MANAGEMENT & AUDIT COMMITTEE HELD IN MEETING ROOM 1, CIVIC CENTRE, HARRY CHAN AVENUE ON FRIDAY, 27 MARCH 2015 COMMENCING AT 9.00 AM. PRESENT: Mr Iain Summers (Chairman); Member R M Knox; Member S J Niblock; Mr
Craig Spencer. OFFICERS: Chief Executive Officer, Mr Brendan Dowd; General Manager Corporate
Services, Dr Diana Leeder; Executive Manager, Mr M Blackburn; Team Coordinator Risk Audit & Safety, Mr Tony Simons; Manager Climate Change & Environment, Ms S Gamble; Records Manager, Mr K Sohl; Finance Manager, Mr Miles Craighead; Committee Administrator, Mrs P Hart.
APOLOGY: Member R K Elix.
* * * INDEX * * * PAGE
1. MEETING DECLARED OPEN ................................................................................... 3 2. APOLOGIES AND LEAVE OF ABSENCE ............................................................... 3 3. DECLARATION OF INTEREST OF MEMBERS AND STAFF ................................. 3 4. CONFIDENTIAL ITEMS ............................................................................................ 4 5. CONFIRMATION OF MINUTES PERTAINING TO THE PREVIOUS RISK
MANAGEMENT & AUDIT COMMITTEE MEETING
Friday, 07 March 2014 ........................................................................................ 4 Friday, 31 October 2014 ..................................................................................... 4
6. BUSINESS ARISING FROM THE MINUTES PERTAINING TO THE
PREVIOUS RISK MANAGEMENT & AUDIT COMMITTEE MEETING 6.1 Business Arising......................................................................................................... 5 7. INFORMATION ITEMS 7.1 Review of Outstanding Audit Issues Register ............................................................ 5
166
166

CONFIDENTIAL RMAC03/2
FRIDAY, 27 MARCH 2015
CONFIDENTIAL – Friday, 27 March 2015 RMAC03\2
8. ACTION ITEMS ......................................................................................................... 5 9. OFFICERS REPORTS 9.1 Progress of Control Self-Assessment ........................................................................ 5 9.2 Progress of Risk Management Framework ................................................................ 6 9.3 Audit Closing Report 2014 - Management Response ................................................ 6 9.4 Audited Financial Statements For The Year Ended 30 June 2013 -
Outstanding Issues .................................................................................................... 6 9.5 Progress Report On Outstanding Audit Issue 142 ..................................................... 7 9.6 Depreciation Expense 2015 ....................................................................................... 7 9.7 Assessment Of Asset Management Processes - Deloitte 2014 ................................. 8 9.8 Outstanding Audit Issue 122 - Review of Fraud Management Arrangements ........... 8 9.9 Report On Records Management Review ................................................................. 9 9.10 Outstanding Audit Issue No. 143 - Environmental Management System
Assessment.............................................................................................................. 10 9.11 Progress Report on the Internal Audit Plan .............................................................. 10 9.12 Internal Audit - Council Decisions ............................................................................ 11 9.13 Internal Audit - Elected Members Allowances .......................................................... 11 9.14 Outstanding Audit Issue No. 139 - Assessment Of Procurement Processes .......... 12 10. GENERAL BUSINESS 10.1 Risk Management & Audit Committee Operation .................................................... 12
11. MOVING OF CONFIDENTIAL DECISIONS & SUPPORTING
DOCUMENTS AFTER DISCUSSION ...................................................................... 12 12. CLOSURE OF MEETING ........................................................................................ 13
167
167

CONFIDENTIAL RMAC03\3
Risk Management & Audit Committee Meeting – Friday, 27 March 2015
CONFIDENTIAL – Friday, 27 March 2015 RMAC03\3
1. MEETING DECLARED OPEN The Chairman declared the meeting open at 9.04 am. 2. APOLOGIES AND LEAVE OF ABSENCE 2.1 Apologies Nil 2.2 Leave of Absence Granted (Knox/Niblock) THAT it be noted Member R K Elix is an apology due to a Leave of Absence previously granted on 24 February 2015, for the period 24 March 2015 to 30 March 2015. DECISION NO.21\3151 (27/03/15) Carried 2.3 Leave of Absence Requested Nil 3. DECLARATION OF INTEREST OF MEMBERS AND STAFF 3.1 Declaration of Interest by Members Nil 3.2 Declaration of Interest by Staff Nil
168
168
CONFIDENTIAL RMAC03\4
Risk Management & Audit Committee Meeting – Friday, 27 March 2015
CONFIDENTIAL – Friday, 27 March 2015 RMAC03\4
4. CONFIDENTIAL ITEMS 4.1 Closure to the Public for Confidential Items
Common No. 1944604 (Niblock/Knox) COMMITTEE’S DECISION THAT pursuant to Section 65(2) of the Local Government Act and Regulation 8 of the Local Government (Administration) Regulations the meeting be closed to the public to consider the following Items:-
Item Regulation Reason 7.1 8(c)(iv) information that would, if publicly
disclosed, be likely to prejudice the interests of the council or some other person
9.1-9.14 8(c)(iv) information that would, if publicly disclosed, be likely to prejudice the interests of the council or some other person
DECISION NO.21\3152 (27/03/15) Carried 5. CONFIRMATION OF MINUTES PERTAINING TO THE PREVIOUS RISK
MANAGEMENT & AUDIT COMMITTEE MEETING 5.1 Risk Management & Audit Committee Meeting held on Friday,
7 March 2014 (Summers/Niblock) COMMITTEE’S DECISION THAT the minutes of the previous Confidential Risk Management & Audit Committee Meeting held on Friday, 07 March 2014, tabled by the Chairman, be received and confirmed as a true and correct record of the proceedings of that meeting. DECISION NO.21\3153 (27/03/15) Carried 5.2 Risk Management & Audit Committee Meeting held on Friday,
31 October 2014 (Niblock/Knox) COMMITTEE’S DECISION THAT the minutes of the previous Open Risk Management & Audit Committee Meeting held on Friday, 31 October 2014, tabled by the Chairman, be received and confirmed as a true and correct record of the proceedings of that meeting. DECISION NO.21\3154 (27/03/15) Carried
169
169

CONFIDENTIAL RMAC03\5
Risk Management & Audit Committee Meeting – Friday, 27 March 2015
CONFIDENTIAL – Friday, 27 March 2015 RMAC03\5
6. BUSINESS ARISING FROM THE MINUTES PERTAINING TO THE PREVIOUS RISK MANAGEMENT & AUDIT COMMITTEE MEETING
6.1 Business Arising The Committee was advised that the committee evaluation process is on track to be presented to the May 2015 Risk Management & Audit Committee Meeting. 7. INFORMATION ITEMS 7.1 Review of Outstanding Audit Issues Register
Common No. 422690 (Knox/Niblock) COMMITTEE’S DECISION THAT the Committee resolve under delegated authority:- A. THAT the Outstanding Audit Issues Register as at 12 March 2015, be received
and noted. B. THAT the revised due date for Outstanding Audit Issue No. 140 be May 2015. DECISION NO.21\3155 (27/03/15) Carried
ACTION: EA TO GM CORP 8. ACTION ITEMS Nil 9. OFFICERS REPORTS 9.1 Progress of Control Self-Assessment
Report No. 15A0021 TS:mp (27/03/15) Common No. 1536877 (Niblock/Knox) COMMITTEE’S DECISION THAT the Committee resolve under delegated authority: THAT Report Number 15A0021 TS:mp entitled Progress of Control Self-Assessment, be received and noted. DECISION NO.21\3156 (27/03/15) Carried
170
170
CONFIDENTIAL RMAC03\6
Risk Management & Audit Committee Meeting – Friday, 27 March 2015
CONFIDENTIAL – Friday, 27 March 2015 RMAC03\6
9.2 Progress of Risk Management Framework Report No. 15A0020 TS:mp (27/03/15) Common No. 2363571
(Knox/Niblock) COMMITTEE’S DECISION THAT the Committee resolve under delegated authority: THAT Report Number 15A0020 TS:mp entitled Progress of Risk Management Framework, be received and noted. DECISION NO.21\3157 (27/03/15) Carried 9.3 Audit Closing Report 2014 - Management Response
Report No. 15A0039 MC:mp (27/03/15) Common No. 2251082 (Niblock/Knox) COMMITTEE’S DECISION THAT the Committee resolve under delegated authority: A. THAT Report Number 15A0039 MC:mp entitled Audit Closing Report 2014 -
Management Response, be received and noted. B. THAT the Committee note the proposal that the current format of the “Management
Discussion and Analysis” be replaced with an executive summary that might include frequently asked questions.
DECISION NO.21\3158 (27/03/15) Carried ACTION: MANAGER FINANCE 9.4 Audited Financial Statements for the Year Ended 30 June 2013 -
Outstanding Issues Report No. 15A0043 MC:mp (27/03/15) Common No. 2527584
(Knox/Niblock) COMMITTEE’S DECISION THAT the Committee resolve under delegated authority: A. THAT Report Number 15A0043 MC:mp entitled Audited Financial Statements for
the Year Ended 30 June 2013 - Outstanding Issues, be received and noted. B. THAT Outstanding Audit Issue 141 be amended to the status of complete. DECISION NO.21\3159 (27/03/15) Carried ACTION: EA TO GM CORP
NOTE: MANAGER FINANCE, GM CORP
171
171

CONFIDENTIAL RMAC03\7
Risk Management & Audit Committee Meeting – Friday, 27 March 2015
CONFIDENTIAL – Friday, 27 March 2015 RMAC03\7
9.5 Progress Report On Outstanding Audit Issue 142 Report No. 15A0038 LC:mp (27/03/15) Common No. 1536877
(Niblock/Knox) COMMITTEE’S DECISION THAT the Committee resolve under delegated authority: A. THAT Report Number 15A0038 LC:mp entitled Progress Report on Outstanding
Audit Issue 142, be received and noted. B. THAT Outstanding Audit Issue 142 be transferred to the completed audit issues
register. DECISION NO.21\3160 (27/03/15) Carried ACTION: EA TO GM CORP
NOTE: MANAGER BUSINESS SERVICES, GM CORP 9.6 Depreciation Expense 2015
Report No. 15A0034 DL:mp (27/03/15) Common No. 2999553 (Niblock/Knox) COMMITTEE’S DECISION THAT the Committee resolve under delegated authority: A. THAT Report Number 15A0034 DL:mp entitled Depreciation Expense 2015, be
received and that the Committee noted the effect that the revaluations will have on the depreciation charge in 2014/15.
B. THAT the Committee note that a report will be prepared on Depreciation Expense
2015 for the Corporate & Economic Development Committee. DECISION NO.21\3161 (27/03/15) Carried
ACTION: MANAGER FINANCE NOTE: GM CORP
Mr Craig Spencer joined the meeting at 10.27 am.
172
172

CONFIDENTIAL RMAC03\8
Risk Management & Audit Committee Meeting – Friday, 27 March 2015
CONFIDENTIAL – Friday, 27 March 2015 RMAC03\8
9.7 Assessment of Asset Management Processes - Deloitte 2014 Report No. 15A0040 MC:mp (27/03/15) Common No. 1713107
(Niblock/Knox) COMMITTEE’S DECISION THAT the Committee resolve under delegated authority: A. THAT Report Number 15A0040 MC:mp entitled Assessment of Asset Management
Processes - Deloitte 2014, be received and noted. B. THAT Management agreed recommendations not yet completed be added to the
Outstanding Audit Issues Register (with the exception of the table on minor matters).
C. THAT the following Outstanding Audit Issues be removed from the register as they
are covered by the more up to date Deloitte assessment of asset management processes which will provide an improved focus:
a. Outstanding Audit Issue 116 “Asset Management & Financial Sustainability
Review” (stemming from Access Economics and Jeff Roorda & Associates reviews).
b. Outstanding Audit Issue 137 Asset Management Plan – originally part of Outstanding Audit Issue 116.
D. THAT a presentation on the Asset Finda system and its relationship with
Map Info and Authority come to the Committee in May 2015. DECISION NO.21\3162 (27/03/15) Carried ACTION: EA TO GM CORP, MANAGER FINANCE 9.8 Outstanding Audit Issue 122 - Review of Fraud Management Arrangements
Report No. 15A0041 MC:mp (27/03/15) Common No. 2862013 (Niblock/Spencer) COMMITTEE’S DECISION THAT the Committee resolve under delegated authority: A. THAT Report Number 15A0041 MC:mp entitled Outstanding Audit Issue 122 -
Review of Fraud Management Arrangements, be received and noted. B. THAT the Outstanding Audit Issues Register be amended to have a completion
date of 31 October 2015 for Outstanding Audit Issue 122 – Review of Fraud Management Arrangements item 2.2.5 (1.2.4).
DECISION NO.21\3163 (27/03/15) Carried ACTION: MANAGER FINANCE, EA TO GM CORP
173
173

CONFIDENTIAL RMAC03\9
Risk Management & Audit Committee Meeting – Friday, 27 March 2015
CONFIDENTIAL – Friday, 27 March 2015 RMAC03\9
9.9 Report on Records Management Review Report No. 15A0031 KS:mp (27/03/15) Common No. 3027964
Records Manager Mr K Sohl was in attendance from 10.53 am. (Knox/Spencer) COMMITTEE’S DECISION THAT the Committee resolve under delegated authority: A. THAT Report Number 15A0031 KS:mp entitled Report on Records Management
Review, be received and noted. B. THAT the Committee note that the actions relate more specifically to operational
issues and business re-engineering for the Records Management Unit and not relate to internal control issues per se.
C. THAT the implementation of actions be managed through the Chief Officers’ Group,
the General Manager Corporate Services and the Records Manager. D. THAT any risk and control issues identified during the implementation, the review of
the Records Management Unit and the implementation of the new version of Council’s Corporate Information System ECM be added to the Corporate Services operational risk assessment and be presented to the committee as part of the continuing review of risk management processes.
E. THAT Outstanding Audit Issue 142 (Corporate Information A, B and C) be
transferred to the completed audit register. F. THAT the implementation timeline of the identified projects to deal with the internal
audit issues be presented to the May 2015 meeting. DECISION NO.21\3164 (27/03/15) Carried ACTION: MANAGER RECORDS, EA TO GM CORP
NOTE: GM CORP
174
174
CONFIDENTIAL RMAC03\10
Risk Management & Audit Committee Meeting – Friday, 27 March 2015
CONFIDENTIAL – Friday, 27 March 2015 RMAC03\10
9.10 Outstanding Audit Issue No. 143 - Environmental Management System Assessment Report No. 14TS0257 SG:nj (27/03/15) Common No. 1713107
Manager Climate Change & Environment Ms S Gamble was in attendance from 11.01 am. (Knox/Niblock) COMMITTEE’S DECISION THAT the Committee resolve under delegated authority: A. THAT Report Number 14TS0257 SG:nj entitled Outstanding Audit Issue No. 143 –
Environmental Management System Assessment, be received and noted. B. THAT Outstanding Audit Issue No. 143, Sections 3.1, 3.2, 3.9 and 3.10 be moved
to the Completed Audit Issues Register. C. THAT the Outstanding Audit Issue Register be amended to have a completion date
of July 2015 for Outstanding Audit Issue No. 143, Section 3.3 and 3.4. DECISION NO.21\3165 (27/03/15) Carried ACTION: EA TO GM CORP
NOTE: MANAGER CLIMATE CHANGE & ENVIRONMENT 9.11 Progress Report on the Internal Audit Plan
Report No. 15A0019 TS:mp (27/03/15) Common No. 1536877 (Spencer/Knox) COMMITTEE’S DECISION THAT the Committee resolve under delegated authority: A. THAT Report Number 15A0019 TS:mp entitled Progress Report on the Internal
Audit Plan, be received and noted. B. THAT Attachment B to Report Number 15A0019 TS:mp, the amended Internal
Audit Plan for 2014/15, be approved except that the Fleet & Fuel Rebate internal audit should be removed as it does not have a clear link to the risk registers; and noting that the Credit Card Management Audit has been removed as all items have been addressed in a recent procurement audit.
C. THAT the committee invites Management to propose an alternate risk register
based internal audit topic. DECISION NO.21\3166 (27/03/15) Carried ACTION: TEAM COORDINATOR RISK AUDIT & SAFETY
175
175
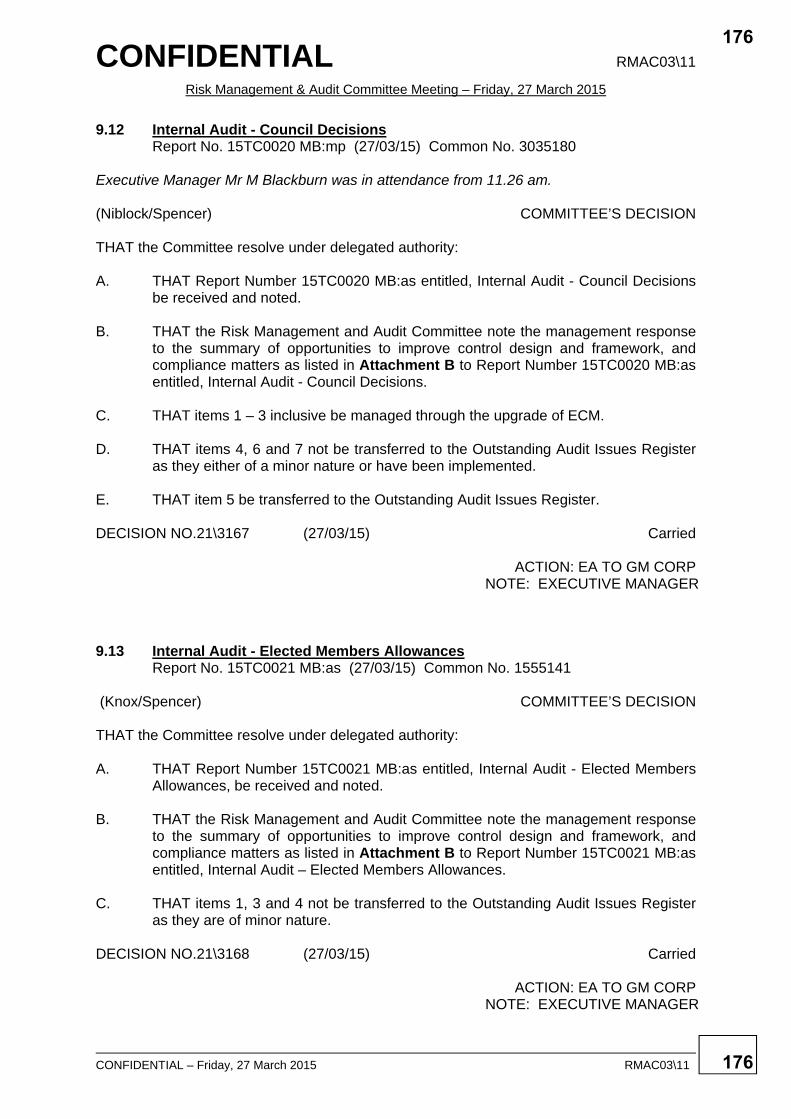
CONFIDENTIAL RMAC03\11
Risk Management & Audit Committee Meeting – Friday, 27 March 2015
CONFIDENTIAL – Friday, 27 March 2015 RMAC03\11
9.12 Internal Audit - Council Decisions Report No. 15TC0020 MB:mp (27/03/15) Common No. 3035180
Executive Manager Mr M Blackburn was in attendance from 11.26 am. (Niblock/Spencer) COMMITTEE’S DECISION THAT the Committee resolve under delegated authority: A. THAT Report Number 15TC0020 MB:as entitled, Internal Audit - Council Decisions
be received and noted. B. THAT the Risk Management and Audit Committee note the management response
to the summary of opportunities to improve control design and framework, and compliance matters as listed in Attachment B to Report Number 15TC0020 MB:as entitled, Internal Audit - Council Decisions.
C. THAT items 1 – 3 inclusive be managed through the upgrade of ECM.
D. THAT items 4, 6 and 7 not be transferred to the Outstanding Audit Issues Register
as they either of a minor nature or have been implemented.
E. THAT item 5 be transferred to the Outstanding Audit Issues Register. DECISION NO.21\3167 (27/03/15) Carried ACTION: EA TO GM CORP
NOTE: EXECUTIVE MANAGER 9.13 Internal Audit - Elected Members Allowances
Report No. 15TC0021 MB:as (27/03/15) Common No. 1555141 (Knox/Spencer) COMMITTEE’S DECISION THAT the Committee resolve under delegated authority: A. THAT Report Number 15TC0021 MB:as entitled, Internal Audit - Elected Members
Allowances, be received and noted. B. THAT the Risk Management and Audit Committee note the management response
to the summary of opportunities to improve control design and framework, and compliance matters as listed in Attachment B to Report Number 15TC0021 MB:as entitled, Internal Audit – Elected Members Allowances.
C. THAT items 1, 3 and 4 not be transferred to the Outstanding Audit Issues Register
as they are of minor nature. DECISION NO.21\3168 (27/03/15) Carried ACTION: EA TO GM CORP
NOTE: EXECUTIVE MANAGER
176
176
CONFIDENTIAL RMAC03\12
Risk Management & Audit Committee Meeting – Friday, 27 March 2015
CONFIDENTIAL – Friday, 27 March 2015 RMAC03\12
9.14 Outstanding Audit Issue No. 139 - Assessment of Procurement Processes
Report No. 15A0042 MC:mp (27/03/15) Common No. 1536877 (Niblock/Spencer) COMMITTEE’S DECISION THAT the Committee resolve under delegated authority:- A. THAT Report Number 15A0042 MC:mp entitled Outstanding Audit Issue No. 139 -
Assessment of Procurement Processes, be received and noted. B. THAT Outstanding Audit Issue No. 139, items 3.3.6 a-b relating to small suppliers
and events planning be transferred to the completed audit issues register as it is already recorded in operating procedures.
C. THAT Outstanding Audit Issue No. 139 item 3.4.2 a, credit card policy/procedure
improvements be amended to completed status. DECISION NO.21\3169 (27/03/15) Carried ACTION: EA TO GM CORP
NOTE: MANAGER FINANCE 10. GENERAL BUSINESS 10.1 Risk Management & Audit Committee Operation
Common No. 2989430 (Summers/Niblock) THAT the Risk Management & Audit Committee will operate consistent with all other Council committees and that the Terms of Reference be updated to reflect this. DECISION NO.21\3170 (27/03/15) Carried
ACTION: EA TO GM CORP, CA 11. MOVING OF CONFIDENTIAL DECISIONS & SUPPORTING DOCUMENTS
AFTER DISCUSSION (Spencer/Knox) THAT all decisions and supporting documents from this, the Risk Management & Audit Committee held on Friday, 27 March 2015, be moved into Open. DECISION NO.21\3171 (27/03/15) Carried
177
177

CONFIDENTIAL RMAC03\13
Risk Management & Audit Committee Meeting – Friday, 27 March 2015
CONFIDENTIAL – Friday, 27 March 2015 RMAC03\13
12. CLOSURE OF MEETING The meeting closed at 12.09 pm.
MR IAIN SUMMERS (CHAIRMAN) – RISK MANAGEMENT & AUDIT COMMITTEE MEETING – FRIDAY, 27 MARCH 2015
Confirmed On: Friday, 29 May 2015 Chairman:
178
178
OPEN SECTION CORP04/6
Corporate & Economic Development Committee Meeting – Wednesday, 22 April 2015
Wednesday, 22 April 2015 CORP04/6
Reports, recommendations and supporting documentation can be accessed via the City of Darwin Council Website at www.darwin.nt.gov.au, at Council Public Libraries or contact Penny Hart on (08) 8930 0670.
10. INFORMATION ITEMS 10.2 Darwin City Waterfront Retailers Association - Progress Report
Document No. 3073393 (22/04/2015) Common No. 2854897 The Darwin City Waterfront Retailers Association Progress Report is Attachment B.
179
179
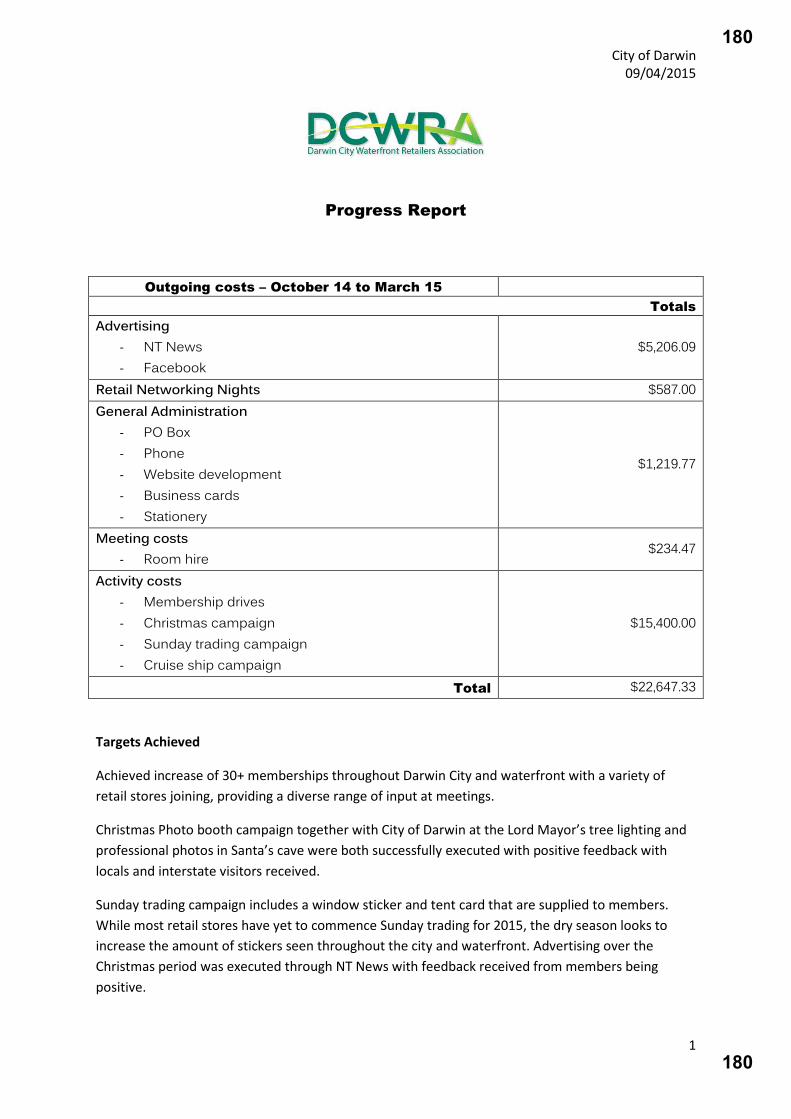
City of Darwin
09/04/2015
1
Progress Report
Outgoing costs – October 14 to March 15
Totals
Advertising
- NT News
$5,206.09
Retail Networking Nights $587.00
General Administration
- PO Box
- Phone
- Website development
- Business cards
- Stationery
$1,219.77
Meeting costs
- Room hire $234.47
Activity costs
- Membership drives
- Christmas campaign
- Sunday trading campaign
- Cruise ship campaign
$15,400.00
Total $22,647.33
Targets Achieved
Achieved increase of 30+ memberships throughout Darwin City and waterfront with a variety of
retail stores joining, providing a diverse range of input at meetings.
Christmas Photo booth campaign together with City of Darwin at the Lord Mayor’s tree lighting and
professional photos in Santa’s cave were both successfully executed with positive feedback with
locals and interstate visitors received.
Sunday trading campaign includes a window sticker and tent card that are supplied to members.
While most retail stores have yet to commence Sunday trading for 2015, the dry season looks to
increase the amount of stickers seen throughout the city and waterfront. Advertising over the
Christmas period was executed through NT News with feedback received from members being
positive.
180
180
City of Darwin
09/04/2015
2
Cruise ship campaign included a short video with a range of retailers promoting a special deal for
cruise ship passengers and locals promoted via social media. DCWRA branded balloons were
distributed to members and throughout the city and waterfront, creating activity and colour in
conjunction with Tourism NT’s marketing.
Following on from cruise ship week, the association has continued to distribute balloons each time a
cruise ship arrives. Actively discussing destinations and recommending stores to passengers as
they’re greeted at the waterfront entrance.
DCWRA has held 2 successful retailers networking events, inviting over 40+ retailers to learn what
the association is about and the direction in which we are heading for 2015. These events have
created a good hype amongst retailers and several membership enquiries are always received.
DCWRA has successful built solid relationships with NT News, Darwin Waterfront Corporation and
Tourism NT to ensure maximum coverage and support is received on all event’s / campaigns rolled
out by the Association as well as in return to support their activities.
Association administration support
General administration support has been working with accountants to bring all the associations
accounts to order for audit and tax return purposes. Ensuring that all requirements are adhered to
as per the grants requirements.
DCWRA Committee vacancies have been filled with a strong and diverse range of decision makers in
these roles. Meetings are run formally ensuring the association complies with its constitution as well
as increasing the number of meetings with strategic planning meetings.
The Association committee received invitations to the Small Business Association conference and
Gala dinner with both the President and Vice President attending.
What to achieve in 3 months
Recently the committee met for its strategic planning meeting. The events calendar was discussed at
length and finalised that night. All events and campaigns were agreed on with what’s planned for
2015 and how DCWRA plan to activate the city and waterfront retailers.
Together with City of Darwin, Tourism NT and Waterfront Corporation, DCWRA is working at
supporting all city and waterfront activities as well as discuss any extra support or promotion that
could be supplied.
Forming solid relationships with our members we aim to achieve an increase in memberships
totalling 100 retailers.
181
181
OPEN SECTION CORP04/7
Corporate & Economic Development Committee Meeting – Wednesday, 22 April 2015
Wednesday, 22 April 2015 CORP04/7
Reports, recommendations and supporting documentation can be accessed via the City of Darwin Council Website at www.darwin.nt.gov.au, at Council Public Libraries or contact Penny Hart on (08) 8930 0670.
11. GENERAL BUSINESS
182
182