Embed Size (px)
Citation preview

1
1
Corporate carbon footprint for country Climate Change mitigation: a case 2
study of a tannery in Turkey 3
4
Eylem Kılıç1, Rita Puig2,3, Gökhan Zengin4, Candaş Adıgüzel Zengin4, Pere Fullana-i-Palmer3,5 5
1 Usak University, Material Science and Nanotechnology Engineering Department,1 Eylul Campus, 64200, Usak, 6
Turkey, Phone: +90-276-2212121, email: [email protected] 7
2 Universitat Politècnica de Catalunya (UPC), EEI, Igualada School of Engineering, 08700, Igualada, Barcelona, 8
Spain. 9
3 Cyclus Vitae Solutions, S.L., Avinguda Caresmar 33, 1; 08700 Igualada, Spain 10
4 Ege University, Leather Engineering Department, 35000, Izmir, Turkey. Phone: +90-232-3112644, 11
[email protected]; [email protected] 12
5 UNESCO Chair in Life Cycle and Climate Change (ESCI-UPF), Pg. Pujades 1, 08003 Barcelona, Spain. 13
14
*Corresponding author: Rita Puig, Tel.:+34938035300. E-mail address: [email protected] 15
16
Abstract 17
Assessment of carbon emissions and environmental impact of production is indispensable to achieve a 18
sustainable industrial production in Turkey, especially for those companies willing to compete in new 19
international green markets. 20
Please cite this article as: Eylem Kılıç, Rita Puig, Gökhan Zengin, Candaş Adıgüzel
Zengin, Pere Fullana-i-Palmer. Corporate carbon footprint for country Climate Change
mitigation: A case study of a tannery in Turkey. Science of The Total Environment, 635,
2018, 60–69.

2
In this case study, corporate carbon footprint of a representative Turkish tanning company was analyzed. 21
Inventory and impact data are presented to help in the environmental decision-making process. The 22
results indicate that significant environmental impacts were caused during the landfilling of solid wastes 23
as well as the production of the electricity and fuel required in the tannery. Turkish tannery inventory 24
data presented here for the first time will be useful for leather tanning company managers to calculate 25
sustainability key indicators. 26
Improving alternatives at country level were identified (increasing the renewable sources on electricity 27
production and promote energy recovery in landfills) which would be useful not only to decrease 28
greenhouse gas (GHG) emissions of tanning sector but also of other industries requiring electricity and 29
producing organic wastes. Considering the substantial contribution of industrial processes to the Turkish 30
carbon emissions (15.7%) (TUIK, 2013), work done on those areas would provide a sound improvement 31
in environmental profile of Turkey. The importance to promote a national strategy to reduce GHG 32
emissions in Turkey was discussed here, as well as its relation to corporate carbon footprint assessments. 33
One of the significant points revealed from the case study is the lack of published country specific 34
emission factors for Turkey, which is a fundamental prerequisite to promote corporate carbon footprint 35
assessment within the country. 36
Keywords: sustainable production, greenhouse gases (GHG) emissions, Turkish leather industry, 37
electricity mix, waste recycling 38
39
1. Introduction 40
1.1. Leather industry and climate change in Turkey. 41
Turkey is considered as a newly industrialized country with a background of rapid economic growth. 42
Industry is one of the three major contributors to CO2 emissions Turkish economy (OECD/IEA, 2016). 43
Although Turkey´s greenhouse gas emissions (GHGs) as carbon dioxide equivalent (CO2-eq.) (6.02 44

3
tonnes CO2/capita) is below OECD1 Europe average of 8.31 tonnes CO2/capita (Akbostancı et al., 2011; 45
OECD/IEA, 2016) the shares of CO2 emissions have increased by 118% in 2014 compared to the 46
emissions in 1990 and reflects its rapid industrial growth and increase in energy consumption associated 47
with increasing demand (TUIK, 2016). Furthermore in line with Turkey´s development targets the level 48
of CO2 emission is foreseen to rise six-fold by 2025 with respect to the level of emissions in 1990 (Lise, 49
2006). 50
Leather and leather product industry is one of the foremost traditional sectors of Turkey, with an annual 51
export value around US$ 1.3 million in 2015, and footwear is the most important item (51% of total 52
leather goods exports) (Leather Wear Report, 2016). Over the past decade the evolution of climate 53
change into a global concern and increasing awareness on the environmental impact of production 54
processes has enforced leather manufacturers to provide more information and to meet higher 55
environmental standards. 56
1.2. Leather processes and life cycle assessment 57
Life cycle assessment (LCA) is a widely accepted methodology that has proven its efficiency as a good 58
decision-making tool for the assessment of the environmental burdens associated with production 59
processes to move towards sustainable production practices. There are a number of applications of LCA 60
methodology in the field of leather production at different geographical locations such as Spain, India, 61
Chile etc.(Joseph and Nithya, 2009; Puig et al., 2007; Rivela et al., 2004) with various system boundaries 62
comprising all system or only one process step (Castiello et al., 2008; Kiliç et al., 2011) and different 63
flow references referring to the delivery of a leather surface area or to the tanning of a certain weight of 64
raw hide (Milà et al., 1998; Notarnicola et al., 2011) 65
First applications of LCA on leather industry took place in the nineties at European tanneries. Milà et 66
al. (1998 conducted a life cycle study in the Spanish leather industry on a cradle-to-grave basis in order 67
to identify the environmental 'hot spots' in the footwear life cycle. These authors further applied LCA 68
in order to detect the environmental ‘hot spots’ of chrome-tanned bovine leather industry and provide 69
1 Organisation for Economic Co-operation and Development

4
environmental information to The Autonomous Government of Catalonia for the establishment of 70
environmental criteria in the Catalan eco-label. In both studies detailed inventory data was not provided. 71
Only environmental results for chrome-tanned leather were presented for different impact categories 72
(Milà et al., 2002). 73
Rivela et al. (2004 carried out a LCA by studying a representative leather tannery industry in Chile. 74
Authors included both technical and economic analysis to quantify and evaluate the impacts of the 75
chromium tanning process and further improvement actions were proposed. Joseph and Nithya (2009 76
made an attempt to investigate the material flows of Indian leather by applying a life cycle analysis 77
approach in order to get an idea about the environmental burdens of leather products. 78
A number of life cycle assessment case studies were conducted to evaluate the environmental 79
performance of alternative technologies in order to investigate the feasibility of applying cleaner 80
production principles as a tool for improving the environmental and economical quality in the leather 81
tanning industry. Within this context the soaking, unhairing and liming processes were evaluated under 82
the LCA perspective and comparative environmental performances of the alternative methods were 83
presented by various researchers (Castiello et al., 2008; Nazer et al., 2006). Nazer et al. (2006 applied 84
LCA as a decision support tool to evaluate the net environmental benefits of using unhairing-liming 85
liquids several times after being recharged with reduced quantities of chemicals and results were 86
expressed in eco-points. Castiello et al. (2008 made another attempt to evaluate the actual reduction of 87
the environmental impact of conventional unhairing process, by applying an alternative oxidative 88
unhairing process that eliminates the use of sulfides. Another comparative LCA was carried out to 89
analyze the environmental performance of chemical and enzyme-assisted soaking and unhairing/liming 90
processes in a Chinese tannery. Environmental impacts of producing and delivering the enzymes to the 91
tannery, chemicals and electricity savings have been evaluated in terms of energy consumption and 92
contribution to global warming (Nielsen, 2006; Notarnicola et al., 2011) put some effort to analyze 93
Spanish and Italian product-systems regarding bovine leather manufacturing, and carried out LCA to 94
find out if the different technologies and management solutions adopted led to significant environmental 95

5
differences in the two system analysed. It is one of the detailed comparative LCA studies in European 96
tannery systems with available inventory data regarding each phase of tanning process. 97
Waste minimization in tannery sludge management was another issue that has been evaluated under 98
LCA perspective for environmental comparison of alternative processes. Kiliç et al. (2011 made some 99
efforts to evaluate three tannery waste treatment scenarios: direct landfilling of sludge, chromium 100
recovery prior to landfilling, and anaerobic digestion followed by oxidative chromium recovery and 101
landfilling to investigate whether recovering chromium from tannery sludge reduce environmental 102
impact of tanning. Bacardit et al. (2015 used LCA methodology to evaluate a patented alternative bovine 103
leather processing system and compared to the existing traditional processes. 104
105
1.3. Leather processes and carbon footprint 106
Although LCA has proven its usefulness as a good environmental tool in quantifying the environmental 107
burdens associated within life cycle stages of production processes, due to its wide scope and multiple 108
impact categories, a higher worldwide trend of simplification (Baitz et al., 2013; Bala et al., 2010) 109
focusing on a single indicator, carbon footprint, relevant to global warming (one of the impact categories 110
evaluated through a LCA study) is gaining increasing interest. Carbon footprint (CF) of a product or 111
service can be assessed at product level, following the LCA methodology for only this one impact 112
category and following standards such as: PAS 2050 (2011), ISO 14067 (ISO 14067, 2013) or GHG 113
Protocol for products (WBCSD, 2011b). It can also be assessed at corporate level, following standards 114
such as: ISO 14064 (2006) or GHG corporate protocol, (2004). Only a few studies have adopted a carbon 115
footprint approach for the analysis of environmental burdens associated with leather production system. 116
Chen et al. (2014) quantified the carbon footprints of the finished bovine leather in different thicknesses 117
tanned in Taiwan through use of PAS 2050 (BSI PAS 2050, 2011). Some other studies focused on 118
comparison of carbon footprint of alternative processes considering only the process under study. Kılıç 119
et al. (2014) made some attempts and calculated greenhouse gas emissions and energy consumption 120
associated with biodiesel production from tannery fleshings and further comparative assessment with 121
rapeseed vegetable oil was also performed by the same authors (Kılıç et al., 2013). In another study 122

6
carbon footprint of using a plant-derived biosurfactants in stead of conventional degreasing chemicals 123
was reported by a preliminary work conducted by Kılıç et al. (2015). 124
Xu et al. (2015) analyzed the environmental performance of a newly developed chromium-free tanning 125
process compared to the conventional one in China. More recently GHG emissions derived from 126
vegetable and chromium tanned leather processing technologies was calculated using data regarding 127
water and energy resource usage from 12 tanneries in seven different countries such as Brasil, Mexico, 128
China, Taiwan, Australia, Argentina and Spain (Laurenti et al., 2016). 129
1.4. Aim of the study 130
The literature review of the aforementioned LCA and carbon footprint studies on leather industry reveals 131
that, in most of the studies, no verifiable individual inventory data is available and none of the published 132
carbonfootprint and leather papers has a corporate carbon footprint approach. Therefore, further studies 133
to elaborate detailed calculations of carbon footprints for leather industry are required. This fact is also 134
highlighted by a UNIDO reports (Brugnoli, 2012; UNIDO, 2017). Additionally, LCA has never been 135
applied to Turkish leather industry. 136
Nowadays, LCA and CF are topics of primary interest to tanners in industrialized countries (Redwood, 137
2013). However, considering the shifting of tannery production from industrialized countries to 138
developing ones, Turkish tanning companies, especially those that are eager to present green credentials 139
of their supply chains, should give particular attention to resource consumption and CO2 emissions and 140
be ready to apply the environmental impact assessment and protection trends prompted by 141
environmental regulations when needed. Moreover, the projected emissions values of Turkey for 2025 142
is another important factor to increase the importance of monitoring and mitigating CO2 emissions to 143
improve leather companies sustainability (Lise, 2006; UNDP and WB, 2003). 144
Summarizing, there is a gap in the literature in adopting corporate carbon footprint approach for leather 145
industry and, apparently, no publication can be found in the literature presenting inventory data for 146
carbon footprint assessment of the Turkish leather industry. It is therefore important to analyze leather 147
companies, in order to identify the hotspots and environmental improvements, which could transform 148

7
the constraints into opportunities for improving the environmental performances of Turkish tanneries. 149
The aim of our research is to provide basic information on a corporate carbon footprint of a sample 150
Turkish tannery and raising awareness of carbon emissions and energy efficiency in Turkish leather 151
production. This study adds up to the low number of corporate CF applications found in the literature 152
and implements LCA methodology for the first time in Turkish tanneries (Kılıç E et al., 2015). Results 153
presented within this paper add scientific value by providing inventory data and information for 154
identification of environmental “hotspots” of Turkish tanning processes in order to promote the 155
implementation of effective carbon mitigation measures. This is in line with a recent United Nations 156
Industrial Development Organization (UNIDO) report on life cycle assessment and carbon footprint of 157
leather which suggests performing more studies on LCA regarding leather industry, and be aware of 158
environmental impact assessment and protection trends in order to be ready at appropriate time when 159
their implemention is needed (Brugnoli, 2012). Presenting inventory data is significant in terms of 160
sectoral benchmarking and use of these benchmarks to reach sustainable leather production goals. 161
Additionally and most importantly this study has revealed that country specific emission factors for 162
Turkey are not yet available. Turkish statistical reports and emission factors from other Mediterranean 163
countries were used instead, together with default values obtained from IPCC (IPCC, 2006). The 164
importance of publishing emission factors from local emission measurements to promote CF 165
calculations in the country was also highlighted. 166
167
2. Methodology 168
In the present study corporate carbon footprint methodology, following the World Business Council for 169
Sustainable Development Standards (WBCSD, 2011a) has been chosen to evaluate the Green House 170
Gases (GHG) emissions of a sample Turkish tanning company. Data was gathered for the year 2013. 171
Corporate carbon footprint was calculated at three scopes (GHG corporate protocols, 2004 and 2011): 172
scope 1) direct emissions, scope 2) indirect emissions from electricity production and scope 3) indirect 173
emissions upstream and downstream of the production chain. Direct GHG emissions occur from sources 174

8
that are owned or controlled by the tanning company, for example, emissions from combustion in owned 175
or controlled boilers, vehicles, etc.. Scope 2 accounts for indirect GHG emissions from the generation 176
of purchased electricity consumed by the tanning company. Other indirect GHG emissions that occur as 177
a consequence of the activities of the tanning company, which derive from sources not owned or 178
controlled by the company, (such as extraction and production of purchased materials; transportation of 179
purchased fuels) are reported in Scope 3. Emissions from scopes 1, 2 and 3 were quantified for 2013. 180
Scope 3 categories included in the study were the following: category 1, emissions from purchased 181
goods and services; category 3, fuel- and energy-related emissions not included in scopes 1 and 2 and 182
category 5, waste generated in operations. 183
However, to quantify scope 3 emissions (of a certain raw material, fuel or the management of a certain 184
waste) the use of LCA methodology (GHG corporate protocol, 2011) is required. LCA is a systematic 185
way to evaluate the environmental impact of products by following a cradle-to-grave approach 186
according to ISO 14040 standard (ISO 14040, 2006). Therefore, life cycle assessment methodology, 187
has been used to quantitatively evaluate the environmental burdens due to indirect emissions (scope 2 188
and scope 3 emissions). 189
The carbon footprint analysis was performed by aid of the GaBi 6 software (Thinkstep), which included 190
Life Cycle Inventories of energy and chemicals. The global warming potential was measured in kg of 191
CO2 equivalent emissions using the impact factors developed by Leiden University Centre of 192
Environmental Science (CML), which were updated in 2009. Calculation was related to the annual 193
processing of rawhide for shoe leather, manufactured by the studied Turkish tanning company, and the 194
reference flow is 29,280 m2 of finished hide. System includes the following phases: production and 195
supply of electric energy, production of the main representative chemicals, beamhouse, tanning, dyeing, 196
finishing, management of the wastewater, and transport of solid waste. The system boundaries are shown 197
in Fig. 1. 198
2.1. Information about the tannery and data collection 199
The tannery under the study was established in a free zone that is considered as one of the important 200

9
regions where Turkish leather manufacturers are located, with a gross built-up area of 12,500 m2. 201
Tannery has an annual total production capacity of 600,000 m2 of finished leather for shoes and bags 202
using chrome-tanning process. The corporate carbon footprint presented here corresponds only to the 203
production of 29,280 m2 of finished leather sold to a specific customer. The company collected and 204
reported the inventory data being asked by its customer. Free Zone, where the tannery is located, has a 205
water treatment plant facility with daily capacity of 8,000 m3 of wastewater, and a solid waste landfilling 206
area 207
208
209
Figure 1. Production processes of leather included in the study 210
211
Inventory data for 2013 was collected through a questionnaire with the following structure of 212

10
information asked: i) general data about company and production process description, ii) inventory 213
data on water and energy consumption, wastewater production, generation of both hazardous and non-214
hazardous solid waste, and direct fugitive emissions, and iii) purchased input material data including 215
the quantity of purchased raw hide, chemicals, paper, and packaging materials. During 2013, the 216
tanning company used 35 tonnes of chemicals and consumed 38,594 m3 of water to produce 29,280 217
m2 finished calf hide (1 m2 = 0.45 kg aprox), generating 410 metric tonnes of non-hazardous and 4.87 218
metric tonnes of hazardous solid waste. Only 15 tonnes of non-hazardous waste is recyclable and was 219
sent to reuse-recycling facility located at 260 km distance from tannery and the rest of the solid waste 220
was sent to landfill area located in the industrial zone. 221
2.2. Assumptions for calculations 222
Emission factors used for the calculation of carbon footprint are mainly taken from Gabi Database, 223
Intergovernmental Panel on Climate Change (IPCC, 2006) and from related U.S. Environmental 224
Protection Agency's (EPA) documents. Total amount of chemicals used in leather production are 225
distributed among the representative chemicals (sodium sulphur, lime, salt, sodium bicarbonate, 226
chromium sulphate, surfactant, sulphuric acid, acetic acid, ammonium sulphate, kaolin, and resin), 227
which correspond more than 70% of total chemical consumption. 228
Emission factor of chromium sulfate was calculated from emission factor of ferrous chrome (FeCr), 229
(considering its molar ratio in its chemical formula) and for resin, melamine production process was 230
assumed as a proxy. For the estimation of CH4 emissions associated with treatment of organics in terms 231
of COD and nitrogen in the effluent, default emission factor provided by IPCC (IPCC, 2006) was used. 232
In order to calculate the impact assessment of the landfilling phase, the process structure and data were 233
taken from the GaBi database (Thinkstep, 2015). Textile waste landfilling process described in the GaBi 234
database was selected as proxy due to composition of organic and industrial waste that had to be 235
landfilled. Energy recovery was not considered in the landfilling process, because no energy recovery 236
facility exists where the company transfers its wastes. Landfilling of solid wastes should be modelled 237
more accurately in the next project. Another significant point is that currently no specific national data 238
on electricity production technologies is available, therefore, although Turkish electricity mix was 239

11
considered in the study, Mediterranean electricity production processes from different energy sources, 240
(coal, natural gas, wind, solar, etc.) were used. 241
2.3. Electricity production in Turkey 242
Generation of electricity in Turkey is mainly based on imported fossil fuels. Turkey imports nearly 99% 243
of the natural gas it consumes and over the last decade, it has been the second country following China, 244
in terms of increase in natural gas demand (EMRA, 2016). Considering the projected growing demand 245
for energy in Turkey and its dependency on expensive energy imports of fuels, implemention of energy 246
policies that supports renewable energy gain significant importance. Despite the positive effects of such 247
policies that went into effect in the last decade especially on hydropower potential which is raised by 248
nearly 40% (Kucukali and Baris, 2011), hard coal and natural gas still hold the highest share comprising 249
nearly 67% of total electricity supplies, while the use of renewable energies except hydropower for 250
electricity production represents only 6.5%. 251
252
Figure 2. Distribution of Turkey’s electricity generation by energy sources (TEIAS, 2015) 253
254
255
38%
1%
26%
29.1%
0.7%
4.5%
1.3%
0.07%
Natural gas
Fuel oil, diesel and naphtha
Hydro power
Hard coal
Biogas
Wind power
Geothermal energy
Photovoltaic energy
0% 5% 10% 15% 20% 25% 30% 35% 40%
Turkish electricity mix

12
256
3. Results and Interpretation 257
258
3.1. Inventory data from Turkish tannery 259
260
In this study a Turkish tannery has been environmentally evaluated and corporate carbon footprint 261
results for the production of shoe leather from calf rawhide are presented. Table 1 shows the compiled 262
inventory data of the tannery for the year 2013. 263
Turkish electricity mix shown in Fig. 2 (TEIAS, 2015) and Spanish electricity production technologies 264
were considered, except for geothermal electricity production which is taken from Italy. This was used 265
to obtain the CO2 equivalent emissions derived from electricity production processes. 266
In order to calculate GHG emissions derived from industrial and domestic tap water consumption in the 267
tannery, inventory data for water production processes is obtained from GaBi database. Transportation 268
of solid wastes from tannery to landfilling and recovery facility is also considered in the study. 269
Transportation of chemicals from the provider to the company was not included in the study due to lack 270
of data. 271
272
273
274
275
276
277
278
279
280
281
282
283

13
284
Table 1. Inventory data from Turkish tannery in 2013 285
286
287
288
289
290
291
292
293
294
295
296
297
298
299
300
301
302
303
304
3.2. Corporate CF results from Turkish tannery 305
Table 2 shows the carbon footprint results, together with the source of each emission considered in the 306
calculation. Greenhouse gas emission values calculated for each scope and contribution of each scope 307
to the total result was presented in Figure 3. Scope 1 includes the emissions that arise directly from 308
sources that are owned or controlled by the tannery, for example from fuels used for the vehicles that 309
tannery owns. Scope 2 comprises the emissions generated by purchased electricity consumed by the 310
tannery. And other indirect emissions, such as the production of purchased materials and fuels, transport-311
related activities in vehicles not owned or controlled by the tannery, not covered in Scope 2, outsourced 312
Source of emission Quantity S
CO
PE
1
Consumption of diesel in tannery [m3] 37
Consumption of natural gas in tannery [kwh] 2,285,300
Refrigerant gas (R-134a) [kg] 2
SC
OP
E
2
Production of electricity [kwh] 797,310
SC
OP
E 3
Cat
egor
y 1
Production of sodium sulphur [kg] 3768.8
Production of lime [kg] 3043.8
Production of salt [kg] 16,250
Production of sodium bicarbonate [kg] 3875
Production of chromium sulphate [kg] 8062.5
Production of surfactant [kg] 604
Production of sulphuric acid [kg] 652
Production of ammonium sulphate [kg] 242
Production of kaolin [kg] 1367
Production of resin [kg] 1198
Production of paper [kg] 853.17
Production of water for industrial purpose [m3] 37,594
Production of domestic water [m3] 1000
Cat
egor
y 3 Production of diesel [L] 37,000
Production of natural gas [kwh] 2,285,300
Cat
egor
y 5
Management of solid waste [kg] 414.870
Treatment of wastewater [L] (3018 mg COD/L; 85 mg N/L) 27,000,000
14
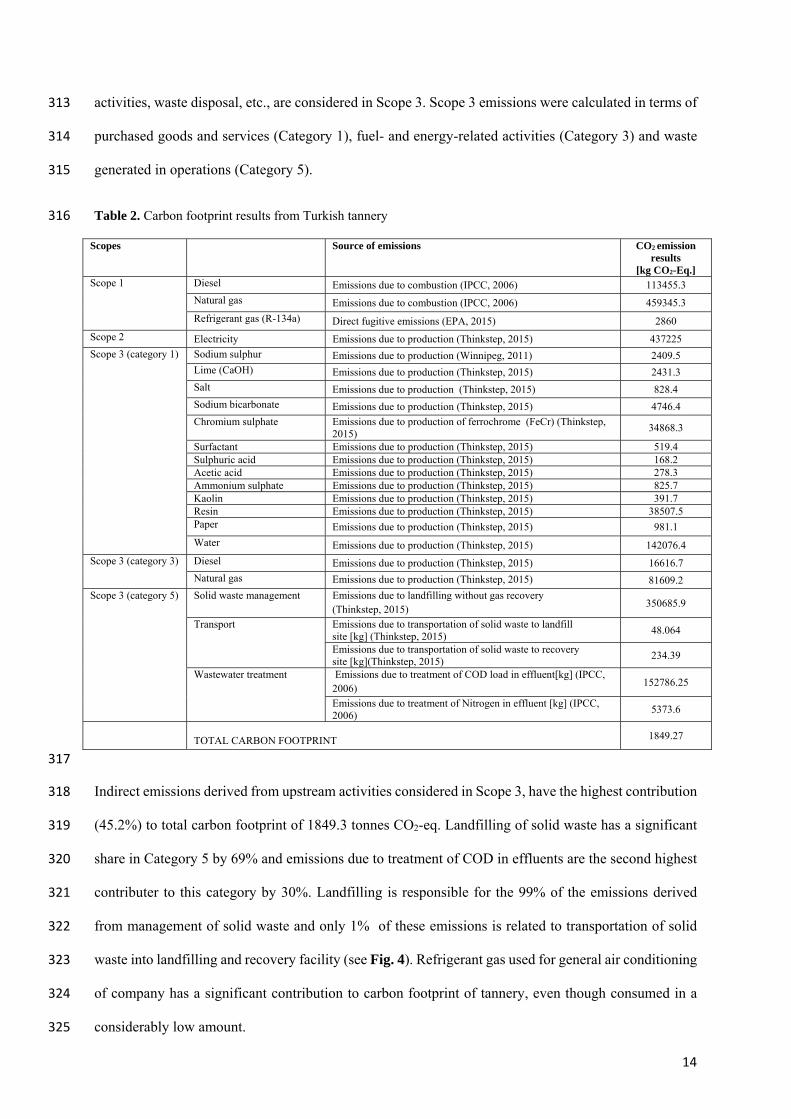
activities, waste disposal, etc., are considered in Scope 3. Scope 3 emissions were calculated in terms of 313
purchased goods and services (Category 1), fuel- and energy-related activities (Category 3) and waste 314
generated in operations (Category 5). 315
Table 2. Carbon footprint results from Turkish tannery 316
Scopes Source of emissions CO2 emission results
[kg CO2-Eq.] Scope 1 Diesel Emissions due to combustion (IPCC, 2006) 113455.3
Natural gas Emissions due to combustion (IPCC, 2006) 459345.3
Refrigerant gas (R-134a) Direct fugitive emissions (EPA, 2015) 2860
Scope 2 Electricity Emissions due to production (Thinkstep, 2015) 437225
Scope 3 (category 1) Sodium sulphur Emissions due to production (Winnipeg, 2011) 2409.5 Lime (CaOH) Emissions due to production (Thinkstep, 2015) 2431.3
Salt Emissions due to production (Thinkstep, 2015) 828.4
Sodium bicarbonate Emissions due to production (Thinkstep, 2015) 4746.4
Chromium sulphate Emissions due to production of ferrochrome (FeCr) (Thinkstep, 2015)
34868.3
Surfactant Emissions due to production (Thinkstep, 2015) 519.4 Sulphuric acid Emissions due to production (Thinkstep, 2015) 168.2 Acetic acid Emissions due to production (Thinkstep, 2015) 278.3 Ammonium sulphate Emissions due to production (Thinkstep, 2015) 825.7 Kaolin Emissions due to production (Thinkstep, 2015) 391.7 Resin Emissions due to production (Thinkstep, 2015) 38507.5 Paper Emissions due to production (Thinkstep, 2015) 981.1
Water Emissions due to production (Thinkstep, 2015) 142076.4
Scope 3 (category 3) Diesel Emissions due to production (Thinkstep, 2015) 16616.7
Natural gas Emissions due to production (Thinkstep, 2015) 81609.2
Scope 3 (category 5) Solid waste management Emissions due to landfilling without gas recovery (Thinkstep, 2015)
350685.9
Transport Emissions due to transportation of solid waste to landfill site [kg] (Thinkstep, 2015)
48.064
Emissions due to transportation of solid waste to recovery site [kg](Thinkstep, 2015)
234.39
Wastewater treatment Emissions due to treatment of COD load in effluent[kg] (IPCC, 2006)
152786.25
Emissions due to treatment of Nitrogen in effluent [kg] (IPCC, 2006)
5373.6
TOTAL CARBON FOOTPRINT 1849.27
317
Indirect emissions derived from upstream activities considered in Scope 3, have the highest contribution 318
(45.2%) to total carbon footprint of 1849.3 tonnes CO2-eq. Landfilling of solid waste has a significant 319
share in Category 5 by 69% and emissions due to treatment of COD in effluents are the second highest 320
contributer to this category by 30%. Landfilling is responsible for the 99% of the emissions derived 321
from management of solid waste and only 1% of these emissions is related to transportation of solid 322
waste into landfilling and recovery facility (see Fig. 4). Refrigerant gas used for general air conditioning 323
of company has a significant contribution to carbon footprint of tannery, even though consumed in a 324
considerably low amount. 325

15
326
Figure 3. Greenhouse gas emission values for each scope 327
328
Among the chemicals used in tanning processes, resin and chromium sulphate have the highest 329
contribution to carbon footprint of tanning operations. It should be kept in mind that representative 330
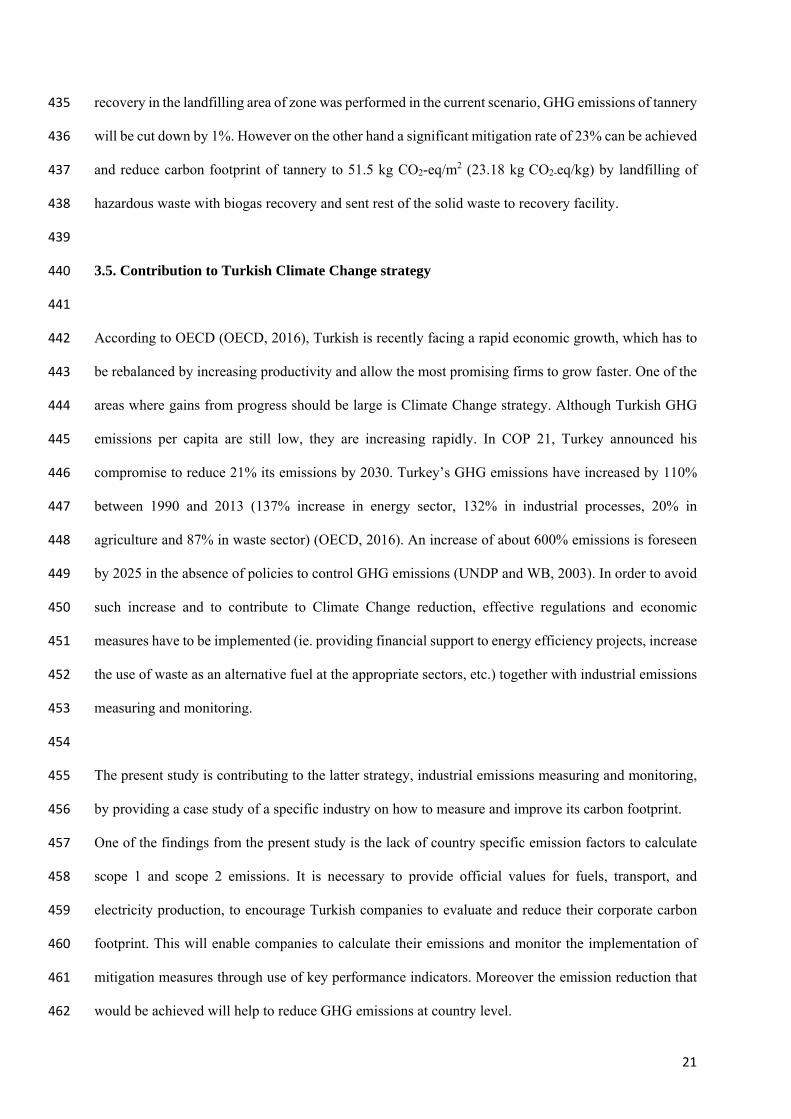
chemicals corresponding to majority of total chemicals were considered in the calculations and 331
furthermore melamine and ferro chrome process data were used as proxy for the aforementioned 332
chemicals respectively. Therefore more accurate data on production processes of chemicals and 333
individual inventory data on the specific content of each chemical is needed for further studies. Chemical 334
companies are beginning to deliver environmental life cycle information of their products, which will 335
be very useful for industries using such chemicals, like tanneries. This study adopted a first approach to 336
calculate carbon footprint using inventory data from proxy chemicals, but in further studies this 337
approach can be improved when chemical production companies would provide more information about 338
the CO2 emissions due to production process of their chemicals. 339
340
Comparative carbon footprint results for each category considered in Scope 3 is shown in Fig. 5. 341
342
343
Scope 1 (31.2%)
575.7 tonnes CO2-Eq.
Scope 2 (23.6%)
437.2 tonnes CO2-Eq.
Scope 3 (45.2%)
836.4 tonnes CO2-Eq.
Global warming potential [tonnes CO2-Equiv.]

16
344
345
Figure 4. Contribution of different processes considered in Scope 3 to total carbon footprint of tanning company 346
347
As seen from results in Fig. 4 production of chemicals play a minor role to the generation of GHG during 348
the leather life cycle. This may be due to the use of simpler proxies to chemical substances, which can 349
be found in Gabi database, instead of performing a life cycle assessment of the more sophisticated ones. 350
This environmental profile can be improved with CO2 emission data from the specific chemicals, 351
provided by chemical producers. 352
2,412,430,834,75
34,90,50,170,280,830,4
38,51,0
141,70,3
16,6281,61
351158,2
0 100 200 300
Production of sodium sulphurProduction of limeProduction of salt
Production of sodium bicarbonateProduction of chromium sulphate
Production of surfactantProduction of sulphuric acid
Production of acetic acidProduction of ammonium sulphate
Production of kaolinProduction of resin
Production of paperIndustrial water consumptionDomestic water consumption
Production of dieselProduction of natural gas
Management of solid wasteTreatment of wastewater
tonnes CO2-Equiv.
Scope 3

17
353
Figure 5. Greenhouse gas emissions accounted for category 1, 3 and 5 under scope 3 354
355
Category 1 includes emissions from production of goods, category 3 evaluates fuel and energy related 356
activities not included in scope 1 or scope 2, and finally emissions from residues generated in processes 357
are included in category 5. Emissions related to waste management within category 5 have a significant 358
relative contribution in scope 3 (83%). 359
360
Finally, the relative contribution of different activities to total global warming potential, in terms of kg 361
CO2 equivalent, are presented in Fig. 6. Here, the different aspects are not classified in scopes, so the 362
results presented in Fig. 6 don’t follow the Corporate Carbon Footprint standard (ISO 14064). 363
364
229 tonnes CO2-Eq.
98.2 tonnesCO2-Eq.
509.1 tonnesCO2-Eq.
0%
10%
20%
30%
40%
50%
60%
70%
Category 1 Category 3 Category 5
Scope 3

18
365
Figure 6. Relative contribution of greenhouse gas emissions from different processes to total carbon footprint of 366
Turkish tannery 367
368
Emissions from energy consumption, both in the form of fossil fuels and electricity, are notable. Natural 369
gas has the highest contribution to green house gas emissions derived from energy use and the electricity 370
use is among the most contributing phases The significant contribution of waste management activities 371
to global warming potential is mainly caused by the gaseous emissions (CH4, NH3) in the landfilling of 372
organic wastes produced in the tannery. This high contribution of the waste management is in line with 373
the previously reported studies and supports the remarkable impact of solid waste management phase 374
of leather production when most of the waste is not recycled (Milà et al., 2002; Milà et al., 1998; Puig 375
et al., 2001). Reduction of wastes together with a higher share of recycling and collection of biogas in 376
landfill is suggested as an improvement possibility to mitigate the greenhouse gas emission generated 377
during the landfilling phase. 378
379
380
381
382
383
671tonnes CO2-eq
509.5 tonnes CO2-eq.
437.22 tonnes CO2-eq.
142 tonnes CO2-eq.
86.9 tonnes CO2-eq.
2.86 tonnes CO2-eq.0%
5%
10%
15%
20%
25%
30%
35%
40%
Combustibles Wastemanagement
Electricity Water use Chemicals Direct fugitiveemissions
% C
ontr
ibu
tion
to
glob
al w
arm
ing
pot
enti
al
Global Warming Potential (GWP)

19
3.3. Improvement recommendations for the tannery under study 384
385
Taking into account the findings of this study and other leather related LCA studies in the literature, 386
some improvement actions that can be implemented to reduce the carbon footprint and enhance the 387
environmental profile of the tannery are listed in Table 3. 388
389
390
Table 3. Measures and recommendations for process improvement 391
392
Issues Improvement opportunities References Energy Reduce electricity consumption
Energy production based on renewable energy Improving machinery efficiency
Our study, (Milà et al., 2002), (Milà et al., 1998)
Waste management Biogas recovery from sludge Material recovery from solid waste Reduction of organic waste landfilled Waste volume reduction Reduce amount of packaging used
Our study, (Notarnicola et al., 2011), (Puig et al., 2007) (Milà et al., 2002)
Wastewater management
Reduce water consumption Seperate waste flows to enable chromium and salt recovery
Our study, (Milà et al., 2002)
393
394
Considering the results obtained from the current study, the two most important improvement 395
opportunites to reduce the environmental impact of leather production are: minimizing the amount of 396
waste generated, by increasing material recycling and reducing the use of combustibles and electricity, 397
which are identified as significant hotspots of the system studied. Material recovery from solid waste 398
implies both environmental and economic advantages, which results in lower quantity of waste disposal 399
in landfill associated with lower emissions of NH3 and CH4 due to anaerobic degradation of the organic 400
waste, and on the other hand reduced need for virgin raw materials such as fertilisers. 401
Energy use is closely linked to GHG emission, therefore energy conservation will result in a significant 402
reduction in the carbon footprint of the studied company, due to its high electricity demand and the 403
origin of this electricity. A country specific improvement suggestion for electricity would be: to 404
encourage a change of the Turkish electricity mix (mainly based on hard coal and natural gas) to less 405
carbon intensive fuels like natural gas and renewable energies. 406

20
Acquiring more accurate individual inventory data on inputs and outputs for chemicals is another 407
suggestion that would enable obtaining results closer to reality. 408
409
Carbon footprint of leather is expressed in kg of CO2-eq/m2 of finished leather in order to supply product 410
information to intermediate and final consumers and environmental key performance indicator of the 411
tannery for the year of 2013 was calculated as 63.16 kg CO2-eq emission/m2 (28.4 kg CO2-eq 412
emission/kg) of finished calf leather. In following years if company would implement any of the 413
aforementioned improvement suggestions in its production processes, this would enable company 414
management to effectively quantify and evaluate the benefits of the adopted carbon reduction measures. 415
Implementation of suitable environmental key performance indicator would also permit tracking the 416
evolution of footprint of the company in progress of time. 417
418
419
3.4. Hypothetic results coming from the implementation of some improvement measures 420
421
Turkish electricity system is currently dominated by hydraulic, hard coal and natural gas power plants 422
while renewable sustainable energy resources such as geothermal, waste, solar and wind have limited 423
capacity. The characteristics of electricity production are of great importance, because they significantly 424
affect the global warming potential due to energy consumption. If this production is based on renewable 425
resources such as wind power, solar, and etc., its contribution will be minor. If the share of hard coal 426
(29%) in electricity production of Turkey is substituted by solar, total carbon footprint of the tannery 427
could be reduced by 15%. Taking into account the increasing dependency of Turkey on natural gas 428
imports, improving the capacity of hydraulic and renewable energy resources would break the 429
dependency on imported non-renewable energy resources and decrease the GHG emission as an 430
additional advantage. 431
432
Other improvement options that could provide important benefits are increasing recovery, recycling 433
ratio of solid waste sent to landfill and biogas recovery from landfilling area. Assuming that biogas 434
21
recovery in the landfilling area of zone was performed in the current scenario, GHG emissions of tannery 435
will be cut down by 1%. However on the other hand a significant mitigation rate of 23% can be achieved 436
and reduce carbon footprint of tannery to 51.5 kg CO2-eq/m2 (23.18 kg CO2-eq/kg) by landfilling of 437
hazardous waste with biogas recovery and sent rest of the solid waste to recovery facility. 438
439
3.5. Contribution to Turkish Climate Change strategy 440
441
According to OECD (OECD, 2016), Turkish is recently facing a rapid economic growth, which has to 442
be rebalanced by increasing productivity and allow the most promising firms to grow faster. One of the 443
areas where gains from progress should be large is Climate Change strategy. Although Turkish GHG 444
emissions per capita are still low, they are increasing rapidly. In COP 21, Turkey announced his 445
compromise to reduce 21% its emissions by 2030. Turkey’s GHG emissions have increased by 110% 446
between 1990 and 2013 (137% increase in energy sector, 132% in industrial processes, 20% in 447
agriculture and 87% in waste sector) (OECD, 2016). An increase of about 600% emissions is foreseen 448
by 2025 in the absence of policies to control GHG emissions (UNDP and WB, 2003). In order to avoid 449
such increase and to contribute to Climate Change reduction, effective regulations and economic 450
measures have to be implemented (ie. providing financial support to energy efficiency projects, increase 451
the use of waste as an alternative fuel at the appropriate sectors, etc.) together with industrial emissions 452
measuring and monitoring. 453
454
The present study is contributing to the latter strategy, industrial emissions measuring and monitoring, 455
by providing a case study of a specific industry on how to measure and improve its carbon footprint. 456
One of the findings from the present study is the lack of country specific emission factors to calculate 457
scope 1 and scope 2 emissions. It is necessary to provide official values for fuels, transport, and 458
electricity production, to encourage Turkish companies to evaluate and reduce their corporate carbon 459
footprint. This will enable companies to calculate their emissions and monitor the implementation of 460
mitigation measures through use of key performance indicators. Moreover the emission reduction that 461
would be achieved will help to reduce GHG emissions at country level. 462

22
463
As an example, if all tanning companies in Turkey had similar processes and emissions like the one 464
studied here (63.16 kg CO2/m2 leather), as Turkey’s leather production in Turkey in 2013 was 80 million 465
pieces of bovine and 6.5 million pieces of ovine leather (TDSD, 2013) (and considering, according to 466
the company, 1 piece ovine ≈ 0.6 m2 and 1 piece bovine ≈ 3m2), the total GHG emissions of the country 467
due to tanning industries would have been 4,263,300,000 kg CO2. This represents a 0.93 % of the total 468
CO2 emissions of Turkey as a country in that year (TUIK, 2013). If all tanning companies in Turkey 469
used an electricity mix with higher renewable origin, such as hydro power 30%, wind power 25%, solar 470
30% and natural gas 15%, instead of the actual country grid mix that is based on fossil fuel, the GHG 471
emissions of the Turkish tanning sector would be reduced by a 20%. These results reveal the necessity 472
of restructuring energy supplies of Turkey and promote locally available sources especially wind and 473
solar energy, which have a high potential in the country. This would also reduce Turkey’s dependence 474
on oil and gas imports, and provide safe energy procurement (Ilkiliç and Aydin, 2015). 475
476
In addition, if all tanning companies would be able to recycle their waste instead of taking it to the 477
landfill, and/or landfills in Turkey had an energy recovery system, an additional reduction would be 478
achieved. 479
480
It has to be said that both proposed alternatives (increasing the renewable sources on electricity 481
production and promote energy recovery in landfills) are useful not only to decrease GHG emissions of 482
tanning sector but also of other industries needing electricity for their processes and producing organic 483
wastes. Considering the substantial contribution of industrial processes to the country carbon emissions 484
and the importance of leather sector in Turkish economy, this reduction would provide a sound 485
improvement in environmental profile of Turkey. 486
487
4. Conclusion 488
489
23
In this paper results from corporate carbon footprint assessment of a Turkish tanning company were 490
presented. They show that emissions from disposal of both solid waste and wastewater (considered in 491
scope 3) and consumption of natural gas are hotspots of the tannery and have the highest contribution 492
to total carbon footprint. The carbon footprint of the tannery could be mitigated by waste reduction and 493
recycling, increasing energy efficiency in tanning processes, collection of landfill biogas for energetic 494
purposes and using an electricity grid mix with more contribution of renewable sources. The two last 495
improvement options depend more on the country policy than on the companies themselves. The energy 496
production profile of Turkey is mainly based on imported fossil fuels (OECD/IEA, 2016). Increasing 497
the share of renewable energy in energy supply of Turkey could provide a remarkable reduction in 498
emissions of greenhouse gases from the combustion of fossil fuels, while reducing Turkey’s dependency 499
on imported energy sources. 500
501
The work presented herein clearly depicts the fact that corporate carbon footprint can play a significant 502
role by providing improvement options to industries, thus decreasing the total GHG emissions of a 503
country. The awareness of diffuse emission sources contribution, like tanneries, to the country GHG 504
emissions by policy makers is of great importance to implement measures for Climate Change 505
mitigation at country level. To implement such measures and policies, national emission factors should 506
be published to promote companies to measure and mitigate their GHG emissions. 507
508
Although the majority of Turkish tanners have limited awareness of their energy consumption and 509
resultant carbon impacts, in order to keep up with foreseen demands from their clients and to compete 510
in new markets they should audit their resource and energy consumptions as well as their carbon 511
emissions. Furthermore, environmental assessments of individual tanneries will help set priorities for 512
future improvements and will contribute to Turkish leather industry sustainability by providing data for 513
benchmarking. 514
The results obtained from this study may provide a useful decision framework for incorporating 515
sustainability concerns, follow-up of the most cost-effective carbon mitigation strategies and tackle with 516
future carbon pollution regulations in Turkish leather industry. Additionally, potential reductions in 517

24
greenhouse gases by promoting sustainable production and achieving the transition to a low carbon 518
sustainable economy will provide new opportunities in the green market for Turkish industry. 519
520
5. Acknowledgements 521
Financial support for the first author provided by The Scientific and Technological Research Council of 522
Turkey (TUBITAK) under the international post-doctoral research fellowship programme 2219, is 523
acknowledged. 524
525
526
6. References 527
528
Akbostancı E, Tunç Gİ, Türüt Aşık S. CO2 emissions of Turkish manufacturing industry: A decomposition 529
analysis. Applied Energy 2011: 2273–2278. 530
Bacardit A, Baquero G, Sorolla S, Olle L. Evaluation of a new sustainable continuous system for processing bovine 531
leather. Journal of Cleaner Production 2015: 197-204. 532
Baitz M, Albrecht S, Brauner E, Broadbent C, Castellan G, Conrath P, et al. LCA's theory and practice: like ebony 533
and ivory living in perfect harmony? . International Journal of Life Cycle Assessment 2013; 18: 5-13. 534
Bala A, Raugei M, Benveniste G, Gazulla C, Fullana-i-Palmer P. Simplified tools for global warming potential 535
evaluation: when 'good enough' is best. International Journal of Life Cycle Assessment 2010; 15: 489-536
498. 537
Brugnoli F. Report on Life Cycle Assessment, Carbon Footprint in Leather Processing (Review of methodologies 538
and recommendations for harmonization). United Nations International Development Organisation 2012. 539
BSI PAS 2050. Specification for the Assessment of the Life Cycle Greenhouse Gas Emissions of Goods and 540
Services, Carbon Trust. British Standards Institution, London, 2011. 541
Castiello D, Puccini M, Seggiani M, Vitolo S, Zammori F. Life Cycle Assessment (LCA) of the Oxidative 542
Unhairing Process by Hydrogen Peroxide. Journal of the American Leather Chemists Association 2008: 543
1-6. 544
Chen K, Lin L, Lee W. Analyzing the Carbon Footprint of the Finished Bovine Leather: A Case Study of Aniline 545
Leather. Energy Procedia 2014; 61: 1063–1066. 546

25
EMRA. Republic of Turkey Energy Market Regulatory Authority, Natural Gas Market 2016 Sector Report, 547
http://www.emra.org.tr/en/home. 2016. 548
EPA. Emission Factors for Greenhouse Gas Inventories, https://www.epa.gov/sites/production/files/2015-549
07/documents/emission-factors_2014.pdf, 2015. 550
Ilkiliç C, Aydin H. Wind power potential and usage in the coastal regions of Turkey. Renewable and Sustainable 551
Energy Reviews 2015; 44: 78-86. 552
IPCC. Intergovernmental Panel on Climate Change, Guidelines for National Greenhouse Gas Inventories. National 553
Greenhouse Gas Inventories Programme, 2006. 554
Joseph K, Nithya N. Material flows in the life cycle of leather. Journal of Cleaner Production 2009; 17: 676-682. 555
Kılıç E, Puig R, Zengin G, Adıgüzel Zengin AC. Carbon footprint of a tanning company in Turkey. Poster session 556
at XXXIII International Congress of IULTCS, Novo Hamburgo, Brazil, 2015. 557
Kiliç E, Puig R, Baquero G, Font J, Colak S, Gürler D. Environmental optimization of chromium recovery from 558
tannery sludge using a life cycle assessment approach. Journal of Hazardous Materials 2011; 192: 393–559
401. 560
Kılıç E, Puig R, Baquero G, Zengin G, Adıgüzel Zengin A. Carbon Footprint and Energy Comparison of Biodiesel 561
Produced From Leather Industry Fleshings and Rapeseed Vegetable Oil. IX International Scientific-562
Practical Conference Leather and Fur in XXI Century Technology, Quality, Environmental Management, 563
Education Congress, Ulan-Ude, Republic of Buryatia, Russia, 2013. 564
Kılıç E, Puig R, Baquero G, Zengin G, Adıgüzel Zengin A. Carbon footprint and energy balance of biodiesel 565
produced from tannery fleshing. Journal of the American Leather Chemists Association 2014; 109: 296-566
305 567
Kılıç E, Puig R, Diarte A. Carbon footprint of plant derived surfactant use in leather industry. SETAC Europe 25th 568
Annual Meeting, Barcelona, Spain, 2015. 569
Kucukali S, Baris K. Renewable energy policy in Turkey. World Renewable Energy Congress, Linköping, 570
Sweden, 2011. 571
Laurenti R, Redwood M, Puig R, Frostell B. Measuring the Environmental Footprint of Leather Processing 572
Technologies. Journal of Industrial Ecology 2016. 573
Leather Wear Report. Republic of Turkey, Ministery of Economy, 574
http://www.economy.gov.tr/portal/content/conn/UCM/uuid/dDocName:EK-021139. 2016. 575
Lise W. Decomposition of CO2 emissions over 1980–2003 in Turkey. Energy Policy 2006; 34: 1841–1852 576

26
Milà L, Domènech X, Rieradevall J, Fullana P, Puig R. Use of Life Cycle Assessment in the Procedure for the 577
Establishment of Environmental Criteria in the Catalan Eco-label of Leather. International Journal of Life 578
Cycle Assessment 2002; 7: 39-46. 579
Milà L, Domènech X, Rieradevall J, Puig R, Fullana P. Application of Life Cycle Assessment to Footwear. 580
International Journal of Life Cycle Assessment 1998; 3: 203-208. 581
Nazer D, Al-Sa’ed RM, Siebel MA. Reducing the environmental impact of the unhairing-liming process in the 582
leather tanning industry. Journal of Cleaner Production 2006; 14: 65-74. 583
Nielsen P. Environmental assessment of enzyme application in the tanning industry. Leather International 2006; 584
August/September: 18-24. 585
Notarnicola B, Puig R, Raggi A, Fullana P, Tassielli G, De Camillis C, et al. Life cycle assessment of Italian and 586
Spanish bovine leather production systems. . Afinidad: revista de química teórica y aplicada 2011; 68: 587
167 - 180. 588
OECD. OECD Economic Surveys: Turkey 2016, OECD Publishing, Paris. http://dx.doi.org/10.1787/eco_surveys-589
tur-2016-en. 2016. 590
OECD/IEA. Energy Policies of IEA Countries: Turkey 2016, IEA, Paris. 591
http://dx.doi.org/10.1787/9789264266698-en. 2016. 592
Puig R, Canela J, Hidalgo R, Navarro D. Evaluación ambiental de un proceso de curtición de pieles (cromo y 593
vegetal). Lederpiel 2001; 26: 67-70. 594
Puig R, Notarnicola B, Raggi A. LCA of Italian and Spanish bovine leather pro- duction systems in an industrial 595
ecology perspective. Milano: Franco Angeli Publishing, 2007. 596
Redwood M. Corporate social responsibility and the carbon footprint of leather. Journal of the Society of Leather 597
Technologists and Chemists 2013; 97: 47–55. 598
Rivela B, Moreira M, Bornhardt C, Mendez R, Feijoo G. Life Cycle Assessment as a Tool for the Environmental 599
Improvement of the Tannery Industry in Developing Countries. Environmental Science and Technology 600
2004; 38: 1901-1909. 601
TDSD. Turkish Leather Industrialists Association, Leather Production Data Report. 2013. 602
TEIAS. Turkish Electricity Transmission Company, Turkish Electricity Generation and Transmission Statistics of 603
Turkey. 604
http://www.teias.gov.tr/T%C3%BCrkiyeElektrik%C4%B0statistikleri/istatistik2015/istatistik2015.htm, 605
2015. 606

27
Thinkstep. Gabi 6. Software and Professional Databases (Ecoinvent 3.0; PE International, 2015; Plastics Europe; 607
ILCD) 2015. 608
TUIK. Turkish Statistical Institute, Greenhouse Gas Emissions Inventory, No 21582. 2013. 609
TUIK. Turkish Statistical Institute, Greenhouse Gas Emissions Inventory, No 21582. 2016. 610
UNDP, WB. Energy and environment review: synthesis report Turkey. United Nations Development Programme, 611
The World Bank, Washington. ESM273, 273/03, Energy Sector Management Assistance Programme 612
(ESMAP). 2003. 613
UNIDO. Leather Carbon Footprint, Review of the European Standar EN 16887:2017, Leather-Environmental 614
footprint-Product Category Rules (PCR). 2017. 615
WBCSD. World Business Council for Sustainable Development Standards, 2011a. 616
WBCSD. World Business Council for Sustainable Development, GHG Protocol -Product Life Cycle Accounting 617
and Reporting Standard 2011b. 618
Winnipeg. Sewage Treatment Program South End Plant Process Selection Report, CO2 emission factors database. 619
http://www.winnipeg.ca/finance/findata/matmgt/documents/2012/682-2012/682-2012_Appendix_H-620
WSTP_South_End_Plant_Process_Selection_Report/Appendix 7.pdf. 2011. 621
Xu X, Baquero G, Puig R, Shi J, J Sang J, Lin W. Carbon footprint and toxicity indicators of alternative chromium 622
free tanning in China. Journal of American Leather Chemist Association 2015; 110: 130-137. 623
624
625