Embed Size (px)
Citation preview

Cornerstone Segmental Retaining Wall UnitShear Strength Test
Prepared for
SI Geosolutions6025 Lee Highway, Suite 435
Chattanooga, TN
__________________________________Prepared by
National Concrete Masonry AssociationResearch and Development Laboratory
2302 Horse Pen RoadHerndon, Virginia 20171
Tel: 703-713-1900Fax: 703-713-1910
__________________________________March 1, 2001

2
NATIONALCONCRETE MASONRYASSOCIATION
NATIONAL CONCRETE MASONRY ASSOCIATION
The National Concrete Masonry Association (NCMA) is a non-profit organization whosemission is to support and advance the common interests of its members in the manufacture,marketing, research, and application of concrete masonry products. The Association is anindustry leader in providing technical assistance and education, marketing, research anddevelopment, and product and system innovation to its members and to the industry.
NCMA Technical Staff
Robert D. Thomas, Director of Engineering and ResearchJason J. Thompson, Structural EngineerR. Lance Carter, P.E., Manager of Engineered Landscape ProductsDennis W. Graber, P.E., Director of Technical PublicationsJeffrey H. Greenwald, P.E., Director of Codes and StandardRobert S. Zobel, Ph.D., Manager of Research and Development
NCMA RESEARCH AND DEVELOPMENTLABORATORY
The NCMA Research and Development Laboratory is exclusively devoted to the scientificresearch and testing of concrete masonry products and systems. The Laboratory is staffed byprofessional engineers and technicians with many years of experience in the concretemasonry industry. The Laboratory is equipped to perform nearly any physical research ortesting of concrete masonry units and assemblages. The Laboratory performs research anddevelopment work for both the Association and individual companies.
NCMA Research and Development Laboratory Staff
Robert S. Zobel, Ph.D., Manager of Research and DevelopmentDonald L. Breeding, Laboratory SupervisorDouglas H. Ross, Senior Laboratory TechnicianJoynul Kahn, Laboratory TechnicianJeffrey Johnson, Laboratory Technician
2302 Horse Pen RoadHerndon, Virginia 20171-3499
(703) 713-1900

3
TABLE OF CONTENTS
1.0 INTRODUCTION _____________________________________________________ 42.0 SHEAR STRENGTH TEST PROCEDURES________________________________ 43.0 SHEAR STRENGTH TEST RESULTS ____________________________________ 54.0 ALLOWABLE SHEAR STRENGTH – NCMA METHODOLOGY ______________ 7
Appendix A – Load Deformation Plots for Cornerstone 100 Series _______________A-1
Appendix B – Load Deformation Plots for Cornerstone 100 Series with GG 45 _____ B-1
4
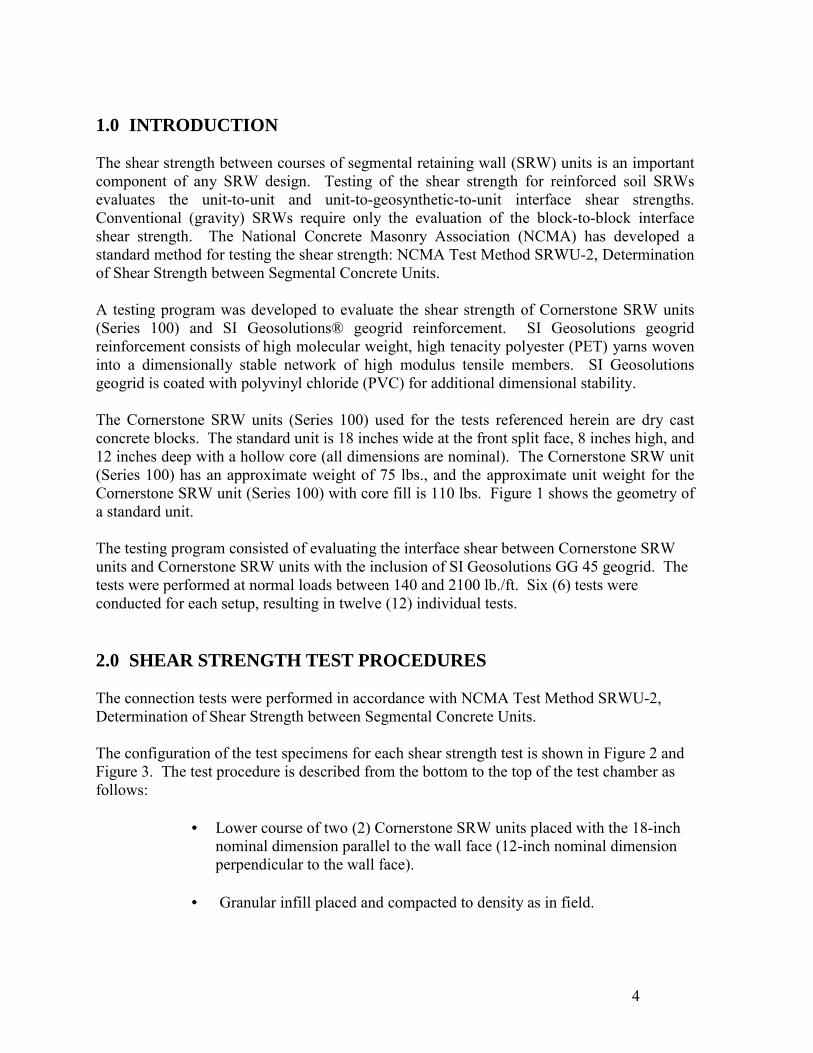
1.0 INTRODUCTION
The shear strength between courses of segmental retaining wall (SRW) units is an importantcomponent of any SRW design. Testing of the shear strength for reinforced soil SRWsevaluates the unit-to-unit and unit-to-geosynthetic-to-unit interface shear strengths.Conventional (gravity) SRWs require only the evaluation of the block-to-block interfaceshear strength. The National Concrete Masonry Association (NCMA) has developed astandard method for testing the shear strength: NCMA Test Method SRWU-2, Determinationof Shear Strength between Segmental Concrete Units.
A testing program was developed to evaluate the shear strength of Cornerstone SRW units(Series 100) and SI Geosolutions® geogrid reinforcement. SI Geosolutions geogridreinforcement consists of high molecular weight, high tenacity polyester (PET) yarns woveninto a dimensionally stable network of high modulus tensile members. SI Geosolutionsgeogrid is coated with polyvinyl chloride (PVC) for additional dimensional stability.
The Cornerstone SRW units (Series 100) used for the tests referenced herein are dry castconcrete blocks. The standard unit is 18 inches wide at the front split face, 8 inches high, and12 inches deep with a hollow core (all dimensions are nominal). The Cornerstone SRW unit(Series 100) has an approximate weight of 75 lbs., and the approximate unit weight for theCornerstone SRW unit (Series 100) with core fill is 110 lbs. Figure 1 shows the geometry ofa standard unit.
The testing program consisted of evaluating the interface shear between Cornerstone SRWunits and Cornerstone SRW units with the inclusion of SI Geosolutions GG 45 geogrid. Thetests were performed at normal loads between 140 and 2100 lb./ft. Six (6) tests wereconducted for each setup, resulting in twelve (12) individual tests.
2.0 SHEAR STRENGTH TEST PROCEDURES
The connection tests were performed in accordance with NCMA Test Method SRWU-2,Determination of Shear Strength between Segmental Concrete Units.
The configuration of the test specimens for each shear strength test is shown in Figure 2 andFigure 3. The test procedure is described from the bottom to the top of the test chamber asfollows:
• Lower course of two (2) Cornerstone SRW units placed with the 18-inchnominal dimension parallel to the wall face (12-inch nominal dimensionperpendicular to the wall face).
• Granular infill placed and compacted to density as in field.
5
• The geogrid was placed on top of the first course of units. The geogridextends beyond the edge of the upper unit to assure complete influence onthe interface surface. The grid was placed such that the first transverse ribwas positioned just to the inside surface of the face shell of the front of theunits (Figure 2).
• Second course of Cornerstone SRW unit placed on top of the first courseand the installed geogrid.
• Granular infill placed and compacted to density as in field.
For each setup, the shear strength test was conducted as follows:
• Normal load was applied to the wall specimen through a single ramhydraulic loading system to steel spreader beams, bearing plates with steelrollers, and a layer of hard neoprene bearing pads placed on the top course(Figure 3). The magnitude of normal load for the hydraulic ram wasmaintained at a constant level and monitored using an electronic load cellthroughout each test.
• After application of the normal load, each setup was subjected to a seatingload, not to exceed 10% of the peak shear strength or 50 lbs., whichever issmaller.
• Each test setup was subjected to a transverse load, by displacing the upperSRW unit across the top of the lower course of SRW units, at a rate of0.01 to 0.03 in./min. The test was continued until a constant or decreasingtransverse load was recorded. The normal load was maintained at aconstant magnitude throughout each test.
• All of interface shear tests were conducted with the transverse loadapplied perpendicular to the back of the upper SRW Unit
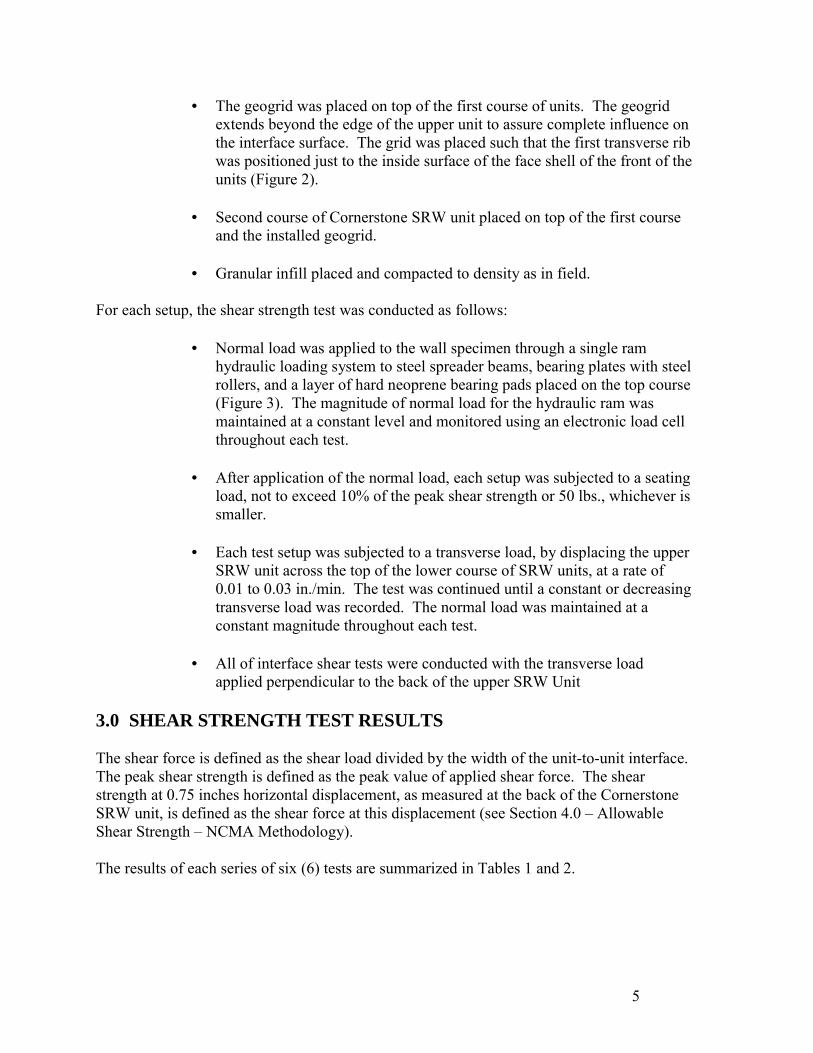
3.0 SHEAR STRENGTH TEST RESULTS
The shear force is defined as the shear load divided by the width of the unit-to-unit interface.The peak shear strength is defined as the peak value of applied shear force. The shearstrength at 0.75 inches horizontal displacement, as measured at the back of the CornerstoneSRW unit, is defined as the shear force at this displacement (see Section 4.0 – AllowableShear Strength – NCMA Methodology).
The results of each series of six (6) tests are summarized in Tables 1 and 2.
6
TABLE 1SUMMARY OF TEST RESULTS
Cornerstone SRW Unit to Cornerstone SRW Unit
TESTNUMBER
NORMALLOAD(lb/ft)
APPROXIMATEWALL HEIGHT
(ft)
PEAKSHEAR
STRENGTH(lb/ft)
SERVICEABILITYSHEAR
STRENGTH(lb/ft)
1 147 1.33 972 9722 473 4.67 1862 15503 1270 12.00 3489 30614 1273 12.00 3139 27985 1266 12.00 3416 22436 2078 19.33 3988 3988
TABLE 2SUMMARY OF TEST RESULTS
Cornerstone SRW Unit to Cornerstone SRW Unit with SI Geosolutions GG 45
TESTNUMBER
NORMALLOAD(lb/ft)
APPROXIMATEWALL HEIGHT
(ft)
PEAKSHEAR
STRENGTH(lb/ft)
SERVICEABILITYSHEAR
STRENGTH(lb/ft)
7 147 1.33 825 8258 471 4.67 2035 20359 1268 12.00 2630 2123
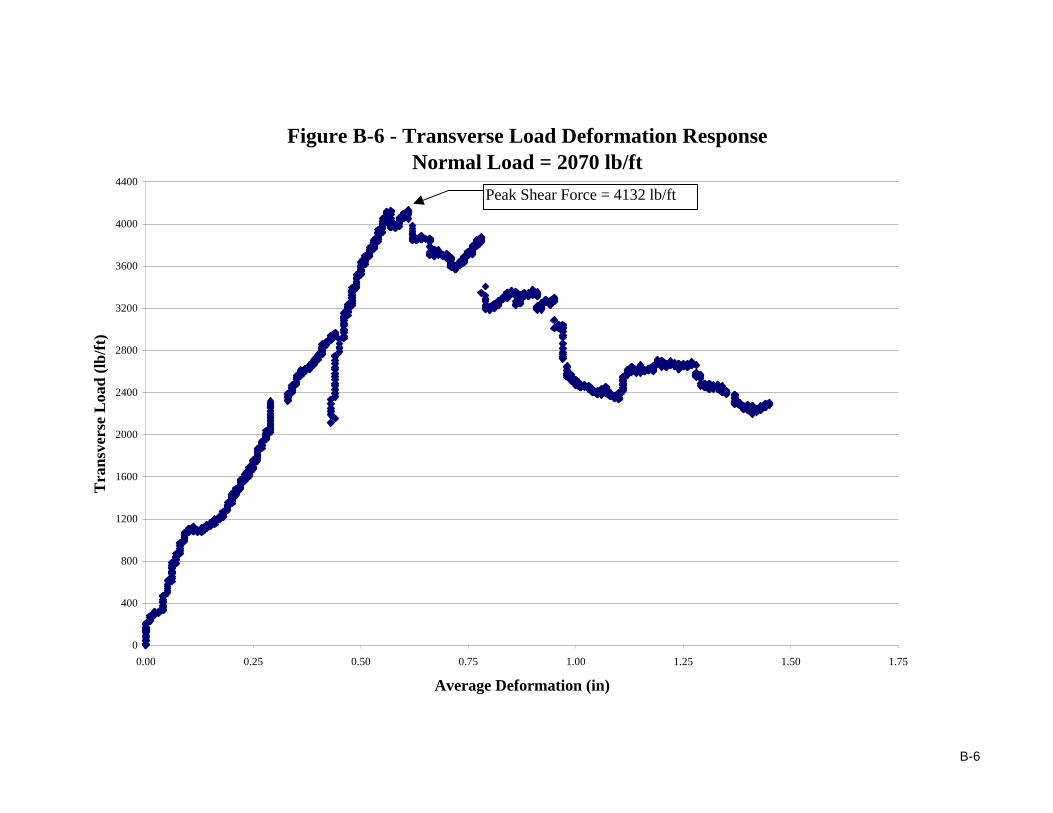
10 1275 12.00 2501 250111 1276 12.00 2842 284212 2070 19.33 4132 4132

7
4.0 ALLOWABLE SHEAR STRENGTH – NCMA METHODOLOGY
The NCMA “Design Manual for Segmental Retaining Walls” has adopted a procedure fordetermining the allowable shear strength between SRW units that considers both a limit shearstrength and a serviceability shear strength. The shear strength between SRW units providestwo functions. One, the shear strength between SRW units provides additional slidingresistance when evaluating internal sliding, a potential internal sliding failure that propagatesalong the surface of a geosynthetic reinforcement layer and through the interface betweenSRW units. Two, the shear strength between SRW units provides resistance to thetheoretical horizontal earth pressure being applied between layers of geosyntheticreinforcement (resistance to bulging), maintaining the relative position of one course to thenext. The shear strength is a function of applied pressure, vertical spacing of geosyntheticreinforcement and shear strength between SRW units. The procedure for determining theshear strength (capacity) is presented below:
The peak shear strength (Vu(n)) at any interface is determined as follows:
Vu(n) = au + Ww(n) tanλu
Where:
au = apparent shear capacity (lb/ft)
λu = apparent peak interface friction angle betweenSRW units (deg)
Ww(n) = total weight of column of dry-stacked SRWunits between surface and hinge height relativeto the sliding surface (lb/ft)
Limiting movement of the wall face over the life of the structure (serviceability) is alsoconsidered.
V’u(n) = a’u + Ww(n) tanλ’u
Where:
a’u = apparent serviceability shear capacity (lb/ft)
λ'u = apparent serviceability interface friction anglebetween SRW units (deg)
Ww(n) = total weight of column of dry-stacked SRWunits between surface and hinge height relativeto the sliding surface (lb/ft)

8
The limit state and serviceability shear strengths are provided in Tables 1 and 2 for each testsetup and level of normal load. A plot of the peak and serviceability shear strength versesapplied normal is shown in Figures 4 and 5, and individual load deformation plots for eachtest can be found in Appendices A and B.

9
Figure 1 – Cornerstone Segmental Retaining Wall Unit Geometry
Figure 2 – Shear Strength Test Setup – Cornerstone SRW Unit with SI Geosolutions GG 45Geogrid
18 " Nominal
12 "
Nom
inal

10
Figure 3 - Shear Strength Test Setup - Cornerstone SRW Unit
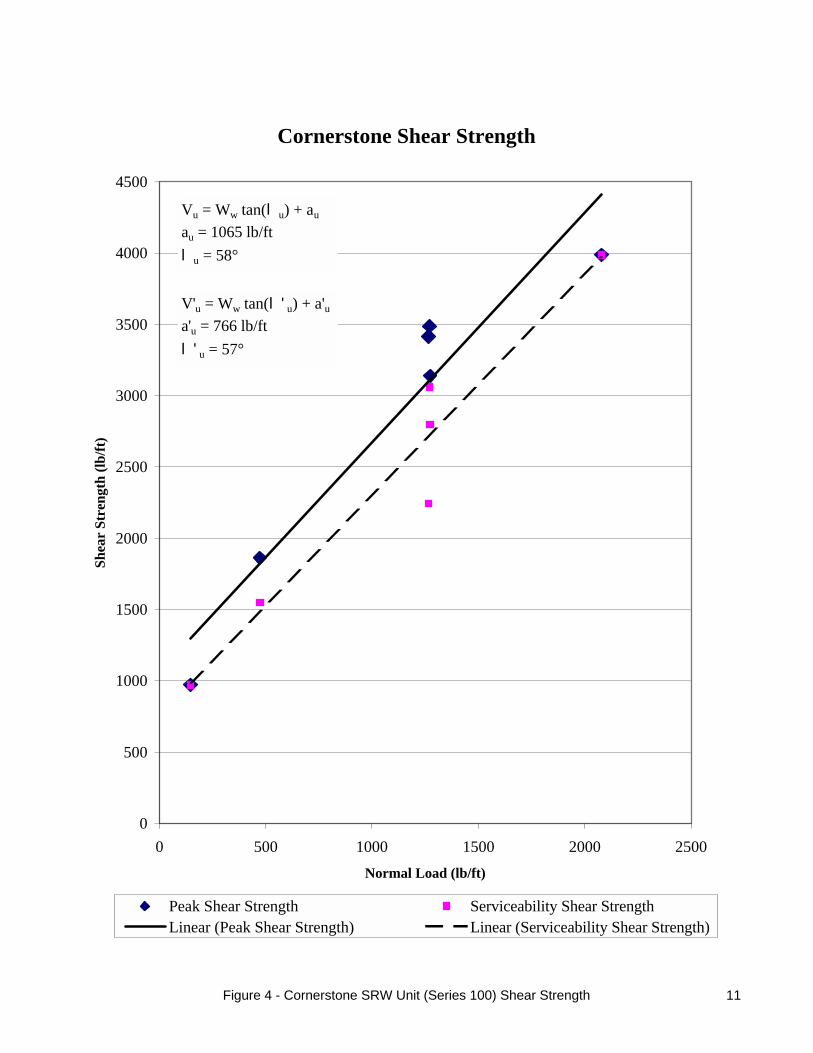
Figure 4 - Cornerstone SRW Unit (Series 100) Shear Strength 11
Cornerstone Shear Strength
0
500
1000
1500
2000
2500
3000
3500
4000
4500
0 500 1000 1500 2000 2500Normal Load (lb/ft)
Shea
r St
reng
th (l
b/ft)
Peak Shear Strength Serviceability Shear StrengthLinear (Peak Shear Strength) Linear (Serviceability Shear Strength)
V'u = Ww tan(l'u) + a'ua'u = 766 lb/ftl'u = 57°
Vu = Ww tan(lu) + au
au = 1065 lb/ftlu = 58°

Figure 5 - Cornerstone SRW Unit (Series 100) Shear Strength with GG 45 12
Cornerstone Shear Strengthwith GG 45
0
500
1000
1500
2000
2500
3000
3500
4000
4500
0 500 1000 1500 2000 2500Normal Load (lb/ft)
Shea
r St
reng
th (l
b/ft)
Peak Shear Strength Serviceability Shear StrengthLinear (Peak Shear Strength) Linear (Serviceability Shear Strength)
V'u = Ww tan(l'u) + a'ua'u = 801 lb/ftl'u = 56°
Vu = Ww tan(lu) + au
au = 842 lb/ftlu = 57°

Appendix A – Load Deformation Plots for Cornerstone 100 Series

A-1
Figure A-1 - Transverse Load Deformation ResponseNormal Load = 147 lb/ft
0
200
400
600
800
1000
1200
0.00 0.25 0.50 0.75 1.00
Average Deformation (in)
Tra
nsve
rse
Loa
d (lb
/ft)
Peak Shear Force = 972 lb/ft

A-2
Figure A-2 - Transverse Load Deformation ResponseNormal Load = 473 lb/ft
0
200
400
600
800
1000
1200
1400
1600
1800
2000
0.00 0.25 0.50 0.75 1.00 1.25 1.50
Average Deformation (in)
Tra
nsve
rse
Loa
d (lb
/ft)
Peak Shear Force = 1862 lb/ft
Serv
ice
Stat
e D
efor
mat
ion

A-3
Figure A-3 - Transverse Load Deformation ResponseNormal Load = 1270 lb/ft
0
400
800
1200
1600
2000
2400
2800
3200
3600
4000
0.00 0.25 0.50 0.75 1.00 1.25 1.50 1.75
Average Deformation (in)
Tra
nsve
rse
Loa
d (lb
/ft)
Peak Shear Force = 3489 lb/ft
Serv
ice
Stat
e D
efor
mat
ion

A-4
Figure A-4 - Transverse Load Deformation ResponseNormal Load = 1273 lb/ft
0
400
800
1200
1600
2000
2400
2800
3200
3600
4000
0.00 0.25 0.50 0.75 1.00 1.25 1.50 1.75
Average Deformation (in)
Tra
nsve
rse
Loa
d (lb
/ft)
Peak Shear Force = 3139 lb/ft
Serv
ice
Stat
e D
efor
mat
ion

A-5
Figure A-5 - Transverse Load Deformation ResponseNormal Load = 1266 lb/ft
0
400
800
1200
1600
2000
2400
2800
3200
3600
4000
0.00 0.25 0.50 0.75 1.00 1.25 1.50
Average Deformation (in)
Tra
nsve
rse
Loa
d (lb
/ft)
Peak Shear Force = 3416 lb/ft
Serv
ice
Stat
e D
efor
mat
ion

A-6
Figure A-6 - Transverse Load Deformation ResponseNormal Load = 2078 lb/ft
0
400
800
1200
1600
2000
2400
2800
3200
3600
4000
4400
0.00 0.25 0.50 0.75 1.00 1.25 1.50
Average Deformation (in)
Tra
nsve
rse
Loa
d (lb
/ft)
Peak Shear Force = 3988 lb/ft

Appendix B – Load Deformation Plots for Cornerstone Series 100 with SIGeosolutions GG 45 Geogrid

B-1
Figure B-1 - Transverse Load Deformation ResponseNormal Load = 147 lb/ft
0
200
400
600
800
1000
1200
0.00 0.25 0.50 0.75
Average Deformation (in)
Tra
nsve
rse
Loa
d (lb
/ft)
Peak Shear Force = 825 lb/ft
B-2
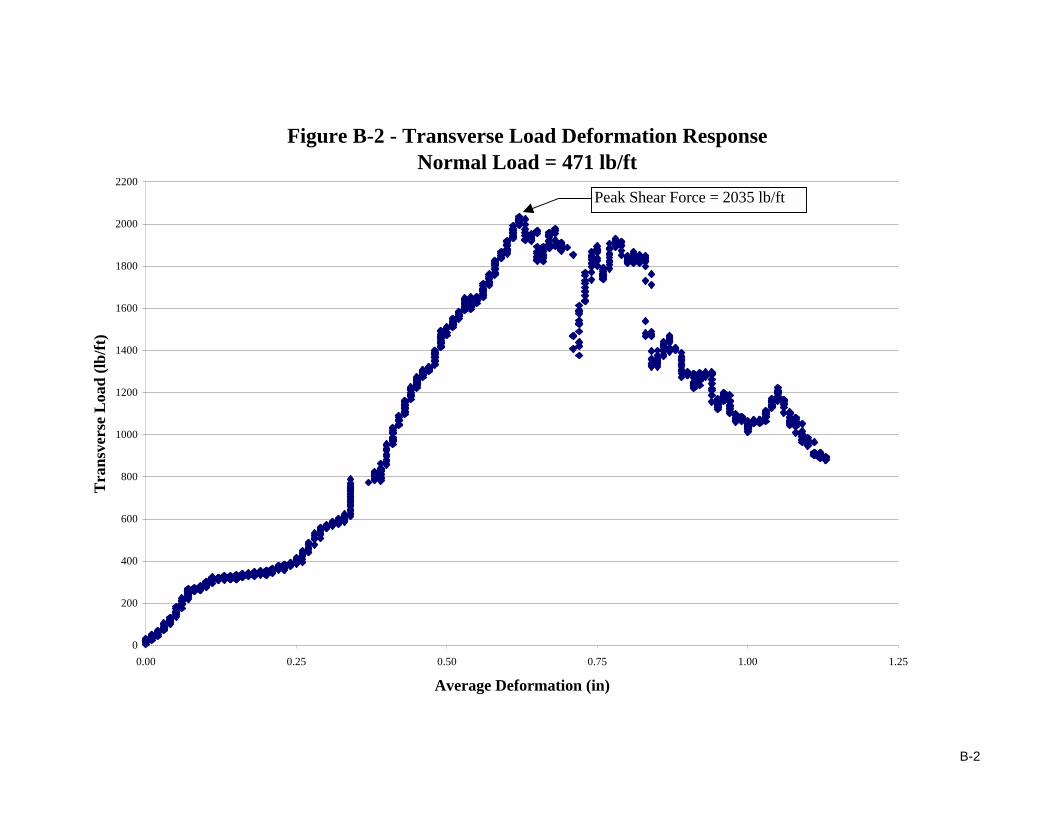
Figure B-2 - Transverse Load Deformation ResponseNormal Load = 471 lb/ft
0
200
400
600
800
1000
1200
1400
1600
1800
2000
2200
0.00 0.25 0.50 0.75 1.00 1.25
Average Deformation (in)
Tra
nsve
rse
Loa
d (lb
/ft)
Peak Shear Force = 2035 lb/ft
B-3
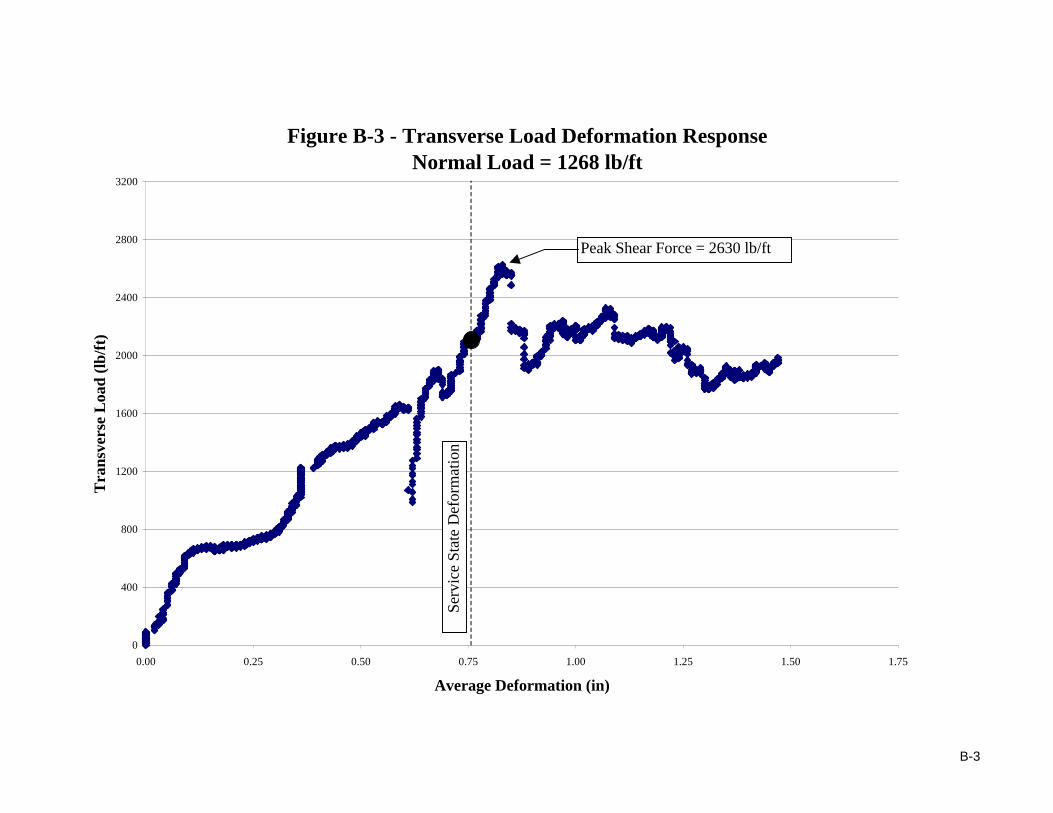
Figure B-3 - Transverse Load Deformation ResponseNormal Load = 1268 lb/ft
0
400
800
1200
1600
2000
2400
2800
3200
0.00 0.25 0.50 0.75 1.00 1.25 1.50 1.75
Average Deformation (in)
Tra
nsve
rse
Loa
d (lb
/ft)
Peak Shear Force = 2630 lb/ft
Serv
ice
Stat
e D
efor
mat
ion
B-4
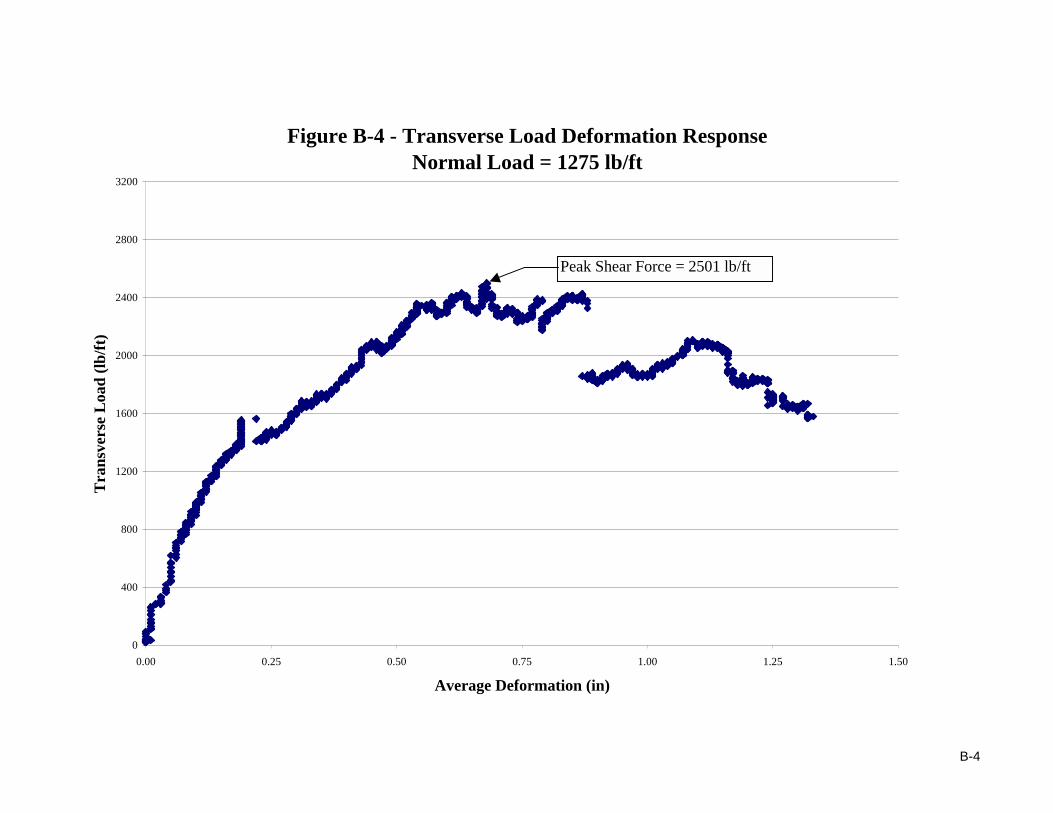
Figure B-4 - Transverse Load Deformation ResponseNormal Load = 1275 lb/ft
0
400
800
1200
1600
2000
2400
2800
3200
0.00 0.25 0.50 0.75 1.00 1.25 1.50
Average Deformation (in)
Tra
nsve
rse
Loa
d (lb
/ft)
Peak Shear Force = 2501 lb/ft

B-5
Figure B-5 - Transverse Load Deformation ResponseNormal Load = 1276 lb/ft
0
400
800
1200
1600
2000
2400
2800
3200
0.00 0.25 0.50 0.75 1.00 1.25 1.50
Average Deformation (in)
Tra
nsve
rse
Loa
d (lb
/ft)
Peak Shear Force = 2842 lb/ft
B-6
Figure B-6 - Transverse Load Deformation ResponseNormal Load = 2070 lb/ft
0
400
800
1200
1600
2000
2400
2800
3200
3600
4000
4400
0.00 0.25 0.50 0.75 1.00 1.25 1.50 1.75
Average Deformation (in)
Tra
nsve
rse
Loa
d (lb
/ft)
Peak Shear Force = 4132 lb/ft