Embed Size (px)
Citation preview

Core-to-Log Integration and Calibration
(The Elastic Properties of Rocks?)
Barry Setterfield LPS
Petrophysics 101 Thursday 17th March 2016

Core to Log Integration and Calibration (The elastic properties of rocks?)
• Measurements derived from core material are taken as definitive because they have been measured under standard laboratory conditions on rock samples derived from the reservoir.
• Log measurements are seen as having greater uncertainty in consequence of the tools, means and environment by which they are acquired.
• Industry has long sought to reconcile log derived measurements with those derived from cores. The subject is fraught with assumptions and uncertainty. • Firstly, there is the process of integration of the two measurements
by depth matching the core and plug samples to the logs. • Secondly, there is the process of calibration of the log measurements
using the core plug measurements.
• A review of the basic principles and techniques is presented, along with some of the uncertainties, assumptions and errors.

Core-to-Log Integration

Check Core • Cored interval vs Recovery. Less than 100%? Where did it go? • Lithology: clastic, carbonate, thin beds, massive beds, vugs etc? • Is the core the right way up? Are coloured ‘tramlines’/arrows correct? Is the
‘Top’ the top and is the ‘Bottom' the bottom?
• Is the core accurately re-constructed? • Are the core pieces in correct sequence? Do sedimentary features agree with
this? • Are there any missing pieces or gaps? • When core is measured it is often assumed that lost material is from base. Is
this the case? • Do the core plug (H & V) depths agree with the plug hole depths in the core? • Do the core photo’s match the core? • Do core and core photo’s match image logs?
Core-to-Log Integration

Check Logs • Are logs on-depth with each other?
• Does logger’s last casing shoe match Driller’s? Is there a depth discrepancy? How does this match initial core to log depth offset prior to shifting
• Are log responses correct? e.g. 57 us/ft in casing
• Are logs within tolerance? Check QC tails.
Core-to-Log Integration

Core-to-Log Integration
Factors affecting depth matching • Acquired using floating installation? Then was there a tidal
correction between cores and/or between logging runs?
• Stump from previous core? At the top of the next core?
• Core barrel jams – signs of wear or erosion of core material?
• Loss of core material e.g. souvenirs?

Core-to-Log Integration
• Which curves to choose to match? e.g. Gamma Ray, Bulk
Density, Porosity, Sw, Image Logs. Look for the Log curves with the most variable features.
• Single Core, block shift whole core? Block shift sections of cored interval? Depth shift individual plugs - dubious?
• Multiple Back-to-Back Cores. Block shift cores individually? Block shift sections of cored intervals? Depth shift individual plugs - dubious?
• Do not Stretch-Squeeze depth shift!

Core-to-Log Calibration
Core-to-Log Calibration
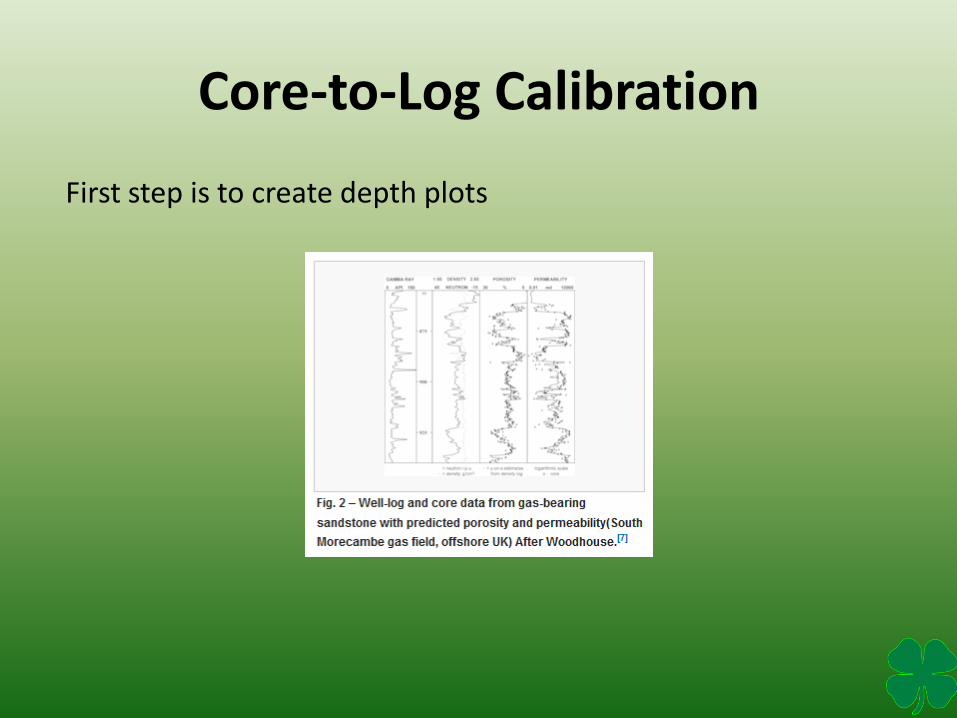
First step is to create depth plots

Core-to-Log Calibration
Then crossplots of the core data against the various log data
‘To some observers, the y-on-x line-fit initially is awkward and less central than some other line-fits. The reduced-major-axis (RMA) line-fit, for example, follows the intuitive middle ground along the major axis of the data cloud (see Fig. 3). The "structural" line-fits estimate the relationship that would be observed if both the y and x variables were error-free. The RMA line provides this relationship for the particular case when y and x have equal fractional errors. These structural line-fits are not generally used in practice because, for their future use, they apply to error-free x-input data, not the real measured data. The RMA slope is defined by the ratio of the standard deviations (SDs) of y and x together with the sign of r. The y-on-x slope is equal to the RMA slope multiplied by the correlation coefficient r. ‘ Woodhouse, R. 2003

Core-to-Log Calibration
‘The initial impression of y-on-x does not weaken its status as the method with the lowest overall residual error in the required y estimates. When viewed from any position on the x-axis, the y-on-x line is central within the y-data values near that x-position (see Fig. 4). Providing average y-estimates from measured x-data is the main feature of y-on-x lines; however, the y-variance of the calibration data is not preserved by y-on-x predictions and the extremes of the y-range are averaged. The RMA line-fit does honour the y-variance; but if y and x are only moderately correlated, high porosity values are overestimated and low porosity values are underestimated (see Fig. 5). The depths of the RMA-predicted high and low y-values will not be at the same depths as the core high and low values. ‘ Woodhouse, R. 2003

Factors to Consider • Errors in ‘Y’?
• Errors in ‘X’?
• ‘Y’ Dependent Variable
• ‘X’ Independent Variable
• y-on-x method assumes that the y and x measurements apply to the same rock sample
• Cores are not always regularly sampled
• To fix Zero Intercept or not? e.g. with average grain density
• Calibration lines should be determined for a single population
• There are circumstances when line-fits such as RMA should be considered e.g. carbonates
Core-to-Log Calibration

Factors to Consider Cont.. • Orientation of Core and plugs relative to logging tool sensor
orientation
• Plotting Horizontal or Vertical Plugs?
• Temperature change in bringing core to surface
• Change in wettability from virgin state
• Stress relief during recovery process i.e. unloading, de-gassing
• Damage during plugging, cleaning and drying processes
• Formation heterogeneity
Core-to-Log Calibration
Plotting Porosity and Permeability It is recognised that excellent porosity-permeability relationships can be obtained once the conventional core data are grouped according to their rock types.
• Flow Zone Indices (FZI)
• Reservoir Quality Indices (RQI)
• Hydraulic Units
Core-to-Log Calibration

References and Acknowledgements
• http://petrowiki.org/Porosity_for_resource_in_place_calculations • Woodhouse, R. 2003. Statistical Regression Line-Fitting in the Oil and Gas
Industry. Tulsa, Oklahoma: PennWell. • Levin, R.I. 1984. Statistics for Management. New Jersey: Prentice-Hall Inc. • Abbaszadeh, M. et al 1996. Permeability Prediction by Hydraulic Flow
Units – Theory and Applications. SPE Formation Evaluation • Amafeule, J.O. et al 1993. Enhanced Reservoir Description: Using Core and
Log Data to Identify Hydraulic Flow Units and Predict Permeability in Uncored Intervals/Wells. SPE 26436
• Stolz, A-K. et al 2003. Sensitivity Study of Flow Unit Definition by Use of Reservoir Simulation. SPE 84277
• Guo, G. et al 2005. Rock Typing as an Effective Tool for Permeability and Water Saturation Modelling: A Case Study in a Clastic Reservoir in the Oriente Basin. SPE 97033
• SPWLA for use of PetroWiki material