Embed Size (px)
Citation preview

July 2015
Core Research Program: Student Baseline Data
GEAR UP College and Career Readiness Evaluation Consortium
Ty Cruce, PhD
Kurt Burkum, PhD

© 2015 by ACT, Inc. All rights reserved. ACT®, ACT Aspire®, ACT Explore®, and ACT Plan® are registered trademarks of ACT, Inc. 4182
Ty Cruce is director in Statistical and Applied Research
at ACT specializing in the study of student preferences
and decision making during the college choice process.
Kurt Burkum is senior director of Policy Research at
ACT specializing in state and federal policy issues related
to college readiness and transitions, particularly for
underserved student populations.

www.act.org
Core Research Program
Report 2
As part of its contribution to CCREC, ACT is leading the core research program, a longitudinal study of the effectiveness of fourteen GEAR UP state grants on the academic achievement, college going, and college retention of low-income and other at-risk students.
IntroductionGaining Early Awareness and Readiness
for Undergraduate Programs (GEAR UP)
is a federal discretionary grant program
designed to increase the number of
students from low-income schools who
are prepared to enter and succeed in
postsecondary education.1 The program
provides six- or seven-year grants to states
and local partnerships to provide services
at middle schools and high schools that
educate primarily low-income students.2
GEAR UP has three broad objectives:
• Increase academic performance and
preparation for postsecondary education.
• Increase the rate of high school
graduation and participation in
postsecondary education.
• Increase educational expectations
and student and family knowledge of
postsecondary educational options,
preparation, and financing.
In order to better understand GEAR UP
across programs, fourteen state GEAR UP
grants funded in the 2011 or 2012 fiscal
year (FY) award cycles have partnered with
the National Council for Community and
Education Partnerships (NCCEP) and ACT
to form the College and Career Readiness
Evaluation Consortium (CCREC). This
research partnership focuses on the
effectiveness of the fourteen state GEAR
UP programs in meeting these three
objectives.3 As part of its contribution to the
consortium, ACT is leading two research
efforts on behalf of CCREC:4
1. The core research program is a
longitudinal study of the effectiveness of
GEAR UP state grants on the academic
achievement, college going, and college
retention of students who are eligible to
receive grant-funded services, many of
which are from low-income families or
otherwise underserved. This research
program will follow CCREC students
and a matched comparison group
of nonparticipants over time using
assessment data from ACT Explore®,
ACT Plan® or ACT Aspire®, and the
ACT® test and college enrollment
data from the National Student
Clearinghouse (NSC) to examine
differences in the academic growth
and educational outcomes of these two
groups.
2. The supplemental research program,
addressed in more detail in other reports
prepared for CCREC, is a study of the
impact of good educational practices
delivered through two commonly
offered GEAR UP-funded services,
tutoring and mentoring, on the academic
achievement and noncognitive outcomes
(e.g., academic self-confidence and
commitment to school) of GEAR UP
participants. Unlike the core research
program, the supplemental research
program is not intended to address
the causal effect of GEAR UP. Instead,
the supplemental research program
intends to help consortium member
states and other GEAR UP programs
better understand the relationships
between the structure and quality of
services commonly offered by GEAR UP
programs and the relationships among
service structure and quality, academic
achievement, and noncognitive
outcomes.
This report focuses on the core research
program, beginning with an overview.

4
Core Research Program Report Student Baseline Data
Next, we provide descriptive data and
narrative discussions on student background
characteristics followed by baseline data on
academic achievement, educational plans,
and self-reported needs of the GEAR UP and
comparison sample data. The comparison
sample in this report will be used to construct a
matched group for future analysis and reporting.
The report concludes by identifying future
reporting of the CCREC core research.
Core Research ProgramACT’s longitudinal CCREC core research
program will compare the academic growth,
college-going rates, and college retention
rates between a treatment group of students
who were eligible to receive GEAR UP-funded
services in the fourteen CCREC member states
and a matched comparison group of low-income
students who did not receive GEAR UP-funded
services. Through this nearly decade-long study,
we seek to provide a reasonable answer to the
general causal question of interest to the core
research program: Are students who are eligible
to receive services funded by GEAR UP state
grants better off educationally than they would
have been in absence of that funding?
This report provides baseline information about
the students eligible to receive GEAR UP
services through the fourteen CCREC state
GEAR UP grants and about students in a
key comparison group. These comparisons of
academic achievement levels between CCREC
and non-GEAR UP low-income students provide
the baseline information necessary for performing
a longitudinal study on the relationship between
academic outcomes and GEAR UP.
Baseline Primary Research QuestionsThe following research questions for the base
year are not intended to address the causal
effect of GEAR UP. Rather, they establish a
baseline for estimating the effect of GEAR
UP and informing the selection of a matched
comparison group for GEAR UP participants:
1. Among eighth graders who took ACT Explore
during the 2012–13 or 2013–14 academic
years,5 to what extent do CCREC students
and non-GEAR UP low-income students
differ with regard to their background
characteristics?
2. To what extent do CCREC students and non-
GEAR UP low-income students differ in their
academic achievement levels in the areas of
English, mathematics, reading, and science,
as measured by ACT Explore?
3. To what extent do CCREC students and
non-GEAR UP low-income students differ
in being on track for college readiness,
as measured by their attainment of ACT
Explore Benchmarks in the areas of English,
mathematics, reading, and science?
4. To what extent do CCREC students and non-
GEAR UP low-income students differ in their
high school and post-high school plans, as
self-reported on ACT Explore?
5. To what extent do CCREC students and
non-CCREC students differ with regard to
their self-reported educational planning and
academic skill needs?
Data Collection and SampleData CollectionACT will collect all data supporting the core
research program from one of four assessments
(i.e., ACT Explore, ACT Plan/ACT Aspire, and the
ACT) or from its partnership with NSC.6 Over the
course of this longitudinal study, five separate
data collections will occur. The first collection will
take place in the base year in eighth grade (ACT
Explore), and there will be four follow-up data
collections: in tenth grade (ACT Plan or ACT
Aspire), in eleventh and/or twelfth grade (the
ACT), in the first year of college (NSC), and in
the second year of college (NSC).7

5
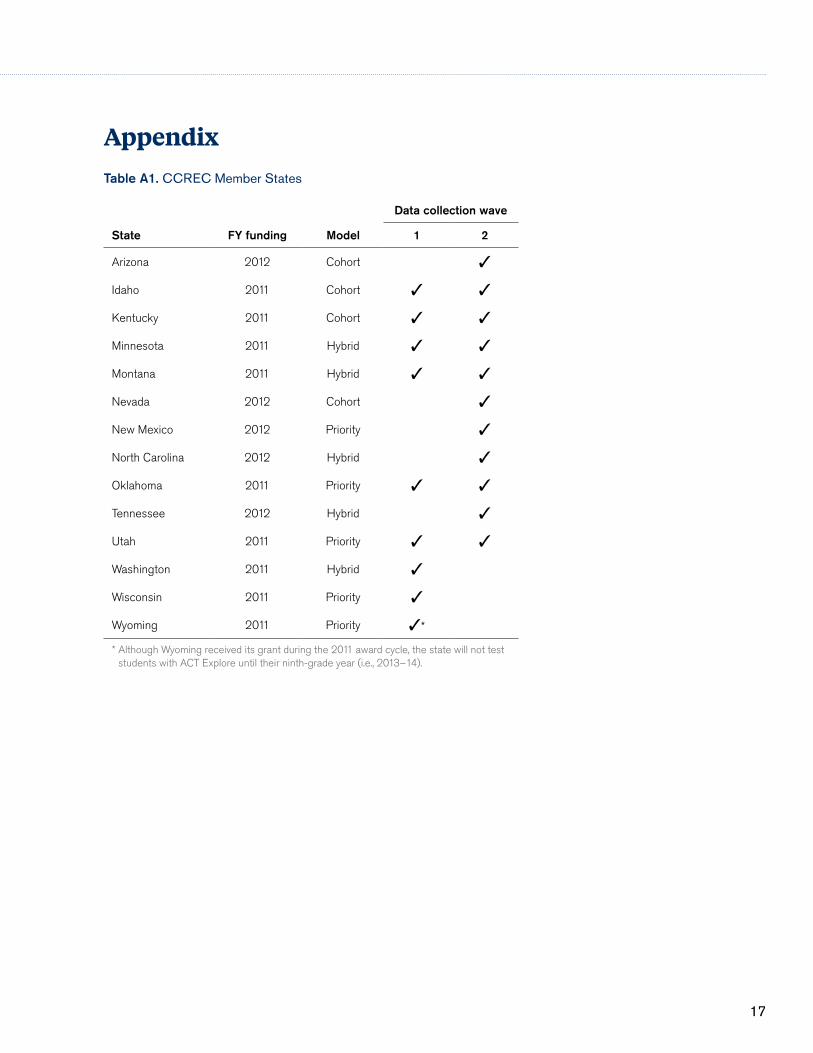
Among the CCREC members states, nine
were awarded grants in FY2011 and five were
awarded grants in FY2012 (see appendix
table A1). Due to these different funding years
for member states, the core research program
follows, longitudinally, two waves of students.
This report presents combined findings on those
students from both data collection waves (i.e.,
2012–13 and 2013–14) when students were in
the eighth grade.8
CCREC Study SampleThe sample for the core research program
comprises those students in the fourteen
CCREC member states eligible to receive
GEAR UP services prior to taking ACT Explore
in the eighth grade. Nine CCREC member
states are administering either a cohort-only
program model or a blend of cohort and priority
student program models (see appendix table
A1).9 Within these states, the core research
program follows those students initially assigned
to GEAR UP under the cohort model. Four
states are administering a priority-only program
model, but assignment of students to GEAR
UP services under these models varies across
the states. Given the focus of the core research
program on the academic growth, educational
plans, and eventual college enrollment and
retention of students assigned to receive GEAR
UP services, priority students are incorporated
into the longitudinal design by including those
students who are served across years and fit
into the “cohort” structure where they received
GEAR UP services before taking ACT Explore in
eighth grade. Although this approach excludes
a number of priority students because they are
outside the cohort structure included in the
study, the focus of the core research program is
on understanding the benefits of GEAR UP on
those students who were eligible to receive the
services over the full course of the grant (grades
7–12) as they matriculate through middle and
high school.
For the baseline, data collection took place with
the administration of ACT Explore in the 2012–
13 and 2013–14 academic years, depending on
the year students took the assessment. In total,
41,588 students who were eligible to receive
GEAR UP services across 365 schools in
fourteen states took ACT Explore (see table 1).
Just under half of these students were from
Kentucky, Tennessee, or Oklahoma.
Table 1. Number of CCREC Schools and Students Identified in ACT Explore Research Data File
State Schools StudentsPercent of
total students
Arizona 22 3,047 7.3
Idaho 28 4,430 10.7
Kentucky 30 7,448 17.9
Minnesota 7 939 2.3
Montana 19 1,451 3.5
Nevada 19 2,342 5.6
New Mexico 13 1,444 3.5
North Carolina 24 3,913 9.4
Oklahoma 24 5,935 14.3
Tennessee 61 6,518 15.7
Utah 9 236 0.6
Washington 30 3,191 7.7
Wisconsin 14 321 0.8
Wyoming 65 373 0.9
Total 365 41,588 100.0

6
Core Research Program Report Student Baseline Data
Comparison GroupExcluding Non-CCREC GEAR UP StudentsTo identify students who were potentially
receiving GEAR UP services funded by a
grantee other than the fourteen CCREC state
grantees (“non-CCREC GEAR UP students”),
the Consortium requested a data file from the
US Department of Education that provided a list
of schools participating in GEAR UP as reported
by grantees in their 2013 and 2014 Annual
Performance Report submissions. After removing
CCREC schools from this list, ACT matched
the remaining schools against ACT Explore test
records for the 2012–13 and 2013–14 school
years to identify potential non-CCREC GEAR
UP students. Students at identified non-CCREC
GEAR UP schools were excluded from the study
to ensure that CCREC GEAR UP students were
not being compared to students in other GEAR
UP programs. Thus, the final comparisons are
between students in GEAR UP CCREC schools
and students in non-GEAR UP schools.
Including Non-GEAR UP StudentsAll ACT Explore-tested students in public schools
not identified as being served by CCREC or non-
CCREC GEAR UP were considered non-GEAR
UP students for the purposes of this study. Non-
GEAR UP students were subdivided into two
groups by the percent of students at the school
who were eligible for the federal free or reduced-
price lunch program. Students attending a non-
GEAR UP school with a free and reduced-price
lunch rate of less than 50%, referred to as non-
GEAR UP high-income students, were excluded
from the study. Students attending a non-GEAR
UP school with a free and reduced-price lunch
rate of 50% or higher, referred to as non-
GEAR UP low-income students, make up the
comparison group. Students in the comparison
group are from 4,538 schools located across
41 states (see table 2).
For future analysis and reporting, a matched-
comparison group will be constructed from the
non-GEAR UP low-income comparison group
used in this baseline report.
Baseline Findings
Background CharacteristicsThe ACT Explore data include information about
students’ demographic, socioeconomic, and
educational backgrounds. This report section
compares CCREC and non-GEAR UP low-
income students’ background characteristics.
GenderThere were equal percentages of females (50%)
and males (50%) among CCREC students
taking ACT Explore. Among students attending
non-GEAR UP low-income schools, however,
there was a slightly larger percentage of
students reporting their gender as male (51%)
than as female (49%).
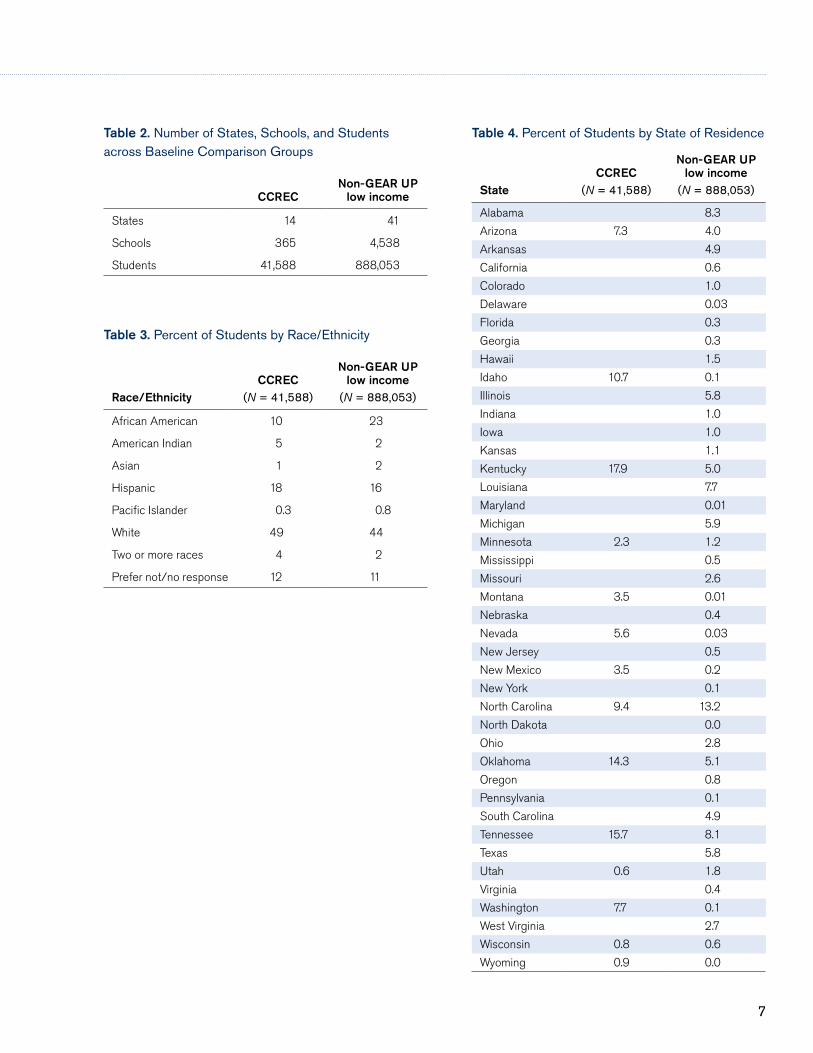
Race/EthnicityCompared to non-GEAR UP low-income
students, a larger percentage of CCREC
students reported they were American Indian,
Hispanic, White, or two or more races; a smaller
percentage were African American, Asian,
or Pacific Islander (see table 3). The largest
percentage-point differences between the
groups were in the percent who reported they
were African American (13 percentage points)
or White (5 percentage points).
State of ResidenceCCREC students were located within the
fourteen participating member states. Roughly
half of all CCREC students were concentrated
within three states—Kentucky, Oklahoma, and
Tennessee (see table 4). An additional quarter
of CCREC students were located within three
additional states—Idaho, North Carolina, and
Washington. Compared to CCREC students,
students in the non-GEAR UP low-income
comparison group represented a larger number
of states, and these students were more widely
distributed across the states. However, roughly
half of all non-GEAR UP low-income students
were concentrated within six states (Alabama,
Illinois, Louisiana, Michigan, North Carolina, and
Tennessee).
7
Table 2. Number of States, Schools, and Students across Baseline Comparison Groups
CCRECNon-GEAR UP
low income
States 14 41
Schools 365 4,538
Students 41,588 888,053
Table 3. Percent of Students by Race/Ethnicity
Race/EthnicityCCREC
(N = 41,588)
Non-GEAR UP low income
(N = 888,053)
African American 10 23
American Indian 5 2
Asian 1 2
Hispanic 18 16
Pacific Islander 0.3 0.8
White 49 44
Two or more races 4 2
Prefer not/no response 12 11
Table 4. Percent of Students by State of Residence
StateCCREC
(N = 41,588)
Non-GEAR UP low income
(N = 888,053)
Alabama 8.3
Arizona 7.3 4.0
Arkansas 4.9
California 0.6
Colorado 1.0
Delaware 0.03
Florida 0.3
Georgia 0.3
Hawaii 1.5
Idaho 10.7 0.1
Illinois 5.8
Indiana 1.0
Iowa 1.0
Kansas 1.1
Kentucky 17.9 5.0
Louisiana 7.7
Maryland 0.01
Michigan 5.9
Minnesota 2.3 1.2
Mississippi 0.5
Missouri 2.6
Montana 3.5 0.01
Nebraska 0.4
Nevada 5.6 0.03
New Jersey 0.5
New Mexico 3.5 0.2
New York 0.1
North Carolina 9.4 13.2
North Dakota 0.0
Ohio 2.8
Oklahoma 14.3 5.1
Oregon 0.8
Pennsylvania 0.1
South Carolina 4.9
Tennessee 15.7 8.1
Texas 5.8
Utah 0.6 1.8
Virginia 0.4
Washington 7.7 0.1
West Virginia 2.7
Wisconsin 0.8 0.6
Wyoming 0.9 0.0

8
Core Research Program Report Student Baseline Data
Parents’/Guardians’ Education LevelA slightly larger percentage of CCREC students
than non-GEAR UP low-income students had
parents or guardians with no postsecondary
training or education (see figure 1). Between
both student groups, roughly seven out of
ten students have parents or guardians who
have not earned a bachelor’s or graduate-
level degree, although roughly one out of
three students have parents or guardians who
have earned some postsecondary training or
education below a bachelor’s degree.
Special Status CodesEach ACT Explore answer folder includes
a section for identifying the test records of
students with particular characteristics for
subgroup analysis. This section is completed by
the test supervisor after students have finished
testing and therefore indicates official school
designations for the student as opposed to
student self-reported information. Each special
status code has its own response field, and
supervisors are instructed to mark all fields that
apply. Although a marked field indicates the
student has been assigned that special status
by the school, the absence of a mark in a field
does not necessarily imply that the student does
not have that special status. Not all schools
complete this section of the answer folder, so it
is difficult to distinguish between the absence of
a special status and school nonresponse.10 The
comparative information provided in this section
should therefore be interpreted with this caveat
in mind.
About one out of three CCREC students and
non-GEAR UP low-income students were
reported to receive free or reduced-price
lunch (see table 5). Unlike students in the
comparison group, a far larger percentage of
CCREC students were designated as receiving
Title I math or reading services—a difference of
13 percentage points between the two groups
for both subjects.
Figure 1. Percent of Students by Parents’/Guardians’ Education Level
40 38
7 8
25 25
17 18
11 12
0
20
40
60
80
100
CCREC (N = 30,548)
Non-GEAR UP low income (N = 637,304)
No college Career/Technical training Less than bachelor’s degree Bachelor’s degree Graduate studies
Note: Parent/guardian education level data are reported by students.

9
Academic AchievementAs previously mentioned, base year comparisons
of academic achievement levels among CCREC
students and non-GEAR UP low-income
students are not intended to address the
causal effect of GEAR UP. Instead, this report
establishes a baseline for estimating the effect
of GEAR UP over time and inform the selection
of a matched non-GEAR UP comparison group.
These baseline data will be used in subsequent
data collection periods to estimate the causal
effect of GEAR UP.
Average ACT Explore ScoresThe score scale for each ACT Explore subject
test and the Composite score ranges from 1
to 25. As shown in table 6, mean ACT Explore
scores for CCREC students and students in the
non-GEAR UP low-income comparison group
were not statistically significantly different.
ACT Explore Readiness BenchmarksThe ACT College Readiness Benchmarks for
ACT Explore were developed using large data
sets of students who had taken ACT Explore,
ACT Plan, and the ACT. First, the probabilities
at each ACT Explore and ACT Plan test score
point associated with meeting the appropriate
Benchmark for the ACT were estimated using
logistic regression. Then, the ACT Explore
scores in English, mathematics, reading, and
science that corresponded most closely to a
50% probability of success at meeting each of
the four Benchmarks established for the ACT
were selected. The eighth-grade Benchmarks
for ACT Explore, as updated in 2013, are a score
of 13 for English, 17 for mathematics, 16 for
reading, and 18 for science.12
Table 5. Percent of Students with School-Reported Special Status Codes11
Status CodeCCREC
(N = 41,588)
Non-GEAR UP low income
(N = 888,053)
Special Education 7 11
Limited English Proficiency 3 3
Free/Reduced Price Lunch 31 31
Title I Math 21 8
Title I Reading 21 8
Table 6. Adjusted Mean ACT Explore Scores
Subject testCCREC
(N = 41,588)
Non-GEAR UP low income
(N = 888,053)
English 13.4 13.4
Mathematics 14.5 14.6
Reading 13.7 13.7
Science 15.8 15.8
Composite 14.5 14.5
Note: Mean ACT Explore scores were adjusted by test date using ordinary least squares regression to account for academic growth over the span of the academic year.

10
Core Research Program Report Student Baseline Data
The same percentages of CCREC and
non-GEAR UP low-income students met or
exceeded the ACT Explore Benchmarks in
all subject areas but English (see figure 2). A
slightly larger percentage of comparison group
students (54%) than CCREC students (52%)
met or exceeded the ACT Explore Benchmark in
English.
About two out of three CCREC students and
students from non-GEAR UP low-income
schools met or exceeded one or fewer ACT
Explore Benchmarks, whereas about one out of
four students in either group met or exceeded
the benchmark in three or more subject areas
(see figure 3). A slightly larger percentage of
CCREC students (43%) than non-GEAR UP
low-income students (41%) did not meet any of
the ACT Explore Benchmarks.
Self-Reported GradesStudents may self-report their academic
performance in each subject area over the
previous and current academic year at the time
they take ACT Explore. Table 7 provides the
percentage of students in the CCREC and the
non-GEAR UP low-income groups who self-
reported earning mostly As or Bs in each of
the core subject areas. As seen in the table, a
slightly larger percentage of CCREC students
than non-GEAR UP low-income students
reported earning mostly As or Bs in the areas
of mathematics and natural sciences. However,
less than half of all CCREC students (47%)
and non-GEAR UP low-income students (45%)
reported earning As or Bs in all four core subject
areas.
Figure 2. Percent of Students Meeting or Exceeding ACT Explore Subject Area Benchmarks
52 54
25 25 26 26 25 25
0
20
40
60
80
100
CCREC (N = 41,588)
Non-GEAR UP low income (N = 888,053)
English Mathematics Reading Science
Figure 3. Percent of Students Meeting or Exceeding Number of ACT Explore Benchmarks
43 41
22 23
13 13 10 10 12 13
0
20
40
60
80
100
CCREC (N = 41,588)
Non-GEAR UP low income (N = 888,053)
0 1 2 3 4

11
Table 7. Percent of Students Who Reported Earning As or Bs by Subject Area
Subject areaCCREC
(N = 38,943)
Non-GEAR UP low income
(N = 817,841)
English 75 75
Mathematics 69 68
Social studies 73 73
Natural sciences 72 71
All four 47 45
Figure 4. Percent Taking Accelerated/Honors Coursework and Planning to Pursue a College Preparatory Curriculum
32
62
33
62
0
20
40
60
80
100
Accelerated or honors courseworka College preparatory curriculumb
CCREC Non-GEAR UP low income
a CCREC N = 39,711; Non-GEAR UP low income N = 833,298.
b CCREC N = 39,702; non-GEAR UP low income N = 832,904.
Educational PlansAccelerated/Honors Course TakingStudents may indicate at the time they complete
ACT Explore whether or not they have taken
accelerated or honors courses. About one
out of three CCREC students (32%) or non-
GEAR UP low-income students (33%) reported
participating in one or more accelerated or
honors courses (see figure 4).
College-Preparatory CourseworkRoughly six out of ten ACT Explore-tested
CCREC students (62%) indicated at the time
they took the assessment that they planned
to pursue a college-preparatory program of
courses during high school (see figure 4). The
same percentage (62%) of non-CCREC low-
income students was planning to pursue such
coursework.

12
Core Research Program Report Student Baseline Data
Figure 5. Percent of Students Planning to Pursue a College Preparatory Curriculum by Gender
68
56
67
57
0
20
40
60
80
100
Femalea Maleb
CCREC Non-GEAR UP low income
Figure 6. Percent of Students Planning to Pursue a College Preparatory Curriculum by Race/Ethnicity
59 64
58 65
0
20
40
60
80
100
Underserved minoritya Whiteb
CCREC Non-GEAR UP low income
Figure 7. Percent of Students Planning to Pursue a College Preparatory Curriculum by Parent/Guardian Education Level
57 64
72
57 66
73
0
20
40
60
80
100
No collegea Some collegeb Bachelor’s or morec
CCREC Non-GEAR UP low income
a CCREC N = 19,089; non-GEAR UP low income N = 402,224.
b CCREC N = 19,305; non-GEAR UP low income N = 411,754.
a CCREC N = 11,983; non-GEAR UP low income N = 240,179.
b CCREC N = 9,847; non-GEAR UP low income N = 205,461.
c CCREC N = 8,433; non-GEAR UP low income N = 186,436.
a CCREC N = 13,280; non-GEAR UP low income N = 337,621. Includes students who self-identify as African American, American Indian, Hispanic, or Pacific Islander.
b CCREC N = 19,665; non-GEAR UP low income N = 372,436.

13
The percentage of students planning to pursue
a college-preparatory program of courses during
high school differed more by gender than by
student group (see figure 5). Regardless of
group, nearly seven out of ten female students
planned to pursue a college-preparatory
program, while fewer male students (by 10 to
12 percentage points) planned to do so.
White students were more likely to plan
to pursue a college-preparatory program
of courses during high school than were
underserved minority students (i.e., African
American, American Indian, Hispanic, or Pacific
Islander students), regardless of student group
(see figure 6). Underserved minority CCREC
students were slightly more likely to plan to
take a college-preparatory program than their
underserved minority non-GEAR UP low-income
peers, while White non-GEAR UP low-income
students were slightly more likely to do so than
White CCREC students.
The percentage of students planning to pursue
a college-preparatory program of courses during
high school differed more by parent/guardian
level of education than by student group (see
figure 7). Larger percentages of students
whose parents or guardians had higher levels of
education planned to take a college-preparatory
program than did their peers. Differences
between CCREC and non-GEAR UP low-
income students based on parent/guardian
level of education were small (1 to 2 percentage
points).
ACT-Recommended Core CurriculumThe core curriculum ACT recommends consists
of four years of English and three years each of
mathematics, science, and social studies. The
benefits to students of taking a suitable number
of core preparatory courses in high school have
been documented by ACT research.13
As compared to non-GEAR UP low-income
students, comparable percentages of CCREC
students planned to take the ACT-recommended
years of coursework in the areas of mathematics
and English; a smaller percentage of CCREC
students planned to take the ACT-recommended
years of coursework in social studies and the
natural sciences (see table 8). Only about
Table 8. Percent of Students Planning to Take the ACT-Recommended Years of Coursework in Specific Subjects
Subject area (years)CCREC
(N = 39,124)
Non-GEAR UP low income
(N = 822,623)
English (4) 44 42
Mathematics (3+) 55 55
Social studies (3+) 41 43
Natural sciences (3+) 48 49
ACT-recommended core 28 30
Femalea 29 31
Maleb 27 29
Underserved minorityc 25 24
Whited 31 35
Parent/guardian education
No collegee 27 27
Some collegef 28 30
Bachelor’s degree or moreg 32 35
a CCREC N = 18,846; non-GEAR UP low income N = 398,251.
b CCREC N = 18,991; non-GEAR UP low income N = 405,692.
c CCREC N = 13,068; non-GEAR UP low income N = 332,681. Includes students who self-identify as African American, American Indian, Hispanic, or Pacific Islander.
d CCREC N = 19,406; non-GEAR UP low income N = 368,452.
e CCREC N = 11,843; non-GEAR UP low income N = 237,109.
f CCREC N = 9,715; non-GEAR UP low income N = 203,021.
g CCREC N = 8,311; non-GEAR UP low income N = 184,520.
14
Core Research Program Report Student Baseline Data
one out of four CCREC eighth graders (28%)
planned to complete the ACT-recommended
core curriculum. This percentage is slightly lower
than that of non-GEAR UP low-income students.
Differences by gender, race/ethnicity,
and parent/guardian education level in
the percentage of students who planned
to complete the ACT-recommended core
curriculum are evident in both the CCREC and
non-GEAR UP low-income student groups.
In both groups, females, White students, and
students whose parents or guardians were more
highly educated were more likely than males,
underserved minority students, and students
whose parents or guardians were less educated
to plan to complete the ACT-recommended
core curriculum. The percentages were lower
for CCREC students than for the comparison
group students for all but two subgroups. In
particular, underserved minority students in
the CCREC were slightly more likely than their
peers in the non-GEAR UP low-income group
to plan to complete the ACT-recommended core
curriculum, whereas CCREC students whose
parents or guardians did not attend college
were as likely to plan to complete the ACT-
recommended core curriculum as their peers in
the non-GEAR UP low-income group.
Post-High School PlansAt the time they took ACT Explore, roughly one
out of eight CCREC and non-CCREC low-
income students had no education or other
training planned for after high school or were
undecided about their future educational plans
(see figure 8). Among students in both groups,
two out of three students planned to obtain
a bachelor’s or graduate degree, whereas
about one out of five planned to obtain some
education or training below the bachelor’s
degree. A slightly larger percentage of CCREC
students than non-GEAR UP low-income
students planned to pursue career or technical
training after high school, whereas a slightly
larger percentage of non-GEAR UP low-income
students than CCREC students planned to
pursue their postsecondary education through a
graduate degree program.
Self-Reported NeedsACT Explore includes a section in which
students can indicate areas where they feel
they need additional help. Table 9 shows the
percentage of students in each of the two
groups who indicated they needed assistance
with various educational plans and academic
skills. As seen in the table, students’ self-
reported needs do not vary to a great extent by
student group. Despite the student group and
the specific need in question, the majority of
students responding to the needs assessment
felt they did not need help. As mentioned in
previous sections of this report, under half of
all students in either student group reported
earning As and Bs in all four core subject areas,
and roughly 1 out of 4 of these students did
not meet any of the ACT Explore Benchmarks.
Taken together, these findings suggest that
a number of students who are struggling
academically do not feel they need assistance to
improve upon their academic skills.
DiscussionThis report compares the background
characteristics, academic achievement and
being on track for college readiness, educational
plans, and academic skill needs of CCREC
and non-GEAR UP low-income eighth graders
who took ACT Explore during the 2012–13 or
2013–14 academic years.
The CCREC GEAR UP group and the non-
GEAR UP low-income group are reasonably
similar on these measures. These baseline
data comparisons give confidence that the
non-GEAR UP low-income group is a suitable
comparison group for informing the selection
of a matched non-GEAR UP comparison group
for use in subsequent ACT-authored CCREC
reports.

15
Figure 8. Percent of Students by Educational Plans after High School
2 2
11 11 15 14
6 5
30 30 35 37
0
20
40
60
80
100
CCREC (N = 37,052)
Non-GEAR UP low income (N = 777,850)
No plans Undecided Career/Technical training Less than bachelor’s Bachelor’s degree Graduate studies
Table 9. Percent of Students Indicating They Need Assistance
NeedCCREC
(N = 40,706)
Non-GEAR UP low income
(N = 869,504)
Exploring options after high school 36 35
Improving writing skills 31 30
Improving reading speed or comprehension 25 26
Improving study skills 35 37
Improving mathematical skills 38 39
Improving computer skills 19 18
Improving public speaking skills 38 35

16
Core Research Program Report Student Baseline Data
Highlights of the baseline observations include:
Background Characteristics• The two groups were similar on most
background characteristics, with three
exceptions:
~ self-identification as African American
(13 percentage-point difference in favor
of the comparison group)
~ receiving Title I math or reading services
(13 percentage-point difference in favor
of the CCREC group for both subjects)
~ geographic dispersion (much more
dispersion in the comparison group)
• A substantial share of students in each
group—about 40%—have parents or
guardians with no college experience.
Academic Achievement and Being On Track for College Readiness• In both groups, most students are not on
track to be academically ready for college by
the time they graduate from high school. Only
about 25% in each group met or exceeded
the ACT Explore Benchmarks in reading,
mathematics, or science; just over 50% did
so in English.
• Over 40% in each group met none of the
Benchmarks and only about 35% met more
than one.
Educational Plans• The majority of students in each group—
about two-thirds—plan to obtain a bachelor’s
or graduate degree.
• Nearly two-thirds of students in each group
plan to pursue a college-preparatory program
of courses in high school.
Academic Skill Needs• About two-thirds of students in each group
felt that they did not need academic help,
suggesting that many students who are
struggling academically do not feel they need
assistance to improve upon their academic
skills.
Taken together, these findings paint a profile
of low-income or otherwise underserved
middle school students who have college
aspirations (with many planning to pursue at
least a four-year degree), who are not yet on
the path to be academically prepared to be
successful in college but do not feel that they
need academic assistance. Within both of these
groups, students seemingly are on a path where
their aspirations do not match their level of
preparation. As we continue our study, we will
seek to determine whether in these fourteen
states GEAR UP can modify that path so
students have the preparation and planning they
need to enter and be successful in college.
Future ACT Reports on the CCREC Core Research ProgramThis report of baseline data is the second ACT-
authored report on the core research program
for the CCREC. A previous publication, Core
Research Program: Results from the First Wave
of the Base Year Data Collection,14 reported
baseline data for the 2012–13 CCREC cohort of
eighth graders and three potential comparison
groups, all of which tested with ACT Explore
within the same testing year.
Beginning in 2017, future ACT CCREC
publications will report on the first follow-up
for the core research program and will identify
how well CCREC students and a matched
comparison group of students are doing as they
progress through the tenth grade. Future reports
will include:
• comprehensive research analysis presenting
comparative findings between the two
groups on intermediate academic outcomes,
including data on academic achievement and
being on track for college readiness
• summary report encapsulating key findings
from the comprehensive research report
• several one-page briefs highlighting salient
and illuminating analyses of findings from the
comprehensive research report
17
AppendixTable A1. CCREC Member States
State FY funding Model
Data collection wave
1 2
Arizona 2012 Cohort ✓
Idaho 2011 Cohort ✓ ✓
Kentucky 2011 Cohort ✓ ✓
Minnesota 2011 Hybrid ✓ ✓
Montana 2011 Hybrid ✓ ✓
Nevada 2012 Cohort ✓
New Mexico 2012 Priority ✓
North Carolina 2012 Hybrid ✓
Oklahoma 2011 Priority ✓ ✓
Tennessee 2012 Hybrid ✓
Utah 2011 Priority ✓ ✓
Washington 2011 Hybrid ✓
Wisconsin 2011 Priority ✓
Wyoming 2011 Priority ✓*
* Although Wyoming received its grant during the 2011 award cycle, the state will not test students with ACT Explore until their ninth-grade year (i.e., 2013–14).
18
Core Research Program Report Student Baseline Data
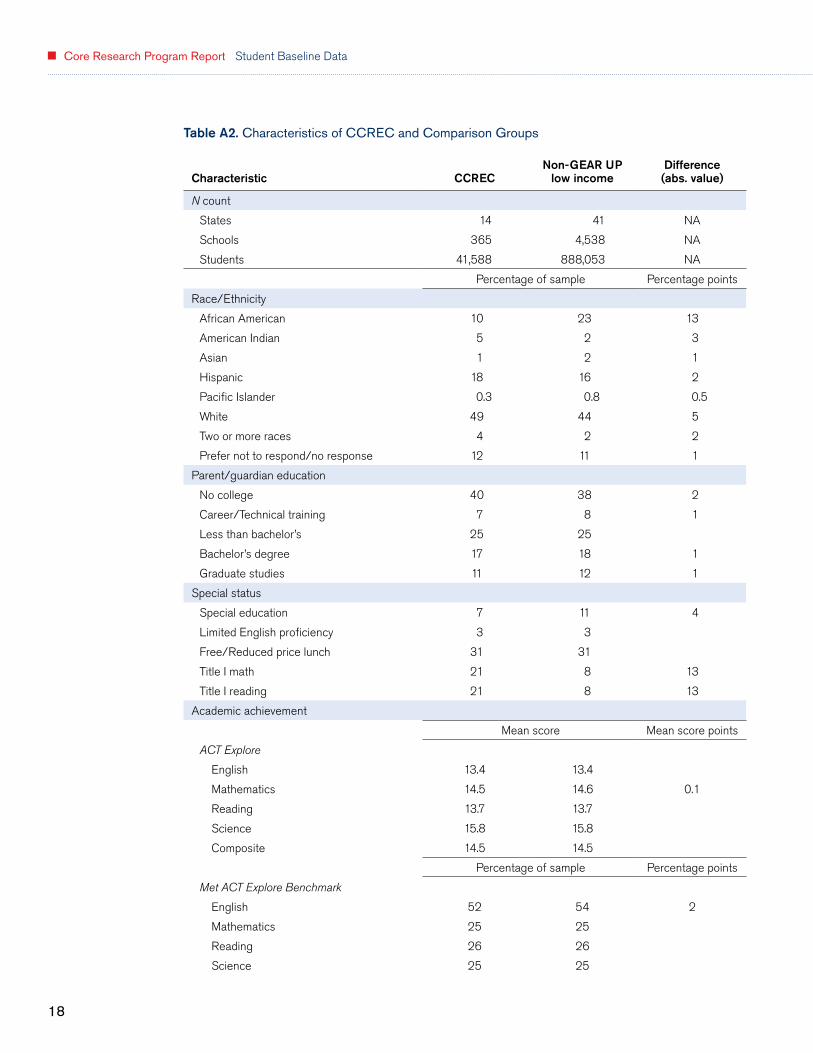
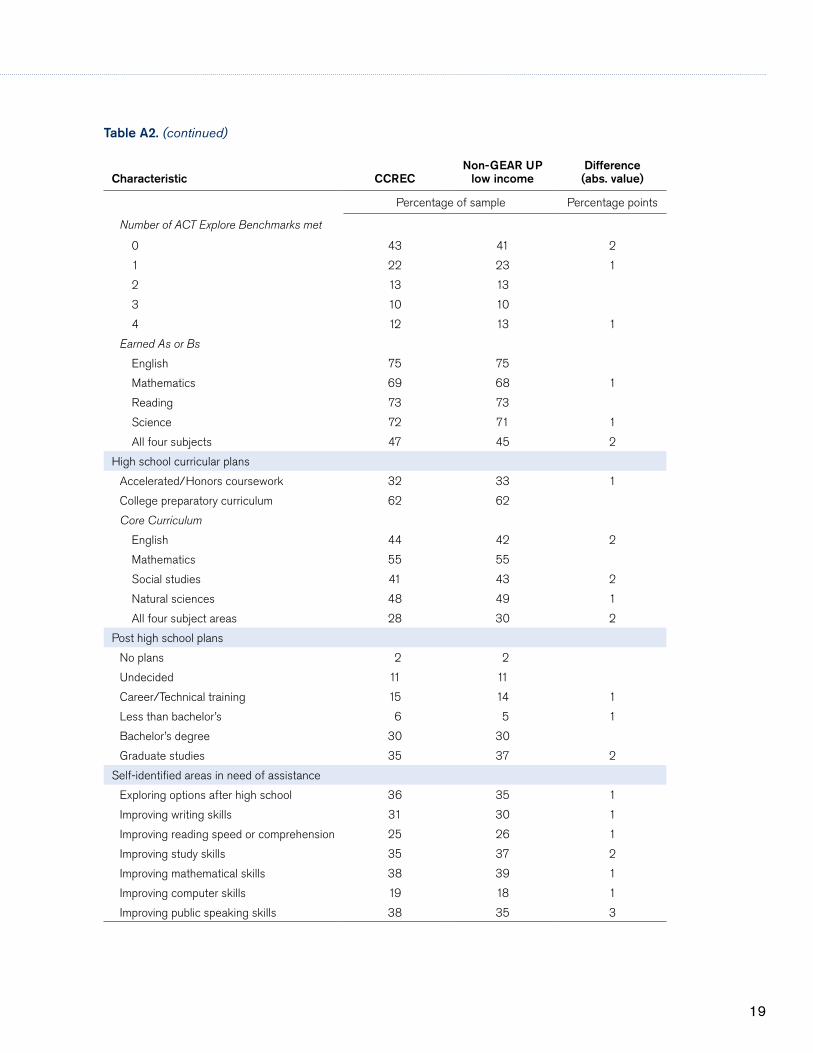
Table A2. Characteristics of CCREC and Comparison Groups
Characteristic CCRECNon-GEAR UP
low incomeDifference (abs. value)
N count
States 14 41 NA
Schools 365 4,538 NA
Students 41,588 888,053 NA
Percentage of sample Percentage points
Race/Ethnicity
African American 10 23 13
American Indian 5 2 3
Asian 1 2 1
Hispanic 18 16 2
Pacific Islander 0.3 0.8 0.5
White 49 44 5
Two or more races 4 2 2
Prefer not to respond/no response 12 11 1
Parent/guardian education
No college 40 38 2
Career/Technical training 7 8 1
Less than bachelor’s 25 25
Bachelor’s degree 17 18 1
Graduate studies 11 12 1
Special status
Special education 7 11 4
Limited English proficiency 3 3
Free/Reduced price lunch 31 31
Title I math 21 8 13
Title I reading 21 8 13
Academic achievement
Mean score Mean score points
ACT Explore
English 13.4 13.4
Mathematics 14.5 14.6 0.1
Reading 13.7 13.7
Science 15.8 15.8
Composite 14.5 14.5
Percentage of sample Percentage points
Met ACT Explore Benchmark
English 52 54 2
Mathematics 25 25
Reading 26 26
Science 25 25
19
Characteristic CCRECNon-GEAR UP
low incomeDifference (abs. value)
Percentage of sample Percentage points
Number of ACT Explore Benchmarks met
0 43 41 2
1 22 23 1
2 13 13
3 10 10
4 12 13 1
Earned As or Bs
English 75 75
Mathematics 69 68 1
Reading 73 73
Science 72 71 1
All four subjects 47 45 2
High school curricular plans
Accelerated/Honors coursework 32 33 1
College preparatory curriculum 62 62
Core Curriculum
English 44 42 2
Mathematics 55 55
Social studies 41 43 2
Natural sciences 48 49 1
All four subject areas 28 30 2
Post high school plans
No plans 2 2
Undecided 11 11
Career/Technical training 15 14 1
Less than bachelor’s 6 5 1
Bachelor’s degree 30 30
Graduate studies 35 37 2
Self-identified areas in need of assistance
Exploring options after high school 36 35 1
Improving writing skills 31 30 1
Improving reading speed or comprehension 25 26 1
Improving study skills 35 37 2
Improving mathematical skills 38 39 1
Improving computer skills 19 18 1
Improving public speaking skills 38 35 3
Table A2. (continued)

20
Core Research Program Report Student Baseline Data
Notes1 “Gaining Early Awareness and Readiness
for Undergraduate Programs (GEAR UP),”
US Department of Education, last modified
September 29, 2014, http://www2.ed.gov/
programs/gearup/index.html.
2 More information about GEAR UP can be
found on the US Department of Education’s
Frequently Asked Questions page on GEAR
UP, http://www2.ed.gov/programs/gearup/
faq.html.
3 The fourteen states are Arizona, Idaho,
Kentucky, Minnesota, Montana, Nevada,
New Mexico, North Carolina, Oklahoma,
Tennessee, Utah, Washington, Wisconsin,
and Wyoming. More information about the
College and Career Readiness Evaluation
Consortium can be found at the website
of the National Council for Community
and Education Partnership, http://www.
edpartnerships.org/college-and-career-
readiness-evaluation-consortium-ccrec.
4 Ty Cruce, ACT-CCREC Core Research
Program: Study Questions and Design, ACT
Working Papers Series WP-2015-01 (Iowa
City, IA: ACT, 2015), http://www.act.org/
research/papers/pdf/WP-2015-01.pdf.
5 CCREC grants were funded in two different
funding years. The core research program
follows, longitudinally, two waves of students.
This report presents findings on those
students from both waves of data collection
(i.e., 2012–13 and 2013–14) of the base
year when students were in the eighth
grade.
6 More information about the data collection
instruments used for the core research
program can be found in the technical
manual of each associated assessment:
ACT, ACT Explore Technical Manual (Iowa
City, IA: ACT, 2013), http://www.act.org/
explore/pdf/TechManual.pdf; ACT, ACT
Plan Technical Manual (Iowa City, IA:
ACT, 2013), http://www.act.org/plan/
pdf/PlanTechnicalManual.pdf; ACT, The
ACT Technical Manual (Iowa City, IA: ACT,
2014), http://www.act.org/aap/pdf/ACT_
Technical_Manual.pdf.
7 Although data collection for the ACT core
research program ends after the second
year of college, a separate consortium-
led evaluation will follow students through
college completion.
8 Although Wyoming received its grant during
the 2011 award cycle, the state did not test
students with ACT Explore until their ninth-
grade year (i.e., 2013–14). A few CCREC
schools in New Mexico and Minnesota
also tested students as ninth graders. Test
scores and benchmarks for these students
have been adjusted to take grade-level
differences into consideration.
9 GEAR UP grants generally fall into one of
two models: cohort model or priority student
model. In a cohort model, all students within
a participating grade are eligible to receive
GEAR UP services. In a priority model,
GEAR UP services are provided to priority
students who meet certain legislatively
mandated eligibility criteria. Some grants
operate under a third model whereby the
grant employs a cohort approach and priority
approach simultaneously (e.g., serves all
students in a cohort and priority students
outside of the cohort). More information
about GEAR UP program models is located
on the US Department of Education’s
Frequently Asked Questions page on GEAR
UP, http://www2.ed.gov/programs/gearup/
faq.html.
10 Thirty-six percent of CCREC schools and
43% of non-GEAR UP low-income schools
have no reported information in the special
status code section of the ACT Explore
answer folder.
21
11 GEAR UP grants using a cohort model must
provide services to a cohort at a participating
school in which at least 50% of all students
are eligible for the federal free or reduced-
price lunch program. Reasons for the lower
reported percentages of students eligible
for the free or reduced-price lunch program
could include underreporting of eligibility
by staff, the distribution of lunch-eligible
students among grades within the schools
served by GEAR UP, or a combination of
these and other reasons.
12 For ninth grade, the ACT Explore
Benchmarks are a score of 14 for English,
18 for mathematics, 17 for reading, and 19
for science.
13 See, for example, ACT, The Condition
of College and Career Readiness 2014
(Iowa City, IA: ACT, 2014), http://www.act.
org/research/policymakers/cccr14/pdf/
CCCR14-NationalReadinessRpt.pdf; ACT,
Mind the Gaps: How College Readiness
Narrows Achievement Gaps in College
Success (Iowa City, IA: ACT, 2010), http://
www.act.org/research/policymakers/
reports/mindthegaps.html; Krista Mattern
and Justine Radunzel, Who Goes to
Graduate School?: Tracking 2003 ACT-
Tested High School Graduates for More Than
a Decade (Iowa City, IA: ACT, 2015), http://
www.act.org/research/researchers/reports/
pdf/ACT_RR2015-2.pdf.
14 ACT, Core Research Program: Results
from the First Wave of the Base Year Data
Collection (Iowa City, IA: ACT, 2014), http://
www.act.org/research/policymakers/pdf/
CoreResearchReport.pdf.


ACT is an independent, nonprofit organization that provides assessment, research, information, and program management services in the broad areas of education and workforce development. Each year, we serve millions of people in high schools, colleges, professional associations, businesses, and government agencies, nationally and internationally. Though designed to meet a wide array of needs, all ACT programs and services have one guiding purpose—helping people achieve education and workplace success.
*051202150* Rev 1
Helping people achieve education and workplace success