Embed Size (px)
Citation preview

UNITEDSTATESSECURITIESANDEXCHANGECOMMISSION
Washington, D.C. 20549
FORM 10-KÈ ANNUALREPORTPURSUANTTOSECTION13OR 15(d)OFTHE SECURITIES EXCHANGEACTOF 1934
For the Fiscal Year EndedDecember 31, 2007or
‘ TRANSITIONREPORTPURSUANTTOSECTION13OR 15(d)OFTHE SECURITIES EXCHANGEACTOF 1934For the transition period from to
Commission File No. 0-516
SONOCOPRODUCTSCOMPANYIncorporated under the laws
of SouthCarolinaI.R.S. Employer Identification
No. 57-02484201N. Second St.
Hartsville, SC 29550Telephone: 843/383-7000
Securities registered pursuant to Section 12(b) of the Act:Title of each class Name of exchange onwhich registered
No par value common stock NewYork Stock Exchange, Inc.Securities registered pursuant to Section 12(g) of the Act: None
Indicate by checkmark if the registrant is a well-known seasoned issuer, as defined in Rule 405 of the Securities Act. Yes È No ‘Indicate by checkmark if the registrant is not required to file reports pursuant to Section 13 or Section 15(d) of the Act. Yes ‘ No ÈIndicate by checkmark whether the registrant (1) has filed all reports required to be filed by Section 13 or 15 (d) of the Securities ExchangeAct of 1934 during the preceding 12months
(or for such shorter period that the registrant was required to file such reports), and (2) has been subject to such filing requirements for the past 90 days. Yes È No ‘Indicate by checkmark if disclosure of delinquent filers pursuant to Item 405 of Regulation S-K is not contained herein, and will not be contained, to the best of registrant’s knowledge, in
definitive proxy or information statements incorporated by reference in Part III of this Form 10-K or any amendment to this Form 10-K. ÈIndicate by checkmark whether the registrant is a large accelerated filer, an accelerated filer, a non-accelerated filer, or a smaller reporting company. See the definitions of “large accelerated
filer,” “accelerated filer” and “smaller reporting company” in Rule 12b-2 of the ExchangeAct. (Check one):Large accelerated filer È Accelerated filer ‘ Non-accelerated filer ‘ Smaller reporting company ‘Indicate by checkmark whether the registrant is a shell company (as defined in Rule 12b-2 of the ExchangeAct). Yes ‘ No ÈThe aggregatemarket value of voting common stock held by nonaffiliates of the registrant (based on theNewYork StockExchange closing price) on June 29, 2007, whichwas the last business
day of the registrant’smost recently completed second fiscal quarter, was $4,165,014,225. Registrant does not (and did not at June 29, 2007) have anynon-voting common stock outstanding.As of February 22, 2008, there were 99,486,369 shares of no par value common stock outstanding.Documents Incorporated by ReferencePortions of the Proxy Statement for the annual meeting of shareholders to be held onApril 16, 2008, which statement shall be filed with the Securities and ExchangeCommission within
120 days after the end of the fiscal year to which this Report relates, are incorporated by reference in Part III.

table of contents
Page
part iItem 1. Business 4Item 1A. Risk Factors 8Item 1B. Unresolved Staff Comments 9Item 2. Properties 9Item 3. Legal Proceedings 9Item 4. Submission ofMatters to a Vote of SecurityHolders 11
part iiItem 5. Market for Registrant’s Common Equity, Related StockholderMatters and Issuer Purchases of Equity Securities 12Item 6. Selected Financial Data 13Item 7. Management’s Discussion andAnalysis of Financial Condition and Results ofOperations 14Item 7A. Quantitative andQualitative Disclosures aboutMarket Risk 25Item 8. Financial Statements and SupplementaryData 25Item 9. Changes in andDisagreements with Accountants onAccounting and Financial Disclosure 26Item 9A. Controls and Procedures 26Item 9B. Other Information 26
part iiiItem 10. Directors and ExecutiveOfficers of the Registrant 27Item 11. Executive Compensation 27Item 12. SecurityOwnership of Certain Beneficial Owners andManagement and Related StockholderMatters 27Item 13. Certain Relationships and Related Transactions, andDirector Independence 28Item 14. Principal Accountant Fees and Services 28
part ivItem 15. Exhibits and Financial Statement Schedules 29
2

sonoco products company and consolidated subsidiaries
Forward-looking StatementsStatements included in this Annual Report on Form 10-K that are not historical in
nature, are intended to be, and are hereby identified as “forward-looking statements” forpurposes of the safe harbor provided by Section 21E of the Securities ExchangeAct of 1934,as amended. The words “estimate,” “project,” “intend,” “expect,” “believe,” “consider,” “plan,”“anticipate,” “objective,” “goal,” “guidance,” “outlook” and similar expressions identify forward-looking statements. Forward-looking statements include, but are not limited to statementsregarding offsetting high rawmaterial costs; improved productivity and cost containment;adequacy of income tax provisions; refinancing of debt; adequacy of cash flows; anticipatedamounts and uses of cash flows; effects of acquisitions and dispositions; adequacy of provi-sions for environmental liabilities; financial strategies and the results expected from them;continued payments of dividends; stock repurchases; and producing improvements in earn-ings. Such forward-looking statements are based on current expectations, estimates and pro-jections about our industry, management’s beliefs and certain assumptionsmade bymanagement. Such information includes, without limitation, discussions as to guidance andother estimates, expectations, beliefs, plans, strategies and objectives concerning our futurefinancial and operating performance. These statements are not guarantees of futureperformance and are subject to certain risks, uncertainties and assumptions that are difficultto predict. Therefore, actual results may differ materially from those expressed or forecastedin such forward-looking statements. The risks and uncertainties include, without limitation:
‰ availability and pricing of rawmaterials;
‰ success of new product development and introduction;
‰ ability tomaintain or increase productivity levels and contain or reduce costs;
‰ international, national and local economic andmarket conditions;
‰ fluctuations in obligations and earnings of pension and postretirement benefit plans;
‰ ability tomaintain market share;
‰ pricing pressures and demand for products;
‰ continued strength of our paperboard-based tubes and cores and composite can oper-ations;
‰ anticipated results of restructuring activities;
‰ resolution of income tax contingencies;
‰ ability to successfully integrate newly acquired businesses into the Company’s operations;
‰ currency stability and the rate of growth in foreignmarkets;
‰ use of financial instruments to hedge foreign currency, interest rate and commodity pricerisk;
‰ actions of government agencies and changes in laws and regulations affecting the Com-pany;
‰ liability for and anticipated costs of environmental remediation actions;
‰ loss of consumer confidence; and
‰ economic disruptions resulting from terrorist activities.TheCompany undertakes no obligation to publicly update or revise forward-looking
statements, whether as a result of new information, future events or otherwise. In light ofthese risks, uncertainties and assumptions, the forward-looking events discussed in thisAnnual Report on Form 10-Kmight not occur.
References to our Web Site AddressReferences to ourWeb site address and domain names throughout this Annual Report
on Form 10-K are for informational purposes only, or to fulfill specific disclosure require-ments of the Securities and ExchangeCommission’s rules or theNewYork Stock ExchangeListing Standards. These references are not intended to, and do not, incorporate the contentsof ourWeb sites by reference into this Annual Report on Form 10-K.
sonoco 2007 annual report 3

part i
Item 1. Business(a) General development of business –
TheCompany is a SouthCarolina corporation founded inHartsville, SouthCarolina, in1899 as the SouthernNovelty Company. The name was subsequently changed to SonocoProducts Company (the “Company” or “Sonoco”). Sonoco is a manufacturer of industrialand consumer packaging products and a provider of packaging services, with 334 locations in35 countries.
Information about the Company’s acquisitions, dispositions, joint ventures and restructur-ing activities is provided inNotes 2 and 3 to the Consolidated Financial Statements includedin Item 8 of this Annual Report on Form 10-K.
(b) Financial information about segments –Information about the Company’s reportable segments is provided inNote 15 to the
Consolidated Financial Statements included in Item 8 of this Annual Report on Form 10-K.
(c) Narrative description of business –Products and Services –The following discussion outlines the principal products
produced and services provided by the Company.
consumer packagingTheConsumer Packaging segment accounted for approximately 36%, 36% and 35% of
the Company’s net sales in 2007, 2006 and 2005, respectively. The operations in this segmentconsist of 63 plants throughout the world. The products, services andmarkets of the Con-sumer Packaging segment are as follows:
Products and Services Markets
Rigid Packaging – Paper Round and shapedcomposite paperboardcans, paperboard pails,single-wrap paperboardpackages, fiber cartridges
Food: Snacks, nuts, cookies andcrackers, confectionery, frozenconcentrates, powderedbeverages and infant formulas,coffee, refrigerated dough,spices/seasonings, nutritionalsupplements, pet foodsNonfood: Adhesives, caulks,cleansers, chemicals, lawn andgarden, automotive, petproducts
Rigid Packaging – Plastic Bottles, jars, tubs, cups,trays, squeeze tubes,monolayer andmultilayer containers,specialty injectionmolded components,caps
Food: Liquid beverages(noncarbonated), includingfunctional beverages and ready-to-drink coffee, processedfoods, sauces and pet foods,powdered beverages includingcoffee, snacks and nutsNonfood:Householdchemicals, industrial chemicals,adhesives and sealants, healthand beauty, automotive,pharmaceuticals
Ends andClosures Aluminum, steel andpeelablemembrane easy-open closures forcomposite, metal andplastic containers
Processed foods inmetal andplastic containers, coffee,beverages, powdered beveragesand infant formulas, snacks, nuts,nutritional supplements, spices/seasonings, pet foods and treats,nonfood products
4

Products and Services Markets
Printed FlexiblePackaging
Flexible packagingmadefrom thin-gauge, highvalue-added rotogravure,flexographic andcombination printed filmincluding high-performance laminationsand rotogravure cylinderengraving
Confectionery and gum, hard-baked goods, coffee, processedfoods, beverages, snacks , petfood, home and personal care
Sonoco’s rigid packaging – paper products are the Company’s second largest revenue-producing group of products and services, representing approximately 15%, 16% and 19% ofconsolidated net sales in 2007, 2006 and 2005, respectively.
tubes and cores/paperThe Tubes andCores/Paper segment accounted for approximately 42% of the Compa-
ny’s net sales in 2007, 2006 and 2005. This segment serves its markets through 122 plants onfive continents. Sonoco’s paper operations provide the primary rawmaterial for the Compa-ny’s fiber-based packaging. Sonoco uses approximately 65% of the paper it manufactures andthe remainder is sold to third parties. This vertical integration strategy is supported by 24papermills with 35 papermachines and 49 recycling facilities throughout the world. In 2007,Sonoco had the capacity tomanufacture approximately 1.9million tons of recycled paper-board. The products, services andmarkets of the Tubes andCores/Paper segment are asfollows:
Products and Services Markets
Tubes andCores Paperboard tubes, cores,roll packaging, moldedplugs, pallet components,concrete forms, voidforms, rotary die boards
Construction, film, flowableproducts, metal, papermill,shipping and storage, tape andlabel, textiles, converters
Paper Recycled paperboard,chipboard, tubeboard,lightweight corestock,boxboard, linerboard,specialty grades,recovered paper, otherrecycledmaterials
Converted paper products,spiral winders, beverageinsulators, displays, gaming,papermanufacturing
Sonoco’s tubes and cores products and services are the Company’s largest revenue-producing group of products and services, representing approximately 31%, 31% and 32% ofconsolidated net sales in 2007, 2006 and 2005, respectively.
packaging servicesThe Packaging Services segment accounted for approximately 13%, 12% and 13% of the
Company’s consolidated net sales in 2007, 2006 and 2005, respectively. The products, serv-ices andmarkets of the Packaging Services segment are as follows:
Products and Services Markets
ServiceCenters Packaging supply chainmanagement, includingcustom packing,fulfillment, primarypackage filling, scalableservice centers, globalbrand artworkmanagement
Personal care, baby care, beauty,healthcare, food, electronics,hosiery, pharmaceuticals, officesupplies, toys
Point-of-Purchase(P-O-P)
Designing,manufacturing,assembling, packing anddistributing temporary,semipermanent andpermanent P-O-Pdisplays, as well ascontract packaging, co-packing and fulfillmentservices
Consumer packaged goods,including automotive,beverages, confectionery,electronics, cosmetics, foods,fragrances, healthcare, homeand garden, liquor, medical,office supply, over-the-counterdrugs, personal care, sportinggoods, tobacco
all other sonocoAllOther Sonoco accounted for approximately 9%, 10% and 10% of the Company’s net
sales in 2007, 2006 and 2005, respectively. In addition to the products and services outlined ineach of the segments above, the Company produces the following products:
Products and Services Markets
Wire andCable Reels Steel, nailed wooden,plywood, recycled andpoly-fiber reels
Wire and cablemanufacturers
Molded andExtrudedPlastics
Complete offering ofproduct design, tooldesign and fabrication;manufacturing in bothinjectionmolding andextrusion technologies
Consumer and industrialpackaging, food service, textiles,wire and cable, fiber optics,plumbing, filtration, automotive,medical, healthcare
Paperboard Specialties Custom-printedStancap® glass covers,Rixie™ coasters, otherpaper amenities
Hotels and resorts, restaurants,casinos, country clubs, cateringservices, cruise lines, airlines,healthcare facilities, advertising
sonoco 2007 annual report 5

Products and Services Markets
Protective Packaging Proprietary Sonopost®technology, Sonobase®carrier system and,through a partnershipwith SonocoCorrFlex,the Sonopop® displaysystem; concept, design,testing andmanufactur-ing ofmultimaterial totalsolutions; tier 1 suppliertomajormanufacturers,on-site engineering,ISTA- and Sears-certified lab testing facili-ties and engineering
Household appliances, heatingand air conditioning, office fur-nishings, automotive, fitnessequipment, lawn and garden,promotional displays, palletizeddistribution
Product Distribution – Each of the Company’s operating units has its own sales staff,andmaintains direct sales relationships with its customers. For those customers that buy frommore than one business unit, the Company often assigns a single representative or team ofspecialists to handle that customer’s needs. Some of the units have service staff at themanu-facturing facility that interacts directly with customers. The Tubes andCores/Paper segmentalso has a customer service center located inHartsville, SouthCarolina, which is themaincontact point between itsNorthAmerican business units and their customers. Divisionalsales personnel also provide sales management, marketing and product development assis-tance as needed. Product distribution is normally directly from themanufacturing plant tothe customer, but in some cases, product is warehoused in amutually advantageous locationto be shipped to the customer as needed.
Raw Materials – The principal rawmaterials used by the Company are recoveredpaper, paperboard, steel, aluminum and plastic resins. Rawmaterials are purchased from anumber of outside sources. TheCompany considers the supply and availability of rawmaterials to be adequate tomeet its needs.
Patents, Trademarks and Related Contracts –Most inventions aremade bymembers of Sonoco’s development and engineering staff, and are important to the Compa-ny’s internal growth. Patents have been granted onmany inventions created by Sonoco staffin theUnited States and other countries. These patents aremanaged globally by a Sonocointellectual capital management team through one of the Company’s subsidiaries, SonocoDevelopment, Inc. (SDI). SDI globallymanages patents, trade secrets, confidentiality agree-ments and license agreements. Some patents have been licensed to othermanufacturers.Sonoco also licenses a few patents from outside companies and universities for business unituse. U.S. patents expire after 17 or 20 years, depending on the patent issue date. New patentsreplacemany of the abandoned or expired patents. A second intellectual capital subsidiary of
Sonoco, SPCResources, Inc., globallymanages Sonoco’s trademarks, servicemarks, copy-rights and Internet domain names.Most of Sonoco’s products aremarketed worldwideunder trademarks such as Sonoco®, Sonotube®, Safe-Top®, Sealed Safe®, Duro® andDurox®. Sonoco’s registeredWeb domain names such as www.sonoco.com andwww.sonotube.com provide information about Sonoco, its people and products. Trade-marks and domain names are also licensed to outside companies where appropriate.
Seasonality –TheCompany’s operations are not seasonal to any significant degree,although theConsumerPackaging andPackaging Services segments normally report slightlyhigher sales and operating profits in the secondhalf of the year, when compared to the first half.
Working Capital Practices –TheCompany is not required to carry any significantamounts of inventory tomeet customer requirements or to assure itself continuous allot-ment of goods, nor does it provide extended terms to customers.
Dependence on Customers –On an aggregate basis, the five largest customers in theTubes andCores/Paper segment accounted for approximately 11% of that segment’s salesand the five largest customers in the Consumer Packaging segment accounted for approx-imately 27% of that segment’s sales. The dependence on a few customers in the PackagingServices segment is more significant as the five largest customers in this segment accountedfor approximately 74% of that segment’s sales.
Sales to Procter&Gamble, the Company’s largest customer, represented approximately12% of the Company’s consolidated revenues in 2007. In addition, this concentration of salesvolume resulted in a corresponding concentration of credit, representing approximately 10%of the Company’s consolidated trade accounts receivable at December 31, 2007.No othercustomer comprisedmore than 5% of the Company’s consolidated revenues in 2007 oraccounts receivable at December 31, 2007.
Backlog –Most customer orders aremanufactured with a lead time of three weeks orless. Therefore, the amount of backlog orders at December 31, 2007, was notmaterial. TheCompany expects all backlog orders at December 31, 2007, to be shipped during 2008.
Competition – TheCompany sells its products in highly competitivemarkets, whichinclude paper, textile, film, food, chemical, pharmaceutical, packaging, construction, and wireand cable. Each of thesemarkets is primarily controlled by supply and demand. Additionally,thesemarkets are influenced by the overall rate of economic activity. Because we operate inhighly competitivemarkets, we regularly bid for new and continuing business. Losses and/orawards of business from our largest customers, customer changes to alternative forms ofpackaging, and the repricing of business, can have a significant effect on our operating results.TheCompanymanufactures and sells many of its products globally. TheCompany, havingoperated internationally since 1923, considers its ability to serve its customers worldwide in atimely and consistent manner a competitive advantage. TheCompany also believes that itstechnological leadership, reputation for quality and vertical integration are competitiveadvantages. Expansion of the Company’s product line and global presence reflect the rapidlychanging needs of its major customers, who demand high-quality, state-of-the-art, environ-
6

mentally compatible packaging, wherever they choose to do business. It is important to be alow-cost producer in order to compete effectively. TheCompany is constantly focused onproductivity improvements and other cost-reduction initiatives utilizing the latest intechnology.
Research and Development –Company-sponsored research and developmentexpenses totaled approximately $15.6million in 2007, $12.7million in 2006 and $14.7millionin 2005. Customer-sponsored research and development expenses were notmaterial in anyof these periods. Significant projects in Sonoco’s Tubes andCores/Paper segment during2007 included efforts to design and develop new products for the construction industry andfor the film and tape industries. In addition, efforts were focused on enhancing performancecharacteristics of the Company’s tubes and cores in the textile, film and paper packagingareas, as well as on projects aimed at enhancing productivity. During 2007, the ConsumerPackaging segment continued to invest in a broad range of cost-reduction projects, high-value flexible packaging enhancements, rigid plastic containers technology and next-generation composite packaging.
Compliance with Environmental Laws – Information regarding compliancewith environmental laws is provided in Item 7 –Management’s Discussion andAnalysis ofFinancial Condition and Results ofOperations under the caption “RiskManagement,” andinNote 13 to the Consolidated Financial Statements included in Item 8 of this AnnualReport on Form 10-K.
Number of Employees – Sonoco had approximately 18,600 employees worldwideas of December 31, 2007.
(d) Financial information about geographic areas –Financial information about geographic areas is provided inNote 15 to the Consolidated
Financial Statements included in Item 8 of this Annual Report on Form 10-K, and in theinformation aboutmarket risk in Item 7 –Management’s Discussion andAnalysis of Finan-cial Condition and Results ofOperations under the caption “RiskManagement” of thisAnnual Report on Form 10-K.
(e) Available information –TheCompany electronically files with the Securities and ExchangeCommission (SEC)
its annual reports on Form 10-K, its quarterly reports on Form 10-Q, its periodic reports onForm 8-K, amendments to those reports filed or furnished pursuant to Section 13(a) of theSecurities ExchangeAct of 1934 (the “1934Act), and proxymaterials pursuant to Section 14of the 1934Act. The SECmaintains a site on the Internet, www.sec.gov, that containsreports, proxy and information statements, and other information regarding issuers that fileelectronically with the SEC. Sonoco alsomakes its filings available, free of charge, through itsWeb site, www.sonoco.com, as soon as reasonably practical after the electronic filing of suchmaterial with the SEC.
Executive Officers of the RegistrantName Age Position and Business Experience for the Past Five Years
Harris E. DeLoach Jr. 63 Chairman of the Board, President andChief ExecutiveOfficer since 2005. Previously President andChief ExecutiveOfficer July2000-April 2005; ChiefOperatingOfficer April-July 2000; Sr. Executive Vice President, Global Industrial Products/ Paper/Molded Plastics 1999-2000; Executive Vice President, HighDensity Film, Industrial Container, Fibre Partitions, ProtectivePackaging, SonocoCrellin and Baker Reels 1996-1999. Joined Sonoco in 1985.
JimC. Bowen 57 Sr. Vice President since 2002. Previously Sr. Vice President, Global PaperOperations 2000-2002; Vice President/GeneralManager– Paper 1997-2000; Vice President,Manufacturing –N.A. Paper 1994-1997. Joined Sonoco in 1972.
Cynthia A.Hartley 59 Sr. Vice President, Human Resources since 2002. Previously Vice President, Human Resources 1995-2002. Prior experience: VicePresident, Human Resources, Dames&Moore andNational GypsumCompany. Joined Sonoco in 1995.
Charles J. Hupfer 61 Sr. Vice President, Chief Financial Officer andCorporate Secretary since 2005. Previously Vice President, Chief Financial OfficerandCorporate Secretary 2002-2005; Vice President, Treasurer andCorporate Secretary 1995-2002. Joined Sonoco in 1975.
M. Jack Sanders 54 Executive Vice President, Industrial since February 2008. Previously Sr. Vice President, Global Industrial Products 2006-2008; VicePresident, Global Industrial Products January 2006-October 2006; Vice President, Industrial Products–N.A. 2001-2006; DivisionVice President/GeneralManager, Protective Packaging 1998-2001. Joined Sonoco in 1987.
Eddie L. Smith 56 Vice President, Industrial Products and Paper, Europe since 2006. Previously Vice President, Customer and Business Development2002-2006; Vice President/GeneralManager, Flexible Packaging 1998-2002; DivisionVice President/GeneralManager, FlexiblePackaging 1996-1998. Joined Sonoco in 1971.
Charles L. Sullivan Jr. 64 Executive Vice President, Consumer since 2005. Previously Sr. Vice President 2000-2005; Regional Director, Cargill Asia/Pacific in2000 and President, Cargill’s Salt Division 1995-2000. Joined Sonoco in 2000.
sonoco 2007 annual report 7

Item 1A. Risk Factorsrisk factors relating to sonoco’s businessThe Company is subject to environmental regulations and liabilities thatcould weaken operating results.
Federal, state, provincial, foreign and local environmental requirements, including theComprehensive Environmental Response, Compensation and Liability Act (CERCLA),and particularly those relating to air and water quality, are significant factors in the Company’sbusiness and generally increase its costs of operations. TheCompanymay be found to haveenvironmental liability for the costs of remediating soil or water that is, or was, contaminatedby the Company or a third party at various sites that are now, or were previously, owned, usedor operated by the Company. Legal proceedingsmay result in the imposition of fines orpenalties, as well as mandated remediation programs that require substantial, and in someinstances, unplanned capital expenditures.
TheCompany has incurred in the past, andmay incur in the future, fines, penalties andlegal costs relating to environmental matters, and costs relating to the damage of naturalresources, lost property values and toxic tort claims. TheCompany has made expenditures tocomply with environmental regulations and expects tomake additional expenditures in thefuture. As ofDecember 31, 2007, approximately $31.1million was reserved for environ-mental liabilities. Such reserves are established when it is considered probable that theCompany has some liability. In part because nearly all of the Company’s potential environ-mental liabilities are joint and severally shared with others, the Company’s maximum poten-tial liability cannot be reasonably estimated. However, the Company’s actual liability in suchcases may be substantially higher than the reserved amount. Additional charges could beincurred due to changes in law, or the discovery of new information, and those charges couldhave amaterial adverse effect on operating results.
General economic conditions in the United States may change, having anegative impact on the Company’s earnings.
Domestic sales accounted for approximately 62% of the Company’s consolidated rev-enues. Even with the Company’s diversification across variousmarkets and customers, due tothe nature of the Company’s products and services, a general economic downturn could havean adverse impact on the Company’s reported results.
Raw materials price increases may reduce net income.Most of the rawmaterials the Company uses are purchased from third parties. Principal
examples are recovered paper, steel, aluminum and resin. Prices for these rawmaterials aresubject to substantial fluctuations that are beyond the Company’s control and can adverselyaffect profitability.Many of the Company’s long-term contracts with customers permit lim-ited price adjustments to reflect increased rawmaterial costs. Although these and otherpricesmay be increased in an effort to offset increases in rawmaterials costs, such adjustments
may not occur quickly enough, or be sufficient to prevent amaterially adverse effect on netincome and cash flow.
The Company may encounter difficulties integrating acquisitions,restructuring operations or closing or disposing of facilities.
TheCompany has made numerous acquisitions in recent years, andmay actively seeknew acquisitions that management believes will providemeaningful opportunities in themarkets it serves. Acquired businesses may not achieve the expected levels of revenue, profitor productivity, or otherwise perform as expected.
Acquisitions also involve special risks, including, without limitation, the potential assump-tion of unanticipated liabilities and contingencies, and difficulties in integrating acquiredbusinesses.Whilemanagement believes that acquisitions will improve the Company’s com-petitiveness and profitability, no assurance can be given that acquisitions will be successful oraccretive to earnings.
TheCompany has closed higher-cost facilities, sold non-core assets and otherwiserestructured operations in an effort to improve cost competitiveness and profitability. Someof these activities are ongoing, and there is no guarantee that any such activities will achievethe Company’s goals and not divert the attention ofmanagement or disrupt the ordinaryoperations of the Company.Moreover, production capacity, or the actual amount of prod-ucts produced,may be reduced as a result of these activities.
Energy price increases may reduce net income.TheCompany’s manufacturing operations require the use of substantial amounts of elec-
tricity and natural gas, whichmay be subject to significant price increases as the result ofchanges in overall supply and demand. Energy usage is forecasted andmonitored, and theCompanymay, from time to time, use commodity futures or swaps in an attempt to reducethe impact of energy price increases. TheCompany cannot guarantee success in these efforts,and could suffer adverse effects to net income and cash flow should the Company be unableto pass higher energy costs through to its customers.
Changes in pension plan assets or liabilities may reduce net income andshareholders’ equity.
TheCompany has a projected benefit obligation for its defined benefit plans in excess of$1 billion. The calculation of this obligation is sensitive to the underlying discount rateassumption. Reductions in the expected long-term yield of high-quality debt instruments willresult in a higher projected benefit obligation and higher net periodic benefit cost. A higherprojected benefit obligationmay result in a change in funded status that significantly reducesshareholders’ equity. TheCompany has total assets in excess of $1 billion funding a significantportion of the projected benefit obligation. Decreases in fair value of these assets may result ina higher net periodic benefit cost and a change in the funded status that significantly reducesshareholders’ equity.
8

The Company may not be able to develop new products acceptableto the market.
TheCompany relies on new product development for organic growth within themar-kets it serves. If new products acceptable to the Company’s customers are not developed in atimely fashion, growth potential may be hindered.
The Company may not be able to locate suitable acquisition candidates.If significant acquisition candidates that meet the Company’s specific criteria are not
located, the Company’s potential for growthmay be restricted.
Conditions in foreign countries where the Company operates may reduceearnings.
TheCompany has operations throughoutNorth and SouthAmerica, Europe, AustraliaandAsia, with facilities in 35 countries. In 2007, approximately 38% of consolidated salescame from operations and sales outside of theUnited States. Accordingly, economic con-ditions, political situations, and changing laws and regulations in those countries mayadversely affect revenues and income.
Foreign exchange rate fluctuations may reduce the Company’s earnings.As a result of operating globally, theCompany is exposed to changes in foreign exchange
rates.Generally, each of theCompany’s foreign operations both produces and sells in itsrespective local currencies. As a result, foreign-exchange transaction risk is not significant.However, theCompany’s reported results of operations and financial position could be neg-atively affected by exchange rates when the activities and balances of its foreign operations aretranslated intoU.S. dollars for financial reporting purposes. TheCompanymonitors itsexposures and, from time to time,may use currency swaps and forward foreign exchange con-tracts to hedge certain forecasted transactions denominated in foreign currencies, foreign cur-rency assets and liabilities or the net investment in foreign subsidiaries. To date, the extent towhich theCompany has hedged its net investments in foreign subsidiaries has been limited.
Item 1B. Unresolved Staff CommentsThere are no unresolved written comments from the SEC staff regarding the Company’s
periodic or current 1934Act reports.
Item 2. PropertiesTheCompany’s corporate offices are owned and operated inHartsville, SouthCarolina.
There are 105 owned and 71 leased facilities used by operations in the Tubes andCores/Paper segment, 27 owned and 36 leased facilities used by operations in the Consumer Pack-aging segment, three owned and 18 leased facilities used by operations in the Packaging Serv-ices segment, and 18 owned and 30 leased facilities used by all other operations. Europe, themost significant foreign geographic region in which the Company operates, has 55manu-facturing locations.
Item 3. Legal ProceedingsTheCompany has been named as a potentially responsible party (PRP) at several
environmentally contaminated sites not owned by the Company. All of the sites are also theresponsibility of other parties. TheCompany’s liability, if any, is shared with such other parties,but the Company’s share has not been finally determined inmost cases. In some cases, theCompany has cost-sharing agreements with other PRPs with respect to a particular site. Suchagreements relate to the sharing of legal defense costs or cleanup costs, or both. TheCom-pany has assumed, for purposes of estimating amounts to be accrued, that the other parties tosuch cost-sharing agreements will perform as agreed. It appears that final resolution of someof the sites is years away, and actual costs to be incurred for these environmental matters infuture periods is likely to vary from current estimates because of the inherent uncertainties inevaluating environmental exposures. Accordingly, the ultimate cost to the Company withrespect to such sites cannot be determined. As ofDecember 31, 2007 and 2006, the Com-pany had accrued $31.1million and $15.3million, respectively, related to environmental con-tingencies. TheCompany periodically reevaluates the assumptions used in determining theappropriate reserves for environmental matters as additional information becomes availableand, when warranted, makes appropriate adjustments.
fox riverTheCompany believes the issues regarding the Fox River, which are discussed in some
detail below, currently represent the Company’s greatest loss exposure for environmentalliability. TheCompany also believes that all of its exposure to such liability for the Fox River iscontained within its wholly owned subsidiary, U.S. PaperMills Corp. (U.S.Mills). Accord-ingly, regardless of the amount of liability that U.S.Mills may ultimately bear, Sonoco Prod-ucts Company believes its maximum additional pre-tax loss for Fox River issues willessentially be limited to its investment inU.S.Mills, the book value of which was approx-imately $80million at December 31, 2007.
The extent of U.S.Mills’ potential liability remains subject tomany uncertainties and theCompany periodically reevaluates U.S.Mills’ potential liability and the appropriate reservesbased on information available to it. U.S.Mills’ eventual liability, whichmay be paid out over aperiod of several years, will depend on a number of factors. In general, themost significantfactors include: (1) the total remediation costs for the sites for whichU.S.Mills is found tohave liability and the share of such costs U.S.Mills is required to bear; (2) the total naturalresource damages for such sites and the share of such costs U.S.Mills is required to bear, and(3)U.S.Mills’ costs to defend itself in this matter.
U.S.Mills was originally notified by governmental entities in 2003 that it, together with anumber of other companies, had been identified as a PRP for environmental claims underCERCLA and other statutes, arising out of the presence of polychlorinated biphenyls(PCBs) in sediments in the lower Fox River and in the bay ofGreen Bay inWisconsin. U.S.Mills was named as a PRP because scrap paper purchased byU.S.Mills as a rawmaterial for itspapermaking processesmore than 30 years ago allegedly included carbonless copy paper that
sonoco 2007 annual report 9

contained PCBs, some of which were included in wastewater fromU.S.Mills’ manufacturingprocesses that was discharged into the Fox River. TheCompany acquired the stock of U.S.Mills in 2001, and the alleged contamination predates the acquisition. Although Sonocowasalso notified that it was a PRP, its only involvement is as a subsequent shareholder of U.S.Mills. As such, the Company has responded that it has no separate responsibility apart fromU.S.Mills.
The governmental entities making such claims against U.S.Mills and the other PRPshave been coordinating their actions, including the assertion of claims against the PRPs.Additionally, certain claimants have notifiedU.S.Mills and the other PRPs of their intent tocommence a natural resource damage (NRD) lawsuit, but no such actions have beeninstituted.
A review of the circumstances leading toU.S.Mills being named a PRP and the currentstatus of the remediation effort is set forth below.
In July 2003, theU.S. Environmental ProtectionAgency (EPA) andWisconsinDepart-ment ofNatural Resources (WDNR) issued their final cleanup plan (known as a Record ofDecision, or ROD) for a portion of the Fox River. The ROD addressed the lower part of theFox River and portions ofGreen Bay, where the EPA andWDNR (theGovernments)estimate the bulk of the sediments that need to be remediated are located. In two portions ofthe lower part of the Fox River covered by the ROD–OperableUnits (OUs) 3 and 4 – theGovernments selected large-scale dredging as the cleanup approach.OU 3 is the section ofthe Fox River running downstream fromLittle Rapids to theDePere dam, andOU4 runsfrom theDePere dam downstream to themouth of the Fox River at Green Bay. U.S.Mills’DePere plant is just below theDePere dam and, prior to 1972, discharged wastewater intothe river downstream of the dam inOU4. In the ROD, theGovernments estimated thatapproximately 6.5million cubic yards of sediment would be removed fromOUs 3 and 4 at anestimated cost of approximately $284million (approximately $26.5million forOU3 andapproximately $257.5million forOU4). TheGovernments also identified “capping” theriverbedwith appropriatematerials as a “contingent remedy” to be evaluated during theremedial design process. ForGreen Bay (OU5), theGovernments selectedmonitorednatural attenuation as the cleanup approach at an estimated cost of approximately $40mil-lion. TheGovernments also indicated that some limited dredging near themouth of the rivermight be required, which would ultimately be determined during the design stage of theproject. Earlier, in January 2003, theGovernments had issued their ROD for the upper por-tions of the Fox River –OUs 1 and 2. Combining the then current cost estimates from bothRODs, it appeared that theGovernments expected the selected remedies for all fiveOUs tocost approximately $400million, exclusive of contingencies. InMarch 2004,NCRCorpo-ration (NCR) andGeorgia-Pacific Corporation (G-P) entered into anAdministrativeOrder onConsent (AOC)with theGovernments to perform engineering design work forthe clean up ofOUs 2 – 5.
In the course of the ongoing design work, additional sampling and data analysis identifiedelevated levels of PCBs in certain areas ofOU4 near theU.S.Mills’ DePere plant (theOU4hotspot). InNovember 2005, theGovernments notifiedU.S.Mills andNCR that theywould be required to design and undertake a removal action that would involve dredging,dewatering and disposing of the PCB-contaminated sediments from theOU4 hotspot. Infurtherance of this notification, onApril 12, 2006, theUnited States and the State ofWisconsin suedNCR andU.S.Mills in theU. S. District Court for the EasternDistrict ofWisconsin inMilwaukee (Civil ActionNo. 06-C-0484). NCR andU.S.Mills agreed to aConsentDecree with theUnited States and the State ofWisconsin pursuant to which thesite is to be cleaned up on an expedited basis andNCR andU.S.Mills started removing con-taminated sediment inMay 2007. Although the defendants specifically did not admit liabilityfor the allegations of the complaint, they are bound by the terms of the ConsentDecree.
NCR andU.S.Mills reached agreement between themselves that each would fund 50%of the costs of remediation of theOU4 hotspot, which the Company currently estimates tobe between $30million and $39million for the project as a whole. Project implementationbegan in 2006, butmost of the project cost is expected to be incurred by the end of 2008.Although the funding agreement does not acknowledge responsibility or prevent eitherparty from seeking reimbursement from any other parties (including each other), the Com-pany accrued $12.5million in 2005, and an additional $5.2million in 2007, as its estimate ofthe portion of costs that U.S.Mills expects to incur under the funding agreement.
At the time of the Company’s acquisition of U.S.Mills in 2001, U.S.Mills and theCompany estimatedU.S.Mills’ liability for the Fox River cleanup at a nominal amount basedonGovernment reports and conversations with theGovernments about the anticipatedlimited extent of U.S.Mills’ responsibility, the belief, based onU.S.Mills’ prior assertions, thatno significant amount of PCB-contaminated rawmaterials had been used at theU.S.Millsplants, and the belief that any PCB contamination in the Fox River, other than a deminimusamount, was not caused byU.S.Mills. It appeared at that time that U.S.Mills and theGovernments would be able to resolve thematter and dismiss U.S.Mills as a PRP for anominal payment. Accordingly, no significant reserve was established at the time.However,theGovernments subsequently declined to enter into such a settlement. Nonetheless, U.S.Mills continued to believe that its liability exposure was very small based on its continuingbeliefs that no significant amount of PCB-contaminated rawmaterials had been used at theU.S.Mills plants and that any significant amount of PCB contamination in the section of theFox River located adjacent to its plant was not caused byU.S.Mills.
InMay/June 2005, U.S.Mills first learned of elevated levels of PCBs (theOU4 hotspot)in the Fox River adjacent to its DePere plant. U.S.Mills, while still not believing its DePereplant was the source of this contamination, entered into the consent decree to remediate theOU4 hotspot as discussed above.
In June 2006, U.S.Mills first received the results of tests it initiated on theU.S.Millsproperty that suggest that theDePere plantmay have processed as part of its furnishmore
1 0

than the deminimus amounts of PCB-contaminated paper reflected in the records availableto the Company. This information seemed to contradict the Company’s previous under-standing of the history of theDePere plant. Based on thesemost recent findings, it is possiblethat U.S.Mills might be responsible for a larger portion of the remediation than previouslyanticipated. The total estimated cost set forth in the ROD for remediation ofOU4wasapproximately $257.5million and the estimated cost of monitoringOU5was approximately$40million (a 2007 amendment to the RODestimated the cost ofOUs 2 – 5 at $390million). There are two alleged PRPs located inOU4 (of which the smaller is the plantowned byU.S.Mills). It is possible that U.S.Mills and the owners of the other plant, togetherwithNCR, the original generator of the carbonless copy paper, could be required to bear amajority of the remediation costs ofOU4, and share with other PRPs the cost of monitoringOU5. U.S.Mills has discussed possible remediation scenarios with other PRPs who haveindicated that they expectU.S.Mills to bear an unspecified butmeaningful share of the costsofOU4 andOU5.
In February 2007, the EPA andWDNR issued a general notice of potential liabilityunder CERCLA and a request to participate in remedial action implementation negotia-tions relating toOUs 2 – 5 to eight PRPs, includingU.S.Mills. The notice requested that thePRPs indicate their willingness to participate in negotiations concerning performance of theremaining elements of the remedial action forOUs 2 – 5 and the resolution of the govern-ment entities’ claims for unreimbursed costs and natural resource damages. OnApril 9, 2007,U.S.Mills, in conjunction with other PRPs, presented to the EPA and theWDNR a pro-posed schedule tomediate the allocation issues among eight PRPs, includingU.S.Mills.Non-bindingmediation began inMay 2007. Themediation is continuing; however, noagreement among the parties has yet occurred.
OnNovember 13, 2007, the EPA issued a unilateral AdministrativeOrder for RemedialAction pursuant to Section 106 of CERCLA. The order requires U.S.Mills and the sevenother respondents to jointly take various actions to clean upOUs 2 – 5. The order establishestwo phases of work. The first phase consists of planning and design work as well as prepara-tion for dredging and other remediation work andmust be completed byDecember 31,2008. The second phase consists primarily of dredging and disposing of contaminated sedi-ments and the capping of dredged and less contaminated areas of the river bottom. Thesecond phase is required to begin in 2009 when weather conditions permit and is expected tocontinue for several years. The order also provides for a $32,500 per day penalty for failure bya respondent to comply with its terms as well as exposing a non-complying respondent topotential treble damages. AlthoughU.S.Mills has reserved its rights to contest liability forany portion of the work, it is cooperating with the other respondents to comply with the firstphase of the order.
Themediation proceedings causedU.S.Mills to revise its estimate during 2007 of therange of loss probable to be incurred in connection with the remediation ofOUs 2 – 5. Basedon information currently available, there is no amount within the range that appears to be a
better estimate than any other. Accordingly, pursuant to applicable accounting rules, U.S.Mills recorded a charge of $20million in the second quarter of 2007 representing themini-mum estimated amount of potential loss U.S.Mills believes it is likely to incur. Develop-ments since that time, including the ongoingmediation and issuance of the AdministrativeOrder, have not providedU.S.Mills with a reasonable basis for further revising its estimate ofthe range of possible loss. BecauseU.S.Mills has not yet been able to estimate with any cer-tainty the portion of the total remediation costs that it might have to bear, reserves toaccount for the potential additional liability have not been increased at this point.
The actual costs associated with cleanup of the Fox River site are dependent uponmanyfactors and it is reasonably possible that total remediation costs could be higher than thecurrent estimates of project costs which range from $390million tomore than $600millionforOUs 2 – 5. Some, or all, of any costs incurred byU.S.Mills may be covered by insurance,ormay be subject to recoupment from other parties, but no amounts have been recognizedin the financial statements of the Company for any such recovery. Given the ongoingremedial design work being conducted, and the initial stages of remediation, it is possiblethere could be some additional changes to some elements of the reserve within the next yearor thereafter, although that is difficult to predict.
Similarly, U.S.Mills does not have a basis for estimating the possible cost of any naturalresource damage claims against it. Accordingly, reserves have not been increased for thispotential liability. However, for the entire river remediation project, the lowest estimate intheGovernments’ 2000 report on natural resource damages was $176million.
In addition to its potential liability forOUs 4 and 5, U.S.Mills may have a contingentliability toMenasha Corporation to indemnify it for any amount for which it may be heldliable in excess of insurance coverage for any environmental liabilities of a plant onOU1 thatU.S.Mills purchased fromMenasha. Due to the uncertainty ofMenasha’s liability and theextent of the insurance coverage as well as any defenses that may be asserted to any suchclaim, U.S.Mills has not established a reserve for this contingency.
In any event, because the discharges of hazardousmaterials into the environmentoccurred before the Company acquiredU.S.Mills, andU.S.Mills has been operated as aseparate subsidiary of the Company, the Company does not believe that it has any liability forthe liabilities of U.S.Mills. Accordingly, as stated above, the Company does not believe it isprobable that the effect of U.S.Mills’ Fox River liabilities, along with any claims against theCompany, would result in a pre-tax loss that wouldmaterially exceed the net worth of U.S.Mills, which was approximately $80million at December 31, 2007.
Additional information regarding legal proceedings is provided inNote 13 to the Con-solidated Financial Statements of this Annual Report on Form 10-K.
Item 4. Submission of Matters to a Vote of Security HoldersNot applicable.
sonoco 2007 annual report 1 1

part ii
Item 5. Market for Registrant’s Common Equity, Related StockholderMatters and Issuer Purchases of Equity Securities
TheCompany’s common stock is traded on theNewYork Stock Exchange under thestock symbol “SON.” As ofDecember 31, 2007, there were approximately 38,000 share-holder accounts. Information required by Item 201(d) of Regulation S-K can be found inPart III, Item 12 of this Annual Report on Form 10-K. The following table indicates the highand low sales prices of the Company’s common stock for each full quarterly period within thelast two years as reported on theNewYork Stock Exchange, as well as cash dividendsdeclared per common share:
High Low CashDividends
2007FirstQuarter $38.90 $36.19 $.24
SecondQuarter $44.91 $38.10 $.26
ThirdQuarter $44.75 $29.65 $.26
FourthQuarter $34.76 $28.45 $.26
2006FirstQuarter $ 34.75 $ 28.76 $ .23SecondQuarter $ 34.75 $ 29.45 $ .24ThirdQuarter $ 34.75 $ 30.30 $ .24FourthQuarter $ 38.71 $ 33.10 $ .24
TheCompany did notmake any unregistered sales of its securities during 2007, and didnot purchase any of its securities during the fourth quarter of 2007.
1 2

Item 6. Selected Financial DataThe following table sets forth the Company’s selected consolidated financial information for the past five years. The information presented below should be read together withManage-
ment’s Discussion andAnalysis of Financial Condition and Results ofOperations included in Item 7 of this Annual Report on Form 10-K and the Company’s historical Consolidated Finan-cial Statements and theNotes thereto included in Item 8 of this Annual Report on Form 10-K. The selected statement of income data and balance sheet data are derived from theCompany’s Consolidated Financial Statements.
Years endedDecember 31(Dollars and shares in thousands except per share data) 2007 2006 2005 2004 2003
OperatingResultsNet sales $4,039,992 $3,656,839 $3,528,574 $3,155,433 $2,758,326Cost of sales and operating expenses 3,695,917 3,310,751 3,232,590 2,897,046 2,549,726Restructuring and impairment charges 36,191 25,970 21,237 18,982 50,056Interest expense 61,440 51,952 51,559 47,463 52,399Interest income (9,182) (6,642) (7,938) (5,400) (2,188)
Income before income taxes 255,626 274,808 231,126 197,342 108,333Provision for income taxes 55,186 93,329 84,174 58,858 37,698Equity in earnings of affiliates/minority interest, net of tax 13,716 13,602 14,925 12,745 7,543
Income from continuing operations 214,156 195,081 161,877 151,229 78,178Income from discontinued operations, net of income taxes1 — — — — 60,771
Net income available to common shareholders $ 214,156 $ 195,081 $ 161,877 $ 151,229 $ 138,949
Per common shareNet income available to common shareholders:
Basic $ 2.13 $ 1.95 $ 1.63 $ 1.54 $ 1.44Diluted 2.10 1.92 1.61 1.53 1.43
Cash dividends – common 1.02 .95 .91 .87 .84Weighted average common shares outstanding:
Basic 100,632 100,073 99,336 98,018 96,819Diluted 101,875 101,534 100,418 98,947 97,129
Actual common shares outstanding at December 31 99,431 100,550 99,988 98,500 96,969
Financial PositionNet working capital $ 269,598 $ 282,974 $ 265,014 $ 282,226 $ 75,671Property, plant and equipment, net 1,105,342 1,019,594 943,951 1,007,295 923,569Total assets 3,340,243 2,916,678 2,981,740 3,041,319 2,520,633Long-term debt 804,339 712,089 657,075 813,207 473,220Total debt 849,538 763,992 781,605 906,961 674,587Shareholders’ equity 1,441,537 1,219,068 1,263,314 1,152,879 1,014,160Current ratio 1.4 1.4 1.4 1.4 1.1Total debt to total capital2 35.8% 37.5% 35.7% 40.7% 36.4%1 Income from discontinued operations, net of income taxes, includes the operating results for theHighDensity Film business, which was sold in 2003.2 Calculated as Total Debt divided by the sum of Total Debt, Shareholders’ Equity and Long-termDeferred Tax Liability.
sonoco 2007 annual report 1 3

Item 7. Management’s Discussion and Analysis of FinancialCondition and Results of OperationsGeneral Overview
Sonoco is a leadingmanufacturer of consumer and industrial packaging products andprovider of packaging services with 334 locations in 35 countries. TheCompany’s operationsare organized and reported in three segments, Consumer Packaging, Tubes andCores/Paper and Packaging Services, while a number of smaller businesses are discussed as AllOther Sonoco. Generally, the Company serves two broad end-usemarkets: consumer andindustrial. Consumer and industrial sales are split approximately 52% and 48% , respectively.Geographically, approximately 62% of sales are generated in theUnited States, 18% inEurope, 10% inCanada and 10% in other regions.
TheCompany is a market-share leader inmany of its product lines, particularly in tubes,cores and composite containers and competition inmost of the Company’s businesses isintense. Demand for the Company’s products and services is primarily driven by the overalllevel of consumer consumption of non-durable goods, however, certain product groups aretiedmore directly to durable goods, such as appliances, and construction.
While overall market conditions have been relatively stable over the past several years inconsumermarkets, declining domestic textile and papermarkets have negatively impactedthe Company’s industrial businesses. Currently, formany of our businesses, marginal capacityin the industry works to restrain the pricing ability of all market participants.
strategy and opportunitiesFinancially, the Company’s objective is to deliver average annual double-digit total returns
to shareholders over time. Tomeet that target, the Company focuses on threemajor areas:driving profitable sales growth, improvingmargins, and leveraging the Company’s strong cashflow and financial position.Operationally, the goal is to be the low-cost global leader incustomer-preferred packaging solutions within targeted customermarket segments.
InDecember 2007, the Company announced its current five-year plan to grow revenue,improvemargins andmore effectively utilize assets. The new five-year plan continues theCompany’s recent focus on growing its consumer-related business faster than the industrial-related business, with the goal of transitioning the overall mix of business to approximately60% consumer and 40% industrial by 2012.
TheCompany’s primary growth drivers are increasing organic sales, geographicexpansion, providing total packaging solutions for customers and strategic acquisitions. Overthe next five years, revenue growth is expected to be equally split between organic and acquis-itions.Much of the organic growth is expected to occur in the form of new products. Thefive-year plan targets average annual sales from new products (those commercialized for twoyears or less) at $100million to $150million. Sales from new products were $100million in2007 and $111million in 2006.
TheCompany’s plan to improvemargins focuses on leveraging fixed costs, improvingproductivity, maintaining a positive price/cost relationship (raising selling price at least
enough to recover cost inflation plus a reasonablemargin), improving underperformingoperations and effectively utilizing capital.
Results of Operations2007 overview
In 2007, Sonoco achieved records in sales and net income. This was accomplished despitesignificant increases in rawmaterial and other costs and a slowing economy inNorthAmer-ica. In addition, the Company generated another year of record productivity improvementsand strong cash flow, which was invested in growing the business and returning value toshareholders through increased dividends and stock repurchases.
In 2007, sales grew 10.5%, or $383million, primarily due to acquisitions, increased sellingprices and foreign exchange rates. The Tubes andCores/Paper segment provided 49% of thetotal increase in revenue, the Consumer Packaging segment provided 35% and the PackagingServices segment provided 16%. Sales in AllOther Sonocowere essentially flat year-over-year. Acquisitions accounted for $207million, or 54%, of the year-over-year sales increase.
TheCompany reported net income of $214.2million for 2007, compared with $195.1million for 2006. Current year earnings benefited from a notably lower effective tax rate andwere negatively affected by after-tax asset impairment and restructuring-related charges of$25.4million, compared with $20.9million in 2006. Current year results also include a $14.8million after-tax charge for environmental costs.
Selling price increases were exceeded by increases in the costs of labor, material, freightand energy, while lower volumes and an unfavorable change in themix of business more thanoffset productivity improvements in virtually all of the Company’s businesses. This resulted ingross profit margins declining to 18.7%, compared with 19.3% in 2006; however, net incomemargin remained flat due to a reduction in the overall effective tax rate.
OutlookWhile revenues are expected to continue to increase in 2008, the outlook for theNorth
American economy is very uncertain and a significant slowdown or decline could affect theCompany’s business accordingly. Althoughmarket share is expected to hold, overall demandfor tubes and cores, specifically inNorthAmerica, is expected to remain weak.Margins in theConsumer Packaging segment are expected to improve.Higher volume and productivityimprovements in flexible packaging, and new products and customers in rigid plasticcontainers, are expected to lead to higher sales and operating profits for that segment.
The current high cost of old corrugated containers (OCC), other rawmaterials, andenergy is expected to continue at least into the first half of 2008, which will continue to putpressure onmargins. TheCompany will seek to offset any significant cost inflation throughprice adjustments. To that end, in January 2008, the Company announced a price increase forpaper-based tubes and cores in theUnited States andCanada. Productivity improvementsand strong cost controls are expected to helpmaintain or slightly increasemargins in what isexpected to be a tough cost and pricing environment in 2008.
1 4

The consolidated effective tax rate, which was 21.6% in 2007, is expected to be approx-imately 32% in 2008.
Restructuring Charges, Unusual Items and Other Activitiesrestructuring/asset impairment charges
During 2007, the Company recognized restructuring and asset impairment charges total-ing $36.2million ($25.4million after tax). These charges resulted primarily from closing thefollowing facilities: a metal ends plant in Brazil; two rigid packaging plants, one in theUnitedStates and one inGermany; rigid packaging production lines in theUnited Kingdom; twopapermills, one in China and one in France; three tube and core plants, one in theUnitedStates and two inCanada; twomolded plastics plants, one in theUnited States and one inTurkey; and a point-of-purchase displaymanufacturing plant in theUnited States. Five ofthese closures were not part of a formal restructuring plan. The remainder of the closureswere part of restructuring plans announced in 2006 and 2003. The charges were comprised ofseverance and termination benefits of $11.9million, other exit costs of $7.6million, and assetimpairment charges of $16.7million.Other exit costs consist of building lease terminationcharges and othermiscellaneous costs related to closing these facilities. Asset impairmentcharges related primarily to the closures of themetal ends plant in Brazil and the rigid pack-aging plant in theUnited States. Impaired assets were written down to the lower of carryingamount or fair value, less estimated costs to sell, if applicable.
During 2006, pursuant to restructuring plans announced in 2006 and 2003, the Companyrecognized restructuring and asset impairment charges totaling $26.0million ($21.3millionafter tax). These charges resulted primarily from the following plant closures: a papermill inFrance; four tube and core plants, three in theUnited States and one in Canada; two flexiblepackaging operations, one in theUnited States and one in Canada; a wooden reels facility intheUnited States; and amolded plastics operation in theUnited States. In addition, thecharges reflect the impact of downsizing actions primarily in the Company’s European tubesand cores/paper operations. These charges were comprised of severance and terminationbenefits of $11.8million, other exit costs of $6.4million, and asset impairment charges of $7.8million.Other exit costs consist of building lease termination charges and othermiscella-neous costs related to closing these facilities. Asset impairment charges related primarily tothe closure of the papermill in France. Impaired assets were written down to the lower ofcarrying amount or fair value, less estimated costs to sell, if applicable.
During 2005, pursuant to a restructuring plan announced in 2003, the Company recog-nized restructuring and asset impairment charges totaling $21.2million ($14.3million aftertax) resulting from 11 plant closings in the Tubes andCores/Paper segment and three plantclosings in the Consumer Packaging segment. These charges consisted of severance andtermination benefits of $6.2million, other exit costs of $8.5million, and asset impairmentcharges of $6.5million.Other exit costs consist of building lease termination charges andothermiscellaneous costs related to closing these facilities. Of the asset impairment charges,$5.9million related to equipment impaired as a result of the plant closures, and $0.6million
related to buildings. Impaired assets were written down to the lower of carrying amount orfair value, less estimated costs to sell, if applicable. In addition to the above charges, theCompany incurred a non-restructuring asset impairment charge of $3.0million related to apapermill in China. This charge was included in “Selling, general and administrative expenses”in the Company’s Consolidated Statements of Income.
TheCompany also recorded non-cash, after-tax income in the amount of $0.1million in2007, $0.4million in 2006 and $1.3million in 2005 to reflect a minority shareholder’s portionof restructuring costs that were charged to expense. This income is included in “Equity inearnings of affiliates/minority interest in subsidiaries, net of tax” in the Company’s Con-solidated Statements of Income.
TheCompany expects to recognize future additional restructuring costs of approx-imately $12million associated with the 2007 restructuring actions and the 2006 restructuringplan. TheCompany does not expect to recognize any future additional restructuring costsunder the 2003 plan.
acquisitions/joint venturesTheCompany completed four acquisitions during 2007, and purchased the remaining
51.1% interest in a small joint venture in Europe, at an aggregate cost of $236.3million, all ofwhich was paid in cash. Acquisitionsmade in the Consumer Packaging segment includedMatrix Packaging, Inc., a leadingmanufacturer of custom-designed blowmolded rigid plasticcontainers and injectionmolded products with operations in theUnited States andCanada,and the fiber and plastic container business of Caraustar Industries, Inc. Additional acquis-itions in 2007 consisted of a small tube and core business inMexico, which is included in theTubes andCores/Paper segment, and a small protective packaging business in theUnitedStates, which is included inAllOther Sonoco. TheCompany also purchased the remaining51.1% interest in AT-SpiralOY, a European tubes and cores joint venture. Annual sales fromthese acquisitions are expected to total approximately $200million. As these acquisitionswere notmaterial to the Company’s financial statements individually or in the aggregate, proforma results have not been provided.
TheCompany completed six acquisitions during 2006, and purchased the remaining35.5%minority interest of its Sonoco-Alcore S.a.r.l. joint venture, at an aggregate cost of$227.3million, all of which was paid in cash. Annual sales from these acquisitions, excludingthe joint venture interest, are expected to total $130million. TheCompany had previouslyconsolidated the joint venture, which was included in the Tubes andCores/Paper segment,so no additional reported sales resulted from the purchase of the remaining interest.
In 2005, the Company completed threeminor acquisitions with an aggregate cost of $3.6million, all of which was paid in cash.
dispositionsInDecember 2005, the Company divested its single-plant folding cartons business for a
note receivable of approximately $11.0million, which was collected in early 2006. This trans-
form 10-k | sonoco 2007 annual report 1 5
action resulted in a gain of $2.4million ($1.6million after tax). The results of this business unitwere immaterial to the Company’s consolidated net income for all periods presented.
other special charges, income items and contingenciesIn 2007, U.S. PaperMills Corp. (U.S.Mills), a wholly owned subsidiary of the Company,
recorded charges totaling $25.2million ($14.5million after tax) in association with environ-mental remediation liabilities for various sites in the lower Fox River inWisconsin. In 2005,U.S.Mills recorded a $12.5million charge ($7.6million after tax) related to one of the sites.The charges are included in “Selling, general and administrative expenses” in the Company’sConsolidated Statements of Income.
The 2005 charge and $5.2million of the 2007 charge related to a particular site on thelower Fox River in which remediation of PCB-contaminated sediments has already begun.The total charge of $17.7million represents the Company’s best estimate of what it is likelyto pay to complete the project; however, the actual costs associated with remediation of thisparticular site are dependent uponmany factors, and it is possible that actual costs couldexceed current estimates. TheCompany acquiredU.S.Mills in 2001, and the identified con-tamination predates the acquisition. Some or all of any costs incurredmay be covered byinsurance or be recoverable from third parties; however, there can be no assurance that suchclaims for recovery will be successful. Accordingly, no amounts have been recognized in thefinancial statements for such recovery.
In February 2007, U.S.Mills and seven other potentially responsible parties received ageneral notice of potential liability under CERCLA from the Environmental ProtectionAgency (EPA) and theWisconsinDepartment ofNatural Resources relating to a stretch ofthe lower Fox River, including the bay at Green Bay. The contamination referred to in thisnotice covers a vastly larger area than the site referred to in the paragraph above.Mediationproceedings between the potentially responsible parties to allocate the liability began in thesecond quarter of 2007. As a result of these proceedings, U.S.Mills revised its estimate of therange of loss probable to be incurred by it in association with the additional remediation.Accordingly, a charge of $20million was recorded in the second quarter of 2007. This chargerepresents theminimum estimated amount of potential loss U.S.Mills believes it is likely toincur. Developments since the second quarter, including ongoingmediation and a unilateralAdministrativeOrder for Remedial Action issued by the EPA inNovember 2007 againstthe eight potentially responsible parties, have not yet providedU.S.Mills with a reasonablebasis for further revising its estimate of the range of possible loss. AlthoughU.S.Mills’ ulti-mate share of the liability could conceivably exceed its net worth, the Company believes themaximum additional exposure to Sonoco’s consolidated financial position is limited to theequity position of U.S.Mills which was approximately $80million as of December 31, 2007,excluding any tax benefits that may reduce the net charge. For amore detailed discussion ofthe Fox River environmental matters, see “Item 3. Legal Proceedings” above.
During 2005, the Company repatriated $124.7million from foreign subsidiaries underthe provisions of the American JobsCreationAct of 2004 (AJCA).Under this temporary
incentive, a portion of the repatriated funds qualified for an 85% dividends-receiveddeduction. Although the effective tax rate on the repatriated funds was lower than it wouldhave otherwise been absent the AJCA, the repatriation resulted in the recognition of addi-tional U.S. federal and state income taxes totaling $10.1million.
Results of Operations 2007 versus 2006operating revenue
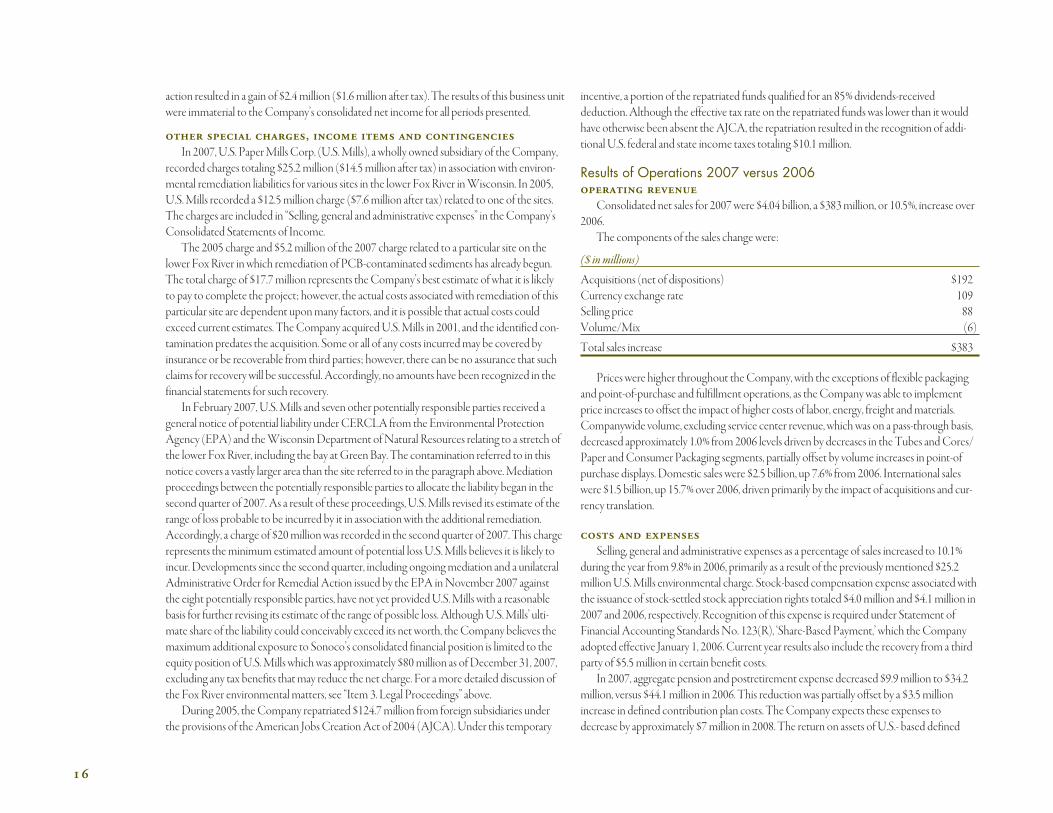
Consolidated net sales for 2007 were $4.04 billion, a $383million, or 10.5%, increase over2006.
The components of the sales change were:
($ in millions)
Acquisitions (net of dispositions) $192Currency exchange rate 109Selling price 88Volume/Mix (6)
Total sales increase $383
Prices were higher throughout the Company, with the exceptions of flexible packagingand point-of-purchase and fulfillment operations, as the Company was able to implementprice increases to offset the impact of higher costs of labor, energy, freight andmaterials.Companywide volume, excluding service center revenue, which was on a pass-through basis,decreased approximately 1.0% from 2006 levels driven by decreases in the Tubes andCores/Paper andConsumer Packaging segments, partially offset by volume increases in point-ofpurchase displays. Domestic sales were $2.5 billion, up 7.6% from 2006. International saleswere $1.5 billion, up 15.7% over 2006, driven primarily by the impact of acquisitions and cur-rency translation.
costs and expensesSelling, general and administrative expenses as a percentage of sales increased to 10.1%
during the year from 9.8% in 2006, primarily as a result of the previouslymentioned $25.2millionU.S.Mills environmental charge. Stock-based compensation expense associated withthe issuance of stock-settled stock appreciation rights totaled $4.0million and $4.1million in2007 and 2006, respectively. Recognition of this expense is required under Statement ofFinancial Accounting StandardsNo. 123(R), ‘Share-Based Payment,’ which the Companyadopted effective January 1, 2006. Current year results also include the recovery from a thirdparty of $5.5million in certain benefit costs.
In 2007, aggregate pension and postretirement expense decreased $9.9million to $34.2million, versus $44.1million in 2006. This reduction was partially offset by a $3.5millionincrease in defined contribution plan costs. TheCompany expects these expenses todecrease by approximately $7million in 2008. The return on assets of U.S.- based defined
1 6

benefit plans was 8.4% in 2007 and 13.9% in 2006.Over time, investment returns on benefitplan assets impact the Company’s cost of providing pension and postretirement benefits.
Operating profits also reflect restructuring and asset impairment charges of $36.2millionand $26.0million in 2007 and 2006, respectively. These items are discussed inmore detail inthe section above titled, “RestructuringCharges, Unusual Items andOther Activities.”
Research and development costs, all of which were charged to expense, totaled $15.6mil-lion and $12.7million in 2007 and 2006, respectively.Management expects research anddevelopment spending in 2008 to be consistent with these levels.
Net interest expense totaled $52.3million for the year endedDecember 31, 2007, com-pared with $45.3million in 2006. The increase was due primarily to higher average debt levelsresulting from acquisitions and stock buybacks.
The 2007 effective tax rate was 21.6%, compared with 34.0% in 2006. The year-over-yeardecrease in the effective tax rate, which added approximately $32million to reported netincome, was due primarily to the release of tax reserves on expiration of statutory assessmentperiods, foreign tax rate reductions and improved international results. Included in the effec-tive tax rate for 2006 was the impact of a $5.3million benefit associated with entering intofavorable tax agreements with state tax authorities and closing state tax examinations foramounts less than originally anticipated. The 2006 benefits were partially offset by a $4.9mil-lion impact resulting from restructuring charges for which a tax benefit could not be recog-nized.
The estimate for the potential outcome for any uncertain tax issue is highly judgmental.TheCompany believes it has adequately provided for any reasonable foreseeable outcomerelated to thesematters. However, future results may include favorable or unfavorableadjustments to estimated tax liabilities in the period the assessments aremade or resolved orwhen statutes of limitations on potential assessments expire. Additionally, the jurisdictions inwhich earnings or deductions are realizedmay differ from current estimates. As a result, theeffective tax ratemay fluctuate significantly on a quarterly basis.
reporting segmentsConsolidated operating profits, also referred to as “Income before income taxes” on the
Consolidated Statements of Income, are comprised of the following:
($ in millions) 2007 2006 %Change
Consumer Packaging segment $104.5 $109.6 (4.7)%Tubes andCores/Paper segment 143.7 148.2 (3.0)%Packaging Services segment 44.5 39.2 13.5%AllOther Sonoco 51.4 49.1 4.6%Restructuring and related impairment charges (36.2) (26.0) (36.9)%Interest expense, net (52.3) (45.3) (15.3)%
Consolidated operating profits $255.6 $274.8 (7.0)%
Segment results viewed byCompanymanagement to evaluate segment performance donot include restructuring and impairment charges and net interest charges. Accordingly, theterm “segment operating profits” is defined as the segment’s portion of “Income beforeincome taxes” excluding restructuring charges, asset impairment charges and net interestexpense. General corporate expenses, with the exception of restructuring charges, interestand income taxes, have been allocated as operating costs to each of the Company’s reportablesegments andAllOther Sonoco.
SeeNote 15 to the Company’s CondensedConsolidated Financial Statements formoreinformation on reportable segments.
Consumer Packaging($ in millions) 2007 2006 %Change
Trade sales $1,438.1 $1,304.8 10.2%Segment operating profits 104.5 109.6 (4.7)%Depreciation, depletion and amortization 66.5 55.1 20.7%Capital spending 74.2 48.2 54.1%
Sales in this segment increased due to the impact of acquisitions, increased selling pricesof composite cans and closures and favorable exchange rates, as the dollar weakened againstforeign currencies. These favorable impacts were partially offset by lower volume in compo-site cans along with lower volume and lower selling prices in flexible packaging.Overallvolumes, excluding the impact of acquisitions, were down 1% in the segment. Domestic saleswere approximately $1,027million, up 11.0% from 2006, and international sales were approx-imately $411million, up 8.3% from 2006.
Segment operating profits decreased primarily due to price and volume declines in flexi-ble packaging, along with volume declines in composite cans. These unfavorable factorsexceeded the impact of productivity and purchasing initiatives and acquisitions.While theCompany was able to increase selling prices in all operations except for flexible packaging, itwas unable to offset increased costs of energy, freight, material and labor.High startup costsat the Company’s rigid plastics container plants inWisconsin andOhio also dampenedoperating profits in the segment, as did operational issues at the closures plant in Brazil. TheWisconsin plant will cease operations at the end of the first quarter of 2008, while the Brazil-ian plant has already been closed.
Significant capital spending included increasing rigid plastic production capacity in theUnited States and productivity projects throughout the segment.
form 10-k | sonoco 2007 annual report 1 7

Tubes and Cores/Paper($ in millions) 2007 2006 %Change
Trade sales $1,712.0 $1,525.6 12.2%Segment operating profits 143.7 148.2 (3.0)%Depreciation, depletion and amortization 91.2 85.9 6.2%Capital spending 75.7 63.3 19.5%
The increase in sales was due to increased selling prices throughout the segment, theimpact of acquisitions and the effect of favorable exchange rates. Lower domestic tube andcore volumewas partially offset by increased volume in the Company’s European operations.Overall, volume in the segment, excluding the impact of acquisitions, decreased by approx-imately 2%. Domestic sales increased approximately $52million, or 6.8%, to approximately$825million and international sales increased approximately $134million, or 17.8% toapproximately $887million. International sales increased primarily as a result of the late 2006acquisition of the remaining 75% interest inDemolli Industria Cartaria S.p.A, an Italy-basedmanufacturer of tubes, cores and paperboard.
Segment operating profits were unfavorably impacted by a charge of $25.2million relatedto an increase in the environmental reserve at a Company subsidiary’s paper operations inWisconsin. See “Other Special Charges, Income Items andContingencies” above for a dis-cussion of this claim. In addition, lower volume and increases in the costs of energy, freight,material and labor had a negative impact on segment profitability. Partially offsetting theseitems were productivity and purchasing initiatives and higher selling prices, along with theimpact of acquisitions.
Significant capital spending included themodification of several papermachines, primar-ily in theUnited States,Mexico and Europe, and building of new tube and core plants in Asia.
Packaging Services($ in millions) 2007 2006 %Change
Trade sales $518.8 $456.8 13.6%Segment operating profits 44.5 39.2 13.5%Depreciation, depletion and amortization 11.8 11.9 (0.8)%Capital spending 3.7 3.4 6.8%
Sales increased due to higher volumes throughout the segment, whichmore than offsetlower selling prices in point-of-purchase and fulfillment operations related to recent com-petive bidding activity. Domestic sales increased to approximately $374million, an 8.5%increase, while international sales increased to approximately $144million, up 29.1%, primar-ily as a result of increased service center volume in Poland.
The increase in segment operating profits is attributable to volume increases inpoint-of-purchase and fulfillment operations along with productivity and purchasing ini-tiatives. The service centers’ sales increase had very little impact on profits, as these sales were
on a pass-through basis with no significant additional grossmargin. Partially offsetting thesefavorable factors were the selling price declines discussed above.
Capital spending included numerous productivity and customer development projects intheUnited States and Europe.
All Other Sonoco
($ in millions) 2007 2006 %ChangeTrade sales $371.1 $369.7 0.4%Operating profits 51.4 49.1 4.6%Depreciation, depletion and amortization 11.8 12.0 (1.2)%Capital spending 15.9 8.4 89.4%
Sales for AllOther Sonoco increased slightly as price increases, the impact of acquisitionsand the effect of favorable exchange rates were nearly offset by lower volumes inmoldedplastics and wire and cable reels. Domestic sales were approximately $294million, down 2.2%from 2006, and international sales were approximately $77million, an increase of 11.9%.
Operating profits in AllOther Sonoco increased due primarily tomanufacturing pro-ductivity and purchasing initiatives, although they were partially offset by the impact of thevolume declines. Through higher selling prices, the Company was able to recover increases inrawmaterial costs but not higher costs of energy, freight and labor.
Capital spending included investing in productivity and customer development projectsin theUnited States andAsia formolded and extruded plastics, protective packaging andwire and cable reels.
Financial Position, Liquidity and Capital Resourcescash flow
Cash flow from operations totaled $445.1million in 2007, compared with $482.6millionin 2006.Operating cash flows in both years benefited from companywide initiatives aimed atreducing working capital, but to a lesser extent in 2007. The projected benefit obligation oftheU.S. Defined Benefit Pension Plan was fully funded as of December 31, 2007. TheCompany froze participation for newly hired salaried and non-union hourlyU.S. employeeseffectiveDecember 31, 2003. Based on the current actuarial estimates, the Company antici-pates that the total 2008 contributionsmade to its benefit plans will be comparable to 2007levels which were approximately $17million.However, no assurances can bemade aboutfunding requirements beyond 2008, as they will depend largely on actual investment returnsand future actuarial assumptions.
Cash flows used by investing activities increased from $332.1million in 2006 to $379.6million in 2007. TheCompany invested $236.3million in four acquisitions and the purchaseof the remainingminority interest in a European tube and core joint venture in 2007. Thiswas comparable to the level of acquisition spending in 2006. As part of its growth strategy,the Company is actively seeking acquisition opportunities and the level of acquisition spend-ing in any given year will depend on the size and number of suitable candidates identified and
1 8

the Company’s success at closing the transactions. Capital spending increased by $46.1mil-lion to $169.4million in 2007 from $123.3million in 2006. Capital spending is expected toreturn tomore historic levels of approximately $125million to $130million in 2008.
Net cash used by financing activities totaled $75.0million in 2007, compared with $125.7million in 2006. Cash dividends increased 8.3% to $102.6million during 2007.Net borrow-ings increased $78.7million, primarily in connection with acquisition activities. During 2007,the Company acquired 3.0million shares of Sonoco common stock at a cost of $109.2mil-lion and issued shares through the exercise of previously awarded stock options for proceedsof $49.7million.
Current assets increased by $84.9million to $1,027.7million at December 31, 2007. Thisincrease is largely attributable to higher levels of inventory and accounts receivable stemmingfrom 2007 acquisitions. Current liabilities increased by $98.3million to $758.1million atDecember 31, 2007. This increase was due to higher accounts payable, accruedwages andtaxes payable, partially offset by decreases in notes payable. The current ratio was 1.4 atDecember 31, 2007 and 2006.
TheCompany uses a notional pooling arrangement with an international bank to helpmanage global liquidity requirements. Under this pooling arrangement, the Company and itsparticipating subsidiariesmaymaintain either cash deposit or borrowing positions throughlocal currency accounts with the bank, so long as the aggregate position of the global pool is anotionally calculated net cash deposit. Because it maintains a security interest in the cashdeposits, and has the right to offset the cash deposits against the borrowings, the bank pro-vides the Company and its participating subsidiaries favorable interest terms on both.
contractual obligationsThe following table summarizes contractual obligations at December 31, 2007:
Payments Due In($ in millions) Total 2008 2009-2010 2011-2012 Beyond 2012 Uncertain
Debt obligations $ 850.0 $ 45.2 $109.0 $180.8 $515.0 $ —Interest payments1 283.2 38.0 75.6 61.3 108.3 —Operating leases 139.4 32.9 47.0 28.4 31.1 —Environmentalremediation (U.S.Mills)2 29.0 9.0 — — — 20.0
FIN 482 40.0 — — — — 40.0Purchase obligations3 289.6 23.7 47.4 38.5 180.0 —
Total contractualobligations $1,631.2 $148.8 $279.0 $309.0 $834.4 $60.0
1 Includes interest payments on outstanding fixed-rate, long-term debt obligations aswell as financing fees on the backstop line of credit.
2 Due to the nature of this obligation, the Company is unable to estimate the timing ofthe cash outflows.
3 Includes only long-term contractual commitments. Does not include short-term obli-gations for the purchase of goods and services used in the ordinary course of business.
capital resourcesTheCompany’s total debt, including the impact of foreign exchange rates, increased by
$85.5million to $849.5million at December 31, 2007.TheCompany currently operates a commercial paper program totaling $500million and
has a fully committed bank line of credit supporting the program by a like amount. OnMay 3, 2006, the Company entered into an amended and restated credit agreement toextend its bank line of credit to a new five-year maturity. The amended and restated creditagreement also provided the Company the option to increase its credit line from $350mil-lion to $500million subject to the concurrence of its lenders. TheCompany exercised thisoption and increased the credit line to $500million onMay 29, 2007. TheCompany intendsto indefinitely maintain line of credit agreements fully supporting its commercial paper pro-gram. AtDecember 31, 2007, the amount of the Company’s outstanding commercial paperwas $169million, compared with $89million at December 31, 2006. Consistent with thematurity of the supporting line of credit, the Company classifies outstanding commercialpaper balances as long-term debt.
On January 2, 2008, the Company prepaid its 6.125% Industrial Revenue Bond (IRB) for$35.1million. TheCompany intends to prepay its 6.0% IRB in the second quarter of 2008 for$35.4million. The prepayment of these two bond issues is expected to result in an after-taxcharge totaling approximately $1.3million.
One of the Company’s primary growth strategies is growth through acquisitions. TheCompany believes that cash on hand, cash generated from operations, and the available bor-rowing capacity under its amended and restated credit agreement will enable it to supportthis strategy. Although the Company currently has no intent to do so, it may obtain addi-tional financing in order pursue its growth strategy. Although the Company believes that ithas excess borrowing capacity beyond its current lines, there can be no assurance that suchfinancing would be available or, if so, at terms that are acceptable to the Company.
TheCompany’s U.S.-based qualified defined benefit pension plan, and certain of theCompany’s Canadian defined benefit plans, had a positive funded status totaling $41.4mil-lion at December 31, 2007.None of the Company’s other defined benefit plans were fullyfunded. The cumulative unfunded liability of these plans at December 31, 2007, totaled$132.3million.
Shareholders’ equity increased $222.5million during 2007. The increase resultedmainlyfrom net income of $214.2million in 2007, stock option exercises of $59.8million, a foreigncurrency translation gain of $95.4million, and defined benefit plan adjustments, net of tax, of$59.0million, offset by cash dividends of $102.7million, and the repurchase of $109.2millionof the Company’s common stock. Shareholders’ equity decreased $44.2million during 2006.
form 10-k | sonoco 2007 annual report 1 9

The decrease resultedmainly from net income of $195.1million in 2006, stock optionexercises of $82.7million, and a foreign currency translation gain of $37.2million, which weremore than offset by cash dividends of $94.7million, the repurchase of $82.7million of theCompany’s common stock, and a $181.4million adjustment, net of tax, from the initialapplication of FASB StatementNo. 158.
OnApril 19, 2006, the Company’s Board ofDirectors authorized the repurchase of up to5.0million shares of the Company’s common stock. The new authorization rescinded allprevious authorizations and does not have a specific expiration date. During 2007, theCompany purchased a total of 3.0million shares of its common stock under this author-ization at a total cost of $109.2million. The Board ofDirectors has approved the reinstate-ment of those shares to the original authorization. Accordingly, 5.0million shares remainavailable for purchase under this authorization at December 31, 2007. During 2006, theCompany repurchased 2.5million shares of Sonoco common stock for approximately $82.7million, under previously existing authorizations.
Although the ultimate determination of whether to pay dividends is within the sole dis-cretion of the Board ofDirectors, the Company plans to increase dividends as earnings grow.Dividends per common share were $1.02 in 2007, $.95 in 2006 and $.91 in 2005.On Febru-ary 6, 2008, the Company declared a regular quarterly dividend of $.26 per common sharepayable onMarch 10, 2008, to shareholders of record on February 22, 2008.
off-balance sheet arrangementsTheCompany had nomaterial off-balance sheet arrangements at December 31, 2007.
risk managementAs a result of operating globally, the Company is exposed to changes in foreign exchange
rates. The exposure is well diversified as the Company’s facilities are spread throughout theworld, and the Company generally sells in the same countries where it produces. TheCom-panymonitors these exposures andmay use traditional currency swaps and forward foreignexchange contracts to hedge a portion of the forecasted transactions that are denominated inforeign currencies, foreign currency assets and liabilities or net investment in foreign sub-sidiaries. TheCompany’s foreign operations are exposed to political and cultural risks, but therisks aremitigated by diversification and the relative stability of the countries in which theCompany has significant operations.
TheCompany is exposed to interest-rate fluctuations as a result of using debt as a sourceof financing operations.When necessary, the Company uses traditional, unleveraged interest-rate swaps tomanage its mix of fixed and variable rate debt tomaintain its exposure to inter-est ratemovements within established ranges. No such instruments were outstanding atDecember 31, 2007.
TheCompany is a purchaser of various inputs such as recovered paper, energy, steel,aluminum and resin. TheCompany does not engage in significant hedging activities, otherthan for energy, because there is usually a high correlation between the primary input costsand the ultimate selling price of its products. Inputs are generally purchased at market or fixed
prices that are established with the vendor as part of the purchase process for quantitiesexpected to be consumed in the ordinary course of business. On occasion, where the correla-tion between selling price and input price is less direct, the Companymay enter intoderivative contracts such as futures or swaps to reduce the effect of price fluctuations.
At the end of 2007, the Company had contracts outstanding to fix the costs of a portionof commodity, energy and foreign exchange risks for 2008 throughDecember 2010. Theswaps qualify as cash flow hedges under Statement of Financial Accounting StandardsNo. 133, ‘Accounting forDerivative Instruments andHedgingActivities’ (FAS 133). Ofthese, the Company had swaps to cover approximately 6.1millionMMBTUs of natural gas.The hedged natural gas quantities at this date represent approximately 69%, 44% and 19% ofanticipatedU.S. andCanadian usage for 2008, 2009 and 2010, respectively. The use ofderivatives to hedge other commodities or foreign exchange was notmaterial as of that date.
The fair market value of derivatives was a net unfavorable position of $2.4million ($1.5million after tax) at December 31, 2007, and a net unfavorable position of $3.2million ($2.1million after tax) at December 31, 2006. Derivatives aremarked to fair value using publishedmarket prices, if available, or estimated values based on current price quotes and a discountedcash flowmodel. SeeNote 9 to the Consolidated Financial Statements formore informationon financial instruments.
TheCompany is subject to various federal, state and local environmental laws and regu-lations concerning, among othermatters, solid waste disposal, wastewater effluent and airemissions. Although the costs of compliance have not been significant due to the nature ofthematerials and processes used inmanufacturing operations, such laws alsomake generatorsof hazardous wastes and their legal successors financially responsible for the cleanup of sitescontaminated by those wastes. TheCompany has been named a potentially responsible partyat several environmentally contaminated sites, both owned and not owned by the Company.These regulatory actions and a small number of private party lawsuits are believed to repre-sent the Company’s largest potential environmental liabilities. TheCompany has accrued$31.1million (including $29.0million associated withU.S.Mills) at December 31, 2007,compared with $15.3million at December 31, 2006 (including $11.7million associated withU.S.Mills), with respect to these sites. See “Other Special Charges, Income Items andCon-tingencies”, Item 3 – Legal Proceedings, andNote 13 to the Consolidated Financial State-ments formore information on environmental matters.
Results of Operations 2006 versus 2005Net income for 2006was $195.1million, comparedwith $161.9million in 2005. The year-
over-year increase is largely attributable to higher operating profits on improved productivityand increased selling prices.Gross profitmargin improved to 19.3%, comparedwith 18.7% in2005.Also contributing to the year-over-year net income improvementwas the net effect offewer special charges and the impact of additionalU.S. federal and state income taxes recordedin 2004 totaling $10.1million associatedwith the repatriation of $124.7million from foreignsubsidiaries under the provisions of theAmerican JobsCreationAct of 2004 (AJCA).
2 0

operating revenueConsolidated net sales for 2006 were $3.66 billion, a $128million, or 3.6%, increase over
2005.
The components of the sales change were:
($ in millions)
Volume $ 41Selling price 51Currency exchange rate 39Acquisitions (net of dispositions) (4)Other 1
Total sales increase $128
Prices were higher throughout the Company, with the exception of recovered paperoperations, as the Company was able to implement price increases to offset the impact ofhigher costs of labor, energy, freight andmaterials. Companywide volume, excluding servicecenter revenue, which was on a pass-through basis, increased slightly less than 1.0% from 2005levels driven by increases in the Tubes andCores/Paper andConsumer Packaging segments.Domestic sales were $2.3 billion, up 2.3% from 2005. International sales were $1.3 billion, up6.2% over 2005, driven primarily by the impact of currency translation.
costs and expensesIn 2006, defined-benefit pension and postretirement expense increased $1.1million to
$44.1million, versus $43.0million in 2005. The return on assets of U.S.-based defined-benefitplans was 13.9% in 2006 and 7.2% in 2005. TheCompany’s U.S.-based qualified defined-benefit pension plan had a positive funded status of $9million at December 31, 2006.Noneof the Company’s other defined-benefit plans were fully funded as of December 31, 2006.The cumulative unfunded liability of these plans at December 31, 2006, was $229million.TheCompany’s total expense under its defined-contribution plan was $1.2million in 2006and $0.4million in 2005.
On January 1, 2006, the Company implemented certain changes to its U.S.-based retireemedical benefits plan. These changes included the elimination of a Company subsidy towardthe cost of retireemedical benefits if certain age and service criteria were notmet, as well asthe elimination of Company-provided prescription drug benefits for themajority of its cur-rent retirees and all future retirees. These changes resulted in a reduction to the accumulatedpostretirement benefit obligation of $38million, which is being amortized over a period of4.6 years beginning in 2006. In addition, 2006 long-term disability expenses were favorablyimpacted by both a decrease in the number of employees receiving benefits and by a decreasein the amount of the average claim.
Selling, general and administrative expenses as a percentage of sales decreased to 9.8%during the year from 10.3% in 2005. Included in 2006 was an additional $4.1million of stock-
based compensation expense associated with the issuance of stock-settled stock appreciationrights. Expenses in 2005 included a $12.5millionU.S.Mills environmental charge.
Operating profits also reflect restructuring charges of $26.0million and $21.2million in2006 and 2005, respectively. These items are discussed inmore detail in the section titled,“RestructuringCharges, Unusual Items andOther Activities.”
Research and development costs, all of which were charged to expense, totaled $12.7mil-lion and $14.7million in 2006 and 2005, respectively.
Interest expense totaled $52.0million for the year endedDecember 31, 2006, comparedwith $51.6million in 2005. The slight increase in 2006, compared with 2005, was due tohigher average interest rates, substantially offset by lowerU.S. and international debt levels.Interest incomewas $6.6million in 2006, a decrease of $1.3million, from the $7.9millionreported in 2005. The decrease was primarily due to the Company’s repatriation of $124.7million of accumulated offshore cash inDecember 2005 under the AJCA and the sub-sequent use of the repatriated cash to lower domestic debt.
The effective tax rate for continuing operations in 2006 was 34.0%, compared with 36.4%in 2005. Included in the effective tax rate for 2006 was the impact of a $5.3million benefitassociated with entering into favorable tax agreements with state tax authorities and closingstate tax examinations for amounts less than originally anticipated. Partially offsetting this wasa $4.9million impact resulting from restructuring charges for which a tax benefit could notbe recognized. The 2005 effective tax rate reflects an additional $10.1million of income taxexpense associated with the repatriation of foreign earnings under the AJCA.
reporting segmentsConsolidated operating profits, also referred to as “Income before income taxes” on the
Consolidated Statements of Income, are comprised of the following:($ in millions) 2006 2005 %Change
Consumer Packaging segment $109.6 $103.5 5.9%Tubes andCores/Paper segment 148.2 107.0 38.4%Packaging Services segment 39.2 44.8 (12.6)%AllOther Sonoco 49.1 40.6 20.9%Restructuring and related impairment charges (26.0) (21.2) (22.3)%Interest expense, net (45.3) (43.6) (3.9)%
Consolidated operating profits $274.8 $231.1 18.9%
Consumer Packaging
($ in millions) 2006 2005 %Change
Trade sales $1,304.8 $1,247.5 4.6%Segment operating profits 109.6 103.5 5.9%Depreciation, depletion and amortization 55.1 56.3 (2.1)%Capital spending 48.2 50.8 (5.2)%
form 10-k | sonoco 2007 annual report 2 1

Sales in this segment increased due to higher selling prices for composite cans, plasticpackaging and closures, along with the impact of favorable exchange rates, as the dollar weak-ened against foreign currencies.Higher composite can volumewas partially offset by reducedvolume in flexible packaging and closures.Overall, volumes were up 1% in the segment.Domestic sales were approximately $925million, up 3.5% from 2005, and international saleswere approximately $380million, up 7.4% from 2005.
Segment operating profits were favorably impacted by productivity and purchasing ini-tiatives, while selling price increases were partially offset by increased costs of energy, freight,material and labor. Continued high startup costs at the Company’s rigid plastics containerplant inWisconsin also dampened operating profits in the segment, as did operational issuesand the loss of a customer at the closures plant in Brazil.
Significant capital spending included numerous productivity and customer developmentprojects in theUnited States and Europe.
Tubes and Cores/Paper($ in millions) 2006 2005 %Change
Trade sales $1,525.6 $1,482.1 2.9%Segment operating profits 148.2 107.1 38.4%Depreciation, depletion and amortization 85.9 83.7 2.5%Capital spending 63.3 62.3 1.6%
The increase in sales was due to increased selling prices and volume inNorthAmericanpaper operations andAsia. The effect of favorable exchange rates also increased sales. Lowertube and core volume inmost geographic segments partially offset these favorable factors.Overall volume in the segment, including the impact of acquisitions, increased by approx-imately 1%. Domestic sales increased approximately $15million, or 1.9%, to $772.6millionand international sales increased approximately $29million, or 4.0%, to $753.0million.
Segment operating profits increased due to productivity and purchasing initiatives alongwith higher selling prices, which offset increases in the costs of energy, freight, material andlabor. Results in 2005 were impacted by a charge of $12.5million related to an environmentalclaim at U.S.Mills’ paper operations inWisconsin. See “Other Special Charges, IncomeItems andContingencies” for a discussion of this claim. In addition, 2005 results included a$3.0million non-restructuring asset impairment charge related to operations in Asia.
Significant capital spending included themodification of several papermachines, primar-ily in theUnited States,Mexico and Europe, and building of new tube and core plants in Asia.
Packaging Services
($ in millions) 2006 2005 %Change
Trade sales $456.8 $455.9 0.2%Segment operating profits 39.2 44.8 (12.6)%Depreciation, depletion and amortization 11.9 12.0 (0.4)%Capital spending 3.4 4.9 (30.0)%
Sales in this segment were flat due to theDecember 2005 divestiture of a single-plantfolding carton operation.Higher volumes and selling prices in the service centers more thanoffset lower volumes in point-of-purchase and fulfillment operations. Domestic salesdecreased to $344.9million, a 3.3% decrease, while international sales increased to $111.9mil-lion, up 12.8%, primarily as a result of a new service center in Poland increasing output.
The decrease in segment operating profits is attributable to unfavorable changes in themix of business and the impact of a $2.4million gain on the sale of a carton facility in 2005.The service centers’ sales increase had very little impact on profits, as these sales were on apass-through basis with no significant additional grossmargin. Productivity and purchasinginitiatives partially offset the unfavorable factors discussed above.
Capital spending included numerous productivity and customer development projects intheUnited States and Europe.
All Other Sonoco
($ in millions) 2006 2005 %Change
Trade sales $369.7 $343.2 7.7%Operating profits 49.1 40.6 20.9%Depreciation, depletion and amortization 12.0 11.1 8.3%Capital spending 8.4 11.1 (24.2)%
Sales for AllOther Sonoco increased due to price increases within each line of business,along with higher volumes in wire and cable reels and protective packaging. Domestic saleswere $300.5million, up 6.3% from 2005, and international sales were $69.2million, anincrease of 14.3%.
Operating profits in AllOther Sonoco increased due primarily tomanufacturing pro-ductivity and purchasing initiatives. TheCompany was able to recover increases in rawmaterial costs, energy, freight and labor through higher selling prices. Although higher vol-ume was a significant reason for the increased sales, operating profits did not benefit aschanges in themix of products resulted in lower profit margins.
2 2

Capital spending included investing in customer development projects in theUnited StatesandEurope formolded and extruded plastics, protective packaging andwire and cable reels.
Critical Accounting Policies and EstimatesManagement’s analysis and discussion of the Company’s financial condition and results of
operations are based upon theCompany’s Consolidated Financial Statements, which havebeen prepared in accordance with accounting principles generally accepted in theUnitedStates (USGAAP). The preparation of financial statements in conformity withUSGAAPrequiresmanagement tomake estimates and assumptions that affect the reported amountsof assets, liabilities, revenues and expenses, and the disclosure of contingent assets andliabilities. TheCompany evaluates these estimates and assumptions on an ongoing basis,including but not limited to those related to inventories, bad debts, derivatives, income taxes,intangible assets, restructuring, pension and other postretirement benefits, environmentalliabilities and contingencies and litigation. Estimates and assumptions are based on historicaland other factors believed to be reasonable under the circumstances. The results of theseestimates may form the basis of the carrying value of certain assets and liabilities andmay notbe readily apparent from other sources. Actual results, under conditions and circumstancesdifferent from those assumed, may differ from estimates. The impact of and any associatedrisks related to estimates, assumptions and accounting policies are discussed inManage-ment’s Discussion andAnalysis of Financial Condition and Results ofOperations, as well asin theNotes to the Consolidated Financial Statements, if applicable, where such estimates,assumptions and accounting policies affect the Company’s reported and expected financialresults.
TheCompany believes the accounting policies discussed in theNotes to the Con-solidated Financial Statements included in Item 8 of this Annual Report on Form 10-K arecritical to understanding the results of its operations. The following discussion representsthose policies that involve themore significant judgments and estimates used in the prepara-tion of the Company’s Consolidated Financial Statements.
impairment of long-lived, intangible and other assetsAssumptions and estimates used in the evaluation of potential impairmentmay affect the
carrying values of long-lived, intangible and other assets and possible impairment expense inthe Company’s Consolidated Financial Statements. TheCompany evaluates its long-livedassets (property, plant and equipment), definite- lived intangible assets and other assets(including notes receivable and preferred stock) for impairment whenever indicators ofimpairment exist, or when it commits to sell the asset. If the sum of the undiscountedexpected future cash flows from a long-lived asset or definite-lived intangible asset is less thanthe carrying value of that asset, an asset impairment charge is recognized. The amount of theimpairment charge is calculated as the excess of the asset’s carrying value over its fair value,which generally represents the discounted future cash flows from that asset, or in the case of
assets the Company evaluates for sale, at fair value less costs to sell. A number of significantassumptions and estimates are involved in developing operating cash flow forecasts for theCompany’s discounted cash flowmodel, includingmarkets andmarket share, sales volumesand prices, costs to produce, working capital changes and capital spending requirements. TheCompany considers historical experience, and all available information at the time the fairvalues of its assets are estimated. However, fair values that could be realized in an actual trans-actionmay differ from those used to evaluate impairment. In addition, changes in theassumptions and estimates may result in a different conclusion regarding impairment.
TheCompany has a long-term note receivable from and preferred equity interest inHilex PolyCo., LLC resulting from the sale its high density film business toHilex in 2003.The combined carrying value of these items at December 31, 2007, was $42.7million. TheCompany’s assumptions and outlook forHilex at December 31, 2007, indicated that theseitems were neither doubtful of collection nor impaired.However, Hilex is a highly leveragedentity operating in a very competitivemarket and its primary products, made from high den-sity polyethylene film, are under increasing environmental scrutiny. Different assumptionsregarding the outlook for theHilex business may result in an impairment or reserve for col-lectibility/recoverability in future periods.
impairment of goodwillIn accordance with Statement of Financial Accounting StandardsNo. 142, ‘Goodwill
andOther Intangible Assets’ (FAS 142), the Company evaluates its goodwill for impairmentat least annually, andmore frequently if indicators of impairment are present. Under FAS142, if the carrying value of a reporting unit’s goodwill exceeds the implied fair value of thatgoodwill, an impairment charge is recognized for the excess.
TheCompany’s reporting units are one level below its reporting segments, as determinedin accordance with FAS 131.
TheCompany uses a discounted cash flowmodel to estimate the fair value of each report-ing unit. TheCompany considers historical experience and all available information at thetime the fair values of its businesses are estimated. Key assumptions and estimates used in thecash flowmodel include discount rate, sales growth, margins and capital expenditures andworking capital requirements. Fair values that could be realized in an actual transactionmaydiffer from those used to evaluate the impairment of goodwill. In addition, changes in theassumptions and estimates may result in a different conclusion regarding impairment.
The annual evaluation of goodwill impairment that was completed during 2007 usedforward-looking projections, including expected improvement in the results of certain reportingunits,most notably, the flexible packaging operationswithin theConsumerPackaging segment.The goodwill associatedwith the Flexible Packaging business totaled approximately $96millionatDecember 31, 2007. If actual performance in this reporting unit falls significantly short of theprojected results, or the assessment of the relevant facts and circumstances changes, it is reason-ably possible that a non-cash impairment chargewould be required.
form 10-k | sonoco 2007 annual report 2 3

income taxesTheCompany records an income tax valuation allowance when the realization of any
deferred tax assets, net operating losses and capital loss carryforwards is not likely. Deferredtax assets generally represent expenses recognized for financial reporting purposes, which willresult in tax deductions over varying future periods. Certain judgments, assumptions andestimates may affect the amounts of the valuation allowance and deferred income taxexpense in the Company’s Consolidated Financial Statements.
For those tax positions where it is more likely than not that a tax benefit will be sustained,the Company has recorded the largest amount of tax benefit with a greater than 50% like-lihood of being realized upon ultimate settlement with a taxing authority having full knowl-edge of all relevant information. For those positions notmeeting themore-likely-than-notstandard, no tax benefit has been recognized in the financial statements.Where applicable,associated interest has also been recognized.
stock compensation plansTheCompany utilizes share-based compensation in the form of stock options, stock
appreciation rights and restricted stock units. Certain awards are in the form of contingentstock units where both the ultimate number of units and the vesting period are performancebased. The amount and timing of compensation expense associated with these performance-based awards are based on estimates regarding future performance usingmeasures defined inthe plan. In 2007, the performancemeasures consisted of Earnings per Share and Return onNet Assets Employed. Changes in estimates regarding the future achievement of these per-formancemeasures may result in significant fluctuations from period to period in the amountof compensation expense reflected in the Company’s Consolidated Financial Statements.
TheCompany uses a binomial option-pricingmodel to determine the grant date fair valueof its stock options and stock appreciation rights. The binomial option-pricingmodel requiresthe input of subjective assumptions.Management routinely assesses the assumptions andmethodologies used to calculate estimated fair value of share-based compensation.Circum-stancesmay change and additional datamay become available over time that result in changes tothese assumptions andmethodologies, which couldmaterially impact fair value determinations.
pension and postretirement benefit plansTheCompany has significant pension and postretirement benefit costs that are devel-
oped from actuarial valuations. The actuarial valuations employ key assumptions, which areparticularly important when determining the Company’s projected liabilities for pension andother postretirement benefits. The key actuarial assumptions used at December 31, 2007, indetermining the projected benefit obligation and the accumulated benefit obligation forU.S.retirement and retiree health and life insurance plans include: a discount rate of 6.40%, 6.27%and 6.11% for the qualified retirement plan, non-qualified retirement plans, and retiree healthand life insurance plan, respectively; an expected long-term rate of return on plan assets of8.5%; and a rate of compensation increase ranging from 4.57% to 4.77%. Discount rates of5.84%, 5.77% and 5.68%were used to determine net periodic benefit cost for 2007 for the
qualified retirement plan, non-qualified retirement plans, and retiree health and life insuranceplan, respectively.
TheCompany adjusts its discount rates at the endof each fiscal year based on yield curves ofhigh-quality debt instruments over durations thatmatch the expected benefit payouts of eachplan. The long-term rate of return assumption is based on theCompany’s historical plan returnperformance and a range of probable return outcomes given the targeted asset class weights ofthe portfolios. The rate of compensation increase assumption is generally based on salary andincentive increases. A key assumption for theU.S. retiree health and life insurance plan is amedical trend rate beginning at 11.3% for post-age 65 participants and trending down to anultimate rate of 6.0% in 2014. The ultimate trend rate of 6.0% represents theCompany’s bestestimate of the long-term average annualmedical cost increase over the duration of the plan’sliabilities. It provides for real growth inmedical costs in excess of the overall inflation level.
During 2007, the Company incurred total pension and postretirement benefit expensesof approximately $34.2million, compared with $44.1million during 2006. The 2007 amountis net of $91.3million of expected returns on plan assets at the assumed rate of 8.5%, andincludes interest cost of $75.4million at a weighted-average discount rate of 5.63%. The 2006amount is net of $83.6million of expected returns on plan assets at the assumed rate of 8.5%,and includes interest cost of $69.5million at a discount rate of 5.50%. During 2007, theCompanymade contributions to pension plans of $15.1million and postretirement plans ofapproximately $1.5million. The contribution amount varies from year to year depending onfactors including asset market value volatility and interest rates. Although these contributionsreduced cash flows from operations during the year, under Statement of Financial Account-ing StandardsNo. 87, ‘Employers’ Accounting for Pensions’ (FAS 87), they did not have animmediate significant impact on pension expense. Cumulative net actuarial losses wereapproximately $294.5million at December 31, 2007, and are primarily the result of poor assetperformance during 2000 through 2002. The amortization period for losses/gains is approx-imately 11 years for the portion outside the 10% corridor as defined by FAS 87, except forcurtailments, which would result in accelerated expense.
Other assumptions and estimates impacting the projected liabilities of these plans includeinflation, participantwithdrawal andmortality rates and retirement ages. TheCompany annuallyreevaluates assumptions used in projecting the pension and postretirement liabilities and asso-ciated expense. These judgments, assumptions and estimatesmay affect the carrying value ofpension and postretirement plan net assets and liabilities and pension and postretirement planexpenses in theCompany’sConsolidatedFinancial Statements. The sensitivity to changes in thecritical assumptions for theCompany’sU.S. plans as ofDecember 31, 2007 is as follows:
Assumption($ in millions)
Percentage PointChange
Projected BenefitObligation
Higher/(Lower)Annual ExpenseHigher/(Lower)
Discount rate -.25 pts $24.7 $3.3Expected return on assets -.25 pts N/A $2.1
2 4

SeeNote 11 to the Consolidated Financial Statements for additional information on theCompany’s pension and postretirement plans.
Recent Accounting PronouncementsInformation regarding recent accounting pronouncements is provided inNote 17 of the
Consolidated Financial Statements included in Item 8 of this Annual Report on Form 10-K.
Item 7A. Quantitative and Qualitative Disclosures about Market RiskInformation regardingmarket risk is provided in this Annual Report on Form 10-K
under the following items and captions: “Conditions in foreign countries where the Com-pany operatesmay reduce earnings” and “Foreign exchange rate fluctuationsmay reduce theCompany’s earnings” in Item 1A–Risk Factors; “RiskManagement” in Item 7 –Manage-ment’s Discussion andAnalysis of Financial Condition and Results ofOperations; and inNote 9 to the Consolidated Financial Statements in Item 8 – Financial Statements andSupplementaryData.
Item 8. Financial Statements and Supplementary DataTheConsolidated Financial Statements andNotes to the Consolidated Financial State-
ments are provided on pages F-1 through F-30 of this report. Selected quarterly financial datais provided inNote 18 to the Consolidated Financial Statements included in this AnnualReport on Form 10-K.
form 10-k | sonoco 2007 annual report 2 5

report of independent registered public accounting firm
To the Shareholders and Directors of Sonoco Products Company:In our opinion, the consolidated financial statements listed in the index appearing under
Item 15(a)(1) present fairly, in all material respects, the financial position of Sonoco ProductsCompany and its subsidiaries at December 31, 2007 and 2006, and the results of their oper-ations and their cash flows for each of the three years in the period endedDecember 31, 2007in conformity with accounting principles generally accepted in theUnited States of America.Also in our opinion, the Companymaintained, in all material respects, effective internal con-trol over financial reporting as of December 31, 2007, based on criteria established in InternalControl – Integrated Framework issued by the Committee of SponsoringOrganizations ofthe TreadwayCommission (COSO). TheCompany’s management is responsible for thesefinancial statements, formaintaining effective internal control over financial reporting and forits assessment of the effectiveness of internal control over financial reporting, included inManagement’s Report on Internal ControlOver Financial Reporting appearing underItem 9A.Our responsibility is to express opinions on these financial statements and on theCompany's internal control over financial reporting based on our integrated audits.Weconducted our audits in accordance with the standards of the Public CompanyAccountingOversight Board (United States). Those standards require that we plan and perform theaudits to obtain reasonable assurance about whether the financial statements are free ofmaterial misstatement and whether effective internal control over financial reporting wasmaintained in all material respects. Our audits of the financial statements included examining,on a test basis, evidence supporting the amounts and disclosures in the financial statements,assessing the accounting principles used and significant estimates made bymanagement, andevaluating the overall financial statement presentation. Our audit of internal control overfinancial reporting included obtaining an understanding of internal control over financialreporting, assessing the risk that a material weakness exists, and testing and evaluating thedesign and operating effectiveness of internal control based on the assessed risk. Our auditsalso included performing such other procedures as we considered necessary in the circum-stances.We believe that our audits provide a reasonable basis for our opinions.
A company’s internal control over financial reporting is a process designed to providereasonable assurance regarding the reliability of financial reporting and the preparation offinancial statements for external purposes in accordance with generally accepted accountingprinciples. A company’s internal control over financial reporting includes those policies andprocedures that (i) pertain to themaintenance of records that, in reasonable detail, accuratelyand fairly reflect the transactions and dispositions of the assets of the company; (ii) providereasonable assurance that transactions are recorded as necessary to permit preparation offinancial statements in accordance with generally accepted accounting principles, and thatreceipts and expenditures of the company are beingmade only in accordance with author-izations of management and directors of the company; and (iii) provide reasonable assuranceregarding prevention or timely detection of unauthorized acquisition, use, or disposition ofthe company’s assets that could have amaterial effect on the financial statements.
Because of its inherent limitations, internal control over financial reportingmay not pre-vent or detectmisstatements. Also, projections of any evaluation of effectiveness to futureperiods are subject to the risk that controlsmay become inadequate because of changes inconditions, or that the degree of compliance with the policies or proceduresmay deteriorate.
Charlotte, NorthCarolinaFebruary 28, 2008
sonoco 2007 annual report F - 1

consolidated balance sheetsSonoco Products Company and consolidated subsidiaries
(Dollars and shares in thousands)At December 31 2007 2006
Assets
CurrentAssetsCash and cash equivalents $ 70,758 $ 86,498Trade accounts receivable, net of allowances of $9,519 in 2007 and $8,983 in 2006 488,409 459,022Other receivables 34,328 33,287Inventories
Finished and in process 138,722 126,067Materials and supplies 204,362 177,781
Prepaid expenses 50,747 27,611Deferred income taxes 40,353 32,532
1,027,679 942,798Property, Plant andEquipment,Net 1,105,342 1,019,594Goodwill 828,348 667,288Other IntangibleAssets,Net 139,436 95,885OtherAssets 239,438 191,113
Total Assets $3,340,243 $2,916,678
Liabilities and Shareholders’ Equity
Current LiabilitiesPayable to suppliers $ 426,138 $ 357,856Accrued expenses and other 206,711 179,462Accrued wages and other compensation 68,422 63,925Notes payable and current portion of long-term debt 45,199 51,903Accrued taxes 11,611 6,678
758,081 659,824Long-termDebt 804,339 712,089Pension andOther PostretirementBenefits 180,509 209,363Deferred IncomeTaxes 84,977 52,809Other Liabilities 70,800 63,525Commitments andContingenciesShareholders’ Equity
Serial preferred stock, no par valueAuthorized 30,000 shares0 shares issued and outstanding as of December 31, 2007 and 2006
Common shares, no par valueAuthorized 300,000 shares99,431 and 100,550 shares issued and outstanding at December 31, 2007 and 2006, respectively 7,175 7,175
Capital in excess of stated value 391,628 430,002Accumulated other comprehensive loss (107,374) (262,305)Retained earnings 1,150,108 1,044,196
Total Shareholders’ Equity 1,441,537 1,219,068
Total Liabilities and Shareholders’ Equity $3,340,243 $2,916,678
The Notes beginning on page F-6 are an integral part of these financial statements.
F - 2

consolidated statements of incomeSonoco Products Company and consolidated subsidiaries
(Dollars and shares in thousands except per share data)Years endedDecember 31 2007 2006 2005
Net sales $4,039,992 $3,656,839 $3,528,574Cost of sales 3,286,198 2,951,799 2,867,623Selling, general and administrative expenses 409,719 358,952 364,967Restructuring/Asset impairment charges 36,191 25,970 21,237
Income before interest and income taxes 307,884 320,118 274,747Interest expense 61,440 51,952 51,559Interest income (9,182) (6,642) (7,938)
Income before income taxes 255,626 274,808 231,126Provision for income taxes 55,186 93,329 84,174
Income before equity in earnings of affiliates/minority interest in subsidiaries 200,440 181,479 146,952Equity in earnings of affiliates/minority interest in subsidiaries, net of tax 13,716 13,602 14,925
Net income $ 214,156 $ 195,081 $ 161,877
Weighted average common shares outstanding:Basic 100,632 100,073 99,336Assuming exercise of awards 1,243 1,461 1,082Diluted 101,875 101,534 100,418
Per common shareNet income:
Basic $ 2.13 $ 1.95 $ 1.63Diluted $ 2.10 $ 1.92 $ 1.61
Cash dividends – common $ 1.02 $ .95 $ .91
The Notes beginning on page F-6 are an integral part of these financial statements.
sonoco 2007 annual report F - 3

consolidated statements of changes in shareholders’ equitySonoco Products Company and consolidated subsidiaries
(Dollars and shares in thousands)Comprehensive
Income
Common SharesCapital inExcess of
Stated Value
AccumulatedOther
ComprehensiveLoss
RetainedEarningsOutstanding Amount
January 1, 2005 98,500 $ 7,175 $ 376,750 $ (103,155) $ 872,109Net income $ 161,877 161,877
Other comprehensive income (loss):Translation loss (12,844)Minimum pension liability adjustment, net of tax 568Derivative financial instruments, net of tax 9,042
Other comprehensive loss (3,234) (3,234)
Comprehensive income $ 158,643
Cash dividends (90,126)Issuance of stock awards 1,488 37,370Stock-based compensation 4,548
December 31, 2005 99,988 $ 7,175 $ 418,668 $ (106,389) $ 943,860Net income $ 195,081 195,081
Other comprehensive income (loss):Translation gain 37,203Minimum pension liability adjustment, net of tax 1,517Derivative financial instruments, net of tax (13,240)
Other comprehensive income 25,480 25,480
Comprehensive income $ 220,561
Adjustment to initially apply FASB StatementNo. 158, net of tax (181,396)Cash dividends (94,745)Issuance of stock awards 3,062 82,655Shares repurchased (2,500) (82,668)Stock-based compensation 11,347
December 31, 2006 100,550 $ 7,175 $ 430,002 $ (262,305) $ 1,044,196Net income $214,156 214,156
Other comprehensive income:Translation gain 95,449Defined benefit plan adjustment, net of tax 58,958Derivative financial instruments, net of tax 524
Other comprehensive income 154,931 154,931
Comprehensive income $369,087
Cash dividends (102,658)Adjustment to initially apply FASB InterpretationNo. 48 (5,586)Issuance of stock awards 1,881 59,832Shares repurchased (3,000) (109,206)Stock-based compensation 11,000
December 31, 2007 99,431 $7,175 $391,628 $(107,374) $1,150,108
The Notes beginning on page F-6 are an integral part of these financial statements.
F - 4

consolidated statements of cash flowsSonoco Products Company and consolidated subsidiaries
(Dollars in thousands)Years endedDecember 31 2007 2006 2005
Cash Flows fromOperatingActivitiesNet income $ 214,156 $ 195,081 $ 161,877Adjustments to reconcile net income to net cash provided by operating activities
Asset impairment 16,684 7,750 9,515Depreciation, depletion and amortization 181,339 164,863 163,074Environmental charges 25,150 — 12,500Non-cash share-based compensation expense 11,000 11,347 4,548Equity in earnings of affiliates/minority interest in subsidiaries (13,716) (13,602) (14,925)Cash dividends from affiliated companies 8,435 9,496 6,758Gain on disposition of assets (838) (4,644) (555)Tax effect of nonqualified stock options 9,538 10,580 2,753Excess tax benefit of share-based compensation (9,317) (10,580) —Deferred taxes (31,940) (15,265) (24,722)Change in assets and liabilities, net of effects from acquisitions, dispositions, and foreign currency adjustments
Receivables 20,169 (9,356) (24,026)Inventories (9,259) 33,159 (6,447)Prepaid expenses (1,304) 6,412 2,298Payables and deferred expenses 69,781 70,376 731Cash contribution to pension plans (11,647) (10,471) (77,024)Prepaid income taxes and taxes payable (26,258) (1,985) (9,110)Other assets and liabilities (6,837) 39,402 20,118
Net cash provided by operating activities 445,136 482,563 227,363Cash Flows from Investing ActivitiesPurchase of property, plant and equipment (169,444) (123,279) (129,112)Cost of acquisitions, net of cash acquired (236,263) (227,304) (3,566)Proceeds from the sale of assets 23,417 21,030 13,377Investment in affiliates and other 2,652 (2,500) —
Net cash used by investing activities (379,638) (332,053) (119,301)Cash Flows fromFinancingActivitiesProceeds from issuance of debt 39,041 33,535 43,859Principal repayment of debt (40,364) (116,182) (11,699)Net increase (decrease) in commercial paper borrowings 80,000 59,000 (150,000)Net (decrease) increase in bank overdrafts (798) (9,614) 7,765Cash dividends – common (102,658) (94,745) (90,126)Excess tax benefit of share-based compensation 9,317 10,580 —Shares acquired (109,206) (82,668) —Common shares issued 49,698 74,413 34,617
Net cash used by financing activities (74,970) (125,681) (165,584)Effects of ExchangeRateChanges onCash (6,268) 2,061 (595)
Increase (Decrease) inCash andCash Equivalents (15,740) 26,890 (58,117)Cash and cash equivalents at beginning of year 86,498 59,608 117,725
Cash and cash equivalents at end of year $ 70,758 $ 86,498 $ 59,608
Supplemental Cash FlowDisclosuresInterest paid, net of amounts capitalized $ 50,401 $ 41,377 $ 46,650Income taxes paid, net of refunds $ 103,846 $ 99,999 $ 115,253
Prior year data has been reclassified to conform to the current presentation.The Notes beginning on page F-6 are an integral part of these financial statements.
sonoco 2007 annual report F - 5

notes to the consolidated financial statements(dollars in thousands except per share data)
The following notes are an integral part of the Consolidated Financial Statements. Theaccounting principles followed by the Company appear in bold type.
1. Basis of PresentationTheConsolidated Financial Statements include the accounts of SonocoProducts
Company and itsmajority-owned subsidiaries (the “Company” or “Sonoco”) after
elimination of intercompany accounts and transactions. Investments in affiliated
companies in which theCompany shares control over the financial and operating deci-
sions, but in which theCompany is not the primary beneficiary are accounted for as
equity investments (“equity investments”). Income applicable to equity investments is
reflected as “Equity in earnings of affiliates/minority interest in subsidiaries” in the
Consolidated Statements of Income. Investments related to equity in affiliates are includedin “Other Assets” in the Company’s Consolidated Balance Sheets and totaled $107,207 and$102,851 at December 31, 2007 and 2006, respectively.
Investments in affiliated companies in which the Company is not the primary beneficiaryare accounted for by the equitymethod of accounting and at December 31, 2007, included:
Entity
Ownership InterestPercentage at
December 31, 2007
RTSPackaging JVCO 35.0%Cascades Conversion, Inc. 50.0%Cascades Sonoco, Inc. 50.0%1191268Ontario, Inc. 50.0%Showa Products Company Ltd. 20.0%Conitex SonocoHolding BVI Ltd. 30.0%
Formost of 2007, the Company accounted for its 48.9% ownership interest in AT-SpiralOy (ATS) by the equitymethod. TheCompany acquired the remaining 51.1% ownershipinterest in ATS inNovember 2007; accordingly, it is no longer accounted for under theequitymethod. Formore information, seeNote 2.
Formost of 2006, the Company accounted for its 25% ownership interest inDemolliIndustria Cartaria S.p.A (Demolli) by the equitymethod. TheCompany acquired theremaining 75% ownership interest inDemolli in December 2006; accordingly, it is no longeraccounted for under the equitymethod. Formore information, seeNote 2.
As a result of the 2003 sale of theHighDensity Film business toHilex PolyCo., LLC(Hilex), the Company has a $29,100 note receivable, due in 2013, and a $13,600 non-votingpreferredmembership interest inHilex, including accrued interest and cumulative unpaiddividends, respectively. The note receivable is included in “Other Assets” in the Company’s
Consolidated Balance Sheets. The preferredmembership interest is accounted for by thecostmethod.
The preparation of financial statements in conformity with accounting principles
generally accepted in theUnited States ofAmerica (USGAAP) requiresmanagement
tomake estimates and assumptions that affect the reported amount of assets and
liabilities at the date of the financial statements and the reported amounts of revenues
and expenses during the reporting period.Actual results could differ from those esti-
mates.
In accordancewithUSGAAP, theCompany records revenuewhen title and risk of
ownership pass to the customer, andwhen persuasive evidence of an arrangement exists,
delivery has occurred or services have been rendered, the sales price to the customer is
fixed or determinable andwhen collectibility is reasonably assured.Certain judgments,
such as provisions for estimates of sales returns and allowances, may affect the applica-
tion of theCompany’s revenue policy and, therefore, the results of operations in its
Consolidated Financial Statements. Shipping and handling expenses are included in
“Cost of sales,” and freight charged to customers is included in “Net sales” in the
Company’s Consolidated Statements of Income.
TheCompany’s trade accounts receivable are non-interest bearing and are recorded
at the invoiced amounts. The allowance for doubtful accounts represents theCompany’s
best estimate of the amount of probable credit losses in existing accounts receivable.
Provisions aremade to the allowance for doubtful accounts at such time that collection
of all or part of a trade account receivable is in question. The allowance for doubtful
accounts ismonitored on a regular basis and adjustments aremade as needed to ensure
that the account properly reflects theCompany’s best estimate of uncollectible trade
accounts receivable. Trade accounts receivable balances that aremore than 180 days past
due are generally 100%provided for in the allowance for doubtful accounts. Account
balances are charged off against the allowance for doubtful accounts when theCompany
determines that the receivable will not be recovered.One of theCompany’s customersrepresented a concentration of credit of approximately 10% of the consolidated tradeaccounts receivable at December 31, 2007 and 2006. Sales to this customer representedapproximately 12% of theCompany’s consolidated revenues in 2007 and 2006; no othersingle customer comprisedmore than 5% of theCompany’s consolidated revenues in 2007,2006 or 2005.
TheCompany identifies its reportable segments in accordancewith Statement of
Financial Accounting StandardsNo. 131, ‘Disclosures about Segments of an Enterprise
andRelated Information’, based on the level of detail reviewed by the chief operating
decisionmaker, gross profitmargins, nature of products sold, nature of the production
F - 6

processes, type and class of customer,methods used to distribute products and nature of
the regulatory environment.Of these factors, the Company believes that themost sig-nificant are the nature of its products and the type of customers served.
Research and development costs are charged to expense as incurred and include sal-
aries and other directly related expenses.Research and development costs totaling $15,614in 2007, $12,735 in 2006 and $14,668 in 2005, are included in “Selling, general and admin-istrative expenses” in the Company’s Consolidated Statements of Income.
2. Acquisitions/Dispositions/Joint VenturesTheCompany completed four acquisitions during 2007, and purchased the remaining
51.1% interest of its AT-SpiralOy joint venture, a Europeanmanufacturer of tubes and cores,at an aggregate cost of $236,263, all of which was paid in cash. In connection with theseacquisitions, the Company recorded fair value of identified intangibles totaling $49,565,goodwill of $126,856 (none of which is expected to be tax deductible) and other net tangibleassets of $59,842. Acquisitions in the Consumer Packaging segment includedMatrix Pack-aging, Inc., a manufacturer of custom- designed blowmolded rigid plastic containers andinjectionmolded products with operations in theUnited States andCanada, and the fiberand plastic container business of Caraustar Industries, Inc. in theUnited States. Additionalacquisitions in 2007 consisted of a small tube and core business inMexico, which is includedin the Tubes andCores/Paper segment, and a small protective packaging business in theUnited States, which is included inAllOther Sonoco. As these acquisitions were notmaterial to the Company’s financial statements individually or in the aggregate, pro formaresults have not been provided.
TheCompany completed six acquisitions during 2006, and purchased the remaining35.5%minority interest in Sonoco-Alcore S.a.r.l. (Sonoco-Alcore), a European tube, core andcoreboard joint venture formed in 2004, at an aggregate cost of $227,304, all of which waspaid in cash. In connection with these acquisitions, the Company recorded fair value ofidentified intangibles of approximately $27,800, goodwill of approximately $83,400 (of whichapproximately $23,500 is expected to be tax deductible), and other net tangible assets ofapproximately $116,100. Acquisitions in the Company’s Tubes andCores/Paper segmentincluded the remaining 75% interest inDemolli Industria Cartaria S.p.A, an Italy-basedmanufacturer of tubes, cores and paperboard and a small tube and coremanufacturer inCanada. Acquisitions in the Consumer Packaging segment included a rotogravure printedflexible packagingmanufacturer in Texas; a rigid paperboard composite containermanu-facturer inOhio; andClear PackCompany, a manufacturer of thermoformed and extrudedplasticmaterials and containers in Illinois. TheCompany also acquired a small packaging ful-fillment business in Illinois, which is included in the Packaging Services segment.
TheCompany completed three acquisitions during 2005 with an aggregate cost of$3,566 in cash. In connection with these acquisitions, the Company recorded fair value ofidentified intangibles of $25, goodwill of $1,081 and other net tangible assets of $2,460.Acquisitions in the Company’s Tubes andCores/Paper segment included a tube and core
manufacturer inNewZealand, a small molded plug recycler in theUnited States and theremaining ownership interest in a Chilean tube and core business. TheCompany alsoacquired certain assets of a rigid plastic packagingmanufacturer in Brazil, which is reported inthe Consumer Packaging segment.
InDecember 2005, the Company divested its single-plant folding cartons business forproceeds of $11,000. This transaction resulted in a gain of $2,417 ($1,634 after tax). Theresults of this business unit were immaterial to the Company’s consolidated net income, forall periods presented.3. Restructuring and Asset Impairment
TheCompany accounts for restructuring charges in accordancewith Statement of
Financial Accounting StandardsNo. 146, ‘Accounting forCostsAssociatedwith Exit or
Disposal Activities’ (FAS 146), whereby the liability is recognizedwhen exit costs are
incurred. If assets become impaired as a result of a restructuring action, the assets are writtendown to the lower of carrying amount or fair value, less estimated costs to sell, if applicable. Anumber of significant estimates and assumptions are involved in the determination of fairvalue. TheCompany considers historical experience and all available information at the timethe estimates aremade; however, the amounts that are ultimately realized upon the sale of thedivested assets may differ from the estimated fair values reflected in the Company’s Con-solidated Financial Statements.
TheCompany has two active restructuring plans, one of which was approved inOctober2006 (the 2006 Plan), and the other in August 2003 (the 2003 Plan). In addition, during thethird and fourth quarters of 2007, the Company recognized additional restructuring andasset impairment charges associated with the closures of several facilities, which were not partof a formal restructuring plan. During the years endedDecember 31, 2007, 2006 and 2005,the Company recognized total restructuring and asset impairment charges, net of adjust-ments, of:
Year EndedDecember 31,
2007December 31,
2006December 31,
2005
Restructuring $ 19,507 $18,220 $14,722Asset impairment 16,684 7,750 6,515
Total 36,191 25,970 21,237Income tax benefit (10,835) (4,640) (6,894)
Restructuring/Asset impairment charges,net of adjustments (after tax) $ 25,356 $21,330 $14,343
Restructuring and asset impairment charges are included in “Restructuring/Asset impair-ment charges” in the Consolidated Statements of Incomewith the exception of the follow-ing: restructuring charges applicable to equitymethod investments, which are included in“Equity in earnings of affiliates/minority interest in subsidiaries, net of tax;” and a 2005 asset
form 10-k | sonoco 2007 annual report F - 7
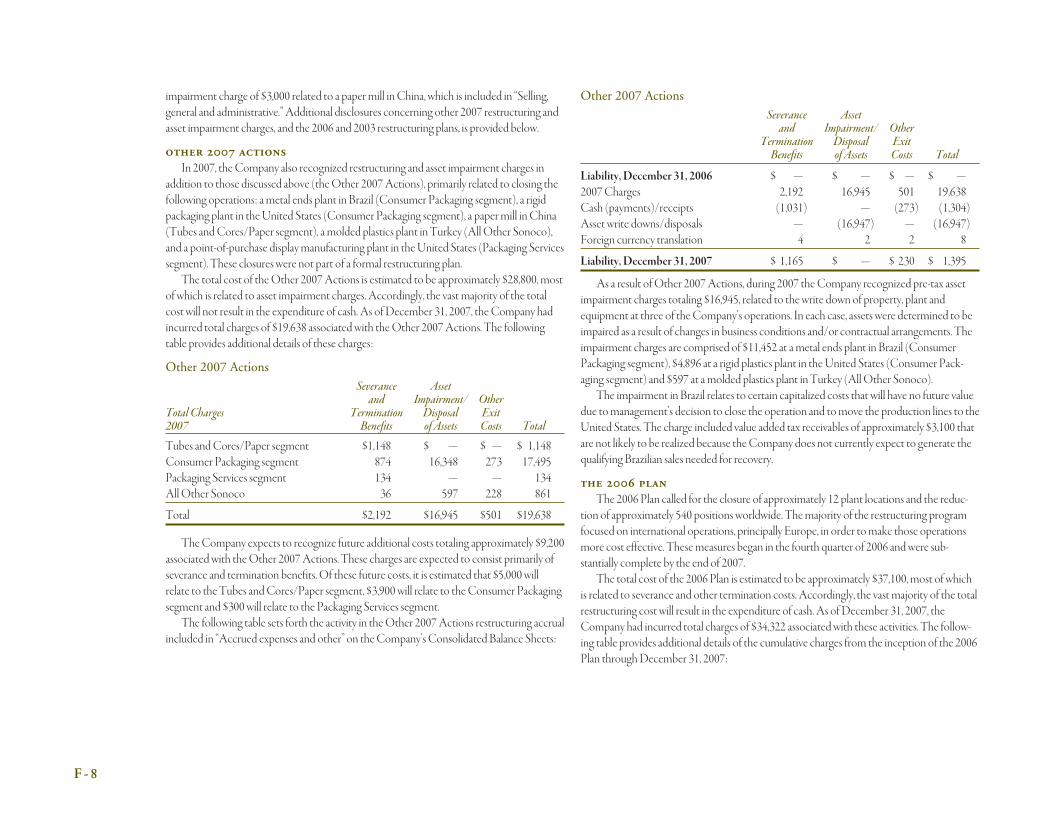
impairment charge of $3,000 related to a papermill in China, which is included in “Selling,general and administrative.” Additional disclosures concerning other 2007 restructuring andasset impairment charges, and the 2006 and 2003 restructuring plans, is provided below.
other 2007 actionsIn 2007, the Company also recognized restructuring and asset impairment charges in
addition to those discussed above (theOther 2007Actions), primarily related to closing thefollowing operations: a metal ends plant in Brazil (Consumer Packaging segment), a rigidpackaging plant in theUnited States (Consumer Packaging segment), a papermill in China(Tubes andCores/Paper segment), a molded plastics plant in Turkey (AllOther Sonoco),and a point-of-purchase displaymanufacturing plant in theUnited States (Packaging Servicessegment). These closures were not part of a formal restructuring plan.
The total cost of theOther 2007Actions is estimated to be approximately $28,800, mostof which is related to asset impairment charges. Accordingly, the vast majority of the totalcost will not result in the expenditure of cash. As ofDecember 31, 2007, the Company hadincurred total charges of $19,638 associated with theOther 2007Actions. The followingtable provides additional details of these charges:
Other 2007 Actions
Total Charges2007
Severanceand
TerminationBenefits
AssetImpairment/Disposalof Assets
OtherExitCosts Total
Tubes andCores/Paper segment $1,148 $ — $ — $ 1,148Consumer Packaging segment 874 16,348 273 17,495Packaging Services segment 134 — — 134AllOther Sonoco 36 597 228 861
Total $2,192 $16,945 $501 $19,638
TheCompany expects to recognize future additional costs totaling approximately $9,200associated with theOther 2007Actions. These charges are expected to consist primarily ofseverance and termination benefits. Of these future costs, it is estimated that $5,000 willrelate to the Tubes andCores/Paper segment, $3,900 will relate to the Consumer Packagingsegment and $300 will relate to the Packaging Services segment.
The following table sets forth the activity in theOther 2007Actions restructuring accrualincluded in “Accrued expenses and other” on the Company’s Consolidated Balance Sheets:
Other 2007 ActionsSeveranceand
TerminationBenefits
AssetImpairment/Disposalof Assets
OtherExitCosts Total
Liability, December 31, 2006 $ — $ — $ — $ —2007Charges 2,192 16,945 501 19,638Cash (payments)/receipts (1,031) — (273) (1,304)Asset write downs/disposals — (16,947) — (16,947)Foreign currency translation 4 2 2 8
Liability, December 31, 2007 $ 1,165 $ — $ 230 $ 1,395
As a result ofOther 2007Actions, during 2007 the Company recognized pre-tax assetimpairment charges totaling $16,945, related to the write down of property, plant andequipment at three of the Company’s operations. In each case, assets were determined to beimpaired as a result of changes in business conditions and/or contractual arrangements. Theimpairment charges are comprised of $11,452 at ametal ends plant in Brazil (ConsumerPackaging segment), $4,896 at a rigid plastics plant in theUnited States (Consumer Pack-aging segment) and $597 at amolded plastics plant in Turkey (AllOther Sonoco).
The impairment in Brazil relates to certain capitalized costs that will have no future valuedue tomanagement’s decision to close the operation and tomove the production lines to theUnited States. The charge included value added tax receivables of approximately $3,100 thatare not likely to be realized because the Company does not currently expect to generate thequalifying Brazilian sales needed for recovery.
the 2006 planThe 2006 Plan called for the closure of approximately 12 plant locations and the reduc-
tion of approximately 540 positions worldwide. Themajority of the restructuring programfocused on international operations, principally Europe, in order tomake those operationsmore cost effective. Thesemeasures began in the fourth quarter of 2006 and were sub-stantially complete by the end of 2007.
The total cost of the 2006 Plan is estimated to be approximately $37,100, most of whichis related to severance and other termination costs. Accordingly, the vast majority of the totalrestructuring cost will result in the expenditure of cash. As ofDecember 31, 2007, theCompany had incurred total charges of $34,322 associated with these activities. The follow-ing table provides additional details of the cumulative charges from the inception of the 2006Plan throughDecember 31, 2007:
F - 8

2006 Plan
Total ChargesInception to Date
Severanceand
TerminationBenefits
AssetImpairment/Disposalof Assets
OtherExitCosts Total
Tubes andCores/Paper segment $13,162 $4,222 $6,202 $23,586Consumer Packaging segment 5,453 1,686 1,444 8,583Packaging Services segment 528 — — 528AllOther Sonoco 757 261 607 1,625
Total $19,900 $6,169 $8,253 $34,322
TheCompany expects to recognize future additional costs totaling approximately $2,800associated with the 2006 Plan. These charges are expected to consist primarily of severanceand termination benefits. Of these future costs, it is estimated that $2,400 will relate to theTubes andCores/Paper segment, $300 will relate to the Consumer Packaging segment and$100 will relate toAllOther Sonoco.
TheCompany recognized restructuring charges related to the 2006 Plan, net of adjust-ments, of $16,824 in 2007 and $17,498 in 2006. The following table provides additionaldetails of these net charges:
2006 Plan
Total Charges
Severanceand
TerminationBenefits
AssetImpairment/Disposalof Assets
OtherExitCosts Total
2007Tubes andCores/Paper segment $4,697 $ (398) $4,072 $ 8,371
Consumer Packaging segment 4,396 1,377 1,288 7,061
Packaging Services segment 451 — — 451
AllOther Sonoco 382 — 559 941
Total $9,926 $ 979 $5,919 $16,824
2006Tubes andCores/Paper segment $ 8,465 $ 4,620 $ 2,130 $ 15,215Consumer Packaging segment 1,057 309 156 1,522Packaging Services segment 77 — — 77AllOther Sonoco 375 261 48 684
Total $ 9,974 $ 5,190 $ 2,334 $ 17,498
The net charges for 2007 relate primarily to the closures of the following: a rigid pack-aging plant inGermany, rigid packaging production lines in theUnited Kingdom, a paper
mill in France, two tube and core plants in Canada, a tube and core plant in theUnited States,and amolded plastics plant in theUnited States.
The charges for 2006 relate primarily to the closures of a papermill in France, two tubeand core plants, one in Canada and one in theUnited States, and a flexible packaging oper-ation in Canada. The charges also include the closures of a wooden reels facility and amoldedplastics operation in theUnited States as well as the impact of downsizing actions primarily inthe Company’s European tubes and cores/paper operations.
The following table sets forth the activity in the 2006 Plan restructuring accrual includedin “Accrued expenses and other” on the Company’s Consolidated Balance Sheets:
2006 PlanSeveranceand
TerminationBenefits
AssetImpairment/Disposalof Assets
OtherExitCosts Total
Liability, December 31, 2005 $ — $ — $ — $ —2006Charges 9,974 5,190 2,334 17,498Cash payments (1,302) — (649) (1,951)Asset write downs/disposals — (5,247) — (5,247)Reclassifications to pension liability (438) — — (438)Foreign currency translation 30 57 — 87
Liability, December 31, 2006 $ 8,264 $ — $ 1,685 $ 9,9492007Charges 10,617 2,897 5,873 19,387
Cash (payments)/receipts (15,125) 5,201 (7,217) (17,141)
Asset write downs/disposals — (6,180) — (6,180)
Foreign currency translation 452 — 83 535
Adjustments (691) (1,918) 46 (2,563)
Liability, December 31, 2007 $ 3,517 $ — $ 470 $ 3,987
Other exit costs consist primarily of building lease termination charges and othermiscella-neous exit costs.
Themajority of the liability and the remaining 2006 Plan restructuring costs, with theexception of certain building lease termination expenses, will be paid during 2008 using cashgenerated from operations.
During 2007, under the 2006 Plan, the Company recognized pre-tax asset impairmentcharges totaling $2,897.Most of this cost was associated with the sale of a rigid packagingbusiness inGermany and the closure of a rigid packaging production line in theUnitedKingdom. Both of these operations were part of the Consumer Packaging segment. Favor-able adjustments totaling $1,918 were recorded during the year due to the sale of equipmentpreviously impaired as the result of the closure of a papermill in France (Tubes andCores/Paper segment) and the sale of buildings and equipment related to a rigid packaging business
form 10-k | sonoco 2007 annual report F - 9

in Germany (Consumer Packaging segment). TheCompany received proceeds totaling$5,201 in connection with these sales.
During 2006, under the 2006 Plan, the Company recognized impairment losses on equip-ment and facilities held for disposal of $4,620 in the Tubes andCores/Paper segment, $309in the Consumer Packaging segment and $261 inAllOther Sonoco.Writeoffs in the TubesandCores/Paper segment related primarily to the closure of a papermill in France. Impairedassets were written down to the lower of carrying amount or fair value, less estimated costs tosell, if applicable.
The 2003 PlanThe 2003Plan called for theCompany to reduce its overall cost structure by $54,000 by
realigning and centralizing a number of staff functions and eliminating excess plant capacity.Pursuant to these plans, theCompany has initiated or completed 22 plant closings and hasreduced its workforce by approximately 1,120 employees.As ofDecember 31, 2007, theCompany had incurred cumulative charges, net of adjustments, of $102,738 associatedwiththese activities. The following table provides additional details of these cumulative net charges:
2003 Plan
Total ChargesInception to Date
Severanceand
TerminationBenefits
AssetImpairment/Disposalof Assets
OtherExitCosts Total
Tubes andCores/Paper segment $36,724 $16,835 $19,213 $ 72,772Consumer Packaging segment 11,195 5,084 4,730 21,009Packaging Services segment 333 — — 333AllOther Sonoco 2,999 326 92 3,417Corporate 5,094 — 113 5,207
Total $56,345 $22,245 $24,148 $102,738
TheCompany does not expect to recognize any future additional costs under the 2003Plan.
TheCompany recognized restructuring charges/(income) related to the 2003 Plan, netof adjustments, of $(271) in 2007, $8,472 in 2006 and $21,237 in 2005. The following tableprovides additional details of these net charges:
2003 Plan
Total Charges
Severanceand
TerminationBenefits
AssetImpairment/Disposalof Assets
OtherExitCosts Total
2007Tubes andCores/Paper segment $ (210) $(1,239) $1,634 $ 185
Consumer Packaging segment — — (456) (456)
Total $ (210) $(1,239) $1,178 $ (271)
2006Tubes andCores/Paper segment $ 952 $ 2,062 $ 5,164 $ 8,178Consumer Packaging segment 861 498 (968) 391AllOther Sonoco 3 — (100) (97)
Total $1,816 $ 2,560 $ 4,096 $ 8,472
2005Tubes andCores/Paper segment $4,834 $ 4,999 $ 6,194 $16,027Consumer Packaging segment 733 1,557 2,321 4,611AllOther Sonoco 640 (41) — 599
Total $6,207 $ 6,515 $ 8,515 $21,237
The net credit incurred in 2007 under the 2003 Plan resulted primarily from a gain on thesale of a building and tract of land adjoining the Company’s closed papermill in Downing-town, Pennsylvania, and from adjustments to previously recognized lease termination costs ata rigid packaging facility in theUnited States and severance costs at two European tube andcore operations. These costs were settled for less than originally expected resulting in a favor-able adjustment to restructuring expense. The gain and favorable adjustments exceededother exit costs incurred during the year associated with this papermill and previously closedtube and core plants in theUnited States and Europe.
The net charges incurred in 2006 under the 2003 Plan relate primarily to the closure oftwo tube and core plants and a flexible packaging operation in theUnited States, and an addi-tional asset impairment charge resulting from a revision to the estimated sales proceeds of apreviously closed papermill located in theUnited States.
The net charges incurred in 2005 under the 2003 Plan relate primarily to the closure oftube and core plants in theUnited States and Europe, flexible packaging plants in theUnitedStates andCanada, and a papermill in theUnited States.
TheCompany also recorded non-cash after-tax offsets in the amounts of $64, $416 and$1,260 in 2007, 2006 and 2005, respectively, reflecting theminority shareholder’s portion ofrestructuring costs that were charged to expense. These offsets are included in “Equity in
F - 1 0

earnings of affiliates/minority interest in subsidiaries, net of tax” in the Company’s Con-solidated Statements of Income.
The following table sets forth the activity in the 2003 Plan restructuring accrual includedin “Accrued expenses and other” in the Company’s Consolidated Balance Sheets:
2003 Plan
Severanceand
TerminationBenefits
AssetImpairment/Disposalof Assets
OtherExitCosts Total
Liability, December 31, 2004 $ 6,674 $ — $ 5,168 $11,8422005Charges 6,232 7,099 8,992 22,323Cash payments (8,600) — (7,329) (15,929)Asset write downs/disposals — (6,515) — (6,515)Foreign currency translation (859) — 140 (719)Adjustments (538) (584) 36 (1,086)
Liability, December 31, 2005 $ 2,909 $ — $ 7,007 $ 9,9162006Charges 2,101 2,672 6,009 10,782Cash payments (4,272) — (7,089) (11,361)Asset write downs/disposals — (2,560) — (2,560)Foreign currency translation 114 — 98 212Adjustments (285) (112) (1,913) (2,310)
Liability, December 31, 2006 $ 567 $ — $ 4,112 $ 4,6792007Charges — — 1,973 1,973
Cash (payments)/receipts (208) 2,318 (2,677) (567)
Asset write downs/disposals — (1,079) — (1,079)
Foreign currency translation 23 — 104 127
Adjustments (210) (1,239) (795) (2,244)
Liability, December 31, 2007 $ 172 $ — $ 2,717 $ 2,889
Other exit costs consist primarily of building lease termination charges and othermiscella-neous exit costs. Adjustments consist primarily of revisions to estimates of building leasetermination charges and differences between expected and actual severance payouts.
During 2007, under the 2003 Plan, the Company received cash of $2,318 in connectionwith the sale of a building and tract of land associated with a papermill in Downingtown,Pennsylvania. Themill had been closed in 2005 and an impairment charge recognized as theassets were written down to their estimated fair value. The sale resulted in a favorable adjust-ment to restructuring of $1,239, as the sales proceeds were in excess of the previously esti-mated fair value of the assets of $1,079. This adjustment was related to the Tubes andCores/Paper segment.
During 2006, under the 2003 Plan, the Company recognized impairment losses on equip-ment and facilities held for disposal in the Tubes andCores/Paper segment in the amount of$2,062 and in the Consumer Packaging segment in the amount of $498.Writeoffs in theTubes andCores/Paper segment related primarily to the closure of a papermill in theUnitedStates.Writeoffs of impaired equipment and facilities in the Consumer Packaging segmentrelated primarily to the closure of two flexible packaging plants. Impaired assets were writtendown to the lower of carrying amount or fair value, less estimated costs to sell, if applicable.
During 2005, under the 2003 Plan, the Company recognizedwriteoffs of impaired equip-ment and facilities held for disposal in the Tubes andCores/Paper segment in the amount of$4,312, in the Consumer Packaging segment in the amount of $1,367 and inAllOtherSonoco in the amount of $(41). Also, during 2005, the Company recognizedwriteoffs ofinventory in the Tubes andCores/Paper segment in the amount of $687, and in theConsumer Packaging segment in the amount of $190.Writeoffs of impaired equipment,facilities and inventory in the Tubes andCores/Paper segment related primarily to the clo-sure of tube and core plants and a papermill in theUnited States.Writeoffs of impairedequipment, facilities and inventory in the Consumer Packaging segment related primarily tothe closure of two flexible packaging plants. Impaired assets were written down to the lowerof carrying amount or fair value, less estimated costs to sell, if applicable.
Themajority of the liability and the remaining 2003 Plan restructuring costs, with theexception of certain building lease termination expenses, will be paid during 2008, using cashgenerated from operations.
4. Cash and Cash EquivalentsCash equivalents are composed of highly liquid investments with an originalmaturity
of threemonths or less. Cash equivalents are recorded at cost, which approximates
market.AtDecember 31, 2007 and 2006, outstanding checks totaling $12,469 and $12,847,respectively, were included in “Payable to suppliers” on the Company’s Consolidated BalanceSheets. In addition, outstanding payroll checks of $686 and $1,106 as of December 31, 2007and 2006, respectively, were included in “Accruedwages and other compensation” on theCompany’s Consolidated Balance Sheets.
TheCompany uses a notional pooling arrangement with an international bank to helpmanage global liquidity requirements. Under this pooling arrangement, the Company and itsparticipating subsidiariesmaymaintain either cash deposit or borrowing positions throughlocal currency accounts with the bank, so long as the aggregate position of the global pool is anotionally calculated net cash deposit. Because it maintains a security interest in the cashdeposits, and has the right to offset the cash deposits against the borrowings, the bank pro-vides the Company and its participating subsidiaries favorable interest terms on both. TheCompany’s Consolidated Balance Sheets reflect a net cash deposit under this poolingarrangement of $200 and $1,263 as of December 31, 2007 and 2006, respectively.
form 10-k | sonoco 2007 annual report F - 1 1

5. InventoriesInventories are stated at the lower of cost ormarket.The last-in, first-out (LIFO)
method was used to determine costs of approximately 18% and 21% of total inventories atDecember 31, 2007 and 2006, respectively. The remaining inventories are determined on thefirst-in, first-out (FIFO)method.
If the FIFOmethod of accounting had been used for all inventories, total inventorywould have been higher by $16,404 and $14,602 at December 31, 2007 and 2006,respectively.
6. Property, Plant and EquipmentPlant assets represent the original cost of land, buildings and equipment,
less depreciation, computed under the straight-line method over the esti-mated useful lives of the assets, and are reviewed for impairment wheneverevents indicate the carrying value may not be recoverable.
Equipment lives generally range from three to 11 years, and buildingsfrom 15 to 40 years.
Timber resources are stated at cost.Depletion is charged to operations based on the
estimated number of units of timber cut during the year.
Details at December 31 are as follows:
2007 2006
Land $ 72,757 $ 66,161Timber resources 39,069 38,503Buildings 443,567 421,291Machinery and equipment 2,289,720 2,130,006Construction in progress 105,205 76,063
2,950,318 2,732,024Accumulated depreciation and depletion (1,844,976) (1,712,430)
Property, plant and equipment, net $ 1,105,342 $ 1,019,594
Estimated costs for completion of capital additions under construction totaled approx-imately $61,300 at December 31, 2007.
Depreciation and depletion expense amounted to $170,013 in 2007, $157,000 in 2006and $155,412 in 2005.
TheCompany has certain properties and equipment that are leased under noncancelableoperating leases. Futureminimum rentals under noncancelable operating leases with terms ofmore than one year are as follows: 2008 – $32,900; 2009 – $26,300; 2010 – $20,700; 2011 –$15,700; 2012– $12,700 and thereafter – $31,100. Total rental expense under operatingleases was approximately $46,800 in 2007, $42,200 in 2006 and $41,900 in 2005.
7. Goodwill and Other Intangible Assetsgoodwill
TheCompany accounts for goodwill in accordancewith Statement of Financial
Accounting StandardsNo. 142 ‘Goodwill andOther IntangibleAssets’ (FAS 142).
Under FAS 142, purchased goodwill and intangible assets with indefinite lives are not
amortized. TheCompany evaluates its goodwill for impairment at least annually, and
more frequently if indicators of impairment are present. In performing the impairmenttest, the Company uses discounted future cash flows to estimate the fair value of each report-ing unit. If the fair value of the reporting unit exceeds the carrying value of the reporting unit’sassets, including goodwill, there is no impairment. Otherwise, if the carrying value of thereporting unit’s goodwill exceeds the implied fair value of that goodwill, an impairmentcharge is recognized for the excess.
TheCompany completed its annual goodwill impairment testing during the third quar-ters of 2007, 2006 and 2005. Based on this impairment testing, no adjustment to the recordedgoodwill balance was necessary. The evaluation of goodwill impairment that was completedduring the third quarter of 2007 used forward-looking projections, which included expectedimprovement in results at certain reporting units, most notably the Flexible Packaging busi-ness in the Consumer Packaging segment. The goodwill associated with the Flexible Pack-aging business totaled approximately $96,000 at December 31, 2007. If actual performance inthis reporting unit falls significantly short of projected results, it is reasonably possible that anon-cash impairment charge would be required.
The changes in the carrying amount of goodwill for the year endedDecember 31, 2007,are as follows:
Tubesand Cores/PaperSegment
ConsumerPackagingSegment
PackagingServicesSegment
AllOtherSonoco Total
Balance as of January 1, 2007 $225,957 $224,657 $150,973 $65,701 $667,288Goodwill on 2007 acquisitions 15 126,798 — 43 126,856Foreign currency translation 16,500 17,691 27 271 34,489Other — (2,423) — — (2,423)Adjustments 2,658 (500) — (20) 2,138
Balance as of December 31,2007 $245,130 $366,223 $151,000 $65,995 $828,348
TheCompany disposed of $1,888 of goodwill associated with the sale of a rigid packagingbusiness inGermany in the second quarter of 2007 and disposed of $535 of goodwill asso-ciated with the sale of a rigid packaging business in Belgium in the third quarter of 2007. Thegoodwill disposed of totaled $2,423 and is shown above under the caption “Other”.
F - 1 2

Adjustments to goodwill in the Tubes andCores/Paper segment consist primarily of achange in the purchase price allocation relating to theDecember 2006 acquisition ofDemolli Industria Cartaria S.p.A. The change, which decreased net tangible assets andincreased goodwill, was a result of finalizing the valuation of the acquired business. Adjust-ments to goodwill in the Consumer Packaging segment consist primarily of changes todeferred tax valuation allowances established in connection with acquisitionsmade in prioryears.
other intangible assetsIntangible assets are amortized, usually on a straight-line basis, over their respective
useful lives, which generally range from three to 20 years. TheCompany evaluates its
intangible assets for impairment whenever indicators of impairment exist.TheCompanyhas no intangibles with indefinite lives.
2007 2006
Amortizable intangibles –Gross costPatents $ 3,360 $ 3,360Customer lists 161,805 108,741Land use rights 7,315 6,855Supply agreements 1,000 1,000Other 11,032 8,302
Total gross cost $184,512 $128,258
Accumulated amortizationPatents $ (3,266) $ (3,255)Customer lists (32,178) (20,651)Land use rights (3,088) (2,797)Supply agreements (650) (550)Other (5,894) (5,120)
Total accumulated amortization $ (45,076) $ (32,373)
Net amortizable intangibles $139,436 $ 95,885
Aggregate amortization expense on intangible assets was $11,326, $7,863 and $7,662 forthe years endedDecember 31, 2007, 2006 and 2005, respectively. Amortization expense onintangible assets is expected to approximate $12,965 in 2008, $12,359 in 2009, $12,018 in2010, $11,820 in 2011 and $11,097 in 2012.
TheCompany recorded $49,565 of identifiable intangibles in connection with 2007acquisitions. Of this total, approximately $46,850 related to customer lists that will be amor-tized over periods ranging from 5 to 20 years. The remaining $2,715 consists of otheridentifiable intangibles, primarily non-compete agreements. These agreements are amortizedover their respective lives, generally from three to five years.
8. DebtDebt at December 31 was as follows:
2007 2006
Commercial paper, average rate of 5.32% in 2007 and 5.01% in 2006 $169,000 $ 89,0006.75% debentures dueNovember 2010 99,940 99,9266.5% debentures dueNovember 2013 249,324 249,2085.625% debentures dueNovember 2016 149,393 149,3229.2% debentures dueAugust 2021 41,305 41,3056.125% Industrial Revenue Bonds (IRBs) due June 2025 34,721 34,6976.0% IRBs dueApril 2026 34,423 34,392Foreign denominated debt, average rate of 8.0% in 2007 and 7.6% in2006 56,721 50,576
Other notes 14,711 15,566
Total debt 849,538 763,992Less current portion and short-term notes 45,199 51,903
Long-term debt $804,339 $712,089
TheCompany operates a commercial paper program totaling $500,000, and has a fullycommitted bank line of credit supporting the program by a like amount. OnMay 3, 2006,the Company entered into an amended and restated credit agreement to extend its bank lineof credit to a new five-year maturity. The amended and restated credit agreement also pro-vided the Company the option to increase its credit line from $350,000 to $500,000 subjectto the concurrence of its lenders. TheCompany exercised this option and increased thecredit line to $500,000 onMay 29, 2007. TheCompany intends to indefinitely maintain lineof credit agreements fully supporting its commercial paper program.Consistent with thematurity of the supporting line of credit, the Company classifies outstanding commercialpaper balances as long-term debt.
In addition, at December 31, 2007, the Company had approximately $289,000 availableunder unused short-term lines of credit. These short-term lines of credit are for generalCompany purposes, with interest at mutually agreed-upon rates.
Certain of theCompany’s debt agreements impose restrictionswith respect to themain-tenance of financial ratios and the disposition of assets. Themost restrictive covenant currentlyrequires that net worth, as defined, at the endof each fiscal quarter be greater than $1,164,248,increased by 25%of net income afterDecember 31, 2005, and decreased by stock purchasesafterMay 3, 2006. This covenant excludes from the above networth calculation any accumu-lated other comprehensive incomeor loss. As ofDecember 31, 2007, theCompanywasapproximately $390,000 above theminimum level required under this covenant.
The 6.125% IRBs and the 6.0% IRBs are collateralized by property, plant and equipmentat several locations. On January 2, 2008, the Company prepaid the 6.125% IRBwith otherborrowings classified as long term. TheCompany intends to prepay the 6.0% IRB in the
form 10-k | sonoco 2007 annual report F - 1 3

second quarter of 2008 with other borrowings to be classified as long term. The prepaymentof these bonds is expected to result in an after-tax loss of approximately $1,300.
The approximate principal requirements of debtmaturing in the next five years are:2008 – $45,198; 2009 – $3,315; 2010 – $105,671; 2011 – $171,048 and 2012 – $9,721.
9. Financial InstrumentsThe following table sets forth the carrying amounts and fair values of the Company’s sig-
nificant financial instruments where the carrying amount differs from the fair value.December 31, 2007 December 31, 2006
CarryingAmount
FairValue
CarryingAmount
FairValue
Long-term debt $804,339 $830,031 $712,089 $732,377Hilex note receivable and equityinstrument $ 42,651 $ 34,737 $ 40,731 $ 35,790
The carrying value of cash and cash equivalents, short-term debt and long-term variable-rate debt approximates fair value. The fair value of long-term debt is based on quotedmarketprices or is determined by discounting future cash flows using interest rates available to theCompany for issues with similar terms and averagematurities. The fair value of theHilexnote receivable and equity instrument is based on discounted future cash flows usingobservablemarket interest rates for issues with similar terms, maturities and risks.
TheCompany records qualifying derivatives based on Statement of Financial Account-ing StandardsNo. 133, ‘Accounting forDerivative Instruments andHedgingActivities’(FAS 133), and related amendments. This Statement requires that all derivatives be recog-nized as assets or liabilities in the balance sheet andmeasured at fair value. Changes in the fairvalue of derivatives are recognized in either net income or in other comprehensive income,depending on the designated purpose of the derivative.
TheCompany uses derivatives from time to time tomitigate the effect of rawmaterialand energy cost fluctuations, foreign currency fluctuations and interest ratemovements. TheCompany purchases commodities such as recovered paper, metal and energy generally atmarket or fixed prices that are established with the vendor as part of the purchase process forquantities expected to be consumed in the ordinary course of business. TheCompanymayenter into commodity futures or swaps to reduce the effect of price fluctuation. TheCom-panymay use foreign currency forward contracts and other riskmanagement instruments tomanage exposure to changes in foreign currency cash flows and the translation ofmonetaryassets and liabilities on the Company’s Consolidated Financial Statements. TheCompany isexposed to interest-rate fluctuations as a result of using debt as a source of financing for itsoperations. TheCompanymay use traditional, unleveraged interest rate swaps to adjust itsmix of fixed and variable rate debt tomanage its exposure to interest ratemovements. TheCompany uses publishedmarket prices or estimated values based on current price quotesand a discounted cash flowmodel to estimate the fair market value of derivatives.
All interest rate swaps qualified as fair-value hedges, under which fixed interest rates areswapped for floating rates. During 2004, the Company entered into agreements to swap theinterest rate from fixed to floating on $100,000 of its $250,000 6.5% notes maturing in 2013,and all $150,000 of its 5.625% notes maturing in 2016. During 2006, the Company termi-nated both interest rate swaps. At the time of termination, the fair value of the interest rateswap related to the 6.5% notes was an unfavorable position of $3,018, and the fair value of theinterest rate swap related to the 5.625% notes was a favorable position of $881. In accordancewith FAS 133, interest expense is being adjusted by amortization of the gain and loss asso-ciated with these swap terminations over the remaining life of the related bonds. Terminationof these swaps increased the Company’s proportion of fixed rate debt, reducing its exposureto the effects of interest rate changes. TheCompany did not enter into any new fair valuehedges during the year endedDecember 31, 2007.
TheCompany has entered into certain cash flow hedges tomitigate exposure to com-modity, energy and foreign exchange risks. Related hedge gains and/or losses are reclassifiedfrom accumulated other comprehensive income and into earnings in the same periods thatthe forecasted purchases or payments affect earnings. The only significant open hedge posi-tions relate to the Company’s forecasted purchase of natural gas. AtDecember 31, 2007,natural gas swaps covering approximately 6.1millionMMBTUswere outstanding. Thehedged natural gas quantities at this date represent approximately 69%, 44% and 19% ofanticipatedU.S. andCanadian usage for 2008, 2009 and 2010, respectively. The total fairmarket value of the Company’s cash-flow hedge derivatives as of December 31, 2007, was anet loss of $1,465 on a tax-adjusted basis. Of this amount, a loss of $272 is expected to bereclassified to earnings in 2008. As a result of the high correlation between the derivativeinstruments and the associated hedged transactions, ineffectiveness did not have amaterialimpact on the Company’s Consolidated Statements of Income for the years endedDecember 31, 2007, 2006 and 2005.
10. Stock-based PlansTheCompany provides share-based compensation in the form of stock options, stock
appreciation rights and restricted stock units. Themajority of these awards are issued pur-suant to the Company’s 1991Key Employee Stock Plan (the “Employee Stock Plan”) and1996Non-employeeDirectors’ Stock Plan (the “Directors’ Plan”). TheCompany’snon-employee director stock-based awards have not beenmaterial. AtDecember 31, 2007, atotal of 3,339,361 shares remain available for future grant under these plans. TheCompanyissues new shares for stock option and stock appreciation right exercises and stock unit con-versions. Although the Company has from time to time repurchased shares to replace itsauthorized shares issued under its stock compensation plans, there is no specific schedule orpolicy to do so.
Total compensation cost for share-based payment arrangements was $11,000, $11,347and $4,554, for 2007, 2006 and 2005, respectively. The related tax benefit recognized in netincomewas $3,908, $3,699 and $1,475, for the same years, respectively. Share-based compen-
F - 1 4

sation expense is included in selling, general and administrative expense on the CondensedConsolidated Statements of Income.
Effective January 1, 2006, the Company adopted the fair valuemethod of accounting forshare-based compensation arrangements in accordance with Statement of FinancialAccounting StandardsNo. 123 (revised 2004), ‘Share-based Payment’ (FAS 123(R)), usingthemodified prospectivemethod of transition. Under themodified prospectivemethod,compensation expense is recognized beginning at the effective date of adoption of FAS123(R) for all share-based payments (i) granted after the effective date of adoption and(ii) granted prior to the effective date of adoption and that remain unvested on the date ofadoption. TheCompany recognizes share-based compensation cost ratably over theexpected vesting period.
Prior to January 1, 2006, the Company accounted for share-based employee compensa-tion plans using the intrinsic valuemethod of accounting in accordance with AccountingPrinciples BoardOpinionNo. 25, ‘Accounting for Stock Issued to Employees’ (APB 25),and its related interpretations. Under the provisions of APB 25, no compensation expensewas recognizedwhen stock options were granted with exercise prices equal to or greater thanmarket value on the date of grant.
Under themodified prospectivemethod of transition, the Company is not required torestate its prior period financial statements. The following table illustrates the effect on netincome and earnings per share if the Company had applied the fair value recognition provi-sions of FAS 123 to stock-based employee compensation for the year endedDecember 31,2005:
Year EndedDecember 31,
2005
Net income, as reported $161,877Add: Stock-based employee compensation cost, net of related tax effects,included in net income, as reported 3,078
Deduct: Total stock-based employee compensation expense determinedunder fair value basedmethod for all awards, net of related tax effects (7,534)
Pro forma net income $157,421
Earnings per share:Basic – as reported $ 1.63Basic – pro forma 1.58Diluted – as reported 1.61Diluted – pro forma 1.57
When the tax deduction for an exercised stock option, exercised stock appreciation rightor converted stock unit exceeds the compensation cost that has been recognized in income,an “excess” tax benefit is created. The excess benefit is not recognized on the income state-ment, but rather on the balance sheet as additional paid-in capital. The additional net excesstax benefit realized was $9,312 and $10,580 for 2007 and 2006, respectively. Prior to the
adoption of FAS 123(R), the Company presented all tax benefits resulting from share-basedcompensation as cash flows from operating activities in the condensed consolidated state-ments of cash flows. FAS 123(R) requires cash flows resulting from tax deductions in excessof the grant-date fair value of share-based awards to be included in cash flows from financingactivities. Excess tax benefits of $9,317 and $10,580, recognized during 2007 and 2006 havebeen included in cash flows from financing activities. In accordance with the adoption ofFAS 123(R), the Company chose to adopt the short-cut method to determine the pool ofwindfall tax benefits related to stock-based compensation.
For purposes of calculating share-based compensation expense under FAS 123(R) forretiree-eligible employees, the service completion date is assumed to be the grant date; there-fore, expense associated with share-based compensation to these employees is recognized atthat time. The annual impact of recognizing this expense immediately versus over the nomi-nal vesting period is notmaterial because the Company’s employee stock options and stockappreciation rights have one-year vesting periods.
stock options and stock appreciation rights (sars)TheCompany typically grants stock options or stock appreciation rights annually on a
discretionary basis to its key employees. Prior to 2006, the Company also granted stockoptions to its non-employee directors.Options granted under the Employee Stock Plan andtheDirectors’ Plan were at market (had an exercise price equal to the closingmarket price onthe date of grant), had 10-year terms and vested over one year, except for the options grantedin 2005, which vested immediately. In 2006, the Company began to grant stock appreciationrights (SARs) instead of stock options. SARs are at market, vest over one year, have seven-year terms and can be settled only in stock. Both stock options and SARs are exercisableupon vesting.
On February 7, 2007, the Company granted to employees 609,975 stock-settled SARs,net of forfeitures. An additional 5,250 SARs were granted over the remainder of the year. AllSARs were granted at the closingmarket prices on the dates of grant. As ofDecember 31,2007, there was $204 of total unrecognized compensation cost related to nonvested SARs.This cost will be recognized over the remaining weighted-average vesting period, which isapproximately onemonth.
The weighted-average fair values of options and SARs granted was $6.43, $5.85 and $5.42in 2007, 2006 and 2005, respectively. TheCompany computed the estimated fair values of alloptions and SARs using the binomial option-pricingmodel applying the assumptions setforth in the following table:
2007 2006 2005
Expected dividend yield 2.5% 2.8% 3.5%Expected stock price volatility 18.3% 20.8% 26.2%Risk-free interest rate 4.8% 4.5% 3.7%Expected life of options/SARs 4 years 4 years 4.5 years
form 10-k | sonoco 2007 annual report F - 1 5

The assumptions employed in the calculation of the fair value of stock options and SARswere determined as follows:• Expected dividend yield – the Company’s annual dividend divided by the stock price at thetime of grant.• Expected stock price volatility – based on historical volatility of the Company’s commonstockmeasured weekly for a time period equal to the expected life.• Risk-free interest rate – based onU.S. Treasury yields in effect at the time of grant formaturities equal to the expected life.• Expected life – calculated using the simplifiedmethod as prescribed in Staff AccountingBulletinNo. 107, where the expected life is equal to the sum of the vesting period and thecontractual term divided by two.
The following tables summarize information about stock options and SARs outstandingand exercisable at December 31, 2007:
Options and SARs Vested and Expected to Vest
Range ofExercise Prices
NumberOutstanding
Weighted-average
RemainingContractual
Life
Weighted-averageExercisePrice
AggregateIntrinsic Value
$17.25 - $23.80 1,691,904 3.6 years $22.04 $18,010$23.86 - $28.00 1,961,763 5.5 years $25.53 $14,029$28.06 - $43.83 2,106,793 3.7 years $33.52 $ 2,355
$17.25 - $43.83 5,760,460 4.3 years $27.42 $34,394
Options and SARs Exercisable
Range ofExercise Prices
NumberExercisable
Weighted-average
RemainingContractual
Life
Weighted-averageExercisePrice
AggregateIntrinsic Value
$17.25 - $23.80 1,691,904 3.6 years $22.04 $18,010$23.86 - $28.00 1,961,763 5.5 years $25.53 $14,029$28.06 - $38.11 1,491,868 2.7 years $31.62 $ 2,355
$17.25 - $38.11 5,145,535 4.1 years $26.15 $34,394
The activity related to the Company’s stock options and SARs is as follows:
Nonvested Vested Total
Weighted-average
Exercise Price
Outstanding, December 31,2006 730,089 6,354,797 7,084,886 $26.48
Vested (728,089) 728,089 —Granted 614,925 300 615,225 $38.13Exercised — (1,928,820) (1,928,820) $27.34Forfeited (2,000) (8,831) (10,831) $30.44
Outstanding, December 31,2007 614,925 5,145,535 5,760,460 $27.42
The aggregate intrinsic value of options and SARs exercised during the years endedDecember 31, 2007, 2006 and 2005was $26,631, $27,827 and $7,635, respectively. Cashreceived on option exercises was $49,698, $74,413 and $34,617 for the same years, respectively.
performance-based stock awardsTheCompany typically grants performance contingent restricted stock units (PCSUs)
annually on a discretionary basis to certain of its executives and othermembers of itsmanage-ment team. Both the ultimate number of PCSUs awarded and the vesting period are dependentupon the degree towhich performance targets are achieved for three-year performance periods.Upon vesting, PCSUs are convertible into common shares on a one-for-one basis. These awardsare granted under theEmployee StockPlan and vest over five years with accelerated vesting overthree years if performance targets aremet. For the awards outstanding atDecember 31, 2007,the ultimate number of PCSUs that could vest ranges from197,946 to 593,837 and is tied toearnings and capital effectiveness over a three-year period. The 2006 awards are tied to perform-ance targets over the three-year period endingDecember 31, 2008, and can range from98,058to 294,174 units. The 2007 awards are tied to performance targets through fiscal year 2009, andcan range from99,888 to 299,663 units.
The three-year performance cycle for the 2005 awards was completed onDecember 31,2007. Based onmeeting performance goals established at the time of the award, participantsto whom awards had been granted earned 198,991 stock units with a vested fair value of$6,503. TheCompany’s 2004 performance program completed its three-year performancecycle onDecember 31, 2006. Based onmeeting performance goals established at the time ofthe award, participants earned 181,157 stock units with a vested fair value of $6,895.
Non-cash stock-based compensation associated with PCSUs totaled $6,619, $6,654 and$3,198 for 2007, 2006 and 2005, respectively. The adoption of FAS 123(R) did notmateriallychange the expense recognition for PCSUs. As ofDecember 31, 2007, there was approx-imately $8,500 of total unrecognized compensation cost related to nonvested PCSUs. Thiscost is expected to be recognized over a weighted-average period of eighteenmonths.
F - 1 6

restricted stock awardsSince 1994, the Company has from time to time granted awards of restricted stock units tocertain of the Company’s executives. These awards vest over a five-year period with one-thirdvesting on each of the third, fourth and fifth anniversaries of the grant. An executivemust beactively employed by the Company on the vesting date for shares to be issued.However, inthe event of the executive’s death, disability or retirement prior to full vesting, shares will beissued on a pro rata basis up through the time the executive’s employment ceases. Partic-ipants can elect to defer receipt. However, once vested these awards do not expire. As ofDecember 31, 2007, a total of 367,889 restricted stock units remained outstanding, 291,885of which were vested.No restricted stock units vested during 2007 and no restricted stockunits were granted during 2007.Non-cash stock-based compensation associated withrestricted stock grants totaled $419, $419 and $1,356 for 2007, 2006 and 2005, respectively.The adoption of FAS 123(R) did notmaterially change the expense recognition for theCompany’s restricted stock awards. As ofDecember 31, 2007, there was $801 of totalunrecognized compensation cost related to nonvested restricted stock units. This cost isexpected to be recognized over a weighted-average period of two years.
The activity related to the PCSUs and restricted stock units is as follows:
Nonvested Vested TotalGrant Date FairValue Per Share
Outstanding, December 31,2006 560,497 559,362 1,119,859 $27.20
Granted 256,728 — 256,728 $38.11Vested (198,991) 198,991 —Converted — (58,978) (58,978) $24.38Performance adjustments/other (30,519) 14,276 (16,243) $32.83
Outstanding, December 31,2007 587,715 713,651 1,301,366 $29.50
deferred compensation plansCertain officers of the Companymay elect to defer a portion of their compensation in
the form of stock units. Units are granted as of the day the cash compensation would haveotherwise been paid using the closing price of the Company’s common stock on that day.The units immediately vest and earn dividend equivalents. Units are distributed in the form ofcommon stock upon retirement over a period elected by the employee. Cash compensationtotaling $174 was deferred as stock units during 2007, resulting in 4,659 units being granted.There were no conversions to common stock during 2007.
During 2006 and 2007, non-employee directors were required to defer a minimum of50% of their quarterly retainer fees into stock units. Units are granted as of the day the cashcompensation would have otherwise been paid using the closing price of the Company’scommon stock on that day. The units immediately vest and earn dividend equivalents. Dis-tributions begin after retirement from the board over a period elected by the director. Sincedistributions can bemade in stock or cash, units granted under the director plan areaccounted for as liability-classified awards.
11. Employee Benefit Plansretirement plans and retiree health and life insurance plans
TheCompany provides non-contributory defined benefit pension plans for amajority ofits employees in theUnited States, and certain of its employees inMexico and Belgium.EffectiveDecember 31, 2003, the Company froze participation for newly hired salaried andnon-union hourlyU.S. employees in its traditional defined benefit pension plan. TheCom-pany adopted a defined contribution plan, the Sonoco Investment and Retirement Plan,which covers its non-unionU.S. employees hired on or after January 1, 2004. TheCompanyalso sponsors contributory pension plans covering themajority of its employees in theUnited Kingdom,Canada and theNetherlands.
TheCompany also provides postretirement healthcare and life insurance benefits to themajority of its retirees and their eligible dependents in theUnited States andCanada. In thefourth quarter of 2005, the Company announced changes in eligibility for retireemedicalbenefits effective January 1, 2006, for its U.S. plan. These changes included the elimination ofa Company subsidy toward the cost of retireemedical benefits if certain age and service cri-teria were notmet, as well as the elimination of Company-provided prescription drug bene-fits for themajority of its current retirees and all future retirees.
TheCompany uses a December 31measurement date for all its plans with the exceptionof its pension plan in theUnited Kingdom, which uses a September 30measurement date.
form 10-k | sonoco 2007 annual report F - 1 7
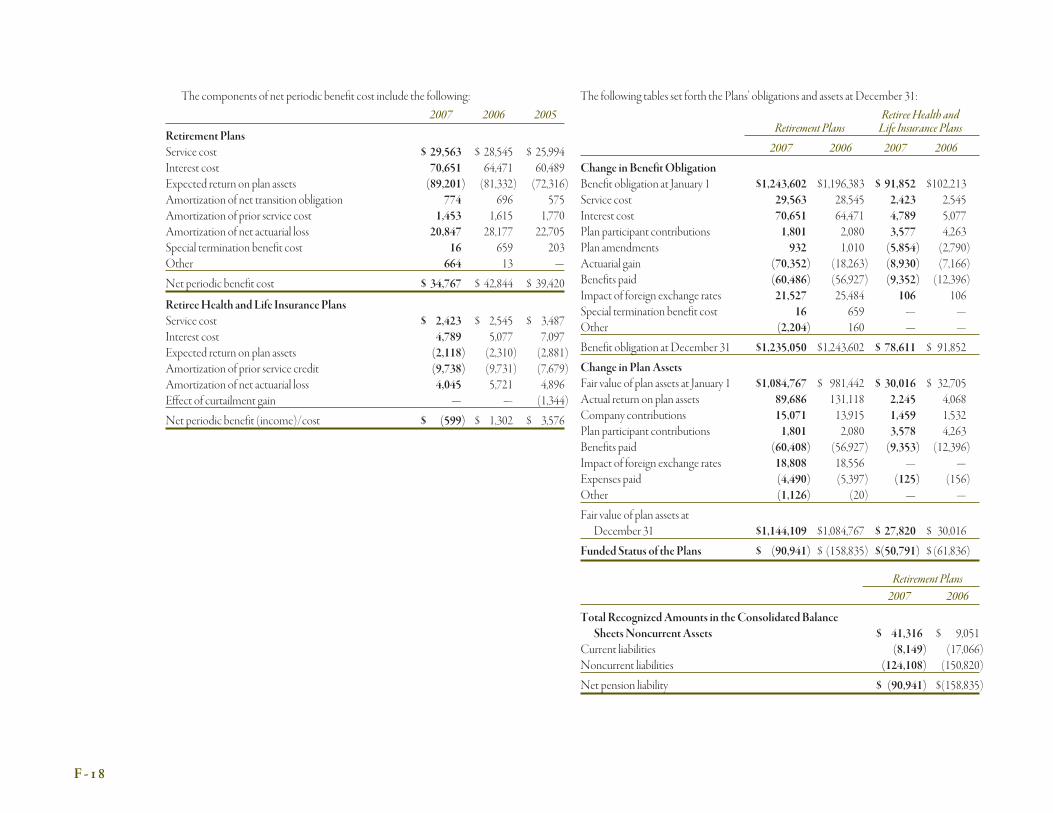
The components of net periodic benefit cost include the following:
2007 2006 2005
Retirement Plans
Service cost $ 29,563 $ 28,545 $ 25,994Interest cost 70,651 64,471 60,489Expected return on plan assets (89,201) (81,332) (72,316)Amortization of net transition obligation 774 696 575Amortization of prior service cost 1,453 1,615 1,770Amortization of net actuarial loss 20,847 28,177 22,705Special termination benefit cost 16 659 203Other 664 13 —
Net periodic benefit cost $ 34,767 $ 42,844 $ 39,420
RetireeHealth and Life Insurance Plans
Service cost $ 2,423 $ 2,545 $ 3,487Interest cost 4,789 5,077 7,097Expected return on plan assets (2,118) (2,310) (2,881)Amortization of prior service credit (9,738) (9,731) (7,679)Amortization of net actuarial loss 4,045 5,721 4,896Effect of curtailment gain — — (1,344)
Net periodic benefit (income)/cost $ (599) $ 1,302 $ 3,576
The following tables set forth the Plans’ obligations and assets at December 31:
Retirement PlansRetiree Health andLife Insurance Plans
2007 2006 2007 2006
Change in BenefitObligation
Benefit obligation at January 1 $1,243,602 $1,196,383 $ 91,852 $102,213Service cost 29,563 28,545 2,423 2,545Interest cost 70,651 64,471 4,789 5,077Plan participant contributions 1,801 2,080 3,577 4,263Plan amendments 932 1,010 (5,854) (2,790)Actuarial gain (70,352) (18,263) (8,930) (7,166)Benefits paid (60,486) (56,927) (9,352) (12,396)Impact of foreign exchange rates 21,527 25,484 106 106Special termination benefit cost 16 659 — —Other (2,204) 160 — —
Benefit obligation at December 31 $1,235,050 $1,243,602 $ 78,611 $ 91,852
Change in PlanAssets
Fair value of plan assets at January 1 $1,084,767 $ 981,442 $ 30,016 $ 32,705Actual return on plan assets 89,686 131,118 2,245 4,068Company contributions 15,071 13,915 1,459 1,532Plan participant contributions 1,801 2,080 3,578 4,263Benefits paid (60,408) (56,927) (9,353) (12,396)Impact of foreign exchange rates 18,808 18,556 — —Expenses paid (4,490) (5,397) (125) (156)Other (1,126) (20) — —
Fair value of plan assets atDecember 31 $1,144,109 $1,084,767 $ 27,820 $ 30,016
Funded Status of the Plans $ (90,941) $ (158,835) $(50,791) $ (61,836)
Retirement Plans2007 2006
Total RecognizedAmounts in theConsolidatedBalance
SheetsNoncurrentAssets $ 41,316 $ 9,051Current liabilities (8,149) (17,066)Noncurrent liabilities (124,108) (150,820)
Net pension liability $ (90,941) $(158,835)
F - 1 8

Items not yet recognized as a component of net periodic pension cost that are included inAccumulatedOther Comprehensive Loss (Income) as of December 31, 2007, are as follows:
Retirement Plans
Retiree Health andLife Insurance
Plans
Net actuarial loss $264,382 $ 30,106Prior service cost/(credit) 8,222 (27,092)Net transition obligation 4,537 —
$277,141 $ 3,014
Of the amounts included inAccumulatedOther Comprehensive Loss (Income) as ofDecember 31, 2007, the portions that are expected to be recognized as components of netperiodic benefit cost in 2008 are as follows:
Retirement Plans
Retiree Health andLife Insurance
Plans
Net actuarial loss $12,533 $ 3,121Prior service cost/(credit) 1,406 (10,436)Net transition obligation 724 —
$14,663 $ (7,315)
The amounts recognized inOther Comprehensive Income during 2007 include the fol-lowing:
Retirement Plans
Retiree Health andLife Insurance
Plans
Adjustments arising during the period:Net actuarial gain $(64,768) $(8,937)Prior service cost/(credit) 851 (5,853)Net transition asset (167) —
Reversal of amortization:Net actuarial loss (20,847) (4,045)Prior service cost/(credit) (1,453) 9,738Net transition obligation (774) —
Total recognized inOther Comprehensive Income $(87,158) $(9,097)
The accumulated benefit obligation for all defined benefit plans was $1,126,748 and$1,143,897 at December 31, 2007 and 2006, respectively.
The projected benefit obligation (PBO), accumulated benefit obligation (ABO) and fairvalue of plan assets for pension plans with accumulated benefit obligations in excess of planassets were, $429,727, $401,619 and $298,620, respectively, as of December 31, 2007, and$428,692, $401,560 and $261,100, respectively, as of December 31, 2006. As ofDecember 31, 2007, both the ABO and the PBOof the Company’s U.S. qualified pensionplan were fully funded.
The following table sets forth the Company’s projected benefit payments for the next tenyears:
Year Retirement Plans
Retiree Health andLife Insurance
Plans
2008 $ 63,075 $ 7,6632009 $ 62,307 $ 7,6082010 $ 64,880 $ 7,5982011 $ 66,087 $ 7,7342012 $ 69,139 $ 7,6522013-2017 $397,247 $37,148
AssumptionsThe following tables set forth themajor actuarial assumptions used in determining the
PBO,ABO and net periodic cost.
Weighted-average assumptions used todetermine benefit obligations at December 31
U.S.RetirementPlans
U.S. RetireeHealth andLife Insurance
Plans Foreign Plans
Discount Rate2007 6.39% 6.11% 3.60-5.90%2006 5.83% 5.68% 4.00-5.25%Rate of Compensation Increase2007 4.77% 4.57% 0.50-4.40%2006 4.88% 4.69% 1.00-4.00%
form 10-k | sonoco 2007 annual report F - 1 9

Weighted-average assumptions used todetermine net periodic benefit cost foryears endedDecember 31
U.S.RetirementPlans
U.S. RetireeHealth andLife Insurance
Plans Foreign Plans
Discount Rate2007 5.83% 5.68% 4.00-5.25%2006 5.50% 5.50% 4.00-5.25%2005 5.75% 5.75% 4.25-6.00%Expected Long-termRate of Return2007 8.50% 8.50% 3.75-8.00%2006 8.50% 8.50% 3.75-8.00%2005 8.50% 8.50% 3.75-8.00%Rate of Compensation Increase2007 4.88% 4.69% 1.00-4.00%2006 4.80% 4.50% 1.00-4.00%2005 4.60% 4.50% 3.00-5.50%
TheCompany adjusts its discount rates at the end of each fiscal year based on yield curvesof high-quality debt instruments over durations that match the expected benefit payouts ofeach plan. The expected long-term rate of return assumption is based on the Company’scurrent and expected future portfoliomix by asset class, and expected nominal returns ofthese asset classes. The rate of compensation increase assumption is generally based on salaryand incentive increases.
A newmortality table assumption was adopted by the Company effective with themeas-urement of theDecember 31, 2005, benefit obligations, moving from the 1983GAMmor-tality table to the RP-2000CH table. This change inmortality table increased pensionliabilities by approximately 2%.
Medical TrendsTheU.S. RetireeHealth and Life Insurance Planmakes up approximately 98% of the
RetireeHealth liability. Therefore, the following information relates to theU.S. plan only.
Healthcare Cost Trend Rate Pre-age 65 Post-age 65
2007 10.30% 11.30%2006 11.30% 12.30%
Ultimate Trend Rate Pre-age 65 Post-age 65
2007 5.0% 6.0%2006 5.0% 6.0%
Year at which the Rate Reachesthe Ultimate Trend Rate Pre-age 65 Post-age 65
2007 2014 20142006 2014 2014
Increasing the assumed trend rate for healthcare costs by one percentage point wouldincrease the accumulated postretirement benefit obligation (the APBO) and total serviceand interest cost component approximately $2,343 and $252, respectively. Decreasing theassumed trend rate for healthcare costs by one percentage point would decrease the APBOand total service and interest cost component approximately $2,036 and $213, respectively.Based on amendments to theU.S. plan approved in 1999, which became effective in 2003,cost increases borne by the Company are limited to theUrbanCPI, as defined.
F - 2 0

Retirement Plan AssetsThe following table sets forth the weighted-average asset allocations of the Company’s
retirement plans at December 31, 2007 and 2006, by asset category.
Asset Category U.S. U.K. Canada
Equity securities20072006
57.9%61.8%
73.1%72.4%
70.1%68.3%
Debt securities20072006
30.3%27.7%
21.7%21.8%
29.9%31.7%
Alternative20072006
11.8%10.5%
4.2%4.8%
0.0%0.0%
Cash20072006
0.0%0.0%
1.0%1.0%
0.0%0.0%
Total20072006
100.0%100.0%
100.0%100.0%
100.0%100.0%
TheCompany employs a total-return investment approach whereby amix of equities andfixed income investments are used tomaximize the long-term return of plan assets for aprudent level of risk. Alternative assets such as real estate, private equity and hedge fundsmaybe used to enhance long-term returns while improving portfolio diversification. Risk toler-ance is established through consideration of plan liabilities, plan funded status and corporatefinancial condition. Investment risk is measured andmonitored on an ongoing basis throughquarterly investment portfolio reviews, annual liabilitymeasurements and periodic asset/liability studies.
U.S. Defined Benefit PlanThe equity investments are diversified amongU.S. and non-U.S. stocks of small and large
capitalizations. The current target allocation (midpoint) for the investment portfolio isEquity Securities – 60%, Debt Securities – 30%, Alternative – 10% andCash – 0%.
U.K. PlanThe equity investments are diversified amongU.K. and international stocks of small and
large capitalizations. The current target allocation (midpoint) for the investment portfolio isEquity Securities – 72%, Debt Securities – 22%, Alternative – 5% andCash – 1%.
Canadian PlanThe equity investments are diversified amongCanadian and international stocks of pri-
marily large capitalizations. The current target allocation (midpoint) for the investment port-folio is Equity Securities – 50%, Debt Securities – 50%, Alternative – 0% andCash – 0%.
Retiree Health and Life Insurance Plan AssetsThe following table sets forth the weighted-average asset allocations of the Company’s
U.S. retiree health and life insurance plan at December 31, 2007 and 2006, by asset category.Asmentioned previously, the U.S. RetireeHealth and Life Insurance Planmakes up approx-imately 98% of the RetireeHealth liability. Therefore, the following information relates totheU.S. Plan only.
Asset Category
Equity securities20072006
58.7%58.4%
Debt securities20072006
33.5%32.6%
Alternative20072006
7.6%6.9%
Cash20072006
0.2%2.1%
Total20072006
100.0%100.0%
ContributionsTheCompany estimates that it will makeminimal voluntary contributions to its defined-
benefit retirement and retiree health and life insurance plans in 2008.
Medicare Prescription Drug, Improvement and Modernization Act of 2003InMay 2004, the Financial Accounting Standards Board (FASB) issued FASB Staff
Position 106-2, ‘Accounting andDisclosure Requirements Related to theMedicare Pre-scriptionDrug, Improvement andModernizationAct of 2003’ (FSP 106-2), which requiresmeasures of the accumulated postretirement benefit obligation and net periodic postretire-ment benefit costs to reflect the effects of theMedicare PrescriptionDrug, ImprovementandModernizationAct of 2003 (theAct). FSP 106-2 was effective for interim or annual
form 10-k | sonoco 2007 annual report F - 2 1

reporting periods beginning after June 15, 2004. TheCompany adopted and retroactivelyapplied FSP 106-2 as of the effective date. In response to the Company’s reflection of theeffects of the Act and the adoption of FSP 106-2, the accumulated postretirement benefitobligation was reduced by $48,940 and net periodic benefit costs were reduced by $9,080 in2004. The reduction in obligation directly related to the subsidy was $816 and $3,394 in 2007and 2006, respectively. The projected subsidy as of December 31, 2007, was substantially lessthan the projected subsidy at the time of adoption because of changes the Companymadeduring 2005 to the eligibility for retireemedical benefits. As part of these changes, pre-scription drug benefits forMedicare-eligible retirees were eliminated for those employeeswho retired after 1981 and for all future retirees, thereby significantly reducing the projectedsubsidy. These changes resulted in an overall reduction in the accumulated postretirementbenefit obligation of $38,132 in 2005, which is being amortized over a period of 4.6 years. Thebenefit of this amortization will cease during 2010.
The following table sets forth the Company’s projected subsidy from the government forthe next ten years:
YearProjectedSubsidy
2008 $ 952009 $ 942010 $ 932011 $ 902012 $ 892013-2017 $413
sonoco savings planTheCompany sponsors the Sonoco Savings Plan for its U.S. employees, a defined con-
tribution retirement plan. In accordance with the IRS “SafeHarbor”matching contributionsand vesting provisions the plan provides 100%Companymatching on the first 3% of pre-taxcontributions, 50%Companymatching on the next 2% of pre-tax contributions and 100%immediate vesting. The plan also provides for participant contributions of 1% to 30% of grosspay. TheCompany’s expenses related to the plan for 2007, 2006 and 2005 were approx-imately $15,700, $14,000 and $13,000, respectively.
sonoco investment and retirement planTheCompany also sponsors the Sonoco Investment and Retirement Plan, a defined
contribution pension plan, for its salaried and non-unionU.S. employees who were hired onor after January 1, 2004, the Plan’s effective date. TheCompanymakes an annual con-tribution of 4% of all eligible pay plus 4% of eligible pay in excess of the Social Security wagebase to eligible participant accounts. Participants are fully vested after five years of service orupon reaching age fifty-five, if earlier. TheCompany’s expenses related to the plan for 2007,2006 and 2005 were approximately $4,757, $1,244 and $414, respectively.
12. Income TaxesTheCompany provides for income taxes using the asset and liabilitymethod.Under
thismethod, deferred tax assets and liabilities are determined based on differences
between financial reporting requirements and tax laws. Assets and liabilities aremeas-
ured using the enacted tax rates and laws that will be in effect when the differences are
expected to reverse.
The provision for taxes on income for the years endedDecember 31 consists of the fol-lowing:
2007 2006 2005
Pre-tax incomeDomestic $ 194,262 $210,444 $185,089Foreign 61,364 64,364 46,037
Total pre-tax income $255,626 $274,808 $231,126
CurrentFederal $ 59,030 $ 83,845 $ 85,047State 5,764 (2,733) 4,311Foreign 22,332 27,482 19,538
Total current $ 87,126 $108,594 $108,896
DeferredFederal $ (12,381) $ (12,060) $ (27,110)State (4,086) (1,207) 4,116Foreign (15,473) (1,998) (1,728)
Total deferred $ (31,940) $ (15,265) $ (24,722)
Total taxes $ 55,186 $ 93,329 $ 84,174
F - 2 2

Deferred tax liabilities (assets) are comprised of the following at December 31:
2007 2006
Depreciation $ 109,257 $ 109,824Employee benefits 11,898 2,942Intangibles 66,676 45,776
Gross deferred tax liabilities $ 187,831 $ 158,542
Retiree health benefits $ (25,258) $ (24,433)Foreign loss carryforwards (67,903) (49,984)Capital loss carryforwards (9,376) (9,048)Employee benefits (69,367) (85,996)Accrued liabilities and other (44,478) (25,558)
Gross deferred tax assets $(216,382) $(195,019)
Valuation allowance on deferred tax assets $ 73,175 $ 56,754
Total deferred taxes, net $ 44,624 $ 20,277
Approximately $283,051 of foreign subsidiary loss carryforwards remain at December 31,2007. Their use is limited to future taxable earnings of the respective foreign subsidiaries. Ofthese loss carryforwards, approximately $208,350 have no expiration date. The remaining losscarryforwards expire at various dates in the future. Approximately $6,092 of state losscarryforwards and $3,114 of state credit carryforwards remain at December 31, 2007. Thestate loss and credit carryforwards expire at various dates in the future.
A reconciliation of theU.S. federal statutory tax rate to the actual consolidated taxexpense is as follows:
2007 2006 2005
Statutory tax rate $ 89,470 35.0% $96,183 35.0% $80,894 35.0%State income taxes, net of federaltax benefit 2,017 0.8 3,182 1.2 1,836 0.8
Repatriation — — — — 9,891 4.3Valuation allowance 919 0.4 9,175 3.3 5,001 2.2IRS and state examinations andsettlements (16,419) (6.4) (5,354) (1.9) (632) (0.3)
Foreign earnings taxed at other thanU.S. rates (8,894) (3.5) (6,343) (2.3) (2,250) (1.0)
Deferred tax impact of enactedforeign rate reductions (6,107) (2.4) — — — —
Other, net (5,800) (2.3) (3,514) (1.3) (10,566) (4.6)
Total taxes $ 55,186 21.6% $93,329 34.0% $84,174 36.4%
Undistributed earnings of international subsidiaries totaled $155,968 at December 31,2007. Deferred taxes have not been provided on the undistributed earnings, as the Companyconsiders these amounts to be indefinitely reinvested to finance international growth andexpansion. If such amounts were remitted, loaned to the Company, or the stock in the for-eign subsidiaries sold, these earnings could become subject to tax.
During 2007, the Company had a favorable impact of $16,419 from lapses of statutes oflimitations in federal and state jurisdictions. Also, the Company had a favorable impact of$6,107 from enacted tax rate reductions in various foreign jurisdictions.
During 2006, the Company entered into favorable tax agreements with state tax author-ities and closed state tax examinations for less than originally anticipated, which resulted inthe reversal of previously accrued taxes of $5,354. This was mostly offset by the impact of$4,867 resulting from restructuring charges for which a tax benefit could not be recognized.
During 2005, the Company repatriated $124,658 from foreign subsidiaries under theprovisions of the American JobsCreationAct of 2004 (AJCA).Under this temporaryincentive, a portion of the repatriated funds qualified for an 85% dividends-receiveddeduction. TheCompany recordedU.S. federal and state taxes on the repatriated funds of$10,074. TheCompany also closed state tax examinations resulting in the reversal of pre-viously accrued taxes totaling approximately $632.
sonoco 2007 annual report F - 2 3

FIN 48 Liabilities:TheCompany adopted the provisions of Financial Accounting Standards Board Inter-
pretationNo. 48, “Accounting forUncertainty in IncomeTaxes” (FIN 48), on January 1,2007. As a result of the adoption, the Company recorded a reduction of approximately$5,600 to the January 1, 2007 balance of retained earnings.
Reconciliation of beginning and ending unrecognized tax benefits
GrossUnrecognizedTax Benefits at January 1, 2007 $ 55,700Increases in prior years’ unrecognized tax benefits 2,000Decreases in prior years’ unrecognized tax benefits (3,000)Increases in current year unrecognized tax benefits 7,700Decreases in unrecognized tax benefits from the lapse of statutes of limitations (25,300)Settlements (400)
GrossUnrecognizedTax Benefits at December 31, 2007 $ 36,700
Of the unrecognized tax benefit balances at December 31, 2007 and January 1, 2007,approximately $28,300 and $39,800, respectively, would have an impact on the effective taxrate if ultimately recognized.
Interest and/or penalties related to income taxes are reported as part of income taxexpense. AtDecember 31, 2007 and January 1, 2007, the Company had approximately$7,500 and $6,400, respectively, accrued for interest. Tax expense for the year endedDecember 31, 2007 includes $1,100 of interest expense, which is comprised of an interestbenefit of approximately $3,500 related to the expiration of statutes of limitations and inter-est expense of $4,600 on unrecognized tax benefits.
TheCompany and/or its subsidiaries file federal, state and local income tax returns in theUnited States and various foreign jurisdictions.With few exceptions, the Company is nolonger subject toU.S. federal, or non-U.S., income tax examinations by tax authorities foryears before 2004.With respect to state and local income taxes, the Company is no longersubject to examination prior to 2002, with few exceptions.
The estimate for the potential outcome of any uncertain tax issue is highly judgmental.TheCompany believes it has adequately provided for any reasonable foreseeable outcomerelated to thesematters. However, future results may include favorable or unfavorableadjustments to estimated tax liabilities in the period the assessments aremade or resolved orwhen statutes of limitation on potential assessments expire. Additionally, the jurisdictions inwhich earnings or deductions are realizedmay differ from current estimates. As a result, theeffective tax ratemay fluctuate significantly on a quarterly basis.
13. Commitments and Contingenciescontingencies
TheCompany is a party to various legal proceedings incidental to its business and is sub-ject to a variety of environmental and pollution control laws and regulations in all juris-
dictions in which it operates. As is the case with other companies in similar industries, theCompany faces exposure from actual or potential claims and legal proceedings. Some ofthese exposures have the potential to bematerial. TheCompany cannot currently estimatethe final outcome ofmany of the items described or the ultimate amount of potential losses.
Pursuant to Statement of Financial Accounting StandardsNo. 5, ‘Accounting for
Contingencies,’ accruals for estimated losses are recorded at the time information
becomes available indicating that losses are probable and that the amounts are reason-
ably estimable.Amounts so accrued are not discounted.While the ultimate liabilities relat-ing to claims and proceedingsmay be significant to profitability in the period recognized, it ismanagement’s opinion that such liabilities, when finally determined, will not have an adversematerial effect on Sonoco’s consolidated financial position or liquidity.
environmental mattersDuring the fourth quarter of 2005, theU. S. Environmental ProtectionAgency
(EPA) notifiedU.S. PaperMills Corp. (U.S.Mills), a wholly owned subsidiary of the Com-pany, that U.S.Mills andNCRCorporation (NCR), an unrelated party, would be jointlyheld responsible to undertake a program to remove and dispose of certainPCB-contaminated sediments at a particular site on the lower Fox River inWisconsin. U.S.Mills andNCR reached an agreement between themselves that each would fund 50% of thecosts of remediation, which the Company currently estimates to be between $29,900 and$39,100 for the project as a whole. TheCompany has accrued a total of $17,650 for its esti-mated share of the total cleanup cost. Of the total accrued, $12,500 was recorded in 2005,and $5,150 was recorded in 2007. The total represents the Company’s best estimate of what itis likely to pay to complete the project. However, the actual costs associated with cleanup ofthis particular site are dependent uponmany factors and it is reasonably possible thatremediation costs could be higher than the current estimate of project costs. TheCompanyacquiredU.S.Mills in 2001, and the alleged contamination predates the acquisition.
In February 2007, the EPA andWisconsinDepartment ofNatural Resources (WDNR)issued a general notice of potential liability under CERCLA and a request to participate inremedial action implementation negotiations relating to a stretch of the lower Fox River,including the bay at Green Bay, (OperatingUnits 2 – 5) to eight potentially responsible par-ties, includingU.S.Mills. OperatingUnits 2 – 5 comprise a vastly larger area than the sitereferred to in the paragraph above. Although it has not accepted any liability, U.S.Mills isreviewing this information and discussing possible remediation scenarios, and the allocationof responsibility therefor, with other potentially responsible parties. OnApril 9, 2007, U.S.Mills, in conjunction with other potentially responsible parties, presented to the EPA and theWDNR a proposed schedule tomediate the allocation issues among eight potentiallyresponsible parties, includingU.S.Mills. Non-bindingmediation began inMay 2007 and iscontinuing although no agreement among the parties has occurred.
OnNovember 13, 2007, EPA issued a unilateral AdministrativeOrder for RemedialAction pursuant to Section 106 of CERCLA. The order requires U.S.Mills and the seven
F - 2 4

other respondents to jointly take various actions to clean upOperatingUnits 2 – 5. Theorder establishes two phases of work. The first phase consists of planning and design work aswell as preparation for dredging and other remediation work andmust be completed byDecember 31, 2008. The second phase consists primarily of dredging and disposing of con-taminated sediments and capping of the dredged and less contaminated areas of the riverbottom. The second phase is required to begin in 2009 when weather conditions permit andis expected to continue for several years. The order also provides for a $32.5 per day penaltyfor failure by a respondent to comply with its terms as well as exposing a non-complyingrespondent to potential treble damages. AlthoughU.S.Mills has reserved its rights to contestliability for any portion of the work, it is cooperating with the other respondents to complywith the first phase of the order.
Themediation proceedings causedU.S.Mills to revise its estimate of the range of lossprobable to be incurred in connection with the remediation ofOperatingUnits 2 – 5. Basedon information currently available, there is no amount within the range that appears to be abetter estimate than any other. Accordingly, pursuant to applicable accounting rules, U.S.Mills recorded a charge of $20,000 in the second quarter of 2007 for the remediation ofOperatingUnits 2 – 5. The second quarter charge represents theminimum estimatedamount of potential loss U.S.Mills believes it is likely to incur. Developments since the sec-ond quarter, including the ongoingmediation and issuance of the AdministrativeOrder,have not yet providedU.S.Mills with a reasonable basis for further revising its estimate of therange of possible loss. U.S.Mills’ ultimate share of the liability, and any claims against theCompany, could conceivably exceed the net worth of U.S.Mills. TheCompany does notbelieve it is probable that the effect of U.S.Mills’ Fox River liabilities would result in a pre-taxloss that wouldmaterially exceed the net worth of U.S.Mills, which was approximately$80,000 at December 31, 2007.
TheCompany has been named as a potentially responsible party at several other environ-mentally contaminated sites. All of the sites are also the responsibility of other parties. Thepotential remediation liabilities are shared with such other parties, and, inmost cases, theCompany’s share, if any, cannot be reasonably estimated at the current time.
As ofDecember 31, 2007 and 2006, the Company (and its subsidiaries) had accrued$31,058 and $15,316, respectively, related to environmental contingencies. Of these, a total of$28,996 and $11,661 relate toU.S.Mills at December 31, 2007 and 2006, respectively. Theseaccruals are included in “Accrued expenses and other” on the Company’s Consolidated Bal-ance Sheets. U.S.Mills has insurance pursuant to which it may recover some or all of the costsit ultimately incurs, or it may be able to recoup some or all of such costs from third parties.There can be no assurance that such claims for recovery would be successful and no amountshave been recognized in the consolidated financial statements of the Company for suchpotential recovery or recoupment.
commitmentsAs ofDecember 31, 2007, the Company had long-term obligations to purchase elec-
tricity and steam, which it uses in its production processes. In addition, the Company hadlong-term purchase commitments for certain rawmaterials, principally steel. These purchasecommitments require the Company tomake total payments of approximately $289,600, asfollows: $23,700 in 2008; $23,700 in 2009; $23,700 in 2010, $20,400 in 2011 and a total of$198,100 from 2012 through 2027.
14. Shareholders’ Equity and Earnings per Sharestock repurchases
In April 2006, the Company’s Board ofDirectors rescinded all previously approved stockrepurchase programs in conjunction with its approval of a new program, which authorizedthe repurchase of up to 5,000,000 shares of the Company’s common stock. In February 2007,the Company completed the repurchase of 1,500,000 shares of its common stock for a totalcost of $56,730. In August 2007, the Company repurchased an additional 1,500,000 shares ofSonoco common stock for $51,409. TheCompany’s Board ofDirectors has takenmultipleactions, most recently inOctober 2007, tomaintain the standing 5,000,000 share author-ization. Accordingly, at December 31, 2007, the number of shares available for futurerepurchase remains at 5,000,000. In addition, the Company repurchased approximately27,000 shares of common stock for $1,067 to cover the tax withholding obligations inassociation with the exercise of stock appreciation rights and performance-based stockawards. These shares were not repurchased as part of a publicly announced plan or program.In 2006, the Company repurchased 2,5000,000 shares of Sonoco common stock for $82,668.
earnings per shareThe following table sets forth the computation of basic and diluted earnings per share:
2007 2006 2005
Numerator:Net income $ 214,156 $ 195,081 $ 161,877
Denominator:Weighted-average commonshares outstanding 100,632,000 100,073,000 99,336,000
Dilutive effect of stock-basedcompensation 1,243,000 1,461,000 1,082,000
Diluted outstanding shares 101,875,000 101,534,000 100,418,000Net income per common share
Basic $ 2.13 $ 1.95 $ 1.63Diluted $ 2.10 $ 1.92 $ 1.61
TheCompany declared dividends totaling $1.02 and $.95 per share in 2007 and 2006,respectively.
form 10-k | sonoco 2007 annual report F - 2 5

Certain stock appreciation rights and options to purchase shares of the Company’scommon stock are not dilutive because the exercise price is greater than themarket price ofthe stock at the end of the fiscal year. Accordingly, the following shares were not included inthe computations of diluted income per share amounts:
2007 2006 2005
Anti-dilutive options/SARs 1,586,000 2,000 1,147,000
These options/SARsmay become dilutive in future periods if themarket price of theCompany’s common stock appreciates. No adjustments weremade to reported net incomein the computation of earnings per share.
15. Financial Reporting for Business SegmentsTheCompany identifies its reportable segments in accordancewith Statement of
Financial Accounting StandardsNo. 131, ‘Disclosures about Segments of an Enterprise
andRelated Information’ (FAS 131), by evaluating the level of detail reviewed by the
chief operating decisionmaker, gross profitmargins, nature of products sold, nature of
the production processes, type and class of customer,methods used to distribute prod-
uct and nature of regulatory environment.
TheConsumer Packaging segment includes the following products: round and shapedrigid packaging, both composite and plastic; printed flexible packaging; andmetal and peel-ablemembrane ends and closures.
The Tubes andCores/Paper segment includes the following products and services: high-performance paper and composite paperboard tubes and cores; fiber-based constructiontubes and forms; recycled paperboard; linerboard; recovered paper and other recycledmaterials.
The Packaging Services segment provides the following products and services: designing,manufacturing, assembling, packing and distributing temporary, semipermanent and perma-nent point-of-purchase displays; brand artworkmanagement; and supply chainmanagementservices including contract packing, fulfillment and scalable service centers.
AllOther Sonoco represents the activities and businesses of the Company’s consolidatedsubsidiaries that do notmeet the aggregation criteria outlined in FAS 131, and thereforecannot be combined with other operating segments into a reportable segment. AllOtherSonoco includes the following products: wooden, metal and composite reels; molded andextruded plastics; custom-designed protective packaging; and paper amenities such as coast-ers and glass covers.
F - 2 6

Restructuring charges, interest expense and interest income are included inCorporate operating profits.
Years endedDecember 31ConsumerPackaging
Tubes andCores/Paper
PackagingServices
All OtherSonoco Corporate Consolidated
Total Revenue2007 $1,441,037 $1,807,035 $519,462 $415,799 $ — $4,183,3332006 1,308,184 1,614,721 456,877 407,411 — 3,787,1932005 1,250,916 1,569,170 456,161 377,968 — 3,654,215Intersegment Sales1
2007 $ 2,918 $ 95,071 $ 629 $ 44,723 $ — $ 143,3412006 3,430 89,163 44 37,717 — 130,3542005 3,465 87,113 284 34,779 — 125,641Sales toUnaffiliatedCustomers2007 $1,438,119 $1,711,964 $518,833 $371,076 $ — $4,039,9922006 1,304,754 1,525,558 456,833 369,694 — 3,656,8392005 1,247,451 1,482,057 455,877 343,189 — 3,528,574Operating Profits2
2007 $ 104,516 $ 143,692 $ 44,482 $ 51,385 $ (88,449) $ 255,6262006 109,624 148,177 39,181 49,106 (71,280) 274,8082005 103,505 107,060 44,813 40,607 (64,859) 231,126IdentifiableAssets3
2007 $1,149,832 $1,439,045 $321,536 $189,179 $240,651 $3,340,2432006 836,705 1,388,453 326,518 185,287 179,715 2,916,6782005 738,023 1,258,166 321,742 189,369 474,440 2,981,740Depreciation,Depletion andAmortization4
2007 $ 66,494 $ 91,160 $ 11,842 $ 11,843 $ — $ 181,3392006 55,074 85,863 11,942 11,984 — 164,8632005 56,281 83,737 11,994 11,062 — 163,074Capital Expenditures4
2007 $ 74,208 $ 75,654 $ 3,674 $ 15,908 $ — $ 169,4442006 48,153 63,290 3,439 8,397 — 123,2792005 50,802 62,312 4,913 11,085 — 129,112
1 Intersegment sales are recorded at amarket-related transfer price.2 Corporate 2007, 2006 and 2005 includes restructuring costs of $ (23,462), $(1,912) and $(4,617) respectively, associated with the Consumer Packaging segment; $(10,343), $(23,655)
and $(16,020), respectively, associated with the Tubes andCores/Paper segment; $(585), $(77) and $0, respectively, associated with the Packaging Services segment; $(1,801), $(453)and $(600), respectively, associated with AllOther Sonoco; and a reversal of previously recorded restructuring charges of $127 in 2006 related toCorporate. Interest expense and inter-est income are also shown underCorporate.
3 Identifiable assets are those assets used by each segment in its operations. Corporate assets consist primarily of cash and cash equivalents, investments in affiliates, headquarters facilitiesand prepaid expenses.
4 Depreciation, depletion and amortization, as well as capital expenditures that are incurred at Corporate, are allocated to the reportable segments andAllOther Sonoco.
form 10-k | sonoco 2007 annual report F - 2 7

geographic regionsSales to unaffiliated customers and long-lived assets by geographic region are as follows:
2007 2006 2005
Sales toUnaffiliatedCustomers
United States $2,519,949 $2,343,046 $2,291,302Europe 730,393 576,096 552,506Canada 384,416 369,563 340,532All other 405,234 368,134 344,234
Total $4,039,992 $3,656,839 $3,528,574
Long-livedAssets
United States $1,346,288 $1,217,462 $1,054,430Europe 368,492 353,841 342,601Canada 303,454 165,796 165,243All other 162,098 148,519 143,894
Total $2,180,332 $1,885,618 $1,706,168
Sales are attributed to countries/regions based upon the plant location fromwhich prod-ucts are shipped. Long-lived assets are comprised of property, plant and equipment, goodwill,intangible assets and investment in affiliates (seeNotes 6 and 7).
16. Accumulated Other Comprehensive LossThe following table summarizes the components of accumulated other comprehensive
loss, and the changes in accumulated other comprehensive loss, net of tax as applicable, forthe years endedDecember 31, 2007 and 2006:
ForeignCurrencyTranslationAdjustments
DefinedBenefitPlans
DerivativeFinancialInstruments
AccumulatedOther
ComprehensiveLoss
Balance at December 31,2005 $(59,833) $ (57,737) $ 11,181 $(106,389)
Change during 2006 37,203 (179,879) (13,240) (155,916)
Balance at December 31,2006 (22,630) (237,616) (2,059) (262,305)
Change during 2007 95,449 58,958 524 154,931
Balance at December 31,2007 $ 72,819 $(178,658) $ (1,535) $(107,374)
The 2007 tax effect on theDefined Benefit Plans andDerivative Financial Instrumentswas $(35,985) and $(304), respectively. The 2006 tax effect on theDefined Benefit Plans andDerivative Financial Instruments was $112,059 and $7,453, respectively. The cumulative taxbenefit of theDefined Benefit Plans was $102,805 and $138,790 at December 31, 2007 and2006, respectively. Additionally, the cumulative tax effect of Derivative Financial Instrumentswas $860 and $1,164 at December 31, 2007 and 2006, respectively.
17. New Accounting PronouncementsThe Financial Accounting Standards Board (FASB) has issued Statement of Financial
Accounting StandardsNo. 158, “Employers’ Accounting forDefined Benefit Pension andOther Postretirement Plans” (FAS 158). FAS 158 required the Company to recognize thefunded status of each of its defined benefit plans as an asset or liability on theDecember 31,2006 balance sheet, with any subsequent changes in funded status that are not reflected in netincome recognized in other comprehensive income/loss.While FAS 158 did not changehow pensions and other postretirement benefits plans are accounted for and reported in theincome statement, it will require the Company tomeasure the funded status of its plans as ofyear end beginning with its December 31, 2008 balance sheet. Because the Company cur-rently uses December 31 as themeasurement date formost of its plans, including its majorU.S.-based plans, this change will not have amaterial effect on the Company’s financialstatements.
The FASB has issued FAS 157, “Fair ValueMeasurements,” which defines fair value,establishes a framework formeasuring fair value and expands disclosures about fair valuemeasurements. FAS 157 does not require any new fair valuemeasurements. The provisionsof FAS 157 will become effective in two phases. Beginning January 1, 2008, the Company isrequired to apply the provisions of FAS 157 to financial assets and liabilities. Effective Jan-uary 1, 2009, the provisions of FAS 157 will apply to all assets and liabilities. Other than addi-tional disclosure, the adoption of FAS 157 is not expected to have amaterial impact on theCompany’s financial statements.
The FASB has issued FAS 159, “The Fair ValueOption for Financial Assets and Finan-cial Liabilities – Including anAmendment of FASB StatementNo. 115.” This Statementpermits companies to elect tomeasure eligible items at fair value. At each reporting datesubsequent to adoption, unrealized gains and losses on items for which the fair value optionhas been electedmust be reported in earnings (or another performance indicator if the busi-ness entity does not report earnings). This Statement is effective for Sonoco as of January 1,2008. TheCompany did notmake any fair value elections and, therefore, the adoption ofFAS 159 did not have amaterial impact on the Company’s financial statements.
F - 2 8

The FASB has ratified the consensus reached by the Emerging Issues Task Force (EITF)in issue 6-10, “Accounting for theDeferredCompensation and Postretirement BenefitAspects of Collateral Assignment Split-Dollar Life InsuranceArrangements.” Under thisconsensus, the EITF concluded that an employer should recognize a liability for the post-retirement benefit, if any, related to a collateral assignment split-dollar life insurance arrange-ment and should recognize andmeasure the asset under a collateral assignment arrangementbased on the substance of the arrangement. The consensus is effective for the Company onJanuary 1, 2008. The adoption of EITF Issue 6-10 did not have amaterial impact on theCompany’s financial position or results of operations.
The FASB has ratified the consensus reached by the EITF in issue 6-11, “Accounting forIncomeTax Benefits of Dividends on Share-Based Payment Awards.” Under this consensus,the EITF concluded a realized income tax benefit from dividends or dividend equivalentsthat are charged to retained earnings and are paid to employees for equity classified non-vested equity shares, nonvested equity share units, and outstanding equity share optionsshould be recognized as an increase in additional paid-in capital. The consensus is effective forthe Company on January 1, 2008 prospectively for income tax benefits derived from divi-dends declared beginning in 2008. The adoption of EITF 6-11 is not expected to have amaterial impact on the Company’s financial statements.
The FASB has issued FAS 141(R), “Business Combinations” which replaces FAS 141.While FAS 141(R) retains the fundamental requirement that the acquisitionmethod ofaccounting be used for all business combinations, several significant changes weremade someof which include: the scope of transactions covered; the treatment of transaction costs andsubsequent restructuring charges; accounting for in-process research and development, con-tingent assets and liabilities, and contingent consideration; and how adjustments made to theacquisition accounting after the transaction are reported. For Sonoco, this statement appliesprospectively to business combinations occurring on or after January 1, 2009.While applica-tion of this standard will not impact the Company’s financial statements for transactionsoccurring prior to the effective date, its applicationmay have a significant impact on theCompany’s accounting for future acquisitions compared to current practice.
The FASB has issued FAS 160, “Noncontrolling Interests in Consolidated FinancialStatements” which amends current accounting and reporting for a noncontrolling interest ina subsidiary and the deconsolidation of a subsidiary. This statement provides that a non-controlling interest in a subsidiary should be reported as equity rather than as a “minorityinterest” liability and requires that all purchases, sales, issuances and redemptions of ownershipinterests in a consolidated subsidiary be accounted for as equity transactions if the parentretains a controlling financial interest. FAS 160 also requires that a gain or loss be recognizedwhen a subsidiary is deconsolidated and, if a parent retains a noncontrolling equity invest-
ment in the former subsidiary, that the investment bemeasured at its fair value. This state-ment is effective January 1, 2009, and will be applied prospectively except for the presentationand disclosure requirements which are retrospective. Application of this standard is notexpected to have amaterial impact on the Company’s financial statements.
18. Selected Quarterly Financial DataThe following table sets forth selected quarterly financial data of the Company:
(Unaudited)First
QuarterSecondQuarter
ThirdQuarter
FourthQuarter
2007
Net sales $955,679 $994,431 $1,029,764 $1,060,118
Gross profit 185,165 190,073 187,279 191,277
Net income 53,104 42,351 64,533 54,168
Per common share
Net income – basic $ .53 $ .42 $ .64 $ .54
– diluted .52 .41 .63 .54
Cash
dividends – common .24 .26 .26 .26
Market price – high 38.90 44.91 44.75 34.76
– low 36.18 38.10 29.65 28.45
2006
Net sales $ 818,769 $ 917,010 $ 931,522 $ 989,538Gross profit 156,176 174,026 181,568 193,270Net income 45,144 49,342 61,091 39,504
Per common shareNet income – basic $ .45 $ .50 $ .61 $ .39
– diluted .44 .49 .60 .39Cashdividends – common .23 .24 .24 .24
Market price – high 34.75 34.75 34.75 38.71– low 28.76 29.45 30.30 33.10
form 10-k | sonoco 2007 annual report F - 2 9

19. Valuation and Qualifying AccountsColumnA Column B - Additions ColumnC ColumnD
Balance atBeginningof Year
Charged toCosts andExpenses
Charged toOther Deductions
Balanceat Endof Year
2007
Allowance for
Doubtful Accounts $ 8,983 $1,261 $ 1,3952 $2,1201 $ 9,519
LIFOReserve 14,602 1,8023 16,404
ValuationAllowance
onDeferredTax
Assets 56,754 918 15,5037 73,175
2006
Allowance forDoubtful Accounts $ 8,325 $ 2,263 $ 1,1692 $ 2,7741 $ 8,983
LIFOReserve 11,568 3,0343 14,602ValuationAllowanceonDeferred TaxAssets 43,022 9,175 4,5576 56,754
2005
Allowance forDoubtful Accounts $ 8,286 $ 3,6612 $ (162)2 $ 3,4601 $ 8,325
LIFOReserve 10,701 8673 11,568ValuationAllowanceonDeferred TaxAssets 43,192 5,0015 5,1712,4 43,022
1 Includes amounts written off.2 Includes translation adjustments and other insignificant adjustments.3 Includes adjustments based on pricing and inventory levels.4 Includes utilization and expiration of domestic capital loss carryforwards and increases
from foreign net operating losses for which no tax benefit can be realized.5 Includes utilization of domestic capital loss carryforwards and increases from foreign
net operating losses for which no tax benefit can be realized.6 Includes translation adjustments.7 Includes changes in valuation allowance due to foreign net operating losses and trans-
lation adjustments.
F - 3 0

Item 9. Changes in and Disagreements with Accountantson Accounting and Financial Disclosure
Not applicable.
Item 9A. Controls and ProceduresEvaluation of Disclosure Controls and Procedures
Under the supervision, and with the participation, of ourmanagement, including ourprincipal executive officer and principal financial officer, we conducted an evaluation of ourdisclosure controls and procedures (as defined in Rule 13a-15(e) under the SecuritiesExchangeAct of 1934). Based on this evaluation, our principal executive officer and principalfinancial officer concluded that such controls and procedures, as of the end of the year cov-ered by this Annual Report on Form 10-K, were effective.
Management’s Report on Internal Control over Financial ReportingOurmanagement is responsible for establishing andmaintaining adequate internal con-
trol over financial reporting, as such term is defined in Rule 13a-15(f) under the SecuritiesExchangeAct of 1934. Under the supervision and with the participation of ourmanagement,including our principal executive officer and principal financial officer, we conducted anevaluation of the effectiveness of our internal control over financial reporting based on theframework in Internal Control – Integrated Framework issued by the Committee of Spon-soringOrganizations of the TreadwayCommission. Based on our evaluation under theframework in Internal Control – Integrated Framework, ourmanagement concluded thatour internal control over financial reporting was effective as of December 31, 2007. Pricewa-terhouseCoopers LLP (PWC ), our independent registered public accounting firm, hasaudited the effectiveness of our internal control over financial reporting as of December 31,2007, and has issued an attestation report, which appears at the beginning of Item 8 of thisAnnual Report on Form 10-K.
Changes in Internal Control over Financial ReportingTheCompany is continuously seeking to improve the efficiency and effectiveness of its
operations and of its internal controls. This results in refinements to processes throughoutthe Company.However, there has been no change in the Company’s internal control overfinancial reporting (as defined in Rule 13a-15(f) under the Securities ExchangeAct of 1934)during themost recent fiscal quarter that has materially affected, or is reasonably likely tomaterially affect, the Company’s internal control over financial reporting.
Item 9B. Other InformationNot applicable.
2 6

part iii
Item 10. Directors and Executive Officers of the RegistrantThe information set forth in the Company’s definitive Proxy Statement for the annual
meeting of shareholders to be held onApril 16, 2008 (the Proxy Statement), under the cap-tions “Election ofDirectors,” “InformationConcerningDirectorsWhose TermsContinue”and “Section 16(a) Beneficial Ownership ReportingCompliance,” is incorporated herein byreference. Information about executive officers of the Company is set forth in Item 1 of thisAnnual Report on Form 10-K under the caption “ExecutiveOfficers of the Registrant.”
Code of Ethics –TheCompany has adopted a code of ethics (as defined in Item 406of Regulation S-K) that applies to its principal executive officer, principal financial officer,principal accounting officer, and other senior executive and senior financial officers. Thiscode of ethics is available through the Company’sWeb site, www.sonoco.com, and is avail-able in print to any shareholder who requests it. Any waivers or amendments to the provi-sions of this code of ethics will be posted to thisWeb site within five business days after thewaiver or amendment.
Audit Committee Members –TheCompany has a separately designated standingaudit committee established in accordance with Section 3(a)(58)(A) of the SecuritiesExchangeAct of 1934. The audit committee is comprised of the followingmembers:MarcD.Oken, Chairman; Pamela L. Davies; CalebC. Fort; John E. Linville; JamesM.Micali andPhillipe R. Rollier. EffectiveMarch 1, 2008, Dr. Davies will step down from theAuditCommittee and will be succeeded by LloydW.Newton.
Audit Committee Financial Expert –TheCompany’s Board ofDirectors hasdetermined that the Company has at least one “audit committee financial expert,” as thatterm is defined by Item 407(d)(5) of Regulation S-K promulgated by the Securities andExchangeCommission, serving on its audit committee.MarcD.Oken, meets the terms ofthe definition and is independent based on the criteria in theNewYork Stock ExchangeListing Standards. Pursuant to the terms of Item 407(d)(5) of Regulation S-K, a person whois determined to be an “audit committee financial expert” will not be deemed an expert forany purpose as a result of being designated or identified as an “audit committee financialexpert” pursuant to Item 407, and such designation or identification does not impose onsuch person any duties, obligations or liability that are greater than the duties, obligations andliability imposed on such person as amember of the audit committee and Board ofDirectorsin the absence of such designation or identification. Further, the designation or identificationof a person as an “audit committee financial expert” pursuant to Item 407 does not affect theduties, obligations or liability of any othermember of the audit committee or Board ofDirectors.
TheCompany’s CorporateGovernanceGuidelines, Audit Committee Charter, Corpo-rateGovernance andNominating Committee Charter and Executive Compensation
Committee Charter are available through the Company’sWeb site, www.sonoco.com. Thisinformation is available in print to any shareholder who requests it.
Item 11. Executive CompensationThe information set forth in theProxy Statement under the caption “Compensation
Committee Interlocks and Insider Participation,” under the caption “ManagementCompensation,” and under the caption “DirectorCompensation” is incorporated herein byreference. The information set forth in theProxy Statement under the caption “CompensationCommitteeReport” is also incorporated herein by reference, but pursuant to the Instructions toItem 407(e)(5) of Regulation S-K shall be deemed to be “furnished” and not “filed” andwill notbe deemed incorporated by reference into any filing under the SecuritiesAct of 1933 or theSecurities ExchangeAct of 1934 as a result of being so furnished.
Item 12. Security Ownership of Certain Beneficial Owners andManagement and Related Stockholder Matters
The information set forth in the Proxy Statement under the caption “SecurityOwner-ship of Certain Beneficial Owners,” and under the caption “SecurityOwnership ofManagement” is incorporated herein by reference.
sonoco 2007 annual report 2 7

equity compensation plan informationThe following table sets forth aggregated information about all of the Company’s com-
pensation plans (including individual compensation arrangements) under which equity secu-rities of the Company are authorized for issuance as of December 31, 2007:
Plan category
Number of securitiesto be issued upon
exercise ofoutstanding options,warrants and rights
(a)
Weighted-averageexercise price of
outstanding options,warrants and rights
(b)
Number of securitiesremaining available forfuture issuance underequity compensationplans (excluding
securities reflected incolumn (a))1
(c)
Equity compensationplans approved bysecurity holders 7,250,458 $27.50 3,339,361
Equity compensationplans not approvedby security holders — — —
Total 7,250,458 $27.50 3,339,361
1 TheCompany intends to present a proposal at its 2008AnnualMeeting of Share-holders for adoption of the 2008 Long-Term Incentive Plan. If this plan is approved byshareholders, the shares shown in this columnwill no longer be available for issuance.
The weighted-average exercise price of $27.50 relates to stock options, stock appreciationright awards, and deferred compensation stock units, which account for 5,863,020 of the7,250,458 securities issuable upon exercise. The remaining securities relate to performancecontingent restricted stock units and restricted stock unit awards that have no exercise pricerequirement.
Item 13. Certain Relationships and Related Transactions, andDirector Independence
The information set forth in the Proxy Statement under the captions “CompensationCommittee Interlocks and Insider Participation” and “Certain Relationships and RelatedTransactions,” and under the caption “CorporateGovernance –Director IndependencePolicies” is incorporated herein by reference. Eachmember of the Audit, CorporateGover-nance andNominating, and Executive CompensationCommittees is independent asdefined in the listing standards of theNewYork Stock Exchange.
Item 14. Principal Accountant Fees and ServicesThe information set forth in the Proxy Statement under the captions “Independent Regis-
tered Public Accounting Firm – Fees Relating to Services Provided by PWC for 2007” and“–Audit Committee Pre-approval of Audit and PermissibleNon-audit Services ofIndependentAuditors” is incorporated herein by reference.
2 8

part iv
Item 15. Exhibits and Financial Statement Schedules
(a) 1. Financial Statements –The following financial statements are provided under Item 8 – Financial Statements and SupplementaryData of this Annual Report on Form10-K:
– Consolidated Balance Sheets as of December 31, 2007 and 2006
– Consolidated Statements of Income for the years endedDecember 31, 2007, 2006 and 2005
– Consolidated Statements of Changes in Shareholders’ Equity for the years endedDecember 31, 2007, 2006 and 2005
– Consolidated Statements of Cash Flows for the years endedDecember 31, 2007, 2006 and 2005
– Notes toConsolidated Financial Statements
– Report of Independent Registered Public Accounting Firm
2. Financial Statement Schedules –All schedules are omitted because they are not required, are not applicable or the required information is given in the financialstatements orNotes thereto.
3. Exhibits
3-1 Articles of Incorporation, as amended (incorporated by reference to the Registrant’s Form 10-Q for the quarter ended June 27, 1999)
3-2 By-Laws, as amended (incorporated by reference to the Registrant’s Form 8-K filedDecember 6, 2007)
4-1 Indenture, dated as of June 15, 1991, between Registrant and The Bank ofNewYork, as Trustee (incorporated by reference to the Registrant’s Form S-4 (FileNumber 333-119863))
4-2 First Supplemental Indenture, dated as of June 23, 2004, between Registrant and The Bank ofNewYork, as Trustee (incorporated by reference to the Registrant’s Form 10-Qfor the quarter ended June 27, 2004)
4-3 Form ofNote for 5.625%Notes due 2016 (incorporated by reference to the Registrant’s Form S-4 (FileNumber 333-119863))
4-4 Form ofNote for 6.50%Notes dueNovember 15, 2013 (incorporated by reference to Registrant’s form 10-Q for the quarter ended September 30, 2001)
10-1 1991 Sonoco Products CompanyKey Employee Stock Plan, as amended (incorporated by reference to the Registrant’s Form 10-Q for the quarter ended September 30,2007)
10-2 Sonoco Products Company 1996Non-employeeDirectors’ Stock Plan, as amended (incorporated by reference to the Registrant’s Form 10-Q for the quarter endedSeptember 30, 2007)
10-3 Amendment toNon-employeeDirectors’ Stock Plan (incorporated by reference to Registrant’s Form 8-K filed February 3, 2006)
10-4 Sonoco Savings Plan (incorporated by reference to the Registrant’s Form S-8 filedOctober 28, 2002 (FileNo. 333-100799))
10-5 DeferredCompensation Plan for CorporateOfficers of Sonoco Products Company, as amended (incorporated by reference to the Registrant’s Form 10-Q for the quarterended September 30, 2007)
10-6 Omnibus Benefit Restoration Plan of Sonoco Products Company (incorporated by reference to the Registrant’s Form 10-K for the year endedDecember 31, 2002)
sonoco 2007 annual report 2 9

10-7 Description of revisions toOmnibus Benefit Restoration Plan of Sonoco Products Company approvedOctober 15, 2007 (incorporated by reference to Registrant’s Form 8-K filedOctober 16, 2007, and to the following portions of the Registrant’s Proxy Statement to be used in connection with the April 16, 2008AnnualMeeting of Shareholders:the section captioned “Management Compensation – Pension Restoration Benefit and SERPBenefit in the Restoration Plan” and the next-to-last paragraph of the sectioncaptioned “Management Compensation –CompensationDiscussion andAnalysis – Executive Benefit Elements – Supplemental Executive Retirement Plan.”
10-8 Form of Executive Bonus Life Agreement between the Company and certain executive officers (incorporated by reference to the Registrant’s Form 10-Q for the quarterended September 26, 2004)
10-9 Form of Executive Bonus Life Supplemental Agreement between the Company andCharles L. Sullivan Jr. (incorporated by reference to Registrant’s Form 10-K for the yearendedDecember 31, 2004)
10-10 Adjustment to Supplemental Executive Retirement Plan for Charles L. Sullivan Jr. (incorporated by reference to Registrant’s Form 8-K filedApril 22, 2005)
10-11 Amendment to terms of Restricted StockUnits granted toHarris E. DeLoach Jr. (incorporated by reference to Registrant’s Form 8-K filedOctober 19, 2005)
10-12 Amendment to 2006DirectorCompensation Program (incorporated by reference to Registrant’s Form 8-K filedOctober 19, 2005)
10-13 Description of StockAppreciation Rights and Long-termRestricted StockUnits granted to executive officers of the Registrant on January 31, 2006 (incorporated byreference to Registrant’s Form 8-K filed February 3, 2006)
10-14 Amended and RestatedCredit Agreement (incorporated by reference to Registrant’s Form 10-Q for the quarter ending June 25, 2006)
10-15 Sonoco Investment and Retirement Plan, effective January 1, 2004
12 Statements regardingComputation of Ratio of Earnings to FixedCharges
21 Subsidiaries of the Registrant
23 Consent of Independent Registered Public Accounting Firmwith respect to Registrant’s Form 10-K
31 Certifications of Chief ExecutiveOfficer andChief Financial Officer pursuant to Section 302 of the Sarbanes-Oxley Act of 2002 and 17C.F.R. 240.13a-14(a)
32 Certifications of Chief ExecutiveOfficer andChief Financial Officer pursuant to Section 906 of the Sarbanes-Oxley Act of 2002 and 17C.F.R. 240.13a-14(b)
99 Proxy Statement, filed in conjunction with annual shareholders’ meeting scheduled for April 16, 2008 (to be filed within 120 days after December 31, 2007)
3 0

signatures
Pursuant to the requirements of Section 13 or 15(d) of the Securities ExchangeAct of 1934, the Registrant has duly caused this report to be signed on its behalf by the undersigned, there-unto duly authorized, on this 28th day of February 2008.
SONOCOPRODUCTSCOMPANY
/s/ Harris E. DeLoach Jr.
Harris E. DeLoach Jr.Chairman, President andChief ExecutiveOfficer
Pursuant to the requirements of the Securities ExchangeAct of 1934, this report has been signed below by the following persons on behalf of the Registrant and in the capacities indicatedon this 28th day of February 2008.
/s/ C.J. Hupfer
C.J. HupferSenior Vice President andChief Financial Officer(principal financial officer)
/s/ Barry L. Saunders
Barry L. SaundersVice President andCorporateController(principal accounting officer)
sonoco 2007 annual report 3 1

signatures – continued
/s/ H.E. DeLoach Jr. President,
H.E. DeLoach Jr. Chief ExecutiveOfficer andDirector (Chairman)
/s/ C.J. Bradshaw Director
C.J. Bradshaw
/s/ J.L. Coker Director
J.L. Coker
/s/ P.L. Davies Director
P.L. Davies
/s/ C.C. Fort Director
C.C. Fort
/s/ E.H. Lawton III Director
E.H. Lawton III
/s/ J.E. Linville Director
J.E. Linville
/s/ J.M.Micali Director
J.M.Micali
/s/ J.H.Mullin III Director
J.H.Mullin III
/s/ L.W.Newton Director
L.W.Newton
/s/ M.D.Oken Director
M.D.Oken
/s/ P.R. Rollier Director
P.R. Rollier
/s/ T.E.Whiddon Director
T.E.Whiddon
3 2