Embed Size (px)
Citation preview

1
Copyright
by
Yorgho Jean Arditzoglou
1994

1
TEST METHODS FOR ELASTOMERIC
BEARINGS ON BRIDGES
by
YORGHO JEAN ARDITZOGLOU, B.S.A.E
THESIS
Presented to the Faculty of the Graduate School of
The University of Texas at Austin
in Partial Fulfillment
of the Requirements
for the Degree of
MASTER OF SCIENCE IN ENGINEERING

THE UNIVERSITY OF TEXAS AT AUSTIN
May 1994

1
TEST METHODS FOR ELASTOMERIC
BEARINGS ON BRIDGES
APPROVED BY
SUPERVISING COMMITTEE:
Supervisor: _________________________________
Joseph A. Yura

______________________________________
John L. Tassoulas

1
To my beloved parents and sisters
for their continuous love, encouragement, and support.

vi
ABSTRACT
TEST METHODS FOR ELASTOMERIC
BEARINGS ON BRIDGES
by
YORGHO JEAN ARDITZOGLOU, M.S.E.
THE UNIVERSITY OF TEXAS AT AUSTIN, 1994
SUPERVISOR: JOSEPH A. YURA
Elastomeric bearing pads are used extensively in bridge structures. Whereas, the mechanical
properties of elastomers like Young's modulus, compressive modulus, and shear modulus are usually
essential for the structural engineer's work, most rubber manufacturers describe their products in terms
of chemical compounds, hardness, tensile stress at some elongation, and compressive set measurements
in order to meet AASHTO material specifications. This paper discusses the material properties of
elastomers and the factors that influence these properties. The development of the AASHTO
specifications between 1961 and 1992 on elastomeric bearings are also summarized. In addition,
various sizes of bonded natural rubber blocks were tested in compression, tension, shear, and combined
compression and shear. Load deformation relationships were obtained from all tests and mechanical
properties of compressive modulus, tensile modulus, and shear modulus were calculated. Test results
indicated that specimen size affects the material properties of an elastomer. Furthermore, the measured
shear modulus values were not affected by various levels of compressive stress.

v
ACKNOWLEDGEMENTS
This study is part of the research sponsored by the Texas Department of Transportation,
TxDOT, under project 1304: "Elastomeric Bridge Bearings." It was conducted at the Phil M. Ferguson
Structural Engineering Laboratory at the Balcones Research Center of the University of Texas at
Austin.
I wish to express my thanks to Dr. Joseph A. Yura for his unlimited guidance and instruction
over the past two years. His priceless suggestions, immeasurable patience, and continuous
encouragement kept me motivated throughout the course of this project. I would also like to
acknowledge all the professors involved in this research, namely, Dr. Tassoulas, Dr. Klingner, and Dr.
Becker for their valuable comments and constructive criticism. Special thanks go to Dr. Tassoulas for
being more than willing to read over my thesis.
I would like to thank all the graduate students at Ferguson lab and especially my project
partners: Joe Muscarella, Osama Hamzeh, Andrew Haines, and Rose Chen. Special thanks to the
technical and administrative staff of the Phil M. Ferguson Structural Engineering Lab for their
assistance and cooperation.
Finally, I would like to thank God Almighty for giving me the strength and good health to
pursue my endeavors.

vi
April 20, 1993
vii
TABLE OF CONTENTS
Page
IST OF TABLES ............................................................................................................. x
IST OF FIGURES .......................................................................................................... xi
HAPTER 1: INTRODUCTION .................................................................................... 1
HAPTER 2: BACKGROUND........................................................................................ 3
TABLE OF CONTENTS.................................................................................................... vii
L
L
C
1.1 Problem Statement................................................................................... 1
1.2 Purpose of Study........................................................................................ 2
1.3 Scope of Tests ....................................................................................... 2
C
2.1 Rubber as an Engineering Material ..................................................... 3
2.1.1 Manufacture and Chemical Composition ............................... 3
2.1.1.1 Compounding................................................................................. 3
2.1.1.2 Processing...................................................................................... 4
2.1.1.3 Vulcanization.................................................................................. 7
2.1.2 Rubber Compared to Metals ......................................... 9
2.1.3 Behavior of Rubber.................................................................... 10
2.1.3.1 Creep, Relaxation, Energy Loss.................................................... 10
2.1.3.2 Compression, Tension, and Shear.................................................... 12
2.2 Elastomeric Bridge Bearings..................................................................... 13
2.2.1 Failure Modes: Reasons and Remedies ................................. 14
2 Structural Engineer and Rubber Technologist.................................... 15 .3
.4
2.3.1 Terminology and Importance of Communication .................. 16
2.3.2 Design Needs of the Structural Engineer ................................. 16
2.3.3 Mix Proportioning abilities of the Rubber Technologist ... 17
2 Summary of the AASHTO Specification Changes .............................. 18

viii
2.5 DuPont's Design Procedure for Neoprene Bearings............................ 33

ix
CHAPTER 3: MECHANICAL PROPERTIES OF ELASTOMERIC BEARINGS 35
3.1 Hardness ...................................................................................................... 35
3.2 Compressive Stiffness .......................................................................... 36
3.2.1 Design Aids and Limitations....................................................... 36
3.2.2 Compressive Modulus ............................................................... 37
3.2.3 Factors that Affect Compressive Modulus................................. 38
3.3 Shear Stiffness ............................................................................................ 39
3.3.1 Stress-Strain Behavior in Shear ............................................... 39
3.3.2 Shear Modulus................................................................................ 40
3.3.2.1 Determination of Shear Modulus ............................................... 40
3.4 Relation between Hardness and other Mechanical Properties ........ 43
CHAPTER 4: STATIC MATERIAL TESTS ON NR BLOCKS............................... 45
4.1 Test Setups ............................................................................................ 45
4.2 Supplier and Ordering Information...................................................... 45
4.3 Size of NR Specimens and Method of Cutting .................................. 50
4.4 Specimen Preparation ............................................................................ 50
4.5 Measurement of Specimen Properties ................................................ 50
4.6 Safety Precautions ................................................................................ 53
4.7 Rubber and Steel Surface Preparation................................................... 53
4.8 Adhesives ............................................................................................... 54
4.9 Displacements and Load Measurements .............................................. 57
4.10 Testing Procedures.................................................................................... 57
4.10.1 Compression Tests....................................................................... 57
4.10.2 Tension Tests .............................................................................. 58
4.10.3 Shear Tests................................................................................... 58
4.10.4 Combined Compression and Shear Tests ............................ 58
CHAPTER 5: ANALYSIS OF RESULTS.......................................................................... 60
5.1 Shear and Combined Compression and Shear Tests ......................... 60
5.2 Compression Tests ................................................................................. 66

x
xi
5.3 Tension Tests .......................................................................................... 71
5.4 Discussion of Test Results ................................................................. 78
CHAPTER 6: SUMMARY CONCLUSIONS AND RECOMMENDATIONS .......... 80
6.1 Summary ................................................................................................. 80
6.2 Conclusions ............................................................................................. 80
6.3 Recommendations and Future Research ........................................... 81
BIBLIOGRAPHY
................................................................................................................ 82
VITA
.................................................................................................................................... 85

xi
LIST OF FIGURES
igureF Page
........
and M
on and
12
gs
and
24
..
s
2.1 Rubber is Worked on the Mixing Mill ........................................................... 5
2.2 Chemical Ingredients are Added to the Rubber Band ..................................... 6
2.3 Carbon Black is Added to the Rubber Band ................................................. 6
2.4 The Rubber Band is Cut From the Mill .................................................. 7
2.5 Slabs of Rubber are Stored in a Controlled Temperature and Humidity .... 8
2.6 Rubber before and after Vulcanization .......................................................... 8
2.7 Structural Formulas for Polyisoprene and Polychloroprene ....................... 9
2.8 Stress-Strain Curves for Loading and Unloading of Rubber etals .... 10
2.9 Stress and Strain (creep) Relaxation in Elastomers ...................................... 11
2.10 Typical Stress-Strain Loading -Unloading Cycle of Rubber ...................... 11
2.11 Comparison of Stress-Strain Curves of Rubber in Compressi Shear 12
2.12 Tensile Stress-Strain Curve for Rubber ........................................................
2.13 Plain and Reinforced Elastomeric Bearin ................................................... 14
2.14 Slip Phenomenon in Plain and Reinforced Bearings ....................................... 15
2.15 Effect of Vulcanization Time on the Tensile Strength Modulus of NR 17
2.16 Compressive σ-ε Curves for 50 and 60 Durometer Elastomers (22) .....
2.17 Compressive σ-ε Curves for 50 and 60 Durometer Elastomers (23) ..... 29
2.18 Compression Curves for 50, 60, and 70 Durometer Neoprene ...................... 34
3.1 Compression Stiffness Factor q1 for Rectangular Cross-Sections ................ 38
3.2 Material Constant k as a Function of Hardness ........................................... 38
3.3 Compressive Stress-Strain Curves as a Function of Shape Factor ................. 39
3.4 Variation of Compressive Modulus Ec with Shape Factor and Hardness .... 39
3.5 Relationship of G to Hardness of Neoprene at Various Temperatures ..... 41
3.6a Arrangement of Bearings and Concrete Slabs ............................................ 42
3.6b Loading and Unloading Curves for the Bearings Shown in Figure 3.6a .... 42
3.7 (a) Quadruple Shear Test Piece (b) 1st and 6th Load-Deflection Curve .. 42
3.8 Relations Between Young's Modulus E, Shear Modulus G, and Hardness 44

xii
.....
.
n 1S4_0
omp
_01
re
4.1 Compression Test Setup ............................................................................. 46
4.2 Tension Test Setup .............................................................................. 47
4.3 Combined Compression and Shear Test Setup .......................................... 48
4.4 Shear Test Setup ........................................................................................... 49
4.5 Breakdown of the NR Specimens Used in the Test Program ..................... 51
4.6 Gluing Stages of the Compression and Tension Specimens ...................... 55
4.7 Gluing Stages of the Shear Specimens ...................................................... 56
5.1 Load-Displacement Cycles for Specime 1,02,03,04 ......................... 61
5.2 Stress-Strain Curves for one NR Block from Specimen 1S4_01,02,03,04 ..... 61
5.3 Shear Stress-Strain Curve for Specimen 1S4_01,02,03,04 ......................... 63
5.4 Shear Specimen at 50% Strain ...................................................................... 64
5.5 Shear Specimen at 100% Strain ................................................................... 64
5.6 Shear Specimen at 150% Strain ................................................................... 65
5.7 Shear Specimen Showing Bond Failure ........................................................ 65
5.8 Five Loading-Unloading Cycles for the C ression Specimen 1C4_01 ..... 67
5.9 Compressive Modulus Vakues for the 4 x 4 x 1in. Specimens ..................... 67
5.10 σ-ε Curve for Specimen 1C4_01 Showing Stress Relaxation and Creep ...... 70
5.11 Compressive Specimen 1C4_01 at 55% Strain ........................................... 70
5.12 Five Loading_Unloading Cycles for the Tension Specimen 1T4_01 ............. 71
5.13 Tensile Modulus Values for the 4 x 4 x 1in. Specimens ............................. 72
5.14 Complete Tensile Stress-Strain Curve for Specimen 1T4 ......................... 73
5.15 Tension Specimen 1T4_03 at 20% Strain ...................................................... 74
5.16 Tension Specimen 1T4_03 at 50% Strain ...................................................... 74
5.17 Tension Specimen 1T4_03 at 78% Strain ...................................................... 75
5.18 Tension Specimen 1T4_03 at Initial Ruptu ................................................. 75
5.19 Tension Specimen 1T4_03 at 90% Strain (Tear Propagation) ..................... 76
5.20 Tension Specimen 1T4_03 at 100% Strain .................................................... 76
5.21 Tension Specimen 1T4_03 at 110% Strain .................................................... 77
5.22 Tension Specimen 1T4_03 at 115% Strain .................................................... 77

x
LIST OF TABLES
Table Page 2.1 Physical Properties of Neoprene 1961 AASHTO .................................... 19
2.2 Physical Properties of Natural Rubber 1973 AASHTO ......................... 20
2.3 Physical Properties of Neoprene 1973 AASHTO ................................. 21
2.4 Shear Resistance Values for NR and Neoprene 1973 AASHTO ............. 22
2.5 Dimension Tolerances for Elastomeric Bearings 1977 and 1983 AASHTO 23
2.6 Shear Modulus and Creep Properties of Elastomers 1989 AASHTO .... 23
2.7 Dimension Tolerances for Elastomeric Bearings 1989 AASHTO .......... 26
2.8 Elastomer Properties at Different Hardnesses 1992 AASHTO ............ 27
2.9 Low Temperature Zones and Elastomer Grades 1992 AASHTO ........ 28
2.10 Natural Rubber Quality Control Tests 1992 AASHTO ....................... 31
2.11 Neoprene Quality Control Tests 1992 AASHTO ................................. 32
2.12 Dimension Tolerances for Elastomeric Bearings 1992 AASHTO ......... 33
2.13 Shear Modulus Values for Neoprene .................................................... 34
3.1 Compressive Stiffness Factors for Various Cross Sections .................. 37
3.2 Scatter of Published G and E values with respect to Hardness ............. 43
4.1a Physical Properties of the Compression Specimens .............................. 52
4.1b Physical Properties of the Tension Specimens .................................... 52
4.1c Physical Properties of the Shear Specimens ........................................ 52
5.1 Summary of the Calculated Shear Modulus Values from all Tests ........ 62
5.2 Computed Compression Modulus Values for all Specimens ................. 68
5.3 Comparison of the Measured Ec Values with the Ec Values from Eq. 3.2 . 68
5.4 Stress Relaxation and Creep Values for all Compression Specimens .... 69
5.5 Computed Tensile Modulus Values for all Specimens ....................... 72
5.6 Average Measured Ec, Et, and G Values and their Interrelationship .... 79

1
t Austin, UT.
CHAPTER 1
INTRODUCTION
This study is part of a larger research project sponsored by the Texas Department of
Transportation, TxDOT, entitled "Elastomeric Bearings." The project was funded to study the
behavior and performance of elastomeric bridge bearings and to recommend practical design
procedures for the TxDOT. The research was partitioned into several tasks, namely, field surveys,
basic material tests, development of engineering models, and design procedures. This study falls under
the basic material tests portion and concentrates on the mechanical properties of elastomers, mainly
natural rubber. The project was conducted at the Phil M. Ferguson Structural Engineering Laboratory,
FSEL, of the University of Texas a
1.1 Problem Statement
The current AASHTO specification (1) allows the structural engineer to design elastomeric
bridge bearings, both plain and steel laminated, based on their Durometer Shore A hardness or on their
material property of shear modulus, G. Specifying an elastomer by its hardness is simply a matter of
convenience since such a test is popular for its quickness and simplicity. However, it is worthwhile
mentioning that the hardness test is sensitive to the way the operator uses the instrument as well as to
the thickness of the sample. Whereas the hardness test is simple, easy, and convenient, it may not
provide an adequate measure of the mechanical properties of the elastomer. Moreover, the relationship
between shear modulus and hardness is not clearly defined and previously conducted studies show a lot
of scatter between these two properties.
The shear modulus, on the other hand, is a very important mechanical property of an elastomer
since it directly enters in the design equations of the AASHTO specifications for elastomeric bearings
(1). The AASHTO specifications strongly recommend that the bearing pad be fabricated based on a
specified shear modulus, rather than durometer hardness. Nevertheless, the method of obtaining a
certain mechanical property, say Young's modulus, E, or G, the type of tests that should be performed to
verify such properties, and the acceptable percent deviation from the required values are not well
documented.

2
ssary.
ated.
In addition, E is considered to be three times that of G based on a Poisson's ratio, v, for rubber
of approximately 0.5. However, this ratio is known to change from one elastomer to another. Since
the AASHTO specification replaces E with 3G in all its design equations, this creates a problem and
further investigation into this relationship is nece
1.2 Purpose of Study
The author intends to supply the engineer with a solid background concerning the mechanics
and behavior of elastomers that are relevant to the design of elastomeric bridge bearings. The
mechanical properties of elastomers that structural engineers are interested in will be addressed and the
capabilities of rubber technologists to manipulate these properties by varying chemical ingredients will
be emphasized. Most importantly, terminology used by both parties will be explained. Next, the
author will clarify some of the relationships between the various material and physical properties of
the elastomer such as durometer hardness, E, compressive modulus, Ec, and G. Finally, an
experimental study was conducted to compare the shear modulus values obtained from the tests with the
nominal shear modulus values ordered from the supplier. Furthermore, the effect of compressive stress
on the behavior of the rubber block in shear as well as the effect of specimen size on the calculated
material properties of the elastomer will be investig
1.3 Scope of Tests
Static tests in compression, tension, shear, and combined compression and shear on rubber
blocks comprise the experimental program presented in chapter four of this thesis. Tests were carried
out at room temperature on bonded natural rubber specimens that varied in sizes of 4 x 4 x 1 in.
(101.6 x 101.6 x 25.4 mm) and 2 x 2 x 0.5 in. (50.8 x 50.8 x 12.7 mm) and nominal shear moduli, Gn, of
100psi (0.69MPa), and 200psi (1.379MPa). Load deformation relationships were obtained from all
tests and mechanical properties such as Ec, tensile modulus, Et, and G values were determined.
3
CHAPTER 2
BACKGROUND
The starting material for the production of elastomers or rubbers is caoutchouc. Caoutchouc,
erived
.1 Rubber as an Engineering Material
ineering material depends on the understanding of its
havior
tion: Rubber manufacture usually consists
three g
d from the Indian word "Caa-o-chu", or "weeping tree", is polyisoprene, (C5H8)n, which is
recovered from the sap of the rubber tree, Hevea Brasiliensis (2). This material is referred to as natural
rubber, NR. After undergoing chemical compounding at elevated temperatures, NR is transformed
from a sticky and highly plastic state (caouchouc or raw rubber) to an elastic one (elastomer or rubber).
In the recent years a large number of synthetic rubbers, SR, with a wide variety of chemical
compositions have been developed. Polystyrene, polychloroprene "Neoprene", and
polytetrafluoroethylene "Teflon", among others, are examples of SR.
2
The effective use of rubber as an eng
be and chemical composition. It is necessary to recognize that an elastomer is a simple elastic
material in the same sense that the steel is elastic, although it is much softer. Its ability to function as a
soft compact spring is one of the main reasons for its wide use (3). Elastomers, which are produced by
a complex chemical reaction during processing and usually containing many additives, are not perfectly
reproducible. This explains why the elastic moduli vary by a few percent for nominally identical
rubbers (3). In the civil engineering industry, elastomers are mainly used in bridge bearings and base
isolation bearings for buildings subjected to earthquakes.
2.1.1 Manufacture and Chemical Composi
of basic sta es, namely, compounding, processing, and vulcanization.
2.1.1.1 Compounding: The compounding stage consists of the proportioning of raw rubber
aterial
ents combine with
the raw rubber monomer or single molecule (e.g. isoprene "C5H8") to form a polymer or chain of
molecules (e.g. polyisoprene "(C5H8)n"). Sulphur, peroxide or urethane are typical crosslinking agents.
m with the vulcanization chemicals. The raw rubber material can either be natural or synthetic
and usually constitutes the largest percentage of the compounding ingredient. The vulcanization
chemicals are numerous and each one serves a specific purpose as explained below.
Crosslinking Agents: During the vulcanization stage, the crosslinking ag
4
nc
revent
s: Because it is highly unsaturated, NR has to be compounded with
ive are aromatic amines, such as p-phenylene
ties that are required for technical reasons. Carbon black is the filler typically used in
of fillers in the rubber compounds and they ensure smooth
Accelerators: They are used in conjunction with the crosslinking agents to control the
crosslinking density. For lower sulphur concentrations, larger amounts of accelerators are required.
Metal Oxides: They are required in a compound to develop the full potential of accelerators.
The main metal oxide is zinc oxide, but other oxides are used at times to achieve specific results.
Activators: Many accelerator systems require additional activators, like fatty acids, zi
soaps, or amine stearates.
Vulcanization Inhibitors: Chemicals like phthalimide sulfenamides are needed to p
premature vulcanization or scorching of the elastomer.
Protective Agent
protective agents to achieve a sufficient aging resistance. The level of protection is determined by the
chemical nature of the protective agent. Most effect
diamine derivatives, which not only protect the vulcanizate against oxidative degradation, but also
against dynamic fatigue and degradation from ozone and heat. For ozone protection, one uses waxes in
combination with p-phenylene diamine in dark-colored vulcanizates, or with enol ethers in light colored
ones.
Fillers: Contrary to most types of SR, NR does not require the use of fillers to obtain high
tensile strengths. However, the use of fillers is necessary in order to achieve the level and range of
proper
elastomeric bearings. It is added to modify the hardness and adjust the stiffness of the rubber. The
filler also affects the tensile strength, elongation at break, creep, and stress relaxation (4).
Softeners: A great number of different materials serve as softeners, the most important ones
being mineral oils. Animal and vegetable oils are also important softeners. NR requires lesser
amounts of softener than most SRs.
Process Aids: Stearic acid, zinc and calcium soaps, and residues of fatty alcohols are some
process aids which are used in NR compounds in addition to softeners. These materials are important
since they facilitate the dispersion
processing.
2.1.1.2 Processing: Rubber processing consists of two steps, namely mastication and
mixing. Unless NR has been modified by the producer to a specific processing viscosity, it is very
tough and therefore requires mastication prior to compounding. During mastication, the NR molecules

5
e mech
y will be well
spersed
Figure 2.1 Rubber is Worked on the Mixing Mill
ar anically broken down by means of high shear forces. Mastication can be carried out on mills
at low temperatures or at elevated temperatures in the presence of peptizing agents.
Mixing can be performed either on mixing mills or in internal mixers. When mixed in an
open mill, the rubber is first worked on the mill until a coherent band is formed on the mill rolls (see
Figure 2.1). Subsequently, protective agents and accelerators are added so that the
di during the mixing cycle (see Figure 2.2). Next, part of the filler is added together with
stearic acid (see Figure 2.3). When adding softeners, the band will split and it has to heal before
additional fillers are added to the compound. Finally, the sulphur is mixed in. During the mixing
process, the band must not be cut, and only after all ingredients have been incorporated in the
compound, is the band cut and folded (see Figure 2.4). When the mixing cycle is completed, the
compound is cut from the mill as slabs and cooled in a water bath and stored. Since mixing on mills is
very time consuming, mixing in internal mixers is preferred.

6
Figure 2.2 Chemical Ingredients are Added to the Rubber Band

7
Figure 2.3 Carbon Black Filler is Added to the Rubber Band
Figure 2.4 The Rubber Band is Cut From the Mill
When mixing is carried out in internal mixers, a relatively hard rubber is required for good and
ficient dispersion of the compounding ingredient. The usual mixing temperatures are 284-302oF
40-150oC). When mixing NR compounds in internal mixers, the rubber is first added followed by
fillers, while with high later on in a separate
hur and accelerators are either added together after the compound has cooled down,
r separ
ef
(1
mixing temperatures, it is necessary to add accelerators
mixing pass. Sulp
o ately on a mill after the compound has warmed up again. After mixing, the compound is
dumped from the internal mixer onto a cooling mill. It is then cut into slabs and allowed to cool. At
this stage, the rubber has a texture similar to a soft taffy candy. It is maintained in this state in a
controlled temperature and humidity room until vulcanization into its final hard form (see Figure 2.5).
2.1.1.3 Vulcanization: The necessary crosslinkages between molecules are normally
introduced in the process of vulcanization. They are due to a chemical reaction between the rubber and

8
Figure 2.5 Slabs of Rubber are Stored in a Controlled Temperature and Humidity
Figure 2.6 Rubber Before and After Vulcanization (2)
the sulphur and are as strong as the primary bonds in the chain itself. Figure 2.6 shows the difference
between a non-crosslinked rubber (plastomer) and a cross-linked rubber (elastomer).
9
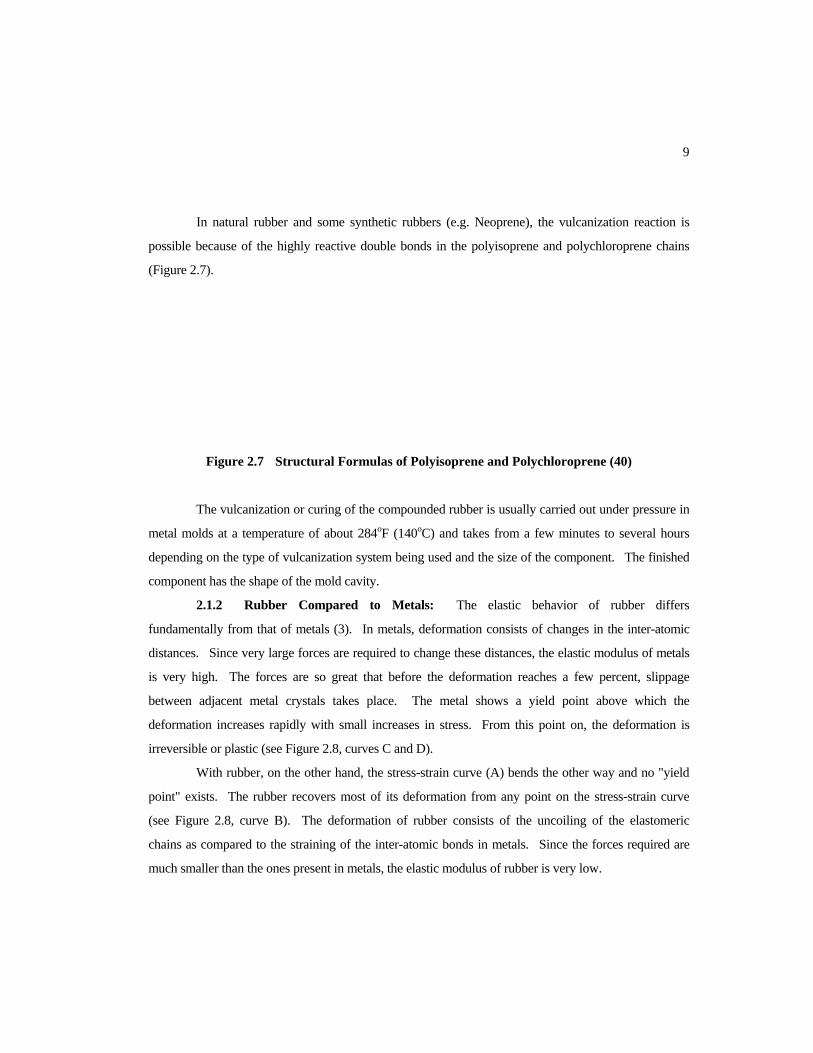
In natural rubber and some synthetic rubbers (e.g. Neoprene), the vulcanization reaction is
ossible because of the highly reactive double bonds in the polyisoprene and polychloroprene chains
igure 2.7).
Figure 2.7 Structural Formulas of Polyisoprene and Polychloroprene (40)
The vulcanization or curing of the compounded rubber is usually carried out under pressure in
etal molds at a temperature of about 284oF (140oC) and takes from a few minutes to several hours
epending on the type of vulcanization system being used and the size of the component. The finished
mponent has the shape of the mold cavity.
2 r differs
ndamentally from that of metals (3). In metals, deformation consists of changes in the inter-atomic
istances
ases in stress. From this point on, the deformation is
versib
p
(F
m
d
co
.1.2 Rubber Compared to Metals: The elastic behavior of rubbe
fu
d . Since very large forces are required to change these distances, the elastic modulus of metals
is very high. The forces are so great that before the deformation reaches a few percent, slippage
between adjacent metal crystals takes place. The metal shows a yield point above which the
deformation increases rapidly with small incre
irre le or plastic (see Figure 2.8, curves C and D).
With rubber, on the other hand, the stress-strain curve (A) bends the other way and no "yield
point" exists. The rubber recovers most of its deformation from any point on the stress-strain curve
(see Figure 2.8, curve B). The deformation of rubber consists of the uncoiling of the elastomeric
chains as compared to the straining of the inter-atomic bonds in metals. Since the forces required are
much smaller than the ones present in metals, the elastic modulus of rubber is very low.

10
rdness of an
astome
Figure 2.8 Stress-Strain Curves for Loading and Unloading of Rubber and Metals (3)
2.1.3 Behavior of Rubber:
2.1.3.1
Poisson's ratio applies to both metals and rubber. Nevertheless, it is important to know that
the nearness of Poisson's ratio to 0.5 makes rubber virtually incompressible. The Poisson's ratio for
metals is normally between 1/4 and 1/3.
Unlike metal hardness, which is measured by irreversible plastic indentation, elastomer
hardness is measured by reversible elastic indentation under a steel point. The ha
el r is typically measured with an instrument called durometer (Shore A).
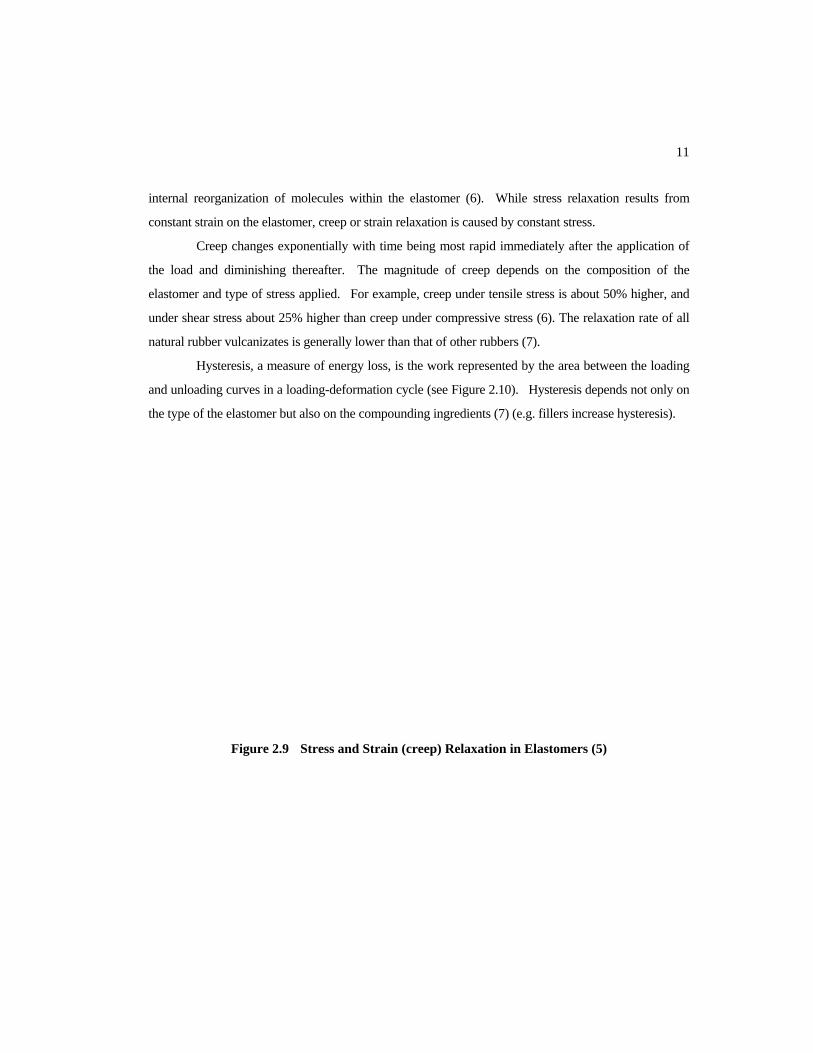
Creep, Relaxation and Energy Loss: Elastomers are unique materials due to the fact
at they are capable of storing and dissipating energy via their characteristic large strain behavior (1).
The n
rms of Hooke's law, viscoelastic materials (e.g. rubbers) undergo two types of relaxation, namely,
ation (see Figure 2.9). In elastomers, stress relaxation is a
chemical reaction caused by the breaking of primary chemical bonds (5), whereas, creep is due to an
th
ir ability to do so characterizes them as viscoelastic materials. Since they are not truly elastic i
te
strain relaxation (creep) and stress relax
11
ternal z
een the loading
d unlo
Figure 2.9 Stress and Strain (creep) Relaxation in Elastomers (5)
in reorgani ation of molecules within the elastomer (6). While stress relaxation results from
constant strain on the elastomer, creep or strain relaxation is caused by constant stress.
Creep changes exponentially with time being most rapid immediately after the application of
the load and diminishing thereafter. The magnitude of creep depends on the composition of the
elastomer and type of stress applied. For example, creep under tensile stress is about 50% higher, and
under shear stress about 25% higher than creep under compressive stress (6). The relaxation rate of all
natural rubber vulcanizates is generally lower than that of other rubbers (7).
Hysteresis, a measure of energy loss, is the work represented by the area betw
an ading curves in a loading-deformation cycle (see Figure 2.10). Hysteresis depends not only on
the type of the elastomer but also on the compounding ingredients (7) (e.g. fillers increase hysteresis).

12
Figure 2.10 Typical Stress-Strain Loading-Unloading Cycle of Rubber (8)
2.1.3.2
Compression, Tension, and Shear: Elastomers behave differently in compression,
nsion, and shear. Figure 2.11 shows typical stress-strain curves of rubber in compression and shear.
is obvious that the stress-strain relationship in shear is linear whereas that in compression is not. This
due to the fact that the rubber bulges at its sides when compressed. Figure 2.11 also indicates that
shear strai
Figure 2.11 Comparison of Stress-Strain Curves of Rubber in Compression and Shear (3)
A typical tensile stress-strain curve for rubber is shown in Figure 2.12. It can be seen that
ere is no linear elastic portion as is usual with metals (also see Figure 2.8). In order to get a
easurement of Young's modulus, an early part of the tensile stress-strain curve (e.g. between 0.05 and
.10 strains) should be considered.
te
It
is
ns up to unity are possible while compression strains can never reach unity (3).
th
m
0

13
Figure 2.12 Tensile Stress-Strain Curve for Rubber (9)

14
2.2 Elastomeric Bridge Bearings
The most common type of structural bearing used on highway bridges is the elastomeric
bearing. The prime function of elastomeric bearings is to protect the structures when relative
movements occur between adjacent structural members by preventing the transmission of harmful
forces, bending moments and vibrations (10). Elastomeric bearings have three important advantages
over conventional sliding plates, rocker arms and rollers used to support bridge girders. Such bearings
are economical, effective, and require no maintenance (11). Compared to the average mechanical
bearing, an elastomeric bearing is more economical because of its simple design, ease of construction,
and low material costs. For example, a 9 x 22 x 3in (23 x 56 x 8cm) elastomeric bearing costs between
$60 and $80. An important quality of the elastomeric bearing is its effectiveness as a medium of load
transfer (11). When subjected to compression forces, the bearing pad absorbs surface irregularities.
When subjected to horizontal forces caused by the expansion and contraction of the bridge girders, the
bearing deflects to accommodate these deflections. Finally, an elastomeric bearing needs no
maintenance since it does not require lubrication or cleaning.
Elastomeric bearings come in two types: plain (unreinforced) pads that are simple rectangular
blocks of rubber (Figure 2.13a) and laminated (reinforced) pads that have thin horizontal steel plates
embedded at specific intervals within the elastomer (Figure 2.13b). Both reinforced and unreinforced
bearings accommodate longitudinal movements of the bridge by simple shear deformation (Figure
2.13c). Shear deformations as large as the rubber thickness are possible, nevertheless, it is common
practice to limit this deformation to half this value. Once the horizontal deflections of the bridge are
known, the thickness of the rubber can be chosen.
A plain pad behaves differently from a reinforced bearing when subjected to a compressive
force. This difference has to do with the amount of bulging that is taking place around the bearing as
well as the amount of vertical deformation. The presence of steel laminates drastically reduce the
bulging effect and the amount of vertical deformation (Figures 2.13d, and 2.13e). One can control the
bulging pattern by controlling the shape of the bearing, namely, the elastomer thickness between steel
laminates and the cross-sectional area. This influence of shape may be numerically expressed as the
"shape factor, S" (11). This value is defined as the ratio of the loaded area to the surface area that is
free to bulge. For a rectangular bearing with length L, width W, and layer thickness t,
S=LW/2t(L+W), and for a circular bearing with diameter d, S=d/4t. While the addition of layers of
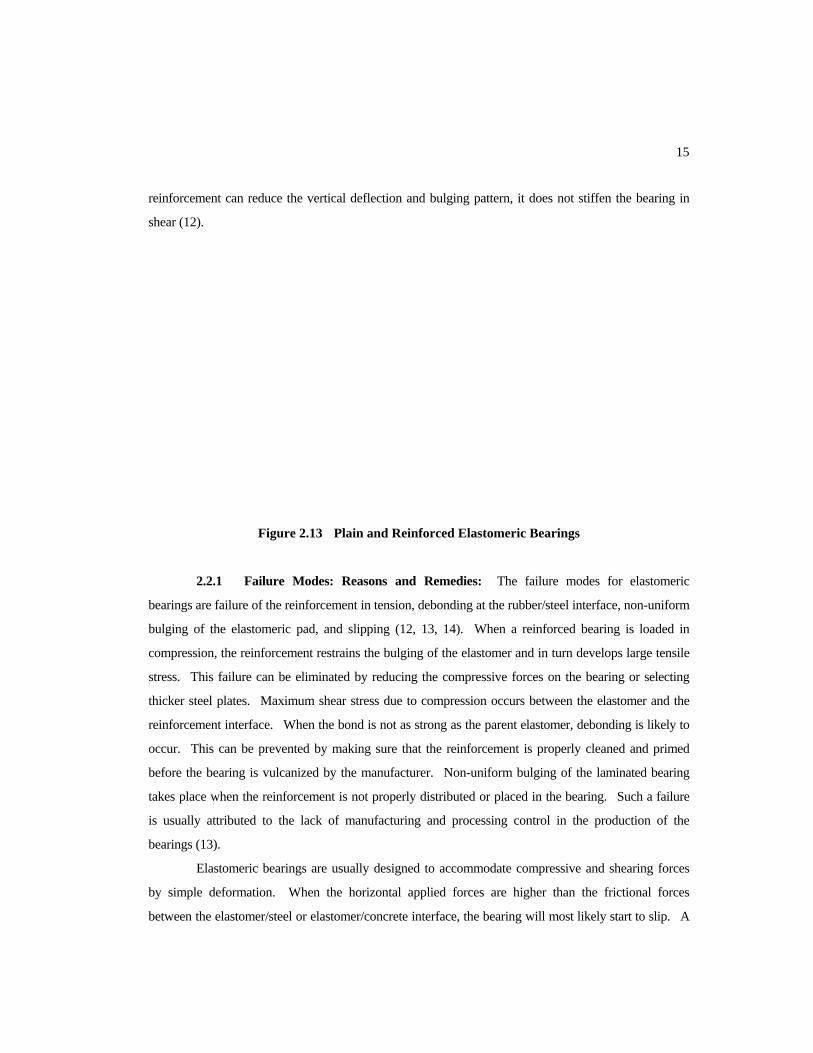
15
between the elastomer/steel or elastomer/concrete interface, the bearing will most likely start to slip. A
reinforcement can reduce the vertical deflection and bulging pattern, it does not stiffen the bearing in
shear (12).
Figure 2.13 Plain and Reinforced Elastomeric Bearings
2.2.1 Failure Modes: Reasons and Remedies: The failure modes for elastomeric
bearings are failure of the reinforcement in tension, debonding at the rubber/steel interface, non-uniform
bulging of the elastomeric pad, and slipping (12, 13, 14). When a reinforced bearing is loaded in
compression, the reinforcement restrains the bulging of the elastomer and in turn develops large tensile
stress. This failure can be eliminated by reducing the compressive forces on the bearing or selecting
thicker steel plates. Maximum shear stress due to compression occurs between the elastomer and the
reinforcement interface. When the bond is not as strong as the parent elastomer, debonding is likely to
occur. This can be prevented by making sure that the reinforcement is properly cleaned and primed
before the bearing is vulcanized by the manufacturer. Non-uniform bulging of the laminated bearing
takes place when the reinforcement is not properly distributed or placed in the bearing. Such a failure
is usually attributed to the lack of manufacturing and processing control in the production of the
bearings (13).
Elastomeric bearings are usually designed to accommodate compressive and shearing forces
by simple deformation. When the horizontal applied forces are higher than the frictional forces

16
Figure 2.14 Slip Phenomenon in Plain and Reinforced Bearings
.3 Structural Engineer and Rubber Technologist
ween structural engineers and rubber
hnolo
technologist, who is really a chemist, usually supervises the chemical compounding and manufacturing
one time slip upon the installation of the elastomeric pad on the bridge abutment is acceptable, however,
repeated slip backwards and forwards may cause abrasion of the elastomer to take place and thus
damage the elastomer surface that is in contact with the steel or concrete surface. The slip
phenomenon is more common in plain bearings than laminated ones. In laminated bearings, the
elastomer is sandwiched between two steel plates which in turn reduce the amount of bulging and
absorb the stresses that are developed in the elastomer. In the case of plain bearings, the amount of
bulging is bigger and the stresses developed in the rubber have to be resisted by the frictional forces
between the bearing and the abutment interface. Since the tensile forces are higher at the bearing's
edges, slip will take place near the edges of the bearing and not in the center (see Figure 2.14a). Some
engineers, in order to prevent this slipping phenomenon recommend that all layers of elastomer should
be bonded between steel plates (6). The outermost steel plates should be covered by only a thin layer
of elastomer to prevent corrosion of the reinforcement (see Figure 2.14b).
2
References 14 and 15 discuss the differences bet
tec gists in terms of their understanding of elastomeric bearings. Elastomeric bearings are usually
designed by structural engineers who possess a very good understanding of the load-deformation
capacity of the structure but have very little understanding of the behavior of the elastomer or the
mechanics of the bearing. Engineers have to understand that elastomers behave differently than
traditional materials, concrete or steel, when used to transfer loads and accommodate movements
between the bridge superstructure and its supporting structure. On the other hand, a rubber

17
ngineer and
e rubb o
ple, to the structural
gineer
eer is interested in a bearing that can resist the vertical forces resulting from the weight
the sla be
of zero
ould b
amount of bulging is lowered and the vertical deflection is decreased. Even though the compressive
processes of elastomeric bearings without having any knowledge of the structural requirements. At the
same time that the structural engineer believes that the elastomer can accommodate a little more load or
deformation, the rubber manufacturer believes that his rubber compound, or manufacturing methods
and tolerances have no effect on the structure or on the behavior of the elastomeric bearing.
2.3.1 Terminology and Importance of Communication: References 3, 5, and 9
emphasize the importance of good communication and terminology between the structural e
th er techn logist in order for the elastomer to be used effectively. If the structural engineer has
some knowledge and understanding of the elastomeric material, his demands on the rubber technologist
may be more realistic and the final design will be more satisfactory. Similarly, the rubber technologist
needs to have some understanding of the structural requirements of elastomeric bearings in addition to
his solid background in the chemical compounding and behavior of elastomers.
Since both the rubber technologist and structural engineer work under different disciplines, the
terminology common to one might mean something else to another. For exam
en , the word "modulus" means either Young's modulus, E, or shear modulus, G, whereas to the
some rubber technologists, the same term stands for the tensile stress value at an arbitrary elongation,
(100%, 200%, or 300%). The term "flexure" to an engineer means "bending", whereas to some rubber
technologists it means "any form of straining". Similarly, the term "ageing in steel" to an engineer
means "stress relieving before final machining", while to a rubber technologist it means "deterioration
with age".
2.3.2 Design Needs of the Structural Engineer: When designing an elastomeric pad, a
structural engin
of b and am as well as the moving traffic above. The amount of vertical deflection should be
minimal. In addition, the bearing should be able to deform horizontally in order to accommodate the
expansion and contraction of the precast concrete or steel beams due to temperature changes.
One can control the behavior of an elastomeric pad by controlling its mechanical properties,
namely, the compressive modulus, Ec, G. A compressive value of infinity and shear modulus
w e ideal for an elastomeric bearing, nevertheless, such values are impossible to obtain. For a
pad that has a constant elastomer thickness, the compressive modulus can be varied by controlling the
amount of bulging that takes place (i.e. changing the shape factor). This can be accomplished by
inserting a number of thin steel plates in the elastomer. By increasing the compressive modulus, the

18
durometer have lower compressive and shear
odulus
modulus can be increased by inserting steel plates, the shear modulus can be held constant by not
changing the total thickness of the elastomeric material.
Another way that an engineer can vary the shear modulus and compressive modulus values is
by using elastomers of various hardnesses. The most common hardness values used for elastomeric
bearings are 50, 60, and 70 durometer. Elastomers of 50
m values than 70 durometer hard elastomers. The hardness of an elastomer can be controlled by
the rubber technologist who can vary the chemical compounding ingredients that go into the
manufacture of rubber.
2.3.3 Mix Proportioning Abilities of the Rubber Technologist: In section 2.1.1.1, it
was shown that various chemical ingredients go into the chemical composition of an elastomer. The
rubber technologist can basically formulate any type of elastomer that will meet the customer's
quirem W
igu
Time on
the Tensile Strength and Modulus of
NR (8)
re ents. hen it comes to elastomeric bearings, the civil engineer's requirements include
mechanical properties such as shear and compressive moduli, and physical properties such as hardness
and ozone/age resistance. The rubber technologist can improve the age resistance of an elastomer by
increasing the amount of metal oxides (e.g. zinc oxide) (16). Higher amounts of waxes will improve
the ozone resistance. The most important ingredient that affects the mechanical properties of an
elastomer is the amount and type of filler used. The typical filler used in the manufacture of
elastomeric bearings is carbon black. Adding more carbon black will increase the hardness of the
elastomer, increase the shear and compressive moduli, and decrease the elongation at break (13).
Furthermore, the rubber technologist can vary the
modulus of the elastomeric material by controlling
the time of vulcanization. Figure 2.14 shows the
effect of the vulcanization time on the tensile
strength and modulus of a typical NR material. The
hardness of the elastomer can be controlled to ±5
durometer units, and the shear modulus to ±10%.
F re 2.15 Effect of Vulcanization
19
2.4 Summary of the AASHTO Specification Changes
The American Association of State Highway and Transportation Officials, AASHTO,
specifications on the design and construction of elastomeric bearings have changed considerably from
the time that they were first introduced in the early 1950's. The author will summarize the most
important changes and additions made to AASHTO specifications starting with the 8th edition (1961)
up to the 15th edition (1992).
In section 1.6.47 of the 8th edition (1961) of the AASHTO specifications (17), entitled
"Expansion Bearings", the design requirements for elastomeric bearings were discussed. The
specifications limited the maximum horizontal displacement of a bearing to half the thickness of the
elastomer. The compressive stress was limited to 500psi (3.45MPa) for dead load and 800psi
(5.52MPa) for combined dead and live load. The maximum allowable compressive deflection was
limited to 15 percent of the elastomer thickness. The taper in the bearing was restricted to 5 percent of
the pad length and to take care of stability requirements, the least dimension of the bearing had to be at
least five times the thickness of the elastomer. All bearings were required to have a shape factor of
1.25, made of a material known as "Neoprene" and cast in molds under heat and pressure. The
chemical composition for all pads had to meet the American Society for Testing and Materials, ASTM,
requirements given in Table 2.1.
The only change in the 9th edition (1965) of the AASHTO specification (18) was that pads
had to be secured against horizontal displacements by the use of adhesives or by mechanical means.
Under sections 12 and 25 of the 11th edition (1973) of the AASHTO specification (19),
entitled "Elastomeric Bearings", a number of changes were made. Both plain (consisting of elastomer
only) and laminated bearings of rectangular or circular shapes were introduced. Laminated pads were
limited to hardnesses not greater than 70 durometer whereas plain pads were restricted to conditions
where little movement was anticipated. To take care of stability requirements, the following pad
criteria had to be met: Plain: minimum L = 5T, W = 5T, D = 10T. Laminated: minimum L = 3T, W = 2T, D = 6T. where,

20
gitudinal axis of the bridge, tudinal axis of the bridge,
L = gross length of rectangular bearing parallel to lon W = gross width of bearing perpendicular to the longi D = gross diameter of a circular bearing, T = total thickness of the elastomer present in a bearing. Table 2.1 Physical Properties of Neoprene 1961 AASHTO (17)
Grade (Durometer) 60 70
Original Physical Properties
Hardness ASTM D 676 Tensile strength, ASTM D-412, minimum psi (MPa) Elongation at break, minimum percent
60 ±5 2500
(17.24) 350
70 ±5 2500
(17.24) 300
Accelerated tests to Determine Long Term Aging Characteristics
Oven Aged - 70 Hrs./212F (100C), ASTM D-573
Hardness, points change, maximum Tensile Strength. % change, maximum Elongation at break, % change maximum
0 to +15 ±15 -40
0 to +15 ±15 -40
Ozone - 100 pphm in Air by Volume - 20% Strain - 100+2F. (38 + 1C)
ASTM D-1149 100 hours
No cracks No cracks
Compression Set - 22 Hrs./158F (70C), ASTM D-395 - Method B
% Maximum 25 25
Lo mperature Stiffness - ASTM D-797 w Te
At 40F. (5C), Young's Modulus, maximum psi (MPa)
10,000 (69)
10,000 (69)
Tear Test - ASTM D-624 - Die "C"
Pounds/lin. in, minimum (kg/mm
250 225 ) (4.5) (4)
The b ing had to be secureear d against horizontal displacement only when the dead and live load uplift
n 200psi (1.38MPa). Furthermore, compressive strains
e 7 perc pecifications (17, 18) allowed compressive strains up
nufacturers which were used to obtain compressive
deflections showed the relationships of shape factor, stress, and durometer hardness of the elastomer.
forces reduced the average pressure to less tha
in the b aring were limited to ent (previous s
to 15 percent). Plots obtained from rubber ma

21
percent
irgin N
ermitted ysical properties was allowed when
st specimens were cut from the finished product. All the steel used in laminated bearings had to be
had to be covered by 1/8" of
e T O (19)
The type of elastomer used had to be either 100 percent virgin natural rubber or 100
v eoprene with physical properties as in Tables 2.2 and 2.3 (previous specifications (17, 18)
p Neoprene bearings only). A 10 % variation in these ph
te
rolled mild steel (ASTM A36) and the components of the bearing
lastomer.
able 2.2 Physical Properties of Natural Rubber 1973 AASHT
ASTM Test Physical Properties
50 Duro
60 Dur Duroo 70
D2240 Hardness 5 60±5 0±5 70±5
D412 Tensile strength, min. psi (MPa) Ultimate elongation, min %
2500 (17.24)
450
2500 (17.24)
400
2500 (17.24)
300
Heat Resistance
Change in durometer hardness, max. + +10 +10 10
D573 70 hr.@ Change in tensile strength, max. % -25 158F (70C) Change in ultimate elongation
-25 -2
-25 -25 5 -25
Compression Set
D395 Method B 22 hours @ 158F (70C), max % 25 25 25
Ozone
D1149 25 pphm ozone in air by volume, ours
No c
No crack
No cks 20% strain 100 ± 2F (38± 1C),48 h
ng procedure D518, procedure A mountiracks s cra
Adhesion
D Bond made d429, B uring vulcanization, m) (
40 (714)
40 (714) lbs per inch (kg/
40 714)
Low Temperature Test
D746 Procedure B
Brittleness at -40F (-40C) No failure
No failure
No failure
Table 2.3 Physical Properties of Neoprene 1973 AASHTO (19)
ASTM Test Physical Properties 50 Duro 60 Duro 70 Duro

22
D2240 Hardness 50±5 60±5 70±5
D412 Tensile strength, min. psi (MPa) Ultimate elongation, min %
2500 (17.24)
400
2500 (17.24)
350
2500 (17.24)
300
Heat Resistance
Change in durometer hardness, max points
+15 +15 +15
D573 70 hr. @ 158F (70C)
Change in tensile strength, max. % -15 -15
-40
-15
-40 Change in ultimate elongation
-40
Compression Set
D395 Method B
22 hours @ 158F (70C), max % 35 35 35
Ozone
D 100 pphm20% strai
1149 ozone in air by volume, n 100 ± 2F (38± 1C),48 hours
mou
No Cracks
No Cracks
No Cracks
nting procedure D518, Procedure A
Adhesion
D429, B Bond mch (kg/m)
40 (714)
40 (714) (714)
ade during vulcanization, lbs per in
40
Low Temperature Test
D746
Brittleness at -40F (-40C) No Failu
No Failu
No FailuProcedure B re re re
indicates cha TO s ion
F assurance, the mechanical properties of the finished bearings were verified by
la tests. One t n to a maxi of 7 percent at 800psi
(5.52MPa) average uni esign dead and live load. t ted ar
r istance extended 4-day ambient temperature of -20oF
( o the values giv
nges made to Table 2.1 from 1961 AASH pecificat
or quality
boratory est limited the compressive strai mum
t pressure or at the d Another est limi the she
es of the bearing at 25% shear strain after an
-7 C) to en is Table 2.4.

23
O (19)
ist omer Type Durome
Table 2.4 Shear Resistance Values for NR and Neoprene 1973 AASHT
Shear Res ance Elast ter
30psi (0.207MPa) Natura Rubber 50 l
40psi (0.276 Natural Rubber 60 MPa)
50psi (0.345 ber 70 MPa) Natural Rub
50psi (0.345 50 MPa) Neoprene
75psi Neoprene 60 (0.517MPa)
110psi (0.75 70 9MPa) Neoprene
both th HTO specifications (20) and the 13th edition (1983)
o SHTO specifications (21) two changes were made. Dimension tolerances for bearings were
i duced d the previous stability requirements (19) for bearings were changed to the
f g:
P
In e 12th edition (1977) of the AAS
f the AA
ntro (see Table 2.5) an
ollowin
lain: minimum L = 5T, W = 5T, in the previous specificati Laminate
D = 6T. ( D = 10T on)
d: minimum L = 3T, W = 2T,
D = 4T. (D = 6T in the previous specification)
In 1989) of the AASHTO specification (22), entitled
"Elastomeric Bearings", a number of changes were made. For the first time, the use of tapered pads
w d. lea kn e
ouraged the use of
e shear modulus and creep deflection properties of the elastomer (if known) in design. If such
opertie
sections 14 and 25 of the 14th edition (
as discourage The thickness of any external steel plate was limited to at st the thic ess of th
elastomer layer to which the steel plate was bonded to. The specification also enc
th
pr s were not specified, values given in Table 2.6 had to be used instead. When the shear
modulus values from Table 2.6 were used in design, the low range had to used for compressive strength
calculations and the high range for shear stress calculations.
24
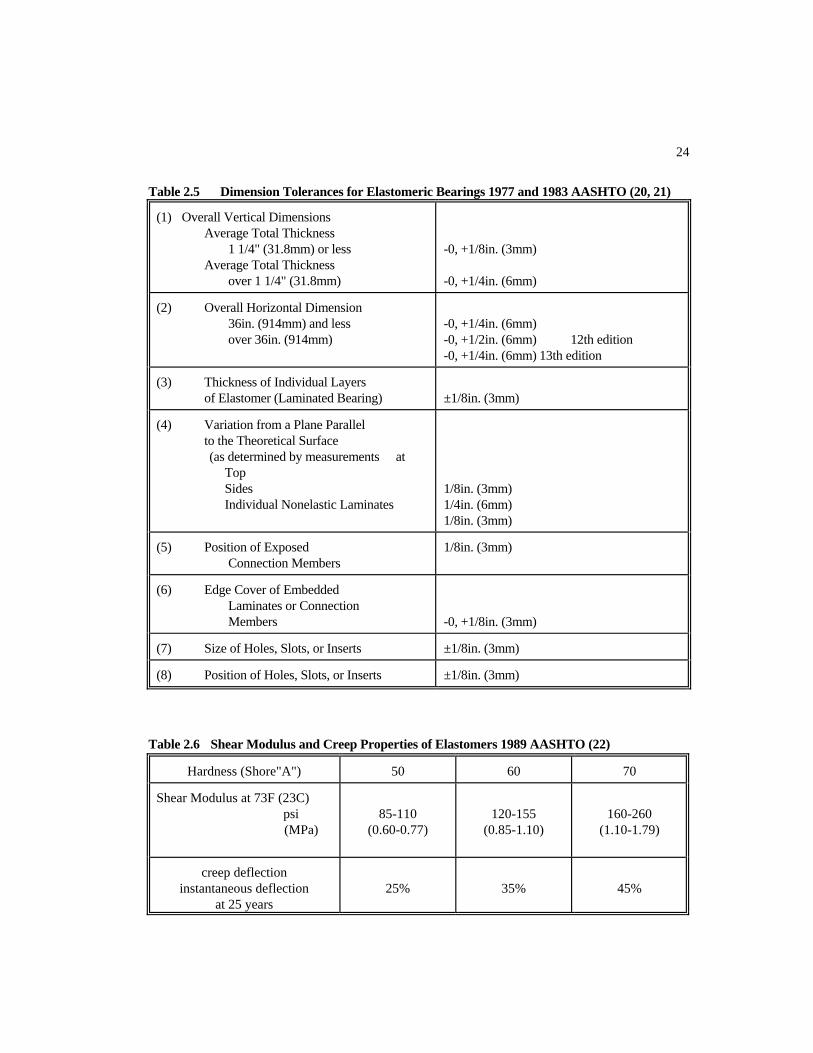
1 1/4" (31.8mm) or less Average Total Thickness over 1 1/4" (31.8mm)
-0, +1/8in. (3mm) -0, +1/4in. (6mm)
Table 2.5 Dimension Tolerances for Elastomeric Bearings 1977 and 1983 AASHTO (20, 21)
(1) Overall Vertical Dimensions Average Total Thickness
(2) Overall Horizontal Dimension 36in. (914mm) and less over 36in. (914mm)
-0, +1/4in. (6mm) -0, +1/2in. (6mm) 12th edition -0, +1/4in. (6mm) 13th edition
(3) Thickness of Individual Layers of Elastomer (Laminated Bearing)
±1/8in. (3mm)
(4) Variation from a Plane Parallel to the Theoretical Surface (as determined by measurements at Top Sides Individual Nonelastic Laminates
1/8in. (3mm) 1/4in. (6mm) 1/8in. (3mm)
(5) Position of Exposed Connection Members
1/8in. (3mm)
(6) Edge Cover of Embedded Laminates or Connection Members
-0, +1/8in. (3mm)
(7) Size of Holes, Slots, or Inserts ±1/8in. (3mm)
(8) Position of Holes, Slots, or Inserts ±1/8in. (3mm)
Table 2.6 Shear Modulus and Creep Properties of Elastomers 1989 AASHTO (22)
Hardness (Shore"A") 50 60 70
Shear Modulus at 73F (23C) psi (MPa)
85-110
(0.60-0.77)
120-155
(0.85-1.10)
160-260
(1.10-1.79)
creep deflection instantaneous deflection
at 25 years
25%
35%
45%

25
were sses n an 60 durometer (previous
speci ) allow ), whereas o 70 durometer were
perm satisfac st. The com ssive stresses given in the previous
AASHTO speci o meet e following requirements: ear modulu Shape Factor = 1.0 for internal layers of reinforcement 1.4 for cover rs ain pads ceed
1,000 psi (6.90 MPa) for steel laminated pads 800 psi (5.52 MPa) for plain pads
aterials, respectively. No curve was given for a 70 durometer material even though it was
ill permitted for plain bearing pads. The effects of creep had to be added to the instantaneous
ions when consi
Figure 2.16 Compressive Stress-Strain Curves for 50 and 60 Durometer Elastomers (22)
Laminated pads limited to hardne ot greater th
fications (19, 20, 21 ed 70 durometer plain pads up t
itted because of their tory use in the pa pre
fications (17, 18, 19, 20, 21) were σc ≤ GS/β
changed t, where G = sh
ths
S = β = laye
nor shall it ex
= 1.8 for pl
σc ≤ ≤σc
In cases where horizontal shear translation is prevented, the allowable compressive stress (σc) could be
increased by 10%. All values for compressive strains had to obtained from Figure 2.16 for 50 and 60
durometer m
st
d ering long term defleceflect d tions.

26
A new requirement on the rotation between the top and bottom surfaces of the bearing was
introduced in this edition of the AASHTO specification. Such rotations were limited to the following:
LαL + WαW ≤ 2Δc for rectangular pads
D (αL2 + αW
2)1/2 ≤ 2Δc for circular pad
where, αL = relative rotation of top and bottom surfaces of bearing about an axis
perpendicular to the longitudinal axis (radian).
αW = relative rotation of top and bottom surfaces of bearing about an axis
parallel to the longitudinal axis (radian).
Δc = instantaneous compressive deflection of bearing. The stability requirements for bearings were changed to the following: Plain:
minimum L = 5T, W = 5T, D = 6T. Laminated: minimum L = 3T, W = 3T, (W = 2T in the previous specification)
D = 4T.
In addition, the use of holes in laminated bearings was discouraged. All pads had to be anchored
(secured against horizontal movement) when the compressive forces exceeded the horizontal forces by
4 times. If the bearing was attached to both its top and bottom surfaces, the attachment had to be such
that no tension was allowed in the vertical direction. The dimensional tolerances for both plain and
reinforced bearings were changed and the new values are given in Table 2.7.
Bearing tests and acceptance criteria were broken down into 2 levels. Level I required the
manufacturer to load each steel reinforced bearing to 1.5 times the maximum design load. If the
bulging pattern implied misplacement of laminates or poor laminate bond, and if there existed 3
separate surface cracks which were greater than 0.08in. (2mm) wide and 0.08in. (2mm) deep, the
bearing had to be rejected. In addition, tensile strength, elongation at break, durometer hardness, bond
strength, and ozone resistance tests had to be performed for each production lot of bearings.

27
T or Elastomeric Be ings 1989 AASHTO (22)
)
ss ss
-0, -0, +1/4in. (6mm)
able 2.7 Dimension Tolerances f ar
(1 Overall Vertical Dimensions e s Average Total Thickn sle 1 1/4" (32mm) or
Average Total Thickne over 1 1/4" (32mm)
+1/8in. (3mm)
(2 Overall Horizontal Dimensio 36in. (0.914m) and le s
) s
over 36in. (0.914m)
-0,-0,
n +1/4in. (6mm) +1/2in. (12mm)
( Thickness of Individual Layers of Elastomer (Laminated 3)
Bearing Only at any point within the bearing
±20% of design value but no more tha ±1/8in.(±3mm)n
(4 Variation f a ll) reti l Surface
Top
Sides
slope relative to the bottom of no
rom Plane Para el to the Theo ca (as determined by measurements at the edges of the bearings)
more than 0.005 radian 1/4in. (6mm)
(5 P tion of Exposed ) osis
1/8 Connection Member in. (3mm)
(6) Edge Cover of Embedded Laminates or Connection
-0, +1/8in. (-0, +3mm) Members
(7) Size of Holes, Slots, or Inserts ±1/8in. (3mm)
(8) Position of Holes, Slots, or ±1/8in. (3mm) Inserts
indicates changes made to Table 2.5 from 1977 and 1983 AASHTO specification
Lev more c ns and h rmed in l the
t ts listed under Level I criteria. Level II tests included shear modulus and compressive stiffness tests
performed in accordance with ASTM D4014 (23). The shear modulus was to be determin either by
testing a piece of the finished bearing as specified in ASTM D4014 (23) or by performing a
non-destructive test on the complete bearing. Shear modulus values had to fall within ±15% of the
s
el cr II iteria were for ritical situatio ad to be perfo addition to al
es
ed
28
value specif esign document or within the limits given in Table 2.6. The compressive
stiffness tests had to be performed on the complete bearing and all values obtained had to vary by no
re tha
(23oC)
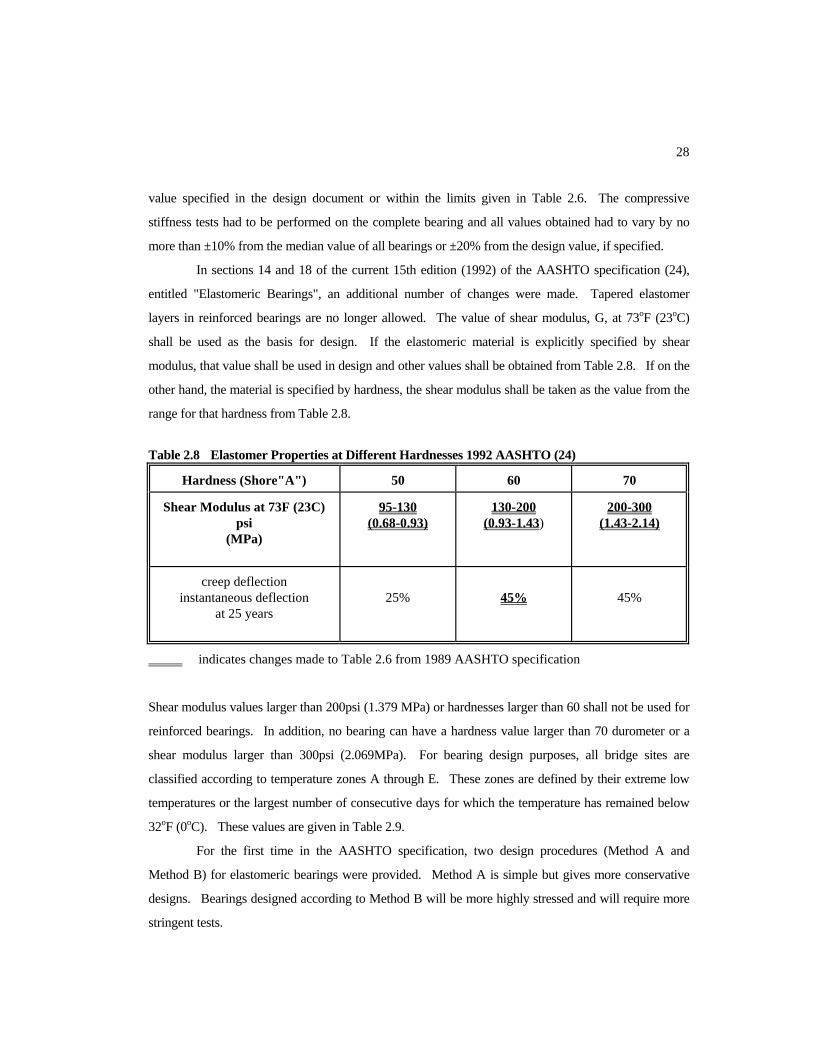
all be used s e b s for design. If plicitly specified by shear
lus sed in .8. If on the
ther hand, th m rial specified hardn all be taken as the value from the
hat
fere 992 AASHTO (24)
Hardness (Shore"A") 50 60 70
ied in the d
mo n ±10% from the median value of all bearings or ±20% from the design value, if specified.
In sections 14 and 18 of the current 15th edition (1992) of the AASHTO specification (24),
entitled "Elastomeric Bearings", an additional number of changes were made. Tapered elastomer
layers in reinforced bearings are no longer allowed. The value of shear modulus, G, at 73oF
sh th a the elastomeric material is exa si
modu , that value shall be u design and other values shall be obtained from Table 2
o e ate is by ess, the shear modulus sh
range for t hardness from Table 2.8.
Table 2.8 Elastomer Properties at Dif nt Hardnesses 1
Shear Modulus at 73F (23C) psi
(MPa)
95-130 (0.68-0.93)
130-200 (0.93-1.43)
200-300 (1.43-2.14)
creep deflection instantaneous deflection
25%
at 25 years
45%
45%
indicates changes made to Table 2.6 from 1989 AASHTO specification
hear modulus values larger than 200psi (1.379 MPa) or hardnesses larger than 60 shall not be used for
inforced bearings. In addition, no bearing can have a hardness value larger than 70 durometer or a
ear modulus larger than 300psi (2.069MPa). For bearing design purposes, all bridge sites are
assified according to temperature zones A through E. These zones are defined by their extreme low
mperatures or the largest number of consecutive days for which the temperature has remained below
2oF (0oC). These values are given in Table 2.9.
For the first time in the AASHTO specification, two design procedures (Method A and
ethod B) for elastomeric bearings were provided. Method A is simple but gives more conservative
esigns. Bearings designed according to Method B will be more highly stressed and will require more
stringent tests.
S
re
sh
cl
te
3
M
d

29
Ta
Low Temperature Zone A B C D E
ble 2.9 Low Temperature Zones and Elastomer Grades 1992 AASHTO (24)
50 Year Low Tem
perature, F (C)
0 (0)
-20 (-29)
-30 (-34)
-45 (-43)
All others
Maximum number of consecutive days when the temperature doe ot 3 7 s n rise above 32F (0C)
14 N/A N/A
Minimum Low Temperature elastomer grade without al
0 speci
2
3
4
5
provisions
Minim w 5 um Lo Temperature elastomer grade with special provisions 0 0 2 3
Method A can be used for the design of steel reinforced, fabric reinforced, or plain bearings.
he allowable compressive stresses are given below:
S = Shape Factor = 1.0 for internal layers of reinforcement
1.4 for cover layers and 1.8 for plain pads ed
for steel reinforced pads c 800 psi (5.52M
hese stress limits can be increased by 10% in cases where horizontal shear deformations are prevented.
ings only. For bearings
bjected
T σc , TL ≤ GS/β , where G = shear modulus β = nor shall it exce σc ≤ 1,000 psi (6.90MPa) σ ≤ Pa) for plain or fabric reinforced pads
T
For bearings with different layer thicknesses, the value for S used shall be the one that gives the
smallest S/β. Compressive stress strain curves shown in Figure 2.17 for 50 and 60 durometer steel
reinforced bearings shall be used in the calculations of the compressive deflections. The same curves
can be used for plain pads, only if the shape factor values are replaced by S/1.8.
Method B is an optional design procedure for steel reinforced bear
su to horizontal deformations, the compressive stresses shall be as follows:
σc, TL ≤ 1,600 psi (11.0 MPa)
σc , TL ≤ 1.66GS/β
σc , LL ≤ 0.66GS/β

30
σc, TL ≤ 1,600 psi (11.0 MPa)
re, β ers and 1.4 for cover layers
0 Durometer Elastomers (24)
T nes g d A. Bearings that are subjected to
c ined e following lim all be met:
for bearings subject to
shear deformations
When bearings are not subjected to horizontal deformations, the compressive stresses shall be as
follows:
σc , TL ≤ 2.00GS/β
σ ≤1.00GS/ whec , LL β = 1.0 for internal lay
Figure 2.17 Compressive Stress-Strain Curves for 50 and 6
he rotation requirements are the same as the o iven in Metho
omb compression and rotation, th its sh
or
for bearings fixed against
shear deformations

31
if the bridge is not free to
translate horizontally
For ci eter d, W and L shall be replaced with 0.8d.
f the st rcement for good quality fabrication should be at
least 1/16in. ( The elastomer used, be i ural rubber has to ality
control test given in Tables 2.10 and 2.11. The dimension tolerances for both plain and reinforced pads
were chan shown in Table 2.12. In addition to th short duration comp on test
listed e previous AASHTO specificatio a long duration ression
test is required. In this test the bearing shall be loaded in compression to 1.5 times its maximum design
ame reasons as the
ort duration compression test (22). Finally, concerning installation, the bearing shall be placed on
where, hrt = total elastomer thickness in a bearing.
To satisfy stability requirements, the average compressive stress due to total dead and live load on
rectangular bearings shall meet the following limits:
if the bridge is free to
translate horizontally
or
rcular bearings with diam
The minimum thickness o eel reinfo
1.5mm). t nat or Neoprene meet the qu
ged to the values e ressi
under ria in thlevel I crite n (22), comp
load for a minimum period of 15 hours. The bearing shall be rejected for the s
sh
surfaces that are plane to within 1/16in. (1.5mm). Any lack of parallelism between the top of the
bearing and the underside of the girder that exceeds 0.01 radian shall be corrected by grouting.

32
able 2.T 10 Natural Rubber Quality Control Tests 1992 AASHTO (24)
ASTM Tests PHYSICAL PROPERTIES
D 2240 D412
Hardness (Shore A Durometer 50 ±5 Tensile Strength, Minimum psi (MPa)
2250
Ultimate Elongation, minimum %
(15.5)
2250
450
60 ±5
(15.5) 2250
400
70 ±5
(15.5) 300
HEAT RESISTANCE
D 573 70 hours at 212oF (100oC) Change in Ultimate Elonga., Max. %
Change in Durom Maxi
eter Hardness, mum points sile Strength,
+10 +10
Change in Ten Max. % -25 -25
-25 -25
+10 -25 -25
COMPRESSION SET
D 395 Method B
22 hours @
OZONE D1149
212oF (100oC), Max. %
in air by volustrain 100oF ±2oF (38oC ±1oC)
ting procedure D 518, A
25
No Cracks
25
No Cracks
25
No Cracks
25 pphm ozone me, 20%
100hr. moun
** LOW TEMPERATURE BR TLENESIT S
D 746, B Grades 0 &2 - No test Required
C)
Failure
Failure
Failure Grade 3 Brittleness at -40oF (-40oC) Grade 4 Brittleness at -55oF (-48o
o o
No No No
Grade 5 Brittleness at -70 F (-57 C)
** INSTANTANEOUS THERMAL STIFFENING
D 1043 Grades 0 & 2 - oF -40oF (-40oC)
Grade 4 - @ -50oF (-46oC) 4o
not exceed 4 times the stiffness measured at 73oF (23oC)
@ -25 (-32oC) Stiffness at test temperature shall Grade 3 - @
Grade 5 - @ -65oF (5 C)
** LOW TEMPERATURE CRYSTALLIZATION
Quad Shear Test
Grade 0 - No Test Required Grade 2 - 7 days @ 0oF (-18oC) Grade 3 - 14 days @ -15oF (-26oC) Grade 4 - 21 days @ -35oF (-37oC) Grade 5 - 28 days @ -35oF (-37oC)
A ±35% strain cycle shall be used, and a complete cycle of strain shall be applied with a period of 100 seconds. The fist 3/4 cycle of strain shall be disregarded and the stiffness shall be determined by the slope of the force deflection curve for the next 1/2 cycle of loading.
changes made to Table 2.2 ** additions made to Table 2.2
33
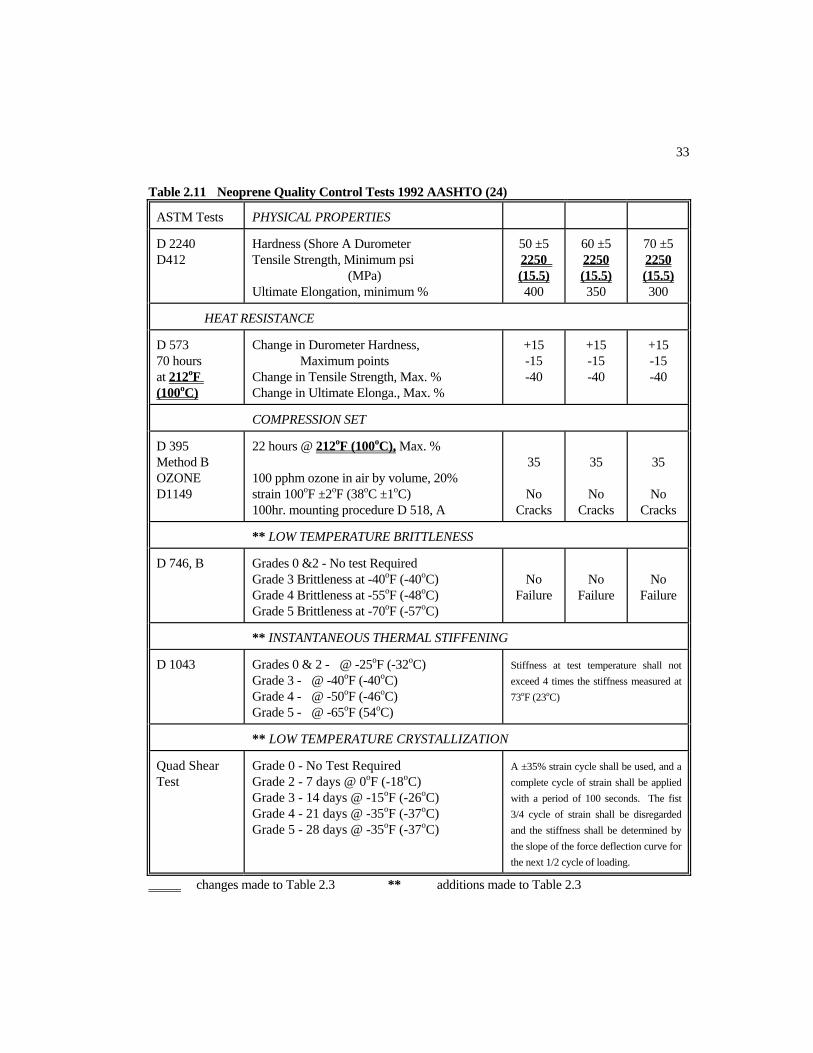
able 2.
T 11 Neoprene Quality Control Tests 1992 AASHTO (24)
ASTM Tests PHYSICAL PROPERTIES
D 2240D412
ter psi
inimum %
50 ±5 2250
Hardness (Shore A DuromeTensile Strength, Minimum (MPa) Ultimate Elongation, m
(15.5) 400
60 ±5 2250 (15.5) 350
70 ±5 2250 (15.5) 300
HEAT RESISTANCE
D 573 70 houat 212o
rs F
(100oC) Change in Ultimate Elonga
Change in Durometer Hardness, oint
rengt ax. % ., Max. %
+15 -15 -40
+15 -15 -40
+15 -15 -40
Maximum p s Change in Tensile St h, M
COMPRESSION SET
D 395 Method B OZONE D1149
22 hours @ 212oF (100oC), Max. % 100 pphm ozone in air by volume, 20% strain 100oF ±2oF (38oC ±1oC) 100hr. mounting procedure D 518, A
35
No Cracks
35
No Cracks
35
No Cracks
** LOW TEMPERATURE BRITTLENESS
D 746, B Grades 0 &2 - No test Required Grade 3 Brittleness at -40oF (-40oC) Grade 4 Brittleness at -55oF (-48oC) Grade 5 Brittleness at -70oF (-57oC)
No
Failure
No
Failure
No
Failure
** INSTANTANEOUS THERMAL STIFFENING
D 1043 Grades 0 & 2 - @ -25oF (-32oC) Grade 3 - @ -40oF (-40oC) Grade 4 - @ -50oF (-46oC) Grade 5 - @ -65oF (54oC)
Stiffness at test temperature shall not exceed 4 times the stiffness measured at 73oF (23oC)
** LOW TEMPERATURE CRYSTALLIZATION
Quad Shear Grade 0 - No Test Required
Grade 5 - 28 days @ -35oF (-37oC)
A ±35% strain cycle shall be used, and a
4 cycle of strain shall be disregarded and the stiffness shall be determined by the slope of the force deflection curve for
Test Grade 2 - 7 days @ 0oF (-18oC) Grade 3 - 14 days @ -15oF (-26oC) Grade 4 - 21 days @ -35oF (-37oC)
complete cycle of strain shall be applied with a period of 100 seconds. The fist 3/
the next 1/2 cycle of loading.
changes made to Table 2 ** additions made to Table 2.3 .3

34
able 2.12 Dimension Tolerances for Elastomeric Bearings 1992 AASHTO (24)
ckness 1 1/4" (32mm) or less Design Thickness
m
-0, +1/8in. (3mm)
T
(1) Overall Height Design Thi
over 1 1/4" (32 m) -0, +1/4in. (6mm)
(2) Overall Horizontal Dim sion en 36in. (0.914m) and less over 36in. (0.914m)
-0, +1/4in. (6mm) -0, +1/2in. (12mm)
(3) Thickness of Individual Layers of Elastomer (Laminated Bearing Only) at any point
within the bearing ±20% of design value but no more than ±1/8in. (±3mm)
(4) Parallelism with Opposite Face Top and Bottom Sides
0.005 radian
02 radi0. an
(5) Position of Exposed Connection Members Holes, Slots, or Inserts
±1/8in. (3mm)
(6) Edge Cover of Embe Laminates or Co
dded nnection
Members
-0, +1/8in. (-0, +3mm)
(7) Thickness Top and bott cover lay if required
-0, the smaller of +1/16 (1.5mm) d +20% f the n
layer thickness om er an o ominal cover
(8) Size Holes, slots, or inserts
±1/8in. (3mm)
indicates changes made to Table 2.7 2.5 DuPont's Design Procedure for Neoprene Bearings In 1959, DuPont published a handout on the design of Neoprene bearings (11). Up to this day, some engineers still use this as a reference tool when designing elastomeric bridge bearings. In this section, the author will try to present a summary of the most important design concepts presented in this reference (11). DuPont limits the compressive stress on the bearing pad to 800psi (5.52MPa), whereas compressive strains up to 15% are permitted. Compression curves like the ones shown in Figure 2.18 that relate stress, strain, shape factor, and hardness values are used as a design aid to limit the compressive strains in bearings to 15%.

35
Figure 2.18 Compression Curves for 50, 60, and 70 Durometer Hard Neoprene (11)
The maximum horizontal deformation in the bearing is limited to twice the total thickness of
the elastomer. Shear modulus values shown in Table 2.13 are used to calculate the horizontal forces
induced in the bearing. The shear modulus increases with a drop in temperature and therefore, the
values given in Table 12 are increased by 10%, 25%, and 90% when bearings are designed for
temperatures of 20oF (-7oC), 0oF (-18oC), and -20oF (-29oC), respectively. To insure bearing stability,
the shortest dimension of the elastomeric pad has to be at least five times the thickness of the elastomer.
Finally, slippage can be prevented as long as the shear stress does not exceed one-fifth the compressive
stress acting on the elastomer/concrete interface.
Table 2.13 Shear Modulus Values for Neoprene (11)
Hardness (Shore"A") 50 60 70
Shear Modulus at 73F (23C), psi (MPa)
110 (0.759)
160 (1.1)
215 (1.484)

35
CHAPTER 3
MECHANICAL PROPERTIES OF ELASTOMERIC BEARINGS
The purpose of elastomeric bridge bearings is to support the vertical loads from the bridge
ck an
.1 Hardness
tal hardness which is measured by irreversible plastic indentation, elastomer
to some extent upon the
uromet
de d beams with minimal deflection and at the same time permit horizontal movement with
minimal resistance. In other words, the behavior of an elastomeric bearing is mainly governed by the
mechanical properties of the elastomer in both compression and shear. Although there is not a direct
correlation between the hardness of an elastomer and its behavior in compression and shear, the
hardness property is still used because the test for it is quick and simple.
3
Unlike me
hardness is measured by reversible elastic indentation under a steel point. Hardness is measured in
degrees, either British Standard, BS, International Rubber Hardness, IRHD, (25) or Durometer
Hardness (26) which is most commonly used today. Hardness is measured by an instrument called a
durometer. The durometer Shore A hardness scale ranges from 0 (very soft) to 100 (very hard).
Generally, elastomeric bearing pads have durometer shore A hardnesses of 50 to 70 degrees and for this
range the IRHD and durometer hardness scales are equivalent. For comparison, the durometer shore A
hardness of a soft pencil eraser is about 30, a rubber band is about 40, an inner tube is about 50, a tire
tread is about 60, a shoe heel is about 70 , and a shoe sole is about 80 (11, 13).
Unfortunately, hardness measurements are variable and they depend
d er, the operator, the sample size, and the method of measurement, so that readings taken on the
same elastomer may vary by ±5 degrees (6). "Despite the attractiveness and apparent simplicity of
employing hardness as a means of characterizing different elastomers, hardness is not one of the
fundamental properties which directly enter into the design of a bearing" (13). The hardness of an
elastomeric bearing can be controlled by adjusting the amount of filler agent that goes into the
compounding of the elastomer. The hardness can be increased by increasing the amount of filler agent.
As the elastomer becomes harder, it stops behaving as a perfectly elastic material.

36
3.2 Compressive Stiffness
The compressive stiffness of an elastomeric bearing is a mechanical property that is of utmost
importance to a structural bridge engineer. The ideal bearing would be one that has an infinite
compressive stiffness such that the compressive deflections become negligible. In reality, the
compressive stiffness of an elastomeric bearing is far from infinity and it is up to the structural engineer
to select the most appropriate compressive stiffness of a bearing that will accommodate the loads
imposed by the bridge structure above. In addition, the bearing should be able to deform in such a way
to absorb any surface irregularities as well as accommodate angle mismatches between the beam and
abutment surfaces. There are a number of factors that affect the compressive stiffness of a bearing.
Therefore, it is important for the design engineer to be familiar with the methods and techniques
available that can be used to control the behavior of an elastomeric bearing.
3.2.1 Design Aids and Limitations: When elastomeric bearings were introduced in the
AASHTO specification (17), the compressive deflection of a bearing was limited to 15% of the total
elastomer thickness. In 1959, E.I. du Pont de Nemours and Company, in its publication entitled
"Design of Neoprene Bearing Pads" (11) also limited the compressive deflection to 15% of the total
elastomer thickness. It was not until the 11th edition of the AASHTO specification in 1973 (19) that
the compressive deflection requirement of elastomeric bearings was lowered from 15% to 7% of the
total elastomer thickness and was kept unchanged up to the most recent 15th edition AASHTO
specification (24). In 1983, E.I. du Pont de Nemours and Company published a handout entitled
"Engineering Properties of Neoprene Bridge Bearings" (8) in which it limited the compressive
deflection to 10% of the total elastomer thickness; a 5% decrease from its originally published
document in 1959 (11).
Stress-strain compressive curves for different shape factors and durometer hardness were
developed experimentally by various researchers (9, 11, 27) to serve as an aid in the design of
elastomeric bearings. Since plain elastomeric bearings were introduced before steel laminated
bearings, stress-strain compression curves for plain bearings were used for the design of both plain and
laminated bearings (11, 19, 20, 21, 22) (see Figures 2.15 and 2.17). Through the years, the use of steel
laminated bearings became more popular and therefore similar stress-strain compression curves were
introduced for steel laminated bearings (1, 8) (see Figure 2.16). The same curves could be also used
for plain bearings by simply dividing the shape factor values by 1.8.
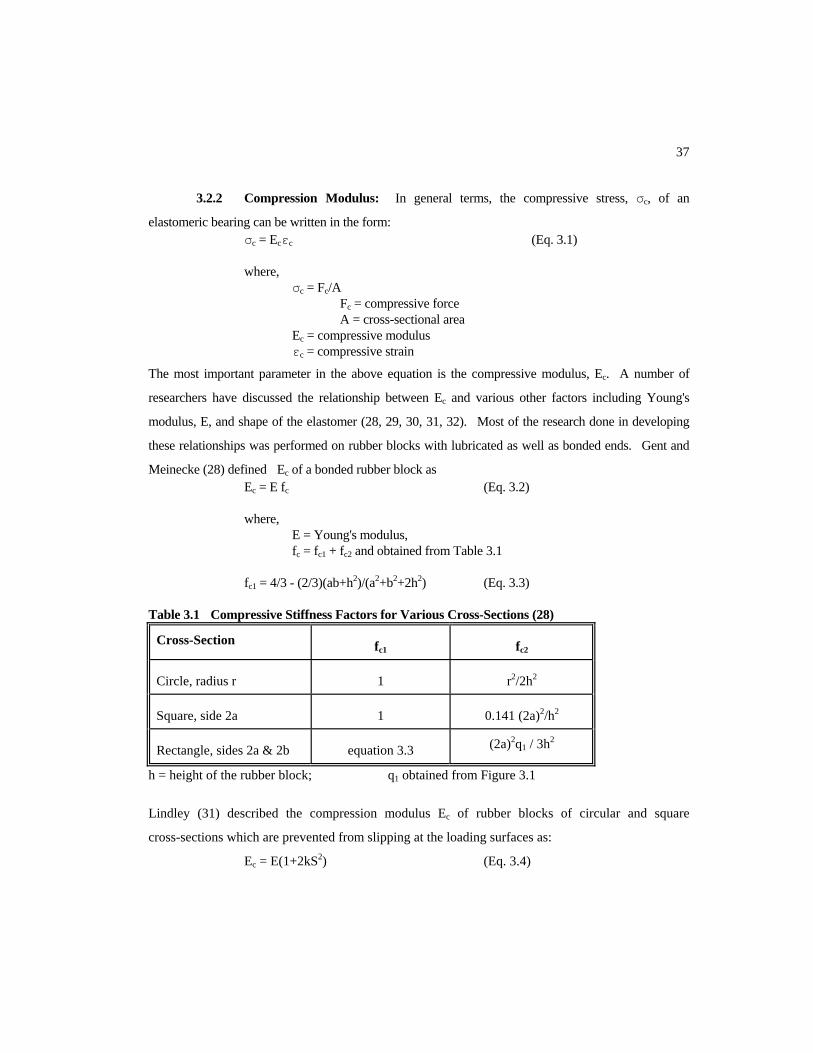
37
3.2.2 Compression Modulus: In general terms, the compressive stress, σc, of an
elastomeric bearing can be written in the form: σc = Ecεc (Eq. 3.1) where, σc = Fc/A Fc = compressive force A = cross-sectional area Ec = compressive modulus εc = compressive strain
The most important parameter in the above equation is the compressive modulus, Ec. A number of
researchers have discussed the relationship between Ec and various other factors including Young's
modulus, E, and shape of the elastomer (28, 29, 30, 31, 32). Most of the research done in developing
these relationships was performed on rubber blocks with lubricated as well as bonded ends. Gent and
Meinecke (28) defined Ec of a bonded rubber block as Ec = E fc (Eq. 3.2) where, E = Young's modulus, fc = fc1 + fc2 and obtained from Table 3.1 fc1 = 4/3 - (2/3)(ab+h2)/(a2+b2+2h2) (Eq. 3.3) Table 3.1 Compressive Stiffness Factors for Various Cross-Sections (28)
Cross-Section fc1 fc2
Circle, radius r 1 r2/2h2
Square, side 2a 1 0.141 (2a)2/h2
Rectangle, sides 2a & 2b equation 3.3 (2a)2q1 / 3h2
h = height of the rubber block; q1 obtained from Figure 3.1
Lindley (31) described the compression modulus Ec of rubber blocks of circular and square
cross-sections which are prevented from slipping at the loading surfaces as:
Ec = E(1+2kS2) (Eq. 3.4)

38
where k is an empirically determined factor less than one that decreases with an increase in hardness
(see Figure 3.2) and S is a shape factor defined as the ratio of the cross-sectional area to the force
free area.
Figure 3.1 Compression Stiffness Figure 3.2 Material Constant k as Factor q1 for Rectangular Cross-Section (28) a Function of Hardness (31)
In Equations 3.2 and 3.4, E is taken to be equal to 3 times the G. This relationship comes
from the assumption that rubber obeys the classical theory of elasticity at very low strains (i.e.
E=2G(1+v)) and with a Poisson's ratio very close to 0.5 (0.49989 to be precise (33)). At this point,
the author would like to draw the reader's attention to the fact that this ratio (E=3G) is only valid
when the rubber is highly elastic (i.e. minimal amounts of filler are present). For harder elastomers,
this ratio will no longer apply as it will be shown later in section 3.4.
3.2.3 Factors that Affect Compressive Stiffness: The compressive stiffness of an
elastomeric bearing can be increased by raising the shape factor (see Figure 3.3 and Figure 3.4).
The shape factor of an elastomeric bearing can be increased by reducing the total elastomer thickness
that is free to bulge and/or by increasing the cross-sectional area. Furthermore, inserting steel plates
at specific intervals within the bearing will drastically increase the shape factor which in turn will
reduce the amount of bulging around the perimeter. In addition, the compressive stiffness can be
increased by using a harder elastomer (see Figure 3.4).
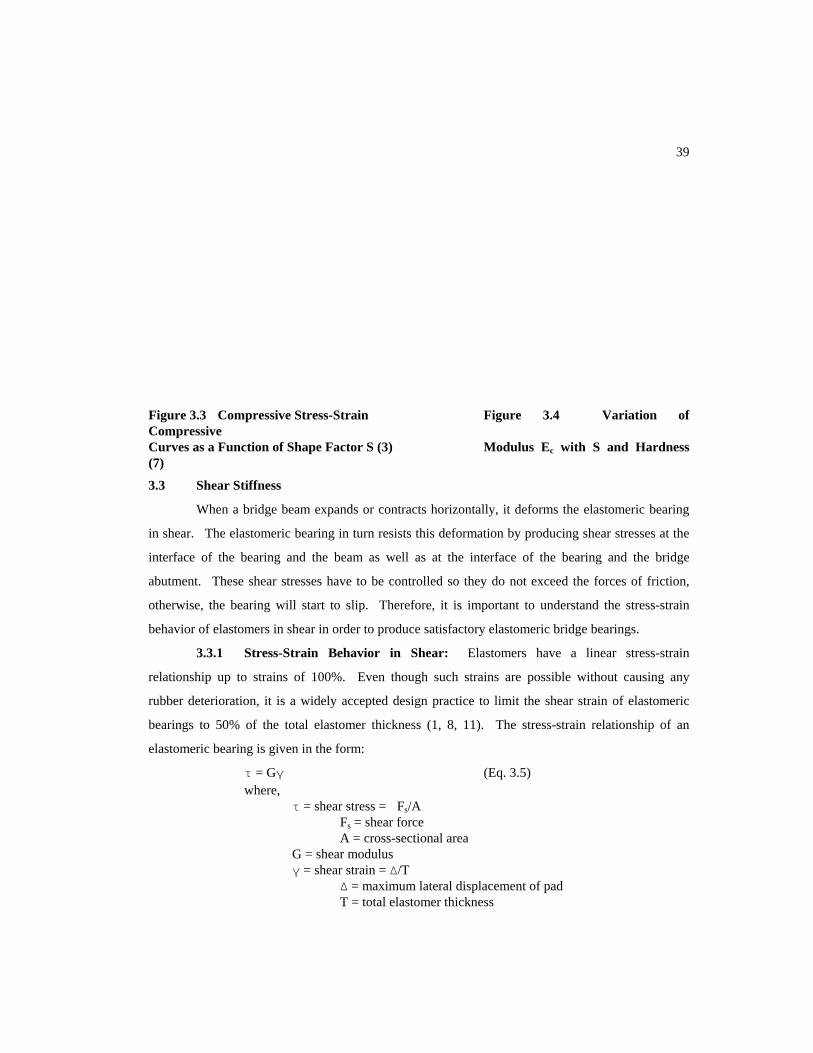
39
Figure 3.3 Compressive Stress-Strain Figure 3.4 Variation of Compressive Curves as a Function of Shape Factor S (3) Modulus Ec with S and Hardness (7)
3.3 Shear Stiffness
When a bridge beam expands or contracts horizontally, it deforms the elastomeric bearing
in shear. The elastomeric bearing in turn resists this deformation by producing shear stresses at the
interface of the bearing and the beam as well as at the interface of the bearing and the bridge
abutment. These shear stresses have to be controlled so they do not exceed the forces of friction,
otherwise, the bearing will start to slip. Therefore, it is important to understand the stress-strain
behavior of elastomers in shear in order to produce satisfactory elastomeric bridge bearings.
3.3.1 Stress-Strain Behavior in Shear: Elastomers have a linear stress-strain
relationship up to strains of 100%. Even though such strains are possible without causing any
rubber deterioration, it is a widely accepted design practice to limit the shear strain of elastomeric
bearings to 50% of the total elastomer thickness (1, 8, 11). The stress-strain relationship of an
elastomeric bearing is given in the form:
τ = Gγ (Eq. 3.5) where, τ = shear stress = Fs/A Fs = shear force A = cross-sectional area G = shear modulus γ = shear strain = Δ/T Δ = maximum lateral displacement of pad T = total elastomer thickness

40
Equation 3.5 is valid for both plain and steel reinforced bearings. The behavior of an elastomeric
bearing in shear is independent of the fact that it is reinforced or not since the effective rubber
thickness, ERT, is the only part of the bearing that is being sheared. For example, two bearings, one
reinforced and another plain, both having the same cross-sectional area, ERT, and base rubber
material will behave identically in shear. The reinforced bearing, nevertheless, will be stiffer in
compression. The only parameter in eq. 3.5 that affects the behavior of an elastomeric bearing pad
in shear is the material property: "shear modulus".
3.3.2 Shear Modulus: Shear modulus is an important engineering property that
directly enters into the design of elastomeric bearings. The value of shear modulus is a function of
the amount of filler that is present in an elastomeric compound. The rubber technologist can control
the amount of filler that is used in the mixing process to come up with shear modulus values that will
meet the design requirements of the bridge engineer within 10-15% variation. "Because many
laboratories are not setup to measure shear modulus, bearing manufacturers generally use hardness
as an indicator of stiffness" (8). Two elastomers of the same hardness obtained from two different
rubber manufacturers will not have the same shear modulus values because of the difference in their
chemical formulations. Furthermore, hardness measurements can vary by as much as 5 degrees
from one operator to another and this translates to an additional 15-20% variation in the actual shear
stiffness of a bearing. Therefore, it is not a good engineering approach to replace the shear modulus
test with the hardness test.
Considerable amount of research has been done to investigate the effect of compressive
stress on the shear modulus of an elastomeric bearing (8, 34). Results from the experimental
research showed little change in shear modulus with an increase in the compressive stress at a given
shear strain. While the shape factor of an elastomeric bearing has no effect whatsoever on the shear
modulus, temperature on the other hand has a lot to do with shear modulus. Figure 3.5 shows the
increase of shear modulus with the decrease in temperature. This means that when the temperature
drops, the shear stiffness of a bearing as well as the shear stresses induced in it will go up.
3.3.2.1 Determination of Shear Modulus: Shear is certainly a more important mode of
deformation for engineering applications than tension, nevertheless, tension remains the most
common mode for laboratory stress-strain tests (9). The purpose of conducting shear stress-strain
tests is to determine the shear modulus of the elastomer. Shear tests are performed on both full

41
quadruple shear test piece made up of four rubber blocks that are bonded to thick rigid steel plates (see
scale elastomeric bearings and small rubber samples cut from elastomeric bearings. In the full scale
test, two bearings are sandwiched between three concrete slabs (see Figure 3.6a).
Figure 3.5 Relationship of G to Hardness of Neoprene at Various Temperatures (8)
A compressive force representing the vertical reaction on a bridge beam is applied on the top and
bottom concrete slabs. A horizontal shear force is applied on the middle concrete slab to simulate the
shear stresses in the elastomeric bearing caused by the expansion and contraction of the bridge beam
due to temperature changes. With the compressive load held constant, the middle slab is loaded
horizontally until shear strains up to 100% are obtained in both directions. This loading-unloading
cycle is repeated several times until the stress-strain curve stabilizes. The linear portion of the final
stress-strain curve is used to calculate the shear modulus of the bearing. For example, Lee (35) uses
the stress-strain curve between tan15o (0.268) and tan 30o (0.577) in the calculation of the shear
modulus (see Figure 3.6b).
Shear modulus tests are also performed on small rubber samples that are obtained from the
original elastomeric bearing material. Annex A of the ASTM D4014 specification (23) describes the
test procedure and setup that is used to measure the shear modulus. The test setup consists of a

42
Figure 3.6 (a) Arrangement of Bearings and Concrete Slabs (b) Loading-Unloading
Figure 3.7a). The rubber blocks should have lengths and widths that are at least four times the
thickness. The test piece is strained in a tension machine at least 6 times up to an extension equal to the
average rubber thickness of one block. The load-displacement curve on the 6th loading cycle is used to
measure the shear modulus (see Figure 3.7b).
Curves

43
Figure 3.7 (a) Quadruple Shear Test Piece (b) 1st and 6th Load-Deflection Curves

44
3.4 Relation between Hardness and other Mechanical Properties
Reference 3 discusses the relationship between hardness, Young's modulus, E, and shear
modulus, G. Even though the design of an elastomeric bearing has to do with the knowledge of the
elastic modulus of the elastomer, it is a common practice to describe rubber by its indentation hardness -
a measure of an indentation produced under a known loading condition. Table 3.2 shows the scatter of
published G and E values with respect to durometer hardness of an elastomer. According to Gent, a
precise relationship although of somewhat complicated form exists between hardness and E (see Figure
3.8). The relationship between G and E at various hardnesses is also shown in Figure 3.8. For soft
highly elastic rubbers (i.e. elastomers with minimal amounts of fillers), E = 3G. As for the case of
stiffer materials which show "imperfect elastic behavior" (3), values of E=4G or more are possible.
The design engineer should be familiar these relationships, before blindly replacing E with 3G.
Table 3.2 Scatter of Published G and E values with respect to Hardness
Mechanical Properties E and G Obtained from the Following References
Ref. 6
Ref. 12
Ref. 7
Ref. 3
Ref. 22
Ref. 24
Ref. 35
Ref. 10
Ref 11
Hardness (Degrees)
SHEAR MODULUS G (psi)
50 87 93 93 90-115 85-110 95-130 71 91 110
60 145 154 154 135-165 120-155 130-200 114 129 160
70 203 254 251 200-260 160-260 200-300 157 177 215
Hardness (Degrees)
YOUNG'S MODULUS E (psi)
50 334 319 319 320-400 - - - - -
60 537 645 645 500-600 - - - - -
70 900 1088 1066 780-900 - - - - -
Note: 145psi = 1MPa

45
Figure 3.8 Relations Between Young's Modulus E, Shear Modulus G, and Hardness (3)
45
CHAPTER 4
STATIC MATERIAL TESTS ON NATURAL RUBBER (NR) BLOCKS
In this chapter, the static material tests conducted on the NR specimens will be discussed.
uch ma
odulus, tensile modulus, and shear modulus for NR
ecimen
.1 Test Setups
the compression, tension, shear, and combined compression and shear test
tups ar
.2 Supplier and Ordering Information
s, supplied the elastomeric bearing pads that
S terial tests include compression, tension, shear, and combined compression and shear. In
addition, specimen preparation, test method used, load and displacement measurements, and testing
procedures, among others, will be fully explained.
Material properties such as compressive m
sp s measuring 4 x 4 x 1, in. (101.6 x 101.6 x 25.4, mm) and 2 x 2 x 0.5, in. (50.8 x 50.8 x 12.7,
mm) will be calculated. The purpose of these tests is to see how well these mechanical properties
compare with the ones obtained from the full size NR elastomeric bearings.
4
The details of
se e shown in Figures 4.1 through 4.4. All Steel components including steel plates, welds and
bolted connections used in all test setups were designed according to the LRFD specification. The
aluminum plates used in the combined compression and shear test setup were designed to resist the
bending moment caused by the force in the calibrated bolt.
4
Applied Rubber Technology Inc., in Conroe, Texa
were used in this research. Pads measuring 9 x 28 x 1, in. (228.9 x 711.2 x 25.4, mm) were ordered in
both nominal shear moduli, Gn, of 100psi (0.69MPa) and 200psi (1.379MPa) instead of specifying the
commonly used property of durometer hardness. In addition, a microcrystalline type of wax replaced
the commonly used paraffinic wax. No information concerning test requirements or methods of
measuring the shear moduli values supplied were provided. Instead it was left to the rubber
manufacturer to choose whatever test method or technique was deemed necessary to come up with the
requested shear moduli. All other ingredients such as carbon black, and curing agents that go into the
chemical composition of the NR were left up to the rubber manufacturer.

46

47

48

49

50
(25.4mm) and 0.5in. (12.7mm) specimens deviated from their nominal thickness by as much as 0.130in.
(3.3mm) and 0.095in. (2.4mm), respectively.
4.3 Size of NR Specimens and Method of Cutting
Rubber blocks, 4 x 4 x 1, in. (101.6 x 101.6 x 25.4, mm) and 2 x 2 x 0.5, in. (50.8 x 50.8 x
12.7, mm), were cut from the originally supplied 9 x 28 x 1, in. (228.9 x 711.2 x 25.4, mm) NR bearing
pads. The 4 x 4 x 1, in. (101.6 x 101.6 x 25.4, mm) specimens were cut on a rotating steel band saw
equipped with a liquid coolant. The rough edges of the blocks were finished smooth with a hand held
rotating sander. The finishing operation was carefully done to avoid overheating of the NR blocks.
The 2 x 2 x 0.5, in. (50.8 x 50.8 x 12.7, mm) specimens were obtained by first cutting NR blocks into 2
x 2 x 1, in. (50.8 x 50.8 x 25.4, mm) using the same procedure defined above. A rotating jig-saw blade
was then used to cut the blocks into thicknesses of 0.5in. (12.7mm).
4.4 Specimen Preparation
Twenty-eight specimens were cut from each of the 100psi (0.69MPa) and 200psi (1.370MPa)
NR pads for a total of 56 specimens (Figure 4.5). Half of the twenty-eight specimens measured 4 x 4 x
1, in. (101.6 x 101.6 x 25.4, mm) and the other half measured 2 x 2 x 0.5, in. (50.8 x 50.8 x 12.7, mm).
The specimens were numbered in such a way to indicate the type of material, dimension, type of test,
and quantity of specimens that fell under the same category (Figure 4.5). The first character stands for
the type of material: "1" for Gn of 100psi (0.69MPa), and "2" for Gn of 200psi (1.379MPa). The
second character represents the type of test: "C" for Compression, "T" for Tension, and "S" for Shear.
The last character simply signifies the number of specimens that fell under the same category of the first
three characters. A grid was marked on one side of the specimen to aid in the observation of the
behavior of the NR block under various stress concentrations. All markings were done by a silver felt
pen.
4.5 Measurement of Specimen Properties
Prior to gluing the natural rubber blocks to the steel surfaces of the steel fixtures, the length,
width, thickness, and hardness of each specimen were determined (see Tables 4.1a, 4.1b, 4.1c). The
length, width, and thickness of each specimen were measured to the nearest 0.001in. (0.0254mm) by
means of a Vernier caliber. The 4in. (101.6mm) and 2in. (50.8mm) specimens deviated from their
nominal length or width by as much as 0.140in. (3.6mm) and 0.057in. (1.5mm), respectively. The 1in.

51
Figure 4.5 Breakdown of the NR Specimens Used in the Test Program
Hardness values were determined by means of a Shore "A" Durometer (ASTM D2240 (26)). The
specimen was placed on a hard, horizontal surface and the durometer was held vertically with the point
of the indentor at least 0.5in. (12.7mm) from any edge. The presser foot of the durometer was applied
to the specimen without shock, keeping the foot parallel to the surface of the specimen. The durometer
was held for 1 to 2 seconds and the maximum reading recorded. The durometer hardness
measurements varied by as much as 4 units for the specimens with a nominal shear modulus (Gn) of
100psi (0.69MPa) and 200psi (1.379MPa).

52
53
4.6 Safety Precautions
In order to avoid any harmful side effects from over exposure to the chemical solvents and
adhesives, the cleaning operations were carried out in strict compliance with the Material Safety Data
Sheets, MSDS, supplied by the chemical manufacturer. Rubber gloves were worn for skin protection,
eye goggles with side shields were utilized to guard the eyes from any splashing chemical liquid, and a
respiratory half mask with chemical/organic filter was used for respiratory protection.
4.7 Rubber and Steel Surface Preparation
Certain steps were taken to assure that a good bond between the NR and the steel surfaces was
obtained. Both surfaces were properly treated and conditioned to provide an acceptable bonding
surface. The steel surface preparation consisted of vapor degreasing, grit blasting, and vapor

54
degreasing. The vapor degreaser used was "Trichloroethylene, C2HCl3" and it was brushed onto the
steel surface using Q-tips. The purpose of the first vapor degreasing operation was to remove soils
such as grease and oil. Blasting consisted of impinging abrasive particles against the surface of the
metal with an air stream. The abrasive particles used were "No5 sand". The second vapor degreasing
step was a safety factor designed to remove any abrasive dust or contaminants that may have been
present in the blasting material.
The NR surface was treated with a special solvent-based surface conditioner under the brand
name "Chemlock 7701." The solvent was carefully applied throughout the pad surface especially on
the corners and edges. "Chemlock 7701" altered the surface to make it more compatible with the
rubber to steel adhesive. After the solvent flashed off in five minutes or less, the treatment was
complete. In order to obtain best adhesion results, bonding the steel to the elastomer was done as soon
as the solvent had splashed off.
4.8 Adhesives
A special type of elastomer to metal epoxy under the brand names "Fusor 320" (resin) and
"Fusor 310B Black" (hardener) was used for all gluing operations. Fusor 320 was mixed with Fusor
310B Black by the ratio of 2:1 by volume. Both the resin and hardener were thoroughly mixed
together. Since the curing time for the epoxy was around 8 hours, all glued surfaces were allowed to
dry at least overnight.
The steps used to glue the two surfaces together are listed below:
1. The epoxy was uniformly applied on one surface of the elastomer.
2. The elastomer was then pressed on the treated steel surface with the help of C-
clamps until the extra epoxy was squeezed out of the edges of the elastomer.
3. The excess epoxy was wiped off the edges using the round edge of the Q-tip.
4. The glued surface was allowed to dry overnight.
5. The following day, the other side of the elastomer was glued to its corresponding
steel surface by following steps 1-4 listed above.
Figure 4.6 shows the gluing stages for the tension and compression specimens, while Figure
4.7 shows the gluing stages for the shear specimens.

55

56
57
.9
pression, tension , or shear were measured
electronically to the nearest 0.001in. (0.0254mm) by a 2in. (50.8mm) linear potentiometer. A digital
displacement gage was used to visually monitor the amount of deformation. A Tinius Olsen universal
tension/compression machine was used to measure all the loads in the NR blocks due to compression,
tension, and shear. The machine was calibrated prior to testing. In the combined compression and
shear test, the compression load was applied by a calibrated bolt. A strain indicator was utilized to
measure the amount of strain in the bolt. A load/strain relationship obtained from the calibration of the
bolts was used to relate the strain in the bolt to actual compressive loads. A data acquisition system
was used to collect and save load and displacement data electronically every 4 seconds.
4.10 Testing Procedures
All the tests were performed at room temperature. Since all the specimens were stored at the test
temperature, no special conditioning time was required before loading. The stress-strain relationship in
all the tests was based on the initial (undeformed) areas and thicknesses of the NR specimens.
4.10.1 Compression Tests: The compression tests were broken down into two parts. In
part I, values of compressive modulus, Ec, were calculated at very small strains (between 4% and 8%),
whereas, in part II, the effects of stress relaxation and creep (strain relaxation) were studied at various
strains.
In part I of the compression tests, each specimen was loaded up to approximately 12%
compressive strain and then unloaded at the same rate (0.02 in./minute, 0.5mm/minute). This
loading-unloading cycle was repeated five times in order to "condition" the specimen. The
compression modulus was measured on the 5th loading cycle between 4% and 8% strain.
In part II of the compression tests, the 1in. (25.4mm) thick specimens were loaded at a rate of
0.02in/minute, (0.5mm/minute) up to strains corresponding to 1500psi (10.24MPa) and 7500psi
(51.7MPa) compressive stresses, while the 0.5in. (12.7mm) thick specimens were loaded at the same
rate up to strains corresponding to 1100psi (7.59MPa) and 6000psi (41.38MPa) compressive stresses.
The loading was then stopped and the compressive deformation in the specimen was held constant.
The specimen was allowed to stress relax for 5 minutes. At the end of the 5 minutes, the machine was
turned on and the specimen was unloaded at the same rate. The amount of creep was measured as a
4 Displacement and Load Measurements
All deformations in the NR blocks due to com
58
percentage of the maximum strain, while the amount of stress relaxation was measured as a percentage
drop in the maximum stress.
4.10.2 Tension Tests: The tension tests were broken down into two parts. In part I, each
specimen was loaded in tension up to approximately 12% tensile strain and then unloaded at the same
rate (0.02in/min, 0.5mm/min). This loading unloading cycle was performed five times in order to
"condition" the specimen. The tensile modulus Et, was measured on the 5th cycle between 4% and 8%
strain. In part II of the tension tests, both the 1in. (25.4mm) and 0.5in. (12.7mm) specimens were
loaded in tension up to the point of failure at a rate of 0.02in/min, 0.5mm/min). The failure was
defined either as a splitting failure in the elastomer itself or as a bond failure at the steel/elastomer
interface.
4.10.3 Shear Tests: The shear tests followed the procedure outlined in ASTM D4014
Annex A (23). Six successive loading and unloading cycles up to a deformation equal to the average
block thickness were carried out for each shear specimen. The loading and unloading rates were set at
0.3in./min (8mm/min). The 6th loading cycle was used to calculate the shear modulus value.
4.10.4 Combined Compression and Shear Tests: In the combined compression and
shear tests, the same specimens tested in simple shear were used. The combined compression and
shear tests followed the same testing procedure outlined in ASTM D4014 Annex A (23). Before
loading and unloading the specimen 6 successive times to a deformation equal to the average block
thickness at a rate of 0.3in./min (8mm/min), a compression force was applied on the specimen through a
calibrated bolt. The specimen was sandwiched between two aluminum blocks and a calibrated bolt
with two washers and a nut were used to assemble the specimen. The strain gage coming out of the
calibrated bolt was wired to the strain indicator, and the nut was turned until the strain recorded by the
strain indicator gave the required compressive stress. The combined compression and shear test was
performed under two different compressive stresses. The reason for this was to investigate the effect of
compressive stress on the calculated shear modulus values. Compressive stresses of approximately
120psi (0.83MPa) and 220psi (1.52MPa) were used for the 0.5in. (12.7mm) thick NR specimens, while
compressive stresses of approximately 100psi (0.69MPa) and 150psi (1.03MPa) were used for the 1in.
(25.4mm) thick NR specimens.
After the completion of the combined compression and shear tests, the specimens were loaded
in simple shear up to the point of failure at a rate of 0.3in./min (8mm/min). The failure was defined
either as a splitting failure in the elastomer itself or as a bond failure at the steel/elastomer interface.

60
CHAPTER 5
ANALYSIS OF RESULTS
.1 Shear and Combined Compression and Shear Tests
imens (see Figures 4.3 and 4.4) were
lus values for the 2 x 2 x 0.5 in. (50.8 x 50.8 x 12.7 mm)
ecimen
5
All the shear and combined compression and shear spec
tested according to the procedure described in Annex A of ASTM D4014 (23). Six loading and
unloading force-displacement cycles were plotted for each test specimen (see Figure 5.1). The
force-displacement curves more or less stabilized after the first loading cycle (see Figure 5.1). Since
each shear specimen consisted of four NR blocks glued to four steel plates, the stress-strain behavior for
one NR block was obtained by using half the load and displacement values from Figure 5.1 and the
average area and thickness values from all four NR blocks. Figure 5.2 shows the first and sixth loading
stress-strain curves for one NR block. Shear modulus values were calculated from the sixth loading
cycle according to the procedure described in Annex A of ASTM D4014 (23). Additional shear
modulus values were obtained from the sixth loading cycle between strains of 20% and 40%. The
reason for selecting this range was that the stress-strain curve was found to be linear. Both methods
used to calculate the shear modulus values are graphically represented in Figure 5.2. Shear modulus
values were also obtained for the combined compression and shear tests using the same methods
described above. Table 5.1 summarizes the calculated shear modulus values for all the shear and
combined compression and shear specimens.
In general, the calculated shear modu
sp s were about 10% higher than those for the 4 x 4 x 1in, (101.6 x 101.6 x 25.4 mm) specimens.
In addition, the method described in Annex A of ASTM D4014 (23) gave shear modulus values that
were about 17% larger than the ones obtained between 20 and 40% strain. Section A1.1 in ASTM
D4014 (23) specifically mentions that shear modulus values obtained using this method will be even
larger for elastomers with hardnesses greater than 55 durometer. In other words, since 60 and 70
durometer elastomers are used in this research, the ASTM method will overestimate the shear modulus
values. In the combined compression and shear tests it was found that the shear modulus values
increased slightly with an increase in compressive stress. For example, the shear modulus value for the
1S4_01, 02, 03, 04 specimen increased by 3% and 4% when the compressive stress was raised from

61
zero to 112psi (0.77MPa) and 146psi (1MPa), respectively. This increase is small so that the effect of
compressive stress can be neglected.

62

63
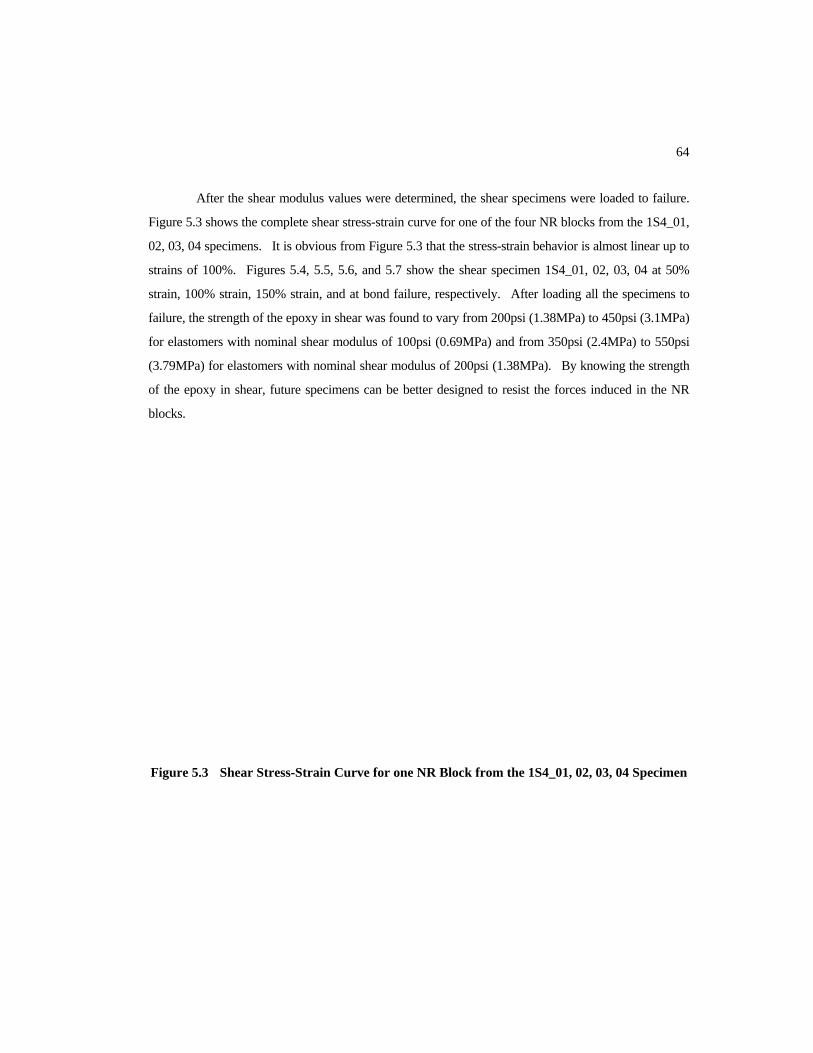
64
After the shear modulus values were determined, the shear specimens were loaded to failure.
Figure 5.3 shows the complete shear stress-strain curve for one of the four NR blocks from the 1S4_01,
02, 03, 04 specimens. It is obvious from Figure 5.3 that the stress-strain behavior is almost linear up to
strains of 100%. Figures 5.4, 5.5, 5.6, and 5.7 show the shear specimen 1S4_01, 02, 03, 04 at 50%
strain, 100% strain, 150% strain, and at bond failure, respectively. After loading all the specimens to
failure, the strength of the epoxy in shear was found to vary from 200psi (1.38MPa) to 450psi (3.1MPa)
for elastomers with nominal shear modulus of 100psi (0.69MPa) and from 350psi (2.4MPa) to 550psi
(3.79MPa) for elastomers with nominal shear modulus of 200psi (1.38MPa). By knowing the strength
of the epoxy in shear, future specimens can be better designed to resist the forces induced in the NR
blocks.
Figure 5.3 Shear Stress-Strain Curve for one NR Block from the 1S4_01, 02, 03, 04 Specimen

65

66

67
held at a constant strain for five minutes. Creep, on the other hand, was measured as a percentage of
the maximum compressive strain.
5.2 Compression Tests
All the compression specimens (see Figure 4.1) were loaded up to approximately 12% strain
and then unloaded back to zero. Five loading and unloading stress-strain cycles were plotted for each
test specimen (see Figure 5.8). It was noticed that the compressive stress-strain curves more or less
stabilized after the first loading cycle (see Figure 5.8). The compressive modulus, Ec, was calculated
from the fifth loading cycle as the slope of the best fit line passing through the collected data points
between 4% and 8% compressive strain. Since 7% compressive strain is the maximum permissible
value for elastomeric bearings, measuring Ec between 4% and 8% strain seemed appropriate.
Furthermore, there is no ASTM test available for measuring the compressive modulus of an elastomer.
Figure 5.9 shows the fifth loading cycles of all the 4 x 4 x 1in. (101.6 x 101.6 x 25.4mm) specimens and
their average Ec values computed between 4% and 8% strain. Table 5.2 summarizes the calculated
compression modulus values for all the compression specimens.
The calculated Ec values of the 2 x 2 x 0.5in. (50.8 x 50.8 x 12.7mm) specimens were higher
than the 4 x 4 x 1in. (101.6 x 101.6 x 25.4mm) specimens by 18% and 10% for nominal shear modulus,
Gn, values of 100psi (0.69MPa) and 200psi (1.38MPa), respectively. Furthermore, the calculated Ec
values of the Gn=200psi (1.38MPa) specimens were higher than the Gn=100psi (0.69MPa) specimens
by 50% and 40% for specimen sizes of 4 x 4 x 1in. (101.6 x 101.6 x 25.4mm) and 2 x 2 x 0.5in. (50.8 x
50.8 x 12.7mm), respectively. Compression modulus values were also calculated according to
Equation 3.2 (Ec=Efc). The value of Young's modulus, E, was taken to be 4G and 4.3G for the 60
durometer (i.e Gn=100psi (0.69MPa)) and 70 durometer (i.e. Gn=200psi (1.38MPa)) specimens,
respectively, and obtained from Figure 3.8. The average shear modulus values calculated according to
the ASTM 4014 (14) and 20-40% methods were used in Equation 3.2 to obtain compressive modulus
values. Table 5.3 compares the measured Ec values with the ones calculated from Equation 3.2. The
measured Ec values were found to be higher than the calculated ones from Equation 3.2 by about 30%
and 12% when shear modulus values from the ASTM 4014 (23) and 20-40% strain methods were used,
respectively.
After determining the compressive modulus values, all the specimens were loaded up to strains
of 30-40% and 45-55% in order to study their stress relaxation and creep (strain relaxation) behavior.
The stress relaxation was measured as a percentage drop in the maximum stress after the specimen was

68

69
Table 5.4 summarizes the creep and stress relaxation values for all the compression
specimens. It was noticed that the % creep values increased by as much as 210% and 174% for the 4 x
4 x 1in. (101.6 x 101.6 x 25.4mm) and 2 x 2 x 0.5in. (50.8 x 50.8 x 12.7mm) specimens, respectively,
when the maximum compressive strain was raised from about 30% to about 50%. On the other hand,
the stress relaxation increased by as much as 22% and 135% for the 4 x 4 x 1in. (101.6 x 101.6 x
25.4mm) and 2 x 2 x 0.5in. (50.8 x 50.8 x 12.7mm) specimens, respectively.

70
Figure 5.10 shows the compressive stress-strain curve for the 1C4_01 NR block with stress
laxatio
re n after five minutes and creep behavior, while Figure 5.11 shows specimen 1C4_02 at 55%
compressive strain. From Figure 5.11, it is obvious that the block bulges more at the center, where the
stress concentrations are high, than at the ends, where the stress concentrations are low.

71
Figure 5.10 Compressive Stress-Strain Curve for Specimen 1C4_01 Showing Stress
Relaxation and Creep

72
Figure 5.11 Compressive Specimen 1C4_02 at 55% Strain
73
Tension Tests
All the tension specimens (see Figure 4.2) were loaded up to approximately 12% strain and
en unloaded back to zero. Five loading and unloading stress-strain cycles were plotted for each test
ecimen (see Figure 5.12). It is obvious from Figure 5.12 that the tensile stress-strain curve stabilized
ter the first loading cycle. The tensile modulus, Et, was determined from the fifth loading cycle as the
ope of the best fit line passing through the collected data points between 4% and 8% strain. Figure
.13 shows the fifth loading cycles of all the 4 x 4 x 1in. (101.6 x 101.6 x 25.4mm) specimens and their
erage Et values measured between 4% and 8% strain. Table 5.5 summarizes the tensile modulus
alues for all the tension specimens.
The Et values of the 2 x 2 x 0.5in. (50.8 x 50.8 x 12.7mm) specimens were higher than the 4 x
x 1in. (101.6 x 101.6 x 25.4mm) specimens by 20% and 1% for nominal shear modulus, Gn, values of
00psi (0.69MPa) and 200psi (1.38MPa), respectively. Furthermore, the calculated Et values of the
Gn=2 and
28% for specimen sizes of 4 x 4 x 1in m) and 2 x 2 x 0.5in. (50.8 x 50.8 x
12.7mm), respectively.
5.3
th
sp
af
sl
5
av
v
4
1
00psi (1.38MPa) specimens were higher than the Gn=100psi (0.69MPa) specimens by 54%
. (101.6 x 101.6 x 25.4m

74
When the tensile modulus values were determined, all the specimens were loaded up to the
point where either the rubber or the epoxy failed. After loading all the specimens to failure, the
strength of the epoxy in tension was found to vary from 170psi (1.17MPa) to 330psi (2.28MPa) for

75
inal shear modulus of 100psi (0.69MPa) and from 190psi (1.31MPa) to 420psi
ddle of the NR block (see Figure 5.18) at the same time that a
elastomers with nom
(2.90MPa) for elastomers with nominal shear modulus of 200psi (1.38MPa). By knowing the strength
of the epoxy in tension, future specimens can be better designed to resist the forces induced in the NR
blocks.
Figure 5.14 shows the complete tensile stress-strain curve for the 1T4_03 specimen at various
loading stages. Figures 5.15 through 5.22 show the actual test specimen at the stages indicated in
Figure 5.14. Out of all the tests specimens, 1T4_03 was the only one to show a good failure sequence
in the rubber material. When specimen 1T4_03 was at a strain of about 80%, a small hole about the
size of a peanut appeared in the mi
popping sound was heard. The splitting in the rubber propagated from this initial hole and spread all
over the NR block (see Figures 5.18-5.22).

76
Figure 5.15 Tension Specimen 1T4_03 at 20% Strain
Figure 5.16 Tension Specimen 1T4_03 at 50% Strain
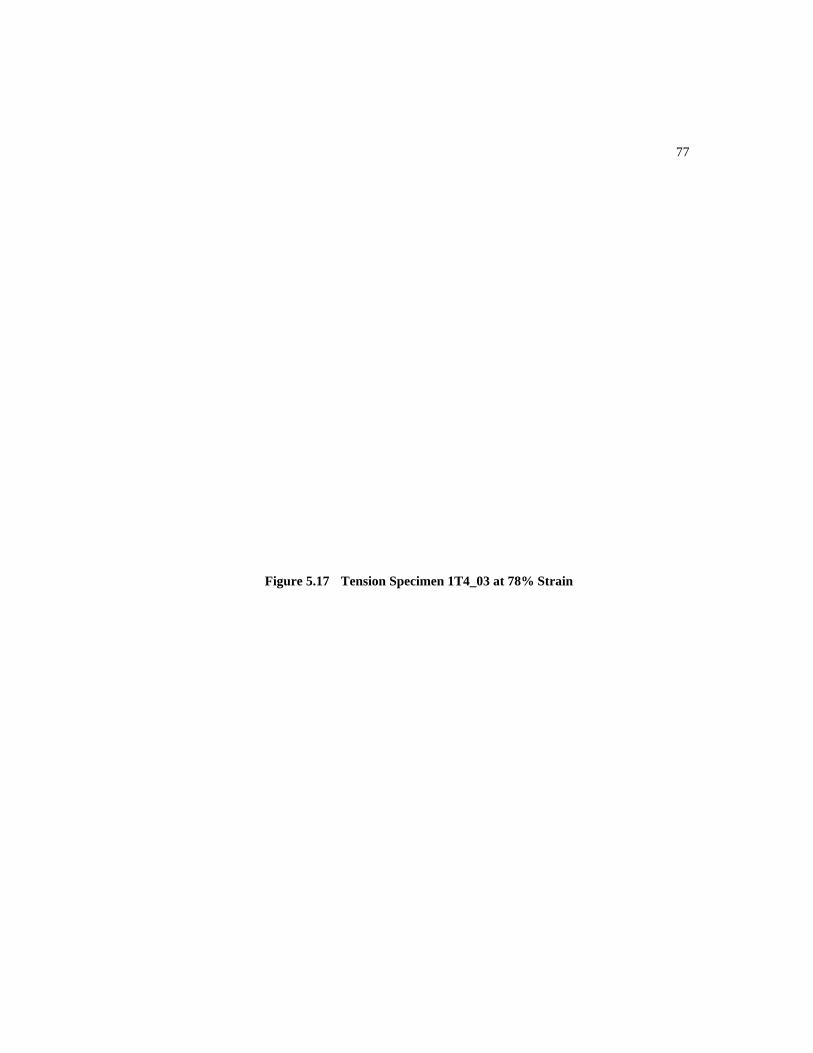
77
Figure 5.17 Tension Specimen 1T4_03 at 78% Strain

78
Figure 5.18 Tension Specimen 1T4_03 at Initial Rubber Failure
Figure 5.19 Tension Specimen 1T4_03 at 90% Strain (Tear Propagation)

79
Figure 5.20 Tension Specimen 1T4_03 at 100% Strain
Figure 5.21 Tension Speci en 1T4_03 at 110% Strain
m

80
Figure 5.22 Tension Specimen 1T4_03 at 115% Strain

81
5.4 Discussion of Test Results
The purpose of the experimental portion of this report is to investigate certain test parameters
in order to establish the influence of test technique, specimen size, and material type on the structural
properties of an elastomer, and also to determine if ere is a consistent relationship between the tensile
modulus, Et, compressive modulus, Ec, and shear m us, G, values of the tested specimens.
Compression, tension, shear, and combined compression and shear tests were performed on 2
x 2 x 0.5in. (50.8 x ) natural rubber NR
ecimens with nominal shear modulus, Gn, values of 100psi (0.69MPa) and 200psi (1.38MPa). The
mpression and tension specimens (see Figures 4.1 and 4.2) used to measure Ec and Et, respectively,
nsisted of one NR block, while the shear and combined compression and shear specimens (see
igures 4.3 and 4.4) used to measure G, consisted of four NR blocks. Since the average stress-strain
lationship of four NR blocks was used to measure the shear modulus value, the shear test gives a
etter representation of the material property of the elastomer. Rubber manufacturers perform a
ifferent type of tension test (ASTM D412 (36)) in which a tensile coupon is tested at high tensile
rains (i.e. 100% to 300% elongation) and a different type of compression test (ASTM D395 (37)) in
hich small rubber specimens are compressed under a known load or displacement for a certain period
f time at elevated temperatures. Compared to these two ASTM tests (36, 37), the shear modulus test
STM D4014 (23)) is the most expensive of all and is usually not performed unless it is requested by
e rubber purchaser.
As is was mentioned earlier, the measured shear modulus values of the 2 x 2 x 0.5in. (50.8 x
0.8 x 12.7mm) specimens were about 10% higher than the 4 x 4 x 1in. (101.6 x 101.6 x 25.4mm)
ecimens. The ASTM D4014 (23) test limits the specimen size to no less than 0.25in. (6mm) thick
d to a square or rectangular cross-section with the lengths and widths at least four times the thickness.
In order to achieve st should be either
specified or limited to a certain range of dimensions
After measuring the material properties of Ec, Et and G of the elastomers from all the test
specimens, their average values were compared to see whether or not any interrelationship exists.
Table 5.6 shows the average tensile and compressi e modulus values obtained from three specimens,
and the average shear modulus values obtained from two specimens. Table 5.6 shows that the
measured shear modulus values are 20%-30% h gher than the 100psi (0.69MPa) nominal shear
modulus material, and 10-20% lower than the 200psi (1.38MPa) nominal shear modulus material.
th
odul
50.8 x 12.7mm) and 4 x 4 x 1in. (101.6 x 101.6 x 25.4mm
sp
co
co
F
re
b
d
st
w
o
(A
th
5
sp
an
consistent test results, the specimen size in the ASTM te
.
v
i

82
Furthermore, the ratio of the compressive modulus the tensile modulus varies from 1.79 to 1.96, the
ratio of the compressive modulus to the shear modulus varies from 13.75 to 14.90, and the ratio of the
tensile modulus to the shear modulus varies from 7.28 to 8.3. When the Ec to G ratios for the 4 x 4 x
1in. (101.6 x 101.6 x 25.4mm) and 2 x 2 x 0.5in. (50.8 x 50.8 x 12.7mm) specimens were averaged,
their values were 14.38 and 14.57 for Gn=100psi (0.69MPa) and Gn=200psi (1.38MPa) rubber material,
respectively. When the Et to G ratios for the 4 x 4 x 1in. (101.6 x 101.6 x 25.4mm) and 2 x 2 x 0.5in.
(50.8 x 50.8 x 12.7mm) specimens were averaged, their values were 7.81 and 7.80 for Gn=100psi
(0.69MPa) and Gn=200psi (1.38MPa) rubber materi , respectively.
The measured shear modulus values of the 4 x 4 x 1in. (101.6 x 101.6 x 25.4mm) specimens
with Gn=100psi (0.69MPa) and Gn=200psi (1.38MPa) were 118psi (0.81MPa) and 162psi (1.12MPa),
respectively, while the measured shear modulus values of the full scale elastomeric bearings were
113psi (0.78MPa) and 148psi (1.02MPa), respectively. The full scale elastomeric bearing specimens
measured 9 x 14 x 2in. (229 x 356 x 51mm) with a total elastomer thickness of 1.75in. (44.5mm) and
two 0.125in. (3.2mm) steel plates. In other words, the shear modulus values of the small scale
specimens were higher than the shear modulus values of the full scale specimens by 4% and 9% for Gn=
100psi (0.69MPa) and Gn=200psi (1.38MPa) rubber material, respectively.
Finally, the combined compression and shear tests gave shear modulus values that were about
3% higher than the ones obtained from the simple shear test. This increase is small enough that the
effect of compressive stress can be neglected.
to
al
80
CHAPTER 6
SUMMARY, CONCLU ECOMMENDATIONS
.1 Summary
ral rubber blocks of nominal shear modulus, Gn, values of 100psi (0.69MPa)
.2 Conclusions
ing the experiments, it was noticed that the 2 x 2 x 0.5in. (50.8 x 50.8 x 12.7mm)
ecimen
SIONS AND R
6
In this study, natu
and 200psi (1.38MPa) and measuring 4 x 4 x 1in. (101.6 x 101.6 x 25.4mm) and 2 x 2 x 0.5in. (50.8 x
50.8 x 12.7mm) were tested in compression, tension, shear, and combined compression and shear. A
detailed description of the sample preparation, test setups used and methods of testing are presented in
Chapter Four of this report. Stress-strain relationships were obtained from all tests and material
properties such as shear modulus, G, compressive modulus, Ec, and tensile modulus, Et were calculated.
All test results obtained from these experiments are fully presented in Chapter Five of this report.
6
After perform
sp s gave higher material property values of Ec, Et, and G than the 4 x 4 x 1in. (101.6 x 101.6 x
25.4mm) specimens. Therefore, it is concluded that the specimen size affects the material properties of
an elastomer. The shear and combined compression and shear tests were performed according to the
procedure outlined in ASTM D4014 Annex A (23). Shear modulus values calculated according to the
equation presented in the ASTM D4014 (23) test were higher than the ones calculated from the straight
line portion of the sixth loading stress-strain curve between 20% and 40% strain. It is concluded that
the shear modulus values computed between 20% and 40% strains for the 4 x 4 x 1in. (101.6 x 101.6 x
25.4mm) specimens better predict the shear modulus values obtained from full scale elastomeric
bearings than the 2 x 2 x 0.5in. (50.8 x 50.8 x 12.7mm) specimens. The shear modulus values of the
small scale specimens were higher than the shear modulus values of the full scale specimens by 4% and
9% for Gn=100psi (0.69MPa) and Gn=200psi (1.38MPa) rubber material, respectively. Shear modulus
values computed from the combined compression and shear tests were found to be only 3% higher than
the shear modulus values computed from the simple shear tests. In conclusion, the shear modulus
value of a NR block is not affected by an increase in the compressive stress.

81
6.3 Recommendations for Future Research
Test specimen sizes used to measure the mechanical properties of elastomeric materials should
be representative of the full scale elastomeric bearings. Therefore, very small specimen sizes should
not be used since they overestimate the material properties. When ordering elastomers by shear
modulus, it is recommended that the type of shear modulus test, including specimen sizes, rate of
testing, and method of measuring the shear modulus values be specified. Since the hardness
measurement is not a true mechanical property of an elastomeric bearing, the shear modulus value
should be specified when placing an order. The hardness measurement should be used only as a tool to
help identify the type of elastomer and not as a design aid. Furthermore, even though it is well
documented that Poisson's ratio for rubber is close to 0.5, which makes the relationship of Young's
modulus to shear modulus 3:1, it should be understood by the design engineers that this relationship is
only true for highly elastic rubbers. For hard elastomers, ratios of 4 or 5 are possible. When the value
of Young's modulus, E, is encountered in design, it is recommended that either a test be performed to
determine the value of E, or that the exact relationship between G and E from Figure 3.8 be used.
At shear strains of about 100%, the 0.25in. (6mm) steel plates that were used in the
construction of the shear specimens started bending. This did not affect the test results since all the
shear modulus values were measured at 50% shear strains. In order to reduce the bending effects at
high strains thicker steel plates should be used. Concerning the compression tests, in order to eliminate
any edge effects like the ones shown in Figure 5.11, it is recommended that the steel plates used in the
construction of the compression specimens have the same overall dimensions as the rubber specimens.
All NR blocks used in this research had a shape factor of about "1". In order to determine if
the shape factor of an elastomeric bearing has an effect on the shear modulus value, rubber blocks with
a number of shape factors should be tested. Additional research can be performed on steel laminated
rubber blocks to investigate the effect of reinforcement on the shear behavior. The natural rubber
material used in this research was obtained from one supplier only. It is worthwhile to look into the
scatter, if any, of the mechanical properties of similar elastomers that are obtained from different rubber
suppliers.
82
BIBLIOGRAPHY
1. American Association of State Highway and Transportation Officials. Standard Specification for Highway Bridges, 15th Edition. Washington, D.C., 1992. 2. Hofmann W. Rubber Technology Handbook, Hanser Publishers, Munich , 1989. 3. Payne, A.R. and Scott, J.R. Engineering Design with Rubber. Maclaren and Sons, London, 1960. 4. Stanton, J.F., Roeder, C.W. "Elastomeric Bearings Design, Construction, and Materials." National Cooperative Highway Research Program Report #248. Washington, D.C., August 1982. 5. Hertz, Daniel, and Eastern, Seals. "Mechanics of Elastomers Affect Design Considerations." Elastomerics. Vol. 120, #1, New York, January 1988, pg.10. 6. Long, J.E. Bearings in Structural Engineering. Butterworth, London, 1974. 7. Roberts A.D. National Rubber Science and Technology. London, 1988. 8. E.I. du Pont de Nemours and Company. "Engineering Properties of Neoprene Bridge Bearings", Du Pont. Wilmington, Delaware, 1983. 9. Brown, R.P. Physical Testing of Rubber, 2nd Edition. Elsevier, New York, 1986. 10. Lindley, Peter B. "Natural Rubber Structural Bearings." American Concrete Institute (ACI) SP-70. Detroit, Michigan, 1982. 11. E.I. du Pont de Nemours and Company. "Design of Neoprene Bearing Pads," Du Pont. Wilmington, Delaware, April 1959. 12. Stanton, John F., Roeder, Charles W. "Elastomeric Bridge Bearings Specifications: Review of the Present and Proposals for the Future." ACI Journal, Nov.-Dec. 1983, pg. 514. 13. Taylor, Andrew W., Lin, Albert N., and Martin, Jonathan W. "Performance of ElAstomers in Isolation Bearings: A Literature Review." Earthquake Spectra. Vol. 8, #2, 1992, pg. 279
83
14. Roeder, Charles W., Stanton, John F., and Taylor, Andrew W., "Failure Modes of Elastomeric Bearings and the Influence of Manufacturing Methods." American Concrete Institute (ACI) SP 94-17. Detroit, Michigan, 1986, pg. 279. 15. Purkiss, C.W. "New Design Parameters for Elastomeric Bridge Bearings: What They Mean in Terms of Performance." American Concrete Institute (ACI) SP-70. Detroit, Michigan, 1982. 16. Chhauda, J.N., Tamhankar, M.G., Kuriakose, Baby, and Thomas, E.V. "Performance of Natural Rubber Bridge Bearing Pads - Current Laboratory Research." American Concrete Institute (ACI) SP-70. Detroit, Michigan, 1982. 17. American Association of State Highway and Transportation Officials. Standard Specification for Highway Bridges, 8th Edition. Washington, D.C., 1961. 18. American Association of State Highway and Transportation Officials. Standard Specification for Highway Bridges, 9th Edition. Washington, D.C., 1965. 19. American Association of State Highway and Transportation Officials. Standard Specification for Highway Bridges, 11th Edition. Washington, D.C., 1973. 20. American Association of State Highway and Transportation Officials. Standard Specification for Highway Bridges, 12th Edition. Washington, D.C., 1977. 21. American Association of State Highway and Transportation Officials. Standard Specification for Highway Bridges, 13th Edition. Washington, D.C., 1983. 22. American Association of State Highway and Transportation Officials. Standard Specification for Highway Bridges, 14th Edition. Washington, D.C., 1989. 23. American Society for Testing and Materials," Standard Specification for Plain and Steel-Laminated Elastomeric Bearings for Bridges," ASTM D4014-89. 24. American Association of State Highway and Transportation Officials. Standard Specification for Highway Bridges, 15th Edition. Washington, D.C., 1992. 25. American Society for Testing and Materials, "Standard Test Method for Rubber Property - International Hardness," ASTM D1415-88. 26. American Society for Testing and Materials, "Standard Test Method for rubber Property - Durometer Hardness," ASTM D2240-91. 27. Minor, John C., and Egen, Richard A. "Elastomeric Bearing Research." National Cooperative Highway Research Program Report #109. Columbus, Ohio, 1970. 28. Gent A.N. and Mineinecke, E.A. "Compression, Bending, and Shear of Bonded Rubber Blocks." Polymer Engineering and Science. Vol 10, #1, January 1970.

84
.
ASTM D395-89.
29. Gent, A. N., Lindley P.B. "The Compression of Bonded Rubber Blocks." Proc. Instn Mech. Engrs. Vol. 173, #3, 1959, pg. 111. 30. Payne, A. R. "Shape Factors and Functions in Rubber Engineering." Engineer. Vol. 207, Jan.-March 1959, pg. 328, pg. 368. 31. Lindley P.B. "Load_Compression Relationships of Rubber Units." Journal of Strain Analysis. Vol. 1, #3, 1966, pg. 190. 32. Holownia, B.P. "Compression of Bonded Rubber Blocks." Journal of Strain Analysis. Vol. 6, #2, 1971, pg. 121. 33. Lindley P.B. "Effects of Poisson's Ratio on Compression Modulus." Journal of Strain Analysis. Vol. 3, #2, 1968, pg. 143. 34. Porter, L.S. and Meinecke, E.A. "Influence of Compression Upon The Shear Properties of Bonded Rubber Blocks." Rubber Chemistry and Technology. Vol. 53, 1980, pg. 1133. 35. Lee, David J. The Theory and Practice of Bearings and Expansion Joints. Cement and Concrete Association, London, 1971, pg. 53 36. American Society for Testing and Materials, " Standard Test Methods for Rubber in Tension," ASTM D412-87. 37. American Society for Testing and Materials," Standard Test Methods for Rubber Property - Compression Set,"


![⃝[jean baudrillard, jean nouvel] the singular objec](https://img.dokumen.tips/doc/110x75/568caa3c1a28ab186da0c5b5/jean-baudrillard-jean-nouvel-the-singular-objec.jpg)


