Embed Size (px)
Citation preview

Copyright
by
Rahul Verma
2016

The Thesis Committee for Rahul Verma
Certifies that this is the approved version of the following thesis:
Hydraulic fracturing sand resource development in the Llano uplift
region, central Texas: Resource calculation, favorability analysis, and
transportation economics
APPROVED BY
SUPERVISING COMMITTEE:
Brent A. Elliott
J. Richard Kyle
Genaro Gutierrez
Supervisor:

Hydraulic fracturing sand resource development in the Llano
uplift region, central Texas: Resource calculation, favorability
analysis, and transportation economics
by
Rahul Verma, B.E.
Thesis
Presented to the Faculty of the Graduate School of
The University of Texas at Austin
in Partial Fulfillment
of the Requirements
for the Degree of
Master of Science in Energy and Earth Resources
The University of Texas at Austin
May, 2016

Dedication
Dedicated to Hardeep Verma, Parmod Lata, and Ridhima Verma

v
Acknowledgements
I sincerely thank Brent A. Elliott for his mentorship and inputs throughout the
research. I would like to thank reviewers notably Richard Kyle, Genaro Gutierrez, Earl
McBride, and John Carranza. This study uses data from the Texas Water Development
Board, Texas Commission on Environmental Quality, IHS Inc., US Geological Survey,
Texas Natural Resources Information System, and the Bureau of Economic Geology. I
thank these institutions for their support. The funding for this study was provided through
the State of Texas Advanced Resource Recovery program through the University of Texas
at Austin, and Texas Department of Transportation through the Center for Transportation
Research. The study was greatly enhanced by regional mapping products, produced by the
University of Texas at Austin Bureau of Economic Geology, and funded through United
States Geological Survey Mapping Cooperative Program, STATEMAP Award No.
G14AC0020. I’d like to thank my family and friends for their invaluable support.

vi
Abstract
Hydraulic fracturing sand resource development in the Llano
uplift region, central Texas: Resource calculation, favorability
analysis, and transportation economics
Rahul Verma, M.S.E.E.R.
The University of Texas at Austin, 2016
Supervisor: Brent A. Elliott
Use of naturally occurring sand, one of the most commonly used proppants for
hydraulic fracturing, has grown tremendously as a commodity in the past decade as
hydraulically wells for petroleum production from unconventional reservoirs increased
significantly. USGS estimates that the United States produced more than 94 million metric
tons of industrial sand in 2015, almost 52 percent of the global production. About 71
percent the total industrial sand was used for hydraulic fracturing and well packing in 2015.
With the recent decline in oil and gas price and exploration drilling, it becomes all the more
relevant to develop low cost, locally extracted sand for hydraulic fracturing. The Hickory
sandstone unit of the Riley formation in central Texas is one such resource. The region is
already one of the largest sand producers in the US and is conveniently located within 200–
300 miles of major shale basins in Texas. Barnes and Schofield (1964), and Kyle and
McBride (2014) present geological studies of the region and its potential for hydraulic

vii
fracturing sand. This study builds on this experience, to calculate for the first time, the total
resource volume in the region. Benson et al. (2015) considers high friability, near surface
access and proximity to transportation facilities as the three most important qualities of
sand resource. As the sand in the Llano uplift region was never buried more than 1,500
feet, it remains friable (Kyle and McBride, 2014). This study estimates the sand resource
in the Llano Uplift region to be more than 24 billion metric tons, of which, 20 billion metric
tons is characterized by near surface access and proximity to transportation facilities.
Several favorable sites for extraction are identified in Mason County, McCulloch County,
San Saba County, Barnet County, and Llano County. Several hydraulic fracturing sites in
the Barnett, Eagle Ford, and Permian basin, with fracture closure stress less than 6,000 psi,
are identified as potential markets for the sand extracted in the Llano Uplift. A
transportation cost optimization between using railways and highways, to transport sand
from favorable extraction sites to hydraulic fracturing sites, finds that using highways is
most cost effective means for transporting to all the sites in the Permian basin, most sites
in the Barnett basin, and a few in the Eagle Ford basin. A combination of railways and
highways is found to be more cost effective on a few routes to the Barnett and Eagle Ford
basin.

viii
Table of Contents
Table of Contents ................................................................................................. viii
List of Tables ...........................................................................................................x
List of Figures ........................................................................................................ xi
Chapter 1. Introduction ............................................................................................1
Chapter 2. Geologic Setting .....................................................................................9
2.1 The Llano Uplift and Precambrian basement rocks ..................................9
2.1.1 The Riley Formation and Hickory Sandstone .............................12
2.1.2 The Wilberns Formation and Post-Cambrian strata....................14
2.2 Petroleum basins in Texas ......................................................................16
2.2.1 Fort Worth Basin.........................................................................16
2.2.2 Permian Basin .............................................................................19
2.2.2.1 Eastern Shelf ...................................................................19
2.2.2.2 Midland basin, Central basin platform, and Delaware basins
............................................................................................21
2.2.3 Eagle Ford basin .........................................................................24
Chapter 3. Methodology ........................................................................................29
3.1 Volume calculation: Natural neighbor interpolation ..............................31
3.1.1 Data .............................................................................................31
3.1.2 Calculation ..................................................................................34
3.2 Favorability assessment: Fuzzy logic analysis .......................................43
3.2.1 Data .............................................................................................43
3.2.2 Calculation ..................................................................................50
3.3 Suitable Hydraulic fracturing sites: Fracture closure stress analysis ......61
3.3.1 Data .............................................................................................61
3.3.2 Calculation ..................................................................................62
3.4 Transportation and cost optimization......................................................63
3.4.1 Data .............................................................................................64
3.4.2 Calculation ..................................................................................66

ix
Chapter 4. Results and Discussion .........................................................................71
4.1 Volume calculation .................................................................................71
4.2 Favorability calculation ..........................................................................72
4.3 Suitable hydraulic fracturing well sites ...................................................77
4.4 Transportation analysis ...........................................................................79
Chapter 5. Conclusion ............................................................................................84
Appendix 1 .............................................................................................................87
References ..............................................................................................................89

x
List of Tables
Table 1.1 Quality guidelines for hydraulic fracturing sand. ....................................5
Table 3.1 Fuzzy membership for sandstone and overburden. ...............................45
Table 3.2 Fuzzy membership for proximity to highways and railway. .................49
Table 3.3 Description of Fuzzy operators. Source: Bonham-Carter (2014) ..........50
Table 3.4 Pressure gradient for oil and gas basins. ................................................63
Table 3.5 Cost of transportation.............................................................................67
Table 4.1 Favorable volume and area result ..........................................................74
Table 4.2 (a) Summary of network analysis. .........................................................81
Table 4.2 (b) Summary of network analysis. .........................................................82
Table A1. List of existing quarries in the Llano uplift ..........................................87

xi
List of Figures
Figure 1.1 Hydraulic fracturing sand producing regions in the United States. .......3
Figure 1.2 Grain size distribution of Hickory sandstone. .......................................6
Figure 2.2 Hydraulic fracturing sand resource stratigraphy in the Llano Uplift are of
central Texas. ....................................................................................13
Figure 2.3 Forth Worth basin geologic setting. ....................................................17
Figure 2.4 Permian basin geologic units. ..............................................................20
Figure 2.5 Eagle Ford basin geologic setting........................................................25
Figure 3.1 Methodology process flowchart. .........................................................30
Figure 3.2 Data sample from TWDB submitted driller’s report. ..........................32
Figure 3.3 Locations of water wells in TWDB submitted driller’s report. ...........33
Figure 3.4a Voronoi tessellation for original 5 points with known variable. ........35
Figure 3.4b Voronoi tessellation after adding 6th point with unknown variable. ..35
Figure 3.5 Sandstone thickness (feet). ..................................................................41
Figure 3.6 Overburden thickness (feet). ...............................................................42
Figure 3.7 Proximity to highways, multi-buffer analysis. ....................................47
Figure 3.8 Proximity to railroad, multi-buffer analysis ........................................48
Figure 3.9 Fuzzy OR combination of proximity to highway or railroad ..............52
Figure 3.10 Fuzzy product combination of sandstone and overburden thickness. 54
Figure 3.11 Fuzzy GAMMA combination of Fuzzy transport and resource. ........56
Figure 3.12 Change in fuzzy membership with change in GAMMA. ...................57
Figure 3.13 Methodology for favorability calculation. ..........................................58
Figure 3.14 Areas restricted for mining. ................................................................60
Figure 3.15 Process flow chart for finding least cost route. ..................................65
xii
Figure 3.16 Least cost route that use only highways for transportation. ...............69
Figure 3.17 Least cost routes that use intermodal transportation. .........................70
Figure 4.1 Final favorability map. ........................................................................73
Figure 4.2 Location of existing mines compared to computed favorability. ........76
Figure 4.3 Oil and gas hydraulic fracturing sites suitable for Texas’ sand...........78
Figure 4.4 Least cost routes from favorable mining locations to suitable hydraulic
fracturing sites. ..................................................................................83

1
Chapter 1. Introduction
The hydraulic fracturing industry has had a tremendous impact on state and local
economies and the hydraulic fracturing sand industry is a large benefactor of the
development (Considine et al., 2011). Clark (1949), in the first introduction to hydraulic
fracturing, defines the two-step process as: (1) injecting a viscous liquid with suspended
material, like sand, at high pressure to induce fracture in the formation, and (2) causing the
viscous liquid to change from high to low viscosity to allow its displacement from the
formation. The suspended material is a propping agent that stays in the fractures to keep
the fractures open and allow the oil and gas to flow out. Naturally occurring sand is one of
the most commonly used types of proppant material (Beckwith, 2011). Resin coated sand
and sintered bauxite are some other types of synthetic or modified proppant materials
(Benson, M.E. et al., 2015). This study focuses on the resource development aspects of
naturally occurring sand in the Llano uplift region of central Texas (see Figure 1.1).
Wisconsin and Minnesota produce the “Northern White sand” or “Ottawa sand” and
remain the largest producers of hydraulic fracturing sand in the US (Benson et al., 2015);
the Texas’s sand also known as ‘Brady’ or ‘Brown’ sand, closely follows in total
production (US Geological Survey, 2016). On a global level, the US is by far the largest
producer of industrial sand estimated at 94 million metric tons in 2015, more than 52
percent of the estimated global production in the same year (US Geological Survey, 2016).
As much as 71 percent (78 million metric tons) of the industrial sand in the US is used for

2
hydraulic fracturing and well packing (US Geological Survey, 2016). Figure 1.1 shows all
the major sand producing regions and prospective resources for proppant sand in the US.

3
Figure 1.1 Hydraulic fracturing sand producing regions in the United States.
Source: Benson et al., (2015)

4
Cambrian formations in Wisconsin, Minnesota and Illinois form one of the largest
sand resource in the country. Hickory sandstone in the Riley formation in Central Texas is
another major source of sand. Other major sand producing states in the US are Arkansas,
Oklahoma, Missouri and Iowa.
The American Petroleum Institute determines the quality standards for hydraulic
fracturing sand in standard ARI RP 19C/ISO 13503-2. Table 1.1 lists the desired
characteristics compared to Northern White sand. ISO 103503–2 column in Table 1.1 lists
ISO standards against respective properties for sand. In the next column, the standard is
compared to the average observed quality in 40/70 Ottawa sand.

5
Table 1.1 Quality guidelines for hydraulic fracturing sand.
Source: Benson, M.E. et al., 2015
Zdunczyk (2014) notes that grain size within 20/40 and 30/50 sieve number is most
commonly used for oil fracturing, and that within 40/70 and 70/100 sieve number is used
for gas fracturing. Barnes and Schofield (1964) provided data on grain size distribution of
the Hickory sandstone; more than 55 percent of the sand lies in the range appropriate for
hydraulic fracturing (Figure 1.2).

6
Figure 1.2 Grain size distribution of Hickory sandstone.
Source: Barnes and Schofield (1964)
Barnes and Schofield (1964), and Kyle and McBride (2014) present a sound case
for the potential of sand in the Llano uplift and there is significant empirical evidence in
terms of large mining facilities in the region that support the prospect. To advance research
in this area, this study explains the feasibility and assessment of new extraction facilities
being built in the Hickory sandstone unit of the Riley formation. The Hickory sandstone is
located in close proximity to several hydraulic fracturing sites in Texas. Therefore, the low
cost of transportation, as compared to competitors in other states, should allow the oil and
gas companies to favor the Hickory sandstone as a more cost effective source of sand.
Benson et al. (2015) lists the following three parameters as most important characteristics
of a sand deposit:
1. Good friability
2. Near surface access
0%
5%
10%
15%
20%
25%
30%
35%
< 80 60–80 40–60 20–40 > 20
Fre
quen
cy (
%)
Grain size (mesh number)
Frequency distribution of sand grain size

7
3. Proximity to transportation routes that serve petroleum basins
The sandstone in the Llano uplift was never buried below a depth 1,500 feet after
deposition and, therefore, remains friable (McBride et al., 2002). To assess the near surface
access of the sandstone, this study analyzes over 2,000 well logs in the region to create a
block model for the resource and map overburden and sandstone distribution in the region.
The resource characteristics are then combined with proximity to transportation facilities
to calculate most favorable sites for establishing new extraction facilities. The difference
in compressive strength of Hickory sand, as compared to other proppant material, keeps its
applicability limited up to certain strata pressure. Based on the quality of sand, US Silica
(2016) and Santrol (2016) claim the Hickory sand to be applicable in fracture closure stress
of 2,000–6,000 psi, Benson et al. (2015) claims applicability up to 4,000 psi, and
compressibility tests by Kullman (2011) and Economides (1992) show a sharp decrease in
conductivity at pressures greater than 6,000 psi. For the purpose of identifying suitable
hydraulic fracturing sites for Hickory sand, this study assumes a fracture closure stress
threshold of 6,000 psi. The favorable mining locations and regions with low fracture
closure stress are the two ends of a supply chain, the product and the market. A complex
network of highways and railroad infrastructure connects the two ends. The transportation
and handling cost can be as high as $56 per ton depending on the distance and means of
transportation, almost 31 – 46 percent of the final cost of $120 – $180 per ton for sand
(Sider, 2014). The transportation distance between the product and market identified in
this study is already much lower than some of other alternatives like Northern White sand
from Minnesota and Wisconsin, and analysis for the means or mode of transportation in

8
this study attempts to provide a holistic solution. An intermodal transportation network is
created with highways and railroad, and least cost routes are identified for several locations
in the Permian, Barnett, and Eagle Ford basins where strata pressure is found to be
sufficiently low for Texas’s sand.

9
Chapter 2. Geologic Setting
2.1 THE LLANO UPLIFT AND PRECAMBRIAN BASEMENT ROCKS
The Llano Uplift is currently a broad regional eroded depression, with the
Precambrian basement rocks forming the central exposure of the regional landform (Figure
2.1). Paleozoic sedimentary strata uncomformably overlie metamorphic rocks and granitic
intrusions as a thin marginal apron. Middle to Late Cambrian and Ordovician units are
covered locally by a veneer of Cretaceous carbonates extending away from the Llano Uplift
as the Edwards Plateau.
The Proterozoic core of the Llano Uplift consists of a complex series of mostly
metavolcanic and metasedimentary rocks dated at ~1.36 to 1.26 Ga (Helper, 2000; Mosher
et al., 2008). Sediments originating from older rhyolitic volcanic rocks and tuffaceous
sediments accumulated as a coastal plain and continental shelf to form the Valley Spring
sedimentary wedge. These were covered with dark, fine-grained muddy sediments of the
Packsaddle Formation. These rocks were trapped in a tectonic collision zone and are
polydeformed, contemporaneous with an intermediate- to high-pressure, upper amphibolite
to lower granulite facies regional metamorphism (Walker, 1992; Mosher, 1993; Reese,
1995; Roback, 1996; Carlson, 1998; Mosher, 1998; Reese et al., 2000), and have been
subdivided into lithotectonic domains based on lithology, field relations, geochemistry, and
U/Pb ages.

10
Figure 2.1 Major geologic units in the Llano uplift.

11
Late Mesoproterozoic granitic magmatism in Texas occurred between 1119 and
1070 Ma (Garrison et al., 1979; Walker, 1992) on both sides of the Grenville Front (Smith
et al., 1997). In the Llano Uplift, 1119–1070 Ma, syn- to post-tectonic granites intruded
the Grenville ~1360–1232 Ma metaigneous and metasedimentary rocks (Mosher, 1993,
1995, 1996, 1998).
Following the development of Proterozoic metamorphic and igneous rocks, uplift
and exhumation during an extensive period of erosion created the surface on which the
Late Cambrian sediments were deposited. Estimated depths of granite emplacement
require that 8–10 km of Precambrian cover were removed to bring the metamorphic and
igneous rocks to sea level prior to the deposition of the late Middle Cambrian sediments
(~515 Ma; Kyle and McBride, 2014). Crustal thickening did occur during the late
Precambrian as evidenced by a positive Bouger Gravity anomaly centered on the current
Llano Uplift. However, thicknesses of sedimentary rocks deposited on the eroded igneous
and metamorphic rocks during the Paleozoic (Barnes and Bell, 1977) show a variety of
patterns that do not provide clear evidence of the uplift having always been a positive
topographic feature, even relative to surrounding areas. The units deposited in the uplift
region throughout time have been shallow water facies. At no time since the Precambrian
have the rocks of the Llano Uplift been at depth of more than 1–2 km. One consistent
feature of the rocks deposited throughout the lower Paleozoic is that, where it is possible
to interpret a depositional setting, the rocks are shallow marine (ocean) to terrestrial (land)
in origin. Paleotopography appears to have been dictated by weathering of underlying
bedrock in an arid environment, with finer grained granite, quartzofeldspathic gneiss, and

12
marble supporting areas of higher relief, and schists, amphibolite and other less resistant
rocks underlying lower relief regions (Barnes and Bell, 1977). The thickness and facies of
the lowermost Cambrian strata were strongly controlled by the paleotopography, which
had as much as 200 m of relief. A few topographic highs persisted as islands until they
were buried by Late Cambrian sedimentation.
2.1.1 The Riley Formation and Hickory Sandstone
The lowermost Paleozoic sediments of the Llano Uplift comprise the three
members of the Middle to Late Cambrian Riley Formation (as part of the lower member of
the Moore Hollow Group; Barnes and Bell (1977); see Figure 2.2). The Hickory Formation
forms the base of the sequence and is a complex succession of terrestrial and transgressive
marine arkosic to quartz arenitic sandstone/siltstone, and can incorporate mudstone and
ironstone that is as much as 150 m thick. The Hickory Formation grades into Cap Mountain
Limestone, consisting of progradational intertidal, subtidal, and shallow-shelf
sandstones/siltstones and transgressive shallow-shelf and shoal carbonate packstones and
fossiliferous grainstones, with a total local thickness of 150 m. The Cap Mountain
Limestone grades into the regressive Lion Mountain Sandstone, composed of tidally
dominated, progradational, argillaceous, green glauconitic sand with trilobite coquina
lenses and beds, ranging from 6–23 m in thickness (Barnes and Bell, 1977; Krause, 1996).
The Hickory and the Cap Mountain strata are locally absent where the Lion Mountain rests
directly on Precambrian basement. The thickness and facies of the Hickory Sandstone
varies laterally and vertically in response to the paleotopography of the underlying

13
Precambrian surface. The Hickory reaches a thickness of 180 m along the western margin
of the Llano Uplift, but generally is less than 110 m thick. The basal Hickory facies is the
most variable, ranging from alluvial conglomerates and cross-bedded fluvial sandstones in
paleo-lows to marine-influenced fine-grained siliciclastic sediments resting directly on
granite highs (Krause, 1996). Sequence stratigraphic and lithofacies analysis (Krause,
1996) suggests that the Riley Formation is an unconformity-bounded, depositional
sequence representing perhaps as little as 4 million years (ca. 514–510 Ma) of deposition.
Figure 2.2 Hydraulic fracturing sand resource stratigraphy in the Llano Uplift are of
central Texas.
Source: Kyle and McBride (2014).

14
2.1.2 The Wilberns Formation and Post-Cambrian strata
The Riley Formation is overlain by transgressive and progradational shallow-water
marine sandstone, siltstone, limestone, and dolomite of the Wilberns Formation (see Figure
2.2). The Wilberns Formation consists of medium-grained marine sandstones of the Welge
Sandstone (3–9 m thick) grading upward into Morgan Creek Limestone. Morgan Creek
Limestone (38–44 m thick) consists of intertidal and shallow shelf oolitic, glauconitic and
stromatolitic limestone(s). Overlying Morgan Creek Limestone is Point Peak Member
(averages 52 m thick) comprised of terrigenous siltstone, silty and stromatolitic limestones,
and intraformational conglomerates. Point Peak Member grades into San Saba Member
(85–137 m thick), which is a laterally variable unit consisting largely of limestone and,
locally stromatolitic and glauconitic, dolostone (Barnes and Bell, 1977). The San Saba
Member is calcareous sandstone and sandy dolomite in the western Llano Uplift and is
time transgressive, containing an early Ordovician trilobite fauna (Barnes and Bell, 1977).
The boundary with overlying Ordovician Ellenburger Group carbonates is
commonly gradational. Post-Lower Ordovician, pre-Pennsylvanian strata are poorly
represented in the Llano Uplift, as the region appears to have been largely emergent during
this time, perhaps with short-lived, periodic marine incursions separated by longer
erosional events. Adams (1954) suggested that in the Ordovician there existed a continental
peninsula running north-northwest to south-southeast in central Texas ("the Texas
Peninsula"). Deeper water and thicker sediments occurred offshore from the peninsula.
However, the peninsula he suggested was not centered on an area in central Texas defined
by a gravity anomaly; the current Llano Uplift was on the east flank of the peninsula.

15
Erosion of the Ordovician Ellenburger Formation suggests tilting of the Llano area at this
time. Pennsylvanian strata (Marble Falls Limestone and Smithwick Formation) record a
return to marine conditions, with the establishment of deeper water depositional systems
for terrigeneous sediment derived from an easterly source. Kier (1980) describes the
Pennsylvanian Marble Falls Formation as being a carbonate bank centered on the current
area of the Llano Uplift. Sedimentation was in part synchronous with the development of
the northeast-trending fault system of the Llano Uplift and overlaps in time with the
development of the Ouachita fold-thrust belt, the subsurface extension of which lies to the
south and east. During the Ouachita Orogeny, which was most intense east and south of
the Llano Uplift, the uplift was cut by a series of northeast-trending faults with normal to
oblique slip. The large grabens of Paleozoic rocks which strongly influence the current
topography were formed during this time.
Barnes et al. (1972) estimated that some of these faults have displacements of as
much as 900 m. Rifting to initiate the formation of the Gulf of Mexico during the early
Mesozoic (Salvador, 1991) resulted in regional subsidence that created a broad shelf during
the early Cretaceous on which the extensive limestones of the Edwards Plateau were
deposited. The absence of Permian, Triassic, and Jurassic strata beneath the Cretaceous
strata records another extensive period of subaerial exposure and erosion. Erosion on the
uplifted northwest side of the Llano Uplift resulted in the removal of the thin veneer of
Cretaceous to Eocene strata (Corrigan et al., 1998), producing the present Llano Uplift
character. A reconstructed burial history indicates that the Hickory strata were never buried
more than 1500 feet (~1 km) around the flanks of the Llano Uplift (McBride et al., 2002).

16
By understanding the geologic of the central Texas strata, we are able to better
identify areas with more appropriate geology for sand resource development. Because most
of the sand resource formations are unconformably overlie Precambrian basement rock,
and overlain by younger strata, understanding the regional and local geology is a critical
first-step to identifying and predicting new resource locations with geospatial techniques.
2.2 PETROLEUM BASINS IN TEXAS
2.2.1 Fort Worth Basin
The Newark East field and other Barnett Shale plays are located in the northern
portion of the Fort Worth Basin, just north of the city of Fort Worth, and across the northern
and eastern half of the Bend-Arch-Fort Worth Basin Province (Figure 2.3). The basin was
formed during the Mississippian and Pennsylvanian periods of the Paleozoic Era. The basin
development is truncated on the eastern margin by the Ouachita Structural Front, to the
northeast by the Muenster Arch, to the north by the Red River Arch, to the west by the
Eastern (Chappel) Shelf, and to the south by the Concho Arch and Llano Uplift (Bowker,
2003).

17
Figure 2.3 Forth Worth basin geologic setting.
Source: Pollastro et al. (2003)
The Bend Arch (a northern extension of the Llano uplift) creates a north-south
bounding structure through the center of the province and pre-dates the Mississippian
period. The Barnett is entirely Mississippian and has been suggested to have been deposited
in a back-arc setting behind the Ouachita Structural Front (Bowker, 2003).
At Newark East, the Barnett Shale is divided into three informal members: the
lower Barnett, the Forestburg, and the upper Barnett. The lower Barnett averages 100 m
thick in Newark East field, and lies directly above a regional angular unconformity. In the
core area, the lower Barnett overlies the Simpson Group and Viola Limestone
(Ordovician). In the western portion of the basin the lower Barnett overlies the Ordovician

18
Ellenburger Group. The Forestburg limestone separates the lower and upper Barnett shale
members. The Forestburg is more than 70 m thick in the northern parts of the basin,
extending into central Wise and Denton counties, but rapidly thins to the south. The upper
Barnett averages 50 m thick throughout the basin and is overlain by the Marble Falls
Limestone (Mississippian). The top of the Barnett is 2200 m deep in the western portion
of the field and 2600 m deep in the northeastern portion.
The Barnett (the oil and gas producing black shale portion of the formation) is
composed of approximately 45% quartz (abundant siliceous micro-fossils), 27% clay
(predominantly illite, with minor amounts of smectite), 8% calcite and dolomite, 7%
feldspar, 5% organic matter, 5% pyrite, 3% siderite, and a trace of phosphatic minerals. At
the base of the Barnett, the concentration of phosphatic minerals (predominantly apatite)
and pyrite can each reach well over 10%. Toward the northern portion of the basin, the
organic-rich facies of the Barnett grades into a more calcareous compositions. The
calcareous compositions are detrital in nature and deposited in a series of fluvial deposits
sourced from the nearby Muester and Red River Arches (Bowker, 2003).
The productive portions of the Barnett have an average porosity of 6% and matrix
permeability less than 100nD (nanodarcies). The average pore conduit has a radius of less
than 0.005 micrometer. The organic-rich facies of the Barnett comprised approximately
20% total organic carbon (TOC) when it was deposited, and in the thermally-mature
portions of the basin the Barnett now averages 5% TOC.

19
The unique thermal history of the Barnett is one of the more important reasons for
the economic success of the play. The thermal history of the Fort Worth basin is directly
related to the emplacement of the Ouachita Structural Front. The depth of burial is
important in regard to the thermal maturity of the stratigraphic column within the basin;
but the proximity of the Ouachita Structural Front, and its influence on the heat flow in the
basin during the late Paleozoic allowed sections of the Barnett bordering the Ouachita
Structural Front to have the highest thermal maturity. The regions of the basin away from
the Ouachita Structural front are thermally less mature.
2.2.2 Permian Basin
The Permian Basin is a large scale oil and gas region in west Texas (Figure 2.4).
The basin can be divided into five primary regional reservoirs with distinctive tectonic and
depositional histories: (1) the Eastern Shelf, (2) the Midland Basin, (3) the Central Basin
Platform, (4) the Delaware Basin, and (5) the Northwest Shelf (Wright, 2016).
2.2.2.1 Eastern Shelf
Detailed studies were performed by Cleaves (1975, 1993, 2000) and Cleaves and
Erxleben (1982, 1985) on the siliciclastic depositional patterns of the Eastern Shelf. During
the Middle Pennsylvanian, siliciclastic sediments encroached fully only on the Eastern
Shelf (within the boundaries of the current Permian Basin). In the Eastern Shelf, these two
influx episodes are associated with Buck Creek and Dobbs Valley sandstones. In the
Middle Pennsylvanian, because no deltaic sediments prograded across the entire Eastern
Shelf, ramp and shelf-margin sediments are either carbonate or condensed marine shales.

20
Middle Pennsylvanian deltaic lobes contain conglomeratic channel fill at the top of
prograded sequences (Cleaves, 1993). Delta lobes appear to aggrade vertically at the delta
front and delta plain, and coarser material is deposited more proximally in the upper delta
and coastal plain.
Figure 2.4 Permian basin geologic units.
Source: Galley (1958)
Within King County, delta facies intermingle with the carbonate ramp and platform
(Boring, 1993). Two large regressive and transgressive cycles are present in this area of
the Knox-Baylor Trough. Tandy sandstones are in a basal cycle, and the Twin Peaks
sandstone is in an upper cycle. Middle Pennsylvanian-age limestones interlayer with and
transgress deltaic sediments; however, correlation is not sufficient to identify the carbonate

21
sequences (for example, Odom, Goen, or Anson). The basal sandstones are interpreted as
a distributary bar comprising crossbedded sandstones and lobate delta deposition. The
upper sandstone is thought to represent an offshore bar system (Boring, 1993). Most of this
succession was previously interpreted as being deposited in deep-water conditions (Gunn,
1979). It appears that this succession is predominantly shallow water deltaic in origin
(Wright, 2016).
The facies present in the delta system at Taylor County comprise prodelta black
shales; delta-front, bar-slope, burrowed, and intercalated carbonaceous sandstones with
silty claystones; delta-front, bar-crest, laminated sandstones; delta-front, cross-bedded
coarse sandstones; delta-plain, carbonaceous shales; and shallow marine sandstones. The
Gray Sandstone is the basal siliciclastic interval in a series that includes Gardner and
Jennings intervals and is stratigraphically between the basal Caddo limestone and the upper
Goen limestone. The overall upward-shallowing succession from prodelta shales to
channels mimics the succession studied by Cleaves (1993) for the Eastern Shelf.
2.2.2.2 Midland basin, Central basin platform, and Delaware basins
Siliciclastic deposition in Midland and Delaware Basins appears largely restricted
to basin-center shales. In general, it appears that basin subsidence in both Midland and
Delaware Basins was minimal during the early Middle Pennsylvanian and increased
dramatically in the late Middle Pennsylvanian. Therefore, regional distribution of the
shales is greater in the late Middle Pennsylvanian relative to the early Middle
Pennsylvanian.

22
Interpretation of Middle Pennsylvanian sedimentation patterns in the Midland and
Deleware Basins historically relied heavily on structural interpretation of the Central Basin
Platform. According to seismic and wireline-log correlations, it appears that the entire
Central Basin Platform was transgressed and covered by carbonate sediments by the early
Middle Pennsylvanian. Regional reconstructions by Tai and Dorobeck (1999, 2000) show
no influence by the Central Basin Platform on Middle Pennsylvanian sedimentation
patterns in the Midland, Delaware, or Val Verde Basin. Middle Pennsylvanian-age
sediments are relatively uniform in thickness and have a consistent geographic distribution
across the Delaware and Midland Basins (Van der Loop, 1990; Yang and Dorobek, 1995).
Most sedimentation patterns appeared largely unaffected by uplift. A pre-Middle
Pennsylvanian unconformity does exist, which results in the erosion of variable amounts
of the stratigraphic section in parts of the Val Verde Basin. Post-Middle Pennsylvanian
differential uplift of blocks within the Central Basin Platform resulted in erosion from
Upper Pennsylvanian units down to the Precambrian basement. Middle Pennsylvanian
sediments (dominanted by carbonates) were pervasive across much of what would become
the Central Basin Platform during the Late Pennsylvanian, when major uplift occurred.
Middle Pennsylvanian siliciclastic deposition in and around the Permian Basin is
even more aerially restricted than in the Early Pennsylvanian. Middle Pennsylvanian
siliciclastic deposition is reciprocal with carbonate sedimentation and is largely restricted
to the northern Eastern Shelf. A transgression appears to have dominated throughout the
rest of the Middle Pennsylvanian; however high-amplitude, sea-level fluctuations occurred
at a high frequency. The result was an almost interlayered carbonate and siliciclastic

23
stacking pattern. Deltaic sediments continued their westward progradation from the Fort
Worth Basin farther onto the Eastern Shelf. This progradation initiated in the Early
Pennsylvanian and was governed largely by convergence of the Ouachita Structural Front
to the east of the Fort Worth Basin. During the early Middle Pennsylvanian, because
subsidence in the Midland Basin, Forth Worth Basin, and Eastern Shelf was minimal,
siliciclastic progradation advanced to its most westward point. During the mid- to late
Middle Pennsylvanian, uplift and compression of the Ouachita diminished, and subsidence
of the Midland Basin accelerated. These two factors, coupled with a rising sea level,
resulted in eastward backstepping of the clastic to carbonate transition zone and a
geographical fixing of the carbonate shelf. In the Permian Basin, distal parts of the deltaic
systems are the most common (Wright, 2016). Coarser grained alluvial delta feeder
systems are generally farther east.
Carbonate rocks of Middle Pennsylvanian age in the Permian Basin have been
studied extensively in the Midland and Delaware Basins and the Northwest and Eastern
Shelves. The carbonate formations of the Eastern Shelf, including the Caddo (Middle
Pennsylvanian interval), Branson Bridge, Odom, Goen, Anson, Capps, and Village Bend,
span the same time interval as the carbonate Strawn Formation in Midland, Delaware, and
Val Verde Basins. The carbonate depositional environment during the Middle
Pennsylvanian was varied in geographic distribution and style (e.g. ramps, patch reefs,
shelf-margins, rimmed shelves). Early Middle Pennsylvanian-age carbonates were
deposited almost ubiquitously across the Permian Basin in predominantly carbonate ramp
style settings. In the middle to late Middle Pennsylvanian, regional subsidence patterns

24
changed, and the Midland, Delaware, and parts of the Val Verde Basins began to subside
rapidly (Wright, 2016). Along the margin of these basins, carbonates aggraded almost
vertically in response to increased accommodation. The carbonate margins became more
steep sided in geometry and a shelf margin formed, becoming geographically permanent.
Thick accumulations of shallow-water facies, including phylloid algal mounds and
grainstones, continued to develop, and most of the thicker Middle Pennsylvanian sections
alloed for Late Pennsylvanian carbonate growth. High-amplitude and high-frequency sea-
level falls exposed the Middle Pennsylvanian carbonates throughout the basins.
2.2.3 Eagle Ford basin
Several tectonic and structural events have affected the depositional environment
of the Eagle ford Oil and Gas formation. The extension of the Gulf of Mexico and rotation
of the Yucatan block caused grabens to form during Triassic time in what is now Maverick
County (Ewing, 2003; Scott, 2004; Cardneaux, 2012). Salt, that now forms salt dome
structures in the Texas gulf coast area, was deposited in the Late Triassic and Jurassic time
(Salvador, 1991). In South Texas, the Ouachita basement provided a stable basement for
coastal reef margins and carbonate platforms to develop (Goldhammer and Johnson, 2001).
Southern movement of the Laramide Uplift filled the Cretaceous foreland basin and caused
sediment to be deposited into intrashelf deposition basins (e.g. the Maverick Basin;
Galloway, 2008). During the Cretaceous, Precambrian highs, such as the Llano Uplift in
central Texas and the Coahuila Block in northeast Mexico were the source of clastic
sediment into the Maverick Basin (Goldhammer and Johnson, 2001). The southeast-

25
northwest trending San Marcos Arch formed an extension of the Llano Uplift, separating
the Maverick Basin and the East Texas Basin (Loucks, 1976). Laramide compression
inverted the local Triassic graben and formed the Chittim Arch in the western portion of
the Maverick Basin (Ewing, 2003). The resulting uplift may have caused 1-2 km of erosion
(Ewing, 2003).
Figure 2.5 Eagle Ford basin geologic setting.
Source: Donovan and Straeker (2010)
The Eagle Ford Formation was deposited during the Late Cretaceous in South
Texas, unconformably below the Austin Chalk Formation and above the Buda Formation.
The upper Eagle Ford is interpreted to prograde deposition within a highstand system and
the lower Eagle Ford is interpreted to represent retrograde deposition within a transgressive

26
systems (Donovan and Staerker, 2010). Since the Eagle Ford is transgressive, the formation
is older near the coastal reef shelf margin and younger towards the north (Adams and Carr,
2010). Some workers interpret the Eagle Ford as a continuous transgressive systems tract
(Adams and Carr, 2010; Dawson and Almon, 2010), and others interpret alternating
transgressive/regressive sequences (Donovan and Staerker, 2010; Harbor, 2011; Lock
et.al., 2010). Eagle Ford units thin from the Maverick Basin to the San Marcos Arch in the
subsurface (Hentz and Ruppel, 2010).
The upper Eagle Ford consists of interbedded dark and light gray calcareous
mudrock, while the lower Eagle Ford unit consists of mostly dark gray mudrock (Hentz
and Ruppel, 2010). Regional lithofacies patterns and fossil content indicate a marginal to
open marine depositional setting for the Eagle Ford Formation (Dawson and Almon, 2010).
Eagle Ford strata show a mixed siliciclastic-bioclastic sediment that accumulated on a
relatively shallow shelf to the northwest and in deeper settings to the south and southwest
(Dawson and Almon, 2010).
There have been several different subdivisions of the Eagle Ford Formation that
suggest that the traditional upper Eagle Ford be subdivided with the upper portion classified
as the Langtry Formation and the lower portion being the upper Eagle Ford. A maximum
flooding surface separates the upper and lower Eagle Ford and five vertical successions of
facies described in Donovan and Staerker (2010) are: Facies (1), cross-laminated
limestones interbedded with thin calcareous mudstones; Facies (2), organic-rich calcareous
mudstones with scattered limestone interbeds; Facies (3), thick-bedded limestones with
calcareous mudstone interbeds; Facies (4), echinoid-bearing marls and nodular limestones;

27
Facies (5), thin-bedded limestones with calcareous mudstone interbeds. Lock et al. (2010)
suggested the Eagle Ford formation be divided into three members: upper, middle, and
lower. The lower member consisting of unstable slope strata: debris flows, slump folds,
and turbidites; the middle member containing mostly organic rich limestone and marlstone;
and the upper member consisting of thick limestone beds near the base with abundant
echinoids throughout. Hentz and Ruppel (2010) interpret the upper Eagle Ford unit to
terminate in the subsurface over the San Marcos Arch from the Maverick Basin. Over the
San Marcos Arch, the lower Eagle Ford is mostly dark gray mudrock, and thins from the
Maverick Basin. Northeast of the San Marcos Arch in the East Texas Basin, two facies
develop that are not present in the Maverick Basin, the Woodbine Group and the Maness
Shale. The Woodbine Group is a siliclastic succession that occurs below the Eagle Ford,
and the Maness Shale is a mudrock interval that occurs above the Buda Formation and
below the Woodbine Group (Hentz and Ruppel, 2010). In the East Texas Basin, the Eagle
Ford has sandstone in the uppermost part, where the Buda, Maness, and Woodbine truncate
over the Sabine uplift (Hentz and Ruppel, 2010).
Harbor (2011) recognized nine facies within the Eagle Ford. Facies 1 is a massive
argillaceous mudrock, and occurs as a relatively thick succession in the basal lower Eagle
Ford. Facies 2 is a laminated calcareous foraminiferal mudrock averaging 54% carbonate
and the most abundant facies within the Eagle Ford. Facies 3 is a laminated fossiliferous
wackestone/packstone averaging 55% carbonate and is located stratigraphically above
Facies 1. Facies 4 is a laminated foraminiferal and peloidal packstone located in both the
upper and lower Eagle Ford. Facies 5 is a massive to bioturbated kaolinitic claystone,

28
mostly in the upper and lower Eagle Ford, with an average clay content of 91% derived
from diagenetically altered volcanic ash interstratified with laminated calcareous
foraminiferal mudrocks. Facies 6 is a laminated wackestone averaging 66% carbonate.
Facies 7 is a disrupted bedded foraminiferal packstone averaging 59% carbonate, with
abundant slump/folding structures. Facies 8 is a massive inoceramid packstone) averaging
70% carbonate, and contains streaks of organic matter near skeletal grains. Facies 9 is a
bioturbated wackestone averaging 90% carbonate, and is abundant in the Maverick Basin
within the upper Eagle Ford near the Austin Chalk boundary.

29
Chapter 3. Methodology
Understanding the geologic setting discussed in Chapter 2 is essential to filter out
prospective region in the Llano uplift for new extraction facilities and prospective regions
in petroleum basins where the extracted sand can be used. This chapter explains the
methodology used for calculating total sandstone resource volume, identifying favorable
extraction sites, identifying oil and gas extraction regions with sufficiently low strata
pressure, and solving for least cost routes for transportation (Figure 3.1 illustrates the
process flow).
The structure of this chapter is as follows. Section 3.1 explains the process of
sandstone and overburden volume calculation. Methods of spatial interpolations and depth
constraints used are covered in this section. The section uses ground water level and
Submitted Driller Report (SDR) databases of Texas Water Development Board (TWDB).
Section 3.2 explains the process for mapping favorability for extraction facilities. Variables
like proximity to transportation facilities, resource thickness, and waste thickness are used
in this section. Section 3.3 covers aspects of selecting well sites, where Texas sand may be
applicable given its lower compressibility strength compared to few other sources (Benson
et al., 2015). This section analyzes the pressure gradient and perforations depths for several
locations in the Permian, Barnett and Eagle Ford basin to calculate strata pressure. Finally
section 3.4 explains the process of analyzing low cost combinations of highways and

30
railroad transportation routes between potential new sand extraction facilities and suitable
well sites.
Figure 3.1 Methodology process flowchart.

31
3.1 VOLUME CALCULATION: NATURAL NEIGHBOR INTERPOLATION
3.1.1 Data
The volume calculation process uses two fundamental data sets: (1) The Submitted
Drillers Report (SDR) database maintained by the Texas Water Development Board
(TWDB), containing reports compiled by registered water well drillers since 2001, and (2)
Ground water level database of Texas Water Development Board (TWDB), containing
information of ground water table depth. Figure 3.2 shows an example of one well in the
SDR database. Each well log has depth and thickness of subsurface rock layers. A complete
database of about 2,000 such water wells is used in this analysis. Figure 3.3 illustrates the
locations of these wells spread over the area under study. The region shaded in blue
represents rock units of Cambrian and Ordovician age and yellow points represent well
locations. Using spatial interpolation, a continuous model of sand thickness in the
Cambrian and Ordovician units is constructed to calculate the volume and thickness of
sand resource. After creating the block model for the complete resource, a restriction on
the lower boundary of the resource is introduced. The restriction is to limit the resource
only until the ground water level as mining below ground water level attracts higher
regulation and cost. The ground water level data defines a depth constraint for sand
resource.

32
Figure 3.2 Data sample from TWDB submitted driller’s report.
Source: Texas Commission on Environmental Quality (TCEQ)

33
Figure 3.3 Locations of water wells in TWDB submitted driller’s report.

34
3.1.2 Calculation
After extracting stratigraphic information (depth and thickness of all types of strata)
from all 2,000 wells in the SDR database, it is possible to create a database with three
important attributes at 2,000 locations: (1) surface elevation relative to sea level, (2) surface
elevation of sandstone layer’s upper boundary, and (3) sandstone layer’s lower boundary.
Very shallow wells (< 20–50 feet), and wells with missing or incorrect data are removed
from the database. Finally, 1819 wells are used for resource calculation. Sutphin and
Goldsmith (2002), and Loen (2002) present examples of using similar methodology for
assessing sand and gravel deposits. The process assumes continuity of sandstone between
water wells, and natural neighborhood interpolation is used to calculate three continuous
rasters, one for each of the attribute, i.e. surface elevation, resource’s upper boundary and
resource’s lower boundary.

35
Figure 3.4a Voronoi tessellation for original 5 points with known variable.
Figure 3.4b Voronoi tessellation after adding 6th point with unknown variable.

36
Natural neighbor interpolation, first developed by Sibson (1981) is based on
Voronoi tessellation. Other commonly used methods for spatial interpolation are Kriging
and Inverse Distance Weighted (IDW) method. The choice of methodology in this study is
based on the nature of data, which is irregularly spaced throughout the region under study
(see Figure 3.3). Natural neighbor interpolation works equally well with regularly and
irregularly spaced data (Watson, 1992) is therefore used here. The method uses Voronoi
Tessellation or Voronoi partition for a set of selected points which can be constructed by
drawing perpendicular bisectors of lines joining adjacent points in space to create polygons,
called Voronoi cells around every point such that no two polygons overlap. Figure 3.4a
shows a simple example of such a partition with a set of 5 points. For a corollary to this
study assume that the five points are five water wells locations. For constructing a
continuous raster for surface elevation, the five points in Figure 3.4a represent the value of
surface elevation at respective locations. To predict the same variable at another point,
point 6 for example, which lies somewhere around the other five points, the Voronoi cells
in Figure 3.4a change due to the introduction of the sixth cell. Figure 3.4b illustrates the
new Voronoi tessellation with six points. To predict the unknown variable at a location in
any Voronoi tessellation, only neighbors with known values influence the computation.
Two points are considered to be neighbors if their Voronoi cells share a boundary, i.e.
points 1 and 6 are neighbors, and points 1 and 3 are not neighbors. Natural neighbor uses
the following equation to predict variables at unknown locations.

37
𝐺(𝑥, 𝑦) = ∑ 𝑤𝑖𝑓(𝑥𝑖 , 𝑦𝑖)
𝑛
𝑖=1
… 𝑒𝑞𝑢𝑎𝑡𝑖𝑜𝑛 (3.1)
Here 𝐺(𝑥, 𝑦) is the predicted value at a point with 𝑛 neighbors and coordinates
(x, y), each with known value 𝑓(𝑥𝑖, 𝑦𝑖), location (xi, yi) and weight, 𝑤𝑖. For calculating
weight for value of every neighbor, natural neighbor uses the Voronoi cells described
above according to the following equation:
𝑤𝑖 =𝐴𝑟𝑒𝑎 𝑜𝑓 𝑖𝑡ℎ 𝑉𝑜𝑟𝑜𝑛𝑜𝑖 𝑐𝑒𝑙𝑙 𝑖𝑛𝑠𝑖𝑑𝑒 𝑡ℎ𝑒 𝑛𝑒𝑤 𝑉𝑜𝑟𝑜𝑛𝑜𝑖 𝑐𝑒𝑙𝑙
𝐴𝑟𝑒𝑎 𝑜𝑓 𝑛𝑒𝑤 𝑉𝑜𝑟𝑜𝑛𝑜𝑖 𝑐𝑒𝑙𝑙 … 𝑒𝑞𝑢𝑎𝑡𝑖𝑜𝑛 (3.2)
For the example exhibited in Figure 3.4a and Figure 3.4b, the variable 𝑧6 will be
defined as following:
𝑧6 = ∑ 𝑤𝑖𝑧𝑖
5
𝑖=1
… 𝑒𝑞𝑢𝑎𝑡𝑖𝑜𝑛 (3.3)
𝑧𝑖 for 𝑖 = 1 to 5 is known and 𝑤𝑖 will be assigned according to following
equation 3.4.:
𝑤i =Area stolen by the new cell from original i𝑡ℎ cell
Total area of the new Vornoi cell … 𝑒𝑞𝑢𝑎𝑡𝑖𝑜𝑛 (3.4)
For example, in the case of 𝑤1, i.e. the weight of point in predicting the value for
point 6, the numerator will be the area of polygon “agfe”, and the denominator will be arhe
ea of polygon “aedcb”. Using natural neighborhood interpolation, three rasters are
constructed: (1) surface elevation raster (Rsurface), (2) elevation of sandstone layer’s upper
boundary (R’upper), and (3) sandstone layer’s lower boundary (R’lower). Before calculating
38
sandstone and overburden thickness, a restriction on the lower boundary to be limited to
the ground water level is applied. Another raster Rground water is constructed using natural
neighbor interpolation, and equation 3.5 is used to define the new raster for a sandstone
layer’s lower boundary. At points where groundwater level is below the lower boundary
sandstone layer, the original value of lower boundary is used, and at a point where ground
water level is above lower boundary, the ground water level will serve as proxy for the
lower boundary. Equation 3.5 represents the relation with a maximum function.
𝑅𝑙𝑜𝑤𝑒𝑟 = max(𝑅′𝑙𝑜𝑤𝑒𝑟 , 𝑅𝑔𝑟𝑜𝑢𝑛𝑑 𝑤𝑎𝑡𝑒𝑟) … 𝑒𝑞𝑢𝑎𝑡𝑖𝑜𝑛 (3.5)
Rlower is the new lower boundary of the sandstone layer. Points where the ground
water level is above even the upper boundary of the sandstone, equations 3.5 alone will
result in lower boundary elevation above the upper boundary elevation. As this would
produce absurd results in the later calculations, another maximum function between a
sandstone layer’s upper and new lower boundaries is used.
𝑅𝑢𝑝𝑝𝑒𝑟 = max(𝑅𝑙𝑜𝑤𝑒𝑟, 𝑅′𝑢𝑝𝑝𝑒𝑟) … 𝑒𝑞𝑢𝑎𝑡𝑖𝑜𝑛 (3.6)
Rupper is the new upper boundary of a sandstone layer. Rupper and Rlower will
henceforth be referred to upper and lower boundary of a sandstone layer, respectively.
Volume can be calculated as product of two variables: (1) thickness, and (2) area.
Continuous rasters Rupper, Rlower, and Rsurface are used to calculate thickness of sandstone at
every point. Thickness of sandstone at any point is simply the difference between relative
elevation levels of a sandstone’s upper boundary and lower boundary. Similarly,
overburden thickness is the difference between elevation levels of surface and upper

39
boundary of sandstone layer. The following equations represent this relation where RST is
the raster that hold thickness of sandstone and ROB represents the thickness of overburden.
𝑅𝑆𝑇 = 𝑅𝑢𝑝𝑝𝑒𝑟 − 𝑅𝑙𝑜𝑤𝑒𝑟 … 𝑒𝑞𝑢𝑎𝑡𝑖𝑜𝑛(3.7)
𝑅𝑂𝐵 = 𝑅𝑠𝑢𝑟𝑓𝑎𝑐𝑒 − 𝑅𝑢𝑝𝑝𝑒𝑟 … 𝑒𝑞𝑢𝑎𝑡𝑖𝑜𝑛(3.8)
For area, the whole area under study is divided in fish nets with pixel sizes of 100
sq. meters. Pixel sizes are slightly smaller near the boundary, where regular squares could
not be created. Each pixel is also assigned a value for average thickness, which the average
of all thickness values at points within that pixel, obtained from equation 3.7 and equation
3.8. The approximation may introduce small errors in volume calculation, but the sand
deposit is relatively flat in this case and does not have high variations within 100 sq. meters
extent. Therefore, each pixel, has three attributes: (1) area, (2) average sandstone thickness,
and (3) average overburden thickness. Product of area and thickness is the volume of
sandstone and overburden, respectively. The following equations, where VST is the volume
of sandstone and VOB is the volume of overburden, represent the relation.
𝑉𝑆𝑇 = �̅�𝑆𝑇 × 𝐴 … 𝑒𝑞𝑢𝑎𝑡𝑖𝑜𝑛(3.9)
𝑉𝑂𝐵 = �̅�𝑂𝐵 × 𝐴 … 𝑒𝑞𝑢𝑎𝑡𝑖𝑜𝑛(3.10)
Here �̅�ST and �̅�OB are average sandstone and overburden thickness, respectively,
and A is the area of respective pixel. Total volume of sandstone and overburden is simply
a summation of respective values for all N pixels. The relation can be represented with the
following two equations, where variables have the same meaning as above.

40
𝑇𝑜𝑡𝑎𝑙 𝑉𝑆𝑇 = ∑ 𝑉𝑆𝑇𝑖 … 𝑒𝑞𝑢𝑎𝑡𝑖𝑜𝑛(3.11)
𝑁
𝑖=1
𝑇𝑜𝑡𝑎𝑙 𝑉𝑂𝐵 = ∑ 𝑉𝑂𝐵𝑖 … 𝑒𝑞𝑢𝑎𝑡𝑖𝑜𝑛(3.12)
𝑁
𝑖=1
At the end of this step, a pixelated polygon file (P’volume) with each pixel assigned
an attribute for sandstone thickness, overburden thickness, sandstone volume and
overburden volume is constructed. The following two rasters which will be used in next
steps:
1. Thickness of sandstone (RTST)1 (see Figure 3.5)
2. Thickness of overburden (RTOB)2 (see Figure 3.6)
1 Raster with thickness values RST from equation 3.7
2 Raster with thickness values ROB from equation 3.8

41
Figure 3.5 Sandstone thickness (feet).
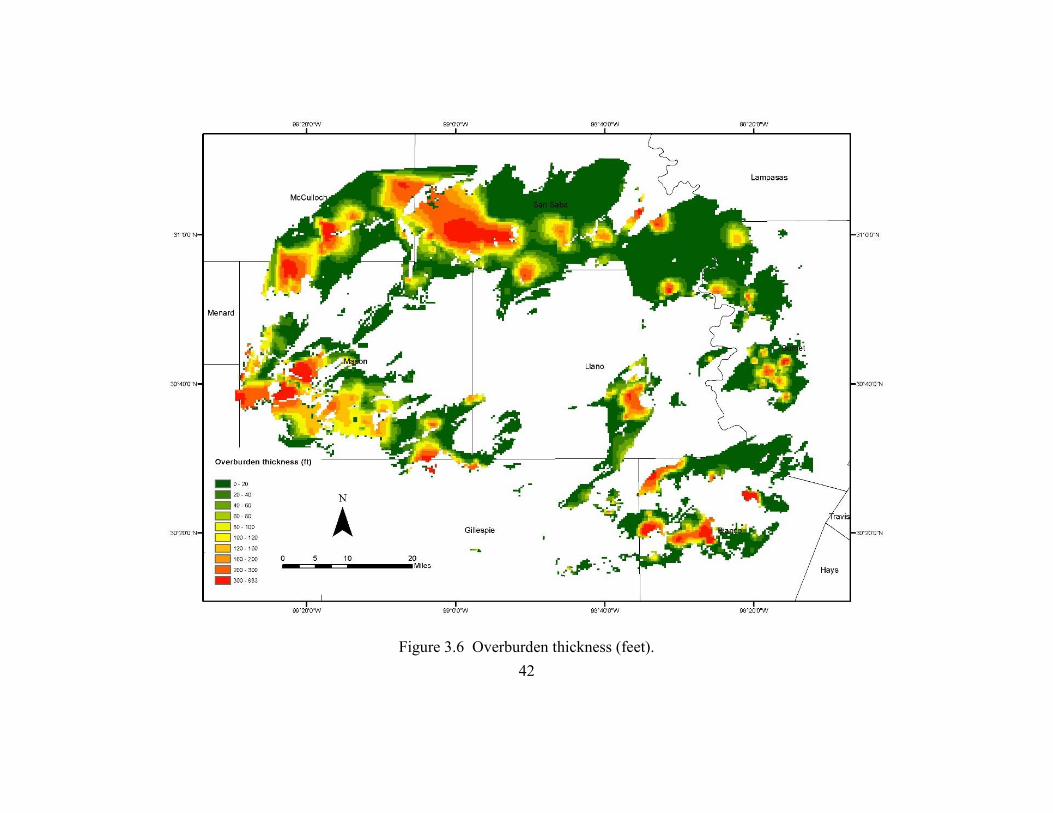
42
Figure 3.6 Overburden thickness (feet).

43
3.2 FAVORABILITY ASSESSMENT: FUZZY LOGIC ANALYSIS
The total resource volume calculated in the last section expands over an area of
more than 922,000 acres and the following analysis is useful to pinpoint locations within
this area which will be most suitable for establishing extraction facilities. To calculate
favorability, high friability, near surface access and proximity to transportation facilities
are important features (Benson, 2015). This chapter assesses the near surface access and
proximity to transportation facilities by calculating Sandstone thickness, overburden
thickness, proximity to highways, and proximity to railways. Fuzzy logic is used to
combine the four variables into a single metric of favorability. The choice of variables is
based on the location of current quarries. Chapter 4 will present a comparison of calculated
favorability and actual location of current quarries to further validate the explanatory nature
of the variables. Also in this step, areas restricted for mining, like buffer areas around water
bodies, and cities, will be removed.
3.2.1 Data
Fuzzy logic analysis (explained later in this section) will require a set of fuzzy
members, each of which defines the quality of membership on a scale of 0 to 1, with 1
being the full membership and 0 as no membership. Fuzzy members (maps) for spatial
analysis used in the study, are essentially rasters with values scaled from 0 to 1. The
following four rasters corresponding to the respective quality measure are used.
1. Thickness of sandstone (FTST)

44
2. Thickness of overburden (FTOB)
3. Proximity to highways (FPH)
4. Proximity to railways (FPR)
Fuzzy maps (1) and (2) correspond to values of rasters calculated in the previous
step (RTST and RTOB) scaled from 0 to 1. Table 3.1 defines the scale used in this analysis.
It is important to note that the value of respective rasters increases with increasing thickness
of sandstone and decreases with increasing thickness of overburden. This is because
overburden is essentially waste rock, and keeping sandstone thickness and all other
variables constant, higher quantity of overburden leads to higher of extraction.

45
Table 3.1 Fuzzy membership for sandstone and overburden.
Class Fuzzy membership
FTST, FTOB
Sandstone
Thickness (feet)
Overburden
Thickness(feet)
1 0.0 0 > 300
2 0.1 0 – 10 200 – 300
3 0.2 10 – 20 160 – 200
4 0.3 20 – 30 120 – 160
5 0.4 30 – 40 100 – 120
6 0.5 40 – 50 80 – 100
7 0.6 50 – 60 60 – 80
8 0.7 60 – 70 40 – 60
9 0.8 70 – 80 20 – 40
10 0.9 80 – 90 0 – 20
11 1.0 >90 0
Values of fuzzy maps (3) and (4) are obtained by a multi-ring buffer analysis. For
analyzing proximity to highways, the study uses only state highways, as other roadways
like county roads often have restricted access to truck traffic that originates from quarry
sites. The data base used is Texas transportation data provided by Texas Department of
Transportation (TxDOT). A multi-ring buffer analysis categorizes the area under study

46
according to distance from highways. A similar multi-ring buffer analysis for railways is
carried out to calculate proximity to railroads. Figure 3.7 shows the multi-ring buffer
analysis with respect to highways, and Figure 3.8 shows the multi-ring buffer with respect
to railways.

47
Figure 3.7 Proximity to highways, multi-buffer analysis.

48
Figure 3.8 Proximity to railroad, multi-buffer analysis

49
The two rasters, one each for highways (FPH) and railways (FPR), are scaled from
0 to 1, with 1 being for areas closest to the respective transportation facility. Table 3.2 lists
the categories and respective scaled value for both rasters.
Table 3.2 Fuzzy membership for proximity to highways and railway.
Class Fuzzy membership
FPH, FPR
Distance from
highway
(Kilometers)
Distance from
railroad
(Kilometers)
1 1.0 1 1
2 0.9 2 2
3 0.8 3 3
4 0.7 4 4
5 0.6 5 5
6 0.5 6 6
7 0.4 7 7
8 0.3 8 8
9 0.2 9 9
10 0.1 10 10
11 0.0 > 10 > 10

50
3.2.2 Calculation
Fuzzy logic model is based on the fuzzy-set theory, first developed by Zadeh
(1965). In fuzzy-set theory, explanatory members are defined on a continuous scale from
0 (full non-membership) to 1 (full membership), instead of defining true of false. To
calculate favorability for extraction sites, sandstone thickness, overburden thickness,
proximity to rail and highways, are the four members that define the prospect for extraction
facilities. Fuzzy-set of A is a set of ordered pairs defined as:
𝜇(𝑥) = {[𝑥, 𝜇𝐴(𝑥)]|𝑥 ∈ 𝑋} … equation(3.13)
Where 𝜇(𝑥) is the fuzzy membership of all objects in collection 𝑿, defined by fuzzy
membership function 𝜇𝐴. Fuzzy membership functions must lie in the range (0, 1), but
there is no other constraint on the membership function (Bonham-Carter, 2014).
Table 3.3 Description of Fuzzy operators. Source: Bonham-Carter (2014)
Operator Equation
Fuzzy Product 𝜇𝐶𝑜𝑚𝑏𝑖𝑛𝑎𝑡𝑖𝑜𝑛 = ∏ 𝜇𝑖
𝑛
𝑖=1
Fuzzy OR 𝜇𝐶𝑜𝑚𝑏𝑖𝑛𝑎𝑡𝑖𝑜𝑛 = 𝑀𝑎𝑥(𝜇𝑎𝜇𝑏𝜇𝑐, … )
Fuzzy Algebraic Sum 𝜇𝐶𝑜𝑚𝑏𝑖𝑛𝑎𝑡𝑖𝑜𝑛 = 1 − ∏ (1 − 𝜇𝑖)
𝑛
𝑖=1
Fuzzy GAMMA 𝜇𝐶𝑜𝑚𝑏𝑖𝑛𝑎𝑡𝑖𝑜𝑛 = (∏ 𝜇𝑖
𝑛
𝑖=1)1−𝛾(1 − ∏ (1 − 𝜇𝑖)
𝑛
𝑖=1
𝛾
)

51
Examples of previous application of fuzzy logic for other minerals can be found
Venkataraman et al. (2000), Carranza and Hale (2001), Porwal et al. (2003), De Quadros
et al. (2006), Ford et al. (2015), and McKay and Harris (2015). Table 3.1 and Table 3.2 list
the fuzzy memberships of the four maps used in this study. Several operators can be used
to combine these maps, depending on the desired result and quality represented by each of
the map. Table 3.3 lists the operators used in this study, along with the formulaic
representation of each. Fuzzy OR is a maximum function; it generates the maximum value
from its inputs. For example, if one of the maps has a membership value of 0.4 and another
has the membership value of 0.8, a fuzzy OR operation between the two will result in
membership of 0.8 for the combination map. In context of this study, if one of the features
has more favorable membership, the overall favorability depends on that. The relation
between highways and railroads can be bound by such a relation. Both serve the purpose
of transportation, and presence of either of the two suffices the need. If a particular site has
close proximity to one or has high membership of one, the site should simply assume the
value of the higher membership. Therefore, fuzzy OR is used between memberships of
highways (FPH) and railroads (FPR) to create a new raster to represent proximity to any
transportation facility in general; it will be represented as (FPTr). Equation 3.14 represents
the relation. Figure 3.9 shows the combination map after fuzzy OR operation i.e., FPTr.
𝐹𝑃𝑇𝑟 = max (𝐹𝑃𝐻 , 𝐹𝑃𝑅) … 𝑒𝑞𝑢𝑎𝑡𝑖𝑜𝑛(3.14)

52
Figure 3.9 Fuzzy OR combination of proximity to highway or railroad

53
It is worth noticing that the combination fuzzy maps, like FPTr and others that are
calculated later in this section, are automatically within the range 0 to 1 by virtue of the
operator formulas. For example, in equation 3.14 both inputs are in range 0 to 1, therefore,
their maximum will also be within that range. This becomes clear in other operators as
well. Fuzzy algebraic product is another operator used in this study. The combination fuzzy
map after this operation assumes the membership equal to the product of membership
values of its inputs. Unlike fuzzy OR, fuzzy product operator uses the membership of all
inputs, instead of using just that of the one which is maximum. For example, fuzzy product
between two inputs, each equal to 0.5, will be equal to 0.25 (0.5 × 0.5 = 0.25). For a high
membership of resulting map, both inputs must have high memberships. Two such
attributes for the resource at hand are: (1) thickness of sandstone, and (2) thickness of
overburden. An ideal site should have both high sandstone thickness and low overburden
thickness (see Figure 3.10). Therefore, fuzzy algebraic product is used between fuzzy map
of sandstone thickness (FTST) and overburden thickness (FTOB), to create a new map to
represent resource characteristics, (FTR). Equation 3.15 represents the relation between the
two maps.
𝐹𝑇𝑅 = 𝐹𝑇𝑆𝑇 × 𝐹𝑇𝑂𝐵 … 𝑒𝑞𝑢𝑎𝑡𝑖𝑜𝑛(3.15)
At this stage, four maps are combined to form the following two maps, and further
combination between the two will result in the favorability map:
1. Transportation fuzzy map (FPTR)
2. Resource fuzzy map (FTR)

54
3.
Figure 3.10 Fuzzy product combination of sandstone and overburden thickness.

55
It is important to note that in the resource fuzzy map, if either of the inputs have
membership equal to zero, the resource map will also have zero membership. It can be
observed from inputs in Tables 3.1 and 3.3 that all regions with sandstone thickness equal
to zero or overburden thickness greater than 300 feet, or both, will have zero membership
in the resulting resource fuzzy map. Areas with no sandstone resource or very high
overburden are not favorable even if they are close to a transportation facility. Weighing
in both variables to calculate combination favorability is a property of fuzzy algebraic
product and it is desirable to carry this forward to the favorability map as well. But, another
situation which must be recognized in creating the favorability map is that the presence of
both good resource and proximity to transportation facility is more favorable than having
only one of these. An “increasing” operator that captures the relationship is fuzzy algebraic
sum (see Table 3.3). To combine the features of both fuzzy algebraic product and fuzzy
algebraic sum, fuzzy GAMMA (see Table 3.3) is used to create the favorability map.
Bonham-Carter (2014) notes that the value of GAMMA is important to reflect the property
of the operator. Figure 3.12 shows change in value for combination map with change in
the value of GAMMA. A high value of GAMMA gives more weight to the fuzzy algebraic
sum part of the equation. A value of 0.8 for GAMMA is used in this study. Equation 3.16
represents the relation between resource fuzzy map and transportation map to create the
favorability map, FFavorability. Figure 3.11 shows the combination map.
𝐹𝐹𝑎𝑣𝑜𝑟𝑎𝑏𝑖𝑙𝑖𝑡𝑦 = (1 − (1 − 𝐹𝑃𝑇𝑟) × (1 − 𝐹𝑇𝑅))0.8 × (𝐹𝑃𝑇𝑟 × 𝐹𝑇𝑅)0.2 … 𝑒𝑞𝑢𝑎𝑡𝑖𝑜𝑛(3.16)

56
Figure 3.11 Fuzzy GAMMA combination of Fuzzy transport and resource.

57
The high value of GAMMA ensures high membership in cases where sandstone
thickness is high, overburden thickness is low, and either highways or railroads are near.
An important feature of the favorability map is that its membership is equal to zero in
regions with zero sandstone thickness or overburden thickness above 300 feet. Figure 3.13
shows the final process flow chart for this section
Figure 3.12 Change in fuzzy membership with change in GAMMA.
Source: Bonham Carter (1994)

58
The favorability map at this stage ranges from 0 to 1, where 1 signifies the most
favorable locations and 0 the least favorable for establishing sand mining facilities. To link
this favorability to the volume polygon file (P’volume) constructed in the previous step, the
next step overlays the favorability map over the polygon file and extract the favorability
value for every pixel3. This step helps in identifying total volume of sandstone and other
parameters like stripping ratio for different ranges of favorability.
Figure 3.13 Methodology for favorability calculation.
3 Each pixel has area less than 100 sq. meters and already holds 4 attributes: (1) thickness of sandstone, (2)
thickness of overburden, (3) volume of sandstone, and (4) volume of overburden.

59
The polygon file at this stage still counts restricted areas like existing mine leases
(based on data from TCEQ), areas around water bodies, and around cities in sandstone
volume. Mining in these regions is restricted and therefore, must be clipped out of the
polygon file. The final step in this section is to clip out the following regions:
1. Existing mining leases (see Appendix 1 for list of quarries)
2. 2 kilometers from all municipalities
3. 50 meters from all water bodies
An existing quarry database from Texas Commission on Environmental Quality
(TCEQ), and Texas Natural Resources Information System’s (TNRIS) boundary files for
municipalities and water bodies along with buffer to respective distances are used to clip
out the restricted regions from the volume polygon file. Figure 3.14 shows the location and
extent of all restricted areas.
The polygon file with volume, thickness and favorability values, hereafter referred
to as PVF, is the most important output of this section and will be used in the assessment of
final resource potential.

60
Figure 3.14 Areas restricted for mining.

61
3.3 SUITABLE HYDRAULIC FRACTURING SITES: FRACTURE CLOSURE STRESS ANALYSIS
3.3.1 Data
This section uses perforation depth data for several wells in the Permian, Barnett,
Haynesville, and Eagle Ford basin. Perforations depths and locations of several thousand
wells is procured from IHS Inc.4 to carry out this analysis. Each well’s three attributes are
used in this study: (1) location, (2) upper perforation depth, and (3) lower perforation depth.
Strata pressure increases with depth; therefore, for a conservative estimate of suitability,
the analysis uses only lower perforation depth to estimate closure stress.
To generate a continuous plane of perforation depth, four different rasters for each
of the shale play is constructed using natural neighbor interpolation. Of the two perforation
depth features, i.e. lower and upper perforation depth, lower perforation depth is used to
construct the plane. Using lower perforation depth ensures that maximum strata pressure
within the thickness between upper and lower perforation depth is considered for analysis.
The pressure gradient varies within a basin and among different basins. Calculations in this
section assume different pressure gradient values for different basins, but assume a constant
pressure within a basin (see Table 3.4). The pressure gradient will be used to calculate
strata pressure at respective perforation depths.
4 https://www.ihs.com/index.html

62
3.3.2 Calculation
The methodology for calculating closure stress uses conservative estimates for
perforation depth and stress gradient. For example, for depth of perforation, only the lower
most depths are used, and for a range of stress gradient, the analysis uses the highest stress
gradient values for calculating closure stress at perforation depths. The calculations were
made in such a way to avoid an over optimistic estimate of Texas sand’s suitability in the
absence of more robust data that would ideally have high resolution, region specific values
of stress gradient.
The first step is to create continuous rasters using natural neighborhood
interpolation because of its previously discussed advantages. The interpolation algorithm
is the same as used in section 3.1 for volume calculation. The difference is that the known
location in this case is that of oil or gas wells instead of water wells, and the attribute being
interpolated is perforation depth instead of elevation of sandstone layers. Four different
rasters hereafter referred to as the following are created:
1. Barnett lower perforation depth (RBarnett)
2. Eagle Ford lower perforation depth (REagle Ford)
3. Permian lower perforation depth (RPermian)
4. Haynesville perforation depth (RHaynesville)
The raster value for each is the lower perforation depth. If the stress gradient or the
change in stress per unit depth is known, the perforation depth can be multiplied by the

63
stress gradient to get closure stress at a given perforation depth. The following equation
represents this relation.
𝐹𝑟𝑎𝑐𝑡𝑢𝑟𝑒 𝑐𝑙𝑜𝑠𝑢𝑟𝑒 𝑠𝑡𝑟𝑒𝑠𝑠 (𝑝𝑠𝑖) = 𝑑𝑒𝑝𝑡ℎ(𝑓𝑡) × 𝑠𝑡𝑟𝑒𝑠𝑠 𝑔𝑟𝑎𝑑𝑖𝑒𝑛𝑡 (𝑝𝑠𝑖 𝑓𝑡⁄ )
… 𝑒𝑞𝑢𝑎𝑡𝑖𝑜𝑛 (3.17) Raster calculator uses equation 3.17 to calculate a raster with fracture closure stress
as raster value for all the four basins (RBarnett, REagle Ford, RPermian, and RHaynesville). Table 3.4
lists the range of pressure gradient for each raster, and the values used for calculation here.
Table 3.4 Pressure gradient for oil and gas basins.
Basin Pressure gradient (psi/feet)
Permian 0.73
Eagle Ford 0.70
Barnett 0.54
Haynesville 0.95
Source: Bowker (2007), Popov et al. (2000), Menchaca (2013), EIA (2014), Nunn (2012)
3.4 TRANSPORTATION AND COST OPTIMIZATION
This step aims to calculate most cost effective routes to transport sand from the
most favorable extraction sites identified in section 3.2, to suitable hydraulic fracturing
sites identified in section 3.3. The network analyst tool in ArcGIS 10.2.2 is used for finding
the best routes. The new route feature allows calculation of a least cost route over a multi-
modal transport network with several starting points and destinations.

64
3.4.1 Data
Three fundamental datasets are used for network analysis in this case: (1) a network
dataset, (2) starting points, and (3) destinations. The network dataset is a set of polyline
features that define railway routes, highways, railway stations, entrances to railway
stations, and polylines that connect the entrances to railway stations to respective railway
stations. TxDOT is the source for railway routes and highways; these are the same features
used for multi-ring buffer analysis in section 3.2 for favorability calculation. The Bureau
of Transportation Statistics publically publishes data for intermodal facilities for freight
and other commodities5. The database has locations for railway stations where freight can
be loaded from trucks on to rail wagons and vice versa. These locations work as points of
transfer between highways and railways during the analysis. Entrances to railway stations
are the nearest points to respective railway stations that lie on highways. Lines joining
railway stations and entrances are travelled whenever there is a transfer from one mode to
another. All polylines have associated costs of travelling. Highways and railways have cost
per mile associated with them, and line connecting railway stations and entrances to
railway stations are associated with the cost of transfer from one mode to another. The
second and third important datasets used in the analysis, i.e. starting points and
destinations, are point features and products of sections 3.2 and 3.3, respectively. Figure
3.15 shows a hierarchy of datasets and assumptions related to each
5 http://www.rita.dot.gov/bts/sites/rita.dot.gov.bts/files/publications/national_transportation_atlas_database/2
015/point

65
Figure 3.15 Process flow chart for finding least cost route.

66
3.4.2 Calculation
Finding the shortest path between two or more nodes is a classic problem in graph
theory and operations research. Dreyfus, S.E. (1969) surveys a number of algorithms used
for the problem. Dijkstra (1959) introduced one of the most commonly used algorithms,
famously known as Dijkstra’s algorithm. Every branch in a network is assigned a cost,
which is the cost of transportation in this case. The network analyst tool in ArcGIS is used
here to solve the problem of finding lowest cost route from favorable mining locations to
oil and gas basins in Texas. The network is inter-modal, i.e. the freight may take more than
one type or mode of transport between the source and final destination. Railroads and
highways are the two transportation networks integrated here to form an inter-modal
transportation network. Both the datasets are polyline feature classes. Other important
datasets are railway stations, entry to railway stations and transfer lines. Railway stations
are point features on railway lines where freight transfers from highways to railroad, or
vice versa, and entry to railway stations are similar point features on highway lines, and
perform the same function. Transfer lines are polyline feature that connects railway stations
and entry to railway stations. All polyline features have cost associated with them, and the
solver minimizes the accumulated cost of moving from one point to another. Table 3.5 lists
the assumptions for cost.

67
Table 3.5 Cost of transportation.
Mode Cost
Highway $0.25 per ton per mile
Railroad $0.04 per ton per mile
Transfer line $300.00 per car
Source: Union pacific, US Bureau of Transportation Statistics
The foremost step in the calculation process is to verify topology rules in the five
features that form the main network dataset i.e. (1) railway polyline, (2) highway polyline,
(3) railway station point file, (4) entrance to railway station point file, and (5) transfer
polylines that connect railway stations and entrances to railway stations. The topology must
verify that the following rules are followed:
1. Railway stations be covered by lines in railway dataset
2. Entrances to railway stations are covered by lines in highway dataset
3. Railway stations are covered by lines in transfer dataset
4. Entrances to railway stations are covered by lines in transfer dataset
The topology ensures that all elements are connected and traversable in the network
dataset that will be created. It is also necessary to check that the railway and highway
datasets have end points at every junction. The network dataset will use end to end
connectivity for line features; therefore, only endpoints at junctions will allow the solver

68
to switch from one line to another. The feature to line tool in the data management tool box
may be useful to introduce start and end vertices at points of intersection.
The network dataset can be created once all the checks stated above are verified.
All five datasets will participate in the network dataset and will connect in two groups
(defining connectivity). Railway stations, railway line dataset, transfer dataset are in one
group. Highway line dataset is the other group. Entrances to railway stations participates
in both groups. The groups keep the two modes separate and allow transfer only at railway
stations though respective entrances. There may be two evaluators for each line dataset: (1)
cost, and (2) distance. This study uses cost as default impedance to solve the routing
problem.
To calculate least cost routes, ‘closest facility tool’ from the network analysis
toolbox of ArcGIS is used. The tool allows computing optimum routes from the mining
locations in the Llano uplift to several destinations in the Permian, Barnett and the Eagle
Ford basin. It is important to note that the routes calculated in this step are not necessarily
the shortest routes, but, the least cost routes. The low cost of transportation by railroads
often leads to longer routes with lower overall cost compared to shortest routes. Figure
3.16 shows all the least cost routes that use only highways. The costs at the bottom of the
Figure are the expected costs for the complete route, per car. Figure 3.17, shows the routes
where intermodal, i.e. a combination of railways and highways, transportation is preferred.

69
Figure 3.16 Least cost route that use only highways for transportation.

70
Figure 3.17 Least cost routes that use intermodal transportation.

71
Chapter 4. Results and Discussion
4.1 VOLUME CALCULATION
The 922,042 acres of area under study (see Figure 3.3) holds approximately 15.8
billion cubic meters of sandstone. This represents only above ground water level sand.
Approximately 10.9 billion cubic meters of overburden will have to be removed to extract
all 15.8 billion cubic meters of sand. Sandstone can be observed (see Figure 3.5) to be
concentrated mainly in the northern region of the area under study, i.e. counties:
McCulloch, San Saba, Llano, Mason, and Burnet. It is important to note that the thickness
of sandstone in Figure 3.5 is only that which is above ground water level, which is also a
reason for the discontinuity at several regions. On comparing Figure 3.5 and Figure 3.6, it
can be observed that the overburden cover over sandstone in Mason, McCulloch, and San
Saba counties is relatively low, when compared to the overburden cover over sandstone in
Burnet county and north eastern parts of Llano. The stripping ratio of mining, the unit of
overburden needed to be removed to retrieve per unit of sand (Hartman, 1992), decreases
in areas with a lower volume of overburden and higher volume of sand. The thickness of
sandstone ranges from 0 feet to 285 feet and that of overburden ranges from 0 feet to over
800 feet. Sandstone thickness is highest (shaded green in Figure 3.5) in Mason County, the
southeast part of McCulloch County, near the boundary between San Saba and Llano
counties, and in Burnet County. Overburden thickness is highest in the southwestern part
of San Saba County, southwestern part of Mason County, and near the boundary between
McCulloch and Mason counties.

72
4.2 FAVORABILITY CALCULATION
The rasters in Figures 3.5 and 3.6 scaled as per Tables 3.1 are used for sandstone
and overburden thickness. The four rasters are combined for fuzzy logic analysis, as
explained in section 3.2. Figure 3.10 shows the resource fuzzy member (FTR), constructed
by combining sandstone and overburden thickness. Figure 3.9 shows proximity to any
transportation facility (FPTr). The two rasters FTR and FPTr are combined by using the fuzzy
GAMMA operator to calculate a favorability map (Figure 3.11). Restricted areas explained
in section 3.2 must be excluded from further calculations. Figure 3.14 shows the restricted
regions, which are clipped out to form Figure 4.1, the final favorability map. The sandstone
deposits in McCulloch, San Saba, Mason, and Burnet counties are most favorable. Existing
quarries in McCulloch and Mason counties, and municipal regions in Burnet County cut
through some of the favorable regions, most of the favorable deposits lie outside the
restrictions in Figure 3.14. The area under study cumulatively holds more than 15.8 billion
cubic meters of sand or more than 24 billion metric tons6. The deposit is also covered by
as much as 10.9 billion cubic meters of overburden. A discussion on distribution of both
sandstone and overburden, as per favorability, helps to better understand the stripping ratio
and actual sandstone tonnage that can be mined economically. Table 4.1 presents the
summary of volume and area covered by different favorability regions
6 1 cubic meter = 1.530 metric ton (Fairmount Santrol, 2016)

73
Figure 4.1 Final favorability map.

74
Table 4.1 Favorable volume and area result
Favorability
Sandstone
tonnage
(Million
metric tons)
Area
(acres)
Overburden Volume
(Million cubic
meters)
Average stripping
ratio (CuM
waste/CuM sand)
0.0 - 0.1 40 625,681 158 5.975
0.1 - 0.2 214 6,441 793 5.656
0.2 - 0.3 366 13,151 741 3.099
0.3 - 0.4 611 22,269 1,259 3.151
0.4 - 0.5 1,053 28,762 1,351 1.962
0.5 - 0.6 1,655 40,344 1,882 1.740
Subtotal 3,940 736,647 6,183
0.6 - 0.7 2,631 48,014 1,703 0.990
0.7 - 0.8 4,403 53,253 1,510 0.525
0.8 - 0.9 6,843 49,650 1,142 0.255
0.9 - 1.0 6,375 34,529 378 0.091
Subtotal 20,253 185,446 4,732
Total 24,193 922,092 10,915
Table 4.1 separates the study area into two categories: (1) area with favorability
less than 0.6, and (2) area with favorability equal to or more than 0.6. The favorability map
in Figure 4.1, when compared to the location of actual locations of existing mines,
illustrates this division (see Appendix 1 for list of quarries). It can be observed in Figure
4.2 that all existing mines are located in an area with favorability more than 0.6. The
observation that actual mines occur in areas computed as highly favorable in this study also
provides validation to the results. The region with favorability more than 0.6 holds more
than 20 billion metric tons of sand deposit, almost 84 percent of the total deposit. The
stripping ratio decreases with increasing favorability. Stripping ratio is the least favorable
region is almost 65 times that of the most favorable region. After–processing yield is

75
another important variable that must be noted. Unlike synthetically manufactured
proppants, naturally formed sand is not “designed” to have desired size, roundness and
strength. Therefore, after mining, the sand goes through a series of processes to get the
final product. After crushing and processing to get the desired product and remove
undesired material, yield can be as low as 20 percent (Beckwith, 2011). At 20 percent yield,
the 20 billion metric tons of sand in favorable zones can yield as much as 4 billion metric
tons of hydraulic fracturing sand.

76
Figure 4.2 Location of existing mines compared to computed favorability.

77
4.3 SUITABLE HYDRAULIC FRACTURING WELL SITES
The compressibility strength for Texas sand ranges from 4,000–6,000 psi (Benson,
2015; Elliott and Verma, 2015). Figure 4.3 shows the wells sites with fracture closure stress
less than 6,000 psi. The choice of using 6,000 psi is subjective, as there is significant
variation in compressive strength of Hickory sand, based on quality and size fraction.
Based on the quality of sand, US Silica (2016) and Santrol (2016) claim the Hickory sand
to be applicable in fracture closure stress of 2,000–6,000 psi, Benson et al. (2015) claims
applicability up to 4,000 psi, and compressibility tests by Kullman (2011) and Economides
(1992) show a sharp decrease in conductivity at pressures greater than 6,000 psi. The well
sites in green are suitable for Texas sand and these sites are used to solve the transportation
analysis in the next section. The Barnett shale in the north has the largest area with shallow
wells. There are significantly large locations with shallow wells in the south, in Eagle Ford
basin. The Permian basin has a comparatively smaller region where Texas’ sand may be
suitable.

78
Figure 4.3 Oil and gas hydraulic fracturing sites suitable for Texas’ sand.

79
4.4 TRANSPORTATION ANALYSIS
The network analysis in this section shows 16 routes originating from the Llano
uplift region to the various regions shaded green in Figure 4.3. Variation in distance of
transportation and mode of transportation leads to a wide gap in cost of transportation; the
cost per ton for a route ranges from $17 to $35. Figure 4.4 shows the least cost
transportation routes from favorable mining sites (see Figure 4.1), to suitable hydraulic
fracturing sites. Table 4.2 (a) and (b) summarize the results of network analysis. Table 4.2
(a) and (b) also present a comparison of rail transport cost assumption with that of actual
quotes from Union Pacific. The analysis shows that all routes ending in the Permian basin
prefer highway as a more cost effective mode of transportation. The distance of travel in
the this case ranges from 103 miles to 238 miles and total cost varies linearly, with cost per
ton remaining constant. For transportation to the Barnett shale, all locations except number
10, highways are the most effective mode of transportation. Areas near location 10,
however, have a distinct advantage of proximity to Fort Worth railway stations, which
brings in partial transportation via railroads. The low cost of transportation via railroad is
well reflected in cost per ton. While the cost per ton for location ranges between $19 and
$26, the same for other routes is as high as $35. The locations in the Eagle Ford basin are
located farthest from the Llano uplift region, but take the advantage of the low cost of
railway transportation. The cost per route, even for most distant locations is as low as $19
to $30, and can be as low as $17 to $21 as in the case of location 14. The Eagle Ford basin’s

80
proximity to the coast, provides access to international sources of sand and synthetic
proppants. Therefore, due to the added competition, the benefits of avoided cost of
transportation may not be as well realized in the Eagle Ford basin as in other basins.

81
Table 4.2 (a) Summary of network analysis.
ID
Destination
basin
Total
distance
(miles)
Distance
on
highway
(miles)
Distance
on
railroad
(miles)
Percent
distance
on
highway
(%)
Percent
distance
on
railroad
(%)
Cost on
highway
($35.00
per car
per
mile)1
1 Permian 206 206 0 100% 0% $7,223
2 Permian 238 238 0 100% 0% $8,323
3 Permian 111 111 0 100% 0% $3,868
4 Permian 103 103 0 100% 0% $3,598
5 Barnett 174 174 0 100% 0% $6,080
6 Barnett 90 90 0 100% 0% $3,164
7 Barnett 164 164 0 100% 0% $5,751
8 Barnett 121 121 0 100% 0% $4,237
9 Barnett 225 225 0 100% 0% $7,871
10 Barnett 266 92 174 34% 66% $3,210
11 Eagle Ford 420 156 264 37% 63% $5,450
12 Eagle Ford 117 117 0 100% 0% $4,089
13 Eagle Ford 361 127 234 35% 65% $4,431
14 Eagle Ford 364 106 258 29% 71% $3,703
15 Eagle Ford 203 203 0 100% 0% $7,108
16 Eagle Ford 202 202 0 100% 0% $7,087 1. @$0.25 per ton per mile; 1 car = 140 tons (140 X 0.25 = 35)
2. @$0.04 per ton per mile; 1 car will carry max 140 tons (due to volume constraint), but cost calculated for 200 tons (max load constraint) (200 X 0.04 = 8)
3. Includes cost incurred on highway @$35.00 per car per mile, cost on rail @$8.00 per car per mile, transfer cost between rail and road
@300 per car 4. Includes cost incurred on highway @$35.00 per car per mile, and cost quoted by Union pacific

82
Table 4.2 (b) Summary of network analysis.
ID
Destination
basin
Cost on
railroad
($ 8.00
per car
per mile)2
Cost on
railroad
(UP quote
for
covered
hopper)
Total
route
cost3
Total
route
cost4
Average
cost per
ton3
Average
cost per
ton4
1 Permian $600 $- $7,223 $7,223 $35 $35
2 Permian $600 $- $8,323 $8,323 $35 $35
3 Permian $600 $- $3,868 $3,868 $35 $35
4 Permian $600 $- $3,598 $3,598 $35 $35
5 Barnett $600 $- $6,080 $6,080 $35 $35
6 Barnett $600 $- $3,164 $3,164 $35 $35
7 Barnett $600 $- $5,751 $5,751 $35 $35
8 Barnett $600 $- $4,237 $4,237 $35 $35
9 Barnett $600 $- $7,871 $7,871 $35 $35
10 Barnett $1,993 $3,621 $5,138 $6,831 $19 $26
11 Eagle Ford $2,714 $7,212 $7,995 $12,662 $19 $30
12 Eagle Ford $600 $- $4,089 $4,089 $35 $35
13 Eagle Ford $2,476 $3,971 $6,232 $8,402 $17 $23
14 Eagle Ford $2,662 $3,971 $6,359 $7,674 $17 $21
15 Eagle Ford $600 $- $7,108 $7,108 $35 $35
16 Eagle Ford $600 $- $7,087 $7,087 $35 $35 1. @$0.25 per ton per mile; 1 car = 140 tons (140 X 0.25 = 35) 2. @$0.04 per ton per mile; 1 car will carry max 140 tons (due to volume constraint), but cost calculated for 200 tons (max load
constraint) (200 X 0.04 = 8)
3. Includes cost incurred on highway @$35.00 per car per mile, cost on rail @$8.00 per car per mile, transfer cost between rail and road @300 per car
4. Includes cost incurred on highway @$35.00 per car per mile, and cost quoted by Union pacific

83
Figure 4.4 Least cost routes from favorable mining locations to suitable hydraulic fracturing sites.

84
Chapter 5. Conclusion
Sandstone potential of more than 922,000 acres of land in central Texas is studied
and rated for favorability on a scale of 0 to 1, with 1 being the most favorable. It is found
that locations with favorability equal to or more than 0.6 successfully predict the location
of all existing mining operations. The total region with this favorability is limited to
185,000 acres and has the potential for more than 20 billion metric tons of sand, in excess
of current mining reserves, away from water bodies and municipalities, and above the
ground water level. McCulloch, Mason, Burnet and San Saba counties in central Texas
hold most of the favorable locations for establishing new extraction facilities. At 20 percent
yield, the region has the potential to produce more than 4 billion metric tons of hydraulic
fracturing sand. The analysis is based on data from about 2,000 water wells from the Texas
Water Development Board, and more in-depth analysis with a higher resolution data is
possible. Collecting samples from the favorable sites and analyzing them for actual crush
strength, roundness, sphericity, size, and silica content will reduce uncertainty in yield and
applicability. Only Hickory sandstone is analyzed in this study, as it is the principal source,
but at least one mine (the Erna operation in San Saba County) operates in the Wilberns
formation as well. A forecast for future hydraulic fracturing sand production and prices,
and cost of extraction were not studied in this report, but can help in making a more
informed decision.
To identify suitable oil and gas production sites for Texas’ sand, pressure gradient
and perforation depth of several petroleum basins are analyzed. Parts of basin where
pressure at respective perforation depths are lower than the compressive strength of sand

85
are deemed suitable for application. A large area in northern and western Texas including
the Barnett and Permian basin plays is identified, and a significant region in the Eagle Ford
in southern Texas is also considered suitable for Texas’ sand. Wells in the Haynesville are
mostly not compatible with the central Texas sand characterisitcs. The study assumes
constant pressure gradient for respective basins, albeit higher values are used. Using the
actual pressure gradient at smaller scale can help identify more regions for applicability,
and may even remove some if the pressure gradient is found to be more than currently
assumed.
Network analysis that completes the supply chain, originating at favorable mining
sites and end at suitable hydraulic fracturing sites, finds different combinations of highways
and railways as favorable modes of transportation. The ratio of distance travelled on each
type of mode depends on the assumed cost per mile for each, cost of intermodal transfer,
and total distance to be travelled. The study finds that most regions in the Permian basin
are most cost effectively served by highways alone. In the Barnett shale, areas near Fort
Worth are cheaper to reach if they use railroad for about 66 percent of the total travel
distance; other regions can be reached via highways alone in the least cost for
transportation. The Eagle Ford basin is most favorable for rail transport, and even with a
longer distance of transportation, lower cost per ton can be seen in this region. For all the
sites, the cost of transportation ranges between $17 and $35 per ton. Texas’ sand is an
excellent alternative for Northern White sand wherever applicable as even with most
conservative estimate of $0.04 per ton per mile, the cost comes out to be $48 per ton hauled
over 1,200 miles from the Great Lakes area. $48 per ton assumes end to end rail transport

86
at most conservative estimate of cost per mile, but the actual cost will be much higher. An
analysis of factors like availability of railway cars, cost of non-availability, fines for late
return remained out of the scope of this study, but can help in a deeper understanding of
the complex network.
The study successfully integrates Hydraulic fracturing sand mining, applicability
of the resource and transportation to suitable destinations in Texas. Reduced cost of sand
can significantly reduce the cost of hydraulic fracturing. Information about resource
quantity and location presents an opportunity to develop the local sand resource and make
more informed policies for resource development of the Llano uplift region. Railways are
seen to significantly reduce the cost of transportation. The study identifies regions with
potential demand of railway infrastructure and presents an opportunity for railroad
development near mining sites and their potential customers in the Barnett, Permian, and
Eagle Ford basins.

87
Appendix 1
Table A1. List of existing quarries in the Llano uplift7
S. No.
Registration
number Permittee County
Area
(Acres) Latitude Longitude
1 AP0000413
Voca
Facility Mcculloch
239 -99.1549 30.9983
2 AP0000719
Chanas
Aggregates
Llc -
Bluffton
Quarry Llano
2,969 -98.5196 30.8635
5 AP0000304
Narund
Quarry Burnet
161 -98.3359 30.9651
6 AP0000305
Lampasas
Quarry Burnet
112 -98.2257 30.9328
7 AP0000455
Collier
Materials,
Inc Burnet
183 -98.2839 30.6501
8 AP0000073
Cadre
Proppants -
Brady
Facility,
Voca Tx. Mcculloch
1,059 -99.1360 31.0078
9 AP0000184
Bilbrough
Marble
Division Burnet
27 -98.2525 30.6949
10 AP0000005
J.M. Huber
Mining
Operationn Burnet
1,089 -98.2688 30.5444
11 AP0000670
Fml Sand
Llc - Fml
Voca
Mcculloch
, Mason
2,026 -99.2281 30.9474
12 AP0000696
Vulcan
Constructio
n Materials
Lp - Burnet
132 -98.2148 30.4846
7 Includes all quarries in addition to hydraulic fracturing sand, e.g. limestone and aggregate quarries are
also included

88
Spicewood
Quarry
13 AP0000172
Burnet
Quarry Burnet
1,744 -98.2365 30.7064
14 AP0000643
Allen
Keller
Company -
Llano -
Moore
Quarry Llano
10 -98.5589 30.6119
15 AP0000873
Premier
Silica Llc -
Voca North Mcculloch
156 -99.1583 30.9903
16 AP0000889
Apac-
Texas Inc -
Marble
Falls
Quarry Burnet
637 -98.2511 30.6463
Source: Texas Commission on Environmental Quality (TCEQ)

89
References
Adams, J.E. (1954). Mid-Paleozoic paleogeography of central Texas. In San Angelo,
Geological Society Guidebook, Cambrian (1st) Field Trip – Llano area, pp.70–73.
Adams, R. L., and Carr, J. P. (2010). Regional depositional systems of the Woodbine,
Eagle Ford, and Tuscaloosa of the U.S. Gulf Coast: Gulf Coast Association of
Geological Societies Transactions, v. 60, p. 3-27.
Barnes, V. E., and Schofield, D. A. (1964). Potential low-grade iron ore and hydraulic-
fracturing sand in Cambrian sandstones, northwestern Llano Region, Texas.
Bureau of Economic Geology, University of Texas.
Barnes, V., Bell, W.C., Clabaugh, S.E., Rodda, P.U., and Young, K. (1972). Geology of
the Llano Region and Austin Area. Field Excursion: Guidebook Number 12,
Bureau of Economic Geology, p.75.
Barnes, V.E., & Bell, W.C. (1977). The Moore Hollow Group of Central Texas.
University of Texas at Austin, Bureau of Economic Geology, Report of
Investigations no. 88, 169 p.
Bonham-Carter, G. F. (2014). Geographic information systems for geoscientists:
modelling with GIS (Vol. 13). Elsevier.
Beckwith, R. (2011). Proppants: Where in the world? Journal of Petroleum
Technology, 63(4).
Benson, M. E., Wilson, A. B., & Bleiwas, D. I. (2015). Frac sand in the United States: a
geological and industry overview (No. 2015-1107). US Geological Survey.
Boring, T. H. (1993). Upper Strawn (Desmoinesian) carbonate and clastic depositional
environments, southeast King County, Texas, in Johnson, K. S., and Campbell, J.
A., eds., Petroleum-reservoir geology in the southern Midcontinent, 1991
Bowker, K.A. (2003). Recent developments of the Barnett Shale play, Fort Worth Basin:
West Texas Geological Society Bulletin, v. 42, no. 6, p. 4-11.
Bowker, K. A. (2007). Barnett shale gas production, Fort Worth Basin: issues and
discussion. AAPG bulletin, 91(4), 523-533.
Cardneaux, A. P. (2012). Mapping of the oil window in the eagle ford shale play of
southwest Texas using thermal modeling and log overlay analysis(Doctoral
dissertation, Faculty of the Louisiana State University Agricultural and
Mechanical College in partial fulfillment of the requirements for degree of Master
of Science in The Department of Geology and Geophysics by Austin Pourciau
Cardneaux BS, University of Mississippi).

90
Carranza, E. J. M., and Hale, M. (2001). Geologically constrained fuzzy mapping of gold
mineralization potential, Baguio district, Philippines. Natural Resources
Research, 10(2), 125-136.
Carlson, W.D. (1998). Petrologic constraints on the tectonic evolution of the Llano
Uplift. In J.P. Hogan, M.C. Gilbert (Eds.), central North America and other
Regions; Proceedings of the twelfth International Conference on Basement
Tectonics: Norman, Oklahoma, USA 1995, Basement Tectonics, 12 (6), (pp. 3–
27). Dordrecht, Netherlands: Kluwer Academic Press.
Clark, J. B. (1949). A hydraulic process for increasing the productivity of wells. Journal
of Petroleum Technology, 1(01), 1-8.
Cleaves, A.W. (1975). Upper Desmoinesian-lower Missourian depositional systems
(Pennsylvanian), North-Central Texas: The University of Texas Austin, Ph.D.
dissertation.
Cleaves, A. (1993) Sequence stratigraphy, systems tracts, and mapping strategies for the
subsurface Middle and Upper Pennsylvanian of the eastern shelf, in Crick, R. E.,
ed., American Association of Petroleum Geologists Southwest Section, Regional
Meeting, Transactions: Fort Worth Geological Society, p. 26-42.
Cleaves, A. W. (2000). Sequence stratigraphy and reciprocal sedimentation in Middle
and Late Pennsylvanian carbonate-bank systems, eastern shelf of the Midland
Basin, north-central Texas, in Johnson, K. S., ed., Platform carbonates in the
southern Midcontinent, 1996 symposium: University of Oklahoma, v. 101, p.
227–257.
Cleaves, A.W., and Erxleben, A.W. (1982). Upper Strawn and Canyon (Pennsylvanian)
depositional systems, surface and subsurface, North-central Texas, in Cromwell,
D. W., ed., Middle and Upper Pennsylvanian System of North-Central and West
Texas (outcrop to subsurface): symposia and field conference guidebook: West
Texas Geological Society, v. 82-21, p. 49–85.
Cleaves, A. W., and Erxleben, A. W. (1985). Upper Strawn and Canyon cratonic
depositional systems of Bend Arch, north-central Texas, in McNulty, C. I., and
McPherson, J. C., eds., Transactions of the American Association of Petroleum
Geologists Southwest Section Regional Meeting: Fort Worth Geological Society,
p. 27–46.
Considine, T. J., Watson, R. W., and Considine, N. B. (2011). The economic
opportunities of shale energy development. The Manhattan Institute, June.
Corrigan, J.C., Cerveny, P.F., Donelick, R.A., and Bergman, S.C. (1998). Postorogenic
denudation along the Paleozoic Ouachita trend, south central United States of
America: magnitude and timing constraints from apatite fission track data.
Tectonics, 17, 587–603.

91
Dawson, W. C., and Almon, W. R. (2010). Eagle Ford Shale variability: Sedimentologic
influences on source and reservoir character in an unconventional resource unit:
Gulf Coast Association of Geological Societies Transactions, v. 60, p. 181-190.
Donovan, A. D., and Staerker, T. S. (2010). Sequence stratigraphy of the Eagle Ford
(Boquillas) Formation in the subsurface of South Texas and outcrops of West
Texas: Gulf Coast Association of Geological Societies Transactions, v. 60, p.
861-899.
De Quadros, T. F. P., Koppe, J. C., Strieder, A. J., and Costa, J. F. C. L. (2006). Mineral-
potential mapping: A comparison of weights-of-evidence and fuzzy methods.
Natural Resources Research, 15, 49–65.
Dijkstra, E. W. (1959). A note on two problems in connexion with graphs.Numerische
mathematik, 1(1), 269-271.
Economides, M. J. (1992). A practical companion to reservoir stimulation (Vol. 34).
Elsevier.
EIA (U.S. Energy Information Administration) (2014). Updates to the EIA Eagle Ford
play maps. U.S. Department of Energy.
https://www.eia.gov/maps/pdf/eagleford122914.pdf
Ewing, T.E. (2003). Review of the Tectonic History of the Lower Rio Grande Border
Region, South Texas and Mexico, and Implications for Hydrocarbon Exploration:
Sipes Newsletter, v. 40, p. 16-21.
Dreyfus, S. E. (1969). An appraisal of some shortest-path algorithms. Operations
research, 17(3), 395-412.
Fairmount Santrol (2016). Technical data sheet. Fairmount Minerals Company.
http://fairmountsantrol.com/wp-content/uploads/2014/09/Frac-Sand-Northern-
White-TDS-914.pdf.
Ford, A., Miller, J. M., and Mol, A. G. (2015). A comparative analysis of weights of
evidence, evidential belief functions, and fuzzy logic for mineral potential
mapping using incomplete data at the scale of investigation. Natural Resources
Research, 1-15.
Galley, J. E. (1958). Oil and geology in the Permian basin of Texas and New Mexico:
North America.
Galloway, W.E. (2008). Depositional Evolution of the Gulf of Mexico Sedimentary
Basin, in Miall, A.D., eds., The Sedimentary Basins of the United States and
Canada: New York, Elsevier, 610 pp.
Garrison Jr, J. R., Long, L. E., and Richmann, D. L. (1979). Rb-Sr and K-Ar
geochronologic and isotopic studies, Llano Uplift, central Texas. Contributions to
Mineralogy and Petrology, 69(4), 361-374.

92
Goldhammer, R.K. and Johnson, C.A. (2001). Middle Jurassic-Upper Cretaceous
paleogeographic evolution and sequence-stratigraphic framework of the
Northwest Gulf of Mexico rim. In: The western Gulf of Mexico basin; tectonics,
sedimentary basins, and petroleum systems (Eds. C. Bartolini, R.T. Buffler and A.
Cantu-Chapa). American Association of Petroleum Geologists : Tulsa, OK,
United States. AAPG Memoir 75, p. 45-81.
Gunn, R. D. (1979). Desmoinesian depositional systems in the Knox-Baylor Trough, in
Hyne, N. J., ed., Pennsylvanian sandstones of the Mid-continent: Tulsa
Geological Society, p. 221–234.
Harbor, R., (2011). Facies Characterization and Stratigraphic Architecture of Organic-
Rich Mudrocks, Upper Cretaceous Eagle Ford Formation, South Texas. Master’s
Thesis, University of Texas at Austin, Austin, TX. 195 pp.
Hartman, H. L. (1992). SME mining engineering handbook (Vol. 2). SME.
Helper, M. A. (2000). Geology of the eastern Llano Uplift. In J.R. Kyle (Ed.), Geology
and Historical Mining (pp. 33–48). Llano Uplift Region: Austin Geological
Society, Guidebook 20.
Hentz, T.F., and Ruppel, S.C. (2010). Regional lithostratigraphy of the Eagle Ford Shale:
Maverick Basin to East Texas Basin: Gulf Coast Association of Geological
Societies Transactions, v. 60, p. 325-337.
Kier, R.S. (1980). Depositional history of the Marble Falls Formation of the Llano
region, Central Texas. West Texas Geological Society Publication 80-73,
Guidebook to the Annual Field Trip, 59–75.
Krause, S.J. (1996). Stratigraphic framework, facies analysis, and depositional history of
the Middle to Late Cambrian Riley Formation, central Texas. Masters Thesis,
University of Texas at Austin, 172 p.
Kullman (2011). The complicated world of proppant selection.
http://images.sdsmt.edu/learn/speakerpresentations/Kullman.pdf. (Accessed on
April 27, 2016)
Kyle, J. R., and McBride, E. F. (2014). Geology of the Voca frac sand district, western
Llano uplift, Texas. In Proceedings of the 48th Annual Forum on the Geology of
Industrial Minerals: Arizona Geological Survey Special Paper(Vol. 9, pp. 1-13).
Lock, B. E., Peschier, L. and Whitcomb, N. (2010). The Eagle Ford (Boquillas
Formation) of Val Verde County, Texas—a window on the South Texas play:
Gulf Coast Association of Geological Societies Transactions, v. 60, p. 419-434.
Loen J.S. (2002). Reconnaissance investigation of sand and gravel deposit in Klickitat
county, Washington. October.
http://www.klickitatcounty.org/planning/FilesHtml/recon%20invest.pdf

93
Loucks, R.G. (1976). Pearsall Formation, Lower Cretaceous, South Texas : depositional
facies and carbonate diagenesis and their relationship to porosity. Ph.D.
Dissertation, University of Texas at Austin, Austin, TX. 362 pp.
McBride, E.F., Abdel-Wahab, A.A., and Milliken, K.L. (2002). Petrography and
diagenesis of a half-billion-year- old cratonic sandstone (Hickory), Llano region,
Texas. University of Texas at Austin, Bureau of Economic Geology, Report of
Investigation No. 264, 77 p.
McKay, G., and Harris, J. R. (2015). Comparison of the data-driven Random Forests
model and a knowledge-driven method for mineral prospectivity mapping: a case
study for gold deposits around the Huritz Group and Nueltin Suite, Nunavut,
Canada. Natural Resources Research. doi:10.1007/s11053-015-9274-z.
Menchaca Matt (2013). General overview of the permian Strata of the Delaware and NW
shelf. Drillinginfo. http://info.drillinginfo.com/general-overview-of-permian-
strata-of-the-delaware-basin-and-nw-shelf/
Mosher, S. (1993). Exposed Proterozoic rocks of Texas. In J. C. Reed Jr, M. E. Bickford,
R. S. Houston, P. K. Link, D. W. Rankin, P. K. Sims, & W. R. Van Schmus
(Eds.), Precambrian Conterminous U.S., The Geology of North America, C-2 (pp.
366–378). Boulder: Geological Society of America.
Mosher, S. (1995). Geology of the eastern Llano Uplift. In S. Mosher (Ed.) Guide to the
Precambrian Geology of the eastern Llano Uplift, A field trip organized by The
University of Texas at Austin, in conjunction with the 12th International
Conference on Basement Tectonics, (pp. 2–8). Austin, Texas.
Mosher, S. (1996). Geology of the eastern Llano Uplift. In S. Mosher (Ed.) Guide to the
Precambrian Geology of the eastern Llano Uplift, Meeting of the South-Central
Section of the Geological Society of America, (pp. 3–7), Austin, Texas.
Mosher, S. (1998). Tectonic evolution of the southern Laurentian Grenville orogenic belt.
Geological Society of America Bulletin, 110, 1357–1375.
Mosher, S., Levine, J. S. F., and Carlson, W. D. (2008). Mesoproterozoic plate tectonics:
A collisional model for the Grenville-aged orogenic belt in the Llano uplift,
central Texas. Geology, 36(1), 55-58.
Nunn, J. A. (2012). Burial and thermal history of the Haynesville Shale: implications for
overpressure, gas generation, and natural hydrofracture.
Pollastro, R. M., Hill, R. J., Jarvie, D. M., and Henry, M. E. (2003). Assessing
Undiscovered Resources of the Barnett-Paleozoic Total Petroleum System, Bend
Arch-Fort Worth Basin Province, Texas.
Popov, M. A., Nuccio, V. F., Dyman, T. S., Gognat, T. A., Johnson, R. C., Schmoker, J.
W., ... and Bartberger, C. (2000). Basin-centered gas systems of the US.
Department of Interior (US).

94
Porwal, A., Carranza, E. J. M., and Hale, M. (2003). Knowledge driven and data-driven
fuzzy models for predictive mineral potential mapping. Natural Resources
Research, 12, 1–25.
Reese, J.F. (1995). Structural evolution and geochronology of the southeastern Llano
Uplift, central Texas. Ph.D. dissertation, The University of Texas at Austin, 172
p.
Reese, J.F., Mosher, S., Connelly, J., and Roback, R. (2000). Mesoproterozoic
chronostratigraphy of the southeastern Llano Uplift, central Texas. Geological
Society of America Bulletin, 112(2), 278–291.
Roback, R.C. (1996). Mesoproterozoic polymetamorphism and magmatism in the Llano
Uplift, central Texas Geological Society of America, Abstracts with Programs,
28, A377.
Salvador, A. (1991). Origin and development of the Gulf of Mexico Basin. In A.
Salvador (Ed.), The Gulf of Mexico Basin, v. J, (pp. 389–344). Boulder,
Colorado: Geological Society of America.
Salvador, A., (1991). Triassic-Jurassic. In: The geology of North America (Ed A.
Salvador): Geologic Society of America: Boulder, CO, United States, p. 131-180.
Santrol (2016). Texas Gold, Frac sand. Santrol, a Fairmount Minerals Company.
http://fairmountsantrol.com/wp-content/uploads/2014/08/13-FMS-0161-
TexasGold-Data-Sht-lores.pdf. (Accessed on April 27, 2016)
Scott, R.J., (2003). The Maverick Basin: New technology -- New Success. In: Structure
and Stratigraphy of south Texas and Northeast Mexico: Applications to
Exploration, CD ROM, GCSSEPM Foundation South Texas Geological Society,
p. 18.
Sibson, R. (1981). A brief description of natural neighbor interpolation. Interpolating
Multivariate Data (pp. 21–36). New York: Wiley.
Sider, A. (2014, April 30). Fracking sends sand sales soaring. The wall street journal.
http://blogs.wsj.com/corporate-intelligence/2014/04/30/fracking-sends-sand-sales-
soaring/
Sutphin, D. M., and Goldsmith, R. (2002). Techniques for Assessing Sand and Gravel
Resources in Glaciofluvial Deposits--an Example Using the Surficial Geologic
Map of the Loudon Quadrangle, Merrimack and Belknap Counties, New
Hampshire (Vol. 1627). US Geological Survey.
Smith, D.R., Barnes, C., Shannon, W., Roback, R. and James, E. (1997). Petrogenesis of
Mid-Proterozoic granitic magmas; examples from central and west Texas.
Precambrian Research, 85, 53–79.
Tai, P. -C., and Dorobek, S. L. (1999). Preliminary study on the late Paleozoic tectonic
and stratigraphic history at Wilshire Field, central Upton County, southwestern

95
Midland Basin, West Texas, in Grace, D. T., and Hinterlong, G. D., eds., The
Permian Basin: providing energy for America: West Texas Geological Society, v.
99-106, p. 19–29.
Tai, P. C., and Dorobek, S. L. (2000) Tectonic model for late Paleozoic deformation of
the Central Basin Platform, Permian Basin region, West Texas, in DeMis, W. D.,
Nelis, M. K., and Trentham, R. C., eds., The Permian Basin: proving ground for
tomorrow’s technologies: West Texas Geological Society, v. 00-109, p. 157–176.
U.S. Geological Survey (2016), Industrial sand: Mineral Commodity Summaries,
http://minerals.usgs.gov/minerals/pubs/commodity/silica/mcs-2016-sandi.pdf
US Silica (2016). 30/50 Premium Hickory.
http://www.ussilica.com/sites/ussilica.com/files/Premium-Hickory-3050-2.pdf
(Accessed on April 27, 2016)
Vander Loop, M. (1990). Amacker-Tippett Wolfcamp Field, Upton County, Texas, in
Flis, J. E., and Price, R. C., eds., Permian Basin oil and gas fields: innovative
ideas in exploration and development: West Texas Geological Society, v. 90-87,
p. 133–151.
Venkataraman, G., Babu Madhavan, B., Ratha, D. S., Antony, J.P., Goyal, R. S.,
Banglani, S., and Sinha Roy, S. (2000). Spatial modeling for base-metal mineral
exploration through integration of geological data sets. Natural Resources
Research, 9, 27–42.
Walker, N. (1992). Middle Proterozoic geologic evolution of Llano uplift, Texas:
Evidence from U-Pb zircon geochronometry. Geological Society of America
Bulletin, 104(4), 494-504.
Wright W. (Accessed on April 27, 2016). Depositional history of the Desmoinesian
succession (middle Pennsylvanian) in the Permian basin.
http://www.beg.utexas.edu/resprog/permianbasin/PBGSP_members/writ_synth/St
rawn.pdf
Yang, K. -M., and Dorobek, S. L. (1995). The Permian Basin of West Texas and New
Mexico: tectonic history of a “composite” foreland basin and its effects on
stratigraphic development, in Dorobek, S. L., and Ross, G. M., eds., Stratigraphic
evolution of foreland basins: SEPM (Society for Sedimentary Geology), v. 52, p.
149–174.
Zadeh, L. A. (1965). Fuzzy sets. Information and control, 8(3), 338-353.
Zdunczyk, Mark, 2014, Hydraulic fracturing sand (frac sand): Mining Engineering, v. 66,
no. 7, p. 53–55


![[XLS] · Web viewKrishna Nagvanshi Lenjwara Rahul Verma Kosmara Pavindra Kumar Baghel Bhendra Suresh Kumar Sahu Biladi Chandra Prakash Choubey Tamaseoni Chandra Shekhar Sahu BHOPAL](https://img.dokumen.tips/doc/110x75/5af7528b7f8b9a5f588b5a83/xls-viewkrishna-nagvanshi-lenjwara-rahul-verma-kosmara-pavindra-kumar-baghel-bhendra.jpg)