Embed Size (px)
Citation preview

Copyright
by
Radhika Anantharaman Nair
2005

The Dissertation Committee for Radhika Anantharaman Nair certifies that this is the approved version of the following dissertation:
EVALUATION OF FACTORS RELATED TO PRESCRIPTION DRUG
EXPENDITURES, PRESCRIBING TRENDS AND PHYSICIAN VISITS: THE
ROLE OF DIRECT-TO-CONSUMER ADVERTISING EXPENDITURES,
DEMOGRAPHICS, AND HEALTH INSURANCE COVERAGE
Committee:
Marvin D. Shepherd
______________________________Jamie C. Barner
______________________________Kenneth A. Lawson
______________________________David C. Warner
______________________________James P. Wilson

EVALUATION OF FACTORS RELATED TO PRESCRIPTION DRUG
EXPENDITURES, PRESCRIBING TRENDS AND PHYSICIAN VISITS: THE
ROLE OF DIRECT-TO-CONSUMER ADVERTISING EXPENDITURES,
DEMOGRAPHICS, AND HEALTH INSURANCE COVERAGE
by
Radhika Anantharaman Nair, B.S.; M. S.
Dissertation
Presented to the Faculty of the Graduate School of
The University of Texas at Austin
In Partial Fulfillment
Of the Requirements
For the Degree of
Doctor of Philosophy
The University of Texas at Austin
May 2005

Dedication
This dissertation is dedicated to my Mother and my husband Vinod, who always believed
in me.

v
Acknowledgements
This dissertation and my graduate education would not have been possible
without the help and support of several individuals. I would like to thank Dr. Marv
Shepherd, my supervising professor, for his continued patience, support, and guidance. I
would also like to thank Drs. Jamie Barner and Ken Lawson for their support not only for
this project, but also during my graduate studies. I would like to express my gratitude to
my other committee members Drs. Jim Wilson and David Warner for generously serving
on my dissertation committee and providing invaluable feedback and suggestions.
I thank the faculty members and graduate students in the Department of Pharmacy
Administration for their friendship and support. I want to especially thank Mickie
Sheppard for her assistance through the years. A special thank you to my friends Anju,
Mohdhar, Qyunhchau, Gabor, Lonnie, Mohamed, and Homa for their support. I would
also like to thank Iris Jennings for her assistance. A very special thank you to my
husband for his love and support. I am grateful to my friends and family - Dad, Mom,
Venky, Rani, and Ruby for their love and support throughout the years. Lastly and most
importantly, thank you Lord for this accomplishment.

vi
EVALUATION OF FACTORS RELATED TO PRESCRIPTION DRUG
EXPENDITURES, PRESCRIBING TRENDS AND PHYSICIAN VISITS: THE
ROLE OF DIRECT-TO-CONSUMER ADVERTISING EXPENDITURES,
DEMOGRAPHICS, AND HEALTH INSURANCE COVERAGE
Publication No.________________
Radhika Anantharaman Nair, Ph.DThe University of Texas at Austin, 2005
Supervisor: Marvin D. Shepherd
This study evaluated the relationships of age, gender, health insurance coverage,
and DTCA expenditures, with physician visits for symptoms and/or conditions treated
with the five advertised drug classes (allergy medications, antilipemics, gastrointestinals,
antidepressants, antihypertensives) selected, number of prescriptions written and
expenditures for the selected advertised drugs from January 1994 to April 2001. The
study also evaluated the relationships of physician visits with number of prescriptions
written and expenditures for drugs from the five drug classes. All relationships were
compared prior to and following the relaxation of the broadcast advertising guidelines:
(a) January 1994 to August 1997; and (b) September 1997 to April 2001.
The data for the study were obtained from the following: (a) CMR for DTCA
expenditures; (b) NAMCS for age, gender, health insurance coverage, physician visits,
and prescriptions written; and (c) AWP and Novartis Pharmacy Benefit reports to

vii
estimate prices of the drugs. Time series analysis was used to determine the relationships
with the dependent variable physician visits. Mixed model analysis was used to evaluate
the relationships with prescriptions written and expenditures. To compare the
relationships, the datasets were split by time period and reanalyzed with time series or
mixed model analysis as appropriate.
Age had a negative relationship with the prescriptions written and expenditures
for gastrointestinals while older individuals had a positive relationship with the
prescriptions written and expenditures for antidepressants. Gender (women) was
positively related to prescriptions written and expenditures for allergy medications and
gastrointestinals. Health insurance coverage had a negative relationship with allergy-
related visits and prescriptions written and expenditures for antihypertensives. However,
health insurance coverage was positively related to prescriptions written for
antidepressants.
DTCA expenditures were positively related to the number of patients diagnosed
with hyperlipidemia and the prescriptions written and expenditures for allergy
medications, antilipemics, and gastrointestinals. DTCA expenditures were negatively
related to the prescriptions written and expenditures for antihypertensives. Only
physician visits were consistently related to prescriptions written and expenditures for all
drug classes for the entire time period and both time periods. The study results indicate
that different factors are related to physician visits, prescriptions written and their
expenditures for the different drug classes.

viii
TABLE OF CONTENTS
Page
LIST OF TABLES . . . . . . . . . . . . . . . . . xix
LIST OF FIGURES . . . . . . . . . . . . . . . . xxviii
CHAPTER 1: INTRODUCTION . . . . . . . . . . . . . . 1
Background . . . . . . . . . . . . . . . . . . . 1
Prescription Drug Expenditures. . . . . . . . . . . . . . 1
Reasons for Rising Prescription Drug Expenditures . . . . . . . 3
Direct-to-Consumer Advertising of Prescription Drugs . . . . . . 5
Direct-to-Consumer Advertising Expenditures . . . . . . . . 7
Access to Care (Healthcare Coverage) . . . . . . . . . . . 10
Demographics: Age and Gender . . . . . . . . . . . . 14
Physician Visits . . . . . . . . . . . . . . . . . 16
Utilization of Prescription Drugs . . . . . . . . . . . . 19
Purpose and Objectives of the Study . . . . . . . . . . . . . 22
CHAPTER 2: DIRECT-TO-CONSUMER ADVERTISING OF PRESCRIPTION DRUGS . . . . . . . . . . . . . . . . 24
Introduction . . . . . . . . . . . . . . . . . . . 24
Types of DTCA . . . . . . . . . . . . . . . . . 28
History of DTCA . . . . . . . . . . . . . . . . . 29
Early History . . . . . . . . . . . . . . . . . . 29
Moratorium and its Effects . . . . . . . . . . . . . . 32
In the 1990s . . . . . . . . . . . . . . . . . . 35
Issues in Support of DTCA . . . . . . . . . . . . . . . 36
Issues Opposed to DTCA . . . . . . . . . . . . . . . 40
Negative Effects of DTCA: Related to Physicians . . . . . . . . 42
Regulatory Issues for DTCA . . . . . . . . . . . . . . 44
Earlier Regulations . . . . . . . . . . . . . . . . 44

ix
Page
Regulatory Changes in 1997 and 1999 . . . . . . . . . . . 46
Other Regulatory Issues . . . . . . . . . . . . . . . 49
GAO Reports: Review of DTCA Literature, 1984-1990 . . . . . . . 51
DTCA and the Consumer . . . . . . . . . . . . . . . 53
Opinions of Consumers . . . . . . . . . . . . . . . 53
Attitudes and Awareness . . . . . . . . . . . . . . 54
Studies Conducted by the FDA . . . . . . . . . . . . . 60
Prevention Magazine Studies . . . . . . . . . . . . . 62
DTCA-Related Canadian Studies . . . . . . . . . . . . 65
Effects of DTCA: Interaction with Physician and Prescription Drug Requests . . . . . . . . . . . . . . 68
Effects of DTCA: Public Health . . . . . . . . . . . . . 78
Effects of DTCA: Adherence to Therapy . . . . . . . . . . . 79
Knowledge of Prescription Drug Information and Processing . . . . . 81
DTCA and Physicians . . . . . . . . . . . . . . . . 84
Opinion of Physicians . . . . . . . . . . . . . . . . 84
Effects of DTCA: Inappropriate Prescribing . . . . . . . . . . 91
DTCA and Pharmacists . . . . . . . . . . . . . . . . 93
Opinion of Pharmacists . . . . . . . . . . . . . . . 93
Other Empirical Research . . . . . . . . . . . . . . . 96
Types of Drugs Advertised . . . . . . . . . . . . . . 96
Claims in Advertisements: Types, Accuracy and Compliance with FDA Regulations . . . . . . . . . . . . . . . 97
Content Analysis . . . . . . . . . . . . . . . . . 99
Risk Information in Advertisements . . . . . . . . . . . . 102
Summary . . . . . . . . . . . . . . . . . . . 105

x
PageCHAPTER 3: LITERATURE REVIEW. . . . . . . . . . . . . 106
Prescription Drug Expenditures . . . . . . . . . . . . . . 106
DTCA Expenditures: Review of the Literature . . . . . . . . . . 108
GAO Report: Review of Studies from 1997 . . . . . . . . . . 108
DTCA Expenditures and Related Studies. . . . . . . . . . . 109
DTCA and Prescription Drug Expenditures . . . . . . . . . . 113
DTCA and Physician Visits . . . . . . . . . . . . . . 115
DTCA and Utilization of Prescription Drugs . . . . . . . . . . 117
DTCA Expenditures and its Impact on Sales and Market Share . . . . 121
Summary of the Literature . . . . . . . . . . . . . . . 126
Access to Care: Review of the Literature . . . . . . . . . . . 127
Access to Care and Prescription Drug Expenditures . . . . . . . . 127
Access to Care and Physician Visits . . . . . . . . . . . . 132
Access to Care and Utilization of Prescription Drugs . . . . . . . 135
Summary of the Literature . . . . . . . . . . . . . . . 140
Demographics: Age and Gender: Review of the Literature. . . . . . . 140
Demographics (Age and Gender) and Prescription Drug Expenditures . . . 140
Demographics (Age and Gender) and Physician Visits . . . . . . . 146
Demographics (Age and Gender) and Utilization of Prescription Drugs . . . 153
Summary of the Literature . . . . . . . . . . . . . . . 163
Utilization of Prescription Drugs: Review of the Literature . . . . . . 164
Utilization of Prescription Drugs and Physician Visits . . . . . . . 164
Summary of the Literature . . . . . . . . . . . . . . . 167
Physician Visits: Review of the Literature . . . . . . . . . . . 167
Physician Visits and Prescription Drug Expenditures . . . . . . . 167
Rationale for Study . . . . . . . . . . . . . . . . . 168

xi
PageCHAPTER 4: METHODOLOGY . . . . . . . . . . . . . . 172
Objectives and Hypotheses . . . . . . . . . . . . . . . 172
Allergy Medications. . . . . . . . . . . . . . . . . 172
Objective I. . . . . . . . . . . . . . . . . . . 172
Objective II . . . . . . . . . . . . . . . . . . 173
Objective III . . . . . . . . . . . . . . . . . . 174
Objective IV . . . . . . . . . . . . . . . . . . 175
Antilipemics. . . . . . . . . . . . . . . . . . . 175
Objective I. . . . . . . . . . . . . . . . . . . 175
Objective II . . . . . . . . . . . . . . . . . . 176
Objective III . . . . . . . . . . . . . . . . . . 177
Objective IV . . . . . . . . . . . . . . . . . . 178
Gastrointestinals. . . . . . . . . . . . . . . . . . 179
Objective I. . . . . . . . . . . . . . . . . . . 179
Objective II . . . . . . . . . . . . . . . . . . 179
Objective III . . . . . . . . . . . . . . . . . . 180
Objective IV . . . . . . . . . . . . . . . . . . 181
Antidepressants . . . . . . . . . . . . . . . . . . 182
Objective I. . . . . . . . . . . . . . . . . . . 182
Objective II . . . . . . . . . . . . . . . . . . 182
Objective III . . . . . . . . . . . . . . . . . . 183
Objective IV . . . . . . . . . . . . . . . . . . 184
Antihypertensives . . . . . . . . . . . . . . . . . 185
Objective I. . . . . . . . . . . . . . . . . . . 185
Objective II . . . . . . . . . . . . . . . . . . 185
Objective III . . . . . . . . . . . . . . . . . . 186
Objective IV . . . . . . . . . . . . . . . . . . 187
Data Sources . . . . . . . . . . . . . . . . . . . 188

xii
Page
Databases . . . . . . . . . . . . . . . . . . . . 188
Competitive Media Reporting (CMR) . . . . . . . . . . . 188
Data Collection Methodology . . . . . . . . . . . . . 189
Cost Collection Methodology . . . . . . . . . . . . . 192
National Ambulatory Medical Care Survey (NAMCS) . . . . . . . 195
Scope of Survey and Sample Design . . . . . . . . . . . 195
Data Collection Procedures and Processing . . . . . . . . . 196
Estimation Procedures . . . . . . . . . . . . . . . 198
Prescription Drug Expenditures . . . . . . . . . . . . . 199
Study Design . . . . . . . . . . . . . . . . . . . 200
DTCA Expenditures . . . . . . . . . . . . . . . . 201
Access to Care (Health Insurance Coverage). . . . . . . . . . . 203
Demographics: Age and Gender . . . . . . . . . . . . . 204
Prescription Drug Expenditures. . . . . . . . . . . . . . 206
Number of Prescriptions Written for Advertised Drugs . . . . . . . 208
Physician Visits . . . . . . . . . . . . . . . . . . 208
Data Analysis . . . . . . . . . . . . . . . . . . . 213
Time Series Analyses . . . . . . . . . . . . . . . . 214
Mixed Model Analyses . . . . . . . . . . . . . . . . 217
CHAPTER 5: RESULTS . . . . . . . . . . . . . . . . 223
Section I: Trends in DTCA Expenditures. . . . . . . . . . . . 223
Section II: Descriptive Analyses . . . . . . . . . . . . . . 229
Allergy Medications. . . . . . . . . . . . . . . . . 230
DTCA Expenditures . . . . . . . . . . . . . . . . 230
Allergy-Related Visits and Prescriptions Written for Allergy Medications . . . . . . . . . . . . . . . 233
Demographic Characteristics (Age, Gender) and Health Insurance Coverage . . . . . . . . . 238

xiii
Page
Prescription Drug Expenditures . . . . . . . . . . . . 240
Antilipemics. . . . . . . . . . . . . . . . . . . 242
DTCA Expenditures . . . . . . . . . . . . . . . . 242
Lipid-Related Visits and Prescriptions Written for Antilipemics. . . . . 246
Demographic Characteristics (Age, Gender) and Health Insurance Coverage . . . . . . . . . 250
Prescription Drug Expenditures . . . . . . . . . . . . . 253
Gastrointestinals. . . . . . . . . . . . . . . . . . 255
DTCA Expenditures . . . . . . . . . . . . . . . . 255
Gastrointestinal-Related Visits and Prescriptions Written for Gastrointestinals . . . . . . . . . . . . . . 259
Demographic Characteristics (Age, Gender) and Health Insurance Coverage . . . . . . . . . 264
Prescription Drug Expenditures . . . . . . . . . . . . . 266
Antidepressants . . . . . . . . . . . . . . . . . . 269
DTCA Expenditures . . . . . . . . . . . . . . . . 269
Depression-Related Visits and Prescriptions Written for Antidepressants . . . . . . . . . . . . . . 270
Demographic Characteristics (Age, Gender) and Health Insurance Coverage . . . . . . . . . 274
Prescription Drug Expenditures . . . . . . . . . . . . . 276
Antihypertensives . . . . . . . . . . . . . . . . . 279
DTCA Expenditures . . . . . . . . . . . . . . . . 279
Hypertension-Related Visits and PrescriptionsWritten for Antihypertensives. . . . . . . . . . . . . . 281
Demographic Characteristics (Age, Gender) and Health Insurance Coverage . . . . . . . . . 285
Prescription Drug Expenditures . . . . . . . . . . . . . 288
Section III: Time Series and Mixed Model Analyses. . . . . . . . . 290
Allergy Medications. . . . . . . . . . . . . . . . . 293
Objective I . . . . . . . . . . . . . . . . . . 294

xiv
Page
Time Series Analysis: January 1994 Through April 2001 . . . . . . 294
Time Series Analyses: Split by Time (Objective IV) . . . . . . . 296
Objective II . . . . . . . . . . . . . . . . . . 298
Mixed Model Analysis with Transformed Variables . . . . . . . 299
Mixed Model Analysis with Untransformed Variables . . . . . . . 301
Mixed Model Analyses with Transformed Variables: Split by Time (Objective IV) . . . . . . . . . . . . . 303
Objective III . . . . . . . . . . . . . . . . . . 305
Mixed Model Analysis with Transformed Variables . . . . . . . 306
Mixed Model Analysis with Untransformed Variables . . . . . . . 307
Mixed Model Analyses with Transformed Variables: Split by Time (Objective IV) . . . . . . . . . . . . . 309
Antilipemics. . . . . . . . . . . . . . . . . . . 311
Objective I. . . . . . . . . . . . . . . . . . . 312
Time Series Analysis: January 1994 Through April 2001 . . . . . . 312
Time Series Analyses: Split by Time (Objective IV) . . . . . . . 314
Objective II . . . . . . . . . . . . . . . . . . 316
Mixed Model Analysis with Transformed Variables . . . . . . . 317
Mixed Model Analysis with Untransformed Variables . . . . . . . 318
Mixed Model Analyses with Transformed Variables: Split by Time (Objective IV) . . . . . . . . . . . . . 320
Objective III . . . . . . . . . . . . . . . . . . 321
Mixed Model Analysis with Transformed Variables . . . . . . . 322
Mixed Model Analysis with Untransformed Variables . . . . . . . 324
Mixed Model Analyses with Transformed Variables: Split by Time (Objective IV) . . . . . . . . . . . . . 325
Gastrointestinals. . . . . . . . . . . . . . . . . . 327
Objective I. . . . . . . . . . . . . . . . . . . 327
Time Series Analysis: January 1994 Through April 2001 . . . . . . 328
Time Series Analyses: Split by Time (Objective IV) . . . . . . . 329

xv
Page
Objective II . . . . . . . . . . . . . . . . . . 331
Mixed Model Analysis with Transformed Variables . . . . . . . 332
Mixed Model Analysis with Untransformed Variables . . . . . . . 334
Supplemental Mixed Model Analysis for Age . . . . . . . . . 336
Mixed Model Analyses with Transformed Variables: Split by Time (Objective IV) . . . . . . . . . . . . . 339
Supplemental Analysis for Age . . . . . . . . . . . . 340
Objective III . . . . . . . . . . . . . . . . . . 343
Mixed Model Analysis with Transformed Variables . . . . . . . 343
Mixed Model Analysis with Untransformed Variables . . . . . . . 345
Mixed Model Analysis with Transformed Variables: Excluding Visit Variable . . . . . . . . . . . . . . 347
Supplemental Analysis for Age . . . . . . . . . . . . . 348
Excluding Visit Variable . . . . . . . . . . . . . . 351
Mixed Model Analyses with Transformed Variables: Split by Time (Objective IV) . . . . . . . . . . . . . 354
Supplemental Analysis for Age . . . . . . . . . . . . 356
Antidepressants . . . . . . . . . . . . . . . . . . 358
Objective I. . . . . . . . . . . . . . . . . . . 358
Time Series Analysis: January 1994 Through April 2001 . . . . . . 359
Time Series Analyses: Split by Time (Objective IV) . . . . . . . 360
Supplemental Analysis for Age . . . . . . . . . . . . 361
Objective II . . . . . . . . . . . . . . . . . . 364
Mixed Model Analysis with Transformed Variables . . . . . . . 365
Mixed Model Analysis with Untransformed Variables . . . . . . . 366
Supplemental Mixed Model Analysis for Age . . . . . . . . . 368
Mixed Model Analyses with Transformed Variables: Split by Time (Objective IV) . . . . . . . . . . . . . 371
Supplemental Analysis for Age . . . . . . . . . . . . 373
Objective III . . . . . . . . . . . . . . . . . . 375

xvi
Page
Mixed Model Analysis with Transformed Variables . . . . . . . 375
Mixed Model Analysis with Untransformed Variables . . . . . . . 378
Supplemental Mixed Model Analysis for Age. . . . . . . . . . 379
Mixed Model Analyses with Transformed Variables: Split by Time (Objective IV) . . . . . . . . . . . . . 383
Supplemental Analysis for Age . . . . . . . . . . . . 384
Antihypertensives. . . . . . . . . . . . . . . . . . 386
Objective I. . . . . . . . . . . . . . . . . . . 386
Time Series Analysis: January 1994 Through April 2001 . . . . . . 387
Time Series Analyses: Split by Time (Objective IV) . . . . . . . 388
Objective II . . . . . . . . . . . . . . . . . . 390
Mixed Model Analysis with Transformed Variables . . . . . . . 390
Mixed Model Analysis with Untransformed Variables . . . . . . . 392
Mixed Model Analyses with Transformed Variables: Split by Time (Objective IV) . . . . . . . . . . . . . 394
Objective III . . . . . . . . . . . . . . . . . . 396
Mixed Model Analysis with Transformed Variables . . . . . . . 397
Mixed Model Analysis with Untransformed Variables . . . . . . . 399
Mixed Model Analyses with Transformed Variables: Split by Time (Objective IV) . . . . . . . . . . . . . 401
CHAPTER 6: DISCUSSION AND CONCLUSION. . . . . . . . . . . 404
Section I: Limitations . . . . . . . . . . . . . . . . . 404
Data Sources: CMR, NAMCS, and AWP . . . . . . . . . . . 404
Therapeutic Drug Classes . . . . . . . . . . . . . . . 406
Study Variables . . . . . . . . . . . . . . . . . . 406
Study Design . . . . . . . . . . . . . . . . . . 409
Section II: Discussion and Conclusion . . . . . . . . . . . . 412
Objective I. . . . . . . . . . . . . . . . . . . . 412

xvii
Page
DTCA Expenditures . . . . . . . . . . . . . . . . 416
Access to Care (Health Insurance Coverage) . . . . . . . . . . 418
Demographics: Age . . . . . . . . . . . . . . . . 421
Time . . . . . . . . . . . . . . . . . . . . 423
Objective II . . . . . . . . . . . . . . . . . . . 423
DTCA Expenditures . . . . . . . . . . . . . . . . 428
Access to Care (Health Insurance Coverage) . . . . . . . . . . 433
Demographics: Age . . . . . . . . . . . . . . . 437
Demographics: Gender . . . . . . . . . . . . . . . 441
Physician Visits . . . . . . . . . . . . . . . . . 444
Objective III . . . . . . . . . . . . . . . . . . . 446
DTCA Expenditures . . . . . . . . . . . . . . . . 451
Access to Care (Health Insurance Coverage) . . . . . . . . . . 455
Demographics: Age . . . . . . . . . . . . . . . . 458
Demographics: Gender . . . . . . . . . . . . . . . 463
Physician Visits . . . . . . . . . . . . . . . . . 467
Time . . . . . . . . . . . . . . . . . . . . 467
Conclusion . . . . . . . . . . . . . . . . . . . . 468
Section III: Suggestions for Future Research . . . . . . . . . . . 471
APPENDIX A
Glossary of Acronyms . . . . . . . . . . . . . . . . . 474
APPENDIX B
Average Wholesale Price for Selected Allergy Medications, Antilipemics, Gastrointestinals, Antidepressants, and Antihypertensives . . . . . . . 476
APPENDIX C
DTCA Expenditures for Allergy Medications . . . . . . . . . . 478

xviii
Page
APPENDIX D
Tables for Number and Percentage of Prescriptions Written for Advertised Drugs from the Five Drug Classes: Allergy Medications, Antilipemics, Gastrointestinal Drugs, Antidepressants, and Antihypertensives . . . . . . 480
APPENDIX E
Tables for Percentage of Women Among those who Received Prescriptions for Advertised Allergy Medications, Antilipemics, Gastrointestinals, Antidepressants and Antihypertensives, 1994-2001 . . . . . . . . . 484
APPENDIX F
Tables for Percentage of Individuals with Health Insurance Coverage Among those who Received Prescriptions for Advertised Allergy Medications, Antilipemics, Gastrointestinals, Antidepressants and Antihypertensives, 1994-2001 . . . . . . . . . . . . . . . . . . 487
APPENDIX G
Tables for Number And Percentage Of Prescriptions Written For Advertised Allergy Medications, Antilipemics, Gastrointestinals, Antidepressants and Antihypertensives by Patient Age Group (Less than 45 Years, 45 Years and Older), 1994-2001 . . . . . . . . . . . . . . 490
APPENDIX H
Figures for Percentage of Prescriptions Written for Advertised Allergy Medications, Antilipemics, Gastrointestinals, Antidepressants, and Antihypertensives by Patient Age Group, (Less than 25 Years, 25-44 Years, 45-64 Years, 65-74 Years, 75 Years and Older), 1994-2001 . . . . . . . 497
APPENDIX I
Tables for Total Prescription Drug Expenditures for Advertised Allergy Medications, Antilipemics, Gastrointestinals, Antidepressants, and Antihypertensives, 1994 to 2001 . . . . . . . . . . . . . . 501
BIBLIOGRAPHY . . . . . . . . . . . . . . . . . . 505
VITA . . . . . . . . . . . . . . . . . . . . . 532

xix
LIST OF TABLES Page
Table 2.1: Regulatory Requirements and the Explanations for Print and Broadcast Product-Specific Advertisements . . . . . 47
Table 2.2: Prevention Magazine Survey Results Summarized, 1997-2002 . . 63
Table 4.1: Advertised Drugs Selected from the Five Drug Classes - Allergy Medications, Antilipemics, Gastrointestinals, Antidepressants, and Antihypertensives . . . . . . . . . . . . . 201
Table 4.2: United States City Average Consumer Price Index and Annual Percent Change in Price Index for Prescription Drugs and Medical Supplies and the Average Dispensing Fees . . . . . . . 207
Table 4.3: Example Dataset for Time Series Analysis for Dependent Variable Physician Visit . . . . . . . . . . . . 216
Table 4.4: Example Dataset for the Mixed Model Analysis . . . . . . 220
Table 5.1: DTCA Expenditures (in millions) by Advertisement Type and Media Outlet, 1994-2001 . . . . . . . . . . . . 225
Table 5.2: Proportion and Percent Change in Total DTCA Expenditures and Product-Specific DTCA Expenditures by Media Outlet, 1994-2001 . . . . . . . . . . . 226
Table 5.3: DTCA Expenditures by Media Outlet and Total DTCA Expenditures for Allergy Medications, Antilipemics, Gastrointestinals, Antidepressants and Antihypertensives from 1994 through 2001 . . . . . . . . . . . . 229
Table 5.4: Number and Percentage of Allergy-Related Physician Visits and/or Visits when at Least One Advertised Allergy Medication was Prescribed, 1994-2001 . . . . . . . . 236
Table 5.5: Total DTCA Expenditures (in millions) for Antilipemics, 1994-2001 . . . . . . . . . . . . . . . . 246
Table 5.6: Number and Percentage of Lipid-Related Physician Visits and/or Visits when at Least One Advertised Antilipemic Drug was Prescribed, 1994-2001 . . . . . . . . . . 249
Table 5.7: Total DTCA Expenditures (in millions) for Gastrointestinals, 1994-2001 . . . . . . . . . . . . . . . . 258
Table 5.8: Number and Percentage of Gastrointestinal-Related Physician Visits and/or Visits when at Least One AdvertisedGastrointestinal Drug was Prescribed, 1994-2001 . . . . . . 262
Table 5.9: Total DTCA Expenditures (in millions) for Antidepressants, 1994-2001. . . . . . . . . . . . 270

xx
PageTable 5.10: Number and Percentage of Depression-Related Visits
and/or Visits when at Least One Advertised Antidepressant was Prescribed, 1994-2001 . . . . . . . . . . . . 273
Table 5.11: Total DTCA Expenditures (in millions) for Antihypertensive Drugs, 1994-2001 . . . . . . . . . . . . . . 281
Table 5.12: Number and Percentage of Hypertension-Related Visits and/or Visits when at Least One Advertised Antihypertensive Drug was Prescribed, 1994-2001 . . . . . . . . . . 284
Table 5.13: Test Statistics for Ordinary Least Squares Analysis for Allergy-Related Physician Visits Regressed on Age, Gender, Access, Total DTCA Expenditures for Allergy Medications and Time Period. . . . . . . . . . . . . . . 296
Table 5.14: Test Statistics for Ordinary Least Squares Analyses for Allergy-Related Physician Visits Regressed on Age, Gender, Access, and Total DTCA Expenditures for Allergy Medications for the Two Time Periods (Transformed Variables). . . . . . 297
Table 5.15: Mixed Model Analysis for Prescriptions Written for Advertised Allergy Medications Controlling for Age, Gender, Access, DTCA Expenditures for Allergy Medications, Allergy-Related Physician Visits and Time (Transformed Variables) . . . . . 300
Table 5.16: Untransformed Mixed Model Analysis for Prescriptions Written for Advertised Allergy Medications Controlling for Age, Gender, Access, DTCA Expenditures for Allergy Medications, Allergy-Related Physician Visits and Time . . . . 302
Table 5.17: Mixed Model Analyses for Prescriptions Written for Advertised Allergy Medications Controlling for Age, Gender, Access, DTCA Expenditures For Allergy Medications, and Allergy-Related Physician Visits for the Two Time Periods (Transformed Variables) . . . . . . . . . . . . 304
Table 5.18: Mixed Model Analysis for Prescription Drug Expenditures for Advertised Allergy Medications Controlling for Age, Gender, Access, DTCA Expenditures for Allergy Medications, Allergy-Related Physician Visits and Time (Transformed Variables) . . . . . . 307
Table 5.19: Untransformed Mixed Model Analysis for Prescription Drug Expenditures for Advertised Allergy Medications Controlling for Age, Gender, Access, DTCA Expenditures for Allergy Medications, Allergy-Related Physician Visits and Time . . . . 309

xxi
PageTable 5.20: Mixed Model Analyses for Prescription Drug Expenditures
for Advertised Allergy Medications Controlling for Age, Gender, Access, DTCA Expenditures for Allergy Medications and Allergy-Related Physician Visits for the Two Time Periods (Transformed Variables) . . . . . . . . . . . . 310
Table 5.21: Test Statistics for Ordinary Least Squares Analysis for Lipid-Related Physician Visits Regressed on Age, Gender, Access, Total DTCA Expenditures for Antilipemics and Time Period (Transformed Variables) . . . . . . . . . 313
Table 5.22: Test Statistics for Ordinary Least Squares Analysis with Untransformed Values for Lipid-Related Physician Visits Regressed on Age, Gender, Access, Total DTCA Expenditures for Antilipemics and Time Period. . . . . . . . . . . . 314
Table 5.23: Test Statistics for Ordinary Least Squares Analyses of Lipid-Related Physician Visits Regressed on Age, Gender, Access, and Total DTCA Expenditures for Antilipemics for the Two Time Periods (Transformed Variables) . . . . . 315
Table 5.24: Mixed Model Analysis for Prescriptions Written for Advertised Antilipemics Controlling for Age, Gender, Access, DTCA Expenditures for Antilipemics, Lipid-Related Physician Visits, and Time Period (Transformed Variables) . . . . . . . . 317
Table 5.25: Untransformed Mixed Model Analysis for Prescriptions Written for Advertised Antilipemics Controlling for Age, Gender, Access, DTCA Expenditures for Antilipemics, Lipid-Related Physician Visits, and Time Period . . . . . . . . . . 319
Table 5.26: Mixed Model Analyses for Prescriptions Written for Advertised Antilipemics Controlling for Age, Gender, Access, DTCA Expenditures for Antilipemics and Lipid-Related Physician Visits for the Two Time Periods (Transformed Variables) . . . . 320
Table 5.27: Mixed Model Analysis for Prescription Drug Expenditures for Advertised Antilipemics Controlling for Age, Gender, Access, DTCA Expenditures for Antilipemics, Lipid-Related Physician Visits, and Time Period (Transformed variables) . . . 323
Table 5.28: Untransformed Mixed Model Analysis for Prescription Drug Expenditures for Advertised Antilipemics Controlling for Age, Gender, Access, DTCA Expenditures for Antilipemics, Lipid-Related Physician Visits, and Time Period . . . . . . . . . . 325

xxii
Page
Table 5.29: Mixed Model Analyses for Prescription Drug Expenditures for Advertised Antilipemics Controlling for Age, Gender, Access, DTCA Expenditures for Antilipemics, and Lipid-Related Physician Visits for the Two Time Periods (Transformed Variables) . . . . . . . . . . . . 326
Table 5.30: Test Statistics for Ordinary Least Squares Analysis of Gastrointestinal-Related Physician Visits Regressed on Age, Gender, Access, Total DTCA Expenditures for Gastrointestinal Drugs and Time Period . . . . . . . . 329
Table 5.31: Test Statistics for Ordinary Least Squares Analyses of Gastrointestinal-Related Physician Visits Regressed on Age, Gender, Access, and Total DTCA Expenditures for Gastrointestinal Drugs for the Two Time Periods . . . . . . 330
Table 5.32: Mixed Model Analysis for Prescriptions Written for Advertised Gastrointestinal Drugs Controlling for Age, Gender, Access, DTCA Expenditures for Gastrointestinals, Gastrointestinal-Related Visits and Time Period (Transformed Variables) . . . . . . . . . . . . 333
Table 5.33: Untransformed Mixed Model Analysis for Prescriptions Written for Advertised Gastrointestinal Drugs Controlling for Age, Gender, Access, DTCA Expenditures for Gastrointestinals, Gastrointestinal-Related Visits and Time Period . . . . . 335
Table 5.34: Mixed Model Analysis for Prescriptions Written for Advertised Gastrointestinal Drugs Controlling for Multiple Age Categories, Gender, Access, DTCA Expenditures for Gastrointestinals, Gastrointestinal-Related Visits and Time Period (Transformed Variables) . . . . . . . . . . . . 337
Table 5.35: Untransformed Mixed Model Analysis for Prescriptions Written for Advertised Gastrointestinal Drugs Controlling for Multiple Age Categories, Gender, Access, DTCA Expenditures for Gastrointestinals, Gastrointestinal-Related Visits and Time Period . . . . . . 338
Table 5.36: Mixed Model Analyses for Prescriptions Written for Advertised Gastrointestinal Drugs Controlling for Age, Gender, Access, DTCA Expenditures for Gastrointestinal Drugs, and Gastrointestinal-Related Physician Visits for the TwoTime Periods (Transformed Variables) . . . . . . . . . 340

xxiii
Page
Table 5.37: Mixed Model Analyses for Prescriptions Written for Advertised Gastrointestinal Drugs Controlling for Multiple Age Categories, Gender, Access, DTCA Expenditures for Gastrointestinal Drugs, and Gastrointestinal-Related Physician Visits for the Two Time Periods (Transformed Variables) . . . . . . . . . . 342
Table 5.38: Mixed Model Analysis for Prescription Drug Expenditures for Advertised Gastrointestinal Drugs Controlling for Age, Gender, Access, DTCA Expenditures for Gastrointestinal Drugs, Gastrointestinal-Related Visits and Time Period (Transformed variables). . . . . . . . . . . . . 344
Table 5.39: Untransformed Mixed Model Analysis for Prescription Drug Expenditures for Advertised Gastrointestinal Drugs Controlling for Age, Gender, Access, DTCA Expenditures for Gastrointestinal Drugs, Gastrointestinal-Related Visits and Time Period . . . . 346
Table 5.40: Mixed Model Analysis for Prescriptions Drug Expenditures for Advertised Gastrointestinal Drugs Controlling for Age, Gender, Access, DTCA Expenditures for Gastrointestinals, and Time Period (Transformed Variables) . . . . . . . . 348
Table 5.41: Mixed Model Analysis for Prescription Drug Expenditures for Advertised Gastrointestinal Drugs Controlling for Multiple Age Categories, Gender, Access, DTCA Expenditures for Gastrointestinal Drugs, Gastrointestinal-Related Visits, and Time Period (Transformed Variables) . . . . . . . . . . . . 349
Table 5.42: Untransformed Mixed Model Analysis for Prescription Drug Expenditures for Advertised Gastrointestinal Drugs Controlling for Multiple Age Categories, Gender, Access, DTCA Expenditures for Gastrointestinal Drugs, Gastrointestinal-Related Visits, and Time Period . . . . . . . . . . . . . . . . 351
Table 5.43: Mixed Model Analysis for Prescription Drug Expenditures for Advertised Gastrointestinal Drugs Controlling for Multiple Age Categories, Gender, Access, DTCA Expenditures for Gastrointestinal Drugs, and Time Period (Transformed Variables) . . . . . . 352
Table 5.44: Untransformed Mixed Model Analysis for Prescription Drug Expenditures for Advertised Gastrointestinal Drugs Controlling for Multiple Age Categories, Gender, Access, DTCA Expenditures for Gastrointestinal Drugs, and Time Period . . . . . . . . 354

xxiv
Page
Table 5.45: Mixed Model Analyses for Prescription Drug Expenditures for Advertised Gastrointestinal Drugs Controlling for Age, Gender, Access, DTCA Expenditures for Gastrointestinal Drugs, and Gastrointestinal-Related Physician Visits for the Two Time Periods (Transformed Variables) . . . . . . . . . . 355
Table 5.46: Mixed Model Analyses for Prescription Drug Expenditures for Advertised Gastrointestinal Drugs Controlling for Multiple Age Categories, Gender, Access, DTCA Expenditures for Gastrointestinal Drugs, and Gastrointestinal-Related Physician Visits for the Two Time Periods (Transformed Variables) . . . . . . . 357
Table 5.47: Test Statistics for Ordinary Least Squares Analysis of Depression-Related Physician Visits Regressed on Age, Gender, Access, Total DTCA Expenditures for Antidepressants and Time Period . . 359
Table 5.48: Test Statistics for Ordinary Least Squares Analyses of Depression-Related Physician Visits Regressed on Age, Gender, Access, and Total DTCA Expenditures for Antidepressants for the Two Time Periods . . . . . . . . . . . . . . 361
Table 5.49: Test Statistics for Ordinary Least Squares Analyses of Depression-Related Physician Visits Regressed on Multiple Age Categories, Gender, Access, and Total DTCA Expenditures for Antidepressants for Two Time Periods (Transformed Variables) . . . . . . 363
Table 5.50: Mixed Model Analysis for Prescriptions Written for Advertised Antidepressants Controlling for Age, Gender, Access, DTCA Expenditures for Antidepressants, Depression-Related Physician Visits, and Time Period (Transformed Variables) . . . 366
Table 5.51: Untransformed Mixed Model Analysis for Prescriptions Written for Advertised Antidepressants Controlling for Age, Gender, Access, DTCA Expenditures for Antidepressants, Depression-Related Physician Visits, and Time Period . . . . . . . . . . 367
Table 5.52: Mixed Model Analysis for Prescriptions Written for Advertised Antidepressants Controlling for Multiple Age Categories, Gender, Access, DTCA Expenditures for Antidepressants, Depression-Related Visits and Time Period (Transformed variables) . . . . . . 369
Table 5.53: Untransformed Mixed Model Analysis for Prescriptions Written for Advertised Antidepressants Controlling for Multiple Age Categories, Gender, Access, DTCA Expenditures for Antidepressants, Depression-Related Visits and Time Period . . . . . . . . 370

xxv
Page
Table 5.54: Mixed Model Analyses for Prescriptions Written for Advertised Antidepressants Controlling for Age, Gender, Access, DTCA Expenditures for Antidepressants and Depression-Related Physician Visits For Both Time Periods (Transformed Variables) . . . . 372
Table 5.55: Mixed Model Analyses for Prescriptions Written for Advertised Antidepressants Controlling for Multiple Age Categories, Gender, Access, DTCA Expenditures for Antidepressants, and Depression-Related Physician Visits for the Two Time Periods (Transformed Variables) . . . . . . . . . . . . 374
Table 5.56: Mixed Model Analysis for Prescription Drug Expenditures for Advertised Antidepressants Controlling for Age, Gender, Access DTCA Expenditures for Antidepressants, Depression-Related Physician Visits, and Time Period (Transformed Variables) . . . 377
Table 5.57: Untransformed Mixed Model Analysis for Prescription Drug Expenditures for Advertised Antidepressants Controlling for Age, Gender, Access, DTCA Expenditures for Antidepressants, Depression-Related Physician Visits, and Time Period . . . . . . . . 378
Table 5.58: Mixed Model Analysis for Prescription Drug Expenditures for Advertised Antidepressants Controlling for Multiple Age Categories, Gender, Access, DTCA Expenditures for Antidepressants, Depression-Related Visits and Time Period (Transformed Variables) . . . . 380
Table 5.59: Untransformed Mixed Model Analysis for Prescription Drug Expenditures for Advertised Antidepressants Controlling for Multiple Age Categories, Gender, Access, DTCA Expenditures for Antidepressants, Depression-Related Visits and Time Period . . . 382
Table 5.60: Mixed Model Analyses for Prescription Drug Expenditures for Advertised Antidepressants Controlling for Age, Gender, Access, DTCA Expenditures for Antidepressants, and Depression-Related Physician Visits for the Two Time Periods (Transformed Variables) . . . . . . . . . 383
Table 5.61: Mixed Model Analyses for Prescription Drug Expenditures for Advertised Antidepressants Controlling for Multiple Age Categories, Gender, Access, DTCA Expenditures for Antidepressants, and Depression-Related Physician Visits for the Two Time Periods (Transformed Variables) . . . . . . . . . . . . 385
Table 5.62: Test Statistics for Ordinary Least Squares Analysis of Hypertension-Related Physician Visits Regressed on Age, Gender, Access, Total DTCA Expenditures for Antihypertensives and Time Period. . . . . . . . . . . . . . . 388

xxvi
Page
Table 5.63: Test Statistics for Ordinary Least Squares Analyses of Hypertension-Related Physician Visits Regressed on Age, Gender, Access, and Total DTCA Expenditures for Antihypertensives for the Two Time Periods . . . . . . . 389
Table 5.64: Mixed Model Analysis for Prescriptions Written for Advertised Antihypertensives Controlling for Age, Gender, Access, DTCA Expenditures for Antihypertensives, Hypertension-Related Physician Visits, and Time Period (Transformed Variables) . . . 391
Table 5.65: Untransformed Mixed Model Analysis for Prescriptions Written for Advertised Antihypertensives Controlling for Age, Gender, Access, DTCA Expenditures for Antihypertensives, Hypertension-Related Physician Visits, and Time Period . . . . . . . 394
Table 5.66: Mixed Model Analyses for Prescriptions Written for Advertised Antihypertensives Controlling for Age, Gender, Access, DTCA Expenditures for Antihypertensives, and Hypertension-Related Physician Visits for the Two Time Periods (Transformed Variables) . 395
Table 5.67: Mixed Model Analysis for Prescription Drug Expenditures for Advertised Antihypertensives Controlling for Age, Gender, Access, DTCA Expenditures for Antihypertensives, Hypertension-Related Physician Visits, and Time Period (Transformed Variables) . . . 398
Table 5.68: Untransformed Mixed Model Analysis for Prescription Drug Expenditures for Advertised Antihypertensives Controlling for Age, Gender, Access, DTCA Expenditures for Antihypertensives, Hypertension-Related Physician Visits, and Time Period . . . . 400
Table 5.69: Mixed Model Analyses for Prescription Drug Expenditures for Advertised Antihypertensives Controlling for Age, Gender, Access, DTCA Expenditures for Antihypertensives, Hypertension-Related Physician Visits For Both Time Periods (Transformed Variables) . . 402
Table 6.1: Results for Hypotheses Tests for Objective I . . . . . . . 413
Table 6.2: Results for Hypotheses Tests for Objective IV for Physician Visits . . . . . . . . . . . . . . . 414
Table 6.3: Significant Variables for Objective I for Dependent Variable Frequency of Allergy-Related, Lipid-Related, Gastrointestinal-Related, Depression-Related and Hypertension-Related Visits. . . 415
Table 6.4: Significant Variables for the Two Time Periods for the Dependent Variable Frequency of Allergy-Related, Lipid-Related, Gastrointestinal-Related, Depression-Related and Hypertension-Related Visits (Objective IV). . . . . . . . . . . . 415

xxvii
Page
Table 6.5: Results for Hypotheses Tests for Objective II . . . . . . . 424
Table 6.6: Results for Hypotheses Tests for Objective IV for Number of Prescriptions Written . . . . . . . . . . . . . 426
Table 6.7: Significant Variables for Objective II for Dependent Variable Number of Prescriptions Written for Allergy Medications, Antilipemics, Gastrointestinals, Antidepressants and Antihypertensives . . . . . . . . . . . . . . 427
Table 6.8: Significant Variables for the Two Time Periods for Dependent Variable Number of Prescriptions Written for Allergy Medications, Antilipemics, Gastrointestinals, Antidepressants and Antihypertensives (Objective IV). . . . . 428
Table 6.9: Results of Hypotheses Tests for Objective III . . . . . . . 446
Table 6.10: Results for Hypotheses Tests for Objective IV for Prescription Drug Expenditures. . . . . . . . . . . 448
Table 6.11: Significant Variables for Objective III for Dependent Variable Prescription Drug Expenditures for Allergy Medications, Antilipemics, Gastrointestinals, Antidepressants, and Antihypertensives. . . . . . . . . 449
Table 6.12: Significant Variables for the Two Time Periods for Dependent Variable Prescription Drug Expenditures for Allergy Medication, Antilipemics, Gastrointestinals, Antidepressants and Antihypertensives (Objective IV) . . . . . . . . . . 450

xxviii
LIST OF FIGURES Page
Figure 1.1: Trends and Projections of National Healthcare Expenditures, Prescription Drug Expenditures, and Prescription Drug Expenditures as a Percentage of National Healthcare Expenditures, 1980-2012.. . 2
Figure 1.2: Annual Percent Change in Prescription Drug
Expenditures, 1990 – 2001. . . . . . . . . . . . . 3
Figure 1.3: Annual Total Promotional Expenditures, DTCA Expenditures, and
DTCA Expenditures as a Percentage of Total Promotional
Expenditures for Prescription Drugs, 1994-2001 . . . . . . 7
Figure 1.4: Annual Direct-To-Consumer Advertising Expenditures for Prescription Drugs by Promotion Media, 1994-2000 . . . . . 9
Figure1.5: Trends in the Proportion of Prescription Drug Expenditures by Private Insurance, Out-of-Pocket, and Government Programs, 1990-2001. . 11
Figure 1.6: Prescription Drug Expenditures by Source of Payment, 1990-2001. . 12
Figure 1.7: Number of Physician Visits Per 1,000 of the Population,
1985-1998 . . . . . . . . . . . . . . . . 18
Figure 1.8: Average Annual Percentage Change in Factors Accounting for Growth in Prescription Drug Expenditures Per Capita: 1980-2011 . . . . 20
Figure 1.9: Number of Prescriptions Dispensed Per Capita and Percent
Change in Number of Prescriptions Dispensed, 1993-2001 . . . 21
Figure 3.1: Change in Prescription Volume and DTCA Expenditures
for High Growth Prescription Drugs, 1999-2000 . . . . . . 122
Figure 4.1: Conceptual Model . . . . . . . . . . . . . . 202
Figure 4.2: Outline for Time Series Analysis . . . . . . . . . . 217
Figure 4.3: Outline for Mixed Model Analysis . . . . . . . . . . 222
Figure 5.1: Trends in DTCA Expenditures by Type of Advertisement, 1994-2001 . . . . . . . . . . . . . . . . 224
Figure 5.2: Trends in DTCA Expenditures for Television/Radio and Print and Other Media 1994-2001 . . . . . . . . . . . 227
Figure 5.3: DTCA Expenditures for Product-Specific (Prescription Drugs) Advertising for Television/Radio and Print and Other Media, 1994-2001 . . . . . . . . . . . . . . 228

xxix
Page
Figure 5.4: Trends in Total DTCA Expenditures and DTCA Expenditures by Media Outlet for Allergy Medications, 1994-2001 . . . . . 231
Figure 5.5: Trend in DTCA Expenditures for Allergy Medications by Media Outlet from June 1997 through November 1997 . . . . 232
Figure 5.6: Trends in DTCA Expenditures for Advertised Allergy Medications, 1994-2001 . . . . . . . . . . . . 233
Figure 5.7: Trends in Total DTCA Expenditures and Number of Prescriptions Written for Allergy Medications and Number of Allergy-Related Physician Visits, 1994-2001 . . . . . . . 234
Figure 5.8: Trend in the Number of Prescriptions Written for Selected Advertised Allergy Medications, 1994-2001 . . . . . . . 237
Figure 5.9: Trends in Percentage of Women, Percentage of Individuals with Health Insurance Coverage and Percentage of Individuals 45 Years and Older Among those with Allergy-Related Physician Visits, 1994-2001 . . . . . . . . . . . . . . 238
Figure 5.10: Trends in Percentage of Women, Percentage of Individuals with Health Insurance Coverage and Percentage of Individuals 45 Years and Older Among those who Received Prescriptions for Advertised Allergy Medications, 1994-2001 . . . . . . . 239
Figure 5.11: Trends in Total Prescription Drug Expenditures, Total DTCA Expenditures and Number of Prescriptions Written for Advertised Allergy Medications, and Number of Allergy-Related Visits, 1994-2001 . . . . . . . . . . . . . . . . 241
Figure 5.12: Trends in Prescription Drug Expenditures for Selected Advertised Allergy Medications, 1994-2001 . . . . . . . . . . 242
Figure 5.13: Trends in Total DTCA Expenditures and DTCA Expenditures by Media Outlet for Antilipemics, 1994-2001 . . . . . . . . 243
Figure 5.14: Trend in DTCA Expenditures for Antilipemic Drugs by Media Outlet, from June to November 1997 . . . . . . . 245
Figure 5.15: Trends in Total DTCA Expenditures and Number of Prescriptions Written for Antilipemic Drugs and Number of Physician Visits with Diagnosis of Hyperlipidemia, 1994-2001 . . . . . 247
Figure 5.16: Trend in the Number of Prescriptions Written for Selected Advertised Antilipemic Drugs, 1994-2001 . . . . . . . . 250
Figure 5.17: Trends in Percentage of Women, Percentage of Individuals with Health Insurance Coverage and Percentage of Individuals 45 Years and Older Among those Diagnosed with Hyperlipidemia, 1994-2001 . . 251

xxx
Page
Figure 5.18: Trends in Percentage of Women, Percentage of Individuals with Health Insurance Coverage and Percentage of Individuals 45 Years and Older Among those who Received Prescriptions for Antilipemic Drugs, 1994-2001 . . . . . . . . . . . 252
Figure 5.19: Trends in Total Prescription Drug Expenditures, Total DTCA Expenditures and Number of Prescriptions Written for Antilipemic Drugs and Number of Physician Visits with Diagnosis for Hyperlipidemia,1994-2001 . . . . . . . . 253
Figure 5.20: Trends in Prescription Drug Expenditures for Selected Advertised Antilipemics, 1994-2001 . . . . . . . 255
Figure 5.21: Trends in Total DTCA Expenditures and DTCA Expenditures by Media Outlet for Gastrointestinals, 1994-2001 . . 256
Figure 5.22: Trend in DTCA Expenditures for Gastrointestinals by Media Outlet from June 1997 through November 1997 . . . . 257
Figure 5.23: Trends in Total DTCA Expenditures and Number of Prescriptions Written for Gastrointestinal Drugs and Number of Gastrointestinal-Related Physician Visits, 1994-2001 . . . . . 260
Figure 5.24: Trend in the Number of Prescriptions Written for Selected Advertised Gastrointestinal Drugs, 1994-2001 . . . . . . . 263
Figure 5.25: Trends in Percentage of Women, Percentage of Individuals with Health Insurance Coverage, and Percentage of Individuals 45 Years and Older Among those with Gastrointestinal-Related Visits, 1994-2001 . . . . . . . . . . . . . . 264
Figure 5.26: Trends in Percentage of Women, Percentage of Individuals with Health Insurance Coverage, and Percentage of Individuals 45 Years and Older Among those who Received Prescriptions for Advertised Gastrointestinal Drugs, 1994-2001 . . . . . . . 265
Figure 5.27: Trends in Total Prescription Drug Expenditures, Total DTCA Expenditures and Number of Prescriptions Written for Gastrointestinal Drugs and Number of Gastrointestinal-Related Physician Visits, 1994-2001 . . . . . . . . . . . 267
Figure 5.28: Trends in Prescription Drug Expenditures for Selected Advertised Gastrointestinal Drugs, 1994 – 2001 . . . . . . . . . 268
Figure 5.29: Trends in Total DTCA Expenditures and DTCA Expenditures by Media Outlet for Antidepressants, 1994-2001 . . . . . . 269

xxxi
Page
Figure 5.30: Trends in Total DTCA Expenditures and Number of Prescriptions Written for Antidepressants and Number of Depression-Related Physician Visits, 1994-2001 . . . . . . . . . . . 271
Figure 5.31: Trend in the Number of Prescriptions Written for Selected Advertised Antidepressants, 1994-2001. . . . . . . . . 274
Figure 5.32: Trends in Percentage of Women, Percentage of Individuals with Health Insurance Coverage, and Percentage of Individuals 45 Years and Older Among those With Depression-Related Visits, 1994-2001 . 275
Figure 5.33: Trends in Percentage of Women, Percentage of Individuals with Health Insurance Coverage, and Percentage of Individuals 45 Years and Older Among those who Received Prescriptions for Advertised Antidepressants, 1994-2001 . . . . . . . . 276
Figure 5.34: Trends in Total Prescription Drug Expenditures, Total DTCA Expenditures and Number of Prescriptions Written for Antidepressants and Number of Depression-Related Visits, 1994-2001 . . . . . 277
Figure 5.35: Trends in Prescription Drug Expenditures for Selected Advertised Antidepressants, 1994-2001 . . . . . . . . 279
Figure 5.36: Trends in Total DTCA Expenditures and DTCA Expenditures by Media Outlet for Antihypertensive drugs, 1994-2001 . . . . 280
Figure 5.37: Trends in Total DTCA Expenditures and Number of Prescriptions Written for Advertised Antihypertensive Drugs and Number of Hypertension-Related Visits, 1994-2001 . . . . . . . . 282
Figure 5.38: Trend in the Number of Prescriptions Written for Selected Advertised Antihypertensive Drugs, 1994-2001 . . . . . . 285
Figure 5.39: Trends in Percentage of Women, Percentage of Individuals with Health Insurance Coverage and Percentage of Individuals 45 Years and Older Among those with Hypertension-Related Physician Visits, 1994-2001. . . . . . . . . . . . . . . 286
Figure 5.40: Trends in Percentage of Women, Percentage of Individuals with Health Insurance Coverage and Percentage of Individuals 45 Years and Older Among those who Received Prescriptions for Advertised Antihypertensives, 1994-2001 . . . . . . . . . . . 287
Figure 5.41: Trends in Total Prescription Drug Expenditures, Total DTCA Expenditures and Number of Prescriptions Written for Antihypertensive Drugs and Number of Hypertension-Related Physician Visits, 1994-2001 . . . . . . . . . . . 288

xxxii
Page
Figure 5.42: Trends in Prescription Drug Expenditures for Selected Advertised Antihypertensive Drugs, 1994-2001 . . . . . . 290
Figure 5.43: Outline for Time Series Analysis . . . . . . . . . . 291
Figure 5.44: Outline for Mixed Model Analysis . . . . . . . . . . 292

1
CHAPTER 1: INTRODUCTION
BACKGROUND
Prescription Drug Expenditures
The practice of medicine has changed considerably in the past two decades. The
use of prescription drugs has become an integral part of healthcare and is the first line of
treatment for most illnesses. Physicians are relying more on prescription drugs since
drug therapies are considered to be the least invasive treatments. When used properly,
prescription drugs can enhance quality of life, improve functional capacity and may even
extend life.1 Furthermore, prescription drugs are claimed as one method for controlling
healthcare costs. However, it is difficult to evaluate the extent to which prescription drugs
help prevent other forms of treatment and help control healthcare costs.2
Although a very small component of total healthcare expenditures, prescription
drug expenditures have been growing at a very rapid rate. In fact, it is one of the fastest
growing components of healthcare expenditures. Prescription drug expenditures as a
percentage of total healthcare expenditures grew more rapidly in the 1990s than the
1980s and are projected to grow even more. In 1980, prescription drug expenditures
accounted for 4.9 percent of total healthcare expenditures, but by 2001 it had more than
1 Findlay SD. Direct-to-consumer promotion of prescription drugs: Economic implications for patients, payers and providers. Pharmacoeconomics. 2001;19(2):109-119.
2 Copeland C. Prescription drugs: Issues of cost, coverage, and quality. EBRI Issue Brief. 1999(208):1-21.

2
9.3%9.9%
10.4%
4.9%
5.1%
5.8% 6.1%
11.0%
13.2%14.5%
$0
$500
$1,000
$1,500
$2,000
$2,500
$3,000
$3,500
1980 1985 1990 1995 2000 2001 2002* 2003* 2008* 2012*
Co
sts
in B
illio
ns
$
0.0
2.0
4.0
6.0
8.0
10.0
12.0
14.0
16.0
Per
cen
t
National Health ExpendituresPrescription Drug ExpendituresPrescription Drug Expenditures as a Percentage of National Health Expenditures
doubled to 9.9 percent (Figure 1.1). Prescription drug expenditures grew from $51 billion
in 1993 to $140 billion in 2001, a 174.5 percent increase in just seven years.3
Figure 1.1: Trends and Projections of National Healthcare Expenditures, Prescription Drug Expenditures, and Prescription Drug Expenditures as a
Percentage of National Healthcare Expenditures, 1980-2012
In the 1990s, managed care system organizations attempted to control the growth
rate of prescription drug expenditures. Annual growth in prescription drug expenditures
dropped from 11.4 percent in 1991 to 7.4 percent in 1992, and further decreased to 6.3
percent in 1993 (Figure 1.2). By 1994, prescription drug expenditures began to grow
much more rapidly. Growth in prescription drug expenditures increased to 11.2 percent in
1995 and has been increasing ever since. The following are some of the factors
contributing to rising prescription drug expenditures.
3 CMS. An overview of the U.S. healthcare system: Two decades of change, 1980-2000. Centers for Medicare and Medicaid Services (CMS). Available at: www.cms.gov/charts/healthcaresystem/all.asp. Accessed May, 2003.
*Projected. Sources: Centers for Medicare and Medicaid Services

3
Figure 1.2: Annual Percent Change in Prescription Drug Expenditures, 1990-2001
15.9%
11.4%
7.4%6.3% 6.6%
11.2%10.5%
12.8%
15.1%
19.2%17.3%
15.7%
0.0%
5.0%
10.0%
15.0%
20.0%
25.0%
1990 1991 1992 1993 1994 1995 1996 1997 1998 1999 2000 2001
Per
cen
t
Source: Data from Centers for Medicare and Medicaid Services at www.cms.gov
Reasons for Rising Prescription Drug Expenditures
It has been speculated that the factors that have propelled the increase in
prescription drug expenditures in the past decades will continue to do so. The following
are some of the reasons cited:
(a) Increase in the number of new expensive medications being approved every year for
chronic conditions such as diabetes, arthritis, and asthma;4,5
(b) Increase in the incidence and prevalence of many chronic conditions;6
4 Findlay SD. Direct-to-consumer promotion of prescription drugs: Economic implications for patients, payers and providers. Pharmacoeconomics. 2001;19(2):109-119.
5 Berndt ER. The U. S. Pharmaceutical industry: Why major growth in times of cost containment. Health Affairs. March/April 2001;20(2):100-114.
6 Findlay SD. Direct-to-consumer promotion of prescription drugs: Economic implications for patients, payers and providers. Pharmacoeconomics. 2001;19(2):109-119.

4
(c) Increase in number of drugs prescribed by physicians coupled with increase in the use
of newer, costlier drugs;7,8
(d) Increase in the aging population who use more prescription drugs;9
(e) Increase in prescription drug insurance coverage; With managed care covering most
of the cost of prescription drugs with low co-payments, consumers and physicians are
becoming price insensitive;10,11,12
(f) Increase in consumer demand for drugs and;13,14
(g) Escalation of prescription drug marketing and promotion, especially direct-to-
consumer advertising (DTCA).15,16,17
The increase in drug utilization has been cited as the number one reason for rising
prescription drug expenditures. With this rise in private third party coverage and low co-
payments for prescription drugs more people are using more prescription drugs. In
7 Findlay SD. Direct-to-consumer promotion of prescription drugs: Economic implications for patients, payers and providers. Pharmacoeconomics. 2001;19(2):109-119.
8 Levit K, Smith C, Cowan C, et al. Inflation spurs health spending in 2000. Health Affairs. January/February 2002;21(1):172-181.
9 Levit K, Smith C, Cowan C, et al. Inflation spurs health spending in 2000. Health Affairs. January/February 2002;21(1):172-181.
10 Berndt ER. The U. S. Pharmaceutical industry: Why major growth in times of cost containment. Health Affairs. March/April 2001;20(2):100-114..
11 Heffler S, Levit K, Smith S, et al. Health spending growth up: Faster growth expected in the future. Health Affairs. March/April 2001;20(2):193-203.
12 Findlay S, Sherman D, Chockley N, et al. Prescription drug expenditures in 2001: Another year of escalating costs. National Institute for Health Care Management. April 2002. Available at: www.nihcm.org. Accessed June, 2002.
13 Findlay SD. Direct-to-consumer promotion of prescription drugs: Economic implications for patients, payers and providers. Pharmacoeconomics. 2001;19(2):109-119.
14 Heffler S, Levit K, Smith S, et al. Health spending growth up: Faster growth expected in the future. Health Affairs. March/April 2001;20(2):193-203.
15 Findlay SD. Direct-to-consumer promotion of prescription drugs: Economic implications for patients, payers and providers. Pharmacoeconomics. 2001;19(2):109-119.
16 Levit K, Smith C, Cowan C, et al. Inflation spurs health spending in 2000. Health Affairs. January/February 2002;21(1):172-181.
17 Findlay S, Sherman D, Chockley N, et al. Prescription drug expenditures in 2000: The upward trend continues. The National Institute for Health Care Management. May 2001. Available at: www.nihcm.org. Accessed December, 2001.

5
addition, the guidelines for detection of certain chronic conditions have changed and the
thresholds for detecting these conditions have been lowered (e.g. cholesterol levels,
fasting glucose levels). This has resulted in the increased diagnosis and incidence of
chronic conditions and consequently more drugs are being prescribed. The
pharmaceutical industry has invested heavily in the DTCA for prescription drugs. As a
result, many consumers visit physicians more frequently to obtain prescription for drugs
that are heavily advertised. Consumers believe that these drugs will help treat the
condition and they will get relief from the symptoms.18
As noted previously, there are several factors that influence prescription drug use
and expenditures. However, to availability of data, only some factors including DTCA,
access to care or insurance coverage, demographics (age and gender), and physician visits
will be evaluated in this study. The next sections will discuss these factors influencing
rising prescription drug expenditures.
Direct-to-Consumer Advertising of Prescription Drugs
Throughout this thesis, the research-intensive brand-name manufactures are
referred to as the pharmaceutical manufacturers or the industry. The primary objective for
pharmaceutical manufacturers is to increase profits through increased sale of drugs.19
Traditionally, prescription drugs were marketed mainly to physicians. The
primary reason was because physicians make the decision on drug therapy and consumers
were viewed as being uninformed about drug therapies. With the advent of a more
18 Cain G. A remedy for rising drug costs. Best's Review. March 2002:80.19 Sheffet MJ, Kopp SW. Advertising prescription drugs to the public: Headache or relief. Journal of Public
Policy and Marketing. 1990;9(2):42-62.
6
knowledgeable consumer and the movement of having consumers involved in their
healthcare decisions, the marketing of prescription drugs has changed dramatically over
the last two decades.20 Using the marketing mix, the industry has actively promoted the
drugs to increase sales and market share. The marketing mix includes detailing or
promotion to physicians (both office-based and hospital-based), providing free samples to
physicians, advertising in medical journals, and DTCA.
The Food, Drug and Cosmetic (FD&C) Act does not define advertising
specifically, except to describe it as “any other material that is considered labeling or
anything other than labeling that promotes a prescription drug sponsored by the
manufacturer.” 21,22,23 For the purpose of this study, DTCA of prescription drugs will be
defined as “the promotion of the availability and/or characteristics of a prescription drug
product to the general public through mass media, such as television, radio, newspapers,
magazines and mailings.” 24,25,26,27
20 Williams JR, Hensel PJ. Direct-to-consumer advertising of prescription drugs. Journal of Health Care Marketing. 1995;15(1):35-41.
21 FDCA §. 21 USC § 321(k).22 . 21 C.F.R. § 202.1(1)(1) (1979).23 Kessler DA, Pines WL. The federal regulation of drug advertising and promotion. Journal of the
American Medical Association. November 14, 1990;264(18):2409-2415.24 Glasgow C, Schommer JC, Gupta K, et al. Promotion of prescription drugs to consumers: Case study
results. Journal of Managed Care Pharmacy. November/December 2002;8(6):512-518.25 Cutrer CM, Pleil AM. Potential outcomes associated with direct-to-consumer advertising of prescription
drugs: Physicians' perspectives. Journal of Pharmaceutical Marketing and Management. 1991;5(3):3-19.26 Maddox LM, Katsanis LP. Direct-to-consumer advertising of prescription drugs in Canada: Its potential
effect on patient-physician interaction. Journal of Pharmaceutical Marketing and Management. 1997;12(1):1-21.
27 Kessler DA, Pines WL. The federal regulation of drug advertising and promotion. Journal of the American Medical Association. November 14, 1990;264(18):2409-2415.

7
Direct-to-Consumer Advertising Expenditures
Every year, total promotional expenditures have been rising (Figure 1.3), but
promotional expenditures as a percentage of sales have remained steady in the narrow
range of 13.6 – 15.3 percent from 1996 to 2000.28 A probable reason for this could be that
marketing budgets have increased at the same rate as growth in sales.
Figure 1.3: Annual Total Promotional Expenditures, DTCA Expenditures, and DTCA Expenditures as a Percentage of Total Promotional Expenditures for
Prescription Drugs, 1994-2001
DTCA as a proportion of total promotional expenditure has been increasing in the
1990s, especially since 1997. In 1989, manufacturers spent $12 million on DTCA, which
gradually increased to $55 million in 1991, and $164 million in 1993.29
28 Rosenthal MB, Berndt ER, Donohue JM, et al. Promotion of prescription drugs to consumers. New England Journal of Medicine. 2002;346(7):498-505.
29 Pines WL. A history and perspective on direct-to-consumer promotion. Food Drug and Law Journal. 1999;54:489-518.
$8,269
$19,059$15,708
$13,868
$9,164$10,991 $12,473$8,447
4.5%
15.7%13.3%
10.6%
14.1%
3.1%
8.6%9.7%
$0
$5,000
$10,000
$15,000
$20,000
$25,000
1994 1995 1996 1997 1998 1999 2000 2001
Exp
endi
ture
s (M
illio
ns)
0.0%
4.0%
8.0%
12.0%
16.0%
20.0%
Per
cent
Total Promotional Expenditures
DTCA Expenditures
DTCA as a Percent of Total Promotional ExpendituresSource: IMS Health, 2002; Prescription drug trends. Henry Kaiser Family Foundation and Sonderegger
Research Center. September 2000. Available at: www.kff.org. Accessed January, 2001. Prescription drug trends: A chart book update. Kaiser Family Foundation. November 2001.
Available at: www.kff.org. Accessed February 2002.

8
In 1994, DTCA accounted for 3.1 percent of total promotional expenditures
which rose to 15.7 percent of total promotional expenditures in 2000.30, 31, 32 In 2001, the
industry spent a total of $19.1 billion on promotion of which DTCA expenditures
accounted for 14.1 percent (Figure 1.3).33 Compared to total promotional expenditures on
prescription drugs, which increased by 71.4 percent from 1996 to 2000, DTCA
expenditures increased by 211.9 percent during the same time period.34
Contrary to popular belief, increase in DTCA expenditures on television was
high even before 1997. In 1994, manufacturers spent $266 million on DTCA of which
$35.7 million was spent on television advertising (Figure 1.4). In 1997, following the
relaxation of guidelines for broadcast advertising, DTCA expenditures rose sharply by
35.1 percent and television advertising rose at a similar rate (40.9%). By 2000, DTCA
increased to $2.4 billion and television advertising accounted for $1.57 billion (63.8% of
DTCA). As seen in Figure 1.4, DTCA expenditures has been rising at a steady pace, but
television advertising has been increasing at a much more rapid rate. Since the relaxation
30 IMS Health. Integrated Promotion Service and Competitive Media Reporting. 1996-2001. Available at: www.imshealth.com. Accessed December, 2002. 1996-2001
31 Frank R, Berndt ER, Donohue J, et al. Trends in direct-to-consumer advertising of prescription drugs. The Henry Kaiser Family Foundation. February, 2002. Available at: www.kff.org. Accessed December, 2002.
32 Freidman K. IMS health reports: US pharmaceutical promotional spending reached a record $13.9 billion in 1999. IMS Health. Accessed March, 2000.
33 Total U.S. promotional spending by type, 2001. IMS Health. 2002. Available at: www.imshealth.com. Accessed August, 2002.
34 IMS Health. Integrated Promotion Service and Competitive Media Reporting. 1996-2001. Available at: www.imshealth.com. Accessed December, 2002. 1996-2001

9
of the guidelines, manufacturers felt that they would be able to advertise via television
more effectively than before.35, 36
Figure 1.4: Annual Direct-To-Consumer Advertising Expenditures for Prescription Drugs by Promotion Media, 1994-2000
$230 $320$571
$759 $652 $712$898
$310$664
$1,138
$1,569
$220
$55$36
$0
$500
$1,000
$1,500
$2,000
$2,500
$3,000
1994 1995 1996 1997 1998 1999 2000
Exp
endi
ture
s (I
n M
illio
ns)
Print and Other Television Advertising
Source: Prescription drug trends. Henry Kaiser Family Foundation and Sonderegger Research Center. September 2000. Available at: www.kff.org. Accessed January 2001.Data: Sonderegger Research Center analysis based on data from IMS Health, Integrated Promotion Service, and Competitive Media Reporting, 1994-2001
In 2001, DTCA expenditures grew in single digits for the first time since the Food
and Drug Administration (FDA) eased consumer-directed advertising restrictions in 1997
compared to a double-digit growth experienced in previous years. DTCA expenditures
grew by only 8.5 percent from 2000 to 2001 and accounted for 14.1 percent of overall
35 Frank R, Berndt ER, Donohue J, et al. Trends in direct-to-consumer advertising of prescription drugs. The Henry Kaiser Family Foundation. February, 2002. Available at: www.kff.org. Accessed December, 2002.
36 Rosenthal MB, Berndt ER, Donohue JM, et al. Promotion of prescription drugs to consumers. New England Journal of Medicine. 2002;346(7):498-505.
$266$375
$791
$1,069
$1,317
$1,848
$2,467

10
promotional expenditures. One explanation for the slowed growth in DTCA expenditures
was the depressed economy of 2001, which forced manufacturers to reduce expenditures
on advertising to sustain earnings.37 However, the proportion of DTCA expenditures, as
a part of total promotional expenditures was much higher in 2001 as compared to the
early 1990s, which indicates that the industry is increasingly focusing on DTCA as a part
of the marketing mix. With rising DTCA expenditures and prescription drug
expenditures, a relationship between them has been often speculated. It is possible that
DTCA may have a direct relationship with prescription drugs expenditures and an
indirect relationship through utilization of prescription drugs.
Access to Care (Healthcare Coverage)
With healthcare coverage, patients feel empowered and capable of taking care of
their own health. It also helps remove some of the barriers to use of healthcare services
and products. For the purpose of this study, health insurance coverage and prescription
drug coverage will also be referred to as access to care.
According to the data from Centers for Medicare and Medicaid Services (CMS),
out-of-pocket payments and payments by private and public sectors for prescription drugs
have changed considerably since the 1960s. In 1965, out-of-pocket spending accounted
for 92.6 percent of prescription drug expenditures, whereas private (3.5%) and public
(3.8%) sources each accounted for almost the same proportion of prescription drug
expenditures. In 1985, this changed with out-of pocket spending declining to 62.5
37 Scussa F. Consumer ads reach peak. Med Ad News. June 2002;21(6):1-8.

11
percent whereas private health insurance and public sources paid for 24.0 percent and
13.5 percent of prescription drug expenditures, respectively.38
Figure 1.5: Trends in the Proportion of Prescription Drug Expenditures by Private Insurance, Out-of-Pocket, and Government Programs, 1990-2001
48.2%
24.4%26.5% 27.3% 28.5%
32.1% 37.1%
47.4%46.6%45.8%43.9%42.4%
39.5%
40.0%
59.1%
56.2% 54.7% 52.7%42.7%
36.8%34.9% 32.9% 31.4% 30.7%
16.6% 17.3% 18.0% 18.8% 19.8% 20.1% 20.6% 20.8% 21.1% 21.3% 22.0% 21.9%
0%
10%
20%
30%
40%
50%
60%
70%
1990 1991 1992 1993 1994 1995 1996 1997 1998 1999 2000 2001
Per
cent
of T
otal
Exp
endi
ture
s
Private Insurance Out-of-Pocket Government Programs
Private third party (private insurance) share of prescription drug payments has
grown from 24.4 percent in 1990 to 37.1 in 1995 and 46.5 percent in 2000 (Figure 1.5).
Private drug coverage share in total prescription drug expenditures grew from $9.8 billion
in 1990 to $22.6 billion in 1995, a 130.6 percent increase (Figure 1.6). The share of
private drug expenditures further increased to $66.6 billion in 2001, a 196.1 percent
increase since 1995. At the same time, the share of out-of-pocket payments has been
declining steadily from 59.1 percent ($23.8 billion) in 1990 to 42.7 percent ($26 billion)
in 1995 (Figures 1.5 and 1.6). Public funds or government spending on prescription
drugs grew from $6.7 billion in 1990 to $12.2 billion in 1995, an 82.1 percent increase. In
38 CMS. An overview of the U.S. healthcare system: Two decades of change, 1980-2000. Centers for Medicare and Medicaid Services (CMS). Available at: www.cms.gov/charts/healthcaresystem/all.asp. Accessed May, 2003.
Source: Data from Centers for Medicare and Medicaid Services, www.cms.gov

12
2001, out-of-pocket and public spending for prescription drugs were $42.5 billion (63.7%
increase from 1995) and $31.5 billion (157.2 % increase from 1995), respectively.39
Figure: 1.6: Prescription Drug Expenditures by Source of Payment, 1990-2001
$0
$10,000
$20,000
$30,000
$40,000
$50,000
$60,000
$70,000
1990
1991
1992
1993
1994
1995
1996
1997
1998
1999
2000
2001
Exp
endi
ture
s ($
in M
illio
ns)
Private Insurance Out-of-Pocket Government Programs
Source: Data from Centers for Medicare and Medicaid Services, www.cms.gov
Since 1980, 97.0 – 98.0 percent of the employees with health benefits provided by
employers had prescription drug coverage. Since the 1990s, with the rise in third party
coverage for prescription drugs, the proportion of prescription drug expenditures being
paid for by third party has been consistently increasing with the burden shifting from out-
of-pocket expenditures by consumers to third party payers. This shift in burden suggests
that access to care through third party coverage possibly increases the likelihood of
individuals filling their prescriptions.40
According to CMS data on healthcare coverage for the past two decades, private
coverage has declined from 83.0 percent in 1980 to 74.0 percent in 2000. Although
39 Health Accounts. Centers for Medicare and Medicaid services. Available at: http://www.cms.gov/statistics/nhe/default.asp. Accessed June, 2003.
40 Baugh DK, Pine PL, Blackwell S. Trends in Medicaid prescription drug utilization and payments, 1990-1997. Health Care Financing Review. Spring 1999;20(3):79-105.

13
public coverage has remained about the same, the number of uninsured has grown from
13.0 percent in 1987 to 16.0 percent in 2000.41
With third party coverage, patients can visit physicians and fill prescriptions with
a co-payment. This then contributes to the increased utilization of healthcare services and
products through improved access to healthcare. It has also been suggested that if a
physician is aware that the patient has drug coverage then they are more likely to
prescribe medications and thereby augment the relationship between insurance coverage
and use.42,43, 44, 45
With low-copays, prescription drug coverage helps reduce the financial barriers to
access to medications whereas lack of coverage could result in unwanted effects such as
unfilled prescriptions. Hence, coverage is likely to increase prescription drug utilization,
increase types of drugs used by patients, and ease the financial burden that the use of
prescription drugs can impose.46,47,48
The latest trend among private third party coverage is the availability of multi-tier
co-pay amounts. Generic drugs usually have the lowest co-payment followed by brand
41 CMS. An overview of the U.S. healthcare system: Two decades of change, 1980-2000. Centers for Medicare and Medicaid Services (CMS). Available at: www.cms.gov/charts/healthcaresystem/all.asp. Accessed May, 2003.
42 Report to the President: Prescription drug coverage, spending, utilization, and prices. Department of Health and Human Services. April 2000. Available at: http://aspe.hhs.gov/health/reports/drugstudy/index.htm. Accessed August, 2001.
43 Stuart B, Grana J. Ability to pay and the decision to medicate. Medical Care. 1998;36(2):202-211.44 Holocombe RF, Griffin J. Effect of insurance status on pain medications in a hematology/oncology
practice. Southern Medical Journal. February 1993;86(2):151-156.45 Weeks HA. Changes in prescription drug utilization after the introduction of a prepaid drug insurance
program. Journal of the American Pharmaceutical Association. April 1973;NS13(4):205-209.46 Report to the President: Prescription drug coverage, spending, utilization, and prices. Department of
Health and Human Services. April 2000. Available at: http://aspe.hhs.gov/health/reports/drugstudy/index.htm. Accessed August, 2001.
47 Stuart B, Grana J. Ability to pay and the decision to medicate. Medical Care. 1998;36(2):202-211.48 Gianfrancesco FD, Baines AP, Richards D. Utilization effects of prescription drug benefits in an aging
population. Health Care Financing Review. Spring 1994;15(3):113-126.

14
name drugs on the formulary. The highest co-payment is for non-formulary brand name
drugs. The concern is that drugs with high levels of co-payment may cause patients to use
fewer prescription drugs and have lower adherence to therapy. Comparing plans with
tiers and plans without tiers, the average out-of-pocket payments were 62.0 percent
higher for plans with tiers. On average, patients in tiered plans used (2.1 medications)
more medications compared to patients in non-tiered plans (1.4 medications). Patients in
multi-tiered plans were twice as likely to not adhere to drug therapy to save money
including, delays in getting prescription filled, deciding not to fill a prescription, using
the drugs less frequently than what is prescribed, and taking smaller doses or splitting
pills.49
While coverage can help to ease the financial barriers, it does not completely
remove them. In addition, even with coverage available, utilization of healthcare services
and products depends on the individual. There are several additional factors influencing
prescription drug use and expenditures including demographics.
Demographics: Age and Gender
Age and gender-related effects on prescription drug use and expenditures have
been speculated in the past few decades. Age has often been reported to have a greater
impact on prescription drug use rates than gender.50 This is will be discussed in more
detail in the literature review related to demographics and utilization.
49 Multi-tier co-pays and the chronically ill. Harris Interactive. Available at: http://www.nacdsfoundation.org/NACDSfoundation/2003/Multi_tier_Co-Pays_the_Chronically_Ill.pdf. Accessed September, 2003.
50 Sayer GP, Britt H. Sex differences in prescribed medications: Another case of discrimination in general practice. Social Science and Medicine. 1997;45(10):1581-1587.

15
According to the National Center for Health Statistics (NCHS), use of
prescription drugs and physician visits increase linearly with age. Individuals 45 years
and older accounted for 53.1 percent of the office visits in 2001, up from 42.3 percent in
1992 (increased by 26.0%).51 Furthermore, the probability of being diagnosed with a
chronic condition also increases with age and as a result, the use of prescription drugs and
expenditures also increases with age.52 Studies also report that prescription drugs used by
the elderly cost less per day than prescription drugs used by the younger adults. However,
it is the increased number of prescriptions and longer duration of use that are influencing
prescription drug expenditures.53
The National Association of Chain Drug Stores (NACDS) using the National
Ambulatory Medical Care Survey (NAMCS) data for 1997 reported a steady increase in
use of prescription drugs from the age of 15 years for both men and women. Except for
those less than five years of age, women consistently used more prescription drugs than
men.54
Women have been noted to use more healthcare services and products than men
(e.g. physician visits) and also tend to have higher morbidity rates. This could have an
impact on prescribing patterns and hence result in greater prescription drug use among
women than men. It is also possible that women visit physicians more often for gender-
51 Cherry DK, Burt CW, Woodwell DA. National Ambulatory Medical Care Survey: 2001 Summary. National Center for Health Care Statistics/Centers for Disease Control and Prevention: Advance data report No. 337. August 11, 2003. Available at: http://www.cdc.gov/nchs/data/ad/ad337.pdf. Accessed January, 2004.
52 Thomas CP, Ritter G, Wallack SS. Growth in prescription drug spending among insured adults. Health Affairs. September/October 2001;20(5):265-277.
53 Wallack SS, Thomas C, Hodgkin D, et al. Recent trends in prescription drug spending for individuals under 65 and age 65 and older. Schneider Institute for Health Policy. Available at: http://www.rxhealthvalue.com/docs/research_07302001.pdf. Accessed October, 2002.
54 The chain pharmacy industry profile: National Association of Chain Drug Stores; 1999.

16
specific morbidity (e.g. Conditions of the reproductive system - pregnancy and
contraception, prenatal vitamins, iron). Other reasons include differences in health
reporting (assessment of self-health), service utilization behaviors, disease-prevention
attitudes, and biological predispositions.55 Furthermore, it is possible that women identify
the symptoms more readily than men or are more interested in health matters than men.56
In addition, women live longer than men. In 2000, life expectancy at birth for
males was 74.1 years and 79.5 years for females.57 Since women live longer, they tend to
use more healthcare services and products thereby contributing to the rising prescription
drug expenditures.
Physician Visits
One of the major predictors of prescription drug use is physician visit since a
physician is needed to write a new prescription. Individuals usually visit the physician at
the onset of the symptoms. In addition, with the availability of healthcare coverage
consumers have better access to the physicians and are more likely to visit the physicians
and talk to them about health-related problems or concerns. With increasing awareness of
disease states and potential treatment options through DTCA and other sources,
consumers are increasingly visiting the physician to talk to them about their health
concerns. Consumers are able to recognize symptoms, but this may not accurately
pinpoint the condition they may have.
55 Sayer GP, Britt H. Sex differences in prescribed medications: Another case of discrimination in general practice. Social Science and Medicine. 1997;45(10):1581-1587.
56 Hibbard JH, Pope CR. Another look at sex differences in the use of medical care: Illness orientation and types of morbidities for which services are used. Women Health. 1986;11:21-36.
57 Arias E. United States, Life tables, 2000. National Vital Statistics Reports. December 19, 2002;51(3):1-39.

17
As mentioned previously, DTCA can also have an indirect impact on prescription
drug utilization by influencing consumers to talk to the physician about the advertised
conditions and prescription drugs. According to Scott Levin, physician visits for
advertised conditions (DTCA) increased by 11.0 percent between January and September
of 1998 whereas total physician office visits increased by only 2.0 percent.58
As discussed in the previous section, morbidity, likelihood of being diagnosed
with chronic conditions, and mortality increase with age. As a result, the elderly are more
likely to visit the physician than the younger adults.59 Similarly, women are more likely
to visit the physician, visit more often, and visit earlier than men at the onset of
symptoms. The reason for higher number of visits for women may be mainly due to
gender-specific requirements or conditions.
Figure 1.7 depicts the trend in physician visits from 1985 to 1998. The decrease in
physician visits from 1985 to 1996 was only slight. Physician visits decreased from
2,903.5 visits per 1,000 in 1985 to 2,719.9 per 1,000 in 1994-96. On further evaluation
of the data, increases in the physician visits were observed mainly for the elderly. The
steep increase in physician visits after 1996 could be explained by the growth in managed
care, which made it easier for the patient to visit the doctor with a low co-payment.60
58 Scott-Levin. Patients visits up for DTC conditions, November 6, 1998.59 Hafner-Eaton C. Physician utilization disparities between the uninsured and insured: Comparisons of the
chronically ill, acutely ill, and well non-elderly populations. Journal of the American Medical Association. February 10, 1993;269(6):787-792.
60 Bernstein AB, Hing E, Burt CW, et al. Trend data on medical encounters: Tracking a moving target. Health Affairs. March/April 2001;20(3):58-72.

18
Figure 1.7: Number of Physician Visits Per 1,000 of the Population, 1985-1998
The average number of physician visits increased from 3.5 visits per person in
1985 to 5.6 per person in 1997-98. Even though the average number of visits has risen,
the drug-mention rate or number of medications mentioned per 100 visits increased from
109 in 1985 to 136.9 in 1998.61 However, the NCHS reported that in 1985, 61.2 percent
of doctor visits resulted in a prescription for a drug compared to 61.9 percent of the visits
in 2001.62, 63
Although the average number of visits has increased, the number of visits when a
prescription drug was prescribed has increased from 61.2 percent to only 61.9 percent
and the drug-mention rate has increased. Even though the number of visits when at least
61 Bernstein AB, Hing E, Burt CW, et al. Trend data on medical encounters: Tracking a moving target. Health Affairs. March/April 2001;20(3):58-72.Bernstein, March/April 2001
62 McLemore T, DeLozier J. 1985 Summary: National Ambulatory Medical Care Survey. National Center for Health Care Statistics/Centers for Disease Control and Prevention: Advance Data Report No. 128. January 28, 1987. Available at: http://www.cdc.gov/nchs/data/ad/ad128acc.pdf. Accessed January, 2004.
63 Cherry DK, Burt CW, Woodwell DA. National Ambulatory Medical Care Survey: 2001 Summary. National Center for Health Care Statistics/Centers for Disease Control and Prevention: Advance data report No. 337. August 11, 2003. Available at: http://www.cdc.gov/nchs/data/ad/ad337.pdf. Accessed January, 2004.
Source: Bernstein AB, Hing R, Burt CW et al. Trend data on medical encounters: Tracking a moving target. Health Affairs. March/April 2001;20(3)58-72.

19
one drug prescribed has not increased by much, the number of prescriptions written or
number of drugs mentioned per visit has increased.
In most cases, a physician visit is necessary for a new prescription and hence with
increasing physician visits, the number of prescriptions written increases leading to
increasing drug utilization and expenditures. However, this does assume that the
prescriptions were filled.
Utilization of Prescription Drugs
Utilization has been cited as the number one reason for increasing prescription
drug expenditures. According to CMS data (Figure 1.8), utilization of prescription drugs
has grown since 1993 and has played just as an important a role as drug price increases in
accounting for the increase in drug expenditures. Some of the prescription drug volume-
related factors that are influencing utilization are:
(a) More people are getting more prescriptions;
(b) Those already receiving prescriptions are getting more prescriptions per year; and
(c) Prescriptions are written for longer periods of time or more days supply.64
Since 1993, drug utilization has been reported to play a vital but stable role in the
rising of prescription drug expenditures. Based on data from IMS Health and Scott Levin,
increase in utilization was reported to account for 48.0 percent of the growth in
prescription drug expenditures from 1993 to 2000. Types of prescriptions used or type of
64 Merlis MA. Explaining the growth in prescription drug spending: A review of recent studies. Paper presented at: ASPE, Conference on Pharmaceutical Pricing Practices, Utilization, and Costs, US Department of Health and Human Services, 2000; Washington DC.

20
therapy and price increases were reported to have contributed to the remainder of the
growth in prescription drug expenditures.65
Figure 1.8: Average Annual Percentage Change in Factors Accounting for Growth in Prescription Drug Expenditures Per Capita: 1980-2011
9.0%
2.8%4.6% 4.9% 4.9%
2.2%
5.0% 3.3% 2.4%4.2%
6.5%
5.1%
2.7%0.9%0.8%
0%
2%
4%
6%
8%
10%
12%
14%
16%
18%
1980-1983 1993-1997 1997-2000 2000-2003 2003-2011
Ave
rag
e A
nnu
al P
erce
nt
Ch
ang
e
Drug Prices Drug Utilization (Number of Prescriptions) Other
10.7%9.2%
16.1%
10%
13.3%
The underlying reasons for increased utilization include a growing elderly
population, new medical guidelines, significant therapeutic advances, and marketing of
drugs. With new innovative prescription drugs being introduced in the market regularly,
physicians and consumers are accepting them more easily and readily irrespective of
whether the drugs have modest or significant therapeutic benefits. Prescription drugs are
now offered in more convenient dosage forms, and with fewer side-effects, which have
vastly increased the utilization rates. As healthcare moves toward outpatient care,
prescription drugs are being covered more often by health plans and use of prescription
65 Kreling DH, Mott DA, Wiederholt JB, et al. Prescription drug trends: A chartbook update. Sonderegger Research Center and The Henry Kaiser Family Foundation. November 2001. Available at: www.kff.org. Accessed February, 2002.
Note: Data for 2000-2011 is projectedOther includes quality and intensity of services, and age-gender effectsSource: CMS, Office of the actuary, National Health Statistics Group

21
drugs is encouraged.66 All these factors have contributed to the increased utilization of
prescription drugs.
Figure 1.9: Number of Prescriptions Dispensed Per Capita and Percent Change in Number of Prescriptions Dispensed, 1993-2001
7.8
8.0 8.4 8.7 9.0
9.610.4 10.8
3.4%
6.1%
4.6%
6.8%
7.8%
4.5%
5.6%
9.1%
0
2
4
6
8
10
12
1993 1994 1995 1996 1997 1998 1999 2000Year
Pre
scri
pti
on
s p
er c
apit
a
0.0%
2.0%
4.0%
6.0%
8.0%
10.0%
Per
cen
t
Prescriptions per capita Annual Percent Change in Number of Prescriptions Dispensed
Prescription drug utilization measured as number of prescriptions dispensed in
retail pharmacies has grown at an average rate of 6.0 percent since 1992 rising to nearly
three billion in 2000.67 The change in growth rate for utilization was high in 1993 (7.8%).
66 Trend of the month: Higher utilization and introduction of new drugs cause increased drug spending. Drug Benefit Trends. 2000;12(7):7-8.
67 Kreling DH, Mott DA, Wiederholt JB, et al. Prescription drug trends: A chartbook update. Sonderegger Research Center and The Henry Kaiser Family Foundation. November 2001. Available at: www.kff.org. Accessed February, 2002.Kreling DH et al. July 2000
Source: Adapted from National Institute for Health Care Management (NIHCM), 2002; U.S. Census Bureau, 2002; Sonderegger Research Center analysis, based on: Number of Dispensed Prescriptions data from IMS Health, Inc., National Prescription Audit Plus, 1992–2000. U.S. population data from U.S. Census Bureau, Statistical Abstract of the United States, 2000, using 1990 census estimates.Note: These percents reflect the increase in the number of prescriptions dispensed in retail pharmacies from the previous year. Retail pharmacies include chain, independent, food store, long-term care, and mail order pharmacies.

22
But, with increased role of managed care the utilization rate did not increase as high in
1994 (3.4%).
PURPOSE AND OBJECTIVES OF THE STUDY
Prescription drug expenditures have been rising every year despite the control
measures imposed by both public and private insurance programs. Although they account
for only a small proportion of total healthcare expenditures, prescription drug
expenditures is the fastest growing component and also contribute considerably to the
overall growth in healthcare expenditures.
The overall purpose of the study was to understand and evaluate the relationships
of DTCA expenditures, access to care (health insurance coverage), demographics (age
and gender), and physician visits with prescription drug use and expenditures. In
addition, it also examined the relationship between DTCA expenditures, access to care
(health insurance coverage), demographics (age and gender) and physician visits.
A conceptual model specifying the below-stated effects or relationships was
developed for each of the five therapeutic categories and also compared between the two
time periods (prior to and following the relaxation of guidelines): (a) January 1994 to
August 1997; (b) September 1997 to April 2001. The advertised drugs from the five
classes (allergy medications, antilipemics, gastrointestinals, antidepressants, and
antihypertensives) were selected.
The objectives of the study are the following:

23
(a) To determine the relationships between DTCA expenditures, access to care (health
insurance coverage), and demographics (age and gender) and physician visits for the
symptoms or diseases the advertised drugs are used to treat.
(b) To determine the relationship between DTCA expenditures, access to care (health
insurance coverage), demographics (age and gender), physician visits (symptoms
and/or diseases) and the number of prescriptions written for the advertised drugs.
(c) To determine the relationships between DTCA expenditures, access to care (health
insurance coverage), demographics (age and gender), physician visits (symptoms
and/or diseases), and expenditures for the advertised drugs.
(d) To compare the relationships from the above three objectives for the two time periods
(1) January 1994 to August 1997, and (2) September 1997 to April 2001.
Since DTCA of prescription drugs is an important aspect of this research, it will
be discussed in detail. The next chapter will discuss different aspects of DTCA including
the reasons why companies use DTCA, definition and types, pros and cons, history, and
regulations for DTCA. Also, a review of literature related to DTCA and the consumer,
physician, pharmacists, claims in the advertisements including the accuracy, risk
information and content analysis will be presented. Chapter 3 will provide a review of
the related literature on variables included in the model including DTCA expenditures,
access to care (health insurance coverage), age and gender in relation to physician visits,
utilization and expenditures for prescription drugs.

24
CHAPTER 2: DIRECT-TO-CONSUMER ADVERTISING OF
PRESCRIPTION DRUGS
INTRODUCTION
Direct-to-consumer advertising (DTCA), though a relatively new phenomenon for
prescription drugs, has always focused on a few drug products that are newer and have no
generic equivalent products in the market. DTCA is mainly associated with drugs used to
treat chronic conditions such as allergies, ulcers, and high cholesterol, but it has been
used for other conditions such as depression and erectile dysfunction. DTCA is also
helping consumers gain some knowledge regarding prescription drugs and disease
symptoms.68
DTCA is a component of the broader marketing mix and communication plan for
businesses and it represents an investment of resources that can be evaluated by its
Return on Investment (ROI). DTCA can also be called the manufacturers’ reaction to the
restrictive prescription drug benefit plans and uncertain effectiveness of other forms of
promotion such as medical journal advertising and detailing individual physicians by
company representatives. Even though education is considered as the most important
68 Frank R, Berndt ER, Donohue J, et al. Trends in direct-to-consumer advertising of prescription drugs. The Henry Kaiser Family Foundation. February, 2002. Available at: www.kff.org. Accessed December, 2002.

25
benefit of DTCA, many claim that DTCA raises basic awareness of the product and
disease, but the educational component of DTCA is failing.69
Many speculate about manufacturers’ possible reasons for increased spending or
aggressive marketing using DTCA. Advances in drug research and technology have
helped introduce new products faster in the market. As a result, the exclusivity period for
a drug product has been reduced. Hence, manufacturers must capture market share and
recoup their investment rapidly and the use of DTCA facilitates the process.70, 71 DTCA
could also help increase physician prescribing for undiagnosed conditions and increase
the speed of adoption or reduce the time between introduction and adoption of new
treatment options.72
The primary goal of advertising, irrespective of the industry, is to disseminate
information about the potential benefits, features and cost of products or services and
ultimately generate profits.73,74 Information provided by DTCA may encourage the
consumer to have a discussion with the physician regarding the advertised product.75 In
this era of information technology, consumers are demanding information and
69 Lyles A. Direct marketing of pharmaceutical to consumers. Annual Review of Public Health. 2002;23:73-91.
70 Berndt ER. The U. S. Pharmaceutical industry: Why major growth in times of cost containment. Health Affairs. March/April 2001;20(2):100-114.
71 Hunt MI. Prescription drug costs: Federal regulation of the industry. Blue Cross Blue Shield Association. September 2000. Available at: http://bcbshealthissues.com/proactive/newsroom/release.vtml?id=17521. Accessed November, 2002.
72 Morris LA, Mazis MB, Brinberg D. Risk disclosures in televised prescription drug advertising to consumers. Journal of Public Policy and Marketing. 1989;8(1):64-80.
73 Rockwell T. The Lifetime experience with prescription drug advertising exposed to consumers. Journal of Pharmaceutical Marketing and Management. Winter 1986;1(2):13-18.
74 Hoen E. Direct-to-consumer advertising: For better profits or for better health. American Journal of Health-System Pharmacy. 1998;55:594-597.
75 Williams JR, Hensel PJ. Direct-to-consumer advertising of prescription drugs. Journal of Health Care Marketing. 1995;15(1):35-41.

26
manufacturers are trying to oblige them and empower them with information and also
educate them using DTCA.76 However, consumers not only need access to information,
but they also should be able interpret and evaluate it with ease. DTCA can help serve this
educational role for consumers.77
In the short-term, advertising of prescription drugs can help improve market
penetration and increase market share. In the long-term, advertising can build brand
equity so as to maintain market share even when competitors are introduced in the
market.78 As the size of the potential market increases, the probability that the
manufacturer will advertise to physicians and consumers increases, because the greater
the market potential for the drug, the lower the cost per treatment to advertise.79
DTCA has been constantly named as a factor responsible for increasing sales of
prescription drugs, in spite of the fact that physicians have to prescribe the drug. The
four related trends that explain the reason behind increase in sales include: (1) High
levels of advertising increases consumer awareness of prescription drugs and illnesses
they treat; (2) Awareness leads to a discussion of the prescription drug and/or condition
with the physician and an increase in physician visits for advertised conditions; (3)
Consumers are more likely to request an advertised drug; and (4) Consumers are
76 Berndt ER. The U. S. Pharmaceutical industry: Why major growth in times of cost containment. Health Affairs. March/April 2001;20(2):100-114.
77 Pines WL. Direct-to-consumer promotion: An industry perspective. Clinical Therapeutics. 1998;20(Suppl C):C96-103.
78 Jones JP. The ultimate secrets of advertising. Thousand Oaks, California: Sage Publications; 2002:9,10,95,171-174.
79 Sheffet MJ, Kopp SW. Advertising prescription drugs to the public: Headache or relief. Journal of Public Policy and Marketing. 1990;9(2):42-62.

27
persistent and will shop around until they can find a physician who will prescribe the
drug they want.80
The nature of the condition for which the drug is used, frequency of use, and
product life cycle stage influence advertising of prescription drugs. Most advertising at
later stages in the product life cycle will focus on product differentiation while products
in early stages will focus primarily on building awareness.81 Furthermore, products
nearing the end of the patent protection may be advertised to inform about a new
condition for the product or because it is being switched to an over-the-counter (OTC)
status and need to build brand equity or loyalty and help improve sales.82, 83
Managed care organizations (MCOs) and Pharmacy Benefit Managers (PBMs), in
an effort to control costs, have restricted drug formularies. The drugs included in the
formularies need to exhibit cost advantages with similar benefits when compared to
others or else provide therapeutic advances that would justify the high prices. Formulary
policies and restrictions have impacted the sales of drugs and manufacturers are now
under pressure to improve revenues by introducing drugs that have distinct advantages.
DTCA is also described as a mode of marketing directly to consumers those products that
80 Davis JJ. Riskier than we think? The relationship between risk statement completeness and perceptions of direct to consumer advertised prescription drugs. Journal of Health Communication. 2000;5(4):349-369.
81 Sheffet MJ, Kopp SW. Advertising prescription drugs to the public: Headache or relief. Journal of Public Policy and Marketing. 1990;9(2):42-62.
82 Frank R, Berndt ER, Donohue J, et al. Trends in direct-to-consumer advertising of prescription drugs. The Henry Kaiser Family Foundation. February, 2002. Available at: www.kff.org. Accessed December, 2002.
83 Morris LA, Mazis MB, Brinberg D. Risk disclosures in televised prescription drug advertising to consumers. Journal of Public Policy and Marketing. 1989;8(1):64 -80.

28
are only slightly more effective, with milder side-effects, or easier to use dosage
forms.84,85
The above reasons have propelled the growth in DTCA. The following sections
present the types of DTCA, history and regulatory issues related to DTCA.
Types of DTCA
There are four different types of direct-to-consumer advertisements. They are:
Product-specific advertisements usually mention the name of the product and the
condition it is intended to treat. It also describes the risks and benefits of using the
medication. These advertisements provide most information and are the most stringently
regulated.
Reminder advertisements may mention the name, dosage form, or the cost information
of the product. However, due to FDA’s restrictions, this type of advertisement cannot
mention or describe the condition it is used to treat or make any claims about the benefits
or risks of medication use. Furthermore, under the FDA regulations, these
advertisements are exempt from risk disclosure.
Help-seeking advertisements are not regulated by the FDA. This is due to the fact that
these advertisements do not mention the name of the drug. Generally, help-seeking
84 Frank R, Berndt ER, Donohue J, et al. Trends in direct-to-consumer advertising of prescription drugs. The Henry Kaiser Family Foundation. February, 2002. Available at: www.kff.org. Accessed December, 2002.
85 Hunt M. Direct-to-consumer advertising of prescription drugs. The George Washington University, Washington DC: National Health Policy Forum; April 1998.

29
advertisements describe and discuss a disease or condition and advise the patient to “see
your doctor” for possible treatment options for these symptoms or conditions.86
Institutional advertisements promote the general “goodness” of the pharmaceutical
company and do not mention a particular product or a single product category
specifically.87 Institutional advertisements mainly promote the attributes and purpose of
the company.
History of DTCA: Early History
In the history of prescription drugs, it is difficult to pinpoint exactly when
advertising of prescription drugs began. Consumer advertising of medications has been
seen in the United States as far back as in 1708 when Nicholas Boone introduced the first
patented drug in Boston, Massachusetts. At that time, the method of advertisement was
through the “Traveling medicine show.” Advertising of prescription drugs in newspapers
was very popular in the 1800s and early 1900s. During this time, newspapers received the
largest portion of their income through advertising of these drug products. In 1962, with
the passing of the Kefauver-Harris Drug Amendments, jurisdiction for advertising of
prescription drugs was transferred from the Federal Trade Commission (FTC) to the Food
and Drug Administration (FDA).88
In 1968, the FDA developed the concept of the patient package insert or the
product package insert (PPI) that required manufacturers to provide patients with more
86 Prescription drugs: FDA oversight of direct-to-consumer has limitations: United States General Accounting Office, Report to Congressional Requesters; October 2002. GAO-03-177.
87 Smeeding JE. Direct-to-consumer advertising of prescription pharmaceuticals: Strategic issues for the pharmaceutical industry. Topics in Hospital Pharmacy Management. 1990;10(1):40-64.
88 Glasgow C, Schommer JC, Gupta K, et al. Promotion of prescription drugs to consumers: Case study results. Journal of Managed Care Pharmacy. November/December 2002;8(6):512-518.

30
information. However, marketing to physicians was the dominant form of promotion.
Traditional marketing to physicians included a strong sales force that sought to “educate”
the physicians about the various products of a company, advertising in medical journals,
and a provision for physicians to receive information about the drugs either through the
sales force or via mail.89 In the past, pharmaceutical companies also promoted drugs to
physicians and students in medical schools with gifts.90
One of the consumers’ first experiences with DTCA of prescription drugs was for
Naprosyn® in England in 1978 when Syntex, a British company, introduced Naprosyn®, a
painkiller. This product and its campaign became the focus of several television talk
shows, which discussed the benefits and risks of the product. This kind of exposure
dramatically increased sales and the manufacturer found that this brief media exposure of
the product shortened the introductory phase of the products life cycle and moved the
product ahead to the maturity phase. Patients learned about the product early and as a
result of patient requests for the drug, physicians became early adopters of the
product.91,92
In the United States, in 1981, Britain-based Boots Pharmaceuticals was the first
company to promote their product Rufen® (Ibuprofen) directly to the consumers on
television and in print. The promotion was intended to stifle the generic competition.
Boots used comparative price advertising as the key component in its advertisements.
89 Pines WL. A history and perspective on direct-to-consumer promotion. Food Drug and Law Journal. 1999;54:489-518.
90 Silverman M, Lee PR. Drug Promotion: The Truth, the Whole Truth, and Nothing but the Truth. Pills Profits and Politics. Los Angeles: University of California Press; 1976:48-80.
91 Smeeding JE. Direct-to-consumer advertising of prescription pharmaceuticals: Strategic issues for the pharmaceutical industry. Topics in Hospital Pharmacy Management. 1990;10(1):40-64.
92 Rosen A. A new kind of opportunity. Advertising Age. September 1982;53.

31
These advertisements were aired mainly in Tampa, Florida and were the subject of
several television and radio talk shows in the area. As a result, consumer awareness
doubled and requests for the drug increased. The campaign revealed that consumer
awareness might have an effect on consumer behavior and stimulate discussions between
patients and physicians.93,94,95 Seeing the widespread effects of the campaign, the FDA
ordered Boots to withdraw the advertisements. The next product to be advertised was for
pneumonia vaccine called Pneumovax® by Merck Sharpe and Dome in the Readers
Digest in 1981.96,97
These introductory drug advertisements encouraged other manufacturers in the
U.S. to advertise their products. In the early 1980s, Lilly started advertising Oraflex®. On
introduction, Oraflex® received good publicity, but had to be withdrawn quickly due to
reports of deaths caused by the product.98 At the same time, Pfizer introduced “Partners
in Healthcare” which were a series of advertisements that covered diabetes, angina,
arthritis, and hypertension, but did not mention drug product names. The advertisements
did prominently mention the name of the company. These advertisements were
institutional advertisements, which promoted the “goodness” of the pharmaceutical
93 Pines WL. A history and perspective on direct-to-consumer promotion. Food Drug and Law Journal. 1999;54:489-518.
94 Smeeding JE. Direct-to-consumer advertising of prescription pharmaceuticals: Strategic issues for the pharmaceutical industry. Topics in Hospital Pharmacy Management. 1990;10(1):40-64.
95 Rx-to-consumer advertising debate starts up again. Drug Topics. October 1985;129:20-21.96 Pines WL. A history and perspective on direct-to-consumer promotion. Food Drug and Law Journal.
1999;54:489-518.97 Staff report on prescription drug advertising to consumers. United States Congress, House of
Representatives, Subcommittee on Oversight and Investigations of the Committee on Energy and Commerce. Washington DC: Government Printing Office; 1984.
98 Oraflex case seen changing the drug industry. The Wall Street Journal. Vol 76; 1982:33.

32
company.99 At the same time, many institutions also began to use advertising as a form
of public relations campaign.100 During this time (early 1980s), despite some marketing
successes, manufacturers were still hesitant to advertise drug products to consumers.
Only three of the 32 major firms surveyed favored using DTCA.101 Manufacturers were
not very enthusiastic about advertising to consumers because of the cumbersome
regulations and the fear that physicians would never accept it because it bypassed
them.102
Moratorium and its Effects
The FDA was concerned with the growing popularity of DTCA. Hence, in 1983,
the FDA decided to impose a voluntary moratorium on drug advertisements directed
toward consumers. This moratorium was on all forms of consumer-directed drug
advertising so that they could study the issue of DTCA, its benefits and risks and also
determine the regulations needed.103, 104 During this moratorium, the FDA encouraged
dialogue among consumers, healthcare professionals, and industry for research and
interpretation of findings on DTCA.105
99 Smeeding JE. Direct-to-consumer advertising of prescription pharmaceuticals: Strategic issues for the pharmaceutical industry. Topics in Hospital Pharmacy Management. 1990;10(1):40-64.
100 Perri M, Nelson AA, Jr. An exploratory analysis of consumer recognition of direct-to-consumer advertising of prescription medications. Journal of Health Care Marketing. 1987;7(1):9-17.
101 Congressional report advises against prescription drug advertising to consumers. American Pharmacy. January 1985;25(1):18.
102 Pines WL. A history and perspective on direct-to-consumer promotion. Food Drug and Law Journal. 1999;54:489-518.
103 Staff report on prescription drug advertising to consumers. United States Congress, House of Representatives, Subcommittee on Oversight and Investigations of the Committee on Energy and Commerce. Washington DC: Government Printing Office; 1984.
104 Cohen E. Direct-to-the public advertisement of prescription drugs. New England Journal of Medicine. 1988;318(6):373-376.
105 Direct-to-consumer advertisement of prescription drugs: Withdrawal of moratorium. Federal Register. September 9 1985;50:36677-36678.

33
During this time, the FDA realized that DTCA could serve as a mode of
information dissemination to the consumers regarding the benefits and risks of
prescription drug products.106 Several DTCA-related studies were conducted which tried
to ascertain the usefulness of DTCA and the risks associated with its use. The studies
discussed the popularity of DTCA and the emerging trend of advertising prescription
drugs directly to consumers. On September 9, 1985, the FDA lifted the moratorium on
DTCA and stated that the consumer-directed advertising had to fulfill the same
requirements as drug promotion directed to physicians. Thus, the advertisements had to
have a fair balance of benefit and risk information, provide a full disclosure with a “brief
summary” of risk information.107
Following the lifting of the moratorium, manufacturers began advertising drugs
more aggressively in print. At the same time, manufacturers began advertising on cable
television shows, which were directed to physicians. Cable Health Network’s Sunday
programming aired the first drug advertisement on television directed toward physicians.
The cable network agreed to place the “major statement” in a separate frame at the end of
the advertisement and also scroll the “brief summary” at the end of each two-hour
program block. When Cable Health Network was then taken over by Lifetime Medical
Network, Lifetime wanted to scroll the brief summary at midnight when regular
programming ended, but the FDA disagreed. The network agreed to include an 800
number in the advertisements so that viewers could call and obtain a package insert,
106 Christensen TP, Ascione FJ, Bagozzi RP. Understanding how elderly patients process drug information: A test of theory of information processing. Pharmaceutical Research. November 1997;14(11):1589-1596.
107 Direct-to-consumer advertisement of prescription drugs: Withdrawal of moratorium. Federal Register. September 9 1985;50:36677-36678.

34
which had to be mailed within 48 hours of request. The American Medical Association
(AMA) also launched its Medical News Network, which was only available to physicians
via closed circuit television. They had to follow the same requirements for
advertisements as Lifetime Cable Network. Eventually, all television networks that
advertised prescription drugs to physicians ceased to exist.108
The FDA requested manufacturers to voluntarily submit promotional materials for
review. According to the new regulations, DTCA had to provide a fair balance of benefit
and risk information and full disclosure with brief summary found in all prescription drug
packaging. In the advertisements, the brief summary that manufacturers had to provide
was not at all brief. It filled up a whole page in print advertisements and in television
advertisements they had to provide a scrolling view of the brief summary and provide full
disclosure to include everything in a 30-second slot. The manufacturers as a result, did
not advertise product-claim advertisements very much on television. Instead, they aired
reminder advertisements that mentioned just the name of the drug or help-seeking
advertisements that described signs and symptoms of a disease or condition without
mentioning the name of the drug. Many thought this would help consumers identify the
drug and ask the physician for guidance. Although institutional advertisements promoted
the image of the company, it did not hold much appeal to the manufacturers.109
Another trend that emerged with the lifting of the moratorium was the use of other
communication techniques in addition to DTCA. Other communication methods
108 Pines WL. A history and perspective on direct-to-consumer promotion. Food Drug and Law Journal. 1999;54:489-518.
109 Hunt M. Direct-to-consumer advertising of prescription drugs. The George Washington University, Washington DC: National Health Policy Forum; April 1998.

35
included media tours in which physicians and celebrities touted a particular product on
talk shows, or were interviewed by newspapers and magazines. Manufacturers began
using product-specific brochures, their own magazines for consumers, provided grants
and brochures to third party disease-oriented organizations to distribute information, and
press releases as a means to advertise their products. The FDA then declared that all the
materials produced by the manufacturers were subject to the same requirements as the
DTCA (fair balance and full disclosure). Even press releases had to fulfill the
requirement of fair balance.110
In the 1990s
Until 1990, manufacturers did not start full-scale advertising of prescription drugs
to consumers. Prescription drugs were predominantly advertised in print (magazines and
newspapers) rather than broadcast media since it was difficult to fulfill the brief summary
requirement in the limited time. The FDA began to recognize that the advertisements
were not helping the consumers, since they were not very communicative.111 In October
of 1995, the FDA held a public meeting to seek broad comment on DTCA advertising
regulations, to evaluate what was happening in the market place and decide what new
regulatory steps need to be taken. The purpose was “to solicit information and views of
interested persons such as healthcare professionals, scientists, professional groups, and
consumers.”112, 113
110 Pines WL. A history and perspective on direct-to-consumer promotion. Food Drug and Law Journal. 1999;54:489-518.
111 Pines WL. A history and perspective on direct-to-consumer promotion. Food Drug and Law Journal. 1999;54:489-518.
112 Pines WL. A history and perspective on direct-to-consumer promotion. Food Drug and Law Journal. 1999;54:489-518.

36
Finally, in August 1997, the FDA issued relaxed guidelines for advertising using
broadcast media.114 These guidelines will be discussed in more detail in the “Regulation
of DTCA” section. In August 1999, the FDA issued a final guidance on direct-to-
consumer television advertising, which did not include any significant changes since
1997.115 The goal of FDA’s requirements of “adequate provision” was to assure that
information was available to consumers through various channels so that consumers of
various literacy levels, access to technology, and propensity to seek information can get
the information.116 This relaxation of regulations for broadcast media resulted in a surge
in DTCA, especially via broadcast media.
Issues in Support of DTCA
DTCA is part of the growing plethora of information available to consumers and
is producing mixed reactions from a variety of healthcare and consumer groups. The
Pharmaceutical Research and Manufacturers of America (PhRMA), which is composed
of the research-intensive drug manufacturers, state that, “companies have both the right
and responsibility to inform consumers about the products under the supervision of the
FDA.” While these advertisements inform consumers and motivate them to seek help or
113 Direct-to-consumer promotion: Public hearing. Federal Register. August 16 1995;60(158):42581.114 FDA, Draft guidance for industry: Consumer-directed broadcast advertisements: Food and Drug
Administration, Center for Drug Evaluation and Research; August 1997.115 Guidance for industry: Consumer-directed broadcast advertisements: US Department of Health and
Human Services, FDA, Center for Drug Evaluation and Research, Center for Biologics Evaluation and Research, Center for Veterinary Medicine, DDMAC; August 1999.
116 Hunt M. Direct-to-consumer advertising of prescription drugs. The George Washington University, Washington DC: National Health Policy Forum; April 1998.

37
care for their condition, it does not dictate the outcome of the encounter with the
physician. 117
Proponents of DTCA claim that DTCA should not be viewed as an isolated
phenomenon developed by the industry with the sole purpose of increasing sales and
profits. Rather it should be viewed as an educational tool that constantly disseminates
information about changes and innovations that occur in the healthcare system.118 They
say that one of the main benefits of DTCA is that it is a valuable tool that can be used to
educate consumers and provide them with information about prevalent health conditions
as well as potential treatment options available.119,120, 121
The drug industry argues that consumers do not visit the doctor only because they
have seen an advertisement, but because they are suffering due to symptoms of a disease.
But once in the physicians’ office, patients may discuss the advertised drug. DTCA helps
strengthen patients’ belief and confidence in the physician and the treatment.122 Industry
advocates of DTCA also state that it encourages patient-physician communication and
can help improve patient outcomes through improved adherence.123
117 Pines WL. Direct-to-consumer promotion: An industry perspective. Clinical Therapeutics. 1998;20(Suppl C):C96-103.
118 Pines WL. Direct-to-consumer promotion: An industry perspective. Clinical Therapeutics. 1998;20(Suppl C):C96-103.
119 Barents Group L. Issue brief: Factors affecting the growth of prescription drugs expenditures. National Institute for Health Care Management. July, 1999. Available at: www.nihcm.org. Accessed January, 2001.
120 Holmer AF. Direct-to-consumer prescription drug advertising builds bridges between patients and physicians. Journal of the American Medical Association. 1999;281:380-382.
121 Findlay S. Research Brief: Prescription drugs and mass media advertising. National Institute for Health Care Management. September, 2000. Available at: www.nihcm.org. Accessed April, 2001.
122 Koberstein W. Old order meets new markets. Pharmaceutical Executive. September 2000;20(9):76-92.123 Williams JR, Hensel PJ. Direct-to-consumer advertising of prescription drugs. Journal of Health Care
Marketing. 1995;15(1):35-41.

38
The theory behind advertising is that it may help patients recognize the symptoms.
Those who do not recognize the symptoms will not associate it with the indications of a
disease and will not see a physician for it.124 Physician visits motivated by DTCA can
help detect conditions that would otherwise have been under treated, and allow
consumers to be more responsible for their own health.125, 126, 127, 128 In addition, DTCA
could help involve consumers in the decision-making process by helping them to evaluate
the options before the physician makes the decision.129, 130
The information from the advertisements enables patients to have a discussion with
the physician and inform them about some of the preferences or intolerances they may
have, which could otherwise be overlooked. Furthermore, the discussion between
patient and physician can result in a more precise matching of prescription drugs to
patients’ needs and preferences.131, 132
124 Lipton C. Consumer advertising and pharmaceuticals: A happy marriage? Journal of Pharmaceutical Marketing and Management. Winter 1986;1(2):23-28.
125 Barents Group L. Issue brief: Factors affecting the growth of prescription drugs expenditures. National Institute for Health Care Management. July, 1999. Available at: www.nihcm.org. Accessed January, 2001.
126 Holmer AF. Direct-to-consumer prescription drug advertising builds bridges between patients and physicians. Journal of the American Medical Association. 1999;281:380-382.
127 Findlay S. Research Brief: Prescription drugs and mass media advertising. National Institute for Health Care Management. September, 2000. Available at: www.nihcm.org. Accessed April, 2001.
128 Masson A, Rubin PH. Matching prescription drugs and consumers: The benefits of direct-to-consumer advertising. New England Journal of Medicine. August 22, 1985;313(8):512-515.
129 Smeeding JE. Direct-to-consumer advertising of prescription pharmaceuticals: Strategic issues for the pharmaceutical industry. Topics in Hospital Pharmacy Management. 1990;10(1):40-64.
130 Prescription drugs: Little is known about the effects of direct-to-consumer advertisements: United States General Accounting Office, Report to the Chairman, Subcommittee on Oversight and Investigations, Committee on Energy and Commerce, House of Representatives; July 1991. GAO PEMD-91-19.
131 Rosenthal MB, Berndt ER, Donohue JM, et al. Promotion of prescription drugs to consumers. New England Journal of Medicine. 2002;346(7):498-505.
132 Masson A, Rubin PH. Matching prescription drugs and consumers: The benefits of direct-to-consumer advertising. New England Journal of Medicine. August 22, 1985;313(8):512-515.

39
It is possible that due to the influence of DTCA, consumers are demanding a
specific prescription rather than a prescription.133 While opponents state that DTCA
would compel physicians to prescribe, proponents argue that physicians have the final
say in prescribing. If the physician does not think the drug is appropriate, they can offer
patients other alternatives and not feel compelled to prescribe the drug requested by
patients.134, 135 This is discussed in more detail in the Effects of DTCA – Inappropriate
Prescribing section later in this chapter.
DTCA can lead to rapid diffusion and adoption of drug innovations, which leads to
more rapid market penetration and an increase in market share.136 DTCA can help reduce
price by simulating competition at the retail level. It can also assist in avoiding other
healthcare expenditures that would be incurred if a condition were left untreated.137
DTCA can help improve public health and communication of health messages to
consumers. It is argued that the overall goal of advertising is to promote and protect
public health through dissemination of balanced and accurate communication of
information on prescription drugs.138, 139
133 Copeland C. Prescription drugs: Issues of cost, coverage, and quality. EBRI Issue Brief. 1999(208):1-21.
134 Rosenthal MB, Berndt ER, Donohue JM, et al. Promotion of prescription drugs to consumers. New England Journal of Medicine. 2002;346(7):498-505.
135 Wechsler J. Managed care and pharmaceutical costs. Pharmaceutical Executive. November 1998;18(11):18-22.
136 Smeeding JE. Direct-to-consumer advertising of prescription pharmaceuticals: Strategic issues for the pharmaceutical industry. Topics in Hospital Pharmacy Management. 1990;10(1):40-64.
137 Prescription drugs: Little is known about the effects of direct-to-consumer advertisements: United States General Accounting Office, Report to the Chairman, Subcommittee on Oversight and Investigations, Committee on Energy and Commerce, House of Representatives; July 1991. GAO PEMD-91-19.
138 Baylor-Henry M, Drezin NA. Regulation of prescription drug promotion: Direct-to-consumer advertising. Clinical Therapeutics. 1998;20(Suppl C):C86-C95.
139 Wilkes MS, Bell RA, Kravitz RL. Direct-to-consumer prescription drug advertising: Trends, impact, and implications. Health Affairs. 2000;19(2):110-128.

40
Issues Opposed to DTCA
The issue argued by opponents of DTCA is not whether there are deficiencies in the
awareness of medications existing among patients and physicians, but the fact that DTCA
has two conflicting goals.140 The two conflicting or opposing goals of DTCA are to
provide information to educate consumers and make a profit. However, it can be argued
that it is possible to meet the two goals because it is in the best interest of the industry to
be truthful.141, 142
Health insurance companies claim that they have to counter-detail the physicians to
offset the pressure of DTCA. The Pharmacy and Therapeutics committees in MCOs have
to review drugs more expeditiously due to increased demand caused by DTCA.
Sometimes few of the MCOs choose not to cover drugs that are marketed aggressively by
DTCA.143 They believe that DTCA increases demand for these drugs and hence the
expenditures when other cheaper drugs of similar profile are available which conflicts
with their goal to provide care while lowering costs.
Patients may be ill-equipped to understand and evaluate the advertisements of
prescription drugs.144,145,146 They may demand specific advertised drugs and may
140 Hoffman JR, Wilkes M. Direct to consumer advertising of prescription drugs: An idea whose time should not come. British Medical Journal. May 15, 1999;318(7194):1301-1302.
141 Ingram RA. Some comments on direct-to-consumer advertising. Journal of Pharmaceutical Marketing and Management. 1992;7(1):67-74.
142 Wind Y. Pharmaceutical advertising: A business school perspective. Archives of Family Medicine. April 1994;3(4):321-323.
143 IMS-Health. Paper presented at: Pharmaceutical Marketing Research Group, March 29, 1999.144 Holmer AF. Direct-to-consumer prescription drug advertising builds bridges between patients and
physicians. Journal of the American Medical Association. 1999;281:380-382.145 Hollon M. Direct-to-consumer marketing of prescription drugs. Journal of the American Medical
Association. 1999;281:382-384.146 Schommer JC, Doucette WR, Mehta BH. Rote learning after exposure to a direct-to-consumer
television advertisement for a prescription drug. Clinical Therapeutics. 1998;20(3):617-632.
41
mistakenly believe that there is a medication for every illness “pill for every ill” causing
increased consumption of medication in an already overmedicated society.147, 148 The
prescription drugs they demand are usually the newer and costlier drugs even though
there might be cheaper alternatives available or drugs might not be needed at all or is
unsafe for them and prove to be expensive to society. 149, 150, 151,152, 153 Use of these high-
priced medications and together with increased utilization increase prescription drug
expenditures.154 Opponents also claim that DTCA leads to increased prescription drug
prices. They also claim that manufacturers add the cost of advertising to the price of
drugs.155,156
Critics also argue that mass media is portraying prescription drugs simply as
another consumer product and trivialize its negative effects. Also, they argue that the
advertisements do not stress the importance of a physician in the prescribing process.157
These may result in inappropriate or unnecessary treatment, which is discussed in more
detail in the following section.
147 Smeeding JE. Direct-to-consumer advertising of prescription pharmaceuticals: Strategic issues for the pharmaceutical industry. Topics in Hospital Pharmacy Management. 1990;10(1):40-64.
148 Bradley LR, Zito JM. Direct-to-consumer prescription drug advertising. Medical Care. 1997;35(1):86-92.
149 Hoen E. Direct-to-consumer advertising: For better profits or for better health. American Journal of Health-System Pharmacy. 1998;55:594-597.
150 Cohen E. Direct-to-the public advertisement of prescription drugs. New England Journal of Medicine. 1988;318(6):373-376.
151 Findlay SD. Direct-to-consumer promotion of prescription drugs: Economic implications for patients, payers and providers. Pharmacoeconomics. 2001;19(2):109-119.
152 Scussa F. Consumer ads reach peak. Med Ad News. June 2002;21(6):1-8.153 Findlay S. Research Brief: Prescription drugs and mass media advertising. National Institute for Health
Care Management. September, 2000. Available at: www.nihcm.org. Accessed April, 2001.154 Understanding the effects of direct-to-consumer prescription drug advertising. The Henry Kaiser
Family Foundation. November 2001. Available at: www.kff.org. Accessed December, 2002.155 Scussa F. Consumer ads reach peak. Med Ad News. June 2002;21(6):1-8.156 Carey J, Barrett A. Drug prices what's fair? Business Week; December 10, 2001:61-70.157 Findlay S. Research Brief: Prescription drugs and mass media advertising. National Institute for Health
Care Management. September, 2000. Available at: www.nihcm.org. Accessed April, 2001.

42
Negative Effects of DTCA: Related to Physicians
In the 1980s, the AMA (representing physicians) was mainly opposed to DTCA
claiming that it would interfere with the patient-physician relationship. In 1993, the
AMA changed its stance mainly due to the commercial value of DTCA in its closed
circuit network directed to physicians. The AMA has always argued that disease-
specific, health educational advertisements were acceptable and product-specific
advertisements would be acceptable if they met all of the criteria developed by the AMA.
Most physicians are still opposed to DTCA, but the numbers are reducing each year.158
Physicians may feel threatened by DTCA because it provides information to consumers.
Physicians do believe that consumers do not completely understand this information.159
Several questions have been raised regarding the use and influence of DTCA and
the inappropriateness of inducing demand, which could lead to inappropriate
prescribing.160 Demand for prescription drugs by consumers has been stated as the most
common reason given by physicians for inappropriate prescribing.161 Seeing the
advertisements for the treatment of a condition or certain symptoms, patients may visit
the doctor for treatment of their symptoms or condition, which may be psychosomatic or
unrelated to the condition or treatment advertised thereby leading to inappropriate
treatment.
158 Pines WL. A history and perspective on direct-to-consumer promotion. Food Drug and Law Journal. 1999;54:489-518.
159 Pines WL. Direct-to-consumer promotion: An industry perspective. Clinical Therapeutics. 1998;20(Suppl C):C96-103.
160 IMS-Health. Paper presented at: Pharmaceutical Marketing Research Group, March 29, 1999. Paper presented.
161 Schwartz RK, Soumerai SB, Avorn J. Physician motivations for nonscientific drug prescribing. Social Science and Medicine. 1989;28(6):577-582.

43
Thus, advertising could cause patients to demand the advertised medications, which
could impact the patient-physician relationship.162,163,164,165,166 Demand for advertised
medications by patients can cause negative feelings between patients and physicians due
to raised and often unrealistic expectations. Physicians having to spend more time
discussing the advantages and disadvantages of the drug may cause a rift in the patient-
physician relationship.167 Physicians may also have to spend time with patients to discuss
and help patients interpret information provided by the advertisements and in some cases
explain why the drug is inappropriate.168, 169 Hollon suggests that DTCA undermines
physician authority regarding the need for prescription drugs and the drug that the
physician should prescribe. He argues that DTCA has no public health value and it
simply creates a demand for prescription drugs.170
162 Wilkes MS, Bell RA, Kravitz RL. Direct-to-consumer prescription drug advertising: Trends, impact, and implications. Health Affairs. 2000;19(2):110-128.
163 Hollon M. Direct-to-consumer marketing of prescription drugs. Journal of the American Medical Association. 1999;281:382-384.
164 Bell RA, Wilkes MS, Kravitz RL. Advertisement-induced prescription drug requests: Patients' anticipated reactions to a physician who refuses. Journal of Family Practice. 1999;48(6):446-452.
165 Bell RA, Kravitz RL, Wilkes MS. Direct-to-consumer prescription drug advertising and the public. Journal of General Internal Medicine. 1999;14(11):651-657.
166 Lipsky MS, Taylor CA. The opinions and experiences of family physicians regarding direct-to-consumer advertising. Journal of Family Practice. 1997;45(6):495-499.
167 Understanding the effects of direct-to-consumer prescription drug advertising. The Henry Kaiser Family Foundation. November 2001. Available at: www.kff.org. Accessed December, 2002.
168 Rosenthal MB, Berndt ER, Donohue JM, et al. Promotion of prescription drugs to consumers. New England Journal of Medicine. 2002;346(7):498-505.
169 Schwartz RK, Soumerai SB, Avorn J. Physician motivations for nonscientific drug prescribing. Social Science and Medicine. 1989;28(6):577-582.
170 Hollon M. Direct-to-consumer marketing of prescription drugs. Journal of the American Medical Association. 1999;281:382-384.

44
Physicians claim that advertising causes patients to come in the office with a
plethora of information and physicians are in a passive role of answering questions and
dispelling false notions. They believe that this could compromise patient care and also
take time away from the active role physicians want to play in treating the patient.171
Another argument regarding DTCA has been that it might lead to patients
believing that physicians are so uninformed and intellectually malleable that they are
easily manipulated into prescribing drugs demanded by patients.172 DTCA can lead to
confusion, unhealthy pressure on the “doctor-knows-best” patient-physician relationship,
and increased demand for brand-name costly drugs.173 With these ongoing debates and
the role DTCA is playing in today’s healthcare, the FDA has tried to regulate it
extensively.
Regulatory Issues for DTCA: Earlier Regulations
The 1914 Federal Trade Commission Act established a new oversight body to
police advertising claims. Section 12 of this act prohibits false advertisements that could
induce the purchase of food, drugs and cosmetics.174 This became the foundation for the
regulation of advertising until the 1962 Kefauver-Harris Drug Amendments. In 1938,
Congress passed the Food, Drug and Cosmetics (FD&C) Act that granted the FDA
jurisdiction over labeling of all drugs both prescription and OTC medications. The 1962
171 Holtz WE. Consumer-directed prescription drugs advertising: Effects on public health. Journal of Law and Health. 1998-99;13(2):199-218.
172 Angel JE. Drug advertisements and prescribing. Lancet. November 23 1996;348:1452-1453.173 Prescription drugs: Little is known about the effects of direct-to-consumer advertisements: United
States General Accounting Office, Report to the Chairman, Subcommittee on Oversight and Investigations, Committee on Energy and Commerce, House of Representatives; July 1991. GAO PEMD-91-19.
174 Sachs EA. Health claims in the market place: The future of FDA and the FTC's regulatory split. Food and Drug Law Journal. 1993;48:268-?

45
Kefauver-Harris Drug Amendments also transferred jurisdiction for prescription drug
advertising to the FDA, but left the authority to regulate OTC advertising with the
FTC.175 According to Section 502(n), the FDA regulated the promotion of prescription
drugs to physician and consumers.176
According to the Kefauver-Harris Amendments to the FD&C Act, the
advertisements should have the following attributes:
(a) Should not be false or misleading;
(b) Must present a fair balance of information on benefits and risks;
(c) Must contain facts regarding the advertised uses of the medication; and
(d) Provide “brief summary” which should include every risk from the product’s
approved labeling.177
To regulate DTCA, the FDA chose to adapt the extensive requirements for labeling
to advertising. Under section 502(a) of the FD&C Act, prescription drug labeling should
provide a brief summary and fair balance of benefits and risks.178 Advertisements of
prescription drugs should provide a “brief summary” which includes the adverse events
profile of the drug, contraindications, warnings, precautions, effectiveness, and
indications for use. This is called a “brief summary” because it does not have to contain
all of the dosage and pharmacological information that the drug’s labeling should have.
175 Kessler DA, Pines WL. The federal regulation of drug advertising and promotion. Journal of the American Medical Association. November 14, 1990;264(18):2409-2415.
176 21 U.S.C. § 352(n) {FDCA § 502(n)}.177 Kefauver-Harris Act 21. Code of Regulations. Vol 2.2.1; 1962.178 Kessler DA, Pines WL. The federal regulation of drug advertising and promotion. Journal of the
American Medical Association. November 14, 1990;264(18):2409-2415.

46
The advertisements should provide a balanced account of clinically relevant information
of benefits and risks that could influence prescribing decisions.179
In 1985, the FDA decided that the current regulations for marketing to physicians
could be applied to DTCA and lifted the moratorium they had placed in 1983. In order to
advertise prescription drugs to consumers, the pharmaceutical industry was required to
meet the same standards as advertising to healthcare professionals, which included
providing a fair balance, full disclosure, and brief summary for the prescription drugs.180
These requirements were very cumbersome and hence drug advertisements were mainly
seen in print rather than broadcast media. The brief summary requirement made it very
difficult to create advertisements for broadcast media because it required that the brief
summary be scrolled across the screen within 30 seconds. Manufacturers instead began
advertising reminder advertisements, but this proved to be very confusing since
consumers had to guess the condition the drug is used to treat.181
Regulatory Changes in 1997 and 1999
After more than a decade of debating the wisdom of DTCA, the FDA issued
guidance in August 1997 that relaxed the rules for broadcasting prescription drugs
advertisements to consumers. One main point of this guidance was that the FDA did not
179 Hunt MI. Prescription drug costs: Federal regulation of the industry. Blue Cross Blue Shield Association. September 2000. Available at: http://bcbshealthissues.com/proactive/newsroom/release.vtml?id=17521. Accessed November, 2002.
180 Direct-to-consumer advertisement of prescription drugs: Withdrawal of moratorium. Federal Register. September 9 1985;50:36677-36678.
181 Hunt MI. Prescription drug costs: Federal regulation of the industry. Blue Cross Blue Shield Association. September 2000. Available at: http://bcbshealthissues.com/proactive/newsroom/release.vtml?id=17521. Accessed November, 2002.

47
require the industry to provide a detailed summary of information on the use, potential
indications and adverse events of the drugs in the mass media advertisements.182
According to the regulations of 1997 and 1999, print and broadcast product-specific
advertisements had to fulfill different requirements. Table 2.1 summarizes these
requirements.
Table 2.1: Regulatory Requirements and the Explanations for Print and Broadcast Product-Specific Advertisements
Advertising Medium Regulatory Requirements ExplanationCannot be false or misleading Must present information that is not
inconsistent with product labelMust present fair balance Must include risks and benefits of a
drug product Print and broadcast
Must present “facts material” Must present information relevant to representations made and describe consequences that may result from recommended use
Print only Must describe risks Must disclose all risks in product’s labeling
Must describe risks Must present major side effects and contraindications in audio or audio and visual form
Broadcast only Must make adequate provision for directing consumers to labeling information, or provide a brief summary of all necessary information related to risks
Must provide additional sources where consumers can find complete information such as toll-free telephone number, a website, a print advertisement in a magazine and by contacting their physician; otherwise must summarize the risks
Source: 21 C.F.R. § 202; FDA, Guidance for industry: Consumer –directed broadcast advertisements (Washington DC: FDA, August 1997)
This guidance made broadcast advertising of prescription drugs easy and attractive.
Instead of having to scroll the brief summary across the screen in 30 seconds,
advertisements had to fulfill the following requirements:
182 Findlay SD. Direct-to-consumer promotion of prescription drugs: Economic implications for patients, payers and providers. Pharmacoeconomics. 2001;19(2):109-119.

48
� The advertisements should not be false or misleading and present a fair balance of
information on benefits and risks of the products.
� Advertisements should include a major statement that conveys risk information and
all information relevant to product’s indication in a consumer-friendly language.
� Broadcast advertisements should provide a “brief summary” or alternatively may
make “adequate provision for dissemination of approved or permitted package
labeling in connection with the broadcast presentation” {21 CFR202.1(e)(1)}. To
fulfill the adequate provision requirement, advertisers can use the following:
(a) Provide an operating toll-free telephone number that consumers can call for
approved package labeling. Upon calling, consumers are given a choice of having
the labeling information mailed to them (mailed within two business days for
receipt within four to six days) or have the labeling information read to them over
the phone.
(b) Advertisements should include a reference to a print advertisement in publications
widely disseminated. If print advertisement is part of the adequate provision then
it should also supply a toll-free telephone number and an address for consumer
access of product packaging information. An alternative mechanism would be to
ensure availability of sufficient number of brochures containing the information in
a variety of publicly accessible sites (pharmacies, grocery stores, public libraries,
and doctor’s offices).
(c) Provide an internet address that provides package labeling.

49
(d) Provide a statement that information can also be obtained from physicians,
pharmacists or other healthcare provider (veterinarians in the case of animal
drugs).183, 184
In 1999, the FDA issued modified guidance, which did not differ significantly from
the guidance of 1997. According to the guidance issued, the FDA cannot require drug
manufacturers to submit advertisements to be reviewed before they are aired or printed.
However, it does require that manufacturers submit the promotional materials at the time
of initial publication as part of its post-marketing surveillance. Print advertisements
associated with the broadly disseminated broadcast commercials were required to meet
the “adequate provision” requirement and should be broadly disseminated in terms of
target audience. This meant that the print advertisements were to be readily available to
the consumers and if printed in a magazine, for example, then the magazine should have
a wide distribution.185
Other Regulatory Issues
As a part of regulating advertisements, the FDA sends regulatory letters to
manufacturers for advertisements that are misleading or are violating the regulations.
There are two types of letters – untitled letters or notice of violation and warning letters.
Untitled letters are sent to address violations such as overstating the effectiveness of the
drug, off-label use or broader range of use than the use for which the drug is indicated,
183 FDA, Draft guidance for industry: Consumer-directed broadcast advertisements: Food and Drug Administration, Center for Drug Evaluation and Research; August 1997.
184 Guidance for industry: Consumer-directed broadcast advertisements: US Department of Health and Human Services, FDA, Center for Drug Evaluation and Research, Center for Biologics Evaluation and Research, Center for Veterinary Medicine, DDMAC; August 1999.
185 21 C.F.R. § 314.81(3).

50
misleading claims, inadequate context or lack of balanced risk information. Warning
letters are sent to address more serious violations such as safety and health risks or
continued violations of regulations. These letters warn the company to rectify their errors
and suggest that FDA may take judicial remediation. They advise the company to
conduct a new advertising campaign to rectify inaccurate impressions of the previous
one. The manufacturers are given 14 days to take remedial actions on receiving either of
the two types of letters.186
With DTCA, lawmakers are now questioning the learned intermediary role of
physicians. Until DTCA, physicians served as the first line of information and this
relieved manufacturers of the task of designing warning messages and risk information
that an average consumer could understand. Advertising helps consumers participate in
the decision-making process with the doctor no longer being the sole decision-maker.
Advertising does have an impact on consumers’ demand for advertised prescription drugs
and reiterates the role of physicians as the learned intermediary between manufacturers
and consumers. Even though physicians are still the decision-makers, they are no longer
the only or first line for information.187
Advertisements try to create the notion that the drugs are very beneficial with very
few risks, which may be true for some drugs. However, regulations do not take into
account the impact of the visual parts of the advertisements. Also, advertisers get to
186 Prescription drugs: FDA oversight of direct-to-consumer has limitations: United States General Accounting Office, Report to Congressional Requesters; October 2002. GAO-03-177.
187 Schwartz TM. Consumer-directed prescription drug advertising and the learned intermediary rule. Food Drug Cosmetic Law Journal. 1991;46(6):829-848.

51
choose which side effects and contradictions are significant enough to be included as part
of the “brief summary.”188
With this background on DTCA of prescription drugs, the next sections will
review the literature on opinions of consumers, physicians, and pharmacists regarding
DTCA. This review will also discuss DTCA-related studies on adherence, public health,
inappropriate prescribing and evaluation of the contents of the advertisements.
GAO Report: Review of DTCA Literature, 1984-1990
Until the 1980s, consumer advertising was not considered important since
consumers did not have much of a say in the drugs being prescribed. In the 1980s,
manufacturers began advertising in earnest to increase revenues and profits. The General
Accounting Office (GAO) reviewed 130 empirical studies conducted between 1984-1990
on DTCA of prescription drugs. The objectives of the review were to identify the
efficacy of DTCA in regards to the benefits and risks, attitudes of consumers and
physicians, and identify the robustness of the methodologies of the studies. The review
also tried to identify the research gaps in DTCA literature.189
The review did not find any credible studies from which the extent of physician
and consumer acceptance or opposition or potential for attitudinal change could be
ascertained. There were in all 17 studies conducted that tried to determine physician and
consumer attitudes toward DTCA. But these studies had limited usefulness because
188 Holtz WE. Consumer-directed prescription drugs advertising: Effects on public health. Journal of Law and Health. 1998-99;13(2):199-218.
189 Prescription drugs: Little is known about the effects of direct-to-consumer advertisements: United States General Accounting Office, Report to the Chairman, Subcommittee on Oversight and Investigations, Committee on Energy and Commerce, House of Representatives; July 1991. GAO PEMD-91-19.

52
opinions regarding DTCA can change depending on type of advertising media and
content. The studies did not address this issue and did not represent opinions of
physicians and consumers adequately due to flawed sampling designs. Hence, the studies
could not measure the extent of positive or negative opinions regarding DTCA. A
majority of the consumers were not aware of DTCA and hence their opinions were based
on their experiences such as advertisements for other products. In general, consumers
were supportive of DTCA and believed that it would serve as an educational and
informational tool. The studies indicated that, in general, physicians were more opposed
to DTCA because of their belief that it will undermine physician-patient relationship.
Also, there was a lack of information regarding the influence of types of DTCA by
media and content and their different consequences. The gaps in the knowledge of DTCA
that existed included likely effects (benefits or risks) and effect on price.
The possible benefits gleaned from the studies included educational value,
improvement in patient-physician relationship, increase in patient compliance, increase in
the regularity of physician visits, lower prices, and support for advertisers’ first
amendment rights and consumers’ right to information. The possible detriments included
damage to patient-physician relationship, inability of consumers to understand technical
information, inadequate risk information, increase in prices, increase in liability actions,
loss of drug industry’s liability protection, misleading nature of promotional materials,
overmedication and drug abuse, pressure by patients on physicians to prescribe, and
waste of physician’s time.

53
The studies that tested these effects of DTCA were limited in generalizability.
Most studies cited the main effects of DTCA including increased involvement in
healthcare, “physician shopping,” increased costs, and inadequate risk information.190
This review of studies reported by the GAO will be discussed in more detail in the
appropriate sections.
DTCA and the Consumer: Opinions of Consumers
In the 1980s, the major controversy was if the regulations were sufficient to make
sure that DTCA did not have any negative consequences. Also, policy makers wanted to
make sure that: (a) Consumers understood DTCA; (b) Consumers understood the risk
information; and (c) If consumers wanted more information they has access to it.
Physicians had always enjoyed the position of immense trust and were not questioned
regarding their choice of medications. DTCA however, is changing this scenario with the
patient demand being introduced in the care model.191
According to the GAO review of studies conducted between 1984-1990,
awareness of DTCA was not very high. According to the seven studies reviewed,
consumers misunderstood 5.0-20.0 percent of the promotional messages in the
advertisements but believed that DTCA would provide them with information. Most
consumers did not support DTCA, but they did support the nonspecific types of DTCA.
However, the studies did not determine attitudes by different demographic characteristics
190 Prescription drugs: Little is known about the effects of direct-to-consumer advertisements: United States General Accounting Office, Report to the Chairman, Subcommittee on Oversight and Investigations, Committee on Energy and Commerce, House of Representatives; July 1991. GAO PEMD-91-19.
191 Everett SE. Lay audience response to prescription drug advertising. Journal of Advertising Research. April/May 1991;31(2):43-49.

54
or the changes in attitudes over time.192 Following are additional DTCA-related studies
that have evaluated the awareness and attitudes of consumers toward DTCA.
Attitudes and Awareness
DTCA was a source of concern for the first time in the early 1980s. In 1983, to
study the issue, the FDA placed a voluntary moratorium on all advertisements for
prescription drugs. During this time, the FDA held 50 “town hall” meetings and
conducted surveys to understand the attitudes of consumers towards DTCA. Among the
approximately 1200 consumers surveyed, they were divided in their approval of DTCA.
While 20.0 percent favored DTCA, 30.0 percent favored it only with strong government
regulations. The main drawback of these surveys was that a majority of the participants
were healthcare professionals or members of consumer advocacy groups that were known
to oppose DTCA.193
In a study published in 1993, Alperstein and Peyrot identified the extent to which
consumer attitudes are influenced by exposure to advertising or awareness of advertising.
A total of 35.0 percent of respondents (N=440) had heard of prescription drug advertising
and 38.5 percent had seen at least one advertisement for a prescription drug indicating
that awareness of DTCA was moderately high. A very high percentage of consumers
(69.1%) thought that the drug advertisements would help educate them but some
consumers (28.4%) thought it would confuse them. Individuals exposed to print media
192 Prescription drugs: Little is known about the effects of direct-to-consumer advertisements: United States General Accounting Office, Report to the Chairman, Subcommittee on Oversight and Investigations, Committee on Energy and Commerce, House of Representatives; July 1991. GAO PEMD-91-19.
193 Morris LA, Brinberg D, Klimberg R, et al. The attitudes of consumers toward direct advertising of prescription drugs. Public Health Reports. January/February 1986;101:82-89.

55
were more likely to have seen an advertisement and being a regular user of prescription
drugs helped in the higher awareness. Attitudes of consumers toward DTCA were
generally positive and were associated with high levels of awareness. The belief that the
physician should be the sole source of information, advertising would weaken the patient-
physician relationship, and that advertising would confuse consumers were associated
with low awareness.194
A study by Williams and Hensel evaluated attitudes of consumers towards DTCA
specifically among older adults 59 years and older (N=132). Print advertisements for
Minitran® patches appearing in the January 1991 issue of Better Homes and Gardens
magazine were selected as the subject advertisement for the study. Overall, respondents
were more likely to ask their physician rather than a pharmacist for more information.
However, those with positive attitudes toward DTCA were more likely to seek
information from a friend or a pharmacist than a physician. Individuals with lower
education and of poor health were more likely to have positive attitudes toward DTCA.195
Consumer awareness of prescription drug advertising has been increasing along
with the widespread use of DTCA. This has influenced the attitudes and susceptibility of
consumers to the advertising. During spring of 1998, a survey of 329 consumers reported
that, on average, consumers were aware of at least four of the ten drugs that were being
advertised at the time of the survey (Accolate®, Buspar®, Claritin®, Fosamax®,
Glucophage®, Imitrex®, Pravachol®, Prilosec®, Prozac®, and Sporanox®). Consumers, on
194 Alperstein NM, Peyrot M. Consumer awareness of prescription drug advertising. Journal of Advertising Research. July/August 1993;33:50-56.
195 Williams JR, Hensel PJ. Direct-to-consumer advertising of prescription drugs. Journal of Health Care Marketing. 1995;15(1):35-41.

56
average, were aware of advertising for three to four drugs (mean=3.72) of the ten drugs.
Women, on average had seen more advertisements than men (4.00 vs. 3.31
advertisements). Awareness was significantly higher (p<0.001) for those who had high
exposure to print media, who were taking prescription medication, were frequent viewers
of television, had more positive attitudes toward DTCA, were female, had evaluated their
general health least positively, and believed that the health plan would cover the cost.
Individuals were more likely to notice an advertisement for a condition they were
diagnosed with, indicating that subjective utility and personal value influence awareness.
Many consumers were also under the wrong impression that the government reviews
DTCA (50.0%) and only “extremely safe” (43.0%) and “efficacious” (21.0%) drugs are
advertised. Mainly consumers with a positive attitude about DTCA had undue faith in the
regulations indicating that they were not adequately informed.196
In 2000, the Kaiser Family Foundation, Harvard School of Public Health and the
News Hour with Jim Lehrer conducted a national survey (N=1,701 adults) regarding
several issues related to prescription drugs. Most consumers (91.0%) reported seeing an
advertisement for prescription drugs in the past year. Most consumers saw the
advertisement on television (86.0%) and newspaper magazine (73.0%). Approximately
half the consumers who had seen an advertisement reported that DTCA did an excellent
or good job describing the benefits (58.0%) and side-effects (45.0%) of the drug and the
196 Bell RA, Kravitz RL, Wilkes MS. Direct-to-consumer prescription drug advertising and the public. Journal of General Internal Medicine. 1999;14(11):651-657.

57
disease it treats (51.0%). One-half of the consumers (48.0%) trusted the advertisements to
provide accurate information about prescription drugs.197
In 2001, the Kaiser Health Foundation conducted another survey of 1,872
“viewers” of the three drug advertisements selected for the study to understand consumer
awareness of DTCA. Most consumers (59.0 percent) reported that they knew only a little
or nothing more about the medication after seeing the advertisement. The study reported
that while DTCA does raise awareness of health conditions and treatment options, the
extent to which they educate the consumer is mixed depending on the consumer’s initial
knowledge about the condition or the drug. Consumers are able to glean information on
name of medicine and condition that it treats, but have difficulty with knowledge
regarding side-effects and sources of additional information.198
In 1998, the American Association for Retired Persons (AARP) surveyed 1,310
consumers 50 years and older to assess their knowledge regarding health issues,
medications, and their side effects. This study also evaluated the impact of DTCA on the
consumers and the role played by pharmacists and physicians in providing information.
The survey found that consumers viewed DTCA as having limited educational value and
considered it as one of the many sources of information. The consumers did not always
take notice or did not understand the key information in the advertisement. They reported
that the advertisements “usually” (49.0%) or “sometimes” (24.0%) provided enough
information regarding what the drugs were for. A few of the consumers (20.0%),
197 National survey on prescription drugs. The News Hour with Jim Lehrer, The Henry Kaiser Family Foundation, Harvard School of Public Health. September 2000. Available at: www.kff.org. Accessed January, 2002.
198 Understanding the effects of direct-to-consumer prescription drug advertising. The Henry Kaiser Family Foundation. November 2001. Available at: www.kff.org. Accessed December, 2002.

58
especially the older consumers (60 years and over), reported that most printed
advertisements do not “clearly” convey the message that the product is available through
prescription only. The consumers were divided in their assessment of how well DTCA
informs them of risks and possible side effects. A total of 50.0 percent of the consumers
agreed that the advertisements contain enough information on risks and possible side-
effects.199
The AARP survey also reported that for many consumers, healthcare
professionals (physician and pharmacists) were not the only source of information about
the medications. Only 54.0 percent of the consumers reported that the physician or
pharmacist talks to them about the product’s risks and side-effects and 21.0 percent of the
consumers reported requesting information about prescription drugs from the physician
who was not familiar with it. The survey suggests that consumers, especially the elderly
(60 years and older), are not receiving enough information in spite of the proliferation of
DTCA. Even healthcare professionals are not providing enough information to the
consumers and sometimes not even aware of the new information.200 As a result,
consumers are seeking other sources of information.
In a study published in 2000, Burak and Damico examined the use of medications
advertised among college students (N=471). Most students (83.9%) reported to have
looked at magazine advertisements for prescription drugs indicating the attention they
pay to the advertisements. A majority of the students (89.0%) had used at least one
199 Foley LA, Gross DJ. Are consumers well informed about prescription drugs? Washington DC: AARP Public Policy Institute; April 2000.
200 Foley LA, Gross DJ. Are consumers well informed about prescription drugs? Washington DC: AARP Public Policy Institute; April 2000.

59
advertised drug and on average used 2.3 advertised drugs. However, many did not talk to
their doctor about the medications. For example, only 43.0 percent of the female students
who reported using advertised medications for yeast infections talked to the physician
about the product even when they experienced the problem regularly. A total of 14.4
percent of the students experienced depression but only 5.7 percent reported this to the
physician. Only one third of the students who experienced headaches (31.3%) and
menstrual discomfort (34.3%) talked to the physician about these complaints. This study
points out some areas for concern regarding DTCA including incorrect self-diagnosis and
inability to discuss their symptoms with their physician.201
Gönül et al. investigated the influence of demographics and the exposure to
marketing on consumers and physicians. Scott-Levin series of surveys for years 1989,
1991, 1993 and 1995 with a sample of 771 respondents were selected for the study. The
overall attitude towards the advertising of prescription drugs to the public was positive
and the consumer evaluation of DTCA was moderately positive. The study did not
provide exact percentages, but most consumers (over half) reported that they would be
interested in seeing an advertisement by a pharmaceutical manufacturer. However,
patients would prefer that advertisements be distributed in the physician’s office when
they can talk to the physician. The study also found that older consumers with a high
level of education, and who had been sick lately were more likely to trust their physician
and this can reduce their valuation of the drug advertisements. These consumers were
also more likely to trust the physicians’ judgment and less likely to bring the prescription
201 Burak LJ, Damico A. College students' use of widely advertised medications. Journal of American College Health. November 2000;49(3):118-121.

60
drug advertisement to the physicians’ attention. Individuals who use medications for
chronic conditions and regularly talk to their physician or pharmacist about their
medication are usually active participants in the healthcare decision-making process and
value DTCA. These individuals were more likely to discuss the advertisements with the
physician.202 As a result of DTCA, consumers are talking to physicians more often about
advertised drugs and even requesting them.
Studies Conducted by the FDA
The FDA conducted two surveys in 1999 (N=960) and 2002 (N=943) to examine
the influence of DTCA on physician-patient relationships and found that the number of
consumers who recalled advertisements increased from 72.0 percent in 1999 to 81.0
percent in 2002. Most advertisements in both years were viewed on television followed
by magazines. During both years, a majority of the consumers recalled benefits, risks
and side effects, who should take or not take, and had questions for the doctor regarding
the advertisements seen on television.203, 204
The study found that in 2002, consumers visited a doctor because they had seen
an advertisement (5.0%) or they wanted the advertised prescription drug (4.0%). During
a physician visit, the consumers who asked about a new condition because of an
advertisement decreased from 1999 (27.0%) to 2002 (18.0%). Few consumers asked
202 Gönül FF, Carter B, Wind J. What kind of patients and physicians value direct-to-consumer advertising of prescription drugs. Health Care Management Science. 2000;3(3):215-226.
203 Attitudes and behaviors associated with direct-to-consumer promotion of prescription drugs. Center for Drug Evaluation and Research, FDA. 1999. Available at: www.fda.gov/cder/ddmac/research.htm. Accessed November, 2002.
204 Aikin KJ. Direct -to-consumer advertising of prescription drugs: Preliminary patient survey results. Division of Drug Marketing, Advertising and Communications, FDA. April 18, 2002. Available at: www.fda.gov/cder/ddmac/DTCnational2002a/sld001.htm. Accessed May 2002.
61
about a specific brand (1999-13.0%, 2002-7.0%). In 2002, 23.0 percent of the patients
reported they would talk to the doctor about a drug to treat a condition compared to 7.0
percent that would ask the doctor about a specific brand.205, 206
The FDA studies reported that when consumers were questioned regarding the
physician’s reaction to their question regarding a drug, the responses were similar for
both years. Most frequent responses were that physicians when asked about the
advertised drug, welcomed the question (1999-81.0%, 2002 – 93.0%), discussed the drug
(1999-79.0%, 2002–86.0%), and reacted like it was an ordinary part of the visit (1999-
71.0%, 2002 – 83.0%). A very small percentage (1999- 4.0%, 2002 – 3.0%) of
consumers reported that their physicians were angry or upset. In both 1999(50.0%) and
2002 (48.0%), almost half the consumers received the prescription they asked for. Some
other responses from physicians to the request for an advertised drug was to recommend
another drug, recommend an OTC product, and/or a behavior or lifestyle change. In the
2002 survey, in response to the question regarding relationship with the physician, most
consumers reported that they had a better (20.0%) or same (77.0%) relationship with their
physician as a result of requesting an advertised drug. Again in 2002, there appeared to
205 Attitudes and behaviors associated with direct-to-consumer promotion of prescription drugs. Center for Drug Evaluation and Research, FDA. 1999. Available at: www.fda.gov/cder/ddmac/research.htm. Accessed November, 2002.
206 Aikin KJ. Direct-to-consumer advertising of prescription drugs: Preliminary patient survey results. Division of Drug Marketing, Advertising and Communications, FDA. April 18, 2002. Available at: www.fda.gov/cder/ddmac/DTCnational2002a/sld001.htm. Accessed May 2002.

62
be few differences in the overall interaction between physician and patient irrespective of
whether patients asked about a prescription drug or not.207, 208
Prevention Magazine Studies
Prevention magazine with the assistance of the FDA’s Division of Drug
Marketing, Advertising and Communications (DDMAC) conducted a series of surveys to
track consumer awareness of DTCA and evaluate the overall effectiveness of advertising.
Results of the Prevention magazine surveys are summarized in Table 2.2.
The first of this series of surveys was conducted in 1997 with the assistance of the
American Pharmaceutical Association (APhA). Consumers who had the condition for
which the advertised drug was used were more likely to recall the contents of
advertisements than those who did not have the condition. Of the 63.0 percent of
consumers who were aware of DTCA, 27.0 percent asked about the specific health
condition. Consumers over 50 years of age, college graduates, and those using
prescription drugs were more likely to have talked to the physician about an advertised
drug. It is possible that consumers with a college education were more likely to have
healthcare coverage with improved access to physicians and hence more likely to discuss
the medication with their doctor.209
207 Attitudes and behaviors associated with direct-to-consumer promotion of prescription drugs. Center for Drug Evaluation and Research, FDA. 1999. Available at: www.fda.gov/cder/ddmac/research.htm. Accessed November, 2002.
208 Aikin KJ. Direct-to-consumer advertising of prescription drugs: Preliminary patient survey results. Division of Drug Marketing, Advertising and Communications, FDA. April 18, 2002. Available at: www.fda.gov/cder/ddmac/DTCnational2002a/sld001.htm. Accessed May 2002.
209 Navigating the medical marketplace: How consumers choose. Washington DC: Prevention Magazine and the American Pharmaceutical Association; 1997.

63
Table 2.2: Prevention Magazine Survey Results Summarized, 1997-2002Years 1997 1998 1999 2000/2001 2001/2002 Total N 1,202 1,200 1,205 1,222 1,601Awareness of DTCA: Seen or heard advertisements for specific prescription drugs
63.0% 70.0% 81.0% 80.0% 85.0%
Had seen at least one advertisement for a specific drug
NA NA 95% 91.0% 99.0%
Asked physician about an advertised prescription drug
31.0% 33.0% 31.0% 32.0% 32.0%
Requested physician to prescribe an advertised prescription drug(Of those who talked to the physician)
29.0% 28.0% 28.0% 26.0% 29.0%
Physician prescribed the requested advertised drug (Of those who requested the drug)
73.0% 80.0% 84.0% 71.0% 77.0%
Physician prescribed the requested advertised drug – percentage of the whole sample
4.0% 6.0% 7.0% 5.0% 7.0%
Discusses health condition as a result of seeing an advertisement for a drug that treats it
NA 13.0% 14.0% NA 13.0%
NA – Not askedSource: Slaughter E. Consumer reaction to DTC advertising of prescription medicines. Emmaus, PA:
Prevention Magazine, Rodale Inc; 2001/2002.
In the 1998 and 1999 survey, consumers reported that the advertisements did not
do a good job of educating them about the conditions they intend to treat. In both years,
men and the older adults were less likely to recall drug advertisement. In both years,
consumers reported that their doctors were very willing to discuss the advertised drug and
prescribe them as well. Some consumers (1998 – 27.0% 1999 – 28.0%) reported that the
advertisements were not too clear or not at all clear. It is possible that this confusion and
ambiguity of the advertisements may be due to the newness of advertising under new
regulations during the time of this study in 1998. But consumers reported the same in the
1999 survey. Increased spending on DTCA increased the awareness and not necessarily
the knowledge of product indications. In both years, very few consumers agreed that drug

64
advertisements on television and in magazines did an excellent job in providing
information regarding both serious and not serious side-effects (9.0%-12.0%) and
benefits (13.0%-15.0%) of the prescription drugs and helped them get more involved in
their own healthcare and make the decisions. In 1998 (13.0%) and 1999 (14.0%), after
seeing an advertisement, few consumers talked to their physician about a medical
condition that they had not discussed previously.210, 211
In the 2000/2001 survey, among consumers who requested an advertised drug
from the physician, half (53.0%) were recommended a non-drug therapy (diet, behavioral
change). Women were more likely to recall at least eight of the ten prescription drugs
included in the survey. More women (93.0%) recalled the drug advertisements than men
(90.0%). For all drugs selected for the survey, individuals diagnosed with the advertised
conditions were more likely to recall advertisements than those who were not diagnosed
with the condition. The survey found that DTCA still did a poor job of informing
consumers what the drugs treated. Consumers reported that DTCA did not provide
enough risk (30.0%) and benefit (27.0%) information they would need to talk to the
doctor.212
The 2001/2002 survey results indicated that DTCA might have a positive
influence on consumer perceptions of prescription medications. Similar to the 2000/2001
survey, in response to questions about advertised drugs, most consumers (60.0%)
210 National survey of consumer reactions to direct-to-consumer advertising. Emmaus, PA: Prevention Magazine, Rodale Inc.; 1998.
211 National survey of consumer reactions to direct-to-consumer advertising. Emmaus, PA: Prevention Magazine, Rodale Inc.; 1999.
212 Slaughter E, Schumacher M. International survey on wellness and consumer reaction to DTC advertising of Rx drugs. Emmaus, PA: Prevention Magazine, Rodale Inc.; 2000/2001.

65
reported that the physician recommended a non-drug therapy (diet, behavioral change).
Among consumers who were taking the advertised prescription drug and have also seen
an advertisement for it, 40.0 percent reported that the advertisements make them feel
better about the benefits of the drugs and 34.0 percent felt better about the safety of the
drug. DTCA provides consumers an opportunity to learn about new treatment options and
information regarding the benefits and risks of the drug. 213
DTCA-Related Canadian Studies
In Canada, even though DTCA is not legal, Canadians are exposed to DTCA
through cable television that is broadcasted across the border from the U.S. Mintzes et al.
conducted a study to assess the impact of DTCA by comparing effects on consumers in
Canada and the U.S. Patients were surveyed from physician practices in Vancouver,
British Columbia (N=748) during June-August 2000 and Sacramento, California (N=683)
during March-June 2001. Fewer patients (15.1%) in Vancouver believed that they needed
prescription drugs than patients (22.1%) in Sacramento (OR=1.6, 95% CI=1.2-2.1).214
Patients in Sacramento made more number of drug requests than patients from
Vancouver (p<0.001); any drug request (15.8% vs. 9.0%), and at least one advertised
drug request (7.3% vs. 3.2%). Even after adjusting for demographic characteristics,
health status, and socio-economic factors, patients in Sacramento were twice as likely to
request an advertised prescription drug than patients from Vancouver. A total of 79.6
213 Slaughter E. Consumer reaction to DTC advertising of prescription medicines. Emmaus, PA: Prevention Magazine, Rodale Inc.; 2001/2002.
214 Mintzes B, Barer ML, Bassett K, et al. An assessment of the health-system impacts of direct-to-consumer advertising of prescription medications (DTCA): Volume III - Patient information on medicines Comparative patient/doctor survey in Vancouver and Sacramento. Center for Health Services and Policy Research. August 2001. Available at: http://www.chspr.ubc.ca/hpru/pdf/dtca-v3-compsurvey.pdf. Accessed August, 2002.

66
percent of the requests for prescription drugs in Sacramento were fulfilled versus 62.6
percent in Vancouver (OR = 2.4, 95% CI = 1.1-3.0). Overall, patients requesting a
prescription drug were most likely to receive a new prescription (OR = 8.7, 95% CI =
5.4-14.2) after controlling for several factors like health status, age, gender, income,
education, drug payment method, physician gender, years in practice, specialty, and
cluster sampling for the survey. The physicians were more likely to express ambivalence
about the treatment when patients requested a certain drug and they prescribed the
medication.215
Few patients (2.2%) judged television advertisements to be unreservedly accurate
in either city. Some patients in both Sacramento (14.3%) and Vancouver (14.2%)
reported that they would go to another physician if their current physician did not
prescribe the requested drug. However, a majority of patients in both Sacramento
(86.3%) and Vancouver (92.2%) reported that they would trust the physician’s decision if
they thought that the medication was not needed. DTCA was reported to have more likely
influenced patients in Sacramento, in a more legal environment, than patients from
Vancouver. The physicians in both cities were highly likely to prescribe these requested
drugs suggesting a similarity in physician beliefs and attitudes. 216
215 Mintzes B, Barer ML, Bassett K, et al. An assessment of the health-system impacts of direct-to-consumer advertising of prescription medications (DTCA): Volume III - Patient information on medicines Comparative patient/doctor survey in Vancouver and Sacramento. Center for Health Services and Policy Research. August 2001. Available at: http://www.chspr.ubc.ca/hpru/pdf/dtca-v3-compsurvey.pdf. Accessed August, 2002.
216 Mintzes B, Barer ML, Bassett K, et al. An assessment of the health-system impacts of direct-to-consumer advertising of prescription medications (DTCA): Volume III - Patient information on medicines Comparative patient/doctor survey in Vancouver and Sacramento. Center for Health Services and Policy Research. August 2001. Available at: http://www.chspr.ubc.ca/hpru/pdf/dtca-v3-compsurvey.pdf. Accessed August, 2002.

67
Maddox and Katsanis in a study published in 1997, surveyed Canadians (N=165)
to understand patient attitudes toward DTCA and its influence on physician-patient
interaction. The survey presented two scenarios, one in which the consumer is exposed to
an advertisement and requests for the drug and the other in which consumer is not
exposed to the advertisement, but the physician recommends the advertised drug. These
scenarios were designed to understand the impact of DTCA on consumers’ perception of
the interaction with the physician. The results showed a significant difference between
the two groups regarding the likelihood of gathering additional information on the
advertised drug (p<0.001). This may indicate that consumers believe that DTCA is not an
adequate source of information and feel the need for more information to feel
comfortable enough to ask for the drug.217
The study showed that consumers/patients were comfortable discussing advertised
drugs with their physician, but were less likely to initiate the discussion and were unsure
if they would seek additional information. The consumers respected physicians’
opinions, had high levels of confidence in their physician, and believed that physicians
were knowledgeable and aware of new therapies. The consumers exposed to DTCA were
more confident in the physician than those not exposed to the ad (p<0.05). When the
physician fulfilled the patient’s request for the advertised drug it helped the patient feel
more confident in the care of the physician. The patients then also believed that the
physician’s concern and ideals about healthcare matches with that of the patient. The
217 Maddox LM, Katsanis LP. Direct-to-consumer advertising of prescription drugs in Canada: Its potential effect on patient-physician interaction. Journal of Pharmaceutical Marketing and Management. 1997;12(1):1-21.

68
study found that physicians were worried that if they did not prescribe the requested drug,
patients would shop around for a doctor who would prescribe it. Also, they believed that
patients will be misled by the advertisement and may think that the drug is right for them
without the knowledge that is needed to make that decision. Overall, the results indicated
that DTCA did not have a significant impact on patient-physician interaction.218
Effects of DTCA: Interaction with Physician and Prescription Drug Requests
Researchers have constantly argued the rationale for the use of DTCA because
some believe that patients may demand inappropriate drugs because they do not
completely understand promotional messages.219, 220 DTCA has also been noted to
encourage patients to talk to physicians about the advertised drugs, even request them and
induce demand. This could have an impact on the interaction between patients and
physicians and also influence the relationship between them. In a study published in 1999
(N=329), as a result of seeing an advertisement, 35.0 percent of the respondents reported
to have discussed the advertised drug with their physician and 19.0 percent of them
requested a prescription.221
A survey conducted by the National Consumers League in August 1998
(N=1,013) reported that four out of five consumers had seen an advertisement for a
prescription drug. Consumers agreed that DTCA increased their knowledge about the
218 Maddox LM, Katsanis LP. Direct-to-consumer advertising of prescription drugs in Canada: Its potential effect on patient-physician interaction. Journal of Pharmaceutical Marketing and Management. 1997;12(1):1-21.
219 Cohen E. Direct-to-the public advertisement of prescription drugs. New England Journal of Medicine. 1988;318(6):373-376.
220 Everett SE. Lay audience response to prescription drug advertising. Journal of Advertising Research. April/May 1991;31(2):43-49.
221 Bell RA, Kravitz RL, Wilkes MS. Direct-to-consumer prescription drug advertising and the public. Journal of General Internal Medicine. 1999;14(11):651-657.

69
drug, but not the disease or condition that the drug is used to treat. Less than half the
consumers (44.0%) surveyed had discussed the advertised medication with their
physician; especially the elderly, women, and those with high incomes and 20.0 percent
of these consumers received a prescription. Only 23.0 percent of the consumers
discussed the disease with the physician.222
The National Consumers League conducted another national survey in October
2002 of consumers regarding DTCA. This study reported that consumers are aware that
advertising piques their interest in the medical condition or treatments or both and
motivates them to visit the doctor to talk about the condition. Most consumers agreed that
even though pharmaceutical manufacturers providing the information regarding the
prescription drugs and the condition it treats want to increase the revenues through
increased sales, access to this information should not be limited.223
A total of 77.0 percent of consumers had seen an advertisement for a prescription
drug in past 12 months. Of these, 57.0 percent talked to their physician about the drug
and 26 percent sought more information. Of the consumers who talked to their doctor,
9.0 percent had already decided that they wanted the medication, but half (51.0%) the
consumers wanted to inquire if the drug was their best option. The study reported that
222 Sibley CE. Research report: DTC Advertising studies. Coalition for Healthcare Communication. August 2001. Available at: http://www.cohealthcom.org/pages2/dtcadstudies.html. Accessed December, 2002.
223 Consumers taking control with DTC Rx ads. National Consumers League. January 9, 2003. Available at: www.ncl.org/dtcpr.html. Accessed April, 2003.

70
most physicians were positive about the discussion regarding the advertised drug and
only 2.0 percent of the physicians were upset.224
The Henry Kaiser Family Foundation conducted a survey in 2001 to understand
consumer awareness and reaction to DTCA. Consumers (N = 1,872) were divided into
three groups and each group was shown an advertisement for one of the three prescription
drugs – Lipitor®, Singulair®, or Nexium®. The study found that consumers had a more
favorable opinion toward a particular advertisement than of DTCA in general. A total of
30.0 percent of the consumers discussed the advertised drug with the physicians and 44.0
percent (13.0% of overall consumers) received a prescription for the requested drug. In
addition, 35.0 percent of the respondents were recommended to change their lifestyle and
25.0 percent were recommended another drug. The results showed that the elderly and
those in poor health were more likely to talk to the physician about a drug or condition.
On seeing the advertisement, many of the consumers were very likely to talk to the
physician about the medication (14.0%) and health condition (14.0%) and look for more
information about both the medication (12.0%) and the condition (13.0%). These
numbers increased if consumers were affected by the medical condition that the
advertised drug was used to treat.225
The Harvard study of DTCA surveyed 3,000 consumers, from July 2001 through
January 2002, who had discussed advertised drugs with their physicians. A total of 86.0
percent of consumers who had seen or heard of an advertisement for a prescription drug
224 Consumers taking control with DTC Rx ads. National Consumers League. January 9, 2003. Available at: www.ncl.org/dtcpr.html. Accessed April, 2003.
225 Understanding the effects of direct-to-consumer prescription drug advertising. The Henry Kaiser Family Foundation. November 2001. Available at: www.kff.org. Accessed December, 2002.

71
and 35.0 percent were prompted to have a discussion with the physician regarding a
prescription drug or other health concern. Some consumers discussed an existing
condition (46.4%), or a new diagnosis (24.7%) with the physician and one in every four
patients were diagnosed with a new condition during the visit. Patients were visiting
physicians for clinically important conditions such as high cholesterol, hypertension,
diabetes, and depression and the visits also resulted in new diagnosis of these
conditions.226
The study found that a total 37.4 percent of patients talked to the physicians about
the advertised drug, 21.9 percent discussed about a new concern, and 35.6 percent
discussed about possible change in the ongoing treatment plan. As a result of the DTCA
visit (influenced by DTCA), 72.9 percent received a prescription for any drug and 43.3
percent received a prescription specifically for the advertised drug.227
In 2001, Allison-Ottey et al. assessed the impact of DTCA on African-American
patients (N=1,065) visiting the doctor in a variety of specialty clinics in five states
including California, Texas, New York, Maryland, and North Carolina. Among the 76.0
percent of the patients who had seen an advertisement for a prescription drug, 23.0
percent of the patients had a question for the physician regarding an advertised drug. As
a result of DTCA, 6.0 percent of the patients made an appointment, 21.0 percent
indicated they wanted to discuss an advertised drug with the physician, 44.0 percent only
sought more information on advertised drug, and 11.0 percent intended to ask for a
226 Weissman JS, Blumenthal D, Silk AJ, et al. Consumer reports on the health effects of direct-to-consumer drug advertising. Health Affairs - Web Exclusive. February 26 2003:W3-82-W83-95.
227 Weissman JS, Blumenthal D, Silk AJ, et al. Consumer reports on the health effects of direct-to-consumer drug advertising. Health Affairs - Web Exclusive. February 26 2003:W3-82-W83-95.

72
prescription. A total of 48.0 percent of the patients felt that advertisements would help
them make better decisions and/or keep them informed about their health.228
Some consumers (34.0%) reported that they had asked about a specific
medication in the past and most reported that the physician was happy to discuss the
option (46.0%) and discussed it in the same manner as other health concerns (46.0%).
However, some consumers (2.0%) did report that the physician was angry or upset with
the questioning.229
The physicians completed a questionnaire following the patients’ visit and they
reported that only 9.0 percent of the patients had asked them for a prescription of an
advertised drug. However, 21.0 percent of the consumers indicated they would discuss
the medication with the physician. In order to resolve this discrepancy, the 21.0 percent
of consumers who reported that they would discuss the medication with the physician
were surveyed again. Among these patients surveyed a second time (21.0%, N=223), a
total of 33.0 percent of the patients reported that they discussed the drug with the
physician and 11.0 percent of these received a prescription for the advertised drug.
Physicians (54.0%) agreed that the discussion had a positive effect and none of them
reported that the discussion had a negative effect on the patient-physician relationship.230
228 Allison-Ottey A, Ruffin K, Allison K, et al. Assessing the impact of direct-to-consumer advertisements on the AA patient: A multisite survey of patients during the office visit. Journal of the National Medical Association. February 2003;95(2):120-131.
229 Allison-Ottey A, Ruffin K, Allison K, et al. Assessing the impact of direct-to-consumer advertisements on the AA patient: A multisite survey of patients during the office visit. Journal of the National Medical Association. February 2003;95(2):120-131.
230 Allison-Ottey A, Ruffin K, Allison K, et al. Assessing the impact of direct-to-consumer advertisements on the AA patient: A multisite survey of patients during the office visit. Journal of the National Medical Association. February 2003;95(2):120-131.

73
Glasgow et al. identified factors related to medication adherence and health
outcomes for patients who had requested a prescription for the advertised drug. In
January 2002, in-depth interviews with six individuals were conducted. The study
reported that DTCA influences consumers to discuss the drug with physicians and even
request it. The six patients made ten requests for advertised drugs of which eight were
fulfilled. In response to one of the requests, a different drug was prescribed and the
second request was denied because the physician believed that other medications the
patient was using would help and hence a new medication was not needed. One drug was
discontinued because it did not meet expectations, while another was discontinued
because it was withdrawn from the market. The study indicated that for some patients,
DTCA could be a way of finding therapies that meets their health needs. But requests for
the drugs could also lead patients to seek advice from another physician and not their
regular physician. The study revealed that as a result of DTCA, some patients are willing
to try new therapies and evaluate the usefulness and value of the product. If the treatment
works, then consumers are extremely pleased and may feel favorable toward advertising
of prescription drugs.231
In 1989, Everett surveyed 238 consumers to understand their opinions on DTCA,
especially print advertisements by creating a hypothetical print advertisement. A total of
70.6 percent of the consumers were more likely to have a discussion with the physician
regarding the prescription drug. Some consumers (34.7%) were likely to request the
advertised drug, but very few were likely to “doctor shop” (5.5%) if the physician refused
231 Glasgow C, Schommer JC, Gupta K, et al. Promotion of prescription drugs to consumers: Case study results. Journal of Managed Care Pharmacy. November/December 2002;8(6):512-518.

74
to prescribe the requested drug. Consumers who rated DTCA as an important factor were
more likely to report that they would read the advertisement carefully, tell the physician
that they had seen the advertisement, discuss it, ask for it, and change physicians if they
were refused. All consumers who read about the drug in a magazine reported that they
would mention the advertisement to the physician.232 However, it should be noted that in
the 1980s and until 1997, DTCA was predominantly seen in print. Since this study was
conducted in the late 1980s, advertisements were mainly seen in the print media.
The youngest (less than 20 years) and oldest (70 years or older) respondents in the
study were likely to state “brand name” as an important factor in product selection
indicating that these two age groups were the most susceptible to DTCA which is
designed to build brand awareness. The level of education also played a major role in
influencing the response of consumers toward the advertisement. The less-educated
consumers were more likely to read the advertisement and discuss it with the physicians.
The study also discussed the possibility of the less-educated consumers’ inability to
understand the typically complex risk information presented in the advertisements and
hence this places a lot of importance on physician’s role in patient education.233
However, critics state that these patient requests could take physicians’ time away from
patients’ medical needs and may also affect patient-physician relationship or undermine
the physician’s role.234
232 Everett SE. Lay audience response to prescription drug advertising. Journal of Advertising Research. April/May 1991;31(2):43-49.
233 Everett SE. Lay audience response to prescription drug advertising. Journal of Advertising Research. April/May 1991;31(2):43-49.
234 Hollon M. Direct-to-consumer marketing of prescription drugs. Journal of the American Medical Association. 1999;281:382-384.

75
Time, Inc. conducted two surveys of consumer attitudes toward DTCA in 1998
and 1999. A total of 1,500 adults in 1998 and 1,000 adults in 1999 were surveyed via
telephone interviews. The results of the study indicated that DTCA did not interfere with
the physician-patient relationship. Most consumers agreed, “doctor knows best” (1998 –
84.0%, 1999 – 80.0%) and followed doctor’s orders. However, 80.0 percent of the
consumers in 1999 reported that they would still want to know all the options and decide
for themselves, but would like to discuss the choices with the physician. In both 1998
and 1999, 32.0 percent of the respondents believed that they had the ability to choose the
right medication for themselves without the help of the physician.235
In the 1998 study, consumers on seeing an advertisement on television or
magazine talked to the physician about the drug and received a prescription (23.0% -
television, 29.0% - magazine) for it. In 1999, on seeing an advertisement in each of the
several DTCA media including magazine (20.0%), television (20.0%), or other resources
(20.0% – newspapers, radio, mail, internet), 20.0 percent of consumers talked to a
healthcare professional and 20.0 percent of those consumers received a prescription.
Consumers claimed that television was the most frequent media source. In both years,
some consumers (1998–28.0%, 1999-24.0%) reported that they would switch physicians
to get a prescription for the drug they wanted. In both years, most respondents did not
235 Sibley CE. Research report: DTC Advertising studies. Coalition for Healthcare Communication. August 2001. Available at: http://www.cohealthcom.org/pages2/dtcadstudies.html. Accessed December, 2002.

76
receive a prescription for the drug they requested mainly because they did not have the
condition or it was not appropriate.236
Physician communication skills can play an important role in the type of
relationship they have with patients and affect the interaction. If the physician’s
communication skills are poor and the physician also has strong negative feelings toward
prescription drug requests from the consumers, they would most likely reject the request.
On the other hand, if a physician-patient relationship is supportive and physician has
strong communication skills, it would allow the physician to respond constructively to
consumers’ questions, concerns, and requests and foster patient trust. If a patient requests
a drug and physician refuses, consumers can have various reactions to this decision.
They can accept the physician’s decision believing that the physician knows best. Or
consumers may feel disappointed and may try to persuade their physician to reconsider,
or seek the prescription from another physician or terminate their relationship with the
physician.237
In 1998, Bell et al. conducted a telephone survey of 329 consumers to understand
patient reactions to physician refusal of advertisement-induced drug request. The study
noted that a majority of the respondents would exhibit at least one negative reaction to
the refusal of a physician to prescribe the advertised drug. A total of 46.0 percent of the
individuals would be “somewhat” and “very likely” to be disappointed in response to a
refusal for the requested drug. Most respondents (47.0 percent) reported that they would
236 Sibley CE. Research report: DTC Advertising studies. Coalition for Healthcare Communication. August 2001. Available at: http://www.cohealthcom.org/pages2/dtcadstudies.html. Accessed December, 2002.
237 Bell RA, Wilkes MS, Kravitz RL. Advertisement-induced prescription drug requests: Patients' anticipated reactions to a physician who refuses. Journal of Family Practice. 1999;48(6):446-452.

77
not be disappointed in the physician and would not take any action in response to the
refusal, but 30.0 percent reported that they would be disappointed and would take action
in response to the refusal. Very few respondents reported that they would have stronger
reactions than disappointment at the refusal of request for a prescription. Most
individuals were not likely to change the physician’s mind (75.0%) at all, but 6.0 percent
of the respondents reported that they would shop around for a physician who would
prescribe the requested drug and 3.0 percent thought they would be very likely to switch
physicians.238
Consumers who had a favorable attitude toward DTCA reported disappointment,
persuasion, “prescription shopping” or seeking prescription from another physician, and
doctor switching as the most likely responses to physician refusal. Authors speculate that
these negative reactions to the refusal for the most part could be reflecting the problems
in the physician-patient communications. Positive reactions toward physician-patient
relationship were associated with lower likelihood for any of the negative reactions.
Positive attitude toward DTCA was a significant predictor of all reactions except doctor
shopping. The most consistent predictor of the negative reactions to denial of a
prescription for an advertised drug by physician was the quality of the physician-patient
relationship and also the patients’ feelings towards DTCA.239
Overall, consumers are aware of DTCA and in general have a positive attitude
toward DTCA. All of the studies cited do indicate that advertisement serves as a stimulus
238 Bell RA, Wilkes MS, Kravitz RL. Advertisement-induced prescription drug requests: Patients' anticipated reactions to a physician who refuses. Journal of Family Practice. 1999;48(6):446-452.
239 Bell RA, Wilkes MS, Kravitz RL. Advertisement-induced prescription drug requests: Patients' anticipated reactions to a physician who refuses. Journal of Family Practice. 1999;48(6):446-452.

78
for consumers to have a discussion with the physician regarding the prescription drug and
maybe even help identify symptoms patient has been experiencing and accurately
diagnose the condition. Also, it speculates on the possibility that DTCA does impact
patient-physician relationship and interaction and also helps in identifying and diagnosing
new conditions.
Effects of DTCA: Public Health
DTCA can have a major impact on public health through increased awareness and
education. By providing the information and increasing consumers’ awareness, DTCA
can encourage or motivate consumers to seek medical help or advice. According to a
study conducted by the Advertising Research Foundation for the Advertising Council
published in 1991, advertising does encourage consumers to seek medical help. A public
service announcement was made throughout the year asking people to talk to their
physician about colon cancer. Consumer awareness increased from 6.0 percent before
the announcement to 30.0 percent at the end of the year. Following the announcement,
the percentage of men discussing colon cancer with their physician increased by 75.0
percent. This study reveals the possibility that DTCA could spur patients into action and
encourage them to talk to their physician.240
In 1992, the first advertisement for nicotine patch was aired during the Super
Bowl. The demand increased so rapidly that for a while, demand was much higher than
the supply. The product had been available for months, but consumers who wanted to
240 Establishing the accountability: A strategic research approach to measuring advertising effectiveness.Washington DC: Advertising Research Foundation for the Advertising Council; 1991.

79
quit smoking were not aware of it.241 Similarly, when the advertisements for
osteoporosis and its treatment were aired, physician visits nearly doubled.242 In 1997, an
advertising campaign for genital herpes treatment was aired and within three months,
40.0 percent of those who called the toll-free number asking about the drug saw a
physician.243
Effects of DTCA: Adherence to Therapy
DTCA has been constantly referred to as having an impact on patient adherence
with drug therapy. Pfizer and RxRemedy conducted a survey using panels of consumers
to determine the effect of DTCA on adherence. The study utilized RxRemedy’s
proprietary consumer longitudinal database of 25,000 monthly diary participants. These
consumers provided monthly reports from 1999 through 2000 on drug use, doctor visits,
and other health-related variables across five major advertised conditions: allergy,
arthritis, elevated cholesterol, depression, and diabetes. Consumers who were involved in
their own care, requested prescription drugs and whose requests were fulfilled were more
likely to continue their therapy, especially those who were motivated by DTCA. Patients
diagnosed with allergies were twice as likely to remain on therapy if they had requested
the drug as a result of an advertisement than those who had not. Patients with arthritis,
depression, elevated cholesterol, and diabetes were 75.0 percent, 37.0 percent, 16.0
percent and 10.0 percent, respectively more likely to remain on the treatment with the
241 DTC ads prompted prescriptions for 7.5 million Americans, APhA/Prevention survey concludes. FDC Reports, The Pink Sheet. October 20 1997;59(42):9-10.
242 Tanouye E. Drug ads spur patients to demand more prescriptions. The Wall Street Journal. December 22, 1997: B1.
243 Holmer AF. Direct-to-consumer prescription drug advertising builds bridges between patients and physicians. Journal of the American Medical Association. 1999;281:380-382.

80
advertised drug they requested. The positive impact of DTCA was reinforced specifically
when patients requested the drug at the time of the first prescription. This effect was seen
specifically for patients treated for allergies and arthritis.244
In another study on drug adherence, Wosinska evaluated the DTCA expenditures
and utilization of advertised cholesterol-lowering drugs from 1996 through 1999 (35,649
hyperlipidemic patients). A secondary analysis on drug adherence indicated that patients
who were treated with cholesterol-lowering drugs in the high category advertising were
more likely to adhere to therapy because the patients probably initiated the process and
hence were more motivated. There was also a possibility of informational spillover i.e.,
the advertising of one brand reminds patients to take their medication, which may be a
different brand.245 Advertising of a brand name drug “A” was effective in improving
adherence of patients using medications in that category and not necessarily just drug
“A.”
In the DTCA Prevention magazine surveys from 1998 through 2002, consumers
stated that one of the benefits of DTCA was adherence since it helped them adhere to the
regimen and reminded them to fill their prescriptions (Table 2.2, Pg 63).246,247,248,249 In the
244 Impact of DTC advertising relative to patient compliance. Pfizer, Inc. and RxRemedy, Inc. June 2001. Available at: http://www.pfizer.com/are/news_releases/mn_2001_1129_additional.html. Accessed November, 2002.
245 Wosinska ME. The economics of prescription drug advertising [Ph.D Diss]. Berkley, University of California; 2002.
246 National survey of consumer reactions to direct-to-consumer advertising. Emmaus, PA: Prevention Magazine, Rodale Inc.; 1998.
247 National survey of consumer reactions to direct-to-consumer advertising. Emmaus, PA: Prevention Magazine, Rodale Inc.; 1999.
248 Slaughter E, Schumacher M. International survey on wellness and consumer reaction to DTC advertising of Rx drugs. Emmaus, PA: Prevention Magazine, Rodale Inc.; 2000/2001.
249 Slaughter E. Consumer reaction to DTC advertising of prescription medicines. Emmaus, PA: Prevention Magazine, Rodale Inc.; 2001/2002.

81
2001 study by Allison-Ottey et al. on the effects of DTCA on African Americans, 23.0
percent of patients reported that they were more likely to take the medication if they had
seen or heard the drug being advertised.250 All these studies reiterate its beneficial effects
on public health as well as patients’ adherence to therapy.
Knowledge of Prescription Drug Information and Processing
In response to the 1983 FDA’s call for research to examine consumer perceptions
and reactions during the industry-wide moratorium on consumer-oriented promotion, the
CBS consumer model study was conducted (Published in 1984). Personal in-home
interviews with 1,233 consumers were conducted. The six major categories which
constituted as knowledge of prescription drugs by consumers were “safety and efficacy,”
“proper use,” “general health issues,” “misuse and dependency,” “liability” and “cost and
value.” Consumers were highly concerned about cost, dependence and abuse of
prescription drugs. The study found that consumers were only marginally informed about
prescription drugs. A total of 38.0 percent of the consumers were “not informed” about
prescription drugs, but 33.0 percent and 28.0 percent of the respondents reported that they
were “well-informed” and “somewhat informed,” respectively. A majority of the
respondents (72.0%) thought it was “highly important” and 18.0 percent thought that it
was “moderately important” to have information about prescription drugs and felt a great
250 Allison-Ottey A, Ruffin K, Allison K, et al. Assessing the impact of direct-to-consumer advertisements on the AA patient: A multisite survey of patients during the office visit. Journal of the National Medical Association. February 2003;95(2):120-131.

82
need for it. Consumer knowledge of prescription drugs was low and hence there was a
need or demand for more information on prescription drugs.251
In 1990, Peyrot et al. developed a model to evaluate consumer understanding of
prescription drugs and requesting behavior and surveyed 440 consumers. The study
reported that demographic factors (age, gender, race, socioeconomic status), media
exposure, attitudes, and awareness of DTCA predicted consumer knowledge of and
requests for prescription drugs, but the effects of these factors were mediated by other
factors. The awareness of pharmaceutical advertising had the greatest effect on
prescription drug knowledge of consumers. The consumers were of the opinion that
advertising educates them. Individuals using prescription drugs regularly were more
aware of prescription drug advertising, but did not request specific drugs because they
feared that it would upset the physician. Women and higher-educated individuals were
more likely to request specific prescription drugs even when controlling for attitudes and
awareness of drug advertisements. The respondents with a traditional view of the
physician-patient relationship were less likely to request prescription drugs.252
Christensen et al. tested a theory to understand how the elderly process
information. In 1992, 2,131 adults were recruited for the study and were provided with
an advertisement for a fictitious non-steroidal anti-inflammatory drug (NSAID).
Involvement, argument quality of risk (strong or weak), and source credibility of
advertisements played a very important role in influencing consumer opinions, attitudes
251 CBS consumer model: A study of attitudes, concerns and information needs for prescription drugs and related illnesses. New York: CBS Network Television; 1984.
252 Peyrot M, Alperstein NM, Van Doren D, et al. Direct-to-consumer ads can influence behavior. Advertising increases consumer knowledge and prescription drug requests. Marketing Health Services. 1998;18(2):26-32.

83
and perceived risk. Argument quality of risk stated in the advertisements had an impact
on consumer attitudes when both involvement and source credibility were low, but
argument quality of risk had no impact when involvement was low and credibility was
high. When involvement was high, irrespective of source credibility (high or low),
argument quality of risk influenced consumer attitudes and perceived risk. When
involvement conditions were ambiguous and source credibility was high, information
content had an impact on consumer attitudes.253
Involvement may be the most influential factor when elderly consider the
information and are predisposed toward promotional messages of advertising. Situational
differences including different levels of involvement could determine if the elderly will
consider the information provided in the advertisement or be influenced by the
promotional aspect of the advertisement. However, if the elderly are not motivated, the
basis for the attitudes and actions may not be determined by consideration of the
information.254
In a study conducted by Schommer et al., consumer’s rote learning response or
ability to retain information from advertisements of prescription drugs was assessed with
a study sample of 177 consumers. A 60-second television advertisement for Allegra®
aired on August 1997 was selected for the study. A majority of the questions (72.0%)
were answered correctly indicating that rote learning response was good after seeing the
253 Christensen TP, Ascione FJ, Bagozzi RP. Understanding how elderly patients process drug information: A test of theory of information processing. Pharmaceutical Research. November 1997;14(11):1589-1596.
254 Christensen TP, Ascione FJ, Bagozzi RP. Understanding how elderly patients process drug information: A test of theory of information processing. Pharmaceutical Research. November 1997;14(11):1589-1596.

84
television advertisement for Allegra®. Consumer’s demographic and psychographic
background (age, gender, education and health insurance), access to health information,
and health-related knowledge and experience influenced their ability to comprehend and
willingness to retain and respond to the information provided in the advertisements.
Education and insurance coverage played a role in the rote learning and incorrect
response to the question regarding nausea effects of Allegra® (Some college, OR = 6.03,
95% CI = 1.53 – 23.83, At least college degree OR = 4.69, 95% CI = 1.04 – 21.28,
Insurance OR = 6.21, 95% CI = 1.18 – 32.68). The more educated and those with
insurance coverage were less likely to get the question incorrect. The study results
indicated that if drug advertisements presented both promotional and risk-related
information, consumers had problems retaining the information.255
DTCA and Physicians: Opinion of Physicians
As mentioned previously, most studies conducted in relation to DTCA are opinion
or attitudes of consumers and physicians. According to the review by the GAO of ten
studies conducted between 1984-1990, physicians were mainly opposed to DTCA. The
extent of this opposition varied by type of advertising, the media, and content. Physicians
who opposed DTCA believed that it would undermine the patient-physician relationship.
But these attitudes varied by specialty. In reviewing the studies, some of the problems in
these studies were lack of generalizability, bias, and sampling design. But since similar
255 Schommer JC, Doucette WR, Mehta BH. Rote learning after exposure to a direct-to-consumer television advertisement for a prescription drug. Clinical Therapeutics. 1998;20(3):617-632.
85
results were obtained from most studies, these results could be applied in general to all
physicians.256 These results reiterate the unpopularity of DTCA among physicians.
In a study published in 1995, 148 physicians in the mid-west region (Ohio,
Michigan and Indiana) were surveyed. The study reported that physician attitudes toward
advertising did have an impact on the attention of physicians toward drug advertisements,
prescription-writing habits, and response of physicians to prescription drug requests.
Overall, physicians had a positive or favorable attitude toward prescription advertising.
However, those who had practiced for over 20 years were less favorable toward the
advertising, paid less attention to advertisements, and were also less responsive to
prescription drug requests. The strong attitude-behavior relationship reported in the study
points to the high degree of involvement of physicians in the prescription decision. Input
of consumers in the prescription decision-making process is reflective of the new era
where consumers are more informed and as a result the patient-physician relationships
have changed.257
Using Scott-Levin’s 1995 sample of 963 physicians, Gönül et al. studied the
influence of physician demographics and marketing on physician receptiveness to DTCA.
The study found that physicians do not place much value on DTCA, but appreciate its
usefulness as a tool to improve interaction with patients. This is mainly by distribution of
brochures in the office that consumers can use to talk to physicians. The more
256 Prescription drugs: Little is known about the effects of direct-to-consumer advertisements: United States General Accounting Office, Report to the Chairman, Subcommittee on Oversight and Investigations, Committee on Energy and Commerce, House of Representatives; July 1991. GAO PEMD-91-19.
257 Petroshius SM, Titus PA, Hatch KJ. Physician attitudes toward pharmaceutical advertising. Journal of Advertising Research. November/December 1995;35(6):41-51.

86
experienced, busier (high caseload) physicians and physicians who have increased
exposure to DTCA brought in by the patients placed more value on DTCA.258
The physicians may view advertising as a threat to their medical authority and are
worried that patients may start demanding prescriptions for inappropriate drugs. In a
study published in 1995, Lipsky and Taylor surveyed 454 family physicians to
understand their opinions, knowledge, and experiences regarding DTCA. Most
physicians (60.0%) agreed that “DTCA encourages patients to take a more active role in
their healthcare” and 56.0 percent agreed that “DTCA encourages patients to seek
medical care for conditions that may otherwise go untreated.” A majority of the
physicians (89.0%) disagreed that DTCA enhances patient-physician relationship, but
71.0 percent agreed that DTCA does pressure physician to prescribe drugs they might
otherwise have not prescribed. Most physicians were of the opinion that DTCA was not
beneficial and it impaired the patient-physician relationship. However, physicians did
agree that DTCA informs and alerts consumers to conditions they should seek care for.
The authors speculated that many of the negative opinions are because physicians feel
threatened and hence not objective about advertising.259 On the other hand, physicians
may be feeling frustrated with the situation and do not have the time to talk to patients
and explain the inappropriateness of requested drug or help patients interpret the
information presented in the advertisements.
258 Gönül FF, Carter B, Wind J. What kind of patients and physicians value direct-to-consumer advertising of prescription drugs. Health Care Management Science. 2000;3(3):215-226.
259 Lipsky MS, Taylor CA. The opinions and experiences of family physicians regarding direct-to-consumer advertising. Journal of Family Practice. 1997;45(6):495-499.

87
In 1997, IMS Health along with Physician Online, an Internet service with a
private physician membership, surveyed 4,860 physicians regarding their views on
DTCA. Among physicians who reported that they received requests for prescription
drugs, more than half (55.0%) reported that the requests for the specific brand name
drugs were the result of an advertisement that the patient had seen. Findings of the study
revealed the effectiveness of DTCA in terms of encouraging patients to initiate
discussions with their physicians regarding brand-name drugs. A majority of the
physicians were of the opinion that the number of advertisements should be either
decreased (26.0%) or stopped completely (35.0%), whereas only 9.0 percent wanted to
see an increase in DTCA. The reason for this could be that DTCA generates increased
patient load and increasing requests from patients places an increased demand for
physician’s time explaining the pros and cons of the drugs patients requested.260
Very few physicians (16.0%) thought that DTCA was an effective educational
tool. The physicians do not believe drug advertisements provide enough information
regarding the ramifications, indications for use, effectiveness, and side effects of the
product. A total of 40.0 percent of the physicians felt that the advertisements are directed
to consumers who lack the adequate education to evaluate the information provided and
weigh in factors that play a role in prescribing. The physicians felt strongly that DTCA
causes confusion and leads patients to reach incorrect conclusions (39.0%). Physicians
260 Sherr MK, Hoffman DC. Physicians - Gatekeepers to DTC success. Pharmaceutical Executive. October 1997;17(10):56-66.

88
also felt that DTCA can play a role in causing disharmony in the physician-patient
relationship.261
In the 1998 survey of physicians by Time Inc., 30.0 percent of the physicians
reported that patients bring in magazine, newspaper advertisements, or articles to their
office to discuss these medications or disease states advertised. Some physicians believed
that DTCA was “extremely beneficial” (15.0%) or “somewhat beneficial” (38.0%).
Physicians believed that DTCA would help alert consumers regarding the prescription
drugs available (85.0%), encourage consumers to seek treatment (67.0%), and provide
information (61.0 percent). A total of 40.0 percent of the physicians felt that DTCA could
help physicians in the efforts to provide the best treatment. The physicians were opposed
to DTCA because they believed that it would encourage patients to request unnecessary
or incorrect medications (88.0%) and pressure physicians to write a prescription fulfilling
patients’ request (74.0%) leading to the increased use of the inappropriate and
unnecessary medications. They also believed that DTCA would not help because it
confuses patients with too much information (56.0%) and the risk information (69.0%)
provided in the advertisements.262
A 2001 survey of 11 physicians reported that a majority of the physicians were
asked about their medical opinion as a result of advertisements of drugs. The physicians
reported that when patients requested an advertised medication, 60.0 percent of the
physicians discussed the medication with the patients, 33.0 percent prescribed the
261 Sherr MK, Hoffman DC. Physicians - Gatekeepers to DTC success. Pharmaceutical Executive. October 1997;17(10):56-66.
262 Sibley CE. Research report: DTC Advertising studies. Coalition for Healthcare Communication.August 2001. Available at: http://www.cohealthcom.org/pages2/dtcadstudies.html. Accessed December, 2002.

89
medication and 7.0 percent gave the patient information that they would discuss during
the next visit. The physicians believed that DTCA has promoted communication between
the physicians and patients and educated patients about different diseases. However, they
did not believe that it helped patients’ drug adherence or that it influenced physician
prescribing habits.263, 264
In 2002, the FDA surveyed 500 physicians to understand the impact of DTCA on
the physician-patient relationship. Most physicians (59.0%) reported that the
advertisements did not have a beneficial effect on the interaction with the patients. Of the
86.0 percent of the patients who had questions about a specific brand name drug, 88.0
percent did have the condition that the advertised drug treated. When patients asked for a
specific brand name drug (59.0%), most physicians (57.0%) prescribed the brand name
drug. The physicians (91.0%) also reported that the patient did not try to influence the
course of treatment that could be harmful. However, when patients requested a
prescription for a drug, 59.0 percent of the physicians felt pressured to prescribe a drug
during the visit.265
Since the patient saw the advertisement for the drug, 45.0 percent of the
physicians agreed that the usefulness of time was increased and 73.0 percent of the
physicians also agreed that patients asked thoughtful questions, but 33.0 percent of the
263 Allison-Ottey SD, Ruffin K, Allison KB. "To do no harm": Survey of NMA physicians regarding perceptions on DTC advertisements. Journal of the National Medical Association. 2002;94(4):194-202.
264 Allison-Ottey A, Ruffin K, Allison K, et al. Assessing the impact of direct-to-consumer advertisements on the AA patient: A multisite survey of patients during the office visit. Journal of the National Medical Association. February 2003;95(2):120-131.
265 Aikin KJ. Direct-consumer advertising of prescription drugs: Physician survey preliminary results. Division of Drug Marketing, Advertising and Communication, FDA. January 13, 2003. Available at: www.fda.gov/cder/ddmac/globalsummit2003/sld001.htm. Accessed January, 2003.

90
physicians reported that patients “were not much aware of potential side effects.” The
physicians reported that patients did not seem confused regarding the effectiveness
(49.0%) and appropriateness (51.0%) of the drug. The patients were aware that only a
physician could decide if the drug was appropriate, and who could use the drug.266
A total of 40.0 percent of the physicians thought that DTCA had a “somewhat” to
“very” positive impact on patients and practice. Some of the other problems created by
DTCA that were reported by physicians included exaggerated benefits (confusing and
appears more effective than it really is), creates anxiety in patients, results in patient
seeking unnecessary drugs or more advantageous drugs, and create physician-patient
tensions. The two major problems that physicians encountered were lost time spent in
correcting misconceptions (41.0%) and drug was not needed/patient did not have the
condition (26.0%). The two main benefits of the advertisements were that they helped to
have a better discussion with the patient (53.0%) and patient was more aware of
treatments (42.0%). Some of the other benefits of DTCA for patients and physician
practice were increased awareness, involvement, and adherence to treatments. The
physicians believed that DTCA encouraged patients who were difficult to reach or
patients with potentially serious conditions to see a doctor and also helped in the
physician-patient interaction.267
266 Aikin KJ. Direct-consumer advertising of prescription drugs: Physician survey preliminary results. Division of Drug Marketing, Advertising and Communication, FDA. January 13, 2003. Available at: www.fda.gov/cder/ddmac/globalsummit2003/sld001.htm. Accessed January, 2003.
267 Aikin KJ. Direct-consumer advertising of prescription drugs: Physician survey preliminary results. Division of Drug Marketing, Advertising and Communication, FDA. January 13, 2003. Available at: www.fda.gov/cder/ddmac/globalsummit2003/sld001.htm. Accessed January, 2003.

91
Results of the studies described in this section indicate that DTCA does indeed
pressure physicians to prescribe advertised drugs. This could lead to unnecessary and
inappropriate use of medications.
Effects of DTCA: Inappropriate Prescribing
DTCA has been believed to influence prescribing behavior of physicians but
when questioned directly regarding the influence, physicians often deny the importance
of commercial sources and its influence on prescribing. This was observed in the study
published in 1982 that surveyed 85 physicians in order to evaluate the influence of
perceived sources of information on prescribing behavior of physicians for cerebral
vasodilators and propoxyphene. The two drug groups were chosen because the
information from scientific sources for these drugs was different from those available
from commercial sources. Most physicians (68.0%) believed that DTCA had minimal
influence on their prescribing behavior. Some physicians rated DTCA as having a
“moderately important” (28.0%) or “very important” (3.0%) influence on prescribing
behavior. These results indicate that a majority of the physicians perceived themselves as
paying very little attention to advertising and other marketing forces as compared to
scientific literature. The authors discussed the possibilities that either the physicians are
unaware of the influence of commercial sources on their prescribing or they do not want
to admit to the influence of DTCA. Most physicians (74.0%) rated consumer preference
as minimally important whereas 24.0 percent and 2.0 percent of the physicians rated
consumer preference as “moderately important” and “very important,” respectively.

92
Academic sources and their own training and experience were rated as most important
sources of information.268
Even though physicians believe that they are not influenced by the promotional
information from the manufacturers compared to the scientific papers, their beliefs
regarding the effectiveness of the drugs revealed an opposite pattern. Most physicians
(84.0%) prescribed Darvon® often or occasionally even when aspirin would have sufficed
because patients were not satisfied with an over-the-counter (OTC) aspirin. It is likely
that patient demand plays a role in encouraging physicians to prescribe the requested
drug. Furthermore, since advertisements are more interesting and accessible than medical
literature, physicians respond to this and use more commercial information whether they
are aware of it or not.269
DTCA and patient expectations have been continually cited as motivations for
physician prescribing pattern. A study published in 1989 surveyed 435 office-based
physicians to analyze motivations for prescribing by physicians (N=435). The prescribing
pattern for three drugs were evaluated – cephalexin (antibiotic), propoxyphene, and a
cerebral and peripheral vasodilator that has no effect on senile dementia and claudication
for which the drug was prescribed. The physicians enrolled in the study were prescribing
these drugs at a much higher rate than warranted by scientific evidence of the
effectiveness.270
268 Avorn J, Chen M, Hartley R. Scientific versus commercial sources of influence on the prescribing behavior of physicians. American Journal of Medicine. July 1982;73:4-8.
269 Avorn J, Chen M, Hartley R. Scientific versus commercial sources of influence on the prescribing behavior of physicians. American Journal of Medicine. July 1982;73:4-8.
270 Schwartz RK, Soumerai SB, Avorn J. Physician motivations for nonscientific drug prescribing. Social Science and Medicine. 1989;28(6):577-582.

93
The study reported that 46.0 percent of the physicians cited patient demand for
drugs as motivation for nonscientific prescribing. The other reasons that physicians cited
for their prescribing behavior were clinical experience (26.0%) and placebo effects
(24.0%) of the drugs. The physicians believed that prescribing a placebo was ethically
acceptable and was also a part of the duty to please the patient, indicative of the strong
influence of patient expectation on physician prescribing decisions. Some of the other
(4.0%) reasons given for prescribing the drugs were habit and peer pressure. Many
physicians feared that if they did not accommodate their patients they could loose their
business and reputation. Furthermore, physicians did not have sufficient time to talk to
patients and change their mind about a drug.271 It is probably easier for physicians to
give in to the demands of the patients and prescribe the requested drug.
DTCA and Pharmacists: Opinion of Pharmacists
Very few studies have examined pharmacists’ opinion regarding DTCA and its
effects. In a study published in 1996, Amonkar and Lively evaluated pharmacists’
(N=159) attitudes toward product-specific advertising of prescription drugs, specifically
television advertisements. The study reported that 53.0 percent of the pharmacists did not
view product-specific advertising favorably. Many pharmacists (41.5%) did not think that
DTCA was beneficial to consumers. Most pharmacists agreed that DTCA would pressure
physicians to prescribe advertised drugs (86.9%) and result in increased unnecessary
physician visits (40.1%). More than half the pharmacists (55.3%) were of the opinion that
television advertising was not a suitable medium for educating consumers, but 32.9
271 Schwartz RK, Soumerai SB, Avorn J. Physician motivations for nonscientific drug prescribing. Social Science and Medicine. 1989;28(6):577-582.

94
percent of the pharmacists agreed that advertising could improve patient-pharmacist
communication.272
An overwhelming majority (89.5%) of the pharmacists wanted advertisements to
be reviewed prior to being aired or printed by an independent panel of healthcare
providers. The factors that accounted for most of the variance (63.7%) in the pharmacist
opinions regarding television advertising were beneficial and negative effects of
advertisements, source, target, and format of the advertisements. Some additional
reasons for pharmacists’ disapproval of DTCA were inability to provide balanced
information, and the possibility that manufacturers would make extravagant claims
regarding the drugs.273
In another more recent study examining pharmacists’ (N=207) perceptions,
opinions and experiences with DTCA, 40.2 percent the pharmacists reported that their
interaction with patients had improved because patients seeking information on
advertised drugs had increased with patients asking more questions. Furthermore, DTCA
did not seem to increase the workload for the pharmacists. The pharmacists (54.2%) do
believe that advertisements have improved the communication between pharmacists and
patients but disagreed (52.0%) that DTCA improved patient understanding of drug-
related information. The pharmacists practicing in chains believed that DTCA could
encourage consumers or patients to seek more information thereby improving
communications with patients. However, since pharmacists practicing in an independent
272 Amonkar MM, Lively BT. Pharmacists' attitudes toward product-specific television advertising of prescription drugs. Journal of Pharmaceutical Marketing and Management. 1996;11(2):3-20.
273 Amonkar MM, Lively BT. Pharmacists' attitudes toward product-specific television advertising of prescription drugs. Journal of Pharmaceutical Marketing and Management. 1996;11(2):3-20.

95
setting were more likely to have a well-established relationship with patients, they did not
feel that DTCA contributed to the communication.274
A majority of the pharmacists (89.7%) agreed that DTCA increased patients’
awareness of newly available drugs and influences patients to talk to the physician about
the symptoms they experience (65.0%). A total of 29.6 percent of the pharmacists
reported that they had become aware of a new drug as a result of the advertisements.
Overall, pharmacists (82.7%) disagreed that DTCA had a positive influence on drug use
behavior of patients. Some pharmacists (54.3%) were of the opinion that DTCA
reminded patients to take their medications.275
Desselle and Aparasu evaluated pharmacists’ (N=90) attitudes toward DTCA and
role of these attitudes in support of DTCA. The study (published in 2000) reported that a
total of 27.3 percent of the pharmacists supported the concept of DTCA. Similar to the
previous study, a majority of the pharmacists (60.0%) reported that they had patients or
consumers asking them for more information on prescription drugs being advertised.
Positively-oriented actions, roles or responsibilities taken by pharmacists and consumers
due to DTCA, communication disruption or negative effects of DTCA on
communication, knowledge, and market-related effects of DTCA accounted for over half
(53.4 percent) of the variance in pharmacists’ attitude toward DTCA. Action or the factor
that describes positively-oriented actions and roles or responsibilities taken by
274 Punjabi SS, Shepherd MD. Pharmacists' perceptions about the impact of direct-to-consumer advertising of prescription drugs on pharmacy practice [Thesis]: Pharmacy Administration, University of Texas at Austin; 2000.
275 Punjabi SS, Shepherd MD. Pharmacists' perceptions about the impact of direct-to-consumer advertising of prescription drugs on pharmacy practice [Thesis]: Pharmacy Administration, University of Texas at Austin; 2000.
96
pharmacists and consumers due to DTCA were the main factors that differentiated
pharmacists based on their attitudes toward DTCA. The study reported that the
pharmacists who supported DTCA were more likely to believe that DTCA would result
in positive actions and less likely to cause disruption in communication channels. The
pharmacists were concerned about the negative effects of DTCA on communication
channels, which could result in inappropriate prescribing and disagreements between
patients and pharmacists. The pharmacists also agreed that DTCA would enhance
knowledge and exert its market-related effects.276
The three studies discussed in this section have reported the general negative
reaction of pharmacists toward DTCA. Healthcare professionals in general criticize the
advertisements for the inadequacies in conveying information and also the inability to
meet the FDA’s requirements. The claims in the advertisements do not always convey the
accurate picture because they tend to exaggerate the benefits and trivialize the side-
effects and risks.
Other Empirical Research: Types of Drugs Advertised
A study by Roth examined patterns of DTCA and researched 90 percent (39
advertisements) of all print media advertisements placed from 1993 to mid-1995. A
majority of advertisements were for drugs in the early part of their life cycle with at least
four years of patent protection remaining. Of the 23 prescription drugs advertised, 15
drugs (65.0%) were in the early stages of the product life cycle and six were in the late
stages of the product life cycle. During the early stages, manufacturers spend heavily on
276 Desselle SP, Aparasu R. Attitudinal dimensions that determine pharmacists' decisions to support DTCA of prescription medication. Drug Information Journal. January-March 2000;34(1):103-114.

97
advertising to build brand loyalty for the new products. On the other hand, during the last
stages of product’s life cycle, advertising can help build brand loyalty and also build
brand market position before the drug lost its patent. Market leaders were more likely to
advertise than the market followers but these followers did not match the advertising
expenditures by the market leaders. A majority of the brands (95%) advertised were
targeted at adults – elderly and/or younger adults. The advertised drugs usually had less
complexity in disease (79%), symptom (92%) and treatment (82%). The drugs were
mainly for chronic conditions as part of maintenance treatment rather than short-term or
periodic use and did not have any prevalent side-effects. Few of the advertisements
(35.0%) did not provide a fair balance of information and 15.0 percent did not mention
any of the risks. Some (12.0%) advertisements provided information on potential misuse
and more than half (58.0%) did not provide any information on directions for use.277
Claims in Advertisements: Types, Accuracy and Compliance with FDA Regulations
Since DTCA uses health-related quality of life (HRQOL) claims liberally in the
advertisements, it is important to understand its applications and appropriateness.
Rothermich et al. conducted a study to assess content of HRQOL claims in
advertisements and also determine the compliance of HRQOL claims with FDA
regulations for advertisements from 1992. HRQOL advertisements from three medical
journals (94 advertisements) from the years 1984, 1988, and 1992 were evaluated. Most
of the advertisements claimed to improve HRQOL (1984 – 81.0%, 1988 – 88.0%, 1992 –
62.0%), but few claimed the ability to maintain it (1984 – 7.0%, 1988 – 10.0%, 1992 –
277 Roth MS. Patterns in direct-to-consumer prescription drug print advertising and their public policy implications. Journal of Public Policy and Marketing. Spring 1996;15(1):63-75.

98
4.0%). The advertisements claiming ability to alleviate negative HRQOL rose sharply
from 19.0 percent in 1984, 15.0 percent in 1988 to 73.0 percent in 1992. A total of 96.0
percent in 1984 and all advertisements from 1988 and 1992 claimed benefits related to
the psychological dimension of HRQOL. The study results indicated that most
advertisements (84.0%) contained an implicit HRQOL claim and few contained explicit
claims (16.0%), but have decreased since 1988. Of the 26 HRQOL advertisements from
1992, 11 (42.0%) advertisements did not comply with the FDA requirements for
advertisements.278
The FDA examines the advertisements for content to make certain that they are not
misleading or deceptive and requires the advertisements to present a balance of benefit
and risk information. In 1990, Wilkes et al. conducted a cross-sectional survey of all
advertisements of drugs appearing in medical journals to assess the accuracy and
compliance with FDA standards. The study evaluated 109 advertisements selected from
ten peer-reviewed journals and found that 92.0 percent of the advertisements did not
comply with the FDA standards. The advertisements were found to have little or no
educational value (20.0%), and quality was unacceptable in several areas. Several
advertisements (40.0%) were lacking in fair balance. The headlines and subheadlines in
the advertisements were frequently found to be misleading. They were found misleading
about efficacy (32.0%) and the side effects and contraindications (19.0%). Most
advertisements (62.0%) were judged as needing major revisions. References and data
provided in the advertisements received the poorest evaluations. In 48.0 percent of the
278 Rothermich EA, Smeenk DA. Health-related quality-of-life claims in prescription drug advertisements. American Journal of Health-System Pharmacy. July 1 1996;53(13):1565-1569.

99
advertisements, headlines and subheadlines were not adequately referenced and in 30.0
percent of the advertisements the graphs and tables were not adequately referenced. The
graphs and tables provided in advertisements were also found to be misleading (30.0%)
and promoting inappropriate use of the drug (25.0%).279
Content Analysis
Content analysis of advertisements appearing in 18 consumer magazines from
January 1989 to December 1998 was conducted. In all, 320 advertisements for 101 brand
name drugs were analyzed. A total of 98.0 percent advertisements were directed toward
the potential end user of the prescription drug. Most advertisements (68.0%) were
directed toward both men and women, but some (23.0%) advertisements were directed
specifically toward women. The most common inducement offered to consumers in
these advertisements was information either in print or broadcast form (35.0%). Very few
(13.0%) advertisements offered monetary incentives in the form of rebate or discount
coupon for the prescription drugs.280, 281
The study also analyzed the type of appeals used in DTCA and found that a
majority of them made claims of effectiveness (57.0%). Others made appeals such as
“control symptoms” and “innovative” (41.0% each), “prevents condition” (16.0%),
“powerful” (9.0%), “reduced mortality” (7.0%), “dependable” (4.0%), and “cures”
(3.0%). Some others even provided socio-psychological appeals such as “psychological
279 Wilkes MS, Doblin BH, Shapiro MF. Pharmaceutical advertisements in leading medical journals: Experts' assessments. Annals of Internal Medicine. June 1, 1992;116(11):912-919.
280 Bell R, Kravitz RL, Wilkes MS. Direct-to-consumer prescription drug advertising, 1989-1998: A content analysis of conditions, targets, inducements, and appeals. Journal of Family Practice. April 2000;49(4):329-335.
281 Bell RA, Wilkes MS, Kravitz RL. The educational value of consumer-targeted prescription drug print advertising. Journal of Family Practice. 2000;49(12):1092-1098.

100
enhancement” (11.0%), “lifestyle enhancement” (6.0%) and “social enhancement”
(3.0%). The ease of use appeals were “convenience” (38.0%), “quick acting” (6.0%),
“economical” (5.0%), and “easy on the system” (3.0%).282, 283
A secondary analysis was conducted to determine the degree of information and
education provided in DTCA for prescription drugs. The results of the analyses indicated
that advertisements did not provide in-depth information regarding the product. The
advertisements for brand name drugs, on average, provided two of the five types of
information (condition name, misconceptions, precursors, prevalence, symptoms) about
the conditions for which the drug was used to treat. A majority of the advertisements
(95.0%) provided the name of the condition the prescription drug was used to treat, but
most did not provide any information on risk factors (73.0%) or prevalence of the
condition (88.0%). The advertisements, on average, provided only one of the six types of
information (alternatives, mechanism of action, success rate, supportive behaviors, time
of onset of action, treatment duration) regarding the prescription drug. Few of the
advertisements provided information on the mechanism of action of the drug (36.0%),
other alternative therapies (29.0%), or behavior changes (24.0%) to supplement the
treatment. The information was typically in a narrative format and also made an explicit
282 Bell R, Kravitz RL, Wilkes MS. Direct-to-consumer prescription drug advertising, 1989-1998: A content analysis of conditions, targets, inducements, and appeals. Journal of Family Practice. April 2000;49(4):329-335.
283 Bell RA, Wilkes MS, Kravitz RL. The educational value of consumer-targeted prescription drug print advertising. Journal of Family Practice. 2000;49(12):1092-1098.

101
offer to provide more information in print or audio/visual format or toll-free
information.284, 285
Another study analyzed the contents of advertisements for prescription drugs that
appeared in ten U.S. magazines between July 1998 and July 1999. A majority of the
advertisements (63.0%) were for drugs for symptom relief, followed by advertisements
(26.0%) for drugs treating the conditions. When analyzed by readership category, a
majority of the advertisements appeared in magazines for women followed by magazines
for general readership. Content-wise, most advertisements (87.0%) were vague in their
description of the benefit of the drugs. Even when the benefit was explicitly stated, very
few (13.0%) provided any evidence to support the claims. In contrast, a majority of the
advertisements (98.0%) described in detail the side-effects of the drug and some (51.0%)
even gave detailed frequency of the side-effects. Over half the advertisements (67.0%)
made one of the two emotional appeals (get back to normal and fear of the outcome), the
most common being the desire to get back to normal (60.0%).286
In a review of the advertisements promoting drugs published in the British
Medical Journal (BMJ) between July and December of 1996, 63 drugs and 81 different
advertisements were identified. The advertisements cited only two meta-analyses and 41
randomized control trials. One-quarter (27.2%) of the advertisements provided a high
level of evidence whereas 49.4 percent of the advertisements did not cite any supporting
284 Bell R, Kravitz RL, Wilkes MS. Direct-to-consumer prescription drug advertising, 1989-1998: A content analysis of conditions, targets, inducements, and appeals. Journal of Family Practice. April 2000;49(4):329-335.
285 Bell RA, Wilkes MS, Kravitz RL. The educational value of consumer-targeted prescription drug print advertising. Journal of Family Practice. 2000;49(12):1092-1098.
286 Woloshin S, Schwartz LM, Tremmel J, et al. Direct-to-consumer advertisements for prescription drugs: What are Americans being sold? The Lancet. October 6 2001;358:1141-1146.

102
evidence.287 In a similar study, Mindell examined 46 advertisements in ten consecutive
issues of the BMJ from March through May 1997. Only two-fifths (19) of the
advertisements cited any published peer-reviewed references. Of the 71 references cited
in these advertisements, 55 references were peer-reviewed journals, 13 were abstracts or
sponsored symposiums published in the journal and only 39 of the references were
original research or review articles.288
These studies reveal the inconsistencies of research literature cited by the
advertisements and as well as inadequacies, irregularities, and discrepancies in the
advertisements of prescription drugs. They also point out the improvements needed with
regards to the contents of the advertisements including the risk information.
Risk Information in Advertisements
An area of constant controversy is the risk statements or risk information provided
in the advertisements. According to the GAO review of two studies conducted between
1984-1990, there are a number of factors that influence consumer reaction to the risk
information. When drugs were advertised in a magazine, knowledge scores for full
disclosure advertisements and no risk information advertisements did not differ
significantly, but in both instances respondents had low knowledge scores. Dispersing
risk information in the advertisement resulted in a higher recall than when risk
information was emphasized by grouping them. The consumers recalled more benefit
information than risk information. However, when amount of risk information presented
287 Smart S, Williams C. Half of drug advertisements in BMJ over six months cited no supporting evidence. British Medical Journal. December 13, 1997;315:1622-1623.
288 Mindell J, Kemp T. Only two-fifths of advertisements cited published, peer reviewed references. British Medical Journal. December 13 1997;315:1622.

103
was increased, recall of risk information also increased and recall of benefit information
decreased. The recall of benefit and risk information was more balanced when specific
risk rather than general risk information was provided. When risk is provided in a very
specific form, it can compete with the promotional message of the advertisement.
However, consumers find any amount of risk information appealing and are reassured by
the advertisement that has some risk information.289
Davis, in a study published in 2000, evaluated the impact of completeness of risk
statement on consumer (N=140) attitude toward DTCA. The product description and risk
statements for Claritin D®, Cardura®, MetroGel®, Fosamax®, Imitrex®, Relafen®,
Sporanox®, and Atrovent® nasal spray were selected. Except for Atrovent®, risk
statement completeness significantly influenced the intent to recommend or purchase a
particular prescription drug (p<0.05). Hence, regardless of the completeness of the risk
statement, consumers were more likely to recommend or purchase the respective drugs
(all drugs except Atrovent®). However, completeness of side effect statements (level of
risk disclosure) in advertisements did have an impact on perception and preference. In a
follow-up study, consumers (N=58) were provided with five cases where a pair of drugs
with incomplete and complete descriptions were compared. In all five cases, a majority
of the consumers (82.8% - 98.3%) were more likely to recommend a drug with
incomplete risk statement. The consumers rated the safety and appeal of a drug more
positively for drugs that had incomplete disclosure of risk in the advertisements as
289 Prescription drugs: Little is known about the effects of direct-to-consumer advertisements: United States General Accounting Office, Report to the Chairman, Subcommittee on Oversight and Investigations, Committee on Energy and Commerce, House of Representatives; July 1991. GAO PEMD-91-19.

104
compared to drugs whose advertisements had complete risk disclosure. The study
discussed the possibility that consumers can conclude inaccurately regarding the drug’s
risks and benefits and equivalent drugs may be perceived differently or a drug may
appear better than it actually is.290
In a study published in 1984, Morris et al. surveyed 256 students to test the effect
of variations in information in advertisements on consumer knowledge, interpretation,
and acceptance of information. Fictitious treatments for acne (Vitamaine) and back pain
(Relaxan) were selected for the study. The type of information that improved knowledge
scores for each of the drugs was different. The amount of benefit information for
Relaxan influenced knowledge scores whereas amount of risk information influenced
knowledge scores for Vitamaine. The placement of risk information did influence the
beliefs regarding the medications. Promotional information with a large number of risks
listed or integrated was perceived as more believable than other formats. The integrated
format of risk information increased perceived value of the drug. While the integrated
format of risk information for the pain medication was perceived as a more thorough
method of presenting information it was the opposite for the acne medication. Relaxan
with more risk information was rated as having fuller content but Vitamaine with fewer
risks and separated format was rated as being more thorough. 291
290 Davis JJ. Riskier than we think? The relationship between risk statement completeness and perceptions of direct to consumer advertised prescription drugs. Journal of Health Communication. 2000;5(4):349-369.
291 Morris LA, Brinberg D, Plimpton L. Prescription drug information for consumers: An experiment of source and format. Current Issues in Research in Advertising. 1984;7(1):65-78.
105
Summary
Consumers are increasingly aware of prescription drugs and are mostly in favor of
DTCA. They also seem to use DTCA as a starting point for getting more information on
drugs and the condition it treats. Physicians and pharmacists are still very much opposed
to DTCA. The physicians believe that DTCA influences patients and as a result they
bring information to the physician and want to discuss the advertised drugs. However,
physicians feel that they increasingly have to spend time in the office explaining why the
drug is inappropriate for the patient or that the patient does not have the condition. With
the less time they have to see these patients and demands for advertised drugs by patients,
physicians feel pressured to prescribe the drugs requested by patients, which could lead to
inappropriate prescribing. Consumers claim that DTCA helps their adherence to the
treatment regimen and also reminds them to have their prescriptions filled. The risk
information provided in these advertisements probably plays a big role in the adherence
as well as in the patients’ decision to visit the doctor for a new diagnosis or for a
prescription. However, contents of advertisements and the claims in the advertisements
have been evaluated to be inadequate and many do not meet the FDA standards.
The next chapter will provide a review of the literature regarding the effects of
DTCA expenditures, access to care, age and gender on physician visits, utilization of the
drugs and prescription drug expenditures. The review will also summarize studies that
have evaluated the relationships of physicians with prescription drug utilization
expenditures.

106
CHAPTER 3: LITERATURE REVIEW
This chapter will provide a review of empirical studies conducted on factors
hypothesized to influence prescription drug expenditures namely advertising expenditures
for prescription drugs, access to care, demographics including age and gender, and
physician visits. This review will also focus on the relationships between physician visits
and utilization of prescriptions drugs.
PRESCRIPTION DRUG EXPENDITURES
In 1990, annual percent increase in prescription drug expenditures surpassed
increases in expenditures for other healthcare services and products (physician and
hospital).292 Based on data from Scott-Levin’s Source Prescription Audit database, the
Barents Group reported that the increased prescription drug expenditures from 1993 to
1998 was concentrated in few therapeutic categories. Four therapeutic categories
including antihistamines, antidepressants, cholesterol reducers and antiulcerants
accounted for 30.8 percent ($42.7 billion) of the increase in prescription drug
expenditures from 1993 to 1998.293 In a follow-up report of prescription drug
expenditures from 1999 to 2000, 51.4 percent of the increase in prescription drug
expenditures could be attributed to retail spending in eight therapeutic categories
292 Health Care Financing Administration (HCFA) Office of the Actuary NHSG. HCFA website: www.hcfa.gov; January 10, 2000.
293 Barents Group L. Issue brief: Factors affecting the growth of prescription drugs expenditures. National Institute for Health Care Management. July, 1999. Available at: www.nihcm.org. Accessed January, 2001.

107
including drugs used to treat high cholesterol levels, arthritis, chronic pain, depression,
ulcers and other stomach ailments, high blood pressure, diabetes, and predisposition to
seizures. However, the increase in sales for 23 drugs contributed to 50.7 percent of the
increase in expenditures. Increasing utilization was responsible for 42.0 percent of the
increase in prescription drug expenditures from 1999 to 2000.294 Using the same
database, the National Institute of Health Care Management (NIHCM) conducted another
follow-up evaluation to identify the factors driving the increase in prescription drug
expenditures from 2000 to 2001. Outpatient prescription drug expenditure increased by
17.1 percent ($131.9 billion to $154.5 billion) from 2000 to 2001. The increase in the
number of prescriptions dispensed contributed to 39.0 percent of the increase in
expenditures. Increased expenditures in nine categories of drugs namely drugs used to
treat depression, cholesterol, diabetes, arthritis, high blood pressure, pain, allergies, ulcers
and other gastrointestinal ailments contributed to 50.6 percent of the increase in
prescription drug expenditures.295
Price Waterhouse Cooper conducted a study to understand factors reported to
contribute to rising premiums and rising healthcare costs from 2001 to 2002. Prescription
drugs and other advances in diagnostics and treatment together accounted for the greatest
increase in healthcare premiums (22.0%). The consumers 40 to 50 years of age were
using more medications and healthcare resources and were interested in getting
294 Findlay S, Sherman D, Chockley N, et al. Prescription drug expenditures in 2000: The upward trend continues. The National Institute for Health Care Management. May 2001. Available at: www.nihcm.org. Accessed December, 2001.
295 Findlay S, Sherman D, Chockley N, et al. Prescription drug expenditures in 2001: Another year of escalating costs. National Institute for Health Care Management. April 2002. Available at: www.nihcm.org. Accessed June, 2002.

108
information about the best healthcare regardless of the costs. Increasing consumer
demand accounted for 15.0 percent of the total increase in healthcare premiums from
2000 to 2001. With increased marketing of prescription drugs, patients visit the physician
more often to ask about these advertised drugs and request a prescription, which
contributes to increased prescription drug expenditures.296
With increasing consumer demand fueled by DTCA and influence of other factors
such as access to care, age, gender, and utilization, prescription drug expenditures have
been rising. The following sections will provide a review of literature for DTCA and
related expenditures, access to care, gender, and age and their impact on prescription drug
expenditures, physician visits and utilization of prescription drugs.
DTCA Expenditures: Review of the Literature
GAO Report: Review of Studies from 1997
The GAO reviewed studies conducted since 1997 to: (a) Compare spending on
DTCA and Research and Development (R&D) by pharmaceutical companies; (b)
Evaluate effect of DTCA on prescription drug expenditures and utilization; and (c)
Evaluate the extent and effectiveness of FDA in its oversight of DTCA. The growth rate
for R&D spending (59.0%) from 1997 to 2001 was lower than the growth rate for total
promotional expenditure (74.0%) and DTCA expenditure (145.0%) for the same time
period. Drugs that were advertised were usually among the best-selling drugs and the
sales were higher for advertised drugs than for drugs that were not advertised. Most of
296 The factors fueling rising healthcare costs. PriceWaterhouseCoopers, prepared for the American Association of Health Plans. April 2002. Available at: http://www.aahp.org/InternalLinks/PwCFinalReport.pdf. Accessed November, 2002.

109
the increased prescription drug expenditures were a result of increased utilization and not
price. The number of prescriptions dispensed for the advertised drugs increased by 25.0
percent from 1999 to 2000 compared to a 4.0 percent increase for drugs that were not
advertised. The drugs used to treat chronic conditions that have greater potential for high
sales were more likely to be advertised.297
The report also discussed the strengths and pitfalls of the FDA’s oversight of
DTCA. While the process is generally effective in halting dissemination of
advertisements that are misleading, there are several problems with the process. Some
pharmaceutical manufacturers have repeatedly disseminated misleading advertisements
for the same drug and have failed to submit the advertisements in a timely manner for
evaluation. Furthermore, with new regulations issued in 2002, it would take more time
for the FDA to issue regulatory letters, mostly after the advertisement has run its
course.298
DTCA Expenditures and Related Studies
Some studies have attempted to evaluate the trends in rising DTCA expenditures
and its emerging effects. Rosenthal et al. conducted a study to identify the trends in total
promotional and DTCA expenditures. Detailing or promotion to physicians still
accounted for a majority of total promotional spending. While DTCA expenditures
increased by $1.7 billion from 1996 to 2000 (212.0%), promotional spending to
physicians including physician samples of drugs increased by $4.9 billion (58.1%).
297 Prescription drugs: FDA oversight of direct -to-consumer has limitations: United States General Accounting Office, Report to Congressional Requesters; October 2002. GAO-03-177.
298 Prescription drugs: FDA oversight of direct-to-consumer has limitations: United States General Accounting Office, Report to Congressional Requesters; October 2002. GAO-03-177.
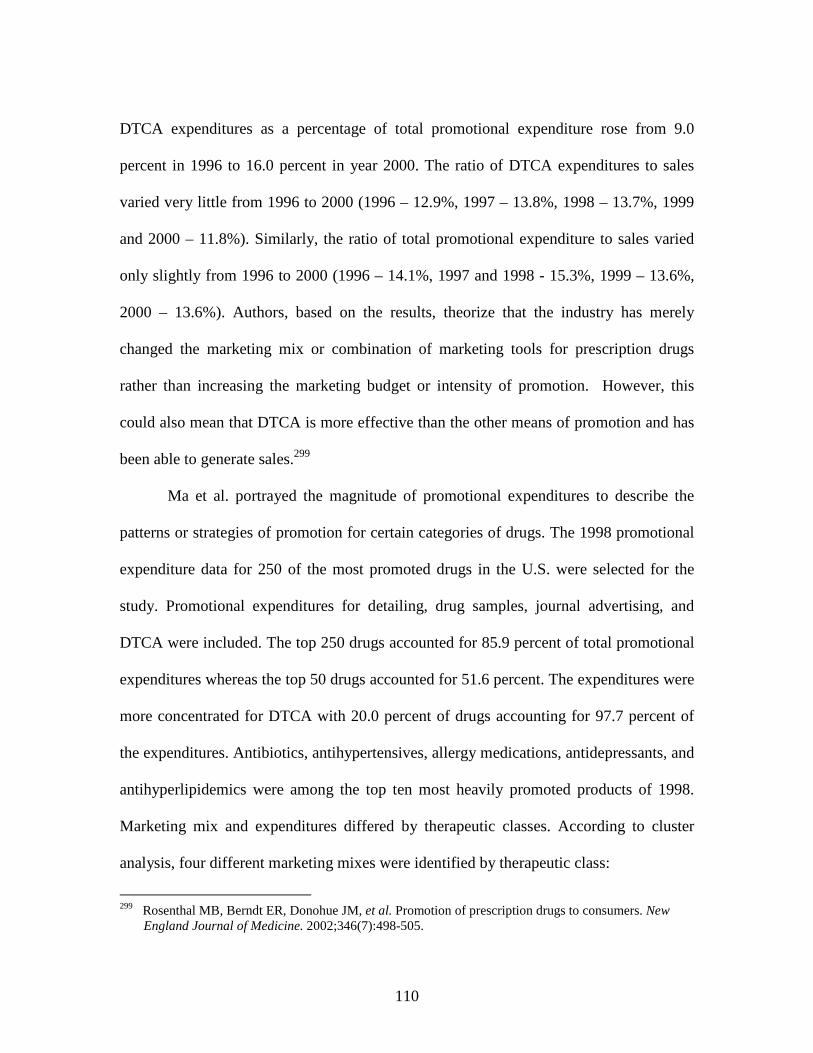
110
DTCA expenditures as a percentage of total promotional expenditure rose from 9.0
percent in 1996 to 16.0 percent in year 2000. The ratio of DTCA expenditures to sales
varied very little from 1996 to 2000 (1996 – 12.9%, 1997 – 13.8%, 1998 – 13.7%, 1999
and 2000 – 11.8%). Similarly, the ratio of total promotional expenditure to sales varied
only slightly from 1996 to 2000 (1996 – 14.1%, 1997 and 1998 - 15.3%, 1999 – 13.6%,
2000 – 13.6%). Authors, based on the results, theorize that the industry has merely
changed the marketing mix or combination of marketing tools for prescription drugs
rather than increasing the marketing budget or intensity of promotion. However, this
could also mean that DTCA is more effective than the other means of promotion and has
been able to generate sales.299
Ma et al. portrayed the magnitude of promotional expenditures to describe the
patterns or strategies of promotion for certain categories of drugs. The 1998 promotional
expenditure data for 250 of the most promoted drugs in the U.S. were selected for the
study. Promotional expenditures for detailing, drug samples, journal advertising, and
DTCA were included. The top 250 drugs accounted for 85.9 percent of total promotional
expenditures whereas the top 50 drugs accounted for 51.6 percent. The expenditures were
more concentrated for DTCA with 20.0 percent of drugs accounting for 97.7 percent of
the expenditures. Antibiotics, antihypertensives, allergy medications, antidepressants, and
antihyperlipidemics were among the top ten most heavily promoted products of 1998.
Marketing mix and expenditures differed by therapeutic classes. According to cluster
analysis, four different marketing mixes were identified by therapeutic class:
299 Rosenthal MB, Berndt ER, Donohue JM, et al. Promotion of prescription drugs to consumers. New England Journal of Medicine. 2002;346(7):498-505.

111
� Office focus cluster had high expenditures for office-physician promotion (36.0%)
and free drug samples (44.0%) than DTCA (7.0%).
(antibiotics, antidepressants, antifungals, oral hypoglycemics, antihyperlipidemics,
asthma medications, antihypertensives, antianxiety, NSAIDs, contraceptives,
osteoporosis medications, headache medications, antacids, impotence medications).
� Office/DTC focus had similar expenditure patterns as office focus but with higher
DTCA expenditures (29.0%).
(allergy medications, urinary tract medications, post-menopausal medications)
� DTC focus cluster (smoking cessation products) had high (83.0%) DTCA
expenditures.
� General professional focus (narcotic analgesics) had high expenditures for office,
hospital promotion, journal advertising and lower expenditures for free samples, but
no DTCA.300
Over the years with the changing marketing mix, DTCA is playing an
increasingly prominent role in the marketing mix. This rising DTCA expenditures has
been speculated to have an impact on retail gross margin, prescription drug expenditures,
physician visits, market share and sales (utilization).
Kopp and Sheffet hypothesized that initiation of DTCA would affect retail gross
margins of the advertised drugs. The retail gross margins of advertised drugs (advertised
between June 1986 and June 1992) were compared with drugs that were not advertised. A
total of 120 drugs were included in the study. On initiation of advertising, retail gross
300 Ma J, Stafford RS, Cockburn IM, et al. A statistical analysis of the magnitude and composition of drug promotion in the United States in 1998. Clinical Therapeutics. May 2003;22(5):1503-1517.

112
margins for the advertised drugs declined dramatically. This decrease was significantly
more than the decrease in retail gross margins over the same period of time for drugs that
were not advertised (p<0.001). According to the dual-stage theory, DTCA influences
consumers who would then demand these brand name products. This could reduce the
generic drug sales in pharmacies and also influence the price set by pharmacies by the
level of competition and thereby influencing the gross margin.301 However, from the
manufacturers’ perspective, Return on Investment (ROI) is one of the main reasons for
the increased use of DTCA by the pharmaceutical industry.
A ROI analysis was conducted for pharmaceutical promotion including detailing,
DTCA, journal advertising, and meetings and events. The study compared ROI for drugs
by brand size (revenue) and launch date (< 1993, 1994-1996, 1997-1999). Analyses of
data for 391 drugs from 1995 through 1999 indicated that with time, the ROI increased
by brand size. Journal advertising had the highest median ROI ($5.00) followed by
physician meetings and events ($3.56), and detailing ($1.72). DTCA had the lowest
median ROI ($0.19). Even though journal advertising has a small share of the total
promotional budget, it had highest the ROI among all the marketing variables indicating
that journal advertising is underutilized. The ROI for journal advertising ranged from
$2.22 to $6.86 depending on brand size and year of launch but was higher for larger and
older brands. Physician meetings and events had the next highest median ROI but had a
high standard error of $1.92 and were highly correlated with other marketing variables,
301 Kopp SW, Sheffet MJ. The effect of direct-to-consumer advertising of prescription drugs on retail gross margins: Empirical evidence and public policy implications. Journal of Public Policy and Marketing. Fall 1997;16(2):270-276.

113
especially detailing. This made it difficult to determine ROI by size and launch date.
Again, spending for physician meetings and events was a small part of the total
promotional budget indicating that it was underutilized. Detailing with a median ROI of
$1.72 suggests that it pays off even at high levels of expenditure. The ROI for detailing
ranged from $1.27 to $10.29 depending on brand size and launch date and was higher for
larger and more recently launched brands. The ROI for DTCA went up to $1.37
depending on brand size and launch date and was more effective for the larger and
recently launched brands. For detailing and journal advertising, half of the ROI was
attained within the first month and the remainder of ROI was attained in the subsequent
nine months. For DTCA, the first 10.0 percent of ROI is attained during the first month,
72.0 percent in the first year and remainder took two years.302 This increase in ROI was
mainly through increased utilization or sales of drugs, which in turn is greatly influenced
by physician visits. These ultimately influence prescription drug expenditures.
DTCA and Prescription Drug Expenditures
Only two studies have tried to evaluate the influence of DTCA on prescription
drug expenditures. In a study by Rosenthal et al., effects of DTCA on five therapeutic
classes including antidepressants, antihyperlipidemics, proton pump inhibitors, nasal
sprays, and antihistamines were evaluated for August 1996 to December 1999. DTCA did
have an effect on sales of the drugs. On applying estimates from results to changes in
DTCA expenditures for 25 classes of drugs with the highest retail sales from 1999 to
2000, they accounted for 60.0 percent of spending on DTCA. Furthermore, DTCA
302 Neslin S. ROI Analysis of pharmaceutical promotion (RAPP): An independent study. May 22, 2001. Available at: www.rappstudy.org. Accessed December, 2002.

114
accounted for a 12.0 percent growth in total prescription drug expenditures for 1999-
2000, which translates to an additional $4.20 in sales for every $1.00 spent on DTCA.
However, the study concluded that DTCA was important, but was not the primary driver
for the growth.303
Using Scott-Levin’s Source Prescription Audit database, NIHCM also evaluated
the influence of DTCA expenditures on prescription drug expenditures. The Barents
group identified four therapeutic categories including antihistamines, antidepressants,
cholesterol reducers, and antiulcerants that accounted for a major portion of the
prescription drug expenditures. The top ten most heavily advertised drugs of 1998
accounted for a $9.3 billion increase (22.0%) in prescription drug expenditures from 1993
to 1998.304
In 1999, advertised drugs were again among the top selling drugs and accounted
for 19.0 percent of the increase in prescription drug expenditures. The top 25 drugs most
heavily advertised drugs of 1999 accounted for 40.7 percent of the increase in
prescription drug expenditures. The advertised drugs had a 43.2 percent growth in one
year sales whereas other drugs had a 13.3 percent growth in sales for 1999.305 A similar
pattern was observed in the year 2000 with few heavily advertised drugs contributing to a
significant increase in prescription drug expenditures. The top 50 most heavily advertised
drugs during the year 2000 accounted for 31.3 percent of the retail sales and contributed
303 Rosenthal MB, Donohue J, Epstein A, et al. Demand effects of recent changes in prescription drug promotion. Available at: www.kff.org. Accessed October, 2002.
304 Barents Group L. Issue brief: Factors affecting the growth of prescription drugs expenditures. National Institute for Health Care Management. July, 1999. Available at: www.nihcm.org. Accessed January, 2001.
305 Findlay S. Research Brief: Prescription drugs and mass media advertising. National Institute for Health Care Management. September, 2000. Available at: www.nihcm.org. Accessed April, 2001.

115
to a 47.8 percent increase in prescription drug expenditures.306 Thus, the two reports by
Rosenthal et al. and NIHCM have opposing conclusions regarding the extent of the
relationship between DTCA and prescription drug expenditures. The next two sections
will discuss the literature on relationships between DTCA and utilization factors
including physician visits and prescription drug use.
DTCA and Physician Visits
Even though there has been much speculation regarding effects of DTCA on
physician visits for conditions and symptoms the advertised drug treats, very few studies
have evaluated this relationship. According to Scott-Levin’s Physician Drug and
Diagnosis Audit for January through September 1998, overall office visits increased by
2.0 percent. However, visits for advertised conditions increased by 11.0 percent during
the same time period.307
Using data from Competitive Media Reporting (CMR) and Scott Levin Source
Prescription Audit, Eichner and Maronick examined the impact of advertising of
antihistamines, nail fungus medications, cholesterol-lowering drugs, and antidepressants
on physician visits from 1996 to 1998. For these drug categories, DTCA expenditures
was related to the increased physician visits for the condition the drugs treat. For
example, during the first nine months in 1998, physician visits for allergies increased by
10.0 percent. Sporanox®, a drug used to treat nail fungus, was introduced in 1992 when
306 Findlay S, Sherman D, Chockley N, et al. Prescription drugs and mass media advertising, 2000. National Institute for Health Care Management. November 2001. Available at: www.nihcm.org. Accessed January, 2002.
307 Scott-Levin. Patient visits up for DTC conditions. Press Release. November 6, 1998. Available at: www.scottlevin.com. Accessed January, 2002.

116
physician visits for this condition was 800,000 per year. By 1996, with advertising,
physician visits doubled.308
In a study evaluating effects of DTCA from July 2001 through July 2002, 35.0
percent of consumers were reported to have visited a doctor as a result of DTCA to have
a discussion regarding an advertised drug or a health concern. It is possible that DTCA
precipitated these visits to the physician and helped detect a new condition (24.7%).309
In another study of the evaluation of DTCA on demand for statin drugs, the effect
on physician visits was also evaluated. Data from IMS Health and Scott Levin for the
years 1995 through 2000 were analyzed. Based on the monthly physician panel data, the
number of physician visits involving treatment for elevated cholesterol has steadily
increased from 1996 to 2000 from 1.0 million to 2.5 million and 75.0-95.0 percent are
being treated with statin drugs. They concluded that although advertising expenditures for
statin drugs did not have a significant direct impact on physician visits, advertising of
statin drugs could have an indirect impact by influencing patients to visit the physician.310
Zachry et al. reported that between January 1992 and July 1997, DTCA
expenditures are related to the number of diagnoses for hyperlipidemia and the number of
visits to the physician for allergy-related symptoms. The other diagnoses and reasons for
visit (symptoms) tested in the study were allergic rhinitis, acid/peptic disorders, and
308 Eichner R, Maronick TJ. A review of direct-to-consumer advertising and sales of prescription drugs: Does DTC advertising increase sales and market share? Journal of Pharmaceutical Marketing and Management. 2001;13(4):19-42.
309 Weissman JS, Blumenthal D, Silk AJ, et al. Consumer reports on the health effects of direct-to-consumer drug advertising. Health Affairs - Web Exclusive. February 26 2003:W3-82-W83-95.
310 Calfee JE, Winston C, Stempski R. Direct-to-consumer advertising and demand for cholesterol-reducing drugs. Journal of Law and Economics. October 2002;45(2{Part 2}):673-690.

117
benign prostatic hypertrophy.311 Even though studies are not consistent regarding the
effects of DTCA on physician visits, its influence on utilization have been widely
reported.
DTCA and Utilization of Prescription Drugs
Several studies have attempted to understand the influence of DTCA on
utilization or sales of prescription drugs. Zachry et al. conducted a study to identify the
relationship between DTCA expenditures and prescriptions written for advertised drugs.
The National Ambulatory Medical Care Survey (NAMCS) and CMR databases were
used for the study. The prescription drugs that had been advertised for at least 19 months
from January 1992 to July 1997 were selected from the five drug classes including:
antihistamines, antihypertensives, acid-peptic disorder medications, benign prostatic
hypertrophy aids, and antilipemics. The results of the study indicate that DTCA did have
an impact on the drugs prescribed by the physician. DTCA may impact only a few
categories of drugs, but it did not necessarily impact all the drugs that are advertised.312
The study found that DTCA expenditures influenced the number of prescriptions
written for Claritin®, Seldane®, Hismanal®, Zocor®, and Zantac®. There was a significant
relationship between monthly expenditure on DTCA for antilipemics and number of
prescriptions written during the respective month (p<0.05). For every $1000 spent on
advertising antilipemics, 41 prescriptions for the antilipemics, 23 prescriptions for Zocor®
311 Zachry III WM, Shepherd MD, Hinich MJ, et al. Relationship between direct-to-consumer advertising and physician diagnosing and prescribing. American Journal of Health-System Pharmacy. 2002;59(1):42-49.
312 Zachry III WM, Shepherd MD, Hinich MJ, et al. Relationship between direct-to-consumer advertising and physician diagnosing and prescribing. American Journal of Health-System Pharmacy. 2002;59(1):42-49.

118
specifically were written. The monthly DTCA expenditures for antihistamines was
significantly associated with the number of prescriptions written for Claritin®, Seldane®,
and Hismanal® (p<0.05). For every $1000 spent on advertising antihistamines, 24 more
prescriptions for Claritin®, 20 fewer prescriptions for Seldane®, and seven fewer
prescriptions for Hismanal® were written. More specifically the amount spent on DTCA
per month on advertising Claritin® was associated with number of prescriptions written
for Claritin®. However, DTCA expenditure on Hismanal® was negatively associated with
the number of prescriptions written for Hismanal®. For every $1000 spent on advertising
each of the products, Claritin® and Hismanal®, 45 prescriptions were written for Claritin®
and 27 fewer prescriptions were written for Hismanal®. DTCA expenditures for acid-
peptic disorder medications was significantly but negatively related to the number of
prescriptions written for Zantac®. For every $1000 spent on advertising acid-peptic
disorder medications, 59 fewer prescriptions for Zantac® were written. The study results
indicate that DTCA expenditures does impact the utilization of prescription drugs or
number of prescriptions written but not necessarily for all advertised drugs.313
In another time-series analysis of new prescription data, DTCA was found to be
associated with increasing sales volume. The study evaluated the impact of a DTCA
campaign on physician prescribing for Imitrex®, medication for migraine, from March
1993 through December 1994. A nationally representative sample of pre- and post-
advertising campaign data on prescription drug volume (IMS Health) was modeled,
313 Zachry III WM, Shepherd MD, Hinich MJ, et al. Relationship between direct-to-consumer advertising and physician diagnosing and prescribing. American Journal of Health-System Pharmacy. 2002;59(1):42-49.

119
which helped assess the impact of DTCA on new prescription sales volume prior to and
following the advertising campaign. Intervention analysis, a type of time-series analysis,
was used to evaluate the magnitude of change in pre- and post-advertising prescription
volume. The analysis indicated a causal relationship between DTCA campaign and new
prescription volume. The previous month’s sales and DTCA campaign were found to
significantly predict new prescription volume for Imitrex® (p=0.000). First month of
DTCA campaign was significantly associated with an increase of 61.4 new prescriptions
(p=0.0006). The new prescription volume increased in an exponentially-declining fashion
over the time when the DTCA campaign was aired. When the DTCA campaign was
discontinued the new prescription volume declined exponentially. Continued advertising
had a positive impact on prescription volume but lessened over time until the marginal
effect approached zero.314
According to NIHCM reports based on data from Scott-Levin’s Source
Prescription Audit database, the heavily advertised drugs of 1993 to 2000 were also
among the top most heavily prescribed drugs, which might lead to the speculation that
advertising does increase utilization of prescription drugs. The most heavily advertised
drugs were also the ones most likely to be used on an ongoing basis, namely
antihistamines, antidepressants, and cholesterol reducers.315 In 1999, physicians wrote
34.2 percent more prescriptions for the top 25 drugs that were advertised. For the same
time period, the number of prescriptions written for all other drugs increased by only 5.1
314 Basara LR. The impact of a direct-to-consumer prescription medication advertising campaign on new prescription volume. Drug Information Journal. 1996;30:715-729.
315 Barents Group L. Issue brief: Factors affecting the growth of prescription drugs expenditures. National Institute for Health Care Management. July, 1999. Available at: www.nihcm.org. Accessed January, 2001.

120
percent.316 In 2000, the number of prescriptions written for the top 50 most heavily
advertised drugs rose by 24.6 percent from 1999, and only 4.3 percent for drugs that were
not advertised.317
As seen in the previous studies, advertised drugs tend to have high new-use
utilization rates but there are exceptions to this. In the Fairman study of utilization trends,
the effects of advertising on prescription drug expenditures were evaluated for users
(N=463,820 adults) of 15 chronic or seasonal therapeutic classes from January 1996
through June 1998. The study found that most advertised drugs have a high utilization or
new use rates (1997) for certain drug categories such as antirheumatic (55.0%), antiulcer
(43.8%), and antidepressants (39.2%). However, the exceptions to this were
antihyperlipidemics (34.1%) that are advertised extensively, but had below average new
use rates. Anticonvulsants that were not advertised, but have many off-label uses, had a
very high new use rate (41.5%). Also, some drugs that were heavily advertised had high
drop-out rates than usual (antihistamines - 55.0% and antiulcer - 41.5%).318
Iizuka and Jin, evaluated the relationship between DTCA expenditures and patient
and doctor behaviors between 1995 to 2000 using data from CMR and NAMCS.
Advertising had significant positive effects on physician visits when drugs were
prescribed in that class. The authors reported that every $21.55 increase in DTCA
expenditures, generated one visit when drug from that class was prescribed. But this
316 Findlay S. Research Brief: Prescription drugs and mass media advertising. National Institute for Health Care Management. September, 2000. Available at: www.nihcm.org. Accessed April, 2001.
317 Findlay S, Sherman D, Chockley N, et al. Prescription drug expenditures in 2000: The upward trend continues. The National Institute for Health Care Management. May 2001. Available at: www.nihcm.org. Accessed December, 2001.
318 Fairman KA. The effect of new and continuing prescription drug use on cost: A longitudinal analysis of chronic and seasonal utilization. Clinical Therapeutics. 2000;22(5):641-652.

121
relationship was significant only after 1997. The advertising effects were found to be five
times greater on established patients than new patients. The reason proposed for this was
that established patients may be more sicker and paying more attention to the
advertisements or because patients tend to return to physicians they have visited before
even for new conditions. For cholesterol-reducing agents (statins) and allergy drugs,
advertising had no positive impact on physician’s prescription choice. DTCA was
reported to increase the visits when drug was prescribed and detailing was reported to
influence physician’s prescription choice. The results suggested that DTCA was
primarily useful for market expanding purposes.319 These results reflect the possibility
that DTCA possibly does drive utilization in some cases but not all.
DTCA Expenditures and its Impact on Sales and Market Share
The manufacturers advertise mainly with the goal of increasing market share and
sales and several studies have attempted to evaluate this relationship. Manning and Keith
reexamined NIHCM data (Scott-Levin’s Source Prescription Audit database) for the year
2000 with rank ordering of brands according to DTCA expenditures. On combining data
from NIHCM and Nielson Monitor Plus for DTCA expenditures for the year 2000, the
study reported that DTCA was not responsible for most of the change in sales for the
drugs and had only a weak association with percentage increase in sales. NIHCM
examined 26 drugs that had the most rapid sales, were launched before 1999, and had
significant DTCA expenditures in 1999 and 2000. In comparison to the NIHCM reports,
319 Iizuka T, Jin GZ. The effects of direct-to-consumer advertising in the prescription drug markets. 2003. Available at: http://www.e.u-tokyo.ac.jp/cirje/research/workshops/micro/micropaper03/iizuka.pdf. Accessed June, 2004.

122
some drugs had strong sales growth without intensive advertising (Figure 3.1) and some
drugs that were advertised heavily did not have strong sales. Other factors were reported
to be responsible for most of the change in sales indicating that other market dynamics
play a major role in growth rather than just DTCA expenditures.320
Figure 3.1: Change in Prescription Volume and DTCA Expenditures for High-Growth Prescription Drugs, 1999-2000
The study by Eichner and Maronick examined the impact of advertising of
antihistamines, nail fungus medications, cholesterol-lowering drugs, and antidepressants
on their sales and market share from 1996 to 1998 using data from CMR and Scott-
Levin’s Source Prescription Audit database. The DTCA expenditures for the two drugs
in the nail fungus treatment category (Sporanox®, Lamisil®) were highly correlated with
market share (0.9 and 0.98 respectively) indicating that as DTCA expenditures increased,
market share increased. However, DTCA expenditures did not really reflect the market
share for Sporanox® and Lamisil®, but instead explained the marketing mix for the
products. For cholesterol-lowering drugs, with the increase in DTCA expenditures from
1996 to 1998, the number of prescriptions written for these drugs almost doubled. The
320 Manning RL, Keith A. The economics of direct-to-consumer advertising of prescription drugs. Economic Realities in Health Care. 2001;2(1):3-9.
Source: Prescription Volume: NIHCM, “Prescription Drug Expenditures in 2000”: DTC Spending Nielson Monitor Plus; Manning RL, Keith A. The economics of direct-to-consumer advertising of prescription drugs. Economic Realities in Health Care. 2001; 2(1):3-9.

123
DTCA expenditures and market share correlation for Pravachol® was negative (-0.37)
and weak for Zocor® (0.15) and Lescol® (0.32). This reiterates the fact that other factors,
other than DTCA expenditures, are playing a larger role in determining the market share.
In the antidepressants category, the correlation between DTCA expenditures and market
share was erratic. Prozac® had a strong negative correlation (-0.92) whereas Effexor® had
a positive correlation (0.50). In this case, other factors were weakening the effects of
DTCA. Increased DTCA expenditures was related to increased antihistamines and
cholesterol-reducing medications prescribed but DTCA did not play that big of a role in
increasing sales for antidepressants and nail fungus medications. Although DTCA
expenditures for nail fungus medications reduced from 1996 to 1998, sales for these
medications increased by 50.0 percent. These results indicate that DTCA expenditures
does not necessarily always correlate with market share within a category.321
DTCA may not be the primary driver but it does have some influence on
prescription drug sales and expenditures for at least some drugs. Rosenthal et al., using
data from CMR and IMS Health, analyzed promotional expenditure trends from 1996
through 2000 and found considerable variation in DTCA expenditures by therapeutic
class. The ratio of DTCA expenditures and sales and the variation in intensity of
promotion were compared for five therapeutic classes namely antidepressants,
antihistamines, antihyperlipidemics, nasal sprays and proton pump inhibitors. This
variation (23.2) was calculated by dividing the highest ratio of expenditures to sales by
321 Eichner R, Maronick TJ. A review of direct-to-consumer advertising and sales of prescription drugs: Does DTC advertising increase sales and market share? Journal of Pharmaceutical Marketing and Management. 2001;13(4):19-42.

124
the lowest ratio of expenditures to sales. This variation 23.2 meant that the ratio for the
classes of drugs with highest DTCA expenditures was 23 times higher than the ratio for
therapeutic classes with the lowest DTCA expenditures. However, promotional
expenditure on detailing as a percent of sales for these classes varied by only a factor of
three. The pharmaceutical industry had been using DTCA campaign as a part of
marketing strategy to improve sales and have allocated huge dollar amounts in the budget
for it. However, DTCA expenditures still remains a small proportion of the overall
promotional expenditures for the industry. This merely reinforces the fact that it is the
physician who makes the final prescribing decision and they should be familiar enough
with the product to be comfortable enough to prescribe the product. Despite growth in
DTCA expenditure, DTCA is simply a tool that complements detailing or promotion to
healthcare professionals.322
In another study, Rosenthal et al. using data from CMR (advertising data) and
Scott-Levin (detailing data), evaluated the effects of two types of promotional
expenditures including detailing and DTCA for brands in five therapeutic classes using
monthly national data from August 1996 to December 1999. The five classes selected for
the study included antidepressants, antihyperlipidemics, proton pump inhibitors, nasal
sprays, and antihistamines. The study reported that if all else were equal, an increase of
10.0 percent in expenditures for advertising would increase sales by approximately 1.0
percent. Applying the estimates from the results to the changes in expenditures from 1999
to 2000 for the 25 drug classes with the highest retail sales found that the drugs in these
322 Rosenthal MB, Berndt ER, Donohue JM, et al. Promotion of prescription drugs to consumers. New England Journal of Medicine. 2002;346(7):498-505.

125
classes accounted for 75.0 percent of the retail sales during that time period. The
coefficient estimates for the impact of detailing on sales indicated that the effect of
detailing on sales of class of drugs was much smaller when compared to sale for classes
of drugs for which DTCA is the main promotion strategy. Based on these results study
concluded that DTCA was important and helps bring in patients into the physicians office
but was not a primary driver of growth in prescription drug use and expenditures.323
Wosinska evaluated the DTCA expenditures and utilization of advertised
cholesterol-lowering drugs from 1996-1999. The study utilized data for 349,129
insurance claims for 38,358 cholesterol patients enrolled in a Blue Shield of California
health plan between 1996 and 1999. During this time period, DTCA was found to have
an impact on market share of these drugs. A $1.0 million increase in DTCA expenditures
increased the market share by 0.5 percent, thus indicating that DTCA does influence
market share and increases the sales of these drugs. However, this effect was observed
predominantly for drugs that were on the preferential list in the formulary. The effect of
DTCA was found to be three times as much for the formulary drugs versus those that are
not preferred drugs or not listed in the formulary. The net effects of DTCA were twice as
large for the initial or new prescription decision or new users than for the subsequent
prescriptions and the effect was also much higher for formulary medications. The impact
of detailing was found to be significantly higher on prescription choice. However, it was
DTCA that brought the consumer to the physician’s office. Informational role of DTCA
was found to outweigh its differentiating effects. For example, Pfizer did not advertise
323 Rosenthal MB, Donohue J, Epstein A, et al. Demand effects of recent changes in prescription drug promotion. Available at: www.kff.org. Accessed October, 2002.

126
Lipitor® the first year, but focused on promoting the drug to the physicians whereas
Bristol Myers focused on advertising Pravachol® to consumers. Advertising did not really
help market share of Pravachol® much, but Lipitor® captured a large proportion of the
market of new users indicating the success of detailing over DTCA. The study concluded
that the primary role of DTCA is to increase market share, but has to be used suitably in
conjunction with detailing.324
Calfee et al. identified an exception to the effects of the fluctuations in DTCA
expenditures on sales for cholesterol-lowering drugs from 1995 to 2000. The study was
conducted using data from IMS Health and Scott-Levin’s Physician Drug and Diagnosis
Audit databases. The effects of DTCA on demand were estimated using data for statin
drugs (cholesterol-lowering drugs) from 1995-2000. The study found that DTCA
expenditures did not have a significant impact on demand for prescription drugs or the
market share for these drugs. However, advertising could have an indirect effect on statin
demand by influencing consumers to visit the physician after seeing the advertisement to
discuss about certain symptoms or about the drug and reinforce the physicians’
recommendations for drug therapy. Hence, the effect of DTCA on demand cannot be
completely ruled out.325
Summary of the Literature
The impact of DTCA on utilization of prescription drugs has researchers
speculating the relationship between DTCA and prescription drug expenditures. Rising
324 Wosinska ME. The economics of prescription drug advertising [Ph.D Diss]. Berkley, University of California; 2002.
325 Calfee JE, Winston C, Stempski R. Direct-to-consumer advertising and demand for cholesterol-reducing drugs. Journal of Law and Economics. October 2002;45(2{Part 2}):673-690.

127
DTCA expenditures along with prescription drug expenditures have contributed to this
speculation. Each year with rising expenditures for marketing, especially DTCA, its
influence can be seen in several aspects of prescription drug use. Some studies stated that
DTCA motivates patients to visit the physician in order to get more information or even a
new diagnosis. The issue of impact of DTCA on physician visits or if it does influence
market share has not been completely resolved, but DTCA has been noted to have an
impact on the sales of drugs.
DTCA is mainly used for drugs used to treat chronic conditions, which are used
on an ongoing basis. This could be one of the reasons for increasing utilization rates for
the advertised drugs. In addition, usually if one drug in a therapeutic class is advertised,
then all drugs in that class are also among the drugs advertised and thereby contributing
to the utilization rates. However, most studies have reported that DTCA influences the
use of some drugs and not all advertised drugs.
Logic would suggest that with increasing influence of DTCA on utilization it
would extend to expenditures as well. Only two studies have tried to identify the impact
of DTCA on prescription drug expenditures. However, there could be several other
factors that are influencing this rise in prescription drug expenditures.
Access to Care: Review of the Literature
Access to Care and Prescription Drug Expenditures
As of 1999, almost all those who have healthcare coverage through employers had
prescription drug coverage (99.0%). Prescription drug coverage can improve overall

128
access to prescription drugs and the type of drugs used.326 Lack of prescription drug
coverage or access to prescription drugs can hinder necessary care for the uninsured and
the older Americans.
Several studies have evaluated the effects of having no prescription drug coverage
especially for the elderly on prescription drug expenditures. A study of Medicare
beneficiaries using the Medicare Current Beneficiary Survey (MCBS) for 1995 found
that total average prescription drug expenditures for beneficiaries with coverage for
prescription drugs was 60.0 percent higher than for those without drug coverage ($691
vs. $432).327
In a report to the President, two national surveys including MCBS and Medical
Expenditure Panel Survey (MEPS) for 1996 and also the pharmacy audits provided by
IMS Health were analyzed. The report was based on a sample of 21,571 individuals. On
average, among the non-Medicare population, individuals with coverage spent $222.01
annually whereas those without coverage spent $58.94 annually. The Medicare
beneficiaries who always had drug coverage in 1996 spent almost twice ($768.90) as
much on prescription drugs as compared to those who did not have coverage ($463.15) at
any point in time regardless of their health status. The report explained some of the
reasons for these differences in prescription drug expenditures. It is possible that perhaps
the difference in prescription drug spending by those with coverage and those without
cannot be attributed to their need or health status or even the cost of the drugs. The
326 Kreling DH, Mott DA, Wiederholt JB, et al. Prescription drug trends: A chart book. Sonderegger Institute and The Henry Kaiser Family Foundation. July 2000. Available at: http://www.kff.org/content/2000/3019/PharmFinal.pdf. Accessed June 2001.
327 Davis M, Poisal J, Chulis G, et al. Prescription drug coverage, utilization, and spending among Medicare beneficiaries. Health Affairs. January-February 1999;18(1):231-243.

129
beneficiaries with coverage may receive a different mix of drugs or more days’ supply
than those without coverage. Furthermore, individuals with coverage have higher
prescription drug use and expenditures because they anticipate high prescription
expenditures or are sicker and hence more likely to purchase prescription drug coverage
(adverse selection).328
Using the 1997 MEPS data, Curtis et al., evaluated the drug expenditures for
individuals 65 years and older with and without coverage (n=4017). The out-of-pocket
spending for individuals without coverage was 47.8 percent higher than for individuals
with insurance coverage. However, the average expenditures per prescription were 28.0
percent lower for the uninsured. Insurance coverage was significantly and positively
associated with expenditures and the average effect on outpatient expenditures
attributable to insurance coverage was $183 per patient controlling for sociodemographic
characteristics, chronic conditions, and health status. However, the study also noted that
even though the drug expenditures increased with declining health status, insurance
coverage did not exacerbate the increase. The drug expenditures for individuals with
partial year insurance were significantly lower than for individuals without insurance
coverage.329
Andrade et al. evaluated the utilization and prescription drug expenditure patterns
for Medicare beneficiaries enrolled in a prescription drug benefit and compared them by
328 Report to the President: Prescription drug coverage, spending, utilization, and prices. Department of Health and Human Services. April 2000. Available at: http://aspe.hhs.gov/health/reports/drugstudy/index.htm. Accessed August, 2001.
329 Curtis LH, Law AW, Anstrom KJ, et al. The insurance effect on prescription drug expenditures among the elderly: Findings from the 1997 Medical Expenditure Panel Survey. Medical Care. 2004;42(5):439-446.

130
the level of coverage provided by the plan. Data for 14,762 enrollees from July 1993
through December 1995 were analyzed. The Medicare beneficiaries enrolled in a health
maintenance organization (HMO) were given three choices for prescription drug
coverage: full drug coverage, coverage with $1000 maximum benefit, or no drug benefit.
A total of 21.0 percent of beneficiaries enrolled in a plan that provided full coverage
switched to a plan with lower level of coverage ($1000 maximum or no coverage).330
Even prior to making the choice, those who selected the full coverage spent much
more on prescription drugs than the others. During the study period, on average,
beneficiaries with full drug coverage, spent $712.35 per patient whereas beneficiaries
with $1000 maximum and those without coverage spent $396.32 per patient and $107.19
per patient, respectively. A higher percentage of individuals who had full coverage
(24.0%) exceeded or reached $1000 than those with $1000 maximum coverage (9.0%)
and those with no coverage (1.0%). The average drug and medical costs were higher for
those with full coverage as compared with those who had lower level of drug coverage
indicating that perhaps individuals made their choices based on past utilization
patterns.331
Just as access or drug coverage can impact prescription drug use and spending for
the elderly, it can also affect use and spending for prescription drugs in the pediatric
population. Chen et al., using the 1996 MEPS data, evaluated factors that influence
330 Andrade SE, Gurwitz JH. Drug benefit plans under managed care: To what extent do older subscribers selecting less drug coverage put themselves at increased risk? Journal of the American Geriatric Society. 2002;50:178-181.
331 Andrade SE, Gurwitz JH. Drug benefit plans under managed care: To what extent do older subscribers selecting less drug coverage put themselves at increased risk? Journal of the American Geriatric Society. 2002;50:178-181.

131
utilization of prescription drugs in the pediatric population (0-17 years). The study
reported that the uninsured children were especially at a very high risk of being under-
treated. The children with healthcare coverage spent three times as much as the uninsured
children on prescription drugs. Uninsured children, on average, spent $27.68 whereas
those with coverage spent in the range of $78.57 to $96.28 depending on the type of
insurance (Medicaid, other public insurance, private insurance and HMO) but had very
high standard deviations. The study concluded that the major predictors of prescription
drug expenditures include race, family income, and insurance status.332 Without
coverage they were more likely to forgo use of prescription drugs or even visit the
physician.
Mott and Kreling evaluated new prescriptions dispensed (N=6,120) at a pharmacy
from October 1993 through September 1994. Similar to previous studies, this study also
found that for the general population, the largest number of prescriptions was dispensed
to those enrolled with private health insurance (41.2%) whereas those without coverage
used 24.9 percent of the prescription drugs. The uninsured had the lowest mean cost per
dose as compared to those who had private third party, Medicaid, or indemnity insurance.
The mean cost per dose of prescription drugs dispensed was $0.60 for the uninsured and
ranged from $0.68 to $0.83 for the insured depending on type of insurance. The authors
speculate that the patients with coverage could be requesting or are being prescribed
high-cost drugs and hence have higher cost per dose than the uninsured. Individuals with
coverage are more likely to get their prescriptions filled since they do not have to pay full
332 Chen AY, Chang RK. Factors associated with prescription drug expenditures among children: An analysis of the Medical Expenditure Panel survey. Pediatrics. 2002;109(5):728-732.

132
price for the product.333 This price-insensitivity could be a precursor to increased
utilization and finally increased expenditures.
All these studies indicate that coverage does influence prescription drug
expenditures. Access to care also encourages physician visits, which is the first step
toward obtaining a new prescription and could indirectly contribute to rising prescription
drug expenditures.
Access to Care and Physician Visits
Coverage enables access to care and as a result, the patient is more likely to visit
the physician if they have coverage. Improved access to physicians’ increases the number
of occasions during which physician can prescribe a drug.334
In another study of children (N= 2,182) in 1986, Wood et al. reported that
uninsured children were more likely than the privately insured children to not have
visited a physician (OR = 3.4, 95% CI = 1.6-7.4). The children without health coverage
were more likely to lack a regular source of care (OR = 2.9, 95% CI = 2.5-3.5). These
children were also more likely to use an emergency room, community clinic, or a hospital
outpatient department than a private physician office (OR = 2.1, 95% CI = 1.5-2.7).335
To understand use of healthcare and the influence of health insurance on children,
Rosenbach et al. conducted a survey of children enrolled in demonstration programs in
Florida, Maine, and Michigan, which would provide access to healthcare. The children
333 Mott DA, Kreling DH. The association of insurance type with costs of dispensed drugs. Inquiry. Spring 1998;35:23-35.
334 Gianfrancesco FD, Baines AP, Richards D. Utilization effects of prescription drug benefits in an aging population. Health Care Financing Review. Spring 1994;15(3):113-126.
335 Wood DL, Hayward RA, Corey CR, et al. Access to medical care for children and adolescents in the United States. Pediatrics. November 1990;86(5):666-673.

133
who were uninsured or were enrolled in these programs were compared to children
enrolled in private plans and Medicaid. The children were surveyed in two waves in 1993
(N=4,420) and 1994 (N=3,504). It was noted that in all three states children who were
enrolled in the programs or had some coverage had a higher likelihood of seeing a
physician than those who were uninsured indicating that healthcare coverage increased
the likelihood of physician use. In Florida, a higher percentage of children enrolled in a
demonstration program (61.2%), Medicaid (60.9%), private (52.0%), or other coverage
(56.7%) visited the physician than the uninsured (46.1%). Similar results were observed
for children from Maine and Michigan.336
In a causal analysis, Wan and Soifer determined that need and enabling factors had
an impact on physician utilization. Using path analysis, this 1972 survey of 2,168
households determined that individuals with one or more conditions and those who have
a greater tendency to respond to the illness were more likely to visit the physician.
Health coverage had a direct impact on physician visits because coverage provides the
opportunity to visit the physician. The study also reported that respondents reported a
higher frequency of physician visits if the reimbursement from health insurance plan was
high.337 To explain this in today’s terms, with coverage, individuals are more likely to
visit the physician with a low co-payment.
Using the data from the 1989 National Health Interview survey (N=102,684),
Hafner-Eaton examined the effects of healthcare coverage on physician utilization among
336 Rosenbach ML, Irvin C, Coulam RF. Access for low-income children: Is health insurance enough? Pediatrics. June 1999;103(6):1167-1174.
337 Wan TH, Soifer SJ. Determinants of physician utilization: A causal analysis. Journal of Health and Social Behavior. June 1974;15(2):100-108.

134
the chronically and acutely ill. The uninsured were less likely to have visited the
physician even when controlled for health status, number of conditions, functional status,
age, gender, and family income. The “chronically ill” or “well” uninsured were half as
likely to visit the physician as compared to those with insurance coverage (OR = 0.5,
95.0% CI = 0.49-0.53). The “acutely ill” uninsured were two-thirds more likely to visit
the physician than their insured counterparts (OR = 0.62, 95% CI = 0.55 to 0.69).
Insurance status was identified as the third most powerful predictor of physician
utilization. The other robust predictors of utilization included: perceived health status,
acute condition, female gender, and increasing number of conditions.338
In 1993, Burstin et al. surveyed 1,121 patients to evaluate the availability of
healthcare coverage and its effect on utilization. The study reported that individuals who
did not have healthcare coverage were more likely not to have a regular physician
(53.4%) compared to those who had a change in coverage (22.7%) or had no disruption
in coverage (21.0%). Furthermore, these individuals without coverage were more likely
to delay seeking care (32.8%) than those who had some disruption in coverage (29.1%)
or no change in coverage (17.7%).339 These study results reiterate the fact that with
increased coverage or access to care, patients are more likely to visit the physician and
more likely to get the prescription filled.
338 Hafner-Eaton C. Physician utilization disparities between the uninsured and insured: Comparisons of the chronically ill, acutely ill, and well non-elderly populations. Journal of the American Medical Association. February 10, 1993;269(6):787-792.
339 Burstin HR, Swartz K, O'Neil AC, et al. The effect of change of insurance on access to care. Inquiry. Winter 1998/99;35:389-397.

135
Access to Care and Utilization of Prescription Drugs
Several studies have evaluated the influence of drug coverage on the utilization of
prescription drugs. When physician was aware that patient has coverage, they are more
likely to prescribe more number of prescriptions as well as more expensive medications.
Andrade et al. compared the utilization patterns by the level of coverage provided
by the plan for Medicare beneficiaries (N=14,762) enrolled from July 1993 through
December 1995. The Medicare beneficiaries enrolled in an HMO were given three
choices for prescription drug coverage: full drug coverage, coverage with $1000
maximum benefit, or no drug benefit. During the study period, beneficiaries with full
drug coverage, on average filled 27.7 prescriptions whereas beneficiaries with $1000
maximum and those without coverage, on average, filled 19.7 and 8.1 prescriptions,
respectively. The average drug costs per patient were higher for those with full coverage
($0 to $11,495.53) as compared with those with a $1000 maximum ($0 to $3,443.52) or
no coverage ($0 to $2,304.23) indicating that perhaps individuals made their choices
based on past spending and utilization patterns.340
Gianfrancesco et al. examined prescription drug coverage effects on utilization for
a two year time period from 1990 through 1992. The utilization patterns of individuals
recently enrolled in a prescription benefit (N=1,818) were compared to individuals
already enrolled in the benefit (N=1,841). Access had a predominant effect on high-cost
drugs rather than the low-cost drugs since coverage made these expensive drugs more
340 Andrade SE, Gurwitz JH. Drug benefit plans under managed care: To what extent do older subscribers selecting less drug coverage put themselves at increased risk? Journal of the American Geriatric Society. 2002;50:178-181.

136
affordable. Prescription drug coverage for the recently enrolled individuals was reported
to have increased the use of high cost drugs and low cost drugs by 14.0 percent and 9.0
percent, respectively. According to the sensitivity analyses, insurance effect on
expenditures for high cost drugs was 21.0 percent versus 6.0 percent for low cost drugs
for the new entrants. Overall, the results indicate that with drug coverage the
consumption of drugs (number, days supply, and cost) will increase by 18.0 percent over
and above any increase that may have occurred in the absence of drug coverage.341
In an analysis of 6,120 new prescriptions dispensed between October 1993 to
September 1994, Mott and Kreling, reported that having private third party drug coverage
increased the likelihood of individuals filling their prescriptions. The study reported that
individuals with private coverage (OR=1.71, 95% CI = 1.44-2.03) or indemnity insurance
(OR=1.51, 95% CI=1.21-1.88) were more likely to have filled a brand name prescription
compared to the uninsured.342
Among the several factors influencing prescription use among the elderly
(N=1,360), Lassila et al. found access to prescription drugs through health coverage was
significantly associated with utilization of higher number of prescription drugs (p<0.001).
Those with coverage were more likely to fill or renew their prescriptions (OR = 2.6, 95%
CI = 2.1-3.2) compared to those without coverage.343
341 Gianfrancesco FD, Baines AP, Richards D. Utilization effects of prescription drug benefits in an aging population. Health Care Financing Review. Spring 1994;15(3):113-126.
342 Mott DA, Kreling DH. The association of insurance type with costs of dispensed drugs. Inquiry. Spring 1998;35:23-35.
343 Lassila HC, Stoehr GP, Ganguli M, et al. Use of prescription medications in an elderly rural population: The MoVIES project. The Annals of Pharmacotherapy. 1996;30:589-595.

137
Among Medicare beneficiaries, supplemental insurance that provide prescription
drug coverage can influence the utilization of prescription drugs. According to the MCBS
data for 1995 (N=12,000), Medicare beneficiaries with drug coverage used an average of
20.3 prescriptions per year whereas those without coverage used 15.3 prescriptions per
year. The utilization rates for those without drug coverage were 31.0 percent below the
national average and this disparity was greater when compared to the national average for
those with coverage. The Medicare beneficiaries also enrolled in Medicaid, on average,
were prescribed twice (25.6 prescriptions) as many medications than those without any
drug coverage (12.7 prescriptions) indicating that perhaps the sicker of the elderly were
enrolled in Medicaid.344
Similarly, Stuart and Grana in their study hypothesized that among the elderly
(N=3,554), persons with better healthcare coverage were more likely to medicate than
those with less comprehensive coverage. On average, prescription drug coverage
increased the odds of using prescription drugs by 1.6. The study results indicated that
individuals with drug coverage through Medicare supplementation, Pennsylvania
Pharmaceutical Assistance Contract for the elderly also called PACE coverage, or
Medicaid were 14.0-26.0 percent more likely to treat their health problems with a
prescription medication than those with only Medicare (p<0.001). When enrolled in
PACE, private prescription coverage, or Medicaid the proportion of problems treated
with prescription drugs increased by 15.0 percent, 17.0 percent, and 10.0 percent,
respectively above the level that occurred for individuals enrolled in Medicare only
344 Davis M, Poisal J, Chulis G, et al. Prescription drug coverage, utilization, and spending among Medicare beneficiaries. Health Affairs. January-February 1999;18(1):231-243.

138
(p<0.001). The study results indicate that individuals are more likely to treat their
condition with prescription drugs when they have prescription drug coverage.345
The Department of Health and Human Services presented a report to the President
that was based on the analysis of 1996 data from two national surveys – MCBS, and
MEPS and also data from pharmacy audits conducted by IMS health. The report was
based on a sample of 21,571 individuals. Irrespective of age, beneficiaries with coverage
were more likely to get their prescription filled (89.4% vs. 80.3%) and also filled more
average number of prescriptions (23.6 vs. 19.9) than those without coverage. Among the
non-Medicare population, individuals without prescription drug coverage were eight
times more likely not to fill a prescription drug they needed as compared to those with
private drug coverage. The prescription drug utilization and spending also varied by type
of drug coverage. The Medicare beneficiaries enrolled in Medicaid had the highest
utilization and spending for prescription drugs. These results point out the fact that
individuals with coverage and low copay are more likely to have their prescriptions filled
and as a result have higher utilization rates compared to those with no coverage.346
Poisal and Murray conducted two studies to understand patterns of use of
prescription drugs among Medicare beneficiaries from 1996 to 1998 using the MCBS.
The 1996 dataset had information on 37.2 million beneficiaries whereas the 1997 and
1998 datasets had information on 37.6 million and 38.1 million beneficiaries,
respectively. The studies indicated that Medicare enrollees without prescription drug
345 Stuart B, Grana J. Ability to pay and the decision to medicate. Medical Care. 1998;36(2):202-211.346 Report to the President: Prescription drug coverage, spending, utilization, and prices. Department of
Health and Human Services. April 2000. Available at: http://aspe.hhs.gov/health/reports/drugstudy/index.htm. Accessed August, 2001.

139
coverage filled fewer prescriptions and spent less on prescription drugs than those who
had prescription drug coverage. The difference in average prescription use between those
with and without coverage was five prescriptions in both 1996 (21.14 versus 16.01) and
1997 (22 versus 17). In 1998, the beneficiaries without coverage, on average, filled 16.65
prescriptions (reduced by 2.4% from 1997) and those with coverage on average filled
24.35 prescriptions per person (increased by 9.0% since 1997). In the 1998 survey, with
the increase in number of chronic conditions the utilization of prescription drugs per
person also increased. On average, beneficiaries without any chronic conditions and
without coverage, used 5.5 prescription drugs whereas those with coverage used 8.97
prescription drugs. Beneficiaries diagnosed with five or more chronic conditions and
without coverage, used 34.95 drugs whereas those with coverage used 45.79 drugs.347, 348
In another study of the Medicare beneficiaries, Lillard et al., identified the
influence of insurance coverage on prescription drug use. Using the RAND elderly
Health Supplement to the 1990 Panel Study of Income Dynamics (PSID) as data source,
study evaluated prescription use patterns of 910 individuals. Similar to previous studies,
results indicated that individuals with coverage were more likely to use prescription
drugs. With coverage, the probability of prescription drug use increased significantly by
1.4 percent for all elderly. Adding prescription drug benefits for the elderly without
coverage for drugs increases the probability of use of prescription drugs by 2.5 percent. If
the elderly had no prescription drug coverage, adding prescription drug benefits increased
347 Poisal J, Chulis GS. Medicare beneficiaries and drug coverage. Health Affairs. March/April 2000;19(2):248-256.
348 Poisal JA, Murray L. Growing differences between Medicare beneficiaries with and without drug coverage. Health Affairs. March/April 2001;20(2):74-85.

140
the probability of use by 4.0 percent and 2.8 percent for elderly enrolled in only Medicare
coverage or private coverage with no prescription drug coverage, respectively.349
Summary of the Literature
Access to care or insurance coverage can help ease the financial barriers to care.
It does play a key role in getting patients to the physician’s office and patients filling the
prescriptions to help them take care of the illness and/or the symptoms. The uninsured
are more likely to have fewer physician visits than patients with coverage. When the
physicians are aware that patient has health and drug coverage, they were more likely to
write a prescription, especially the more expensive medications.
Individuals with coverage are more likely to fill their prescriptions than those
without coverage. The uninsured may need more care and prescription medications, but
usually are reported to use fewer prescriptions and have lower prescription drug
expenditures than those with drug coverage. However, access to care does not ensure that
those with coverage will actually use healthcare services and products or that all barriers
to receiving care are sufficiently overcome. Added to the insurance effect, demographics
may also play a role in the utilization of healthcare services and products as well as
prescription drug expenditures.
Demographics (Age and Gender): Review of the Literature
Demographics (Age and Gender)and Prescription Drug Expenditures
Several studies have hypothesized that age and gender influence prescription drug
use and expenditures. Women have been acknowledged to use more healthcare services
349 Lillard LA, Rogowski J, Kington R. Insurance coverage for prescription drugs: Effects on use and expenditures in the Medicare population. Medical Care. 1999;37(9):926-936.

141
than men and are receive more prescription drugs than men. It is possible that women
recognize symptoms faster and seek care and this boosts their chances of early diagnosis.
Some even theorize that women develop a keener sense of recognition of signs and
symptoms of disease and are more willing to use treatment to relieve their symptoms. It is
also possible that women have more health problems in general than men and as a result,
visit the physician more often and use more medications or that physicians respond
differently to men and women.350
Furthermore, older individuals utilize more health services and products
(physician visits and prescription drugs). With increasing age, the chances of being
diagnosed with a chronic condition are increased. Since prescription drug treatment is
considered to be the least invasive alternative, the use of prescription drugs among
elderly is relatively high.
Mueller et al. evaluated the effect of age and chronic health problems on
prescription drug expenditures. The study was conducted using the National Medical
Expenditure Survey (NMES) of 1987 administered to a sample of 36,000 individuals.
Prescription drug expenditures for children, the non-elderly and the elderly were 9.1
percent, 56.5 percent and 34.4 percent, respectively. As a percentage of total health
expenditures in their age group, prescription drug expenditures accounted for 9.0 percent
for children, 12.8 percent for non-elderly and 22.9 percent for the elderly. Being
diagnosed with a chronic condition had a significant impact on prescription drug
350 Verbrugge LM. Gender and health: An update on hypothesis and evidence. Journal of Health and Social Behavior. September 1985;26:156-182.

142
expenditures. Non-elderly and elderly with no chronic conditions spent 29.9 percent and
4.4 percent of the prescription drug expenditures, respectively.351
In a study conducted by the Schneider Institute for Health Policy, the recent trends
in prescription drug expenditures for those who had prescription drug coverage in 1997
(N=99,655) and/or 2000 (N=106,517) were evaluated. The average annual prescription
drug expenditures per enrollee for the elderly (18.5%) and the younger adults (15.6%)
increased at a similar rate from 1997 to 2000. The elderly incurred a lower cost per day of
treatment than the younger adults, which could reflect the different types of medications
used by the two groups. The average cost of 30 days of prescription drug therapy
increased from $41.25 in 1997 to $51.63 in 2000 for those under 65 years of age whereas
for the elderly the average cost increased from $34.63 in 1997 to $43.43 in 2000.352, 353
This study also found that some therapeutic categories had higher growth in
expenditure than others and also accounted for a higher proportion of the total
prescription drug expenditures. The growth of cost per enrollee was high for the
following therapeutic categories from 1997 to 2000: Anti-diabetics (40.0% for younger
adults vs. 117.0% for elderly), cholesterol-lowering medications (28.0% for younger
adults vs. 93.0% for elderly), anti-arthritic medications (24.0% for younger adults vs.
128.0% for elderly), and antidepressants (22.0% for younger adults vs. 73.0% for
elderly). The study indicated that utilization (days per enrollee) and cost per daily dose of
351 Mueller C, Schur C, O'Connell J. Prescription drug spending: The impact of age and chronic disease status. American Journal of Public Health. October 1997;87(10):1626-1629.
352 Thomas CP, Ritter G, Wallack SS. Growth in prescription drug spending among insured adults. Health Affairs. September/October 2001;20(5):265-277.
353 Wallack SS, Thomas C, Hodgkin D, et al. Recent trends in prescription drug spending for individuals under 65 and age 65 and older. Schneider Institute for Health Policy. Available at: http://www.rxhealthvalue.com/docs/research_07302001.pdf. Accessed October, 2002.

143
the prescription drug accounted for most of the increase in prescription drug expenditures
for both the elderly and non-elderly. Days per enrollee and cost per daily dose, on an
average, grew by 7.6 percent and 7.4 percent, respectively for those less than 65 years of
age and grew by 9.8 percent and 8.0 percent, respectively for the elderly.354, 355
In a study by Hong and Shepherd, children less than 18 years old (N=3,144)
enrolled in a pharmacy benefit manager from December 29, 1992 through December 28,
1993 were included. Boys ($56.18) had higher prescription drug expenditures per person
per year than girls ($47.41). Average prescription drug expenditures per person-year
decreased with increasing age. Children less than three years old, on average, spent
$76.91 per person per year whereas those 9-11 years of age spent the lowest, $44.97 per
person per year. Teenagers 15-17 years old spent $48.73 per person per year.356
In a report to the President, based on the analysis of data for 21,571 adults from two
national surveys conducted in 1996 – MCBS, and MEPS and also data from pharmacy
audits conducted by IMS health, women were noted to spend more on prescription drugs
compared to men. Among “all” covered beneficiaries and covered “high spenders,”
women spent more on prescription drugs than men (55.0% and 60.0%, respectively).
Among “all” beneficiaries and “high-spenders” without coverage, women again spent
more than men (61.0% and 56.0%, respectively). Both non-elderly beneficiaries with and
without coverage spent more on prescription drugs than elderly with and without
354 Thomas CP, Ritter G, Wallack SS. Growth in prescription drug spending among insured adults. Health Affairs. September/October 2001;20(5):265-277.
355 Wallack SS, Thomas C, Hodgkin D, et al. Recent trends in prescription drug spending for individuals under 65 and age 65 and older. Schneider Institute for Health Policy. Available at: http://www.rxhealthvalue.com/docs/research_07302001.pdf. Accessed October, 2002.
356 Hong S, Shepherd MD. Outpatient prescription drug use by children enrolled in five drug benefit plans. Clinical Therapeutics. 1996;18(3):528-545.

144
coverage, respectively. The non-elderly beneficiaries in different age groups with
coverage, on average, spent $1,077–$1,300 whereas beneficiaries in different age groups
without coverage spent $268-$588. On average, among the elderly, beneficiaries in
different age groups with coverage spent $662-$762 whereas those without coverage
spent $395-$519.357
In a study using data from 1980 National Medical Care Utilization and Expenditure
Survey (NMCUES), the utilization and expenditures for prescription drugs across all age
groups in the ambulatory care setting (N=17,123) were examined. A higher number of
elderly were reported to be the heavy users (eight or more prescription drugs per year)
and they also had a higher level of prescription drug expenditures than any other age
group. The elderly accounted for 13.4 percent of the users and 28.8 percent of the total
prescription drug expenditures. A total of 33.0 percent of the elderly spent $100 or more
on prescription drugs whereas only 6.5 percent of those younger than 65 years spent the
same amount.
On average, the elderly also used more prescriptions (15.03 prescriptions per
user) and spent more ($120.43 per user) on prescription drugs than younger adults.
Compared to the 25-64 year olds, the elderly used twice as many prescription drugs and
incurred more than twice the expenditure on prescription drugs. The likelihood of being a
non-user decreased with increasing age. More men (44.0%) were non-users of
prescription drugs than women (31.3%). More women than men were moderate (24.2%
357 Report to the President: Prescription drug coverage, spending, utilization, and prices. Department of Health and Human Services. April 2000. Available at: http://aspe.hhs.gov/health/reports/drugstudy/index.htm. Accessed August, 2001.

145
vs. 17.9%) or heavy users (21.4% vs. 12.8%) whereas more men were light users (24.9%
vs. 23.1%) of prescription drugs. Women, on average spent more on prescription drugs
than men (($60.42 vs. $49.82) and women also used more prescription drugs than men (8
vs. 6.44). Perceived health status and age were found to be the strongest predictors of
prescription drug expenditures and use.358, 359
The study by Momin et al. evaluated prescription utilization and expenditures
using data from a Rhode-Island-based PBM for 1996 for 64,815 enrollees for six
therapeutic categories including: calcium channel blockers, angiotensin converting
enzyme (ACE) inhibitors, lipotropics, antidepressants, H2-blockers, and beta blockers.
Except for beta-blockers and antidepressants, the elderly had the highest average drug
costs and spent more than the younger adults in all therapeutic categories. Demographic
variables including age, gender, location, and place of employment explained 3.9 percent
of the variance in the cost of the drugs. The remainder of the variance was explained by
the health plan characteristics namely number of days eligible, number of members,
average wholesale price (AWP), out-of-pocket expense, days supply, and quantity
dispensed. Except for lipotropics and antidepressants, males were positively associated
with the cost of pharmaceuticals indicating that men, on average, spent more on
prescription drugs than women except for lipotropics and antidepressants.360 This
358 Eng HJ, Lee ES. The role of prescription drugs in health care for the elderly. Journal of Health and Human Resources Administration. Winter 1987;9(3):306-318.
359 Eng HJ, Lairson DR. Prescribed medicines: Expenditures and usage patterns for selected demographic characteristics. Journal of Pharmaceutical Marketing and Management. 1988;3(2):19-36.
360 Momin SR, Larrat EP, Lipson DP, et al. Demographics and cost of pharmaceuticals in a private third-party prescription program. Journal of Managed Care Pharmacy. 2000;6(5):395-409.

146
contradicts most studies because previous studies reported that women use and spend
more on prescription drugs than men.
Steinberg et al. conducted a study to evaluate prescription drug use and expenditure
by the elderly using data from a PBM (Merck Medco Managed Care LLC) for persons
enrolled in 1997 and 1998 (N=375,480). The average annual prescription drug
expenditures increased with age. The elderly who were 65-69 years, 70-74 years, 75-85
years and 85 and older, on average, spent $1,242, $1,337, $1,415, and $1,436,
respectively. On average, women ($1,383) spent more than men ($1,292) on prescription
drugs.361 Similar to previous studies, in a 1983 survey of 3,860 individuals, Leibowitz et
al. reported that women incurred higher average prescription drug expenditures than men
($105.43 vs. $52.91).362
The influence of demographics on prescription drug expenditures could be the
result of the influence of demographics on utilization of prescription drugs. Then we can
hypothesize that demographics do influence physician visits since a physician visit is a
necessary intervention for a patient to receive a new prescription.
Demographics (Age and Gender) and Physician Visits
According to the National Center for Health Care Statistics (NCHS) and NAMCS,
women are more likely to use medical services. In 1998, of all the visits in all age groups,
women were responsible for 60.3 percent of the physician visits. Except for those in the
less than 15 years age group, women in all age groups had a higher number of physician
361 Steinberg EP, Gutierrez B, Momani A, et al. Beyond survey data: A claims-based analysis of drug use and spending by the elderly. Health Affairs. March/April 2000;19(2):198-211.
362 Leibowitz A, Manning WG, Newhouse JP. The demand for prescription drugs as a function of cost-sharing. Social Science and Medicine. 1985;21(10):1063-1069.

147
visits than men. In 1998, the average rate of physician visit was 3.1 visits per person per
year. Those in the 25-64 year age group had the highest number of physician visits.
However, those of ages 75 years and above had the highest rate of physician visits per
year – 6.6 visits per person per year.363 Similarly, in 1999 it was reported that women 15
years and older were more likely to visit the physician than men. Overall, women had
more number of physician visits than men (58.9% of all visits). Similar to previous years,
individuals over 75 years had the highest rate for physician visits (6.7 visits per person
per year). Trend data for 1985 to 1999 showed that physician visit rate for those of 65
years and older increased by 22.0 percent, but declined by 19.0 percent for those of ages
15-24 years.364
Several studies have used age and gender to describe differences in morbidity and
mortality and to explain healthcare utilization. To test this theory, in a study published in
1996, Murphy and Hepworth investigated the health services utilization patterns by age
and gender for 795 elderly, 66 years and older. Increasing age was associated with a
decreasing number of visits to the HMO primary care providers, but positively associated
with use of other healthcare services (inpatient HMO MD hospital visits, home healthcare
363 Woodwell DA. National Ambulatory Medical Care Survey: 1998 Summary. Advance from vital and health statistics, No. 315, Hyattsville, MD: National Center for Health Care Statistics, 2000. Available at: www.cdc.gov/nchs/products/pubs/pubd/ad/311-320/311-320.htm#ad315. Accessed November, 2001.
364 Cherry DK, Burt CW, Woodwell DA. National Ambulatory Medical Care Survey: 1999 Summary. National Center for Health Care Statistics/Centers for Disease Control and Prevention: Advance data report No. 322. July 17, 2001. Available at: http://www.cdc.gov/nchs/data/ad/ad322.pdf. Accessed December, 2002.

148
visits, emergency care visits, hospitalizations). In this study, gender did not play a role in
the utilization of healthcare services, specifically physician visits.365
In a study published in 2000, Ganther et al. attempted to identify factors that predict
patient (N=1,933) preferences to seeking medical care using the Medical Care
Preferences Scale. Gender and age were among the several variables significantly related
to patient preferences. The results indicated that women are more likely to seek medical
care than men. This could be explained by a number of factors including increased
morbidity among women and being comfortable in seeking medical help. This could
probably indicate that women are more likely to be care seekers than self-treaters. It was
observed that with age the patient preferences to seek medical help increased i.e., the
elderly are more likely to be care-seekers than self-treaters. Since health tends to
deteriorate with age, medical help seeking behavior increases with age. Care-seekers, on
average, had 0.5 times more physician visits in the past month and 1.62 more physician
visits the past six months than self-treaters. Care-seekers in all categories of health status
had higher utilization rates (physician visit and prescription drugs) than self-treaters.366
In a 1972 causal analysis, Wan and Soifer surveyed 2,168 households and found
that predisposing factors such as age and gender influence physician utilization. The
percentage of individuals over 65 years in each household had a direct effect on physician
visits and also an indirect causal effect through poor health. The proportion of women in
365 Murphy JF, Hepworth JT. Age and gender differences in health services utilization. Research in Nursing and Health. August 1996;19(4):323-329.
366 Ganther JM, Wiederholt JB, Kreling DH. Measuring patients' medical care preferences: Care seeking versus self-treating. Medical Decision Making. 2000;21:47-54.

149
each household was causally associated with number of physician visits. The more the
number of women in the household greater were the number of physician visits.367
There is much speculation that the increased number of physician visits is due
difference in morbidity or due to the difference in the gender roles. Mutran and Ferraro
used Andersen’s model to understand healthcare utilization in terms of physician visits
and hospitalization. They used the sub-sample of Current Population Survey data
(N=3,150) from the 1973 Survey of the Low-Income Aged and Disabled. Gender (male)
had a weak negative relationship with physician visit indicating men had fewer visits than
women in the past year. On average, men had 3.77 visits and women had 3.85 physician
visits in the past five months. Some of the reasons reported by the study were that gender
could directly influence illness measures with men reporting fewer illnesses than women
or that self-assessment of health condition had a stronger impact on men than women in
prompting them to see the physician. Age had a weak correlation with physician visits
during the year prior to the study. The elderly with serious illness, poor assessments of
health or in poor health, and high levels of disability were more likely to have higher
number of physician visits.368
Krause in an attempt to understand physician utilization examined the impact of
stress, gender, and cognitive impairment. A total of 1,103 individuals were interviewed
from October 1992 to February 1993. The physician visits were measured as number of
visits during the three months prior to the study. The elderly or the older adults were
367 Wan TH, Soifer SJ. Determinants of physician utilization: A causal analysis. Journal of Health and Social Behavior. June 1974;15(2):100-108.
368 Mutran E, Ferraro KF. Medical need and use of services among older men and women. Journal of Gerontology. 1988;43(5):S162-S171.

150
more likely to have more number of health problems and hence more likely to have
higher number of physician visits than younger adults or individuals with less number of
health problems (p<0.05). The elderly with mild or moderate cognitive impairments were
more likely to visit the physician than those with no impairments (p<0.05). The older
men had higher number of physician visits than elderly women (p<0.05). For each
negative life event (stressor), older men had two additional physician visits (p<0.001),
but the stressor did not have an impact on number of physician visits for older women.369
Hibbard and Pope explain that women are probably more likely to adopt the sick
role and pay attention to symptoms and hence take curative actions. A total 1,648 adults
were interviewed in 1970-71 as a part of a survey and the medical records for these
individuals were obtained for seven years from an HMO, including three years prior to
the survey. The study found that there was a significant difference in physician visits for
men and women for “chronic conditions” (with treatable and untreatable symptoms),
“acute conditions” (both microorganism and nonmicroorganisim), “symptoms’ and
“trauma”. Except in “trauma,” women had higher number of physician visits than men.
The physician visits for three categories of conditions with the greatest gender difference
and accounting for 64.0 percent of the physician visits were combined: “chronic
condition with treatable symptoms,” “acute condition” (both microorganism and
nonmicroorganisim), “sick role and symptom reports.” Illness orientation (symptom
reports, readiness to adopt sick role) and socioeconomic status explained 6.0 percent of
the variance in physician visits for men. Interest in and concern for health, symptom
369 Krause N. Stress, gender, cognitive impairment, and outpatient physician use in later life. Journals of Gerontology. Series B, Psychological Sciences and Social Sciences. January 1996;51(1):P15-P23.

151
reports, employment status, and readiness to adopt sick role accounted for 8.0 percent of
the variance in physician visits for women. Overall, symptom reports, interest in health,
and gender in all accounted for 8.0 percent of the variation in physician visit rates and
gender specifically accounted for 2.0 percent of the variation. Women were more
interested in and concerned about health-related matters and as a result, were more likely
to see a physician.370
A survey of 912 adults by Cleary et al. published in 1982, reported that women
(including pregnant women) had 1.27 more visits than men prior to interview and 1.34
more number of visits than men after the interview. On excluding women who gave birth,
women had only 0.94 more visits than men before interview and 1.08 visits after the
interview. Women were reported to use more physician services because of reported
health and not due to differences in help-seeking tendencies. The study also reported that
women were more likely to believe in preventive care and reported a tendency to consult
physician for physical and mental problems and this was linked to a high number of
physician visits. 371
Green and Pope explored the effects of gender, health status, mental and physical
symptom levels, health knowledge, illness behaviors and health concerns and long term
use of healthcare services (physician visit, hospital, emergency room visits and telephone
calls) using the data from a household survey conducted in 1970-71 and linked to 22
years of health services utilization records (1970-1991; 1401-female, 1202-male).
370 Hibbard JH, Pope CR. Another look at sex differences in the use of medical care: Illness orientation and types of morbidities for which services are used. Women Health. 1986;11:21-36.
371 Cleary PD, Mechanic D, Greenley JR. Sex differences in medical care utilization: An empirical investigation. Journal of Health and Social Behavior. June 1982;23(2):106-119.

152
Women reported more symptoms and more interest in health than men. However, the
self-reported global status for women did not differ from men and women also did not
report being more concerned about their health than men. Age and gender accounted for
3.0 percent and 10.0 percent of the variance in utilization of healthcare services with age
becoming increasingly predictive over time. Removing gender-specific utilization from
the analyses did not change the relationship with utilization significantly, but it did
reduce the predictive ability of gender.372
Bertakis et al., in a study published in 2000, evaluated gender differences in
utilization of healthcare services among 509 new adult patients randomly assigned to
primary care physicians at a university medical center. Medical center resources
including number of primary care physician visits, specialty clinic visit, emergency
department visits, hospitalizations, and laboratory and diagnostic and radiological tests
(diagnostic services) used by these individuals were evaluated for one year. Women had
significantly higher mean number of primary care clinic visits (p=0.0004) and diagnostic
services ordered than men (p=0.0005). However, women reported lower baseline
physical and mental health status than men indicating that the difference in the use of the
two healthcare services were probably due to the health status differences.373 The
physician visits increase the odds of patients being prescribed a drug, and physician visits
were influenced by demographics, we can say that demographics also influence
utilization of prescription drugs.
372 Green CA, Pope CR. Gender, psychological factors and the use of medical services: A longitudinal analysis. Social Science and Medicine. 1999;48:1363-1372.
373 Bertakis KD, Azari R, Helms LJ, et al. Gender differences in the utilization of health care services. Journal of Family Practice. February 2000;49(2):147-152.

153
Demographics (Age and Gender) and Utilization of Prescription Drugs
With age, morbidity increases and hence increasing the need for prescription
medications and other healthcare services. Women have repeatedly shown higher levels
of utilization of prescription medications. As seen in studies discussed earlier, age seems
to have a more consistent impact on prescription drug expenditures than gender, which
may also extend to utilization of drugs.
On analyzing prescription drug use data for from December 1992 to December
1993 for 3,144 children (18 years and younger), Hong and Shepherd reported that boys
used more number of prescription drugs (52.7%) than girls (45.4%). On average, boys
used 3.3 prescriptions per person per year whereas girls used 3.0 prescriptions per person
per year. The number of children receiving prescription drugs and the average
prescription drug use decreased with increasing age. Children less than three years old,
on average, used 5.9 prescription drugs per child-year whereas those of ages 12-17 years
used 2.5 prescription drugs per person-year. Children 3-5 years, 6-8 years, and 9-11
years, on average used 3.7, 3.3, and 2.7 prescriptions per person per year, respectively.374
According to the Kaiser report based on 1997 NAMCS data, women from the age
of 15 years consistently used more number of prescription drugs than men. Until the age
of 14 years, the gap in utilization rates for boys and girls was narrow. Among children
less than five years of age, on average, boys and girls used 4.3 and 4.0 prescription drugs
per year, respectively. The gap in the average number of prescriptions drugs reduced
374 Hong S, Shepherd MD. Outpatient prescription drug use by children enrolled in five drug benefit plans. Clinical Therapeutics. 1996;18(3):528-545.

154
considerably for ages 5-14 years for both boys (1.5) and girls (1.4). For boys and girls
over 15 years of age, utilization increased with age and the gap in average utilization of
prescription drugs for boys and girls widened. Men of ages 25-34 years, used an average
of 1.4 prescription drugs per year and women used 3.2 prescription drugs per year. Men
45-54 years of age used an average of 3.0 prescription drugs whereas women used 5.6
prescription drugs. Among individuals 75 years and older, each year, men and women
used an average of 11 and 11.7 prescription drugs, respectively.375
It is speculated that women use more prescription drugs than men due to
psychosocial reasons, ease in adopting sick role, or attitudes toward illness and medical
care or anxiety. However, Svarstad et al. hypothesized that it is not the attitudes, but
rather gender-specific illnesses that contribute to the differences in prescription drug use
between men and women. On evaluation of data for 862 adults for a two year period, the
study (published in 1987) found that women used more number of drugs than men in all
age groups. The difference in prescription drug use between men and women was the
greatest during the child-bearing years (18-29 years: 1.48 vs. 6.81, 30-44 years: 2.30 vs.
7.00). Among adults 45 years and older, the differences in prescription drug use between
men and women narrowed. On average, men 45-59 years and 60 years and above filled
6.2 and 10.7 prescriptions, respectively whereas women filled 7.32 and 12.96
prescriptions, respectively. Overall, on average, women filled 8.64 prescriptions and men
filled 4.54 prescriptions. Further analysis revealed that the difference in prescription
375 Kreling DH, Mott DA, Wiederholt JB, et al. Prescription drug trends: A chart book. Sonderegger Institute and The Henry Kaiser Family Foundation. July 2000. Available at: http://www.kff.org/content/2000/3019/PharmFinal.pdf. Accessed June 2001.

155
drugs use was largely due to drugs used by women for gender or women-specific
conditions or related to the reproductive role of women. On excluding women with
female-specific conditions and drugs used to treat them, the difference in utilization of
prescription drugs between men and women was almost eliminated.376
Influence of gender and age was evaluated with prescription drug use data from
1978-79 and 1987-88 for 924 individuals. The average number of prescription drugs used
increased from 2.9 in 1978-79 to 4.08 in 1987-88, indicating that the use of prescription
drugs increased with age. In 1978-79, on average, men and women used 2.36 and 3.18
prescription drugs, respectively. In 1987-88, men on average used 3.59 prescription
drugs and women used 4.33 prescription drugs. There was a significant difference in the
number of prescription drugs used by men and women in both time periods. Fewer
women reported not using prescription drugs in both time periods and this decreased at a
higher rate with time for women (9.8% decreased to 4.7%) compared to men (16.6%
decreased to 6.1%).377
The study by Kotzan et al. evaluated the effects of age, race, and sex on utilization
of prescription drugs dispensed during December 1985 to Medicaid recipients
(N=17,128) of Georgia. Gender was found to influence use of prescription drugs through
interactions with age and race. Similar to previous studies, on average, women (3.4
prescriptions) were dispensed greater number of prescriptions than men (3.1
prescriptions). When classified by age and gender, those who were classified as old (>65
376 Svarstad BL, Cleary PD, Mechanic D, et al. Gender differences in the acquisition of prescribed drugs an epidemiological study. Medical Care. 1987;25:1089-1098.
377 Stewart RB, Moore MT, May FE, et al. A longitudinal evaluation of drug use in an ambulatory elderly population. Journal of Clinical Epidemiology. 1991;44(12):1353-1359.

156
years) used more prescription drugs than all the others. Women 65 years and older used
only slightly more number of prescription drugs (4.1+ 2.8) than men (3.9 + 2.8) in the
same age group. This was the greatest difference in prescription drugs among all age
groups. Both men and women, 65 years and older, on average were dispensed the more
number of prescription drugs than other individuals in other age groups. There was a
significant relationship between age and mean number of prescription drugs dispensed
(p=0.0001). Age was reported to have a more influential role in the number of
prescriptions dispensed than gender.378
In a telephone survey of ambulatory adult population (N=2,590) conducted from
February 1998 through December 1999, Kauffman et al. evaluated prescription drug
utilization patterns. Among the 18-44 year olds, 29.0 percent of the men used at least one
prescription and less than 1.0 percent used five or more prescription drugs. In the same
age group, 46.0 percent of the women used at least one prescription drug and 3.0 percent
of the women were using five or more drugs. A total of 47.0 percent of men and 66.0
percent of the women 45-64 years old used at least one prescription drug. Also, 6.0
percent of the men and 12.0 percent of the women in the same age category used five or
more prescription drugs. Among the elderly 65 years and older, 71.0 percent of the men
and 81.0 percent of the women used at least one drug and 19.0 percent of the men and 7.0
percent of the women used five or more drugs. The results indicate that prescription
drugs were used more often by women than men and by older adults than younger adults.
378 Kotzan L, Carroll NV, Kotzan JA. Influence of age, sex, and race on prescription drug use among Georgia Medicaid recipients. American Journal of Hospital Pharmacy. February 1989;46:287-290.

157
The study results indicated that the rate of utilization increased with age and women used
greater number of prescription medications than men in every age group.379
In 1994, Jörgenson et al. evaluated utilization patterns of prescription drugs and
other healthcare services in Sweden among the elderly 65 years and older (N=4,642) and
the differences in the utilization patterns between men and women. The study reported
that being diagnosed with three or more conditions greatly increased the likelihood of a
drug being prescribed. A higher percentage of men (24.7%) than women (20.2%) did not
use any prescription drugs. The utilization difference between men (71.2%) and women
(80.4%) were highest among older adults (65-74 years). Contrary to other studies, the
utilization of prescription drugs decreased with age. A total of 82.8 percent and 72.3
percent of men 75-84 years and 85 years and older, respectively were prescribed drugs.
Similarly, the percentage of women prescribed drugs decreased with age among those 75-
84 years of age (84.3%) and 85 years and older (67.2%). A total of 42.8 percent of men
and 34.4 percent of the women were using five or more prescriptions in a year.
Furthermore, women used greater number of prescriptions per person than men (4.3 vs.
3.8). According to logistic regression, age played a prominent role in multiple drugs use.
The elderly 75-84 years (OR=2.52; 95% CI =1.44-4.40) and 85 years and older
(OR=2.92; 95% CI=1.44-5.95) were more likely to use five or more prescription drugs.380
According the study (published in 1996) based on Monogahela Valley Independent
Elders Survey (MoVIES) of the rural community sample of the elderly 65 years and older
379 Kauffman DW, Kelly JP, Rosenberg L, et al. Recent patterns of medication use in the ambulatory adult population of the United States: The Slone survey. Journal of the American Medical Association. January 16, 2002;287(3):337-344.
380 Jörgenson T, Johnasson S, Kennerfalk A, et al. Prescription drug use, diagnoses, and healthcare utilization among the elderly. The Annals of Pharmacotherapy. September 2001;35:1004-1009.

158
(N=1,360), the utilization of a higher number of prescription drugs was significantly
associated with older age and gender. A total of 54.7 percent of women and 45.3 percent
of the men were prescribed drugs. Among those who received at least one prescription,
14.9 percent of individuals 65-74 years, 17.3 percent of individuals 75-84 years and 24.1
percent individuals 85 years and older reported using five or more prescriptions. The
proportion of individuals taking any medication increased with age and among
individuals 65 years and older, the odds of being prescribed a drug increased with age for
the elderly 75-84 years (OR=1.4; 95% CI=1.1-1.7) and 85 years and older (OR=2.6; 95%
CI=1.6-4.2). However, the association between gender and utilization was not
significant.381
To evaluate the medication use characteristics among the elderly 65 years and
older (N=3,467) in rural Iowa, Helling et al. interviewed them from December 1981
through October 1982. More men (15.5%) than women (9.6%) did not use any
prescription drugs. The percentage of men and women using prescription medications
increased linearly with age. Men (61.9%) and women (68.4%) 65-69 years of age
reported the lowest percentage of users. In every age category, women were using more
medications than men. The percentage of men using drugs increased linearly from 73.4
percent among those 80-84 year of age to 74.7 percent among those 85 years and older.
Similarly, the percentage of women using drugs increased to 82.1 percent among those
80-84 years of age and then dropped to 79.6 percent among elderly 85 years and older.
On average, women filled 1.77 prescriptions and men filled 1.68 prescriptions. Even
381 Lassila HC, Stoehr GP, Ganguli M, et al. Use of prescription medications in an elderly rural population: The MoVIES project. The Annals of Pharmacotherapy. 1996;30:589-595.

159
though the difference in the average number of prescriptions filled by both men and
women is small, results indicated difference in utilization was not because of the number
of prescriptions, but rather due to more women using prescriptions drugs than men.
Overall, the percentage of elderly using prescription drugs increased with age from 65.6
percent for 65-69 year olds to 79.1 percent for those 80-84 years of age, but dropped to
78.0 percent for those 85 years and older.382
According to a study (published in 1990) by Zadoroznkyj and Svarstad surveying
762 adults, women (73.0%) were more likely to use prescription drugs than men (54.0%).
The study found that health problems, women-specific conditions, increasing age, and
gender (female) increase the chances of using prescription drugs. Even though the
difference in the use of prescription drugs was reduced on adjusting for use of female-
specific drugs (excluding use of oral contraceptives, estrogens, prenatal vitamins and
iron, and antifungal agents), more women (65.0%) than men (53.0%) were using at least
one drug. The effects of gender were reduced when controlled for female-specific
conditions and drugs and the correlation between gender and prescription drug use
reduced from 0.23 to 0.15 (p<0.0.001). However, adjusting for female-specific conditions
the correlation between age and use of prescription drugs increased from 0.13 to 0.19
(p<0.001). Adjusting for female-specific conditions and drugs, probability of use of
prescription drugs dropped to a statistically insignificant level. Furthermore, this
adjustment also reduced the gender difference in the extent of use of prescription drugs to
55.0 percent, a statistically insignificant level. Hence, the gender difference in
382 Helling DK, Lemke JH, Semla TP, et al. Medication use characteristics in the elderly: The Iowa 65+ rural health study. Journal of the American Geriatrics Society. 1987;35:4-12.

160
prescription drug use could be explained to a certain extent by female-specific conditions
and use of female-specific drugs.383
Aiken et al. analyzed two models to determine predictors of utilization of
prescription drugs using data for elderly 65 years and older (N=1,872) from NMCUES
for 1980. The dependant variable in one model was initial prescription drug use and
refilled prescription drug use in the second model. Perceived morbidity and cost-sharing
were strong predictors of prescription drug use in both models. Gender and race were
found to have both direct and indirect effects on initial and refilled prescription drug use.
Age had an indirect effect on both initial and refilled prescription drug use. Caucasians
and women were reported to have higher utilization levels of prescription drugs.384
According to a study by Metge et al. on Manitobians (N=1.14 million) using data
for 1996, after 15 years of age, more women than men were consistently using at least
one prescription drug. Overall, women used 9.7 prescriptions whereas men used 7.9
prescriptions per year. Overall, 73.0 percent of women and 59.4 percent of men were
dispensed at least one prescription drug. Use of prescription drugs also increased with
age. A total of 563 drugs were dispensed among 1000 residents 5-9 years of age; 812
prescriptions per 1,000 residents in the 65-69 age group; and 857 in 1,000 residents in the
80-84 age group. The study reported that the gender difference in use of prescription
drugs was due to the use of female-specific drugs such as oral contraceptives.385
383 Zodoroznyj M, Svarstad BL. Gender, employment and medication use. Social Science and Medicine. 1990;31(9):971-978.
384 Aiken MM, Smith MC, Juergens JP, et al. Individualized determinants of prescription drug use among noninstitutionalized elderly. Journal of Pharmacoepidemiology. 1994;3(1):3-25.
385 Metge C, Black C, Peterson S, et al. The population use of pharmaceuticals. Medical Care. 1999;37(Supplement 6):JS42-JS59.

161
According to the study based on data from the National Medical Care Expenditure
Survey (NMCES) of 1977 (N=212,098), until age of six years, a higher percentage of
boys (67.0%) were reported to use prescription drugs than girls (63.8%) and among those
older than six years of age, more girls/women were reported to use prescription drugs. A
total of 45.4 percent of the girls 6-18 years of age used at least one drug which increased
to 69.1 percent among those 25-54 years of age and 78.2 percent among those 65 years
and older. A total of 43.8 percent of the boys 6-18 years of age used prescription drugs
which increased to 48.3 percent among those who were 35-54 years of age and 70.8
percent of those 65 years and older.386
Analysis of the 1985 NAMCS data (N=71,594), did not report any relationship
between gender and prescription drug volume. Overall, a higher percentage of women
(54.2%) than men (51.5%) were prescribed at least one drug. Multivariate analysis
revealed that when controlling for age, gender no longer played a role in predicting
prescription volume.387
Thomas et al. examined the utilization and spending on prescription drugs for 1997
to 2000 among the elderly, 65 years and older (N=72,115), enrolled with AdvancePCS
(PBM). The number of prescriptions filled per person for the elderly and non-elderly
grew by 7.1 percent and 4.7 percent, respectively. Among individuals who filled at least
one prescription, the increase in use of prescription drugs was 4.3 percent for the non-
elderly and 6.0 percent for the elderly. On average, the elderly used greater number of
386 Kasper JA, Wilson R. Use of prescribed medicines: A proxy indicator of access and health status. International Journal of Health Services. 1983;13(3):433-442.
387 Ferguson JA. Prescribing practices and patient sex differences. Journal of the Royal Society of Health. April 1990;110(2):45-49, 53.

162
prescription drugs than the younger adults. Among individuals with at least one claim,
the elderly used 25.6 and 30.5 prescription drugs in 1997 and 2000, respectively (among
all 20.7 in 1997 and 25.5 in 2000). The younger adults used 9.65 and 10.94 prescription
drugs in 1997 and 2000, respectively (among all 6.2 in 1997 and 7.1 in 2000). Even at the
baseline in 1997, the utilization rate was three times higher for the elderly than for the
younger population. This could be because even if the costs of the medications are low,
the elderly used more medications for a longer period of time.388
Fillenbaum et al. examined prescription drug use among the elderly 65 years and
older (N=4,162) for two time periods: 1986-87 and 1989-90. Age (OR = 1.03, 95%
CI=1.01-1.05) along with race (African American OR=0.7, 95% CI=0.55-0.89) was
found to consistently predict prescription drug use. The results indicate that older adults
were more likely to use prescription drugs and the number of prescription drugs used
increased with age. However, they also indicate that although age was a predictor of
prescription drug use, it was not as important as race or health status.389
A 1995 Swedish population-based study of women (N=2,991) reported that the
elderly women were more likely to use prescription drugs. Women of ages 45-54 years
(OR=2.36; 95% CI=1.93-2.89) and 55 years and older (OR=3.52; 95.0% CI=2.81-4.41)
were more likely to use prescription drugs than the younger adults (34-44 years).390
388 Thomas CP, Ritter G, Wallack SS. Growth in prescription drug spending among insured adults. Health Affairs. September/October 2001;20(5):265-277.
389 Fillenbaum GG, Horner RD, Hanlon JT, et al. Factors predicting change in prescription and nonprescription drug use in a community-residing black and white elderly population. Journal of Clinical Epidemiology. 1996;49(5):587-593.
390 Bardel A, Wallander M, Svärdsudd K. Reported use of prescription drugs and some of its determinants among 35 to 65-year-old women in mid-Sweden: A population-based study. Journal of Clinical Epidemiology. 2000;53:637-643.

163
Summary of the Literature
These studies reiterate the fact that with age, the health of individuals begins to
deteriorate and the need to see the physician is increased. Usually beyond 15-18 years of
age, utilization rates drop for the next few years, but then rise again with age. The
number of diseases, especially chronic conditions encountered, increases with age. These
chronic conditions are usually treatable with prescription drugs, which results in an
increased need for prescription drugs. As a result, with age, the number of physician
visits and the need for prescription drugs increase leading to increased utilization and
expenditures for prescription drugs. However, the role of age in prescription drug use is
not consistent.
Women have been reported to be more proactive and readily visit the physician.
This may account for the higher number of physician visits and increased use of
prescription drugs among women. Some studies have pointed out that women use more
prescription drugs for women-specific conditions and thereby accounting for higher
utilization of prescriptions by women compared to men. However, in some instances,
studies have indicated that this may not be the case and that men use greater number of
drugs. Studies also report that adjusting for gender-specific conditions and drugs, gender
then no longer plays a significant role in utilization and even report that there is a
relationship between utilization and age and not gender. As a result, the role of gender in
prescription drug use is inconclusive.

164
Utilization of Prescription Drugs: Review of the Literature
The utilization rate of prescription drugs has been constantly cited as the main
reason for increased prescription drug expenditures. However, for the current study, the
utilization of prescriptions drugs is a part of the calculation of the drug expenditures and
hence the relationship will not be evaluated.
Utilization of Prescription Drugs and Physician Visits
A physician visit increases the likelihood that a medication will be prescribed
because physician visit provides the opportunity for a physician to write a prescription
thereby increasing the odds of receiving a prescription. Logic would suggest that with
increased number of physician visits, the number of new prescription drugs prescribed
would also increase. However, according to the trend data from NAMCS of 1980 and
1992, the utilization rates have not changed much since 1980. In 1980, during 63.1
percent of physician visits at least one drug was prescribed, which increased to 63.8
percent in 1992.391 However, since utilization rates have been increasing (Figures 1.8
and 1.9), it could mean that the number prescriptions were written during each visit has
increased.
In a study that evaluated data for 3,481 adults and children collected as a part of
the World Health Organization’s International Collaborative Study of Medical Care
Utilization to determine relationship between physician visits and prescription drug use.
391 Nelson C, Knapp D. Medication therapy in ambulatory medical care: National Ambulatory Medical Care Survey and National Hospital Ambulatory Care Survey, 1992. Advance Data from Vital Health Statistics, No. 290, Hyattsville, MD. National Center for Health care Statistics. Available at: www.cdc.gov/nchs/data/ad/ad290.pdf. Accessed November, 2002.

165
In a model predicting prescription and non-prescription drug use, physician visit was
found to be a significant predictor specifically for prescription drug use (p<0.05).392
Fillenbaum et al. in their study evaluated the longitudinal prescription drug use
data for 4,162 elderly, 65 years and older, for two time periods: 1986-87 and 1989-90.
They reported that a higher number of physician visits increased the likelihood that the
drug will be prescribed (OR = 1.09; 95% CI = 1.04-1.13). Based on the results, the study
reported that individuals who were sicker or had poor health status were more likely to
visit the physician who, in turn, was more likely to prescribe medications for them.393
Aiken et al. in their study using data from 1980 NMCUES for the elderly 65 years
and older (N=1,872) examined the predictors of new and refilled prescription drug use. In
a model predicting initial prescription drug use, it was expected that physician contact or
physician visit would have a direct and significant effect on initial prescription drug use
since it is the conventional method or the necessary intervention to acquire a new
prescription. As expected, physician contact did have an impact on the initial
prescription drugs use along with perceived morbidity. Increased perceived morbidity
would motivate patients to see the physician and this could result in physician writing a
prescription. However, physician contact did not influence the use of refilled prescription
drugs.394
392 Bush PJ, Osterweis M. Pathways to medicine use. Journal of Health and Social Behavior. June 1978;19(2):179-189.
393 Fillenbaum GG, Horner RD, Hanlon JT, et al. Factors predicting change in prescription and nonprescription drug use in a community-residing black and white elderly population. Journal of Clinical Epidemiology. 1996;49(5):587-593.
394 Aiken MM, Smith MC, Juergens JP, et al. Individualized determinants of prescription drug use among noninstitutionalized elderly. Journal of Pharmacoepidemiology. 1994;3(1):3-25.

166
In 1994, Jörgenson et al. evaluated the factors that could influence the use of
prescription drug among non-institutionalized elderly 65 years and older (N=4,642). The
study reported that multiple drug use (> 5 prescription drugs in a year) was influenced
mainly by primary care visits. The more the number of visits, the more likely the
individual would use five or more prescription drugs in a year. With a single visit the
odds of an individual being prescribed five or more increased almost four times
(OR=3.95; 95% CI=1.61-9.72). Visiting a primary care physician five times or more
further increased the likelihood of use of five or more prescription drugs (OR=15.41;
95% CI=5.74-41.34) compared to not being seen by the physician at all.395
However, contrary to logic and the previous studies reported, Sharpe and Smith
found that physician visits did not predict prescription drug use even though it is known
that a physician visit would result in a prescription. In this study, patients (N=300) were
interviewed regarding the use of prescription drugs for the two weeks prior to the
interview. The researchers hypothesized that the reason why physician visit was not a
predictor in the model was because the data collected for study was for a two-week
period preceding the interview. During this limited time the patients may not have visited
the physician. Also, most of the prescription drugs reported being filled during the two-
week time could be refills and hence patients did not see the physician. Another
possibility is for that short span of time, physician visits are more likely to predict use of
medications for treatment of acute conditions rather than chronic conditions.396
395 Jörgenson T, Johnasson S, Kennerfalk A, et al. Prescription drug use, diagnoses, and healthcare utilization among the elderly. The Annals of Pharmacotherapy. September 2001;35:1004-1009.
396 Sharpe T, Smith M, Barbe A. Medicine use among the rural elderly. Journal of Health and Social Behavior. 1984;26(2):113-127.

167
Summary of the Literature
Utilization has been reported as a major contributor to rising prescription drug
expenditures. It is not only the use of newer drugs but also the use of prescription drugs
for a long period of time that contributes to the expenditures. However, this relationship
will not be evaluated in this study. A physician visit is a step toward obtaining a new
prescription. Most studies have reported that increased physician visits increased the
likelihood of receiving a prescription. However, some studies report that the physician
visit contributes to only new prescription drug utilization and not refilled prescriptions
while another study reported that physician visit does not really play a role in the
utilization. One major point in these studies could be that the data for number of
prescriptions may not necessarily be filled prescriptions but rather just prescriptions
written which may not have been dispensed or it may have been filled but not used
completely because of change in therapy.
Physician Visits: Review of the Literature
Physician Visits and Prescription Drug Expenditures
Based on literature discussed earlier in this chapter with regards to several factors
influencing prescription drug expenditures and utilization of prescription drugs, it can be
concluded that physician visits also have an impact on prescription drug expenditures.
However, the literature search did not locate any study that evaluated the relationship
between physician visit and prescription drug expenditures.
Since a physician visit is a necessary intervention to receive a new prescription,
physician visits do have an impact on the utilization of drugs. Furthermore, except for

168
one study, all other studies have reported that physician visits do influence utilization of
drugs. Since utilization does impact prescription drug expenditures, it is possible that in
addition to the relationship between physician visits and prescription drug expenditures
moderated by utilization of drugs, physician visits do have a direct relationship with
prescription drug expenditures.
RATIONALE FOR STUDY
The growth in prescription drug expenditures have been widely discussed and the
factors influencing prescription drug expenditures have been speculated about and even
researched. There are several factors that have been stated to have an impact on
prescription drug expenditures including: access to care, demographics, physician visits,
and DTCA. Each year, prescription drug expenditures have been growing rapidly even
though they account for less than a fifth of total healthcare expenditures. Access to care
is dependent on health insurance coverage; patients or consumers with health insurance
coverage are more likely to use healthcare services such as visit the physician and fill
their prescriptions, especially the expensive prescription drugs. A physician visit is
essential for a new prescription to be written and hence it serves as a starting point for
increased utilization of and expenditures for prescription drugs.
The literature is indecisive regarding the role of gender in the utilization of
healthcare services and products. Several studies reported that more women visit the
physician and use prescription drugs than men and use a greater number of drugs than
men, but some studies have reported the opposite. This discrepancy could be because the

169
results are skewed, especially when women use more healthcare services because they
are being treated for female-specific conditions. For example, women have a high
number of physician visits for pregnancy, vaginal infections, or urinary tract infections
and use more prescriptions to treat these conditions or use preventive services or products
(e.g., birth control).
With increasing age, individuals are diagnosed with chronic conditions which
give rise to increased physician visits and prescription drugs being filled. According to
NAMCS, patients of age 45 years and older accounted for almost half of the physician
visits. Age has been reported to have a more consistent effect on utilization and
expenditures for prescription drugs than gender.
Marketing, especially DTCA, is playing a major role in increasing sales of drugs
and is speculated to impact even prescription drug expenditures. Surveys of consumers
reveal that DTCA provided valuable information and high levels of awareness. Both the
FDA and Prevention magazine surveys suggest that DTCA motivated consumers to talk
to their physicians about their conditions and seek information from a multitude of
sources. According to the FDA, the main reasons for patients expecting a prescription
are: past prescription history, information from friends and family, discussion with
physician in the past, and advertising. But advertising was at the bottom of the list.
Another benefit of DTCA is the rapid dissemination of information about new conditions,
especially those that patients are unaware of or are hesitant to discuss with their
physicians. Since DTCA encourages patients to talk to their doctors it might result in

170
discussion of non-drug therapies like lifestyle changes and even compliance.397 However,
since DTCA occurs simultaneously with other forms of marketing and market dynamics
or forces, it is difficult to isolate its effects. As an increased number of prescription drugs
are introduced in the market, the manufacturers are promoting these drugs aggressively to
physicians, consumers and other decision-makers.
In a testimony in July 2001 during a Congressional hearing on DTCA of
prescription drugs, John Calfee stated that spending and utilization of these advertised
drugs accounted for only 2.0 percent of total prescription drug expenditures in the year
2000. As a result, eliminating advertising might not have a significant influence on
prescription drug expenditures.398 Some studies have attempted to explain this
relationship between advertising and increasing sales of prescription drugs and
expenditures. However, not many studies can decisively state that advertising increases
prescription drug expenditures since there are several factors playing a role.
Studies speculate about the relationship between DTCA expenditures and
prescription drug expenditures, but have not been able to establish causality and do not
take into account other confounding factors. Some studies have indicated that DTCA
could possibly increase utilization in some therapeutic categories, but it cannot be
assumed that it will cause an increase in the consumption of all advertised drugs. As a
result, DTCA may not influence the expenditures for all advertised drugs.
397 Calfee JE. Direct-to-consumer advertising of prescription drugs. Subcommittee on Consumer Affairs, Foreign Commerce, and Tourism, Committee on Commerce, Science, and Transportation; July 24, 2001:1-8.
398 Calfee JE. Direct-to-consumer advertising of prescription drugs. Subcommittee on Consumer Affairs, Foreign Commerce, and Tourism, Committee on Commerce, Science, and Transportation; July 24, 2001:1-8.

171
Several other factors and market dynamics play a role in the utilization and
expenditures for prescription drugs. Most of the studies have evaluated the impact of
each of the variables separately or the influence of only two or three of the variables on
physician visits, prescription drug use and expenditures. This study will attempt to
evaluate the following relationships both prior to and following changes in guidelines for
advertising in August 1997 (January 1994 to August 1997, September 1997 to April
2001): (a) DTCA expenditures, access to care, age, gender with physician visits; and (b)
DTCA expenditures, access to care, age, gender, and physician visits with prescription
drug utilization and expenditures. Chapter 4 will discuss the proposed model, hypotheses
and sources of data for the study. Data analysis along with the exogenous and
endogenous variables included in the model will be described in detail.

172
CHAPTER 4: METHODOLOGY
This chapter describes the methodology for this study including the objectives and
hypotheses and the data sources. Finally, the research design including description of the
variables and the data analyses are discussed.
OBJECTIVES AND HYPOTHESES
The overall objective of the study was to examine the relationships of DTCA
expenditures, age, gender, and access to care with drug expenditures, number of
prescriptions written, and physician visits. These relationships were examined for
advertised drugs from five therapeutic classes: antihistamines/allergy medications,
antilipemics, gastrointestinals, antidepressants, and antihypertensives. The relationships
are compared for the two time periods selected for the study: (a) January 1994 to August
1997; and (b) September 1997 to April 2001. The following presents the objectives of
the study along with the associated hypotheses for each drug class:
Allergy Medications
Objective I
To determine the relationship between DTCA expenditures for allergy medications,
access to care, demographics (age and gender) and physician visits for the symptoms
and/or diagnosis of allergy (allergy-related visits).

173
H1: An increase in DTCA expenditures for allergy medications will be significantly
related to an increase in allergy-related visits.
H2: Among individuals with allergy-related visits, an increase in the proportion of
individuals with health insurance coverage or access to care will be significantly
related to an increase in allergy-related visits.
H3: An increase in the proportion of older individuals among those with allergy-related
visits will be significantly related to an increase in allergy-related visits.
H4: An increase in the proportion of women among those with allergy-related visits will
be significantly related to an increase in allergy-related visits.
Objective II
To determine the relationship between DTCA expenditures for allergy medications,
access to care, demographics (age and gender), allergy-related visits and the number of
prescriptions written for advertised allergy medications.
H5: An increase in DTCA expenditures for allergy medications will be significantly
related to an increase in prescriptions written for advertised allergy medications.
H6: Among individuals who received a prescription for allergy medication, an increase
in the proportion of individuals with health insurance coverage or access to care
will be significantly related to an increase in prescriptions written for the advertised
allergy medications.
H7: An increase in the proportion of older individuals among those who received
prescription for advertised allergy medications will be significantly related to an
increase in prescriptions written for advertised allergy medications.

174
H8: An increase in the proportion of women among those who received a prescription
for advertised allergy medications will be significantly related to an increase in
prescriptions written for the advertised allergy medications.
H9: An increase in allergy-related physician visits will be significantly related to an
increase in prescriptions written for the advertised allergy medications.
Objective III
To determine the relationship between DTCA expenditures for allergy medications,
access to care, demographics (age, gender), allergy-related, physician visits and the
expenditures for the advertised allergy medications.
H10: An increase in DTCA expenditures for allergy medications will be significantly
related to an increase in allergy drug expenditures.
H11: Among individuals who received a prescription for advertised allergy medications,
an increase in the proportion of individuals with health insurance coverage or
access to care will be significantly related to an increase in expenditures for
advertised allergy medications.
H12: An increase in the proportion of older individuals among those who received a
prescription for advertised allergy medications will be significantly related to an
increase in expenditures for advertised allergy medications.
H13: An increase in the proportion of women among those who received prescription for
advertised allergy medications will be significantly related to an increase in
expenditures for advertised allergy medications.

175
H14: There is no significant relationship between the number of allergy-related physician
visits and prescription drug expenditures for advertised allergy medications.
Objective IV
To compare the relationships from Objectives I, II, and III for the two time periods: (1)
January 1994 to August 1997; and (2) September 1997 to April 2001.
H15: The significant relationships between DTCA expenditures, access, age, gender and
allergy-related visits in time period one (January 1994 to August 1997) are also
significant in time period two (September 1997 to April 2001).
H16: The significant relationships between, DTCA expenditures, access, age, gender,
allergy-related visits and prescriptions written for advertised allergy medications in
time period one (January 1994 to August 1997) are also significant in time period
two (September 1997 to April 2001).
H17: The significant relationships between DTCA expenditures, access, age, gender,
allergy-related visits and expenditures for advertised allergy medications in time
period one (January 1994 to August 1997) are also significant in time period two
(September 1997 to April 2001).
Antilipemics
Objective I
To determine the relationship between DTCA expenditures for antilipemic drugs, access
to care, demographics (age and gender) and physician visits when patient was diagnosed
with hyperlipidemia or lipid-related visits.

176
H18: An increase in DTCA expenditures for antilipemic drugs will be significantly
related to an increase in lipid-related visits.
H19: Among individuals diagnosed with hyperlipidemia (lipid-related visits), an increase
in the proportion of individuals with health insurance coverage or access to care
will be significantly related to an increase in lipid-related visits.
H20: An increase in the proportion of older individuals among those diagnosed with
hyperlipidemia (lipid-related visits) will be significantly related to an increase in
lipid-related visits.
H21: An increase in the proportion of women among those diagnosed with
hyperlipidemia (lipid-related visits) will be significantly related to an increase in
lipid-related physician visits.
Objective II
To determine the relationship between DTCA expenditures for antilipemic drugs, access
to care, demographics (age and gender), lipid-related visits and the number of
prescriptions written for advertised antilipemic drugs.
H22: An increase in DTCA expenditures for antilipemic drugs will be significantly
related to an increase in prescriptions written for advertised antilipemic drugs.
H23: Among individuals who received a prescription for advertised antilipemics, an
increase in the proportion of individuals with health insurance coverage or access to
care will be significantly related to an increase in prescriptions written for the
advertised antilipemics.

177
H24: An increase in the proportion of older individuals among those who received
prescription for advertised antilipemics will be significantly related to an increase in
prescriptions written for advertised antilipemics.
H25: An increase in the proportion of women among those who received a prescription
for advertised antilipemics will be significantly related to an increase in
prescriptions written for the advertised antilipemics.
H26: An increase in the number of patients diagnosed with hyperlipidemia (lipid-related
visits) will be significantly related to an increase in prescriptions written for the
advertised antilipemic drugs.
Objective III
To determine the relationship between DTCA expenditures for antilipemic drugs, access
to care, demographics (age, gender), lipid-related physician visits and the expenditures
for the advertised antilipemic drugs.
H27: An increase in DTCA expenditures for antilipemic drugs will be significantly
related to an increase in antilipemic drug expenditures.
H28: Among individuals who received a prescription for advertised antilipemics, an
increase in the proportion of individuals with health insurance coverage or access to
care will be significantly related to an increase in expenditures for advertised
antilipemics.
H29: An increase in the proportion of older individuals among those who received a
prescription for advertised antilipemics will be significantly related to an increase in
expenditures for advertised antilipemics.

178
H30: An increase in the proportion of women among those who received prescription for
advertised antilipemics will be significantly related to an increase in expenditures
for advertised antilipemics.
H31: There is no significant relationship between the number of patients diagnosed with
hyperlipidemia (lipid-related visits) and prescription drug expenditures for
advertised antilipemics.
Objective IV
To compare the relationships from Objectives I, II, and III for the two time periods: (1)
January 1994 to August 1997; and (2) September 1997 to April 2001.
H32: The significant relationships between DTCA expenditures, access, age, gender and
lipid-related visits in time period one (January 1994 to August 1997) are also
significant in time period two (September 1997 to April 2001).
H33: The significant relationships between DTCA expenditures, access, age, gender,
lipid-related visits and prescriptions written for advertised antilipemic drugs in time
period one (January 1994 to August 1997) are also significant in time period two
(September 1997 to April 2001).
H34: The significant relationships between DTCA expenditures, access, age, gender,
lipid-related visits and expenditures for advertised antilipemics in time period one
(January 1994 to August 1997) are also significant in time period two (September
1997 to April 2001).

179
Gastrointestinals
Objective I
To determine the relationship between DTCA expenditures for gastrointestinal drugs,
access to care, demographics (age and gender) and physician visits for the symptoms or
diseases the advertised gastrointestinal drugs are used to treat (gastrointestinal-related
visits).
H35: An increase in DTCA expenditures for gastrointestinal drugs will be significantly
related to an increase in gastrointestinal-related visits.
H36: Among individuals with gastrointestinal-related visits, an increase in the proportion
of individuals with health insurance coverage or access to care will be significantly
related to an increase in gastrointestinal-related visits.
H37: An increase in the proportion of older individuals among those with
gastrointestinal-related visits will be significantly related to an increase in
gastrointestinal-related visits.
H38: An increase in the proportion of women among those with gastrointestinal-related
visits will be significantly related to an increase in gastrointestinal-related visits.
Objective II
To determine the relationship between DTCA expenditures for gastrointestinal drugs,
access to care, demographics (age and gender), gastrointestinal-related visits and the
number of prescriptions written for advertised gastrointestinal drugs.
H39: An increase in DTCA expenditures for gastrointestinal drugs will be significantly
related to an increase in prescriptions written for advertised gastrointestinals.

180
H40: Among individuals who received a prescription for advertised gastrointestinals, an
increase in the proportion of individuals with health insurance coverage or access to
care will be significantly related to an increase in prescriptions written for the
advertised gastrointestinals.
H41: An increase in the proportion of older individuals among those who received
prescription for advertised gastrointestinals will be significantly related to an
increase in prescriptions written for advertised gastrointestinals.
H42: An increase in the proportion of women among those who received a prescription
for advertised gastrointestinals will be significantly related to an increase in
prescriptions written for the advertised gastrointestinals.
H43: An increase in gastrointestinal-related physician visits will be significantly related
to an increase in prescriptions written for the advertised gastrointestinals.
Objective III
To determine the relationship between DTCA expenditures for gastrointestinal drugs,
access to care, demographics (age, gender), gastrointestinal-related physician visits and
the expenditures for the advertised gastrointestinal drugs.
H44: An increase in DTCA expenditures for gastrointestinal drugs will be significantly
related to an increase in gastrointestinal drug expenditures.
H45: Among individuals who received a prescription for advertised gastrointestinals,
increase in the proportion of individuals with health insurance coverage or access to
care will be significantly related to an increase in expenditures for advertised
gastrointestinals.

181
H46: An increase in the proportion of older individuals among those who received a
prescription for advertised gastrointestinals will be significantly related to an
increase in expenditures for advertised gastrointestinals.
H47: An increase in the proportion of women among those who received prescription for
advertised gastrointestinals will be significantly related to an increase in
expenditures for advertised gastrointestinals.
H48: There is no significant relationship between number of gastrointestinal-related
physician visits and prescription drug expenditures for advertised gastrointestinals.
Objective IV
To compare the relationships from Objectives I, II, and III for the two time periods: (1)
January 1994 to August 1997; and (2) September 1997 to April 2001.
H49: The significant relationships between DTCA expenditures, access, age, gender and
gastrointestinal-related visits in time period one (January 1994 to August 1997) are
also significant in time period two (September 1997 to April 2001).
H50: The significant relationships between DTCA expenditures, access, age, gender,
gastrointestinal-related visits and prescriptions written for advertised
gastrointestinals in time period one (January 1994 to August 1997) are also
significant in time period two (September 1997 to April 2001).
H51: The significant relationships between DTCA expenditures, access, age, gender,
gastrointestinal-related visits and expenditures for advertised gastrointestinals in
time period one (January 1994 to August 1997) are also significant in time period
two (September 1997 to April 2001).

182
Antidepressants
Objective I
To determine the relationship between DTCA expenditures for antidepressants, access to
care, demographics (age and gender) and physician visits for the symptoms or diseases
the antidepressants are used to treat (depression-related visits).
H52: An increase in DTCA expenditures for antidepressants will be significantly related
to an increase in depression-related visits.
H53: Among individuals with depression-related visits, increase in the proportion of
individuals with health insurance coverage or access to care will be significantly
related to an increase in depression-related visits.
H54: An increase in the proportion of older individuals among those with depression-
related visits will be significantly related to an increase in depression-related visits.
H55: An increase in the proportion of women among those with depression-related visits
will be significantly related to an increase in depression-related visits.
Objective II
To determine the relationship between DTCA expenditures for antidepressants, access to
care, demographics (age and gender), depression-related visits and the number of
prescriptions written for advertised antidepressants.
H56: An increase in DTCA expenditures for antidepressants will be significantly related
to an increase in prescriptions written for advertised antidepressants.
H57: Among individuals who received a prescription for advertised antidepressants, an
increase in the proportion of individuals with had health insurance coverage or

183
access to care will be significantly related to an increase in prescriptions written for
the advertised antidepressants.
H58: An increase in the proportion of older individuals among those who received
prescription for advertised antidepressants will be significantly related to an
increase in prescriptions written for advertised antidepressants.
H59: An increase in the proportion of women among those who received a prescription
for advertised antidepressants will be significantly related to an increase in
prescriptions written for the advertised antidepressants.
H60: An increase in depression-related visits will be significantly related to the increase
in the prescriptions written for the advertised antidepressants.
Objective III
To determine the relationship between DTCA expenditures for antidepressants, access to
care, demographics (age, gender), depression-related physician visits and the
expenditures for the advertised antidepressants.
H61: An increase in DTCA expenditures for antidepressants will be significantly related
to increased expenditures for antidepressants.
H62: Among individuals who received a prescription for advertised antidepressants,
increase in the proportion of individuals with health insurance coverage or access to
care will be significantly related to an increase in expenditures for advertised
antidepressants.

184
H63: An increase in the proportion of older individuals among those who received a
prescription for advertised antidepressants will be significantly related to an
increase in expenditures for advertised antidepressants.
H64: An increase in the proportion of women among those who received prescription for
advertised antidepressants will be significantly related to an increase in
expenditures for advertised antidepressants.
H65: There is no significant relationship between the number of depression-related
physician visits and prescription drug expenditures for advertised antidepressants.
Objective IV
To compare the relationships from Objectives I, II, and III for the two time periods: (1)
January 1994 to August 1997; and (2) September 1997 to April 2001.
H66: The significant relationships between DTCA expenditures, access, age, gender and
depression-related visits in time period one (January 1994 to August 1997) are also
significant in time period two (September 1997 to April 2001).
H67: The significant relationships between DTCA expenditures, access, age, gender,
depression-related visits and prescriptions written for advertised antidepressants in
time period one (January 1994 to August 1997) are also significant in time period
two (September 1997 to April 2001).
H68: The significant relationships between DTCA expenditures, access, age, gender,
depression-related visits and expenditures for advertised antidepressants in time
period one (January 1994 to August 1997) are also significant in time period two
(September 1997 to April 2001).

185
Antihypertensives
Objective I
To determine the relationship between DTCA expenditures for antihypertensives, access
to care, demographics (age and gender) and physician visits for the symptoms and/or
diagnosis of hypertension (hypertension-related visits).
H69: An increase in DTCA expenditures for antihypertensive drugs will be significantly
related to an increase in hypertension-related visits.
H70: Among individuals with hypertension-related visits, increase in the proportion of
individuals with health insurance coverage or access to care will be significantly
related to an increase in hypertension-related visits.
H71: An increase in the proportion of older individuals among those with hypertension-
related visits will be significantly related to an increase in hypertension-related
visits.
H72: An increase in the proportion of women among those with hypertension-related
visits will be significantly related to an increase in hypertension-related visits.
Objective II
To determine the relationship between DTCA expenditures for antihypertensive drugs,
access to care, demographics (age and gender), hypertension-related visits and the
number of prescriptions written for advertised antihypertensive drugs.
H73: An increase in DTCA expenditures for antihypertensive drugs will be significantly
related to an increase in prescriptions written for advertised antihypertensive drugs.

186
H74: Among individuals who received a prescription for advertised antihypertensives, an
increase in the proportion of individuals with health insurance coverage or access to
care will be significantly related to an increase in prescriptions written for the
advertised antihypertensives.
H75: An increase in the proportion of older individuals among those who received
prescription for advertised antihypertensives will be significantly related to an
increase in prescriptions written for advertised antihypertensives.
H76: An increase in the proportion of women among those who received a prescription
for advertised antihypertensives will be significantly related to an increase in
prescriptions written for the advertised antihypertensives.
H77: An increase in hypertension-related physician visits will be significantly related to
an increase in prescriptions written for the advertised antihypertensives.
Objective III
To determine the relationship between DTCA expenditures for antihypertensive drugs,
access to care, demographics (age, gender), hypertension-related physician visits and
the expenditures for the advertised antihypertensive drugs.
H78: An increase in DTCA expenditures for antihypertensive drugs will be significantly
related to increase in drug expenditures for advertised antihypertensives.
H79: Among individuals who received a prescription for advertised antihypertensives, an
increase in the proportion of individuals with health insurance coverage or access to
care will be significantly related to an increase in expenditures for advertised
antihypertensives.

187
H80: An increase in the proportion of older individuals among those who received a
prescription for advertised antihypertensives will be significantly related to an
increase in expenditures for advertised antihypertensives.
H81: An increase in the proportion of women among those who received prescription for
advertised antihypertensives will be significantly related to an increase in
expenditures for advertised antihypertensives.
H82: There is no significant relationship between the number of hypertension-related
physician visits and prescription drug expenditures for advertised antihypertensives.
Objective IV
To compare the relationships from Objectives I, II, and III for the two time periods: (1)
January 1994 to August 1997; and (2) September 1997 to April 2001.
H83: The significant relationships between DTCA expenditures, access, age, gender and
hypertension-related visits in time period one (January 1994 to August 1997) are
also significant in time period two (September 1997 to April 2001).
H84: The significant relationships between DTCA expenditures, access, age, gender,
hypertension-related visits and prescriptions written for advertised antihypertensive
drugs in time period one (January 1994 to August 1997) are also significant in time
period two (September 1997 to April 2001).
H85: The significant relationships between DTCA expenditures, access, age, gender
hypertension-related visits and expenditures for advertised antihypertensives in time
period one (January 1994 to August 1997) are also significant in time period two
(September 1997 to April 2001).

188
DATA SOURCES
The data for the study were obtained from three databases: 1) Competitive Media
Reporting (CMR), 2) National Ambulatory Medical Care Survey (NAMCS), and 3)
Average Wholesale Price (AWP) from Red Book. DTCA expenditures were calculated
from the CMR databases. Data for all other variables except prescription drug
expenditures were calculated from the NAMCS databases. The prescription drug
expenditures data were calculated using the product of estimated price of the drug and
number of prescriptions written for it. The estimated price of the drug was calculated as
the sum of the AWP (ingredient cost) and average dispensing fee for each prescription.
Databases
Competitive Media Reporting (CMR)
TNS Media Intelligence/Competitive Media Reporting, a company located in
New York, collects advertising occurrence and expenditures. They monitor advertising
and provide reports on the “advertising occurrence and expenditures for competitive
analyses and buying decisions.” CMR monitors advertising from 11 different media
including broadcast network television, cable network television, magazine, national
newspaper, national spot radio, national syndication television, network radio,
newspaper, outdoor spot television, and Sunday magazine.399 Specifically, for the data
used in the current study, the CMR dataset included monthly advertising expenditures for
prescription drugs/disease by media outlet and manufacturer.
399 Description of Methodology. New York: Competitive Media Reporting; 1999.

189
Data Collection Methodology
The basic unit of CMR’s monitoring process is the advertisement itself and is
reported as an “account name” which is the term for a brand and product combination.
CMR utilizes MediaWatch® technology to monitor television services including spot,
network, and cable television services. MediaWatch® utilizes proprietary hardware and
software. The hardware has three components including the local site, central site, and
workstation. Following is the description of these hardware components and their
functions.
The local site, an unmanned custom-built computer, is the primary data collection unit for MediaWatch®. The local site is located in each of the 75 spot markets. Four of the local sites are located in Kansas City for monitoring the broadcast and cable networks. A broadcast signal brought by a roof antenna or cable is received by the local site and connected to a communications network. These are then analyzed to identify potential advertisements. The local site performs three functions concurrently: (a) Digitizes audio/visual (A/V signals): The local site digitizes every broadcast
frame on each channel monitored for recognition and creates unique signatures to match the database of known commercials. The local site also digitizes the full audio and one video frame every four seconds in order to replay the A/V at a classification workstation.
(b) Detects new commercials: MediaWatch® detects new commercials based on finding of cues in the signal such as fade-to-back and known signatures. If analysis of this cue data by expert system software meets predefined criteria, the local site has then identified a new commercial. The local site then saves the digitized A/V (full audio and one video frame every four seconds) and a signature (generated from every broadcast frame) for the potential new commercial. The data is then sent via the communications network to be classified at the workstation.
(c) Matches known commercials: The local site maintains a database of known commercials with the known signatures and each of these signatures has a key frame. As the local site creates the signatures for the broadcast frames it is monitoring, it scans its database to see if any of the frames match the key frames in its database. If a match is found and the remaining of the signature supports the match, the local site will then write the information in the occurrence file indicating the station/network, date and time the segment was aired and this occurrence information will be sent to the central site.

190
The central site databases stores signals of known commercials throughout the system in all markets. The central site is responsible for grouping and filtering information being sent from each local site to the workstation as well as updating signatures at local site databases and collecting occurrence data. If multiple local sites see a new segment, each site will send a signature to the central site. The central site will then group similar signatures, requesting that only one copy of the A/V data be sent through to the classification workstation. On receiving the classified segment back from workstation, central site will update the database of each local site that sent the segment. The central site also filters the data being sent through to the workstation. If a local site identifies a commercial new to that site, which has already been classified at the central site, then the central site will alert the local site to discard the A/V and update the local site based on the information pertaining to the segment already in the database. The central site routinely collects occurrence information from the local sites. The information (station/network, date and time) is stored at the central site until all occurrences for a broadcast day are processed. The daily market occurrence data will then be loaded into production files for further processing.
The workstation receives A/V for segments, which the system has determined to be potential new commercials. At the workstation, the operator views the A/V data to make a classification (brand, PSA, unassigned, promotion or chaff). If account name already exists in the master file of accounts, then the operator can classify the commercial. If the segment is for a new account, the operator will classify it as unassigned and refer it to a specialist for the creation of a new account name. Any program material or incomplete commercials that are sent to the workstation are classified as chaff and discarded.
The A/V displayed at the workstation (except chaff and promotions) is then copied onto an optical disk where it is stored by account name and first occurrence date. This A/V is retained indefinitely and can be redisplayed for review and reclassification if necessary. After classification of commercial by CMR, account name and creative description is assigned which summarizes the visual aspects of the commercial.400
Data from national syndicated television service are videotaped and then
classified. For network radio service, CMR collects information on occurrence and
expenditure from 12 radio sales networks.401
400 MediaWatch® Data Collection. Description of Methodology. New York: Competitive Media Reporting; 1999:4-5.
401 Description of Methodology. New York: Competitive Media Reporting; 1999:6-25.

191
As mentioned earlier, CMR also collects information from magazines on space
for publication and expenditure from the Publishers Information Bureau (PIB).
Information is collected mainly from magazines and other publications that are members
of the PIB, which include over 200 consumer magazines and four national newspaper
supplements. Any new members are required to provide previous year publications for
measurement. Each member publication is required to provide “marked” issues of the
national editions, which give detailed information about each advertisement. Tear sheets
of advertisements, which are actually ripped out of regional or demographic editions, are
also submitted. Inserts including postcards, scent strips, booklets, pop-ups, and
application cards also have to be submitted. Outserts, tear outs, and supplements are also
evaluated for commercials.402
In addition, CMR collects information on outdoor advertising in over 200
markets. Operators who sell outdoor advertising space provide CMR with the information
on advertising expenditures.403
CMR also collects information on commercials appearing in national spot radio
service for approximately 4000 stations in more than 225 markets. The national
representatives for the radio stations provide the information to CMR, which is then
matched to the account name and product classification. Advertising space in 360
newspapers (regional editions and preprints) is measured by CMR for occurrence and
expenditure data. Newspapers are delivered to CMR from the newspaper itself or market
402 Description of Methodology. New York: Competitive Media Reporting; 1999:6-25.403 Description of Methodology. New York: Competitive Media Reporting; 1999:6-25.

192
representative subscribing to the paper and the data collection for newspapers is done
manually.404
Cost Calculation Methodology
The advertising expenditure data are calculated by several methods depending on
the type of media. Following are the descriptions of cost, expenditure, or rate calculations
used by CMR for spot television, network television, cable television, syndicated
television, magazine, newspapers, network radio, outdoor advertising, and spot radio.
To determine expenditures for spot television, television stations, their
representatives, and agency sources are polled quarterly. These sources provide the
average 30-second daypart-level rates for the next quarter and this information, which
can vary by source, is then used to estimate the advertising rates to be applied for that
quarter. The data go through an automated process, which then determines the best data
that can be used as input to calculate weighted average daypart rate. This estimated rate
is then reviewed by market specialists to ensure that the information is consistent with
market share information provided by agencies and past histories. If the rate change is
greater than 10.0 percent from the previous year, it is investigated with the station and
agency sources. Prime time broadcast, sporting events, specials, and other program
changes are adjusted accordingly so as to reflect a true picture on expenditures. Results
are then adjusted by a percentage after comparing to the results of the national
404 Description of Methodology. New York: Competitive Media Reporting; 1999:6-25.

193
broadcasting industry survey conducted monthly by the Television Bureau of Advertising
and tabulated by Ernst and Young.405
For network television services expenditure calculations, rates are supplied
directly by the networks with eight agencies providing expenditure information on their
network purchases. Monthly, the networks provide the 30-second program rates by
program title after the completion of the monitored month. These rates are then checked
for consistency and completeness and discrepancies are resolved with the networks. The
expenditures are adjusted accordingly for special rates for specified programs. Regional
advertising networks report the regional positions, the advertisers that are sharing the
position, and the percentage of the expenditures by each advertiser.406
For cable television network expenditure data, a combination of cable networks
and agencies supply preliminary daypart and/or program rates or rate card information.
At the end of the month, the networks are contacted to obtain actual revenue totals. CMR
uses daypart defined by each network or agency as primary unit for rate determinations.
Based on these preliminary rates, a detailed daypart grid for each network is created,
which can then be applied to each commercial. CMR adjusts data by adjusting rates by
types of spots in cable and applying the appropriate rates for each.407
CMR calculates expenditure data for national syndicated television for more than
200 programs per month through 24-hour monitoring of four satellites and 18
405 The Spot Television Service. Description of Methodology. New York: Competitive Media Reporting; 1999:6-8.
406 The Network Television Service. Description of Methodology. New York: Competitive Media Reporting; 1999:9-10.
407 The Cable Television Network Service. Description of Methodology. New York: Competitive Media Reporting; 1999:11-12.

194
transponders. Every month, eight agencies provide CMR with confidential information
on cost for syndicated programs based on previous month’s buys. These data are then
used to calculate approximate expenditures for monitored syndicated programs appearing
in national syndicated television. Typically, the information provided includes the
program title, spot length, average cost (or total cost), and number of spots purchased. All
the rates are then averaged and adjusted for differences in spot lengths to provide the
final rate for the syndicated program.408
To determine advertising expenditure data for magazines, member publications of
the PIB are required to provide the current rate card. Commissions and frequency or
volume discounts are not taken into account, but premium charges are included. Data are
adjusted for special published rates when applicable. Similarly, newspapers also provide
CMR with a rate card that is utilized to calculate the advertising expenditures. Specific
rates and day of the week or special section rates are used when available.409
Radio networks provide the quarterly daypart rates to CMR for their sales
networks and CMR then applies these rates directly to the sales network occurrences.
Companies selling outdoor advertising (mainly billboards) provide the expenditures for
all outdoor advertisements providing both the rates and gross sales volume. For national
spot radio, the national station representatives provide the expenditure data.410
The total monthly DTCA expenditures for advertised drugs from the five classes
of drugs selected for the study from January 1994 to April 2001 were determined. As
408 The National Syndicated Television Service. Description of Methodology. New York: Competitive Media Reporting; 1999:13-14.
409 Description of Methodology. New York: Competitive Media Reporting; 1999:15-21.410 Description of Methodology. New York: Competitive Media Reporting; 1999:15-21.

195
stated previously, data for the remainder of the variables except prescription drug
expenditures were obtained from NAMCS, which is described in detail in the following
section.
National Ambulatory Medical Care Survey (NAMCS)
The purpose of NAMCS is to provide objective and reliable national data on
ambulatory care services in the United States. NAMCS has been conducted yearly from
1973 to 1981, in 1985, and yearly since 1989. Data are based on physician visits
involving direct patient care.411 The data are collected from a nationally representative
sample and extrapolated to the U.S. population.
Scope of Survey and Sample Design
The basic sampling unit for the NAMCS survey is a physician visit (also called
patient-physician encounter). Visits to physicians who are non-federally employed and
classified as “office-based care” by the American Medical Association (AMA) or the
American Osteopathic Association (AOA) are included. Physicians practicing
anesthesiology, pathology, or radiology specialties are excluded from the survey. In
addition, the following types of visits or physician contacts are excluded from the survey:
“telephone, visit outside physician office, visit in hospital settings (unless physician has a
private office in the hospital and office meets NAMCS’s definition of “office”), visits
made in institutional settings by patients for whom the institution has primary
responsibility over time (e.g.; nursing home), and visits to doctor’s offices that are made
for administrative purposes only (e.g.; leave specimen, pay a bill, pick up an insurance
411 Ambulatory Health Care Data: NAMCS Description. National Center for Health Statistics. Available at: www.cdc.gov/nchs/about/major/ahcd/namcsdes.htm. Accessed June, 2002.

196
form).”412 Following is a detailed description of the sampling technique and data
collection and processing procedures.
A modified probability-proportional-to-size procedure using separate sampling frames for standard metropolitan statistical areas (SMSA’s) and for nonmetropolitan counties are employed.413 Survey utilizes a multistage (three stage) probability sampling design involving probability samples of primary sampling units (PSUs), physician practices within PSUs, and patient visits within practices. The first stage sample includes 112 PSUs which are geographic segments composed of counties, groups of counties, county equivalents (such as parishes or independent cities) or towns and townships (for some PSUs in New England) within the 50 States and the District of Columbia.
The second stage consists of a probability sample of practicing physicians selected from the master files maintained by the AMA and the AOA. Within each PSU, all eligible physicians are stratified by 15 groups: general and family practice, osteopathy, internal medicine, pediatrics, general surgery, obstetrics and gynecology, orthopedic surgery, cardiovascular diseases, dermatology, urology, psychiatry, neurology, ophthalmology, otolaryngology, and a residual category of all other specialties.
The final stage is the selection of patient visits within the annual practices of sample physicians. This involves two steps. First, the total physician sample is divided into 52 random sub-samples of approximately equal size, and each sub-sample is randomly assigned to one of the 52 weeks in the survey year. Second, a systematic random sample of visits is selected by the physician during the reporting week. The sampling rate varies for this final step from a 100.0 percent sample for very small practices, to a 20.0 percent sample for very large practices as determined in a pre-survey interview.414
Data Collection Procedures and Processing
The U.S. Bureau of the Census acts as the field data collection agent for the NAMCS. The actual data collection for the NAMCS is carried out by the physician aided by his/her office staff when possible, as instructed by Census field representatives. Two data collection forms are employed — Patient Log and Patient Record. The Patient Log is used to sequentially list patients seen in the physician’s office during his or her assigned reporting week. This list serves as the sampling frame to indicate the visits for which data
412 Ambulatory Health Care Data: NAMCS Scope and Sample Design. National Center for Health Statistics. Available at: www.cdc.gov/nchs/about/major/ahcd/sampnam.htm. Accessed August, 2003.
413 Tenney JB, White KL, Williamson JW. National Ambulatory Medical Care Survey. National Center for Health Statistics. April 1974;Series 2(61):1-76.
414 Ambulatory Health Care Data: NAMCS Scope and Sample Design. National Center for Health Statistics. Available at: www.cdc.gov/nchs/about/major/ahcd/sampnam.htm. Accessed August, 2003.

197
are to be recorded. A perforation between the patient’s name on the Patient Log and patient visit information on the Patient Record form permit the physician to detach and retain the listing of patients, thus assuring confidentiality. Each physician is assigned a patient-sampling ratio, based on an estimate of the expected number of office visits. These ratios are designed to yield about 30 Patient Record forms per physician.
In addition to the completeness checks made by field staff, clerical edits are performed upon receipt of the data for central processing. Detailed editing instructions are provided to manually review the forms and to reclassify or recode ambiguous entries. Computer edits for code ranges and inconsistencies are also performed. All medical and drug coding and keying operations are performed centrally by Analytic Sciences, Inc. and are subject to quality control procedures. Keying and coding error rates generally range between 0.0-2.0 percent for various survey items.
Item nonresponse rates are generally 5.0 percent or less for NAMCS data items, with some exceptions. Imputations for missing data are performed for patient age, sex, race, time spent with physician, and date of visit.415 Some missing data items are imputed by randomly assigning a value from a patient record form with similar characteristics. Imputations are based on physician specialty, geographic region, and 3-digit ICD-9-CM codes for primary diagnosis.416
Data are obtained on patients' symptoms, physicians' diagnoses, and medications ordered or provided. The survey also provides statistics on the demographic characteristics of patients and services provided, including information on diagnostic procedures, patient management, and planned future treatment.417 Drug data are coded using a unique classification scheme developed at the NCHS. Listings of drugs by entry name (the name used by the respondent to record the drug on the Patient Record form) and by generic substance are available. The therapeutic classes of drugs are recorded based on the National Drug Code Directory.418
Physicians expecting few visits each day record all of them whereas those expecting more than a predetermined number of visits per day record data for every second, third or fifth visit. Random start provided on the first page of patient log so that
415 Ambulatory Health Care Data: NAMCS Data Collection and Processing. National Center for Health Statistics. June 12, 2002. Available at: http://www.cdc.gov/nchs/about/major/ahcd/impnam97.htm. Accessed August, 2003.
416 2001 NAMCS Micro-data File Documentation: National Center for Health Statistics, Centers for Disease Control and Prevention; 2001:5-22.
417 Ambulatory Health Care Data: NAMCS Scope and Sample Design. National Center for Health Statistics. Available at: www.cdc.gov/nchs/about/major/ahcd/sampnam.htm. Accessed August, 2003.
418 Ambulatory Health Care Data: NAMCS Data Collection and Processing. National Center for Health Statistics. June 12, 2002. Available at: http://www.cdc.gov/nchs/about/major/ahcd/impnam97.htm. Accessed August, 2003.

198
the predesignated sample visits on each succeeding page of the log provides a systematic random sample of patient visits during the reporting period.419
Estimation Procedures
Statistics are derived by a multistage estimation procedure. The procedure produces essentially unbiased national estimates and has basically four components: 1) Inflation by reciprocals of the probabilities of selection; 2) Adjustment for nonresponse; 3) Ratio adjustment to fixed totals; and 4) Weight smoothing. Each of these components are described briefly below:Inflation of Reciprocals by Sampling ProbabilitiesSince the survey utilized a three-stage sample design, there were three probabilities:
a) The probability of selecting the PSU;b) The probability of selecting a physician within the PSU; andc) The probability of selecting a patient visit within the physician's practice.
The last probability was defined to be the exact number of office visits during the physician's specified reporting week divided by the number of Patient Record forms completed. All weekly estimates are inflated by a factor of 52 to derive annual estimates.
Adjustment for NonresponseEstimates from the NAMCS data are adjusted to account for the sample of physicians who did not participate in the study. This was done in such a manner as to minimize the impact of nonresponse on final estimates by imputing to nonresponding physicians the practice characteristics of similar responding physicians. For this purpose, similar physicians were judged to be physicians having the same specialty designation and practicing in the same PSU.
Ratio AdjustmentA postratio adjustment was made within each of the 15 physician specialty groups. The ratio adjustment is a multiplication factor, which had as its numerator the number of physicians in the universe in each physician specialty group and as its denominator the estimated number of physicians in that particular specialty group. The numerator is based on figures obtained from the AMA-AOA master files, and the denominator is based on the data from the sample.
Weight SmoothingEach year there are a few sample physicians whose final visit weights are large relative to those for the rest of the sample. There is a concern that those few may adversely affect the ability of the resulting statistics to reflect the universe, especially if the sampled patient visits to some of those few physicians should be unusual relative to the universe. Extremes in final weights also increase the resulting variances. Extreme weights can be
419 2001 NAMCS Micro-data File Documentation: National Center for Health Statistics, Centers for Disease Control and Prevention; 2001:5-22.

199
truncated, but this leads to an understatement of the total visit count. The technique of weight smoothing is used instead, because it preserves the total estimated visit count within each specialty by shifting the "excess" from visits with the largest weights to visits with smaller weights.
Excessively large visit weights are truncated, and a ratio adjustment is performed. The ratio adjustment is a multiplication factor that uses as its numerator the total visit count in each physician specialty group before the largest weights are truncated, and, as its denominator, the total visit count in the same specialty group after the largest weights are truncated. The ratio adjustment was made within each of the 15 physician specialty groups and yields the same estimated total visit count as the unsmoothed weights.420
Prescription Drug Expenditures
The average wholesale price (AWP) from the Redbook was used to calculate the
prescription drug expenditures for all drugs, each month, from 1994 to 2001.421 The
strengths that were available during all the years the drug was in the market were
identified and among those, the most commonly prescribed strengths were identified
using reports from Families USA.422,423,424,425,426 The product ingredient cost was
estimated using the AWP for selected strengths from the Red Book. Each prescription
was assumed to be a 30-day supply. Hence, the estimated total prescription drug price for
each drug was calculated as the sum of the product’s AWP for a 30-day supply and the
420 Ambulatory Health Care Data: NAMCS Estimation Procedures. National Center for Health Statistics. May 17, 2001. Available at: http://www.cdc.gov/nchs/about/major/ahcd/namcs_est_proc.htm. Accessed June, 2002.
421 Drug Topics: Red Book: Thomson Healthcare; 1994-2003.422 Still rising: Drug price increases for seniors 1999-2000. Families USA. April 2000. Available at:
http://www.familiesusa.org/site/DocServer/pdrug.pdf?docID=771. Accessed September, 2004.423 Enough to make you sick: Prescription drug prices for the elderly. Families USA. June 2001. Accessed
September, 2004.424 Hard to swallow: Rising drug prices for America's senior's. Families USA. November 1999. Available
at: http://www.familiesusa.org/site/DocServer/drug.pdf?docID=772. Accessed September, 2004.425 Bitter pill: The rising prices of prescription drugs for older Americans. Families USA. June 2002.
Available at: http://www.familiesusa.org/site/DocServer/BitterPillreport.pdf?docID=261. Accessed September, 2004.
426 Out of bounds: Rising prescription drug prices for seniors. Families USA. July 2003. Available at: http://www.familiesusa.org/site/DocServer/Out_of_Bounds.pdf?docID=1522. Accessed September, 2004.

200
average dispensing fee for each year obtained from the Novartis Pharmacy Benefit
Reports.427 The product of this estimated drug price and number of prescriptions written
was the prescription drug expenditure for that drug product.
STUDY DESIGN
This retrospective study employed part non-experimental and part quasi-
experimental study design. This study utilized the retrospective data from Competitive
Media Reporting (CMR), National Ambulatory Medical Care Survey (NAMCS), and
prescription drug expenditures calculated as a product of estimated total yearly price
(sum of AWP and average dispensing fees) and number of prescriptions written for drugs
each month. The study attempts to evaluate the relationships of DTCA expenditures,
access to care or health insurance coverage, age, and gender with physician visits,
number of prescriptions written for the advertised drugs, and prescription drug
expenditures. The drug classes selected were the top five drug classes with the greatest
increase in drug expenditures from 1993 to 1998 and were among the top ten drug classes
ranked by retail sales from 1999 to 2001. The drug classes selected were
antihistamines/allergy medications, antilipemics, gastrointestinals, antidepressants, and
antihypertensives.428,429,430 The drugs from these five classes were also among the most
heavily advertised from January 1994 through April 2001.
427 Novartis. Facts and Figures. East Hanover, NJ: Novartis Pharmaceuticals Corporation and Emron; 1995-2002 editions.
428 Barents Group L. Issue brief: Factors affecting the growth of prescription drugs expenditures. National Institute for Health Care Management. July, 1999. Available at: www.nihcm.org. Accessed January, 2001.

201
As discussed in Chapter 2, with the relaxation of regulations for broadcast media
advertising of prescription drugs in August 1997, there has been a surge in DTCA. The
study compares the relationships between independent and dependent variables (number
of visits, number of prescriptions written and prescription drug expenditures) for both
time periods: (a) January 1994 to August 1997; and (b) September 1997 to April 2001.
Following is a description of the variables in the conceptual model (Figure 4.1).
DTCA Expenditures
The advertised drugs from the five therapeutic classes selected were identified
and included in the study. The drugs selected from each of the five classes are shown in
Table 4.1.
Table 4.1: Advertised Drugs Selected from the Five Drug Classes - Allergy Medications, Antilipemics, Gastrointestinals, Antidepressants, and
AntihypertensivesDrug Class Drugs Selected
Allergy Medications Allegra®, Claritin®, Flonase®, Hismanal®, Nasonex®, Seldane®,
Zyrtec®
Antilipemics Baycol®, Lescol®, Lipitor®, Mevacor®, Pravachol®, Zocor®
Gastrointestinals Helidac®, Lotronex®, Prevacid®, Prilosec®, Propulsid®, Zantac®
Antidepressants Effexor®, Paxil®, Prozac®, Serzone®, Wellbutrin®, Zoloft®
Antihypertensives Adalat®, Altace®, Capoten®, Cardizem®, Cardura®, Coreg®,
Lotensin®, Toprol XL®
429 Findlay S, Sherman D, Chockley N, et al. Prescription drug expenditures in 2000: The upward trend continues. The National Institute for Health Care Management. May 2001. Available at: www.nihcm.org. Accessed December, 2001.
430 Findlay S, Sherman D, Chockley N, et al. Prescription drug expenditures in 2001: Another year of escalating costs. National Institute for Health Care Management. April 2002. Available at: www.nihcm.org. Accessed June, 2002.

Figure 4.1: Conceptual Model
202
DTCA Expenditures
Access to care/Insurance coverage
Patient Age
Patient Gender
Number of Physician Visits
Number of Prescriptions Written
Prescription Drug Expenditures

203
The total monthly advertising expenditures in U.S. dollars for these specific
prescription drugs in the five classes were calculated using CMR data from January 1994
to April 2001. Nexium®, advertised only from June 2001, was included only in the
descriptive analyses for the gastrointestinals.
Access to Care (Health Insurance Coverage)
The access to care variable identifies the source of payment for physician visits.
The 1994 NAMCS provided the following choices for expected sources of payment:
HMO/other prepaid, Medicare, Medicaid, other government, private/commercial
insurance, patient paid, no charge, other, and unknown.431 The choices changed for 1995
and 1996 to: no source listed, preferred provider option, insured fee for service,
HMO/other prepaid, self-pay, no charge, other, Blue Cross Blue Shield, other private
insurance, Medicare, Medicaid, worker’s compensation, and unknown.432 From 1997 the
choices offered were: no box is marked, private insurance, Medicare, Medicaid/SCHIP,
worker’s compensation, self-pay, no charge/charity, other, and unknown.433
For the purpose of the study, when source of payment was self-pay (patient paid)
or unknown, it was assumed that the patient did not have health insurance coverage and
the physician visit was assumed to be paid for by the patient. When no charge was
applied or was marked as charity, the visits were coded separately. In all other cases,
physician visits were assumed to be covered by a third party entity such as government or
431 1994 National Ambulatory Medical Care Survey: Data File Documentation: National Center for Health Statistics, Centers for Disease Control and Prevention; 1994:1-2.
432 1996 National Ambulatory Medical Care Survey: Data File Documentation: National Center for Health Statistics, Centers for Disease Control and Prevention; 1996:1-2.
433 2001 NAMCS Micro-data File Documentation: National Center for Health Statistics, Centers for Disease Control and Prevention; 2001:28.

204
private insurance. Access to care, for the purpose of the study, was coded as having
health insurance coverage, no health insurance coverage, or charity.
For the dependent variable number of physician visits per month for each drug
class, the percentage of individuals who visited the doctor and had health insurance
coverage was calculated. For dependent variables number of prescriptions written and
prescription drug expenditures, for each month and by drug, the percentage of individuals
with health insurance coverage among those who received a prescription for the drug was
calculated.
Demographics: Age and Gender
NAMCS calculates age in years from the date of birth. NAMCS reported that
patients of age 45 years and older accounted for 53.1 percent of the physician visits in
2001, up from 42.3 percent in 1992 (increased by 26.0%). The greatest increase in visits
were for individuals 45 years and older.434 For the purpose of analyses, age was
categorized into two groups: Less than 45 years, 45 years and older. Specifically for two
drugs classes (gastrointestinals and antidepressants), age has been reported to play a very
important role. The use of antidepressants and gastrointestinals has been reported to
increase with age.435 Age effects for these two drug classes were further explored with a
finer classification of age groups. In addition to the continuous age variable, NAMCS
also categorizes age into the following: less than 15 years, 15-24 years, 25-44 years, 45-
434 Cherry DK, Burt CW, Woodwell DA. National Ambulatory Medical Care Survey: 2001 Summary. National Center for Health Care Statistics/Centers for Disease Control and Prevention: Advance data report No. 337. August 11, 2003. Available at: http://www.cdc.gov/nchs/data/ad/ad337.pdf. Accessed January, 2004.
435 Health care in America: Trends in utilization. US Department for Health and Human Services, Centers for Disease Control and Prevention, National Center for Health Care Statistics. January 2004. Available at: http://www.cdc.gov/nchs/data/misc/healthcare.pdf. Accessed February, 2004.

205
64 years, 65-74 years, and 75 years and older. Since majority of the drug classes selected
for the study are used to treat chronic conditions, age groups less than 15 years and 15-24
years were combined into one category and the elderly were represented as 65 years and
older.
For the analyses with number of physician visits as the dependent variable, for
each drug class, age was calculated as follows for each month:
(a) Among individuals with physician visits for symptoms and/or conditions treated by
the different drug classes, the percentage of individuals 45 years and older were
calculated for the respective classes;
(b) For gastrointestinals and antidepressants, the percentage of patients who saw a doctor
for symptoms and/or conditions treated with gastrointestinals and antidepressants and
were 25 to 44 years, 45 to 64 years and 65 years and older was calculated.
For the analyses with number of prescriptions written and expenditures for
advertised drugs as the dependent variables, age was calculated as follows for each
month:
(a) For each drug, among individuals who received a prescription for the advertised drug,
the percentage of individuals 45 years and older was calculated.
(b) Gastrointestinals and antidepressants: For each advertised gastrointestinal and
antidepressant, the percentage of individuals 25 to 44 years, 45 to 64 years and 65
years and older were calculated.
In the NAMCS dataset, gender was recorded as a dichotomous variable and this
variable was used to calculate the percentage of women. For the dependent variable

206
physician visits, the percentage of patients with physician visit for the different classes of
drug therapies who were women was calculated. For the dependent variables number of
prescriptions written and expenditures, among those who received a prescription for an
advertised drug from the five drug classes, the percentage of women was determined.
Prescription Drug Expenditures
Prescription drug expenditures were defined as the monthly national prescription
drug expenditures in U.S. dollars for the advertised drugs from the five therapeutic drug
classes selected for the study from January 1994 through April 2001.
Drug expenditures for each month were calculated as follows:
Prescription drug expenditures = Number of prescriptions written x Estimated drug pricefor each month for each month
Estimated drug price = AWP + DFAWP = Average wholesale price, DF = Dispensing fee
The AWPs for a 30-day supply for all the drugs were identified for the years they
were available in the market and were used in the estimation of prescription drug price.
The estimated price of the drug was calculated as the sum of the AWP and average
dispensing fee for each year obtained from the Novartis Benefit Reports. The average
dispensing fee (overall) was used as listed in the benefit reports for 1994 and 1995. From
1996 onwards, the average dispensing fee for network pharmacy was used.436 The drug
expenditures were calculated as a product of the estimated price of the prescription and
number of prescriptions written each month (Appendix B – AWP for all drugs).
436 Novartis. Facts and Figures. East Hanover, NJ: Novartis Pharmaceuticals Corporation and Emron; 1995-2002 editions.

207
Table 4.2: United States City Average Consumer Price Index and Annual Percent Change in Price Index for Prescription Drugs and Medical Supplies and the
Average Dispensing FeesYear Average Consumer Price
Index ($)Percent change
(%)Dispensing
Fees($)
1994 230.6 3.4 2.6451995 235.0 1.9 2.501996 242.9 3.4 2.231997 249.3 2.6 2.2651998 258.6 3.7 2.021999 273.4 5.7 2.032000 285.4 4.4 2.0752001 300.9 5.4 2.042002 316.5 5.2 --2003 326.3 3.1 --
Source for US City Average Consumer Price Index and Annual Percent Change for Prescription Drugs and Medical Supplies: Public Data Query: Consumer Price Index (All Urban Consumers). U.S. Department of Labor: Bureau of Labor Statistics. Available at: http://data.bls.gov/labjava/outside.jsp?survey=cu. Accessed September 2004Source for Dispensing Fees: Novartis. Facts and Figures. East Hanover, NJ: Novartis Pharmaceuticals Corporation and Emron; 1995-2002 editions.
The AWP for the following six drugs were not available for certain years:
Lescol® –1994, Prevacid® - 1995, Allegra® - 1996, Coreg® - 1997, Lipitor® - 1997,
and Lotronex® - 2000. Using the annual percent change in average consumer price index
for prescription drugs and medical supplies (Table 4.2) from the Bureau of Labor
statistics, the missing AWPs were calculated. Following is the table of inflation rates or
annual percent change in price index for prescription drugs and medical supplies and the
average dispensing fee.
Lotronex® was introduced in February 2000 and withdrawn in November 2000
and reintroduced in 2002. Only the 2003 AWP for Lotronex® was available. This AWP
for Lotronex® for 2003 was decreased using the annual percent change values from 2003
to 2000 and the AWP for the year 2000 was calculated.

208
Number of Prescriptions Written for Advertised Drugs
The frequency of new prescriptions written per month for the advertised drugs
from the five therapeutic classes studied was interpreted as the utilization of advertised
drugs. From 1994 to 1995, NAMCS recorded up to five prescriptions written. From 1996,
NAMCS recorded up to six medications prescribed. The drugs in NAMCS database are
coded based on a unique coding system developed by the National Center for Health
Statistics (NCHS).437 Using these codes, the number of new prescriptions written each
month for all advertised drugs from the five classes listed in Table 4.1 was calculated.
Physician Visits
Physician visits were measured as the frequency of office visits for the purpose of
seeking or rendering care. NAMCS collects data on the symptoms associated with
physician visits and records up to three fields for reason for visit or initial complaints or
symptoms or existing conditions (disease code). These are recorded in the order of “most
important” and two “other” complaints or symptoms. The “most important” is the
problem or symptom, which in the physician's judgment, was responsible for the patient’s
visit. NAMCS uses a unique coding scheme to record the symptoms related to the
visits.438 The symptoms and existing conditions were coded in these three fields.
In addition to symptoms or complaints, NAMCS also records up to three
diagnoses per visit: primary diagnosis and two fields for additional diagnoses. These
fields record the physician’s primary diagnosis for this visit and other conditions
437 2001 NAMCS Micro-data File Documentation: National Center for Health Statistics, Centers for Disease Control and Prevention; 2001:5-22.
438 2001 NAMCS Micro-data File Documentation: National Center for Health Statistics, Centers for Disease Control and Prevention; 2001:5-22.

209
including chronic conditions (e.g., hypertension, depression, etc.) if related to this visit.
The codes used for diagnoses were from the International Classification of Diseases – 9th
edition – Clinical Modification Mode.439 The following are the symptoms or complaint
codes and ICD-9 CM codes used to identify physician visits for the symptoms and/or
conditions treated by the selected drugs from the five drug classes.
Allergy Medications
The symptom codes for allergic rhinitis were:
1400.0 - Nasal congestion {includes drippy nose, runny nose, post-nasal drip, sniffles,
stuffy nose, nasal congestion, nasal obstruction, excess mucus};
1310.2 - Tearing, watering {eyes}; and
1485.0 - Other symptoms referable to the respiratory system {drainage in throat}.
The patients seeking care for an existing problem {allergic rhinitis} in the initial
complaint fields were listed as disease code:
2635.0 - Hay fever {includes allergic rhinitis, nasal allergy, pollenosis, allergy to dust,
pollen, animals, ragweed}.
All diagnoses pertaining to allergic rhinitis were captured using the ICD-9 CM
codes 477.0, 477.8, and 477.9.
Antilipemics
NAMCS does not list any codes for initial complaints for high cholesterol level or
hyperlipidemia. As a result, physician visits for antilipemics were determined using
diagnoses for hyperlipidemia that were captured using the ICD-9 CM codes 272.0 to
272.4.
439 International Classification of Diseases, 9th Revision, Clinical Modification. 6th ed: U.S. Department of Health and Human Services, Centers for Disease Control and Prevention,Health Care Financing Administration; October 1999.

210
Gastrointestinals
The codes for symptoms treated using gastrointestinals were:
1535.0 – Heartburn and indigestion {dyspepsia} includes excessive belching;
1545.0 – Stomach and abdominal pain, cramps and spasms {includes gastric pain};
1545.1 – Abdominal pain, cramps and spasms {includes abdominal discomfort, NOS, gas
pains, intestinal colic};
1545.3 - Upper abdominal pain, cramps, spasm {epigastric pain, left upper quadrant
pain};
1580.1 – Blood in stool; and
1580.2 – Vomiting blood.
Patients seeking care for an existing problem treated with gastrointestinals were coded as:
2650.0 - Disease of the esophagus, stomach and duodenum {includes: esophagitis,
duodenal ulcer, peptic ulcer, gastritis, stomach ulcer}.
The ICD-9 CM codes selected to capture conditions treated with gastrointestinal were:
530.1 - Esophagitis {alkaline, chemical, chronic, infectional, necrotic, peptic;
postoperative, regurgitant}, inflammation of esophagus;
530.11 - Esophagitis {Reflux esophageal with esophagitis};
530.81 - Reflux esophageal {gastroesophageal};
531-534 - Ulcer {Duodenal, peptic, gastric};
564.10 - Irritable bowel syndrome {irritable colon, spasm};
041.86 - H. Pylori;
251.50 - Ellison-Zollinger {gastric hypersecretion with pancreatic islet cell tumor}; and
787.1 – Heartburn.
Lotronex® is the only drug among the gastrointestinals selected that is indicated
for irritable bowel syndrome and was available only from February 2000 to November

211
2000. The ICD-9 CM code for irritable bowel syndrome was captured for only that time
period.
Antidepressants
The symptoms or initial complaints that are treated using antidepressants selected
for the study were captured using the following symptom codes:
1100.0 - Anxiety and nervousness {includes: apprehension, bad nerves, jittery, panicky
feeling, stress, tension, upset, worried};
1105.0 - Fears and phobia {includes: general fearfulness, agoraphobia};
1110.0 - Depression {includes: crying excessively, dejected, distress, feeling down, grief,
hopelessness, sadness, unhappy};
1120.0 - Problems with identity and self- esteem {Includes: co-dependency, dependency,
don’t like myself, guilt, helpless, identity crisis, insecurity, emotional, lack of
motivation, loss of identity, no confidence, no goals, poor boundaries, too much
is expected of me};
1130.1 – Antisocial behavior {includes: avoiding people, excessive symptoms, lying,
social isolation, withdrawal};
1130.5 - Obsessions and compulsions;
1135.1 - Insomnia {includes: can’t sleep, sleeplessness, trouble falling asleep};
1135.2 - Sleepiness {hypersomnia} {includes: can’t stay awake, drowsiness}; and
1165.0 - Other symptoms related to psychological and mental disorders {includes:
blunted affect, can’t cope, constricted affect, déjà vu feelings, disoriented,
difficulty concentrating, frustration, going crazy, hate everybody, inhibited,
learning disability, losing my mind, mood fluctuation, mood swings, non-
communicative, peculiar thinking, psychological problems, trouble
concentrating, wandering around}.
The patients seeking treatment for an existing problem treated with
antidepressants were identified with the following disease codes:

212
2310 - Neuroses {includes: anxiety reaction, depressive neurosis, depressive reaction,
neurosis, obsessive compulsive neurosis} excludes anxiety and depression
{Excludes: 1100.0 and 1110.0 symptom codes}; and
2315 - Personality and character disorders.
The ICD-9 CM codes used to capture diagnoses for conditions treated with the
antidepressants selected for the study included:
300, 293.84, 300.4, 300.02, 300.2, 308.0, 300.01, 309.21, 293.84 - Anxiety;
783.6, 307.51 {nonorganic} - Bulimia Nervosa ;
311, 296.82, 296.2, 296.3 - Depressive disorder;
300.02 - Generalized anxiety;
300.3, 301.4 - Obsessive compulsive;
300.01, 300.21 - Panic disorder;
309.81, 308.3 - Posttraumatic stress disorder;
625.4 - Premenstrual dysphoric disorder;
300.23 - Social anxiety disorder or Social phobia;
Antihypertensives
The symptoms codes related to hypertension were:
1260.0 – Abnormal pulsations and palpitations;
1260.1 – Increased heartbeat {pulse too fast, rapid heartbeat};
1260.3 – Irregular heartbeat {fluttering, skipped beat};
1265.0 – Heart pain {includes heart distress, anginal pain, pain over heart}{excludes
angina pectoris, chest pain}; and
1270.0 – Other symptoms of the heart {includes bad heart, poor heart, weak heart, heart
condition}.
The disease code for hypertension was identified as
2505.0 – hypertension with involvement of target organs; and
2510.0 - hypertension.

213
The ICD-9 CM codes used to identify diagnoses pertaining to hypertension were
401.0, 401.1, 401.9 – Hypertension {arterial, arteriolar, crisis, degeneration, disease,
essential, fluctuating, idiopathic, intermittent, labile, low rennin,
orthostatic, paroxysmal, primary, systemic, uncontrolled, vascular,
malignant, benign, unspecified}.
To operationalize the physician visit variable, a dichotomous variable was created
for each of the five drug classes to identify patients who reported above mentioned
symptoms and/or conditions in the initial complaints field and/or diagnoses fields. For
each drug class, if any of the above mentioned “reason for visit” codes, disease codes
and/or ICD-9 codes for symptoms and/or conditions treated by that drug class were
reported in the initial complaint fields or the diagnoses field, then the dichotomous
variable for visit was set to equal one. This means that the patient was reported to have a
symptom or reported an existing problem and/or was diagnosed with a condition that the
respective drug class treats. The monthly frequency of visits for these symptoms or
disease and/or diagnoses (for each drug class) was calculated. For example, the monthly
frequency of allergy-related visits was calculated as: the monthly frequency of visits
when patients reported symptoms of allergy or existing problem/disease allergic rhinitis
(hay fever) and/or were diagnosed with allergic rhinitis.
DATA ANALYSIS
The data from NAMCS were first adjusted using the weights for population-level
data. Following this adjustment, data were aggregated by month and by drug for each

214
therapeutic class of agents for the two time periods and merged with the DTCA
expenditures for the drugs and their drug expenditures. DTCA expenditures and
prescription drug expenditures were the aggregate national expenditures for each month.
Descriptive analyses or the trends for the different variables, time series and mixed model
analysis for repeated measures data were used to test the relationships between the
variables. For time series and mixed model analyses, all DTCA expenditures and drug
expenditures were adjusted to 2001 dollars. The significance level was set at p=0.05 and
the statistical packages SAS version 8.0 and SPSS version 12.0 were used for
analyses.440,441
Time Series Analysis
The physician visit data were month-level data, and to facilitate the testing of the
first objective regarding the predictors of physician visits, a time series analysis was used.
The time series analysis using ordinary least squares (OLS) regression determines the
relationship between the independent variables in the model with the dependent variable.
The four basic assumptions for a time series regression are: (a) Linearity - the
relationship between the independent and dependent variable is linear; (b) Nonstochastic;
(c) Zero mean and constant variance; and (d) Nonautoregression or the errors at different
time points are not correlated.442
However, with time series data, the ordinary regression residuals are usually
correlated over time. As a result of the violation of the assumption of independence of
440 SAS. Version 8.0. Cary, NC.441 SPSS. Version 12.0. Chicago, IL.442 Ostrom CW. Time Series Analysis: Regression Techniques. Thousand Oaks, California: Sage
Publications.

215
errors, the significance of the parameters and confidence limits of predicted values are
not correct and the estimates of the regression coefficients are not as efficient as they
would be if autocorrelation was taken into account. The autoregression procedure
augments the regression model with an autoregressive model for random error and
thereby accounts for the autocorrelation of errors.443
Ykm = µy + βyx(Xk- µx) + ekm
Ykm = Dependent variable Y for drug class k for month mXk = Independent variable X for drug class k for month mµ = Intercept, e = error
In addition, the Durbin-Watson statistic was calculated to test the likelihood of
serial correlation between the error terms. The Durbin-Watson statistic is calculated as
∑ (êt - êt-1)2
D = t
∑ êt2
têt = ρ êt-1 + ut
The error term in the model ê at time t (month) consists of a fraction of the
previous error term ρ (when ρ > 0) and a new disturbance term ut. The parameter ρ is also
called the autocorrelation parameter. The Durbin-Watson tests the serial correlation: H0:
ρ = 0, HA: ρ ≠ 0. If the hypothesis for no serial correlation is not supported {i.e., presence
of autocorrelation (positive or negative)}, the Yule-Walker method (Prais-Winsten
estimates), a modification of the Cochrane-Orcutt method, was used to correct the
autocorrelation in the model. The Cochrane-Orcutt method is the primitive version of the
443 Documentation for SAS Version 8: Regression with autocorrelated errors. SAS Institute, NC. Available at: http://support.sas.com/documentation/onlinedoc/index.html. Accessed August 2004.

216
Yule-Walker method for the first order autoregression, except the Yule-Walker method
retains information from the first observation.444
Table 4.3 provides an example of the dataset to be used to test the first objective
for the dependent variable physician visits.
Table 4.3: Example Dataset for Time Series Analysis for Dependent Variable Physician Visit
Month Total DTCA ($000)
Age:% 45 yrs &
older
Gender:%
Women
Coverage:% With
Coverage
Visits#
Time
Jan-94 $0.00 56.3 48.6 79.5 20,000 1Feb-94 $0.00 56.3 54.4 89.6 4,305,048 1Mar-94 $1,204.50 56.2 49.8 85.3 4,046,507 1
April-94 $3,571.70 77.1 57.9 87.7 2,511,470 1Time 1- January 1994 to August 1997Time 2 – September 1997 to April 2001
The variables age, gender, and health insurance coverage include: Among
individuals with doctor’s visit for conditions the drugs from each of the five drug classes
treat, percentage of individuals 45 years and older, percentage women and percentage of
individuals with health insurance coverage.
The dataset was split by time period and reanalyzed to determine if relationships
were significant for each time period: (a) January 1994 to August 1997; and (b)
September 1997 to April 2001. Figure 4.2 provides an outline of the time series analyses.
The dataset for the entire time period from January 1994 to April 2001 (monthly
data) was analyzed using time series analysis. For Objective IV, the dataset was split by
time period from January 1994 to August 1997 and September 1997 to April 2001. The
Durbin-Watson statistic was used to test the null hypothesis for serial correlation. In the
444 Documentation for SAS Version 8: Alternate autocorrelation correction methods. SAS Institute, NC. Available at: http://support.sas.com/documentation/onlinedoc/index.html. Accessed August 2004.

217
presence of autocorrelation, data was adjusted using Yule-Walker method. The linearity
assumption was checked with scatter plots. However, to adjust for the large values and
skewness, DTCA expenditures and visits were transformed to logarithmic values and the
analysis (Figure 4.2) was repeated to check if any new variables emerged significant.
Figure 4.2: Outline for Time Series Analysis
Mixed Model Analyses
For the dependent variables number of prescriptions written and drug
expenditures, data were represented for each month and each drug. Mixed model analysis
was used because it takes into account the consequence of repeated measurements over
Interpret
Positive/Negative Autocorrelation or
Inconclusive
Adjust using Yule-Walker Method
No autocorrelation
Time Series Analyses:Entire time period: Jan.’94-Apr.’01
Split by time period: Jan.’94-Aug.’97 and Sept.’97-Apr.’01
Calculated Durbin-Watson Statistic

218
time, time itself, the autoregressive covariance structure of data and effects of the random
variable or the subject, in this case “drug.”
The mixed model analysis is a generalization of the standard linear model used in
the general linear modeling procedure, the generalization being that the data are
permitted to exhibit correlation and nonconstant variability. Mixed model analysis
provides the flexibility of modeling not only the means of the data (as in the standard
linear model), but also their variances and covariances as well. The primary assumptions
underlying the mixed model analyses are as follows: (a) The data are normally
distributed; (b) The means (expected values) of the data are linear in terms of a certain set
of parameters; and (c) The variances and covariances of the data are in terms of a
different set of parameters and may display one of the following structures:
Autoregressive, compound symmetry, unstructured.445
The parameters of the mean model are fixed-effects parameters, and the
parameters of the variance-covariance model are the covariance parameters. The
covariance parameters are what distinguish the mixed model from the standard linear
model. The need for covariance parameters arises typically in the following two
scenarios: Clustered data (data from a common cluster are correlated); and Repeated
measurements taken (repeated measurements are correlated or exhibit variability that
changes).446 The data for the current study include repeated measures or responses
445 Documentation for SAS Version 8: Overview for mixed models. SAS Institute, NC. Available at: http://support.sas.com/documentation/onlinedoc/index.html. Accessed August 2004.
446 Documentation for SAS Version 8: Overview for mixed models. SAS Institute, NC. Available at: http://support.sas.com/documentation/onlinedoc/index.html. Accessed August 2004.

219
measured for each drug over a period of time and the possibility exists that the outcome
variables or dependent variables might be correlated.
If the responses measured are close in time then they are very highly likely to be
correlated. In addition, variances for repeated measures design change with time. These
potential patterns of correlation and variation patterns combine to produce a complicated
covariance structure of repeated measures. Mixed model methodology enables users to
address the covariance structure.447 The covariance structure for the data was
autoregressive of order one because the data are measured over time. In addition, the
autoregressive covariance structure specifies the covariance between two measurements
separated by a certain time interval and measures the correlation between adjacent
measurements separated by one time interval.448
Furthermore, the effects of the independent variables and overall effects can be
assessed in a single model over time and the covariance pattern of the data, in this case
the autoregressive covariance pattern, was taken into account. In addition, the interaction
of the independent variable with the variable time period compared the relationships
across the two time periods.
Missing data in the dependent variable does not pose much of a problem when
fitting a covariance pattern model and it even leads to more appropriate fixed effects
estimates and standard errors. The procedure does not automatically remove the lines of
447 Littell RC, Henry PR, Ammerman CB. Statistical analysis of repeated measures data using SAS procedures. Journal of Animal Science. 1998;76:1216-1231.
448 Littell RC, Milliken GA, Stroup WW, et al. Analysis for Repeated Measures Data. SAS System for Mixed Models. Cary, North Carolina: BBU Press; 1996:87-134.

220
data if values for the dependent variable are missing because the mixed model uses
likelihood-based estimation.449
An example of the dataset for mixed model analyses is provided in Table 4.4.
Data for all the variables in the model for the mixed model analyses are expressed as
monthly data for the advertised drug. For example, data for January 1994 for Drug A
included:
a) Advertising expenditure for drug A; b) Number of physician visits for symptoms and/or conditions that drug A treats;c) Number of prescriptions written for drug A; d) Total expenditures for Drug A; e) Among those who received a prescription for drug A –
∗ Percentage of individuals 45 years and older;∗ Percentage of women; and∗ Percentage of individuals with health insurance coverage.
Table 4.4: Example Dataset for the Mixed Model AnalysesMonth
mDrug
jTotal
DTCA ($000)
Age: 45 yrs & older
(%)
Gender:
Women(%)
Access: With
Coverage(%)
Visits#
# Rxs Expend-itures($000)
Timet
Jan-94 A $50 55.3 59.1 80.3 20,0000 40,000 $2,120 1Jan-94 B $20 70.4 50.5 90.4 20,0000 35,000 $1,750 1
Sept-97 A $1,250 42.2 45.3 95.5 40,0000 50,000 $3,100 2Sept -97 C $1,000 33.3 60.5 97.5 40,0000 10,000 $250 2
Time 1- January 1994 to August 1997Time 2 – September 1997 to April 2001
Accounting for the effect of the two time periods, two regression models for each
of the dependent variables (number of prescriptions written and prescription drug
expenditures) were analyzed. Let us assume that drugs j of class k are used to treat
symptoms or disease h. These drugs j are advertised and the monthly effects along with
patient demographics are observed for month m. The two time periods, January 1994 to
449 Wolfinger R, Chang M. Comparing the SAS GLM and mixed procedures for repeated measures. SAS Institute Inc., NC. March 30, 2000. Available at: http://support.sas.com/rnd/app/papers/mixedglm.pdf. Accessed May 2000.

221
August 1997 and September 1997 to April 2001 will be denoted as t. The two dependent
variables include utilization or number of prescriptions written for the advertised drug
and the monthly expenditures for the drug.
Yj = Xjmβ +Zjmbjm +εjm,
Xjm are the covariates and β is the regression coefficient for the subject-specific
effects or the random effects. β also helps explain the variability in the subjects, in this
case the drugs. Zjmbjm denotes the fixed effects in the model. In the following equations,
Zjmbjm is denoted by αj (fixed effects).
Ujm= αj+ γt + εjmRjm= αj+ γt + εjm
Where αj = b1Ijm + b2Ajm + b3Gjm+ b4DTCAjm+ b5Vjm
γt = Time trend.
Ujm = Number of prescriptions written for drug j during month m.
Rjm = Expenditures for drug j for month m.
εjm = Error or the residual components.
Ijm = Percentage of individuals who were prescribed the drug j and had coverage during
month m.
Ajm = Percentage of individuals who were prescribed drug j at time m and were 45 years and
older.
Gjm = Among individuals prescribed drug j during month m, percentage of women.
Vjm = Number of physician visits for the symptom or disease the advertised drug j treats.
DTCAjm = Advertising expenditures for drug j for month m.
Figure 4.3 provides a diagrammatic representation of the mixed model analyses.
DTCA expenditures, physician visits, number of prescriptions written and drug
expenditures had very large values and were skewed. Logarithmic transformations were
applied to the DTCA expenditures variable {log of (DTCA Expenditures +1) – one was

222
added since some values were zero}. The distribution of the dependent variables number
of physician visits, number of prescriptions written and drug expenditures were evaluated
and appropriate transformations (square root or logarithmic) were applied to adjust for
the skewness.
The visit variable was month-level data and all other variables in the mixed model
analyses were drug and month-level data. In order to determine if the variable visit was
suppressing effects of other variables or distorting the results, the mixed model analyses
for dependent variables number of prescriptions written and expenditures were repeated
without the visit variable.
Figure 4.3: Outline for Mixed Model Analysis
Mixed Model Analysis With Transformed Variables (Visits, DTCA
Expenditures, Prescriptions Written and Expenditures)
Mixed Model Analysis With Untransformed Variables (Visits, DTCA Expenditures, Prescriptions Written and Expenditures)
Split model by time period and analyze with Transformed Variables (Visits, DTCA Expenditures, Prescriptions
Written and Expenditures)

223
CHAPTER 5: RESULTS
Chapter 5 will present the results of the descriptive, time series and mixed model
analyses. The first section of the chapter will describe the overall trends in DTCA
expenditures. The second section will present the descriptive results for each of the five
drug classes including trends in DTCA expenditures, physician visits, number of
prescriptions written and prescription drug expenditures and also describe the
demographic characteristics of the population (age, gender, insurance coverage) for the
visits and prescriptions written. The last section will present the time series and mixed
model analyses results for each of the four objectives outlined in the previous chapter.
SECTION I: TRENDS IN DTCA EXPENDITURES
The data on DTCA expenditures from CMR included advertising expenditures for
each month by drug, company and media outlet. Figure 5.1 shows the trend in advertising
expenditures by type of advertisement, namely product-specific, disease-specific,
institutional, and advertisements for the Pharmaceutical Research and Manufacturers
Association (PhRMA). From 1994 to 2001, the greatest proportion of advertising dollars
were spent on product-specific advertisements followed by disease-specific and
institutional advertisements. From 1994 to 2001, compared to the other types of
advertisements, the product-specific advertising had the greatest increase in expenditures.

224
Institution, disease-specific and PhRMA advertising accounted for a relatively small
proportion of the total DTCA expenditures.
Figure 5.1: Trends in DTCA Expenditures by Type of Advertisement, 1994-2001
$0
$500
$1,000
$1,500
$2,000
$2,500
$3,000
1994 1995 1996 1997 1998 1999 2000 2001
Year
DT
CA
Exp
end
iutr
es (
$ in
mill
ion
s)
Product-Specific Institutional Disease-Specific PhRMA
Table 5.1 provides the distribution of advertising expenditures not only by type of
advertisement, but also by media outlet to provide a better understanding of the allotment
of advertising dollars from 1994 through 2001. A total of $9.7 billion was spent on
product-specific advertising, of which $5.0 billion was spent on advertising via broadcast
media from 1994 through 2001. A greater proportion of the advertising dollars were
spent on product-specific advertising via print and broadcast media. The expenditures for
product-specific DTCA via broadcast media have increased sharply since 1995. The
DTCA expenditures for product-specific advertising via broadcast media increased from

225
$39.8 million in 1995 accounting for 11.4 percent of total DTCA expenditures to $173.7
million in 1996 accounting for 24.6 percent of total DTCA expenditures. In 1998, print
advertising, for the first time decreased to $580.4 million from $677.1 million in 1997
and advertising dollars spent on broadcast media increased dramatically from $176.7
million in 1997 to $628.3 million in 1998, accounting for 52.0 percent of the total
product-specific advertising expenditures. By 2001, the total product-specific DTCA
expenditures had risen to $2,476.0 million, of which $1,616.9 million (65.3%) was spent
on advertising via broadcast media.
Table 5.1: DTCA Expenditures (in millions) by Advertisement Type and Media Outlet, 1994-2001
DTCA Expenditures Product-Specific Disease-Specific Institutional PhRMA
YearPrint and
Other*Television/
RadioPrint and
Other*Television/
RadioPrint and
Other*Television/
RadioPrint and
Other*Television
/Radio1994 $221.35 $34.19 -- -- $23.33 $19.33 -- --1995 $310.30 $39.80 -- $0.01 $22.33 $38.44 $0.50 $3.701996 $531.88 $173.69 -- -- $35.95 $105.83 $0.79 $0.071997 $677.11 $176.65 $39.71 $81.14 $34.88 $61.29 $14.31 $6.601998 $580.43 $628.26 $32.47 $77.65 $16.03 $20.30 $11.98 $6.901999 $675.21 $919.51 $39.33 $199.79 $14.62 $37.34 $12.89 $10.492000 $795.01 $1,458.47 $62.15 $149.07 $31.15 $45.14 $11.68 $10.942001 $859.07 $1,616.91 $75.29 $121.53 $38.09 $32.41 $21.41 $11.75Total $4,650.35
47.95%$5,047.4852.05%
$248.9528.35%
$629.1971.65%
$216.3737.53%
$360.0962.47%
$73.5859.32%
$50.4540.68%
* Other- outdoor advertisements (billboards)
For disease-specific and institutional or company specific advertisements, the
majority of the dollars was allotted for advertising via broadcast media. A total of $629.2
million (71.7%) and $360.1 million (62.5%) were spent on advertising via broadcast
media for disease-specific and institutional advertisements, respectively. PhRMA had the
lowest DTCA expenditures ($124.0 million, 1.1%) compared to the other types of

226
advertisements and over half of the advertising dollars (59.3%, $73.6 million) were spent
on print and outdoor advertisements (Table 5.1).
The total DTCA and product-specific DTCA expenditures by media outlet and the
percent change in total DTCA and product-specific DTCA expenditures were examined
(Table 5.2). The proportion of DTCA expenditures for print/other and television/radio
changed in 1998 with a decrease in expenditures for print and other and an increase in
expenditures for broadcast media. It was also noted that after 1997 a greater proportion of
the DTCA expenditures were for broadcast media.
Table 5.2: Proportion and Percent Change in Total DTCA Expenditures and Product-Specific DTCA Expenditures by Media Outlet, 1994-2001
DTCA All DTCA Product-SpecificProportion Percent Change Proportion Percent Change
YearPrint and
Other*Television/
RadioPrint and
Other*Television/
RadioPrint and
Other*Television/
RadioPrint and
Other*Television/
Radio1994 82.05% 17.95% -- 86.62% 13.38% -- --1995 80.26% 19.74% 36.15% 53.12% 88.63% 11.37% 40.19% 16.42%1996 67.04% 32.96% 70.69% 241.15% 75.38% 24.62% 71.41% 336.40%1997 70.17% 29.83% 34.71% 16.49% 79.31% 20.69% 27.30% 1.71%1998 46.64% 53.36% -16.33% 125.10% 48.02% 51.98% -14.28% 255.65%1999 38.87% 61.13% 15.78% 59.20% 42.34% 57.66% 16.33% 46.36%2000 35.11% 64.89% 21.28% 42.54% 35.28% 64.72% 17.74% 58.61%2001 35.80% 64.20% 10.43% 7.15% 34.70% 65.30% 8.06% 10.86%
* Other – Outdoor Advertisements (billboards)
Figure 5.2 describes the total advertising expenditures by media outlet from 1994
through 2001. A total of $11.3 billion was spent on DTCA from 1994 through 2001.
Broadcast media advertising accounted for over half (54.0%, $6.1 billion) the total
DTCA expenditures. Since 1997, advertising expenditures for broadcast media have risen
sharply whereas the growth in print and billboard advertisements has not. In 1994, a total
of $298.2 million was spent on DTCA of which 82.1 percent ($244.7 million) was spent
on print and billboard advertisements. While total DTCA expenditures were increasing

227
each year to $1,091.7 million in 1997, the proportion spent on print and billboard
advertisements decreased to 70.2 percent ($766.0 million) during that year.
Figure 5.2: Trends in DTCA Expenditures for Television/Radio and Print and Other Media, 1994-2001
$0
$500
$1,000
$1,500
$2,000
$2,500
$3,000
1994 1995 1996 1997 1998 1999 2000 2001
Year
DT
CA
Exp
endi
ture
s ($
in
Mill
ions
)
Television/Radio
Print andOther
In 1998, 53.4 percent ($733.1 million) of the total advertising dollars ($1,374.0
million) was spent on advertising via the broadcast media and the DTCA expenditures for
broadcast media have been consistently increasing each year, accounting for 64.2 percent
($1,782.6 million) in 2001. The total DTCA expenditures increased by 154.3 percent
from 1997 to 2001. While the proportion spent on advertising via print and billboards
increased by 29.7 percent from 1997 to 2001, expenditures for broadcast media increased
by 447.3 percent.
This study’s focus is specifically on advertised drugs from five drug classes.
Figure 5.3 provides the trend in DTCA expenditures for product-specific advertisements
by media outlet from 1994 through 2001. The figure shows the increase in advertising
dollars spent on broadcast media since 1997 following the relaxation of guidelines for
broadcast advertising.
Note: Other –Outdoor advertisements (Billboards)

228
Figure 5.3: Trends in DTCA Expenditures for Product-Specific (Prescription Drugs) Advertising for Television/Radio and Print and Other Media, 1994-2001
$0
$500
$1,000
$1,500
$2,000
$2,500
$3,000
1994 1995 1996 1997 1998 1999 2000 2001
Year
DT
CA
Exp
endi
ture
s ($
in m
illio
ns)
Television/Radio
Print andOther
The proportion spent on advertising via broadcast media increased from 13.4
percent ($34.2 million) in 1994 to 20.7 percent ($176.7 million) in 1997. However, the
expenditure ratios changed dramatically in 1998 with expenditures for advertising via
broadcast media increasing to 52.0 percent ($628.3 million). In 2001, the amount spent
on advertising via broadcast media increased to $1,616.9 million, accounting for 65.3
percent of total product-specific DTCA expenditures.
Table 5.3 provides advertising expenditures for the five drug classes selected for
the study from 1994 to 2001 by media outlet. Among the five classes, allergy medications
($1,964.0 million) had the highest expenditures for advertising from 1994 through 2001
followed by antilipemics ($840.2 million). The greater proportion of the advertising
dollars for allergy medications (57.4%), gastrointestinal drugs (53.9%) and
antidepressants (64.6%) were spent on broadcast media. Antilipemics and
antihypertensives were mainly advertised via print and billboards.
Note: Other –Outdoor advertisements (billboards)

229
The number of months represent the total sum of months each drug class was
advertised or the sum of months of advertising for all drugs in that class. The DTCA
expenditures increased with the number of the months the drugs in that class were
advertised.
Table 5.3: DTCA Expenditures by Media Outlet and Total DTCA Expenditures for Allergy Medications, Antilipemics, Gastrointestinals,
Antidepressants and Antihypertensives from 1994 through 2001Drug Class
[row%]Television/Radio
[in millions]Print and Other
[in millions]Number of
Months Advertiseda
Total DTCA Expenditures[in millions]
Allergy Medications $ 1127.55[57.41%]
$836.48 [42.59%]
357 $1,964.02[100.00%]
Antilipemics $ 403.70[48.05%]
$436.53 [51.95%]
187 $840.24[100.00%]
Gastrointestinals $ 283.33 [53.85%]
$242.86[46.15%]
119 $526.19[100.00%]
Antidepressants $ 268.80 [64.59%]
$147.37 [35.41%]
117 $416.17[100.00%]
Antihypertensives $ 9.32 [11.57%]
$711.821[88.43%]
87 $80.50[100.00%]
Total $2092.70[45.32%]
$1734.42[54.68%]
867 $3827.12[100.00%]
Other – Outdoor advertising (billboard)a - Reflects the total number of months each of the drugs in that class have been advertised.Allergy Medications – Claritin®, Allegra®, Zyrtec®, Flonase®, Nasonex®, Hismanal®, Seldane®Antilipemics – Baycol®, Lescol®, Lipitor®, Mevacor®, Pravachol®, Zocor®Gastrointestinals – Helidac®, Lotronex®, Prevacid®, Prilosec®, Propulsid®, Zantac®, Nexium®Antidepressants – Wellbutrin®, Prozac®, Paxil®, Zoloft®, Effexor®, Serzone®Antihypertensives – Adalat®, Altace®, Capoten®, Cardizem®, Cardura®, Coreg®, Lotensin®, ToprolXL®
SECTION II: DESCRIPTIVE ANALYSES
The section will present the descriptive analyses results for each of the five classes
of drugs: allergy medications, antilipemics, gastrointestinal drugs, antidepressants, and
antihypertensives.

230
Allergy Medications
DTCA Expenditures
This section presents the DTCA expenditures for the following allergy
medications: Claritin®, Allegra®, Zyrtec®, Nasonex®, Flonase®, Hismanal®, and
Seldane®. Annual DTCA expenditures for each of the drugs were calculated from the
CMR dataset.
Figure 5.4 depicts the trend in DTCA expenditures for broadcast media and print
and billboards for allergy medications from 1994 to 2001. With the relaxation of
guidelines in August 1997, the DTCA expenditures for allergy medications for broadcast
media increased dramatically, especially when compared to expenditures for print and
outdoor (billboard) advertising.
Since 1998, the level of expenditures for print and outdoor advertising has been
fairly constant, but expenditures for advertising via television and radio has risen to
almost double the expenditures for print and outdoor advertising. Following the
relaxation of guidelines in August 1997 for broadcast media, advertising expenditure for
broadcast media in 1998 was three times ($263.5 million) higher than the broadcast
media expenditure in 1997 ($88.2 million) and were approximately two and one half
times the expenditures for print and outdoor advertising. The proportion of advertising
dollars spent on print and billboard advertisements decreased considerably from 1994
($40.7 million, 99.7%) to 1997 ($139.9 million, 61.3%). In 1998, print and billboards
advertising expenditures decreased to $109.0 million, accounting for only 29.3 percent of
total DTCA expenditures for allergy medications. During the years from 1999 to 2001,

231
print and billboard advertising expenditures accounted for 29.3-32.1 percent of total
advertising expenditures with broadcast media advertising expenditures accounting for a
greater proportion of total DTCA expenditures.
Figure 5.4: Trends in Total DTCA Expenditures and DTCA Expenditures by Media Outlet for Allergy Medications*, 1994-2001
$116.001
$0.162
$245.143
$139.856$109.035 $110.047 $107.856
$114.747
$40.691$98.242 $38.023 $88.181
$263.536
$232.501$259.856
$0.143
$40.834
$98.404
$152.771
$228.036
$372.572 $367.712
$361.144$342.548
$0
$50
$100
$150
$200
$250
$300
$350
$400
1994 1995 1996 1997 1998 1999 2000 2001
Year
DT
CA
Exp
end
itu
res
($ in
mill
ion
s)
Print and Other Television/Radio Total DTCA Expenditures for Allergy Medications
Since the relaxation of guidelines in August 1997, DTCA expenditures were
examined by media type just prior to and following the guidelines change. Monthly
expenditures by media outlet were examined for allergy medications from June 1997 to
November 1997 (Figure 5.5). The total DTCA expenditures for allergy medications
decreased from June 1997 to July 1997 but increased in August and September 1997. The
DTCA expenditures again decreased in October and November of 1997.
Note: Other - Outdoor advertisements (billboards)* Claritin®, Allegra®, Zyrtec®, Nasonex®, Flonase®, Hismanal®, Seldane®

232
Note: Other – Outdoor advertisements (billboards)* Claritin®, Allegra®, Zyrtec®, Flonase®
Figure 5.5: Trend in DTCA Expenditures for Allergy Medications* by Media Outlet from June 1997 through November 1997
$11.718
$5.036
$13.587
$0.872
$18.639
$8.374
$14.726
$2.946 $1.695
$2.247
$7.507
$14.158
$7.283
$19.225
$28.884
$32.226
$11.320
$2.567
$0
$5
$10
$15
$20
$25
$30
$35
Jun-97 Jul-97 Aug-97 Sep-97 Oct-97 Nov-97
Month and Year
DT
CA
Exp
end
itu
res
($ in
mill
ion
s)
Television/Radio
Print andOther
Note: Other - Outdoor advertisements (billboards)* Claritin®, Allegra®, Zyrtec®, Nasonex®, Flonase®, Hismanal®, Seldane®
Print and outdoor advertising expenditures accounted for 61.0 percent ($11.7
million) of total DTCA expenditures in June 1997. In August and September of 1997, the
proportion of DTCA expenditures for broadcast advertising increased to 49.0 percent
($14.2 million), and rose again to 57.8 percent ($18.6 million), respectively. In October
and November 1997, total DTCA expenditures for allergy medications decreased
considerably, but the proportion of DTCA expenditures for broadcast media still
accounted for 74.0 percent ($8.4 million) and 66.0 percent ($1.7 million), respectively.
Figure 5.6 presents the total DTCA expenditures from 1994 through 2001 for
each of the allergy medications. The data for Figure 5.6 can be found in Appendix C.
DTCA expenditures for Claritin® rose from $17.5 million in 1994 to $173.0 million in

233
1998, but then decreased every year to $86.7 million in 2001. In 2001, the total DTCA
expenditures for Allegra® surpassed DTCA expenditures for Claritin®.
Figure 5.6: Trends in DTCA Expenditures for Advertised Allergy Medications, 1994-2001
$0
$40
$80
$120
$160
$200
1994 1995 1996 1997 1998 1999 2000 2001
Year
DT
CA
Exp
end
itu
res
($ in
m
illio
ns)
Hismanal® Seldane® Claritin® Flonase® Allegra® Zyrtec® Nasonex®
Hismanal® and Seldane® were both advertised from 1994 to 1996. The DTCA
expenditures for Hismanal® decreased each year from $11.2 million in 1994 to $7.2
million in 1996. The total DTCA expenditures for Seldane® increased from $12.1
million in 1994 to $17.7 million in 1995 and decreased to $5.9 million in 1996. During
all years from 1994 through 2001, except in 1995 and 2001, Claritin® had the highest
DTCA expenditures. Flonase® and Allegra® were the most heavily advertised allergy
medications in 1995 and 2001, respectively.
Allergy-Related Physician Visits and Prescriptions Written for Allergy Medications
As mentioned in Chapter 4, if the reason for a physician visit was allergy-related
symptoms and/or diagnosis for allergic rhinitis was reported, the visit was coded as an

234
allergy-related visit. Figure 5.7 depicts the trends in allergy-related visits, total DTCA
expenditures and prescriptions written for allergy medications from 1994 through 2001.
The total number of allergy-related physician visits fluctuated between 34.6-36.0 million
visits per year in the U.S. from 1994 through 1997. The number of visits rose to 39.5
million in 1998 and 43.3 million in 1999. However, the number of visits fell to 37.0
million in 2000, but increased again to 41.3 million in 2001.
Figure 5.7: Trends in Total DTCA Expenditures and Number Of Prescriptions Written for Allergy Medications* and Number of Allergy-Related Physician Visits,
1994-2001
$152.771
$228.036
$342.548$361.144
$40.834
$98.404
$367.712$372.572
19.589
39.476 43.330
37.032
41.33735.70335.98534.56735.649
9.63411.077
13.417
30.556
35.216
39.107
46.688
$0
$50
$100
$150
$200
$250
$300
$350
$400
1994 1995 1996 1997 1998 1999 2000 2001
Year
DT
CA
Exp
end
itu
res
($in
mill
ion
s)
0
5
10
15
20
25
30
35
40
45
50
Num
ber
of P
hysi
cian
Vis
itsN
umbe
r of
pre
scrip
tions
writ
ten
(in
mill
ions
)Total DTCA Expenditures for Allergy Medications Allergy-related Physician Visits
Number of prescriptions written for Allergy Medications
The total DTCA expenditures increased from $40.8 million in 1994 to $372.6
million in 1998. It decreased slightly in 1999 ($342.5 million) and 2001 ($361.1 million).
There was a steady increase in the number of prescriptions written for allergy
medications since 1994. The greatest increase in the number of prescriptions written for
* - Claritin®, Allegra®, Zyrtec®, Flonase®, Nasonex®, Hismanal®, Seldane®

235
advertised allergy medications was in 1998 when the number of prescriptions written
increased to 30.6 million from 19.6 million in 1997 (56.0%).
Overall, DTCA expenditures increased by 784.4 percent from 1994 to 2001
whereas physician visits increased by 159.6 percent and number of prescriptions
increased by 384.6 percent. Taking into account the fact that the guidelines for DTCA
were relaxed in 1997, DTCA expenditures, number of allergy-related physician visits and
number of prescriptions written for allergy medications increased from 1997 to 1998 by
63.4 percent, 10.6 percent, and 56.0, respectively.
The difference or gap in the number of allergy-related visits and number of
prescriptions written for advertised allergy medications decreased from 1994 to 1999. In
2000 and 2001, the number of prescriptions written for allergy medications surpassed the
number of allergy-related visits indicating that the allergy-related symptoms and/or
diagnosis may not have been documented, but prescriptions for allergy medications were
written.
During physician visits, allergy-related symptoms and/or diagnoses may not have
been reported but advertised allergy medications were prescribed and vice-versa. To
examine this closely, the characteristics of physician visits were evaluated. Table 5.4
depicts the trend in physician visits when allergy-related symptoms and/or diagnoses
were reported and/or advertised allergy medications were prescribed from 1994 to 2001.
The proportion of visits when symptoms and/or diagnosis for allergy was reported but
advertised allergy medication was not prescribed decreased from 76.4 percent in 1994 to
41.5 percent in 2001. The percentage of visits when allergy-related symptoms and/or

236
diagnoses were not reported but advertised allergy medications were prescribed,
increased from 11.9 percent in 1994 to 38.8 percent in 2001. In 2000 and 2001,
approximately 20.0 percent of the allergy-related visits were associated with at least one
prescription written for advertised allergy medications.
Table 5.4: Number and Percentage of Allergy-Related Physician Visits and/or Visits when at Least One Advertised Allergy Medication* was Prescribed, 1994-2001
Number of VisitsAdvertised Drug Not Prescribed
Advertised Drug PrescribedYear
Allergy-Related Visit
Not Allergy-Related Visit
Allergy-related Visit
Total Number of Visits
1994(%)
30,927,753(76.44%)
4,809,212(11.89%)
4,721,451(11.67%)
40,458,416(100%)
1995(%)
30,640,853(74.29%)
6,680,050(16.20%)
3,925,654(9.52%)
41,246,557(100%)
1996(%)
31,093,420(72.10%)
7,139,295(16.56%)
4,891,963(11.34%)
43,124,678(100%)
1997(%)
28,504,661(60.97%)
11,047,294(23.63%)
7,198,804(15.40%)
46,750,759(100%)
1998(%)
28,909,253(50.88%)
17,463,684(30.74%)
10,441,887(18.38%)
56,814,824(100%)
1999(%)
32,190,725(50.80%)
20,035,438(31.62%)
11,139,542(17.58%)
63,365,705(100%)
2000(%)
25,015,500(42.32%)
22,193,983(37.55%)
11,895,322(20.13%)
59,104,805(100%)
2001(%)
27,996,393(41.48%)
26,158,126(38.76%)
13,340,960(19.77%)
67,495,479(100%)
* - Claritin®, Allegra®, Zyrtec®, Flonase®, Nasonex®, Hismanal®, Seldane®
Figure 5.8 depicts the number of prescriptions written for advertised allergy
medications from 1994 through 2001. The data used to construct Figure 5.8 can be found
in Appendix D. In 1994, Seldane® was the most heavily prescribed advertised allergy
medication followed closely by Claritin®. However, this quickly changed in 1995 when
the share of prescriptions written for Seldane® fell but the number of prescriptions
written for Claritin® and Flonase® (introduced in October 1994) increased.

237
Figure 5.8: Trend in the Number of Prescriptions Written for Selected Advertised Allergy Medications, 1994-2001
0
2
4
6
8
10
12
14
16
18
1994 1995 1996 1997 1998 1999 2000 2001
Year
Num
ber
of P
resc
riptio
ns
writ
ten
(in m
illio
ns)
Seldane® Hismanal® Claritin® Flonase® Allegra® Zyrtec® Nasonex®
As noted above, number of prescriptions written for Seldane® consistently fell
from 4.6 million in 1994 to 0.8 million in 1996. No prescriptions were written for
Seldane® in 1997 and the product was withdrawn from the market in February 1998.450
The share of prescriptions written for Hismanal® also decreased dramatically each year
from 1994. In 1998 and 1999, prescriptions for Hismanal® accounted for less than 1.0
percent of the prescriptions written for advertised allergy medications and the product
was withdrawn from the market in June 1999.451 As depicted in Figure 5.8, from 1995 to
2001, Claritin® was the product of choice. The number of prescriptions written for
Claritin® as a share of prescriptions written for advertised allergy medications has
450 FDA Paper: Seldane and Generic Terfenadine Withdrawn from the Market. Food and Drug Administration. February 27, 1998. Available at: www.fda.gov/bbs/topics/answers/ans00853.html. Accessed August, 2004.
451 Food and Drug Administration: Determination that Astemizole 10mg Tablets were Withdrawn from Sale for Safety Reasons. Federal Register. August 23 1999;64(162):45973.

238
always been over 40.0 percent from 1994 through 2000, but it was reduced to 31.3
percent in 2001.
Demographic Characteristics (Age, Gender) and Health Insurance Coverage
The data were further evaluated with regards to the demographic characteristics of
individuals who were prescribed the advertised drug and/or visited the physician for an
allergy-related symptom and/or diagnosis. Figure 5.9 depicts the percentage of patients
who visited the physician for an allergy-related symptom and/or diagnosis and who were
women, had health insurance coverage, and were 45 years and older.
Figure 5.9: Trends in Percentage of Women, Percentage of Individuals with Health Insurance Coverage, and Percentage of Individuals 45 years and Older Among
those with Allergy-Related Physician Visits, 1994-2001
92.0
55.4
31.8
86.2 85.3 88.190.6 92.2 92.3 93.6
54.658.355.959.154.9
55.555.1
28.3 27.8 28.0
31.0 30.7 33.524.6
0
20
40
60
80
100
1994 1995 1996 1997 1998 1999 2000 2001
Year
Per
cent
Percent Individuals with Health Insurance Coverage
Percent Women
Percent Individuals 45 years and older
Note – Percent was calculated from total number of individuals with allergy-related visits.
A greater proportion of women than men saw a physician for an allergy-related
symptom and/or diagnosis for each year from 1994 to 2001 (54.6-59.1%). The majority
of the individuals with an allergy-related visit had insurance coverage (85.3-93.6%).

239
Since 1997, nine out of ten individuals who saw a physician for allergy-related problem
had health insurance coverage. The majority of the individuals with allergy-related visits
were less than 45 years of age (less than 45 years– 66.5-75.4%) (Figure 5.9).
Figure 5.10 describes the trends in percentage of individuals who received a
prescription for an advertised allergy medication and who were women, had health
insurance coverage, and were 45 years and older.
Figure 5.10: Trends in Percentage of Women, Percentage of Individuals with Health Insurance Coverage and Percentage of Individuals 45 years and Older Among those
who Received Prescriptions for Advertised Allergy Medications, 1994-2001
86.5 85.3 87.390.8 91.2 92.5 93.8 91.5
56.5 56.856.3 60.0 58.1 59.2 59.4 55.1
46.944.547.645.648.743.044.444.5
0
20
40
60
80
100
1994 1995 1996 1997 1998 1999 2000 2001
Year
Per
cent
Percent Individuals with Health Insurance Coverage
Percent Women
Percent Individuals 45 years and older
* - Claritin®, Allegra®, Zyrtec®, Flonase®, Nasonex®, Hismanal®, Seldane® Note: Percent was calculated from total number of individuals who received a prescription for an advertised allergy medication.
Overall, 55.1-60.0 percent of the individuals who received a prescription for
advertised allergy medications were women and 85.3-93.8 percent of the individuals had
health insurance coverage. In addition, the majority of individuals who received a

240
prescription for advertised allergy medications were less than 45 years of age (51.3-
57.0%).
The specific data on the percentage of women, percentage of individuals with
healthcare coverage and percentage of individuals 45 years and older among those who
received prescriptions for advertised allergy medications are provided in Appendix E, F,
and G, respectively. In addition, age was categorized into six groups who received a
prescription for allergy medications: Under 15 years, 15 to 24 years, 25 to 44 years, 45 to
64 years, 65 to 74 years, and 75 years and older. During all the years, the majority of the
prescriptions were written for individuals 25 to 64 years of age (53.0-67.9%). The
distribution of allergy medications prescribed for individuals in these age categories is
provided in Appendix H.
Prescription Drug Expenditures
This section presents the trends in drug expenditures for advertised allergy
medications (Claritin®, Allegra®, Zyrtec®, Flonase®, Nasonex®, Hismanal®,
Seldane®) from 1994 to 2001. As mentioned in the methodology chapter, the price per
prescription was calculated for each drug as a sum of the AWP and average dispensing
fee for each year. The product of the estimated price and number of prescriptions written
for that drug provided the drug expenditures.
Figure 5.11 compares the trends in DTCA expenditures, prescription drug
expenditures and number of prescriptions written for allergy medications, and number of
allergy-related visits. The total drug expenditures for allergy medications increased from
$453.6 million in 1994 to $2,718.7 million in 2001, a 499.4 percent increase. The greatest

241
increase in prescription drug expenditures was in 1998 when it increased from $1,111.1
million in 1997 to $1,684.3 million in 1998, a 51.6 percent increase. DTCA expenditures
increased by 784.4 percent from 1994 to 2001 whereas physician visits increased by
159.6 percent and number of prescriptions increased by 384.6 percent. While DTCA
expenditures increased by 63.4 percent from 1997 to 1998, number of allergy-related
visits increased only 10.6 percent and number of prescriptions written increased by 56.0
percent.
Figure 5.11: Trends in Total Prescription Drug Expenditures, Total DTCA Expenditures and Number of Prescriptions Written for Advertised Allergy
Medications*, and Number of Allergy-Related Visits, 1994-2001
* - Claritin®, Allegra®, Zyrtec®, Flonase®, Nasonex®, Hismanal®, Seldane®
Figure 5.12 presents yearly drug expenditures for each of the advertised allergy
medications. Claritin® had the highest expenditures during all the years from 1994 to
$40.834 $98.404 $152.771$228.036
$372.572
$342.548$367.712
$135.438
$2,253.943$1,994.150
$1,684.261
$1,111.113
$739.272
$553.145$453.606
$2,718.689
43.330
35.649 34.567 35.985 35.703
39.476 41.337
37.032
9.634 11.07713.417
19.589
30.556
35.21639.107
46.688
$0
$500
$1,000
$1,500
$2,000
$2,500
$3,000
1994 1995 1996 1997 1998 1999 2000 2001
Year
Exp
endi
ture
s ($
in m
illio
ns)
0
5
10
15
20
25
30
35
40
45
50
Num
ber
of p
hysi
cian
vis
its (
in m
illio
ns)
Num
ber
of P
resc
riptio
ns W
ritte
n (in
m
illio
ns)
Total DTCA Expenditures for Allergy Medications Total Drug Expenditures for Allergy Medications
Number of Allergy-Related Visits Number of Prescriptions Written for Allergy Medications

242
2001. Since 1995, drug expenditures for Claritin® were at least two times greater than
the expenditures for the other advertised allergy medications. The drug expenditures for
Claritin® increased from 1994 to 2000, but decreased in 2001. Although Allegra® was
the most heavily advertised allergy medication in 2001, its drug expenditures were
among the lowest. The data for the drug expenditures for each of the advertised allergy
medications are provided in Appendix I.
Figure 5.12: Trends in Prescription Drug Expenditures for Selected Advertised Allergy Medications, 1994-2001
$0
$100
$200
$300
$400
$500
$600
$700
$800
$900
$1,000
$1,100
$1,200
$1,300
1994 1995 1996 1997 1998 1999 2000 2001
Year
Exp
end
itu
res
(in
mill
ion
s)
Hismanal® Seldane® Claritin® Allegra®
Zyrtec® Flonase® Nasonex®
Antilipemics
DTCA Expenditures
This section presents the trends in DTCA expenditures for the following
antilipemic products: Baycol®, Lescol®, Lipitor®, Mevacor®, Pravachol®, and Zocor®.

243
The total DTCA expenditures for antilipemics were aggregated for each year from 1994
to 2001. The total DTCA expenditures for antilipemic drugs from 1994 to 2001 were
$840.2 million, which was less than half the total DTCA expenditures for allergy
medications ($1,964.0 million). Figure 5.13 depicts the trend in DTCA expenditures for
antilipemics by broadcast, print and outdoor media from 1994 through 2001. DTCA
expenditures for antilipemics increased by 979.6 percent from $20.0 million in 1994 to
$215.6 million in 2001. In 1994 and 1995, antilipemics were advertised directly to
consumers only via print and billboards and the DTCA expenditures for antilipemics
were relatively low compared to the later years.
Figure 5.13: Trends in Total DTCA Expenditures and DTCA Expenditures by Media Outlet for Antilipemics*, 1994-2001
$74.501
$25.072
$129.000
$64.471
$33.649
$86.619
$56.002
$87.041
$146.951
$58.066
$37.509$7.107
$91.715$112.010$112.113
$63.109
$19.972 $14.279
$211.422$215.619
$0
$50
$100
$150
$200
$250
1994 1995 1996 1997 1998 1999 2000 2001
Year
DT
CA
Exp
end
itu
res
($ in
mill
ion
s)
Print and Other Television/Radio Total DTCA Expenditures for Antilipemics
* - Baycol®, Lescol®, Lipitor®, Mevacor®, Pravachol®, Zocor®Other –Outdoor advertisements (billboard)

244
The DTCA expenditures for broadcast advertising began rising during the period of
1996 through 2000. Although total DTCA expenditures fell from $112.0 million in 1998
to $91.7 million in 1999, the proportion of advertising expenditures for broadcast media
increased from 33.5 percent ($37.5 million) in 1998 to 63.3 percent ($58.1 million) in
1999. In 2000, there was a sharp increase in total DTCA expenditures to $211.4 million,
an increase of 130.5 percent. For this same year, expenditures for advertising via the
broadcast media rose to account for 69.5 percent ($147.0 million) of the total DTCA
expenditures. In 2001, advertising expenditures for broadcast media accounted for 59.8
percent ($129.0 million) of total DTCA expenditures ($215.6 million).
Since the guidelines for broadcast media advertising were relaxed in August 1997,
the trend in DTCA expenditures for antilipemics were examined prior to and following
this relaxation (Figure 5.14, June 1997 to November 1997). DTCA expenditures actually
decreased in August 1997 ($7.6 million), but increased in September 1997 to $12.1
million. In October 1997, the total DTCA expenditures again decreased to $8.7 million
and again increased sharply to $18.1 million in November 1997. The proportion of
DTCA expenditures for broadcast media advertising increased from 19.6 percent ($1.7
million) in July 1997 to 29.3 percent ($2.2 million) in August 1997. Even with the
relaxation of guidelines, the proportion of DTCA expenditures for broadcast media
dropped to 9.4 percent ($1.1 million) in September 1997. In October and November
1997, DTCA expenditures for broadcast media accounted for 24.7 percent and 47.0
percent, respectively, of total DTCA expenditures (Figure 5.14).

245
Figure 5.14: Trend in DTCA Expenditures for Antilipemic Drugs* by Media Outlet from June 1997 to November 1997
$12.487
$7.157$5.402
$10.966
$6.523$9.578
$2.243$2.138
$8.489$0.927
$1.744
$1.140
$13.414
$8.901$7.646
$12.106
$8.661
$18.067
$0
$2
$4
$6
$8
$10
$12
$14
$16
$18
$20
Jun-97 Jul-97 Aug-97 Sep-97 Oct-97 Nov-97
Month and Year
DT
CA
Exp
end
itu
res
($ in
mill
ion
s)
Television/Radio
Print andOther
* - Baycol®, Lescol®, Lipitor®, Mevacor®, Pravachol®, Zocor®Other - Outdoor advertisements (billboard)
Table 5.5 presents the annual DTCA expenditures for each of the antilipemic
products in order to understand the allotment of advertisement dollars for each
antilipemic drugs. Mevacor® was advertised only in 1994 ($20.0 million) and 1995
($14.3 million) whereas Baycol® was advertised only in 2001 ($19,200). Pravachol®
was advertised from 1996 to 1998 and in 2000 and 2001. The total DTCA expenditures
for Zocor® rose from $40.8 million in 1996 to $45.6 million in 1997 and decreased to
$35.3 million in 1999. In 2000 and 2001, DTCA expenditures for Zocor® increased to
$91.2 million and $117.7 million, respectively.
246
Table 5.5: Total DTCA Expenditures (in millions) for Antilipemics, 1994-2001Year Mevacor® Pravachol® Zocor® Lescol® Lipitor® Baycol® Total1994 $19.9720 -- -- -- -- -- $19.97201995 $14.2790 -- -- -- -- -- $14.27901996 -- $21.3116 $40.8198 $0.9776 -- -- $63.10901997 -- $66.5191 $45.5938 -- -- -- $112.11291998 -- $61.2203 $42.0950 $0.6375 $8.0568 -- $112.00961999 -- -- $35.2642 $0.9940 $55.4567 -- $91.71492000 -- $62.0055 $91.2490 -- $58.1673 -- $211.42182001 -- $47.1657 $117.7185 $0.6069 $50.1086 $0.0192 $215.6189
Lescol® was advertised only for four years and its total DTCA expenditures were
less than a million during each of these four years (1996 – $0.98 million, 1998 - $0.64
million, 1999 - $0.99, 2001 - $0.61 million). The total DTCA expenditures for Lipitor®,
which was introduced in 1997, increased from $8.1 million in 1998 to $58.2 million in
2000, but decreased to $50.1 million in 2001. In 1996, 2000 and 2001, Zocor® had the
highest DTCA expenditures. In 1997 and 1998, Pravachol® was the most heavily
advertised antilipemic drug and in 1999, Lipitor® was the most heavily advertised
antilipemic drug.
Lipid-Related Physician Visits and Prescriptions Written for Antilipemics
This section presents the trend in number of physician visits when patients were
diagnosed with hyperlipidemia and number of prescriptions written for antilipemics. The
physician visits when patients had a diagnosis of hyperlipidemia or hypercholesterolemia,
are referred to as lipid- related visits.
Figure 5.15 compares the trends for number of lipid-related visits, DTCA
expenditures and number of prescriptions written for the advertised antilipemic drugs
from 1994 through 2001. The total DTCA expenditures decreased from $20.0 million in

247
1994 to $14.3 million in 1995, but increased to $112.1 million in 1997 and leveled off in
1998 ($112.0 million). The total DTCA expenditures decreased again to $91.7 million in
1999 and increased in 2000 and 2001 to $211.4 million and $215.6 million, respectively.
The greatest increase in DTCA expenditures was in 2000, when it increased by 130.5
percent from 1999.
Figure 5.15: Trends in Total DTCA Expenditures and Number of Prescriptions Written for Antilipemic Drugs* and Number of Physician Visits with Diagnosis of
Hyperlipidemia, 1994-2001
$112.113
$19.972$14.279 $63.109
$211.422
$215.619
$112.010
$91.715
23.641
6.0218.843
11.6589.38011.729
13.681 18.53116.532
22.525
31.930
33.689
17.489
23.215
26.312
39.829
$0
$50
$100
$150
$200
$250
1994 1995 1996 1997 1998 1999 2000 2001
Year
DT
CA
Exp
endi
ture
s ($
in m
illio
ns)
0
5
10
15
20
25
30
35
40
45
Num
ber
of P
hysi
cian
Vis
its (
in m
illio
ns)
Num
ber
of P
resc
riptio
ns W
ritte
n (in
m
illio
ns)
Total DTCA Expenditures for Antilipemics Total Lipid-Related Visits
Number of Prescriptions Written for Antilipemics
* - Baycol®, Lescol®, Lipitor®, Mevacor®, Pravachol®, Zocor®
The number of lipid-related physician visits also increased annually from 1994
through 2001.The greatest increase in lipid-related physician visits was in 2001 when it
increased by 35.1 percent from 23.6 million in 2000 to 31.9 million in 2001. The number
of prescriptions written increased every year since 1994 through 2001. The greatest

248
increase in number of prescriptions written for advertised antilipemics was in 1997 when
it increased by 50.0 percent from 11.7 million in 1996 to 17.5 million in 1997.
Overall, DTCA expenditures, number of lipid-related visits, and number of
prescriptions increased by 979.6 percent, 240.4 percent and 561.5 percent, respectively
from 1994 to 2001. Taking into account the relaxation of guidelines in 1997, the DTCA
expenditures decreased slightly by 0.1 percent in 1998. However, the number of lipid-
related visits and number of prescriptions written for antilipemics written increased by
12.1 percent and 32.7 percent, respectively, in 1998 from the previous year.
The number of prescriptions written surpassed the number of lipid-related visits in
1997 and continued to 2001. Furthermore, for some visits patients who were diagnosed
with hyperlipidemia were not necessarily prescribed an advertised antilipemic drug and
vice-versa. Table 5.6, presents the trends in physician visits when a diagnosis for
hyperlipidemia was reported and/or at least one advertised antilipemic drug was
prescribed.
The proportion of lipid-related visits when no antilipemic drug was prescribed
decreased from 54.7 percent in 1994 to 30.2 percent in 1998, but increased slightly to
31.4 percent in 1999. The percentage of visits when no antilipemic drug was prescribed
but hyperlipidemia was reported decreased in 2000 to 27.0 percent and increased to 32.3
percent in 2001. The percentage of visits when advertised antilipemics were prescribed,
but hyperlipidemia was not reported (not lipid-related visit) increased from 29.4 percent
in 1994 to 43.8 percent in 1998, decreased to 41.1 percent in 1999 and increased again in
2000 (48.2%).

249
Table 5.6: Number and Percentage of Lipid-Related Physician Visits and/or Visits when at Least One Advertised Antilipemic Drug* was Prescribed, 1994-2001
Number of VisitsAdvertised Drug Not Prescribed
Advertised Drug PrescribedYear
Lipid-Related Visit
Not Lipid-Related Visit
Lipid-related Visit
Total Number of
Visits
1994(%)
7,273,832(54.74%)
3,907,058(29.40%)
2,106,512(15.85%)
13,287,402(100%)
1995(%)
8,338,321(48.72%)
5,385,023(31.47%)
3,390,763(19.81%)
17,114,107(100%)
1996(%)
8,963,027(43.55%)
6,900,853(33.53%)
4,717,667(22.92%)
20,581,547(100%)
1997(%)
9,256,573(34.80%)
10,064,016(37.84%)
7,275,236(27.35%)
26,595,825(100%)
1998(%)
9,948,990(30.18%)
14,432,181(43.78%)
8,582,022(26.04%)
32,963,193(100%)
1999(%)
11,991,434(31.36%)
15,716,106(41.10%)
10,534,050(27.55%)
38,241,590(100%)
2000(%)
12,327,130(27.04%)
21,950,938(48.15%)
11,314,230(24.82%)
45,592,298(100%)
2001(%)
18,874,285(32.29%)
26,519,700(45.37%)
13,055,872(22.34%)
58,449,857(100%)
*- Baycol®, Lescol®, Lipitor®, Mevacor®, Pravachol®, Zocor®
Figure 5.16 presents the trend in number of prescriptions written for each of the
advertised antilipemic drugs from 1994 to 2001. The data for the number of prescriptions
written for each of the antilipemic drugs are provided in Appendix D. In 1994 and 1995,
a majority of the prescriptions were written for Mevacor® (1994 – 3.3 million, 1995 –
3.5 million) but Zocor® was the most heavily prescribed antilipemic in 1996 (3.9
million) and 1997 (6.8 million). The number of prescriptions written for Mevacor®
steadily increased until 1996, following which it began decreasing each year until 2000
and increased slight in 2001. The number of prescriptions written for Zocor® increased
steadily from 1994 to 2001 with sharp increases in 1995 (119.8%) followed by 2000
(52.5%).

250
Figure 5.16: Trend in the Number of Prescriptions Written for Selected Advertised Antilipemic Drugs, 1994-2001
0
5
10
15
20
25
1994 1995 1996 1997 1998 1999 2000 2001
Year
Num
ber
of P
resc
riptio
ns W
ritte
n (in
mill
ions
)
Mevacor® Pravachol® Zocor® Lescol® Lipitor® Baycol®
Since the launch of Lipitor® in 1997, there has been an increase in the number of
prescriptions written for Lipitor® and since 1998, it has been the most frequently
prescribed antilipemic drug. From 1998 to 2001, all the six antilipemics selected for the
study including Baycol®, Lescol®, Lipitor®, Mevacor®, Pravachol®, Zocor® were
competing for market share.
Demographic Characteristics (Age, Gender) and Health Insurance Coverage
This section presents the demographic characteristics of individuals diagnosed
with hyperlipidemia and those who received a prescription for an advertised antilipemic
drug. Figure 5.17 depicts the trends in percentage of individuals with diagnosis for
hyperlipidemia who were women, had health insurance coverage, and were 45 years and
older.

251
Figure 5.17: Trends in Percentage of Women, Percentage of Individuals with Health Insurance Coverage and Percentage of Individuals 45 Years and Older Among
those Diagnosed with Hyperlipidemia, 1994-2001
93.3
47.5
95.895.494.093.895.193.890.5
57.1 51.7 49.8 53.2 51.0 54.6 53.0
89.8 86.4 85.0 87.590.2
88.5 88.7 85.5
0102030405060708090
100
1994 1995 1996 1997 1998 1999 2000 2001
Year
Per
cent
Percent Individuals with Health Insurance Coverage
Percent Women
Percent Individuals 45 years and older
Note – Percent was calculated from total number of individuals diagnosed with hyperlipidemia.
The percentage of patients diagnosed with hyperlipidemia who were women
decreased from 57.1 percent in 1994 to 47.5 percent in 2001. Over 90 percent (90.5-
95.8%) of the individuals diagnosed with hyperlipidemia had health insurance coverage
from 1994 to 2001. The majority of individuals diagnosed with hyperlipidemia between
1994 and 2001 were 45 years and older (85.0-90.2%).
Figure 5.18, depicts the trends among individuals who received prescriptions for
an antilipemic drug who were women, had health insurance coverage and were 45 years
and older. Overall, among patients prescribed an advertised antilipemic drug who were
women decreased from 57.7 percent in 1994 to 48.5 percent in 2001. Among individuals
who received a prescription for advertised antilipemics, the majority had health insurance
coverage (92.5-96.1%) and were 45 years and older (90.8-96.3%).

252
Figure 5.18: Trends in Percentage of Women, Percentage of Individuals with Health Insurance Coverage and Percentage of Individuals 45 Years and Older Among
those who Received Prescriptions for Antilipemic Drugs*, 1994-2001
48.5
93.796.1
96.194.895.094.792.5 94.0
50.2
52.0
48.5
53.049.1
51.357.7
92.390.8
93.592.993.294.994.596.3
0
20
40
60
80
100
1994 1995 1996 1997 1998 1999 2000 2001
Year
Per
cent
Percent with Health Insurance Coverage Percent women
Percent Individuals 45 yrs and older
*- Baycol®, Lescol®, Lipitor®, Mevacor®, Pravachol®, Zocor®Note: Percent was calculated from total number of individuals who received a prescription for an antilipemic drug.
The specific data on the percentage of women, percentage of individuals with
health insurance coverage and percentage of individuals 45 years and older among those
who received a prescription for antilipemics can be found in Appendix E, F, and G,
respectively. Age was categorized into six groups of individuals who received
prescriptions for advertised antilipemics: Under 15 years, 15 to 24 years, 25 to 44 years,
45 to 64 years, 65 to 74 years, and 75 years and older. The majority of the prescriptions
for the advertised antilipemics drugs were written for individuals 45 to 74 years of age
(69.2-81.5%). The specific data on the distribution of prescriptions written for each of
these age groups are provided in Appendix H.

253
Prescription Drug Expenditures
This section presents the trend in drug expenditures for the following antilipemic
drugs: Baycol®, Lescol®, Lipitor®, Mevacor®, Pravachol®, and Zocor®. Using the
AWP for the drugs and the average dispensing fee for each year, the total price of the
drug was calculated. The product of this calculated price and number of prescriptions
written for the drug provided the expenditures for the drug. Figure 5.19 depicts the trend
in prescription drug expenditures for antilipemics and was compared with the trends in
lipid-related visits, DTCA expenditures and number of prescriptions written for
antilipemic drugs.
Figure 5.19: Trends in Total Prescription Drug Expenditures, Total DTCA Expenditures and Number of Prescriptions Written for Antilipemic Drugs* and
Number of Physician Visits with Diagnosis for Hyperlipidemia, 1994-2001
*- Baycol®, Lescol®, Lipitor®, Mevacor®, Pravachol®, Zocor®
$19.972 $14.279$63.109 $112.113 $112.010 $91.715
$211.422 $215.619
$3,273.299
$2,541.012
$1,944.787
$1,695.932$1,341.866
$881.068$656.308$407.554
23.641
6.021
8.843
22.525
18.531
9.38011.729
13.68116.532
31.93033.689
26.312
23.215
11.658
17.489
39.829
$0
$500
$1,000
$1,500
$2,000
$2,500
$3,000
$3,500
1994 1995 1996 1997 1998 1999 2000 2001
Year
Exp
endi
ture
s (in
mill
ions
)
0
5
10
15
20
25
30
35
40
45
Nu
mb
er o
f P
hys
icia
n V
isit
s (i
n
mill
ion
s)N
um
ber
of
Pre
scri
pti
on
s W
ritt
en (
in
mill
ion
s)
Total DTCA Expenditures for Antilipemics Total Drug Expenditures for Antilipemics
Number of Lipid-related visits Number of Prescriptions Written for Antilipemics

254
The total drug expenditures for the antilipemics increased each year from $407.6
million in 1994 to $3.3 billion in 2001. Thus, total expenditures for antilipemics drugs
increased 703.2 percent from 1994 to 2001. Taking into account the relaxation of
guidelines in 1997, total expenditures increased by 26.4 percent in 1998 from 1997. The
greatest increase in expenditures was in 1995 when total expenditures increased from
$407.6 million in 1994 to $656.3 million in 1995 (61.0% increase). The DTCA
expenditures for antilipemics drugs were only 2.2-8.4 percent of the antilipemic drug
expenditures. It was also noted that drug expenditures, number of prescriptions written
and number of visits followed a similar pattern.
Figure 5.20 presents the trends in expenditures for each of the antilipemics.
Mevacor® had the highest expenditures in 1994 ($206.3 million). From 1995 to 1998 and
in 2000, Zocor® had the highest expenditures. In 1999, Lipitor® ($713.1 million) had
slightly higher expenditures than Zocor® ($709.1 million). Since its launch in 1997,
Lipitor® showed sharp increases during all the years. In 2001, compared to all other
antilipemics, Lipitor® ($1,379.1 million) had the highest expenditures followed closely
by Zocor® ($1,314.1 million). The drug expenditures for Baycol® increased sharply in
2000 (1999 - $168.1 million, 2000 – $863.8 million) following which it decreased in
2001 ($660.3 million). The specific data for the drug expenditures for each of the
antilipemics are provided in Appendix I.

255
Figure 5.20: Trends in Prescription Drug Expenditures for Selected Advertised Antilipemics, 1994-2001
$0
$200
$400
$600
$800
$1,000
$1,200
$1,400
$1,600
1994 1995 1996 1997 1998 1999 2000 2001
Year
Exp
endi
ture
s ($
in m
illio
ns)
Baycol® Lescol® Lipitor® Mevacor® Pravachol® Zocor®
Gastrointestinals
DTCA Expenditures
This section presents the DTCA expenditures and the trends for the following
seven gastrointestinal drugs: Prilosec®, Zantac®, Prevacid®, Helidac®, Propulsid®,
Lotronex®, and Nexium®. As with previous analyses, the CMR database was used to
estimate the DTCA expenditures by media outlet from 1994 through 2001. It must be
mentioned that advertising for Nexium® began in June 2001 and was included in
calculation of total advertising expenditures for gastrointestinals. However, NAMCS did
not report any prescriptions written for Nexium® in 2001.
Figure 5.21 shows a rise in the proportion of DTCA expenditures for broadcast
media following the relaxation of guidelines in 1997. In 1994, all the advertising dollars
($2.9 million) were spent on print advertising whereas in 1995, 80.0 percent ($21.3
million) of the advertising dollars was spent on print advertising. In 1996, advertising

256
dollars spent on print advertisements and billboards increased to account for 99.9 percent
of the advertising dollars.
Figure 5.21: Trends in Total DTCA Expenditures and DTCA Expenditures by Media Outlet for Gastrointestinals*, 1994-2001
$48.227
$116.734
$62.914
$38.825$16.531$34.782$17.453$21.274
$79.193
$41.321$33.205
$7.534$0.022$5.325
$142.107 $164.961
$80.146
$49.736$42.316
$17.474$26.598$2.857
$0
$30
$60
$90
$120
$150
$180
1994 1995 1996 1997 1998 1999 2000 2001
Year
DT
CA
Exp
end
itu
res
($ in
mill
ion
s)
Print and Other Television/Radio Total DTCA Expenditures for Gastrointestinals
Outdoor advertising was utilized only in June 1996. In 1997, the proportion spent
on print advertising dropped to 82.2 percent ($34.8 million). However, this pattern was
reversed during the following years with the advertising via broadcast media accounting
for the major proportion of total DTCA expenditures for gastrointestinals. In 1998, 1999
and 2000, advertising dollars spent on broadcast media accounted for 66.8 percent ($33.2
million), 51.6 percent ($41.3 million) and 55.7 percent ($79.2 million) of the total DTCA
expenditures, respectively. In 2001, the expenditures for broadcast media rose
dramatically to account for 70.8 percent ($116.7 million) of the total DTCA expenditures
for gastrointestinal drugs. Since 1997, DTCA expenditures for gastrointestinal drugs
increased four-fold from $42.3 million in 1997 to $165.0 million in 2001.
Note: Other –outdoor advertisements (billboards)* - Prilosec®, Zantac®, Prevacid®, Helidac®, Propulsid®, Lotronex®, Nexium®

257
Since the guidelines for broadcast media advertising were relaxed in August 1997,
the trend in DTCA expenditures for gastrointestinal drugs was examined (Figure 5.22)
prior to and following this relaxation (June 1997 to November 1997). Broadcast
advertising for gastrointestinal drugs was not a part of the advertising campaign until
October 1997. The expenditures for broadcast advertising accounted for 8.9 percent ($0.3
million) of the total DTCA expenditures in October of 1997 and 42.7 percent ($2.4
million) in November 1997.
Figure 5.22: Trend in DTCA Expenditures for Gastrointestinals* by Media Outlet from June 1997 through November 1997
$6.312
$4.408 $4.032
$2.603 $3.037 $3.213
$0.296
$2.393
$6.312
$4.408$4.032
$2.603
$3.333
$5.605
0
1
2
3
4
5
6
7
Jun-97 Jul-97 Aug-97 Sep-97 Oct-97 Nov-97
Month and Year
DT
CA
Exp
endi
ture
s ($
in m
illio
ns)
Television/Radio
Print andOther
Note: Other –outdoor advertising (billboards)* - Prilosec®, Zantac®, Prevacid®, Helidac®, Propulsid®
To understand the trends in advertising expenditures for each of the
gastrointestinals, the advertising expenditures for specific gastrointestinal drugs from
1994 to 2001 were examined (Table 5.7). As depicted, advertising for gastrointestinal
drugs has not been consistent through the years. Zantac® and Prilosec® were the only
two drugs that have been advertised to consumers for at least four years. The total DTCA

258
expenditures for Zantac® increased from $2.9 million in 1994 to $26.6 million in 1995.
Following the prescription to over-the-counter switch of Zantac® in December 1995, the
DTCA expenditures for Zantac® decreased in both 1996 ($14.5 million) and 1997 ($0.02
million).452
Table 5.7: Total DTCA Expenditures (in millions) for Gastrointestinals, 1994-2001Year Zantac® Propulsid® Prilosec® Prevacid® Helidac® Lotronex® Nexium® Total1994 $2.8565 -- -- -- -- -- -- $2.85651995 $26.5984 -- -- -- -- -- -- $26.59841996 $14.5114 $2.9629 -- -- -- -- -- $17.47431997 $0.0202 $0.2091 $41.9076 -- $0.1788 -- -- $42.31571998 -- -- $49.7361 -- -- -- -- $49.73611999 -- -- $80.1455 -- -- -- -- $80.14552000 -- -- $107.4689 $34.3844 -- $0.2535 -- $142.10682001 -- -- $1.9214 $36.7729 -- -- $126.2663 $164.9606
The total DTCA expenditures for Prilosec® rose from $41.9 million in 1997 to
$107.5 million in 2000, but decreased to $1.9 million in 2001 when Nexium® was
introduced in the market. Helidac® (1997 - $0.2 million), Lotronex® (2000 - $0.3
million) and Nexium® (2001 - $126.3 million) were each advertised for only one year.
Propulsid® (1996 - $3.0 million, 1997 - $0.2 million) and Prevacid® (2000- $34.4
million, 2001 - $36.8 million) were each advertised for only two years.
In 1994 and 1995, Zantac® was the only drug advertised. In 1996, Zantac® had
the highest DTCA expenditures. From 1997 to 2000, Prilosec® was the most heavily
advertised drug among the gastrointestinal drugs selected, but in 2001, Nexium® had the
highest DTCA expenditures (Table 5.7).
452 Orange Book. Food and Drug Administration. July 2004. Available at: http://www.fda.gov/cder/ob/default.htm. Accessed September 2004, 2004.

259
Gastrointestinal-Related Physician Visits and Prescriptions Written for
Gastrointestinals
The patients who visited the physician for gastrointestinal-related symptoms
and/or diagnosis (ICD-9 codes) for esophagitis, gastroesophageal disease, ulcers (peptic,
duodenal, gastric), irritable bowel syndrome, and Ellison-Zollinger syndrome were
identified. These visits will be referred to as visits for gastrointestinal-related symptoms
and/or diagnoses or gastrointestinal-related visits. Figure 5.23 describes the trends in
DTCA expenditures and number of prescriptions written for advertised gastrointestinal
drugs, and number of gastrointestinal-related physician visits from 1994 through 2001.
The total DTCA expenditures increased dramatically from $2.9 million in 1994 to
$26.6 million in 1995, but decreased to $17.5 million in 1996. The total DTCA
expenditures for gastrointestinal drugs have been rising consistently since 1996 to 2001
($165.0 million). The number of prescriptions written for these drugs has also risen since
1994 (9.3 million) to 1999 (26.4 million), but decreased in 2000 (25.4 million) and 2001
(24.5 million). The highest growth in number of prescriptions written was in 1995 when
it increased by 62.4 percent (1994 – 9.3 million, 1995-15.0 million). The trend in total
DTCA expenditures and number of prescriptions written for gastrointestinal drugs were
similar from 1996 through 1999.

260
Figure 5.23: Trends in Total DTCA Expenditures and Number of Prescriptions Written for Gastrointestinal Drugs* and Number of Gastrointestinal-Related
Physician Visits, 1994-2001
$2.857
$26.598$17.474
$42.316$49.736
$80.146
$164.961
$142.107
19.039
31.823
22.160 23.20325.566 24.623
29.315
25.977
31.197
9.265
15.042
17.011
23.330
26.416
25.39024.480
$0
$30
$60
$90
$120
$150
$180
1994 1995 1996 1997 1998 1999 2000 2001
Year
DT
CA
Exp
end
itu
res
(in
m
illio
ns)
0
5
10
15
20
25
30
35
Nu
mb
er o
f P
hys
icia
n V
isit
s (i
n
mill
ion
s)N
um
ber
of
Pre
scri
pti
on
s W
ritt
en (
in m
illio
ns)
Total DTCA Expenditures for Gastrointestinals Total gastrointestinal-related Visits
Number of Prescriptions Written for Gastrointestinals
* - Zantac®, Propulsid®, Prilosec®, Prevacid®, Helidac®, Lotronex®, Nexium®
Except for two years (1997 and 1999) when number of visits fell slightly, the
remainder years have shown a modest increase in the number of gastrointestinal-related
physician visits. The greatest increase in the number of gastrointestinal-related visits was
in 2000 when it increased by 20.1 percent (1999 – 26.0 million, 2000 – 31.2 million).
Overall DTCA expenditures, number of gastrointestinal-related visits and number
of prescriptions written for gastrointestinal drugs increased from 1994 to 2001 by 5,674.9
percent, 43.6 percent and 164.2 percent, respectively. Following the relaxation of
guidelines for DTCA, the expenditures for DTCA, number of gastrointestinal-related

261
visits and number of prescriptions written for gastrointestinals increased from 1997 to
1998 by 17.5 percent, 19.1 percent, and 22.5 percent, respectively.
The number of gastrointestinal-related visits were always higher than number of
prescriptions written for gastrointestinal drugs. During the gastrointestinal-related visits,
the patients were not always prescribed the advertised drugs. They may have not been
prescribed any drug, or were prescribed a drug that was not advertised, or an OTC
medication was recommended. Table 5.8 presents the visits when at least one advertised
gastrointestinal drug was prescribed and/or visit was recorded as a gastrointestinal-related
visit.
The percentage of gastrointestinal-related visits when the patient was not
prescribed at least one advertised gastrointestinal drug decreased each year from 1994
(67.5%) to 1999 (40.7%), but increased in 2000 (48.1%) and 2001 (49.3%). The
percentage of visits not recorded as a gastrointestinal-related visit, but associated with at
least one advertised gastrointestinal drug increased from 21.6 percent in 1994 to 37.6
percent in 1999, decreasing once in 1996 (26.7%). In 2000 and 2001, visits when
advertised gastrointestinal drug was prescribed but was not recorded as a gastrointestinal-
related visit decreased to 34.4 percent and 33.4 percent, respectively. The proportion of
gastrointestinal-related visits during which patients received at least one prescription for
advertised gastrointestinal drugs increased since 1994, but in general has held steady to
just under 22.0 percent.

262
Table 5.8: Number and Percentage of Gastrointestinal-Related Physician Visits And/Or Visits when at Least One Advertised Gastrointestinal Drug* was
Prescribed, 1994-2001Number of Visits
Advertised Drug Not Prescribed
Advertised Drug Prescribed
Year Gastrointestinal-Related Visit
Not Gastrointestinal-Related Visit
Gastrointestinal-related Visit
Total Number of
Visits1994(%)
19,080,815(67.48%)
6,118,614(21.64%)
3,078,752(10.89%)
28,278,181(100.0%)
1995(%)
18,092,676(56.46%)
8,841,543(27.59%)
5,110,434(15.95%)
32,044,653(100.0%)
1996(%)
19,043,526(54.59%)
9,319,065(26.71%)
6,522,299(18.70%)
34,884,890(100.0%)
1997(%)
17,320,854(49.40%)
10,441,622(29.78%)
7,302,317(20.83%)
35,064,793(100.0%)
1998(%)
20,660,904(48.85%)
12,976,505(30.68%)
8,653,821(20.46%)
42,291,230(100.0%)
1999(%)
16,916,875(40.66%)
15,634,080(37.57%)
9,059,840(21.77%)
41,610,795(100.0%)
2000(%)
22,877,052(48.11%)
16,354,128(34.39%)
8,319,720(17.50%)
47,550,900(100.0%)
2001(%)
23,553,800(49.28%)
15,976,991(33.42%)
8,269,615(17.30%)
47,800,406(100.0%)
* - Zantac®, Propulsid®, Prilosec®, Prevacid®, Helidac®, Lotronex®
In order to understand the prescribing trends for the advertised gastrointestinals, the
number of prescriptions written for each of the advertised gastrointestinal drugs from
1994 to 2001 were examined (Figure 5.24). The specific data for the number of
prescriptions written for each advertised gastrointestinal drug can be found in Appendix
D. In 1994, only Propulsid® and Zantac® were available in the market and 87.5 percent
(8.1 million prescriptions) of the prescriptions written were for Zantac®. Although the
number of prescriptions written for Zantac® increased in 1995, its market share
decreased to 60.2 percent with the introduction of Prilosec® in the market. In addition,
Zantac® 75 mg strength was switched to over-the-counter status in December 1995.
Fewer prescriptions have been written for Zantac® since then with number of

263
prescriptions written decreasing to 4.5 million in 2001. In 1994 and 1995, the majority of
prescriptions were written for Zantac®. From 1996 (40.7%) to 2001 (44.5%), Prilosec®
was the most heavily prescribed drug among the advertised gastrointestinal drugs
selected for the study. Since 1996, the proportion of prescriptions written for Propulsid®,
decreased from 15.1 percent to 2.5 percent in 2000. Propulsid® was withdrawn from the
market in July 2000.453
Figure 5.24: Trend in the Number of Prescriptions Written for Selected Advertised Gastrointestinal Drugs, 1994-2001
0
2
4
6
8
10
12
14
1994 1995 1996 1997 1998 1999 2000 2001
Year
Nu
mb
er o
f P
resc
rip
tio
ns
Wri
tten
(in
m
illio
ns)
Zantac® Propulsid® Prilosec® Prevacid® Helidac® Lotronex®
Note: Number of prescriptions written for Helidac® was less than 0.2 million. 1997 – 0.02 million, 1998 –0.1 million, 2000 – 0.03 million, 2001 – 0.1 million
Helidac® was prescribed in 1997, 1998, 2000 and 2001, but during all these four
years, Helidac® accounted for less than 0.5 percent of the advertised gastrointestinals
prescribed. Lotronex®, introduced in February 2000 and withdrawn in November
453 FDA Talk Paper: Janssen Pharmaceutica Stops Marketing Cisapride in the US. Food and Drug Administration. March 23, 2000. Available at: http://www.fda.gov/bbs/topics/ANSWERS/ANS01007.html. Accessed September, 2004.

264
2000,454 accounted for only 1.2 percent (0.3 million) of prescriptions written for
advertised drugs.
Demographic Characteristics (Age, Gender) and Health Insurance Coverage
This section presents the demographic characteristics of the individuals with
gastrointestinal-related physician visits and individuals who received prescriptions for
advertised gastrointestinal drugs. Among individuals who reported gastrointestinal
complaints and/or were diagnosed with a gastrointestinal problem, the percentage of
women, percentage of individuals with health insurance coverage, and percentage of
individuals 45 years and older were identified (Figure 5.25).
Figure 5.25: Trends in Percentage of Women, Percentage of Individuals with Health Insurance Coverage, and Percentage of Individuals 45 years and Older Among
those with Gastrointestinal-Related Visits, 1994-2001
91.4 90.3 90.9 95.0 94.4 95.2 94.7 93.661.964.063.9 63.1
57.2 56.8
57.962.3
54.5 52.4 60.8 60.5 57.9 60.3
62.5 61.6
0
20
40
60
80
100
1994 1995 1996 1997 1998 1999 2000 2001
Year
Per
cent
Percent Individuals with Health Insurance Coverage
Percent Women
Percentage of Individuals 45 years and older
Note – Percent was calculated from total number of individuals with gastrointestinal-related visits
Among individuals who reported gastrointestinal-related symptoms and/or were
diagnosed with gastrointestinal-related conditions, the majority were women (56.8-
454 Glaxo Wellcome Decides to Withdraw Lotronex from the Market. Food and Drug Administration. November 28, 2000. Available at: http://www.fda.gov/bbs/topics/ANSWERS/ANS01058.html. Accessed September, 2004.

265
64.0%), had health insurance coverage (90.3-95.2%) and were 45 years and older (52.4-
62.5%).
Figure 5.26 describes the trends in the percentage of women, percentage of
individuals with health insurance coverage and percentage of individuals 45 years and
older among those received a prescription for an advertised gastrointestinal drug. Among
those who received a prescription, women accounted for 56.1-62.0 percent whereas those
with coverage ranged from 91.7-96.8 percent from 1994 through 2001.
Figure 5.26: Trends in Percentage of Women, Percentage of Individuals with Health Insurance Coverage, and Percentage of Individuals 45 years and Older Among those who Received Prescriptions for Advertised Gastrointestinal Drugs*, 1994-
2001
95.494.2 91.7 93.7 94.3 96.4 96.6 96.8
56.8 59.4 60.8 56.1 61.6 58.2 59.6 62.0
70.078.7 75.8 76.8 80.3 77.8 77.4 82.5
0.0
20.0
40.0
60.0
80.0
100.0
1994 1995 1996 1997 1998 1999 2000 2001
Year
Per
cent
Percent Individuals with Health Insurance Coverage
Percent Women
Percent Individuals 45 years and older
* - Zantac®, Propulsid®, Prilosec®, Prevacid®, Helidac®, Lotronex®Note – Percent was calculated from total number of individuals who received a prescription for gastrointestinals.
The majority of the prescriptions written for advertised gastrointestinals were for
individuals 45 years and older (70.0-82.5%). The data for percentage of women,
percentage of individuals with coverage and percentage of individuals 45 years and older

266
among those who received a prescription for advertised gastrointestinals are provided in
Appendix E, F, and G, respectively. Age was further categorized into six groups of
individuals who received prescription for gastrointestinals: under 15 years, 15 to 24
years, 25 to 44 years, 45 to 64 years, 65 to 74 years, and 75 years and older. The major
proportion of the prescriptions for advertised gastrointestinals were written for
individuals 45 to 64 years of age (29.7-41.4%). The prescribing patterns for advertised
gastrointestinal drugs for these different age categories are provided in Appendix H.
Prescription Drug Expenditures
This section presents the drug expenditures and their trends for the following
advertised gastrointestinal drugs: Zantac®, Propulsid®, Prilosec®, Prevacid®, Helidac®,
and Lotronex®. As mentioned in the methodology, the total price of each drug was
calculated using the AWP and average dispensing fee. The drug expenditures were the
product of the estimated price and number of prescriptions written.
Figure 5.27 compares the trends in gastrointestinal-related visits, DTCA
expenditures, prescription drug expenditures and prescriptions written for advertised
gastrointestinal drugs for each year from 1994 through 2001. Total drug expenditures for
advertised gastrointestinals selected for the study increased steadily from 1994 to 2001.
The increase in expenditures was the highest in 1995 when it increased by 130.4 percent
from $433.1 million in 1994 to $997.9 million in 1995. The expenditures began to level
off in 2000 ($2,676.4 million) and 2001 ($2,737.2 million).

267
Figure 5.27: Trends in Total Prescription Drug Expenditures, Total DTCA Expenditures and Number of Prescriptions Written for Gastrointestinal Drugs* and
Number of Gastrointestinal-Related Physician Visits, 1994-2001
$2.857 $26.598 $17.474 $42.316 $49.736 $80.146 $142.107 $164.961
$433.118
$2,509.367
$2,676.422
$2,737.216
$997.862
$1,274.773
$1,521.888
$1,973.245
29.315
9.265
24.62325.566
23.20322.160
25.977
31.197
31.823
24.480
15.04217.011
19.039
23.330 26.41625.390
$0
$500
$1,000
$1,500
$2,000
$2,500
$3,000
1994 1995 1996 1997 1998 1999 2000 2001
Year
Exp
endi
ture
s ($
in m
illio
ns)
0
5
10
15
20
25
30
35
Num
ber
of P
hysi
cian
Vis
its (
in m
illio
ns)
Num
ber
of P
resc
riptio
ns W
ritte
n (in
m
illio
ns)
Total DTCA Expenditures for Gastrointestinals
Total Drug Expenditures for Gastrointestinals
Number of Gastrointestinal Visits
Number of Prescriptions Written for Gastrointestinals
* - Zantac®, Propulsid®, Prilosec®, Prevacid®, Helidac®, Lotronex®, Nexium®
The total DTCA expenditures for gastrointestinals increased by 5,674.9 percent
from 1994 to 2001 and total prescription drug expenditures for advertised
gastrointestinals increased by 532.0 percent. The number of gastrointestinal-related visits
and number of prescriptions written for gastrointestinal drugs increased from 1994 to
2001 by 43.6 percent, and 164.2 percent, respectively. Following the relaxation of
guidelines for DTCA, in 1998, the DTCA expenditures and total prescription
expenditures for gastrointestinals increased by 17.5 percent and 29.7 percent, respectively
from 1997. The number of gastrointestinal-related visits and number of prescriptions

268
written for gastrointestinals increased from 1997 to 1998 by 19.1 percent and 22.5
percent, respectively. However, since 1999, the number of prescriptions written has
shown a decrease.
Figure 5.28 presents the total drug expenditures for each of the advertised
gastrointestinal drugs. Two products, Prilosec® and Prevacid® showed a steady increase
in expenditures from 1995 to 2001. In 1994, Zantac® had the highest expenditures. In
1995, the expenditures for Zantac® ($472.0 million) were only slightly higher than
expenditures for Prilosec® ($465.7 million). The total expenditures for Zantac® have
been decreasing since 1995 and Prilosec® had the highest expenditures from 1996
($769.2 million) to 2001 ($1,374.2 million). The specific data for prescription drug
expenditures for advertised gastrointestinals are provided in Appendix I.
Figure 5.28: Trends in Prescription Drug Expenditures for Selected Advertised Gastrointestinal Drugs, 1994 – 2001
$0
$200
$400
$600
$800
$1,000
$1,200
$1,400
$1,600
1994 1995 1996 1997 1998 1999 2000 2001
Year
Exp
endi
ture
s ($
in m
illio
ns)
Helidac® Lotronex® Prevacid® Prilosec®
Propulsid® Zantac®

269
Antidepressants
DTCA Expenditures
Figure 5.29 presents the trend in DTCA expenditures for the following
antidepressants from 1994 through 2001: Effexor®, Prozac®, Paxil®, Serzone®,
Wellbutrin®, and Zoloft®. It was noted that no expenditures occurred for broadcast
media advertising from 1994 through 1998. From 1999 through 2001, broadcast media
advertising increased dramatically to over $150.0 million in 2001. In addition, it was
noted that among the five drug classes selected for the study, antidepressants had the
highest advertising dollars spent on broadcast media ($268.8 million, 64.6%) from 1994
to 2001. In 2001, broadcast media represented 82.3 percent ($151.9 million) of the total
DTCA expenditures for antidepressants.
Figure 5.29: Trends in Total DTCA Expenditures and DTCA Expenditures by Media Outlet for Antidepressants*, 1994-2001
$9.101$21.789
$32.594$23.053
$93.872
$151.881
$0.000$4.241 $7.560
$34.543 $37.542 $32.154
$115.661
$184.475
$0
$40
$80
$120
$160
$200
1994 1995 1996 1997 1998 1999 2000 2001
Year
DT
CA
Exp
endi
ture
s ($
in m
illio
ns)
Print and Other Television/Radio Total DTCA Expenditures for Antidepressants
* - Effexor®, Prozac®, Paxil®, Serzone®, Wellbutrin®, Zoloft®Other – Outdoor advertisements (billboard)

270
In order to understand the trends in advertising expenditures for antidepressants,
the total DTCA expenditures for each of the antidepressants were examined from 1994
through 2001 (Table 5.9). Effexor®, Paxil®, and Prozac® were the only three drugs that
were advertised for four or more years. Serzone®, approved in December 1994, was
advertised only in 1997 ($4.6 million). Wellbutrin® was advertised in 2000 ($0.1
million) and 2001 ($25.1 million) whereas Zoloft® ($55.9 million) was advertised only
in 2001. Effexor® was the only drug advertised in 1995 and 1996. In 1997 and 1998,
Prozac® had the highest total DTCA expenditures, but from 1999 to 2001, DTCA
expenditures for Paxil® surpassed DTCA expenditures for all other antidepressants
selected.
Table 5.9: Total DTCA Expenditures (in millions) for Antidepressants, 1994-2001Year Effexor® Paxil® Prozac® Serzone® Wellbutrin® Zoloft® Total1994 -- -- -- -- -- -- $0.00001995 $4.2406 -- -- -- -- -- $4.24061996 $7.5595 -- -- -- -- -- $7.55951997 $6.2853 $1.0061 $22.6104 $4.6414 -- -- $34.54321998 $0.0250 -- $37.5168 -- -- -- $37.54181999 -- $31.5132 $0.6407 -- -- -- $32.15392000 $0.4704 $91.7984 $23.2517 -- $0.1402 -- $115.66072001 $0.0282 $65.1462 $38.2614 -- $25.1322 $55.9066 $184.4746
Depression-Related Physician Visits and Prescriptions Written for Antidepressants
As mentioned in the methodology, the number of visits during which patients
reported symptoms or complaints and/or were diagnosed with conditions, which are
treated with antidepressants selected for the study were identified. These visits will be
referred to as depression-related visits. Figure 5.30 compares the trends in total DTCA
expenditures and number of prescriptions written for the selected antidepressants and the
number of depression-related visits from 1994 to 2001.

271
The total DTCA expenditures increased from $4.2 million in 1995 to $184.5
million in 2001 with a decrease in expenditures only in 1999 ($32.2 million). The greatest
increases in DTCA expenditures were in 1997 (1996 - $7.6 million, 1997 – $34.5
million) and 2000 (1999 - $32.2 million, 2000 - $115.7 million) when they increased by
357.0 percent and 259.7 percent, respectively.
Figure 5.30: Trends in Total DTCA Expenditures and Number of Prescriptions Written for Antidepressants* and Number of Depression-Related Physician Visits,
1994-2001
$0.000 $4.241 $7.560
$34.543 $37.542 $32.154
$184.475
$115.661
19.781
40.400
36.23337.661
44.766 44.64042.018
49.691
52.543
38.18235.31431.830
29.96728.560
17.54315.375
$0
$40
$80
$120
$160
$200
1994 1995 1996 1997 1998 1999 2000 2001
Year
DT
CA
Exp
endi
ture
s ($
in m
illio
ns)
0
10
20
30
40
50
60
Nu
mb
er o
f P
hys
icia
n V
isit
s (i
n m
illio
ns)
Nu
mb
er o
f P
resc
rip
tio
ns
Wri
tten
(in
m
illio
ns)
Total DTCA Expenditures for Antidepressants Number of depression-related Visits
Number of Prescriptions Written for Antidepressants
* - Effexor®, Prozac®, Paxil®, Serzone®, Wellbutrin®, Zoloft®
The number of prescriptions written for the advertised antidepressants increased
steadily from 15.4 million prescriptions in 1994 to 38.2 million in 2001. The greatest
increase in the number of prescriptions written for antidepressants was in 1997, when it
grew by 44.4 percent (1996 - 19.8 million, 1997 - 28.6 million). The number of
depression-related visits decreased from 40.4 million in 1994 to 36.2 million visits in

272
1995, but increased to 44.8 million visits in 1997. The number of visits again decreased
to 42.0 million in 1999, but increased to 52.5 million visits in 2001.
There was a tremendous increase in DTCA expenditures for antidepressants from
1994 to 2001 (4,250.2%) compared to the increase in the number of prescriptions written
for antidepressants (148.3%) and number of depression-related visits (30.1%). From
1997 to 1998, DTCA expenditures and number of prescriptions written for
antidepressants increased by 8.7 percent and 4.9 percent, respectively, whereas the
number of depression-related visits decreased by 0.3 percent. The largest increase in
DTCA expenditures occurred from 1999 to 2001. There was a 473.7 percent increase in
DTCA expenditures; however, the number of prescriptions written for the same time
period increased by 25.1 percent and gastrointestinal-related visits increased by 20.0
percent.
It was also noted that the number of depression-related visits was higher than
number of prescriptions written for the advertised antidepressants selected for the study.
During the depression-related visits, physicians may have prescribed an antidepressant
not selected for the study or may not have recommended a drug intervention. Table 5.10
presents the visits when patient reported symptoms and/or were diagnosed with
conditions treated with advertised antidepressants and/or were prescribed advertised
antidepressants.
The percentage of visits when advertised antidepressants were not prescribed but
the visit was recorded as a depression-related visit decreased from 66.2 percent in 1994 to
45.0 percent in 1999, but increased to approximately 47.0 percent in 2000 and 2001. The

273
percentage of visits when the visits were not recorded as depression-related visit, but
advertised antidepressant was prescribed increased from 9.4 percent in 1994 to 24.7
percent in 1999, but decreased to 22.9 percent in 2000 and again increased to 24.5
percent in 2001.
Table 5.10: Number and Percentage of Depression-Related Visits and/or Visits when at Least One Advertised Antidepressant* was Prescribed, 1994-2001
Number of VisitsAdvertised Drug Not Prescribed
Advertised Drug PrescribedYear
Depression-Related Visit
Not Depression-Related Visit
Depression-related Visit
Total Number of Visits
1994(%)
29,491,155(66.16%)
4,171,961(9.36%)
10,909,297(24.48%)
44,572,413(100%)
1995(%)
24,487,125(58.52%)
5,612,520(13.41%)
11,745,743(28.07%)
41,845,388(100%)
1996(%)
25,737,732(57.09%)
7,418,767(16.46%)
11,923,145(26.45%)
45,079,644(100%)
1997(%)
27,710,885(49.77%)
10,915,404(19.60%)
17,055,494(30.63%)
55,681,783(100%)
1998(%)
27,249,692(48.29%)
11,794,851(20.90%)
17,389,915(30.81%)
56,434,458(100%)
1999(%)
25,107,080(45.00%)
13,775,890(24.69%)
16,910,745(30.31%)
55,793,715(100%)
2000(%)
30,316,094(47.01%)
14,792,741(22.94%)
19,374,742(30.05%)
64,483,577(100%)
2001(%)
32,566,097(46.82%)
17,016,963(24.46%)
19,976,811(28.72%)
69,559,871(100%)
* - Effexor®, Prozac®, Paxil®, Serzone®, Wellbutrin®, Zoloft®
The number of prescriptions written for each of the advertised antidepressants
selected for the study were examined for the time period 1994 through 2001 (Figure
5.31). Appendix D presents specific data for the number of prescriptions written for each
advertised antidepressant. Prozac®, Paxil®, and Zoloft® have been the most heavily
prescribed advertised antidepressants from 1994 to 2001. Among the antidepressants
selected, Prozac® was the most heavily prescribed drug from 1994 to 1997. From 1998

274
to 2000, the majority of the prescriptions were written for Zoloft® and in 2001, Paxil®
was the most heavily prescribed drug among the advertised antidepressants selected.
Figure 5.31: Trend in the Number of Prescriptions Written for Selected Advertised Antidepressants, 1994-2001
0
2
4
6
8
10
12
1994 1995 1996 1997 1998 1999 2000 2001
Year
Num
ber
of P
resc
riptio
ns W
ritte
n (in
m
illio
ns)
Effexor® Prozac® Paxil® Wellbutrin® Zoloft® Serzone®
Demographic Characteristics (Age, Gender) and Health Insurance Coverage
This section presents the demographic characteristics of patients with depression-
related visits and patients who received prescriptions written for advertised antidepressant
products. Among all depression-related visits, women accounted for 63.5-67.3 percent of
the visits and individuals with health insurance coverage accounted for 80.6-86.1 percent
of visits between 1994 and 2001. In addition, from 1994 to 2001, there was an almost an
even split in the proportion of depression-related visits by individuals less than 45 years
and 45 years and older (Figure 5.32).

275
Figure 5.32: Trends in Percentage of Women, Percentage of Individuals with Health Insurance Coverage, and Percentage of Individuals 45 years and Older Among
those with Depression-Related Visits, 1994-2001
67.363.563.664.864.764.964.366.1
49.4 49.653.4 52.7
50.952.7
49.349.8
85.781.7 81.8 82.0 80.6 83.1 80.7 86.1
0
20
40
60
80
100
1994 1995 1996 1997 1998 1999 2000 2001
Year
Per
cent
Percent women
Percent Individuals 45 years and older
Percent Individuals with Health Insurance Coverage
Note – Percent was calculated from total number of individuals with depression-related visits
Figure 5.33 presents the percentage of women, percentage of individuals with
health insurance coverage and percentage of individuals 45 years and older among those
who received a prescription for an advertised antidepressant from 1994 to 2001. During
all the years from 1994 to 2001, among individuals who received prescriptions for
advertised antidepressants, a majority were women (65.3-73.2%) and had health
insurance coverage (83.9-89.5%). From 1994 to 2001, there was again almost an even
split in the proportion of individuals who received a prescription for advertised
antidepressants and were less than 45 years and 45 years and older (45 years and older:
47.3-56.6%).
Data for the percentage of women, percentage of individuals with health
insurance coverage and percentage of individuals 45 years and older among those who

276
received a prescription for advertised antidepressants are provided in Appendix E, F, and
G, respectively. Age was further categorized into the following six groups for individuals
who received prescriptions for the antidepressants selected: under 15 years, 15 to 24
years, 25 to 44 years, 45 to 64 years, 65 to 74 years, and 75 years and older. The majority
of the prescriptions for advertised antidepressants were written for individuals 25 to 64
years of age (67.9-76.0%). The distribution for antidepressants prescribed for individuals
in these age categories is also provided in Appendix H.
Figure 5.33: Trends in Percentage of Women, Percentage of Individuals with Health Insurance Coverage, and Percentage of Individuals 45 years and Older Among those who Received Prescriptions for Advertised Antidepressants*, 1994-2001
73.269.2 69.9 67.7 69.767.8 67.5 65.3
85.9 85.4 86.2 85.9 89.1 87.0 83.989.5
47.3
52.0 50.4 56.5 54.2 56.6 53.0 54.7
0
20
40
60
80
100
1994 1995 1996 1997 1998 1999 2000 2001
Year
Per
cent
Percent Women
Percent Individuals with Health Insurance Coverage
Percent Individuals 45 years and older
* - Effexor®, Prozac®, Paxil®, Serzone®, Wellbutrin®, Zoloft®Note – Percent was calculated from total number of individuals who received a prescription for an advertised antidepressant
Prescription Drug Expenditures
This section presents the drug expenditures for antidepressants selected for the
study including Effexor®, Prozac®, Paxil®, Serzone®, Wellbutrin®, and Zoloft®. As

277
presented in the methodology, the expenditures were a product of the number of
prescriptions written and total price (sum of AWP and average dispensing fee) of the
drug. Figure 5.34 presents the trends in drug expenditures for the antidepressants selected
along with their DTCA expenditures and number of prescriptions written for the
antidepressants and depression-related visits.
Figure 5.34: Trends in Total Prescription Drug Expenditures, Total DTCA Expenditures and Number of Prescriptions Written for Antidepressants* and
Number of Depression-Related Visits, 1994-2001
$0.000 $4.241 $7.560 $34.543 $37.542 $32.154$115.661
$184.475
$894.347$1,019.234
$1,198.616
$1,748.653$1,865.328
$2,034.991
$2,232.720
$2,670.112
40.40036.233 37.661
44.76644.640
42.018
49.69152.543
15.37517.543
19.781
28.56029.967
31.83035.314
38.182
$0
$500
$1,000
$1,500
$2,000
$2,500
$3,000
1994 1995 1996 1997 1998 1999 2000 2001
Year
Exp
endi
ture
s ($
in m
illio
ns)
0
10
20
30
40
50
60
Num
ber
of P
hysi
cian
Vis
its (
in m
illio
ns)
Num
ber
of P
resc
riptio
ns W
ritte
n (in
mill
ions
)Total DTCA Expenditures for Antidepressants Total Drug Expenditures for Antidepressants
Number of Depression-related Visits Number of Prescriptions Written for Antidepressants
* - Effexor®, Prozac®, Paxil®, Serzone®, Wellbutrin®, Zoloft®
The total drug expenditures increased consistently each year from $894.3 million
in 1994 to $2,670.1 million in 2001. The greatest increase in expenditures was in 1997
when expenditures increased from $1,198.6 million in 1996 to $1,748.7 million in 1997,

278
a 45.9 percent increase. The prescription expenditures for advertised antidepressants
increased by 198.6 percent from 1994 to 2001 whereas DTCA expenditures, number of
prescriptions written for advertised antidepressants, and number of depression-related
visits increased 4,250.2 percent, 148.3 percent, and 30.1 percent, respectively. Total
prescription drug expenditures, DTCA expenditures, and number of prescriptions written
for antidepressants increased by 6.7 percent, 8.7 percent, and 4.9 percent, respectively,
from 1997 to 1998 whereas the number of depression-related visits decreased by 0.3
percent. There was a greater percentage increase in number of prescriptions written for
advertised antidepressants from 1994 to 1997 (85.8%) compared to after 1997 (1997 to
2001 – 33.7%). Similarly, the percentage increase in drug expenditures was higher from
1994 to 1997 (95.5%) than following 1997(1997 to 2001 – 52.7%).
Figure 5.35 depicts the trends in total drug expenditures for each of the advertised
antidepressants selected. Prozac®, Zoloft®, and Paxil® followed the same pattern in
drug expenditures from 1994 to 1999. The difference between the three narrowed
considerably from 1999 through 2001. Expenditures for Prozac® were the highest
compared to the other advertised antidepressants from 1994 to 1999. In 2000,
expenditures for Prozac® decreased (1999-$630.0 million, 2000-$557.1 million) and
Zoloft® had the highest expenditures ($663.2 million). In 2001, Paxil® had the highest
expenditures ($785.8 million), but there were only minor differences in drug expenditures
between the three drugs (Prozac® - $767.6 million, Zoloft® - $726.7 million). The data
on the total drug expenditures for each of the advertised antidepressants are provided in
Appendix I.

279
Figure 5.35: Trends in Prescription Drug Expenditures for Selected Advertised Antidepressants, 1994-2001
$0
$200
$400
$600
$800
$1,000
1994 1995 1996 1997 1998 1999 2000 2001
Year
Exp
endi
ture
s ($
in m
illio
ns)
Effexor® Paxil® Prozac® Serzone® Wellbutrin® Zoloft®
Antihypertensives
DTCA Expenditures
This section presents the trend in DTCA expenditures from 1994 through 2001 for
the following antihypertensive drugs: Adalat®, Altace®, Capoten®, Cardizem®,
Cardura®, Coreg®, Lotensin®, and Toprol XL®. Figure 5.36 provides yearly DTCA
expenditures for antihypertensive drugs selected for the study by media outlet. Contrary
to general trend of increased DTCA expenditures since 1997 for the other drug classes
examined, DTCA expenditures for antihypertensives dropped after 1997. DTCA
expenditures increased from $5.2 million in 1994 to $42.6 million in 1997, following
which, they decreased to $55,000 in 2001.
Except in 1995 (Total – $20.0 million, Broadcast - $3.0 million) and 1996 (Total –
$42.6 million, Broadcast - $6.3 million), all advertising dollars were spent on print and

280
outdoor media. In 1995 and 1996, 14.9 percent of the total advertising dollars for
antihypertensives were spent each year on broadcast media.
Figure 5.36: Trends in Total DTCA Expenditures and DTCA Expenditures by Media Outlet for Antihypertensive Drugs*, 1994-2001
$2.985
$6.331
$17.053
$36.246
$42.577
$5.242
$20.038
$0.200
$3.184
$6.788
$2.416$0.055
$0
$9
$18
$27
$36
$45
1994 1995 1996 1997 1998 1999 2000 2001
Year
DT
CA
Exp
endi
ture
s ($
in m
illio
ns)
Print and Other Television/Radio Total DTCA Expenditures for Antihypertensives
Note: Other - Outdoor advertisements (billboards)* - Adalat®, Altace®, Capoten®, Cardizem®, Cardura®, Coreg®, Lotensin®, Toprol XL®
Table 5.11 depicts DTCA expenditures from 1994 to 2001 for each of the
antihypertensive drugs selected for the study. In 1994, Lotensin® had the highest DTCA
expenditures. In 1995 and 1999, Cardizem® was the most heavily advertised drug and in
1997 and 2000, Cardura® had the highest DTCA expenditures among the
antihypertensives selected. In 1996 and 1998, Adalat® and Altace® were the most

281
heavily advertised antihypertensive drugs, respectively. In 1998 and 2001, Altace® and
Lotensin® were the only antihypertensive drug advertised, respectively.
Table 5.11: Total DTCA Expenditures (in millions) for Antihypertensive Drugs, 1994-2001
Year Adalat® Altace® Capoten® Cardizem® Cardura® Coreg® Lotensin®Toprol®
XL Total1994 -- -- $0.7131 -- -- -- $4.5284 -- $5.24151995 $0.8390 -- $2.9851 $11.3260 -- -- $4.8876 -- $20.03771996 $17.5278 -- -- $10.8699 $13.9374 --- $0.1449 $0.0969 $42.57691997 -- $0.1000 -- $0.4240 $5.9465 -- $0.2102 $0.1076 $6.78831998 -- $0.2000 -- -- -- -- -- -- $0.20001999 -- -- -- $1.6959 -- $1.4876 -- -- $3.18352000 -- -- -- -- $2.0039 $0.1583 $0.2535 -- $2.41572001 -- -- -- -- -- -- $0.0550 -- $0.0550
Hypertension-Related Physician Visits and Prescriptions Written for
Antihypertensives
This section presents the number of visits when patients reported hypertension-
related symptoms and/or were diagnosed with hypertension and the number of
prescriptions written for the selected antihypertensives. These visits during which
patients reported symptoms of hypertension and/or were diagnosed with hypertension
will be referred to as hypertension-related visits.
Figure 5.37 depicts the annual DTCA expenditures for antihypertensives, number of
prescriptions written for the antihypertensive drugs, and the number of hypertension-
related visits. Total DTCA expenditures increased from $5.2 million in 1994 to $42.6
million in 1996. However, total DTCA expenditures decreased dramatically in 1997 ($6.8
million) and 1998 ($0.2 million) followed by a slight increase in 1999 ($3.2 million), and
decreased again in 2000 ($2.4 million) and 2001($55,000).

282
The number of hypertension visits decreased from 49.4 million in 1994 to 46.6
million in 1995. However, the number of visits then began increasing each year from
56.7 million visits in 1996 to 70.6 million visits in 2001, a 24.4 percent increase. The
trend in the number of prescriptions written was not linear throughout the years or in
other words, the number of prescriptions written did not show a steady increase. In 1996,
while DTCA expenditures increased by 112.5 percent from 1995, hypertension-related
physician visits increased by 21.7 percent whereas the number of prescriptions written for
the advertised antihypertensives increased by 15.2 percent.
Figure 5.37: Trends in Total DTCA Expenditures and Number of Prescriptions Written for Advertised Antihypertensive Drugs* and Number of Hypertension-
Related Visits, 1994-2001
$20.038
$0.200$3.184 $2.416
$0.055
$5.242
$42.577
$6.78817.264 21.802
19.881
20.387
22.93716.770
14.557
14.891
49.356 46.602 56.717 57.469
61.77064.439
67.944 70.569
$0
$5
$10
$15
$20
$25
$30
$35
$40
$45
1994 1995 1996 1997 1998 1999 2000 2001
Year
DT
CA
Exp
endi
ture
s (in
mill
ions
)
0
10
20
30
40
50
60
70
80
Num
ber
of P
hysi
cian
Vis
its (
in
mill
ions
)N
umbe
r of
Pre
scrip
tions
W
ritte
n (in
mill
ions
)
Total DTCA Expenditures for Antihypertensives
Number of Prescriptions Written for Antihypertensives
Number of Hypertension-Related Visits
* - Adalat®, Altace®, Capoten®, Cardizem®, Cardura®, Coreg®, Lotensin®, Toprol XL®
Unlike other drug classes, DTCA expenditures for antihypertensives decreased by
99.0 percent from 1994 to 2001 while number of prescriptions written for

283
antihypertensives and number of hypertension-related visits increased by 46.4 percent
and 43.0 percent, respectively. Even with the relaxation of guidelines for broadcast
advertising in 1997, DTCA expenditures for antihypertensives decreased from 1997 to
1998 by 97.1 percent whereas number of prescriptions written for antihypertensives and
hypertension-related visits increased by 32.9 percent and 7.5 percent, respectively. Even
though DTCA expenditures for antihypertensives decreased from 1997, hypertension-
related visits increased at a fairly steady rate while the number of prescriptions written for
advertised antihypertensives increased with intermittent decreases.
During all the years from 1994 to 2001, the hypertension-related visits were always
higher than the number of prescriptions written for antihypertensives. During the
hypertension-related visits, patients were not always prescribed the advertised
antihypertensive drugs and during some visits when patients were prescribed the
advertised antihypertensive visits, hypertension-related symptoms and/or diagnosis were
not reported. Table 5.12 depicts the number and percentage of visits when advertised
antihypertensives were prescribed and/or visits when symptoms and/or diagnosis for
hypertension were reported.
Unlike other drug classes, there was no trend in the percentage of hypertension-
visits when advertised antihypertensives were not prescribed (69.6-75.6%) from 1994 to
2001. The percentage of visits when the advertised antihypertensive was prescribed but
no hypertension-related symptom and/or diagnosis were reported from 1994 to 2001 also
did not display a specific pattern (12.3-15.1%). During most years, except in 1998

284
(15.7%), 10.0-13.0 percent of hypertension-related visits were associated with at least
one prescription for advertised antihypertensive drug.
Table 5.12: Number and Percentage of Hypertension-Related Visits and/or Visits when at Least One Advertised Antihypertensive Drug* was Prescribed, 1994-2001
Number of VisitsAdvertised Drug Not Prescribed
Advertised Drug PrescribedYear
Hypertension-Related Visit
Not Hypertension-Related Visit
Hypertension-related Visit
Total Number of Visits
1994(%)
42,413,012(74.74%)
7,391,313(13.02%)
6,943,095(12.24%)
56,747,420(100.0%)
1995(%)
41,103,461(74.85%)
8,314,833(15.14%)
5,498,780(10.01%)
54,917,074(100.0%)
1996(%)
48,871,893(73.64%)
8,166,090(12.30%)
7,844,977(11.82%)
66,366,807(100.0%)
1997(%)
49,104,787(74.56%)
8,391,886(12.74%)
8,364,591(12.70%)
65,861,264(100.0%)
1998(%)
50,408,323(69.58%)
10,678,939(14.74%)
11,361,652(15.68%)
72,448,914(100.0%)
1999(%)
54,788,623(73.65%)
9,950,662(13.38%)
9,649,937(12.97%)
74,389,222(100.0%)
2000(%)
59,544,517(75.64%)
10,781,372(13.69%)
8,399,732(10.67%)
78,725,621(100.0%)
2001(%)
61,945,672(75.18%)
11,823,927(14.35%)
8,623,744(10.47%)
82,393,343(100.0%)
* - Adalat®, Altace®, Capoten®, Cardizem®, Cardura®, Coreg®, Lotensin®, Toprol XL®
Figure 5.38 shows the trends in number of prescriptions written for advertised
antihypertensive drugs from 1994 through 2001. The specific data for the number of
prescriptions written from 1994 to 2001 for each of the advertised antihypertensives are
provided in Appendix D. From 1994 to 1999, majority of the prescriptions were written
for Cardizem®. The number of prescriptions written for Toprol XL ® increased steadily
from 1994 to 2001 and by 2000, majority of the prescriptions were written for Toprol
XL®. In 2001, Toprol XL® was again the drug of choice. Other advertised
antihypertensive drugs did not exhibit any specific pattern or trend in the number of
prescriptions written for them each year.

285
Figure 5.38: Trend in the Number of Prescriptions Written for Selected Advertised Antihypertensive Drugs, 1994-2001
0
1
2
3
4
5
6
7
8
9
1994 1995 1996 1997 1998 1999 2000 2001
Year
Num
ber
of P
resc
riptio
ns W
ritte
n (in
mill
ions
)
Capoten® Toprol XL® Altace® Adalat® Cardura® Cardizem® Lotensin® Coreg®
Demographic Characteristics (Age, Gender) and Health Insurance Coverage
This section presents the demographic characteristics of individuals who reported
symptoms of hypertension and/or were diagnosed with hypertension (hypertension-
related visits) and individuals who received a prescription for an advertised
antihypertensive drug.
Figure 5.39 presents the trends in percentage of women, percentage of individuals
with health insurance coverage and percentage of individuals 45 years and older among
those with hypertension-related physician visits from 1994 through 2001. The majority of
the hypertension-related visits were by women (56.0-61.2%) and by individuals with

286
health insurance coverage (90.5-96.5%). It was also noted that among individuals with
hypertension-related visits, the majority (84.7-88.3%) were 45 years and older.
Figure 5.39: Trends in Percentage of Women, Percentage of Individuals with Health Insurance Coverage and Percentage of Individuals 45 years and Older Among those
with Hypertension-Related Physician Visits, 1994-2001
93.0
58.0 61.2 56.0 59.8 59.0 57.7 58.656.3
92.5 90.5 91.1 93.394.9 93.9 96.5
86.787.387.887.488.387.3
84.785.8
0
20
40
60
80
100
1994 1995 1996 1997 1998 1999 2000 2001
Year
Per
cent
Percent Women
Percent Individuals with Health Insurance Coverage
Percent Individuals 45 years and older
Note – Percent was calculated from total number of individuals with hypertension-related visits
Figure 5.40 presents the trends in percentage of women, percentage of
individuals with health insurance coverage, and percentage of individuals 45 years and
older among those who received a prescription for advertised antihypertensive drugs.
From 1994 to 1996, a majority of prescriptions were written for women (51.7-57.1%),
but from 1997 to 2001, fewer prescriptions for antihypertensives were written for women
compared to men (women – 41.8-48.0%). The majority of the individuals who received
prescriptions for advertised antihypertensives had health insurance coverage (87.2-
97.9%) and were 45 years and older (87.4-95.6%).

287
Figure 5.40: Trends in Percentage of Women, Percentage of Individuals with Health Insurance Coverage and Percentage of Individuals 45 years and Older Among those
who Received Prescriptions for Advertised Antihypertensives, 1994-2001
48.056.2 57.151.7
45.8 46.8 41.8 44.5
94.2
87.2
92.195.1 95.4 95.1 97.9 94.6
90.8
89.7
92.1 89.794.4 92.6 95.6
87.4
0
20
40
60
80
100
1994 1995 1996 1997 1998 1999 2000 2001
Year
Per
cent
Percent Women
Percent Individuals with Health Insurance Coverage
Percent Individuals 45 years and older
* - Adalat®, Altace®, Capoten®, Cardizem®, Cardura®, Coreg®, Lotensin®, Toprol XL®Note: Percent was calculated from total number of individuals who received a prescription for an advertised antihypertensive drug
The data for percentage of women, percentage of individuals with coverage, and
percentage of individuals 45 years and older among those who received a prescription for
advertised antihypertensives are provided in Appendix E, F, and G, respectively. Age was
further categorized into six groups of individuals who received prescriptions for
advertised antihypertensives: under 15 years, 15 to 24 years, 25 to 44 years, 45 to 64
years, 65 to 74 years and 75 years and older. The majority of the prescriptions for
advertised antihypertensives were written for individuals 45 to 64 years of age (28.7-
37.6%). The distribution or prescribing patterns for antihypertensives for these different
age categories are provided in Appendix H.

288
Prescription Drug Expenditures
This section presents the trends in total drug expenditures for advertised
antihypertensives from 1994 to 2001. The total expenditures were calculated using the
total price of drug (sum of AWP and average dispensing fees) and number of
prescriptions written for antihypertensives. Figure 5.41 presents the trends in total drug
expenditures along with DTCA expenditures and number of prescriptions written for
advertised antihypertensives and number of hypertension-related visits.
Figure 5.41: Trends in Total Prescription Drug Expenditures, Total DTCA Expenditures and Number of Prescriptions Written for Antihypertensive Drugs*
and Number of Hypertension-Related Physician Visits, 1994-2001
$5.242 $20.038 $42.577$6.788 $0.200 $3.184 $2.416 $0.055
$627.024 $621.343
$895.351$824.999
$759.988$858.578
$569.708
$593.982
49.35646.602
61.77064.439
67.944 70.569
57.46956.717
14.891 14.55716.770 17.264
22.937 20.387 19.881 21.802
$0
$100
$200
$300
$400
$500
$600
$700
$800
$900
$1,000
1994 1995 1996 1997 1998 1999 2000 2001
Year
Exp
endi
ture
s ($
in m
illio
ns)
0
10
20
30
40
50
60
70
80
Num
ber
of P
hysi
cian
Vis
its (i
n m
illio
ns)
Num
ber
of P
resc
ript
ions
Wri
tten
(in
mill
ions
)
Total DTCA Expenditures for Antihypertensives
Total Expenditures for Antihypertensives
Number of Hypertension-related Visits
Number of prescriptions w ritten for Antihypertensives
* - Adalat®, Altace®, Capoten®, Cardizem®, Cardura®, Coreg®, Lotensin®, Toprol XL®The total drug expenditures increased from $594.0 million in 1994 to $858.6
million in 2001, a 44.5 percent increase. Unlike other drug classes examined for this

289
study, total drug expenditures did not increase during each of the years from 1994 to
2001, but decreased in 1995 (4.1%), 1997 (0.9%), 1999 (7.9%) and 2000 (7.9%). The
greatest increase in total drug expenditures was in 1998 when it increased by 44.1 percent
from 1997 compared to a decrease in DTCA expenditures (97.1%) whereas the number
of prescriptions written for antihypertensives and hypertension-related visits increased by
32.9 percent and 7.5 percent, respectively.
Figure 5.42 presents the total expenditures for all the advertised antihypertensive
drugs. Cardizem® had the highest drug expenditures from 1994 to 2001. The total
expenditures for Cardizem® decreased from 1994 ($421.6 million) to 1997 ($249.8
million) followed by an increase in 1998 ($361.4 million). In 1999 the expenditures for
Cardizem® ($348.5 million) leveled off, but decreased in 2000 ($245.8 million) and
increased again in 2001 ($337.7 million). Although Toprol XL® was the most heavily
prescribed drug in 2000 and 2001 compared to other advertised antihypertensives,
Cardizem® had the highest drug expenditures and there was a considerable difference in
the expenditures between Cardizem® and the other advertised antihypertensive drugs.
The specific data for the drug expenditures for each of the antihypertensives are provided
in Appendix I.

290
Figure 5.42: Trends in Prescription Drug Expenditures for Selected Advertised Antihypertensive Drugs, 1994-2001
$0
$50
$100
$150
$200
$250
$300
$350
$400
$450
1994 1995 1996 1997 1998 1999 2000 2001
Year
Exp
endi
ture
s (
$ in
mill
ions
)
Adalat® Altace® Capoten® Cardizem®
Cardura® Coreg® Lotensin® Toprol XL®
SECTION III: TIME SERIES AND MIXED MODEL ANALYSES
The section presents the results of the time series and mixed model analyses.
Time series regression analysis was used to determine the relationship between the
number of physician visits and the independent variables age, gender, access (health
insurance coverage), and total DTCA expenditures (Objective I). The Yule-Walker
method or the Prais-Winsten method was used to correct the autocorrelation. For each
month, the following variables were calculated: DTCA expenditures for that class of
drugs, physician visits when symptoms and/or diagnoses were reported, percentage of
individuals 45 years and older, percentage of women, and percentage of individuals with
health insurance coverage. These percentages were calculated from the total number of
individuals with a physician visit for symptoms and/or diagnosis for conditions treated by

291
the advertised drugs from the respective drug classes selected for the study. Figure 5.43
provides a diagrammatic representation or outline of the time series analysis.
Figure 5.43: Outline for Time Series Analysis
Since the variables DTCA expenditures and number of physician visits included
large values and were skewed, these variables were transformed to their logarithmic
values and the above analysis (Figure 5.43) was repeated. If the results from the analysis
with transformed variables differed from the results of analysis with untransformed
variables, both results were reported. If both analyses yielded same variables as
significant, only results of analysis with untransformed variables were reported.
Interpret
Positive/Negative Autocorrelation or
Inconclusive
Adjust using Yule-Walker Method
No autocorrelation
Time Series Analyses:Entire time period: Jan.’94-Apr.’01
Split by time period: Jan.’94-Aug.’97 and Sept.’97-Apr.’01
Calculated Durbin-Watson Statistic

292
Repeated measures mixed model analyses were conducted to analyze the
relationships between selected independent variables and dependent variables (number of
prescriptions written and prescription drug expenditures) for Objectives II and III. Figure
5.44 provides an outline for the mixed model analysis. Mixed model analysis also
accounts for the fact that since this is a repeated measures model, the monthly
measurements may be correlated. An auto-regressive covariance structure was used to
model the within-subject (drug) correlation over time. Logarithmic transformations were
applied to the DTCA expenditures variable {log of (DTCA Expenditures +1) – one was
added since some values were zero}. The distributions for the variables physician visits,
number of prescriptions written and prescription drug expenditures were checked for
skewness and appropriate transformations (square root and logarithmic) were applied to
the variables. The models were reanalyzed with untransformed values to interpret the
results of the analysis with the transformed variables. The variables significant in the
transformed model may not be always be significant in the untransformed models and
vice-versa due to the non-linear effects of the extreme values of the untransformed
variables.
Figure 5.44: Outline for Mixed Model Analysis
Mixed Model Analysis With Transformed Variables (Visit, DTCA, Prescriptions Written and Expenditures)
Mixed Model Analysis With Untransformed Variables (Visit, DTCA, Prescriptions Written and Expenditures)
Split model by time period and analyze with Transformed Variables (Visit, DTCA, Prescriptions Written and Expenditures)

293
In the dataset for mixed model analysis, the visit variable was a month-level
variable and all other variables were month and drug-level. To confirm that this
difference in level of data does not suppress the significant relationships, the above
analysis with transformed variables was repeated (Figure 5.44) without the visit variable.
The relationships between age and the dependent variables visits, prescriptions
written and expenditures were further explored only for gastrointestinals and
antidepressants. The age variable for individuals 45 years and older was replaced by
variables representing individuals 25-44 years, 45-64 years and 65 years and older.
To determine if relationships between independent variables with all three
dependent variables were significant in both time periods (January 1994 to August 1997,
September 1997 to April 2001), the datasets were split by time period and analyzed. The
results for this objective (Objective IV) are described simultaneously with the other three
objectives. For all time series and mixed model analyses, DTCA expenditures and drug
expenditures were adjusted to 2001 dollars. The following five sections will present the
results of the time series and mixed model analyses for Objectives I, II, III and IV for the
five classes of drugs selected for the study: allergy medications, antilipemics,
gastrointestinals, antidepressants and antihypertensive drugs.
Allergy Medications
This section presents the time series and mixed model analyses results for
advertised allergy medications. The results for Objective IV, comparing the relationships
from Objectives I, II, and III for the two time periods (1) January 1994 to August 1997,

294
and (2) September 1997 to April 2001, will be presented simultaneously with the three
objectives.
Objective I
To determine the relationships of DTCA expenditures for allergy medications, access to
care, and demographics (age and gender) with physician visits for the symptoms and/or
diagnosis of allergy (allergy-related visits).
Time series analysis was employed to analyze the relationships. In this analysis
for the dependent variable monthly allergy-related visits based on reason for visit and
diagnosis, the independent variables included monthly total DTCA expenditures for all
allergy medications, percentage of individuals 45 years and older, percentage of women
and percentage of individuals with health insurance coverage. These percentages were
calculated from number of individuals with allergy-related visits. The variable time
period (January 1994 through August 1997, September 1997 to April 2001), which
categorized the time of visit, was also included. The results of the analysis with all the
untransformed variables were reconfirmed by analyzing model with transformed
(logarithmic) values for DTCA expenditures and visits. Analyzing the transformed
(logarithmic) or untransformed values for allergy-related visits and DTCA expenditures
yielded the same variables as significant and thus, the results of the analysis with all
untransformed variables are reported.
Time Series Analysis: January 1994 Through April 2001
The null hypothesis of no serial correlation present in the error term was tested at
p=0.05 level of significance for n=88 (88 months) observations of the dependent variable

295
monthly allergy-related physician visits. The critical values for positive autocorrelation
were identified as 1.542 to 1.776 and for negative autocorrelation greater than 2.458 (4.0-
1.542=2.458). The Durbin-Watson statistic was calculated to be 1.496. The null
hypothesis of no serial correlation present in the error term was rejected. Yule-Walker
(Prais-Winsten) method was used for the correction of the positive autocorrelation.
Ordinary least squares regression was used to determine the relationship between
the independent variables and the dependent variable monthly allergy-related physician
visits and the results are presented in Table 5.13. The adjusted R-square was 0.0835 and
the only significant variable was access or percentage of individuals with allergy-related
visits who had health insurance coverage {t=-2.993, p=0.0037}. The Pearson correlation
coefficient for access was -0.194 (p=0.071) and the unstandardized coefficient was
-71,701.0. The results show that an increase in percentage of individuals with allergy-
related visits and health insurance coverage was significantly related to a decrease in the
number of allergy-related visits while controlling for the other variables in the equation.
For every one percent increase in the individuals with allergy-related visits and health
insurance coverage (decrease in percentage of individuals without health insurance
coverage), there were 71,701 fewer allergy-related physician visits. Since the variable
access to care represents proportion of individuals with health insurance, the results
should be interpreted with caution because they may be valid only for the percentage
range of individuals with allergy-related visits and health insurance coverage included in
the dataset (71.8-100.0%, Mean – 90.4+5.5%).

296
Table 5.13: Test Statistics for Ordinary Least Squares Analysis for Allergy-Related Physician Visits Regressed on Age, Gender, Access, Total DTCA Expenditures for
Allergy Medications* and Time Period
B SEB BETA T SIG TAge (> 45 yrs) 10625.8 10465.6 0.1072 1.0153 0.3130Gender: Women -8427.8 16853.0 -0.0529 -0.5000 0.6184Access -71701.0 23959.4 -0.3365 -2.9926 0.0037**DTCA 8.4 8.1 0.1189 1.0303 0.3060Time 635189.0 368056.8 0.2071 1.7258 0.0882Constant 8322366.1 2214299.7 . 3.7585 0.0003
**p<0.05 * Claritin®, Allegra®, Zyrtec®, Hismanal®, Seldane®, Nasonex®, Flonase®Age, Gender, Access – Percentage of Individuals with allergy-related visits (45 years and older, women, with health insurance coverage), DTCA –DTCA Expenditures for allergy medications Time – January 1994 to August 1997, September 1997 to April 2001
Time Series Analyses: Split by Time (Objective IV)
To determine if significant relationships found in time period one were significant
in time period two (Objective IV), the dataset used in the above analysis was split by time
period (January 1994 to August 1997 and September 1997 to April 2001). Analyzing
with transformed variables did not yield the same results as analysis with untransformed
variables. The results of the analysis with transformed variables are reported here (Table
5.14). The critical interval for positive autocorrelation was identified as 1.336 to 1.720
and for negative correlation above 2.664 (4.0-1.336=2.664). The Durbin-Watson statistic
for time period one was calculated to be 1.501 and 1.802 for time period two. The null
hypothesis of no serial correlation present in error term for time period one was rejected
(autocorrelation), but not rejected for time period two. The Yule-Walker method was
employed to correct for autocorrelation in time period one. The results of the analyses are
presented in Table 5.14.

297
Table 5.14: Test Statistics for Ordinary Least Squares Analyses for Allergy-Related Physician Visits Regressed on Age, Gender, Access, and Total DTCA Expenditures
for Allergy Medications*for the Two Time Periods (Transformed Variables)†
Time Period 1 – January 1994 to August 1997B SEB BETA T SIG T
Age (> 45 yrs) -0.0022 0.0048 -0.0708 -0.4601 0.6481Gender: Women 0.0034 0.0088 0.0660 0.3857 0.7018Access -0.0204 0.0089 -0.3567 -2.285 0.0280**DTCA -0.0032 0.0227 -0.0243 -0.1430 0.8870Constant 16.5756 0.8638 . 19.1882 0.0000
Time Period 2 – September 1997 to April 2001B SEB BETA T SIG T
Age (> 45 yrs) 0.0092 0.0050 0.2761 1.8356 0.0740Gender: Women -0.0137 0.0077 -0.2591 -1.7679 0.0849Access -0.0326 0.0153 -0.3081 -2.1330 0.0393**DTCA 0.0472 0.0434 0.1597 1.0873 0.2836Constant 17.7402 1.5278 . 11.6113 0.0000
**p<0.05 * Claritin®, Allegra®, Zyrtec®, Hismanal®, Seldane®, Nasonex®, Flonase® Age, Gender, Access – Percentage of Individuals with allergy-related visits (45 years and older, women, with health insurance coverage)† Transformed variables – DTCA and Allergy-related visitsDTCA – DTCA Expenditures for allergy medications
The variable access or percentage of individuals with allergy-related visits and
health insurance coverage was found significant in both time periods. The unstandardized
coefficients for access was negative in both time periods indicating that an increase in the
percentage of individuals with allergy-related visits and had health insurance coverage
was significantly related to a decrease in allergy-related visits in both time periods while
controlling for the other variables in the equation. In time period one, the beta value for
access variable indicates a strong relationship with the number of allergy-related visits in
time period one compared to the other variables. The relationship was almost six times
stronger than the relationship of age and gender with allergy-related visits. However, in
time period two the difference in the strength of the relationships between access and

298
allergy-related visits and other variables with allergy-related visits was not as great as
compared to time period one.
The Pearson correlation coefficients for the variable access were –0.316
(p=0.036) for time period one and –0.346 (p=0.022) for time period two with
untransformed values for allergy-related visits. The Pearson correlation coefficient for the
variable access with transformed values for allergy-related visits was –0.329 (p=0.029) in
time period one and –0.319 (p=0.036) in time period two. Since the variable access was
represented as a percentage, the results for access in time period one (71.8-97.2%, Mean
– 87.7+5.8%) and two (84.6-100.0%, Mean – 93.0+3.7%) may be valid only for the range
of values in the current dataset.
The research hypotheses for Objective I regarding relationships of allergy-related
visits with age, gender, health insurance coverage and total DTCA expenditures for
allergy medications were not supported. The research hypothesis for Objective IV
regarding relationships being significant in time period one and two was supported.
Objective II
To determine the relationship between DTCA expenditures for allergy medications,
access to care, demographics (age and gender), allergy-related visits and the number of
prescriptions written for advertised allergy medications.
Mixed model analysis was employed to determine the relationships for Objective
II. The dependent variable for this analysis was number of prescriptions written for the
advertised allergy medications. The independent variables in the analysis were monthly
DTCA expenditures for allergy medications, allergy-related physician visits, percentage

299
of individuals 45 years and older, percentage of women, and percentage of individuals
who had health insurance coverage. These percentages were calculated from the total
number of individuals who received a prescription for each of the advertised allergy
medications each month. In addition, the dichotomous variable time period (January 1994
to August 1997, September 1997 to April 2001), which categorized the time when
prescription was written and its interaction with the independent variables were also
included in the analysis.
Mixed Model Analysis with Transformed Variables
To help control for their large values and skewness, the variable DTCA
expenditures for allergy medications was transformed to its logarithmic values and the
variables number of allergy-related visits and number of prescriptions written for allergy
medications were transformed to their square root values. The auto-regressive covariance
structure, modeling the within-subject (drug – allergy medications) correlation over time
(0.5877) or in other words the correlation between the number of prescriptions written for
the allergy medications separated by one time interval (1 month) was significant
(p<0.0001). The calculated R-square for this full model for the dependent variable
number of prescriptions written for the advertised allergy medications was 0.180,
signifying that 18.0 percent of the variance in the number of prescriptions written for
allergy medications is accounted for by the model. The results from the mixed model
analysis are presented in Table 5.15.
From Table 5.15 it can be seen that gender or among those who received a
prescription for advertised allergy medications percentage who were women {df=302,

300
t=2.02, p=0.0438}, DTCA expenditures for allergy medications {df=379, t=4.03,
p<0.0001}, and allergy-related physician visits {df=346, t = 6.67, p<0.001} were
significantly related to the number of prescriptions written for advertised allergy
medications. In addition, the interaction between DTCA expenditures and time period
{df=389, t=-2.06, p=0.0399} was also significant.
Table 5.15: Mixed Model Analysis for Prescriptions Written for Advertised Allergy Medications* Controlling for Age, Gender, Access, DTCA Expenditures for Allergy Medications*, Allergy-Related Physician Visits and Time (Transformed Variables)†
Time StandardEffect Period Estimate Error DF t Value Pr > |t|Intercept 110.68 138.74 358 0.80 0.4256Age ( >45 yrs) 0.4372 0.5243 294 0.83 0.4051Gender: Women 1.2125 0.5988 302 2.02 0.0438**Access -0.7663 1.2108 317 -0.63 0.5273DTCA 22.9589 5.6949 379 4.03 <.0001**Visit 0.2132 0.03199 346 6.67 <.0001**Time 1 -116.26 154.90 375 -0.75 0.4534 Time 2 0 . . . .Age*Time 1 -0.4289 0.6965 296 -0.62 0.5385Age*Time 2 0 . . . .Women*Time 1 -1.2842 0.8210 314 -1.56 0.1188Women *Time 2 0 . . . .Access*Time 1 1.6867 1.4453 316 1.17 0.2441Access*Time 2 0 . . . .DTCA*Time 1 -15.1442 7.3446 389 -2.06 0.0399**DTCA*Time 2 0 . . . .
**p<0.05 * Claritin®, Allegra®, Zyrtec®, Hismanal®, Seldane®, Nasonex®, Flonase®† Transformed variables: DTCA, Visits, Number of prescriptions written for allergy medications DTCA – DTCA Expenditures for allergy medications, Visit – Allergy-related visitsAmong individuals who received a prescription for allergy medications: Age – percentage of individuals 45 years and older, Gender – Percentage of women, Access – Percentage of individuals with health insurance coverage, Time - 1 (January 1994 to August 1997), 2 (September 1997 to April 2001)
The positive estimate for the variables gender, DTCA expenditures for allergy
medications and allergy-related physician visits indicate that an increase in these
variables was associated with an increase in the number of prescriptions written for
advertised allergy medications. The significant interaction between DTCA expenditures

301
and time period indicates that the relationship between DTCA expenditures for allergy
medications and the number of prescriptions written for allergy medications varied
significantly in time period one from time period two. The slope for the interaction
between DTCA expenditures and time period one was lower (22.959-15.144 = 7.815)
than the slope for time period two (22.959). This indicates that an increase in the number
of prescriptions written for allergy medications related to an increase in DTCA
expenditures for allergy medications was significantly higher in time period two
compared to time period one.
The variable allergy-related physician visit was a month-level variable whereas all
other variables in the model were month and drug-level and as a result there may be some
distortion in the results. The data were reanalyzed with transformed variables, but without
the allergy-related visit variable. There were no new significant variables in the model
indicating that visit was not suppressing effects of other variables or distorting the results.
Mixed Model Analysis with Untransformed Variables
In order to interpret the results of the analysis with transformed variables (Table
5.15), the analysis was repeated with the untransformed values for DTCA expenditures,
number of prescriptions written and number of allergy-related physician visits and the
results are presented in Table 5.16. Since the analysis uses the untransformed variables,
the results are easier to interpret.
The estimates from the analysis were used to interpret the variables significant in
the analysis with transformed values, which included gender or percentage of women,
DTCA expenditures for allergy medications, and allergy-related visits. The estimate for
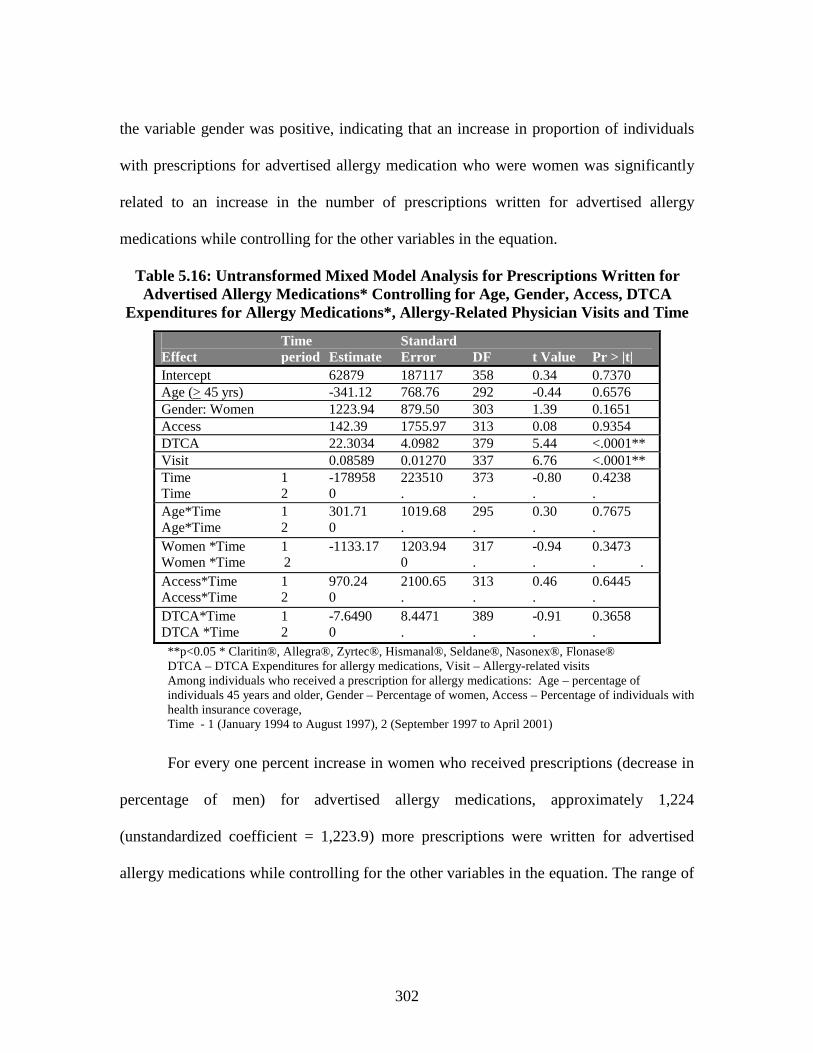
302
the variable gender was positive, indicating that an increase in proportion of individuals
with prescriptions for advertised allergy medication who were women was significantly
related to an increase in the number of prescriptions written for advertised allergy
medications while controlling for the other variables in the equation.
Table 5.16: Untransformed Mixed Model Analysis for Prescriptions Written for Advertised Allergy Medications* Controlling for Age, Gender, Access, DTCA
Expenditures for Allergy Medications*, Allergy-Related Physician Visits and Time
Time StandardEffect period Estimate Error DF t Value Pr > |t|Intercept 62879 187117 358 0.34 0.7370Age (> 45 yrs) -341.12 768.76 292 -0.44 0.6576Gender: Women 1223.94 879.50 303 1.39 0.1651Access 142.39 1755.97 313 0.08 0.9354DTCA 22.3034 4.0982 379 5.44 <.0001**Visit 0.08589 0.01270 337 6.76 <.0001**Time 1 -178958 223510 373 -0.80 0.4238Time 2 0 . . . .Age*Time 1 301.71 1019.68 295 0.30 0.7675Age*Time 2 0 . . . .Women *Time 1 -1133.17 1203.94 317 -0.94 0.3473Women *Time 2 0 . . . .Access*Time 1 970.24 2100.65 313 0.46 0.6445Access*Time 2 0 . . . .DTCA*Time 1 -7.6490 8.4471 389 -0.91 0.3658DTCA *Time 2 0 . . . .**p<0.05 * Claritin®, Allegra®, Zyrtec®, Hismanal®, Seldane®, Nasonex®, Flonase®DTCA – DTCA Expenditures for allergy medications, Visit – Allergy-related visitsAmong individuals who received a prescription for allergy medications: Age – percentage of individuals 45 years and older, Gender – Percentage of women, Access – Percentage of individuals with health insurance coverage, Time - 1 (January 1994 to August 1997), 2 (September 1997 to April 2001)
For every one percent increase in women who received prescriptions (decrease in
percentage of men) for advertised allergy medications, approximately 1,224
(unstandardized coefficient = 1,223.9) more prescriptions were written for advertised
allergy medications while controlling for the other variables in the equation. The range of

303
values in the dataset for the percentage of women among those who received prescription
for advertised allergy medications was 0-100 percent (Mean – 61.6% + 23.4).
An increase in DTCA expenditures for allergy medications was significantly
related to an increase in the number of prescriptions written for allergy medications while
controlling for the other variables in the equation. For every $1,000 increase in DTCA
expenditures for allergy medications, approximately 22 (unstandardized coefficient =
22.3) more prescriptions were written for advertised allergy medications while
controlling for the remaining variables in the equation. Also, an increase in the number of
allergy-related visits were significantly related to an increase in the number of
prescriptions written for advertised allergy medications while controlling for the other
variables in the equation. For every one allergy-related visit increase, the number of
prescriptions written for allergy medications increased by approximately 0.1
(unstandardized coefficient = 0.0859) or in other words, for every ten allergy-related
visits increase, one more prescription was written for advertised allergy medication while
controlling for other variables in the equation (Table 5.16).
Mixed Model Analyses with Transformed Variables: Split by Time (Objective IV)
To test if significant relationships in time period one were also significant in time
period two (Objective IV), the dataset was split by time period. Mixed model analysis
was employed for both time periods with the transformed values for the variables DTCA
expenditures, allergy-related visits and number of prescriptions written for allergy
medications and the results are presented in Table 5.17. The auto-regressive covariance
structure, modeling the within-subject (drug -allergy medications) correlation over time

304
or in other words the correlation between the number of prescriptions written for allergy
medications separated by one time interval (1 month) was significant in both time periods
(Time 1 = 0.6494, Time 2 = 0.5460, p<0.0001).
Table 5.17: Mixed Model Analyses for Prescriptions Written for Advertised Allergy Medications* Controlling for Age, Gender, Access, DTCA Expenditures For Allergy
Medications*, and Allergy-Related Physician Visits for the Two Time Periods (Transformed Variables) †
Time Period 1 – January 1994-August 1997 Standard
Effect Estimate Error DF t Value Pr > |t|Intercept 129.75 118.29 170 1.10 0.2742Age (>45 yrs) -0.01068 0.4012 135 -0.03 0.9788Gender: Women -0.1801 0.5009 144 -0.36 0.7197Access 0.7082 0.6999 139 1.01 0.3133DTCA 6.5971 4.3378 168 1.52 0.1302Visit 0.1413 0.04562 157 3.10 0.0023**
Time Period 2 – September 1997-April 2001 StandardEffect Estimate Error DF t Value Pr > |t|Intercept 24.1887 157.77 190 0.16 0.8733Age (> 45 yrs) 0.4445 0.5738 164 0.77 0.4396Gender: Women 1.2216 0.6540 169 1.87 0.0635Access - 0.7969 1.3161 177 -0.61 0.5456DTCA 23.7914 6.1116 198 3.89 0.0001**Visit 0.2661 0.0441 188 6.04 <.0001**
**p<0.05 * Claritin®, Allegra®, Zyrtec®, Hismanal®, Seldane®, Nasonex®, Flonase®† Transformed variables: DTCA, Visits, Number of prescriptions written for allergy medicationsVisit –Number of allergy-related visits, DTCA – DTCA expenditures for allergy medicationsAmong individuals who received a prescription for allergy medications: Age – percentage of individuals 45 years and older, Gender – Percentage of women, Access – Percentage of individuals with health insurance coverage
The variable allergy-related visit was significant in both time periods. However,
DTCA expenditures for allergy medications was significant only in time period two.
Gender, although significant in overall mixed model analysis or the analysis for the entire
time period from January 1994 to April 2001 (Table 5.15) was not significant in the
mixed model analyses for split datasets (Table 5.17).

305
Increase in the allergy-related visits were significantly related to an increase in the
number of prescriptions written for advertised allergy medications in both time periods
while controlling for the other variables in the equations. Also, an increase in DTCA
expenditures for allergy medications was significantly related to an increase in the
number of prescriptions written for allergy medications in time period two (September
1997 to April 2001) while controlling for the other variables in the equation.
The research hypotheses for Objective II regarding the relationships between
number of prescriptions written for allergy medications and age, gender, health insurance
coverage, DTCA expenditures for allergy medications and allergy-related visits were
supported for gender, DTCA expenditures for allergy medications and allergy-related
visits. The research hypothesis for Objective IV that significant relationships in time
period one were also significant in time period two was not supported.
Objective III
To determine the relationship between DTCA expenditures for allergy medications,
access to care, demographics (age and gender), allergy-related, physician visits and the
prescription drug expenditures for the advertised allergy medications.
Mixed model analysis was employed to determine the relationships for this
objective. The dependent variable in this model was prescription drug expenditures for
the advertised allergy medications. The independent variables were monthly DTCA
expenditures for allergy medications, number of allergy-related physician visits,
percentage of individuals who received a prescription for allergy medications and were
45 years and older, percentage of individuals with a prescription for allergy medications

306
who were women, and percentage of individuals who received a prescription for allergy
medications and had health insurance coverage. In addition, the variable time period
(January 1997 to August 1997, September 1997 to April 2001), which categorized the
time when drug was prescribed, and its interaction with the independent variables were
also included in the analysis.
Mixed Model Analysis with Transformed Variables
To help control for their large values and skewness, the variables prescription
drug expenditures and DTCA expenditures for allergy medications were transformed to
their logarithmic values and the variable number of allergy-related visits was transformed
to its square root value. The auto-regressive covariance structure, modeling the within-
subject (drug – allergy medications) correlation over time (0.5678) or correlation between
allergy drug expenditures separated by one time interval (1 month) was significant
(p<0.0001). The calculated R-square was 0.142, signifying that 14.2 percent of the
variance in the prescription drug expenditures for advertised allergy medications was
accounted for by the model. The results of the analysis are presented in Table 5.18.
The significant variables were gender or percentage of individuals with a
prescription for advertised allergy medications who were women {df=303, t=2.22,
p=0.0271}, DTCA expenditures for allergy medications {df=373, t=3.25, p=0.001}, and
allergy-related physician visits {df=349, t = 5.37, p<0.001}. All the significant variables
had positive estimates indicating that an increase in the independent variable was
associated with an increase in drug expenditures for allergy medications while controlling
for the other variables in the equation.

307
Table 5.18: Mixed Model Analysis for Prescription Drug Expenditures for Advertised Allergy Medications* Controlling for Age, Gender, Access, DTCA
Expenditures for Allergy Medications*, Allergy-Related Physician Visits and Time (Transformed Variables) †
Time StandardEffect period Estimate Error DF t Value Pr > |t|Intercept 14.8245 0.6002 355 24.70 <.0001Age (> 45 yrs) 0.003039 0.002277 294 1.33 0.1831Gender: Women 0.005772 0.002600 303 2.22 0.0271**Access -0.00406 0.005251 319 -0.77 0.4406DTCA 0.07950 0.02444 373 3.25 0.0012**Visit 0.000744 0.000138 349 5.37 <.0001**Time 1 -0.4946 0.6690 372 -0.74 0.4601Time 2 0 . . . .Age*Time 1 -0.00085 0.003025 296 -0.28 0.7778Age*Time 2 0 . . . .Women *Time 1 -0.00554 0.003561 315 -1.56 0.1208Women *Time 2 0 . . . .Access*Time 1 0.005297 0.006269 317 0.84 0.3988Access*Time 2 0 . . . .DTCA*Time 1 -0.02666 0.03160 388 -0.84 0.3994DTCA*Time 2 0 . . . .**p<0.05 * Claritin®, Allegra®, Zyrtec®, Hismanal®, Seldane®, Nasonex®, Flonase®† Transformed variables: DTCA, Visits, Drug Expenditures for allergy medicationsDTCA – DTCA Expenditures for allergy medications, Visit – Allergy-related visits, Among individuals who received a prescription for allergy medications: Age – percentage of individuals 45 years and older, Gender – Percentage of women, Access – Percentage of individuals with health insurance coverageTime –1 (January 1994 to August 1997), 2 (September 1997 to April 2001)
The variable allergy-related physician visit was a month-level variable whereas all
other variables in the model were month and drug-level and as a result there may be some
distortion in the results. So, the above analysis was repeated without the allergy-related
visit variable. No new variables were significant indicating that visit variable was not
suppressing effects of other variables.
Mixed Model Analysis with Untransformed Variables
The analysis with transformed variables and with the visit variable was repeated
with the untransformed values for allergy-related physician visits, DTCA expenditures

308
and prescription drug expenditures for allergy medications and the results are presented
in Table 5.19. The analysis with untransformed values enables us to understand the
results of the analysis with the transformed variables (Table 5.18). The estimates from the
analysis with untransformed values were used to interpret the significant variables in the
analysis with transformed values, which included gender or percentage of women, DTCA
expenditures for allergy medications and allergy-related visits. For example, the variable
gender was significant in the model with transformed variables and the relationship was
positive indicating that an increase in the percentage of individuals with prescriptions for
allergy medications who were women was significantly related to an increase in
expenditures for advertised allergy medications while controlling for other variables in
the equation. For every one percent increase in individuals with a prescription for allergy
medication who were women (decrease in percent men), the drug expenditures increased
by $78,787 while controlling for the other variables in the equation. Among individuals
who received a prescription for allergy medications, the percentage of women ranged
from 0-100 percent (Mean: Women – 61.6% + 23.4%).
An increase in DTCA expenditures was significantly related to an increase in the
expenditures for allergy medications while controlling for other variables in the equation.
For every $1,000 increase in DTCA expenditures for allergy medications, the drug
expenditures for allergy medications increased by approximately $1,450 (unstandardized
coefficient = 1,450.22) while controlling for the other variables in the equation. An
increase in allergy-related visits was significantly related to an increase in allergy drug
expenditures while controlling for other variables in the equation. For every one allergy-

309
related visit increase, the drug expenditures for allergy medications increased by
approximately $5.5 (unstandardized coefficient = 5.47) while controlling for the other
variables in the equation.
Table 5.19: Untransformed Mixed Model Analysis for Prescription Drug Expenditures for Advertised Allergy Medications* Controlling for Age, Gender,
Access, DTCA Expenditures for Allergy Medications*, Allergy-Related Physician Visits and Time
Time StandardEffect period Estimate Error DF t Value Pr > |t|Intercept -986994 11579629 378 -0.09 0.9321Age (> 45 yrs) -41406 51621 301 -0.80 0.4231Gender: Women 78787 58076 307 1.36 0.1759Access 51662 110164 313 0.47 0.6394DTCA 1450.22 285.62 388 5.08 <.0001**Visit 5.4704 0.8662 328 6.32 <.0001**Time 1 -5074836 13676318 387 -0.37 0.7108Time 2 0 . . . .Age*Time 1 44538 67705 303 0.66 0.5112Age*Time 2 0 . . . .Women*Time 1 -66863 80499 317 -0.83 0.4068Women*Time 2 0 . . . .Access*Time 1 12347 128401 314 0.10 0.9235Access*Time 2 0 . . . .DTCA*Time 1 -670.05 586.19 378 -1.14 0.2537DTCA*Time 2 0 . . . .**p<0.05 * Claritin®, Allegra®, Zyrtec®, Hismanal®, Seldane®, Nasonex®, Flonase®DTCA – DTCA Expenditures for allergy medications, Visit – Allergy-related visits, Among individuals who received a prescription for allergy medications: Age – percentage of individuals 45 years and older, Gender – Percentage of women, Access – Percentage of individuals with health insurance coverageTime –1 (January 1994 to August 1997), 2 (September 1997 to April 2001)
Mixed Model Analyses with Transformed Variables: Split by Time (Objective IV)
To test if significant relationships in time period one were also significant in time
period two (Objective IV), the dataset was split by time period. The datasets were
analyzed using mixed model analysis with the transformed variables allergy-related
visits, DTCA expenditures, and drug expenditures for allergy medications (Table 5.20).

310
The auto-regressive covariance structure, modeling the within-subject (drug – allergy
medications) correlation over time or in other words the correlation between prescription
drug expenditures for allergy medications separated by one time interval (1 month) was
significant in both time periods (Time 1 = 0.5558, Time 2 = 0.5857, p<0.0001).
Table 5.20: Mixed Model Analyses for Prescription Drug Expenditures for Advertised Allergy Medications* Controlling for Age, Gender, Access, DTCA
Expenditures for Allergy Medications* and Allergy-Related Physician Visits for the Two Time Periods (Transformed Variables) †
Time Period 1 - January 1994 to August 1997Standard
Effect Estimate Error DF t Value Pr > |t|Intercept 14.5811 0.6627 164 22.00 <.0001Age (> 45 yrs) 0.002163 0.002308 132 0.94 0.3504Gender: Women -0.00008 0.002860 146 -0.03 0.9775Access 0.000555 0.004013 138 0.14 0.8901DTCA 0.05411 0.02412 172 2.24 0.0261**Visit 0.000603 0.000257 163 2.34 0.0203**
Time Period 2 – September 1997 to April 2001Standard
Effect Estimate Error DF t Value Pr > |t|Intercept 14.6552 0.5444 193 26.92 <.0001Age (> 45 yrs) 0.003223 0.001969 165 1.64 0.1035Gender: Women 0.006044 0.002246 170 2.69 0.0078**Access -0.00379 0.004527 177 -0.84 0.4032DTCA 0.07485 0.02150 207 3.48 0.0006**Visit 0.000858 0.000152 185 5.65 <.0001**
**p<0.05 * Claritin®, Allegra®, Zyrtec®, Hismanal®, Seldane®, Nasonex®, Flonase®† Transformed variables: DTCA, Visits, Drug Expenditures for allergy medicationsDTCA – DTCA Expenditures for allergy medications, Visit –Number of allergy-related visitsAmong individuals who received a prescription for allergy medications: Age – percentage of individuals 45 years and older, Gender – Percentage of women, Access – Percentage of individuals with health insurance coverage
Allergy-related visits and DTCA expenditures were significant in both time
periods. However, the variable gender or percentage of individuals with a prescription for
allergy medications who were women was significant only in time period two. All the
significant variables had a positive estimate indicating that an increase in these significant

311
independent variables was associated with an increase in prescription drug expenditures
for allergy medications. Increase in allergy-related visits and DTCA expenditures for
allergy medications were significantly related to an increase in expenditures for
advertised allergy medications in both time periods while controlling for other variables
in the equation. Among those who received a prescription for advertised allergy
medication, an increase in the percentage of women was significantly related to an
increase in expenditures for allergy medications in time period two while controlling for
other variables in the equation.
The research hypotheses for Objective III regarding relationships between
prescription drug expenditures for allergy medications and age, gender, health insurance
coverage, DTCA expenditures for allergy medications and allergy-related visits were
supported for gender, DTCA expenditures for allergy medications, and allergy-related
visits. The research hypothesis for Objective IV that significant relationships in time
period one were also significant in time period two was not supported.
Antilipemics
This section presents the time series and mixed model analyses results for
antilipemics. The results for Objective IV, comparing the relationships from Objectives I,
II, and III for the two time periods (1) January 1994 to August 1997, and (2) September
1997 to April 2001, will be presented simultaneously with the three objectives.

312
Objective I
To determine the relationship between DTCA expenditures for antilipemics, access to
care, and demographics (age and gender) and physician visits when patient was
diagnosed with hyperlipidemia (lipid-related visits).
Time series analysis was used to determine the relationships for this objective.
The dependent variable for this analysis was lipid-related physician visits (diagnosis of
hyperlipidemia or high cholesterol level) and the independent variables included monthly
total DTCA expenditures for antilipemic drugs, percentage of individuals 45 years and
older, percentage of women, and percentage of individuals with health insurance
coverage. These percentages were calculated from the total number of individuals with
lipid-related visits or in other words individuals diagnosed with hyperlipidemia each
month. In addition, a dichotomous variable time period (January 1994 to August 1997
and September 1997 to April 2001), which categorized the time of visit, was also
included. The results of the analysis with all untransformed variables were reconfirmed
by analyzing model with transformed (logarithmic) values for DTCA expenditures for
antilipemics and lipid-related visits.
Time Series Analysis: January 1994 Through April 2001
Time series analysis using the transformed (logarithmic values) and
untransformed values for lipid-related visits and total DTCA expenditures for
antilipemics yielded different results. The Durbin-Watson statistic and the results of the
analysis with transformed variables are reported along with the results of the analysis
with untransformed variables for interpretation.

313
The Durbin-Watson statistic for this dataset was calculated to be 1.885. Based on
this Durbin-Watson statistic, the null hypothesis of no serial correlation present in the
error term was tested at p=0.05 level of significance for n=88 observations (88 months)
for the dependent variable monthly lipid-related physician visits. The critical values for
positive autocorrelation were identified as 1.542 to 1.776 and for negative autocorrelation
greater than 2.458 (4 -1.542=2.458). The null hypothesis of no serial correlation present
in error term was not rejected. Ordinary least squares regression was used to determine
the relationship between the independent variables and dependent variable monthly lipid-
related physician visits. The results of the analysis with transformed values for DTCA
expenditures for antilipemics and lipid-related visits are reported in Table 5.21.
Table 5.21: Test Statistics for Ordinary Least Squares Analysis for Lipid-Related Physician Visits Regressed on Age, Gender, Access, Total DTCA Expenditures for
Antilipemics* and Time Period (Transformed Variables)†
B SEB BETA T SIG TAge(> 45 yrs) -0.0019 0.0059 -0.0263 -0.3233 0.7473Gender: Women -0.0010 0.0042 -0.0190 -0.2388 0.8118Access -0.0022 0.0051 -0.0353 -0.4369 0.6633DTCA 0.0375 0.0132 0.2699 2.8391 0.0057**Time 0.4860 0.0880 0.5203 5.5251 0.0000**Constant 13.4794 0.74512 . 18.0892 0.0000**p<0.05 * Baycol®, Lescol®, Lipitor®, Mevacor®, Pravachol®, Zocor®† Transformed variables – DTCA, lipid-related visitsDTCA –DTCA Expenditures for antilipemicsAge, Gender, Access – Percentage of Individuals with lipid-related visit (45 years and older, women, with health insurance coverage), Time – January 1994 to August 1997, September 1997 to April 2001
The analysis yielded an adjusted R-square of 0.454. The significant variables in
the model were total DTCA expenditures for antilipemics {t=2.839, p=0.0057}, and time
period {t=5.525, p<0.0001}. The Pearson correlation coefficient for the variable DTCA

314
expenditures for antilipemics (transformed) was 0.539 (p<0.0001) and 0.437 (p<0.0001)
when DTCA expenditures and visit variables were not transformed.
The unstandardized coefficient (untransformed model Table 5.22) for total DTCA
expenditures was 13.20 indicating that for every $1,000 increase in DTCA expenditures
for antilipemics there were approximately 13 more lipid-related visits or 13 more patients
were diagnosed with hyperlipidemia while controlling for other variables in the equation.
Table 5.22: Test Statistics for Ordinary Least Squares Analysis with Untransformed Values for Lipid-Related Physician Visits Regressed on Age, Gender, Access, Total
DTCA Expenditures for Antilipemics* and Time Period
B SEB BETA T SIG TAge (> 45 yrs) -2430.11 9860.7 -0.0221 -0.2464 0.8060Gender: Women -504.89 7066.0 -0.0062 -0.0715 0.9432Access -5261.88 8490.8 -0.0548 -0.6197 0.5372DTCA 13.20 10.3 0.1387 1.2839 0.2028Time 761817.47 152923.6 0.5346 4.9817 0.0000**Constant 907176.55 1244951.0 . 0.7287 0.4683
**p<0.05 * Baycol®, Lescol®, Lipitor®, Mevacor®, Pravachol®, Zocor®Age, Gender, Access – Percentage of Individuals with lipid-related visit (45 years and older, women, with health insurance coverage), DTCA –DTCA expenditures for antilipemics, Time – January 1994 to August 1997, September 1997 to April 2001
The unstandardized coefficient for time period was 761,817.5 or during the
second time period (September 1997 to April 2001), there were 761,818 more lipid-
related visits or patients diagnosed with hyperlipidemia compared to time period one
(January 1994 to August 1997) while controlling for other variables in the equation.
Time Series Analyses: Split by Time (Objective IV)
To determine if significant relationships in time period one were significant again
in time period two, the dataset was split by time period from January 1994 to August
1997 and September 1997 to April 2001. Since the analysis with transformed and

315
untransformed values yielded different results, the results of the analysis with
transformed variables are reported in Table 5.23. The critical interval for positive
autocorrelation was identified as 1.336 to 1.720 and for negative correlation above 2.664
(4.0-1.336=2.664). The Durbin-Watson statistic for time period one was calculated to be
1.944 and 1.826 for time period two. The null hypothesis of no serial correlation present
in the error term in both time periods one and two was not rejected.
Table 5.23: Test Statistics for Ordinary Least Squares Analyses of Lipid-Related Physician Visits Regressed on Age, Gender, Access, and Total DTCA Expenditures
for Antilipemics* for the Two Time Periods (Transformed Variables)†
Time 1 – January 1994 to August 1997B SEB BETA T SIG T
Age (> 45 yrs) -0.0101 0.0081 -0.1841 -1.2488 0.2192Gender: Women -0.0023 0.0051 -0.0621 -0.4399 0.6624Access 0.0026 0.0056 0.0672 0.4733 0.6386DTCA 0.0324 0.0124 0.3814 2.6066 0.0129**Constant 14.3341 0.9744 . 14.7111 0.0000
Time 2 – September 1997 to April 2001B SEB BETA T SIG T
Age (> 45 yrs) 0.0059 0.0084 0.1099 0.7065 0.4841Gender: Women 0.0021 0.0069 0.0462 0.2990 0.7665Access -0.0163 0.0100 -0.2509 -1.6323 0.1107DTCA 0.0765 0.0754 0.1586 1.0144 0.3166Constant 14.5740 1.4286 . 10.2014 0.0000
**p<0.05 * Baycol®, Lescol®, Lipitor®, Mevacor®, Pravachol®, Zocor® † Transformed variables – DTCA, lipid-related visitsDTCA –DTCA Expenditures for antilipemicsAge, Gender, Access – Percentage of Individuals with lipid-related visit (45 years and older, women, with health insurance coverage)
The variable total DTCA expenditures for antilipemics was a significant predictor
only during the first half of the time period selected for the study from January 1994 to
August 1997 (Pearson coefficient = 0.439, p=0.003, transformed variables). The positive
unstandardized coefficient indicates that an increase in DTCA expenditures for
antilipemics was significantly related to an increase in the number of patients diagnosed

316
with hyperlipidemia in time period one while controlling for the other variables in the
equation.
The research hypotheses for Objective I regarding relationships between lipid-
related visits and age, gender, health insurance coverage, and total DTCA expenditures,
was supported only for DTCA expenditures for antilipemics. The research hypothesis that
significant relationships in time period one were also significant in time period two was
not supported.
Objective II
To determine the relationship between DTCA expenditures for antilipemics, access to
care, demographics (age and gender), lipid-related physician visits and the number of
prescriptions written for the advertised antilipemic drugs.
Mixed model analysis was used to determine the relationships for this objective.
The dependent variable for this analysis was number of prescriptions written for the
advertised antilipemics. The independent variables included monthly DTCA expenditures
for each antilipemic drug and number of lipid-related physician visits. In addition, among
individuals who received prescription for antilipemics, percentage of individuals 45 years
and older, percentage of women, and percentage of individuals with health insurance
coverage were also included. The time period (January 1994 to August 1997, September
1997 to April 2001) variable, which categorizes the time when the prescription was
written, along with its interaction with the independent variables were included in the
analysis.

317
Mixed Model Analysis with Transformed Variables
The variable number of lipid-related visits was transformed to its square root
values. The variables DTCA expenditures and number of prescriptions written for
antilipemics were transformed to their logarithmic values. The auto-regressive covariance
structure, modeling the within-subject (drug - antilipemics) correlation over time (0.4026)
or in other words the correlation between number of prescriptions written for antilipemics
separated by one time interval (1 month) was significant (p<0.0001). The results of the
analysis with the transformed values are presented in Table 5.24.
Table 5.24: Mixed Model Analysis for Prescriptions Written for Advertised Antilipemics* Controlling for Age, Gender, Access, DTCA Expenditures for
Antilipemics*, Lipid-Related Physician Visits, and Time Period (Transformed Variables)†
Time StandardEffect period Estimate Error DF t Value Pr > |t|Intercept 10.7529 0.6921 366 15.54 <.0001Age (> 45 yrs) -0.00464 0.004402 320 -1.05 0.2923Gender: Women -0.00124 0.001925 353 -0.64 0.5211Access 0.000032 0.004979 352 0.01 0.9949DTCA 0.1473 0.02036 102 7.24 <.0001**Visit 0.001174 0.000180 356 6.51 <.0001**Time 1 -0.8019 0.9389 365 -0.85 0.3936Time 2 0 . . . .Age*Time 1 0.005229 0.006494 336 0.81 0.4213Age*Time 2 0 . . . .Women*Time 1 0.000147 0.003087 340 0.05 0.9621Women*Time 2 0 . . . .Access*Time 1 0.006819 0.006450 346 1.06 0.2911Access*Time 2 0 . . . .DTCA*Time 1 -0.05737 0.03342 115 -1.72 0.0888DTCA*Time 2 0 . . . .
**p<0.05 * Baycol®, Lescol®, Lipitor®, Mevacor®, Pravachol®, Zocor®† Transformed variables - DTCA, Visits, Number of prescriptions written for antilipemicsVisit– Number of lipid-related visits, DTCA –DTCA expenditures for antilipemicsAmong individuals who received a prescription for antilipemics: Age – percentage of individuals 45 years and older, Gender – Percentage of women, Access – Percentage of individuals with health insurance coverageTime – 1 (January 1994 to August 1997), 2 – (September 1997 to April 2001)

318
The calculated R-square for this full model for dependent variable number of
prescriptions written for the advertised antilipemics was 0.2186, signifying that 21.9
percent of the variance in the number of prescriptions written for antilipemics is
accounted for by the model. The significant variables were DTCA expenditures for
antilipemics {df=102, t=7.24, p<0.0001} and lipid- related physician visits {df=356, t =
6.51, p<0.001}. The estimates for both visits and DTCA expenditures were positive
indicating than an increase in the lipid-related visits and DTCA expenditures for
antilipemics were associated with an increase in the number of prescriptions written for
antilipemics.
The variable lipid-related physician visit was a month-level variable whereas all
other variables in the model were month and drug-level and as a result there may be some
distortion in the results. Hence, the analysis was repeated with transformed variables but
excluding the lipid-related visit variable. There were no new significant variables in the
model indicating that the variable visit was not suppressing effects of other variables.
Mixed Model Analysis with Untransformed Variables
The analysis with the transformed variables (lipid-related visits, DTCA
expenditures, number of prescriptions written for antilipemics) was interpreted using the
values from the results of the analysis with untransformed variables. The results of the
analysis with the untransformed values are presented in Table 5.25. The estimates from
the results of the analysis with the untransformed values were used to interpret the
significant variables (DTCA expenditures, lipid-related visits) in the analysis with
transformed values.

319
Table 5.25: Untransformed Mixed Model Analysis for Prescriptions Written for Advertised Antilipemics* Controlling for Age, Gender, Access, DTCA Expenditures
for Antilipemics*, Lipid-Related Physician Visits, and Time Period
Time StandardEffect period Estimate Error DF t Value Pr > |t|Intercept 227209 174986 382 1.30 0.1949Age(>45 yrs) -476.46 1117.62 312 -0.43 0.6702Gender: Women 228.71 499.47 323 0.46 0.6473Access -1659.82 1294.39 324 -1.28 0.2006DTCA 25.6181 5.0532 395 5.07 <.0001**Visit 0.1661 0.01719 324 9.66 <.0001**Time 1 -59572 246681 371 -0.24 0.8093Time 2 0 . . . .Age*Time 1 -65.9217 1677.11 327 -0.04 0.9687Age*Time 2 0 . . . .Women*Time 1 -355.03 794.64 318 -0.45 0.6553Women*Time 2 0 . . . .Access*Time 1 1242.52 1670.82 323 0.74 0.4576Access*Time 2 0 . . . .DTCA*Time 1 -9.6610 12.5094 399 -0.77 0.4404DTCA*Time 2 0 . . . .
**p<0.05 * Baycol®, Lescol®, Lipitor®, Mevacor®, Pravachol®, Zocor® Visit– Number of lipid-related visits, DTCA –DTCA expenditures for antilipemicsAmong Individuals who received a prescription for antilipemics: Age – percentage of individuals 45 years and older, Gender – Percentage of women, Access – Percentage of individuals with health insurance coverage, Time Period – 1 (January 1994 to August 1997, September 1997 to April 2001)
An increase in DTCA expenditures and number of lipid-related visits were
significantly related to an increase in the number of prescriptions written for advertised
antilipemics while controlling for the other variables in the equation. For every $1,000
increase in DTCA expenditures for antilipemics, approximately 26 (unstandardized
coefficient = 25.6) more prescriptions were written for antilipemics. For every one lipid-
related visit increase, approximately 0.2 (unstandardized coefficient = 0.166) more
prescriptions were written for advertised antilipemics or in other words, for every ten
lipid-related visit increase, approximately two more prescriptions written for advertised
antilipemics while controlling for other variables in the equation.

320
Mixed Model Analyses with Transformed Variables: Split by Time (Objective IV)
To test if significant relationships in time period one were also significant in time
period two (Objective IV), the dataset was split by time period. Both datasets were
analyzed using mixed model analysis with transformed variables for lipid-related visits,
DTCA expenditures, and number of prescriptions written for antilipemics (Table 5.26).
Table 5.26: Mixed Model Analyses for Prescriptions Written for Advertised Antilipemics* Controlling for Age, Gender, Access, DTCA Expenditures for Antilipemics* and Lipid-Related Physician Visits for the Two Time Periods
(Transformed Variables)†
Time 1 – January 1994 to August 1997Standard
Effect Estimate Error DF t Value Pr > |t|Intercept 9.5116 0.7083 161 13.43 <.0001Age ( > 45 yrs) 0.001460 0.004655 160 0.31 0.7542Gender: Women -0.00076 0.002372 159 -0.32 0.7496Access 0.006987 0.004043 160 1.73 0.0858DTCA 0.08631 0.02052 51.9 4.21 0.0001**Visit 0.001507 0.000345 167 4.36 <.0001**
Time 2 – September 1997 to April 2001Standard
Effect Estimate Error DF t Value Pr > |t|Intercept 10.6596 0.7063 205 15.09 <.0001Age( > 45 yrs) -0.00296 0.004356 171 -0.68 0.4982Gender: Women -0.00091 0.001925 186 -0.47 0.6383Access 0.001951 0.004970 185 0.39 0.6951DTCA 0.1313 0.02452 51.7 5.36 <.0001**Visit 0.001031 0.000210 188 4.91 <.0001****p<0.05 *- Baycol®, Lescol®, Lipitor®, Mevacor®, Pravachol®, Zocor®† Transformed variables – DTCA, visits, number of prescriptions written for antilipemicsDTCA – DTCA Expenditures for antilipemics, Visit –Number of Lipid-related visitsAmong individuals who received a prescription for antilipemics: Age – percentage of individuals 45 years and older, Gender – Percentage of women, Access – Percentage of individuals with health insurance coverage
The auto-regressive covariance structure, modeling the within-subject (drug -
antilipemics) correlation over time or in other words the correlation between the number
of prescriptions written for antilipemics separated by one time interval (1 month) was

321
significant in both time periods (Time 1 = 0.2153, Time 2 = 0.5181, p<0.0001). The
variables DTCA expenditures and number of lipid-related visits were significant in both
time periods. The positive estimate for both variables indicate that an increase in DTCA
expenditures for antilipemics and lipid-related visits were associated with an increase in
the number of prescriptions written for advertised antilipemics in both time periods. An
increase in DTCA expenditures for antilipemics was significantly related to an increase in
the number of prescriptions written for advertised antilipemics while controlling for the
other variables in the equation. An increase in lipid-related visits or number of patients
diagnosed with hyperlipidemia was significantly related to an increase in the number of
prescriptions written for advertised antilipemics while controlling for the other variables
in the equation.
The research hypotheses for Objective II regarding the relationships between
number of prescriptions written for advertised antilipemics and age, gender, health
insurance coverage, DTCA expenditures for antilipemics and lipid-related visits were
supported for DTCA expenditures for antilipemics and lipid-related visits. The research
hypothesis that significant relationships in time period one were also significant in time
period two was supported.
Objective III
To determine the relationship between DTCA expenditures for antilipemics, access to
care, demographics (age and gender), lipid-related physician visits and the drug
expenditures for these advertised antilipemic drugs.

322
Mixed model analysis was used to determine the relationships for this objective.
The dependent variable in this model was prescription drug expenditures for the
advertised antilipemics prescribed. The independent variables in the model were monthly
DTCA expenditures for antilipemics, number of lipid-related physician visits, percentage
of individuals 45 years and older, percentage of women, and percentage of individuals
with health insurance coverage. These percentages were calculated from the total number
of individuals who received prescription for each of antilipemic drugs each month. In
addition, the dichotomous variable time period (January 1994 to August 1997, September
1997 to April 2001), which categorizes the time when prescription was written, along
with its interaction with the independent variables were also included.
Mixed Model Analysis with Transformed Variables
To help control for their large values and skewness, the variable number of lipid-
related visits was transformed to its square root values and the variables DTCA
expenditures and drug expenditures for antilipemics were transformed to their
logarithmic values. The auto-regressive covariance structure, modeling the within-subject
(drug - antilipemics) correlation over time (0.5582) or in other words the correlation
between prescription drug expenditures for antilipemics separated by one time interval (1
month) was significant (p<0.0001). The analysis yielded an R-square of 0.1699,
signifying that approximately 17.0 percent of the variance in the drug expenditures for
the advertised antilipemics was accounted for by this model. The results of the analysis
with the transformed variables are presented in Table 5.27.

323
The significant variables in this analysis were DTCA expenditures for
antilipemics {df=99.9, t=5.87, p<0.0001} and lipid-related physician visits {df=325, t =
6.48, p<0.001}. The estimates for both visits and DTCA expenditures were positive
indicating that an increase in these variables were associated with an increase in the drug
expenditures for antilipemics.
Table 5.27: Mixed Model Analysis for Prescription Drug Expenditures for Advertised Antilipemics* Controlling for Age, Gender, Access, DTCA Expenditures
for Antilipemics*, Lipid-Related Physician Visits, and Time Period (Transformed Variables)†
Time StandardEffect period Estimate Error DF t Value Pr > |t|Intercept 14.5897 0.7035 364 20.74 <.0001Age (> 45 yrs) -0.00269 0.004364 299 -0.62 0.5375Gender: Women -0.00100 0.001932 322 -0.52 0.6039Access 0.002110 0.004996 322 0.42 0.6731DTCA 0.1536 0.02618 99.9 5.87 <.0001**Visit 0.001176 0.000181 325 6.48 <.0001**Time 1 -0.2007 0.9536 360 -0.21 0.8334Time 2 0 . . . .Age*Time 1 0.002841 0.006489 317 0.44 0.6618Age*Time 2 0 . . . .Women*Time 1 -0.00004 0.003082 311 -0.01 0.9901Women*Time 2 0 . . . .Access*Time 1 0.004023 0.006459 319 0.62 0.5338Access*Time 2 0 . . . .DTCA*Time 1 -0.04379 0.04208 125 -1.04 0.3001DTCA*Time 2 0 . . . .
**p<0.05 * Baycol®, Lescol®, Lipitor®, Mevacor®, Pravachol®, Zocor®† Transformed variables – DTCA, visits, drug expenditures for antilipemicsVisit– Number of lipid-related visits, DTCA –DTCA Expenditures for antilipemicsAmong Individuals who received a prescription for antilipemics: Age – percentage of individuals 45 years and older, Gender – Percentage of women, Access – Percentage of individuals with health insurance coverage. Time – 1 (January 1994 to August 1997, September 1997 to April 2001)
The variable lipid-related physician visit was a month-level variable whereas all
other variables in the model were month and drug-level and as a result there may be some
distortion in the results. Hence, the analysis with the transformed variables was repeated

324
without the lipid-related visit variable. There were no new significant variables in the
model indicating that the variable visit was not suppressing effects of other variables.
Mixed Model Analysis with Untransformed Variables
The analysis with the transformed variables including physician visits was
repeated with the untransformed values for DTCA expenditures for antilipemics, drug
expenditures for antilipemics and number of lipid-related physician visits in order to
interpret the results of the analysis with transformed variables. The results of the analysis
with the untransformed values are presented in Table 5.28. The estimates from the
analysis with the untransformed values were used to interpret the significant variables
(DTCA expenditures, lipid-related visits) in the analysis with transformed values.
Increases in DTCA expenditures and lipid-related visits were significantly related
to an increase in the prescription drug expenditures for antilipemics while controlling for
the other variables in the equation. For every $1,000 increase in DTCA expenditures for
antilipemics, drug expenditures for antilipemics increased by approximately $2,634
(unstandardized coefficient = 2,634.48) while controlling for the other variables in the
equation. For every one lipid-related visit increase or every patient diagnosed with
hyperlipidemia, the expenditures for antilipemics increased by approximately $14
(unstandardized coefficient = 14.27) while controlling for the other variables in the
equation.

325
Table 5.28: Untransformed Mixed Model Analysis for Prescription Drug Expenditures for Advertised Antilipemics* Controlling for Age, Gender, Access, DTCA Expenditures for Antilipemics*, Lipid-Related Physician Visits, and Time
Period
Time StandardEffect period Estimate Error DF t Value Pr > |t|Intercept 10887354 16955716 369 0.64 0.5212Age (> 45 yrs) -5727.25 111611 310 -0.05 0.9591Gender: Women 21998 45101 324 0.49 0.6261Access -109769 120348 324 -0.91 0.3624DTCA 2634.48 449.62 399 5.86 <.0001**Visit 14.2673 1.5692 324 9.09 <.0001**Time 1 8463544 20694499 363 0.41 0.6828Time 2 0 . . . .Age*Time 1 -76260 158936 326 -0.48 0.6317Age*Time 2 0 . . . .Women*Time 1 -36722 70428 318 -0.52 0.6024Women*Time 2 0 . . . .Access*Time 1 56038 141136 323 0.40 0.6916Access*Time 2 0 . . . .DTCA*Time 1 -753.07 1110.73 396 -0.68 0.4982DTCA*Time 2 0 . . . .
**p<0.05 * Baycol®, Lescol®, Lipitor®, Mevacor®, Pravachol®, Zocor®† Transformed variables – DTCA, visits, drug expenditures for antilipemicsVisit– Number of lipid-related visits, DTCA –DTCA Expenditures for antilipemicsAmong individuals who received a prescription for antilipemics: Age – percentage of individuals 45 years and older,Gender – Percentage of women, Access – Percentage of individuals with health insurance coverageTime – 1 (January 1994 to August 1997, September 1997 to April 2001)
Mixed Model Analyses with Transformed Variables: Split by Time (Objective IV)
To test if significant relationships in time period one were also significant in time
period two (Objective IV), the dataset was split by time period. Mixed model analysis
was employed for both datasets with transformed values for lipid-related visits, DTCA
expenditures, and drug expenditures for antilipemics drugs (Table 5.29).
The auto-regressive covariance structure, modeling the within-subject (drug -
antilipemics) correlation over time or in other words the correlation between prescription

326
drug expenditures for antilipemics separated by one time interval (1 month) was
significant in both time periods (Time 1 = 0.4956, Time 2 = 0.6165, p<0.0001).
Table 5.29: Mixed Model Analyses for Prescription Drug Expenditures for Advertised Antilipemics* Controlling for Age, Gender, Access, DTCA Expenditures
for Antilipemics*, and Lipid-Related Physician Visits for the Two Time Periods (Transformed Variables)†
Time period 1 – January 1994 to August 1997Standard
Effect Estimate Error DF t Value Pr > |t|Intercept 13.9536 0.7365 150 18.95 <.0001Age (> 45 yrs) 0.000643 0.004828 146 0.13 0.8942Gender: Women -0.00094 0.002427 137 -0.39 0.6978Access 0.005813 0.004155 139 1.40 0.1640DTCA 0.1021 0.03181 47 3.21 0.0024**Visit 0.001608 0.000362 146 4.44 <.0001**
Time period 2 – September 1997 to April 2001Standard
Effect Estimate Error DF t Value Pr > |t|Intercept 14.6945 0.7151 209 20.55 <.0001Age (> 45 yrs) -0.00196 0.004328 161 -0.45 0.6513Gender: Women -0.00076 0.001925 173 -0.39 0.6938Access 0.003092 0.004967 172 0.62 0.5345DTCA 0.1393 0.02924 49.5 4.77 <.0001**Visit 0.001024 0.000210 174 4.88 <.0001**
**p<0.05 ** Baycol®, Lescol®, Lipitor®, Mevacor®, Pravachol®, Zocor®† Transformed variables – DTCA, Visits, drug expenditures for antilipemicsDTCA – DTCA Expenditures for antilipemics, Visit –Number of Lipid-related visitsAmong individuals who received a prescription for antilipemics: Age – percentage of individuals 45 years and olderGender – Percentage of women, Access – Percentage of individuals with health insurance coverage
The variables DTCA expenditures and number of lipid-related visits were
significant in both time periods. Increase in DTCA expenditures for antilipemics was
significantly related to an increase in the drug expenditures for advertised antilipemics
while controlling for the other variables in the equation. Increase in lipid-related visits or
number of patients diagnosed with hyperlipidemia was significantly related to an increase

327
in the drug expenditures for advertised antilipemics while controlling for the other
variables in the equation.
The research hypotheses for Objective III for antilipemics regarding relationships
between prescription drug expenditures for advertised antilipemics and age, gender,
health insurance coverage, DTCA expenditures for antilipemics and lipid-related visits
were supported for DTCA expenditures for antilipemics and lipid-related visits. The
research hypothesis for objective IV if significant relationships in time period one were
also significant in time period two was supported.
Gastrointestinals
This section presents the results for the time series and mixed model analyses
results for gastrointestinal drugs. The results for Objective IV, comparing the
relationships from Objectives I, II, and III for the two time periods (1) January 1994 to
August 1997, and (2) September 1997 to April 2001, will be presented simultaneously
with the three objectives.
Objective I
To determine the relationship between DTCA expenditures for gastrointestinal drugs,
access to care, and demographics (age and gender) and physician visits for the symptoms
and/or diseases the advertised gastrointestinal drugs are used to treat (gastrointestinal-
related visits).
Time series analysis was used to determine the relationships for this objective.
The dependent variable for this analysis was monthly gastrointestinal-related visits. The
independent variables included monthly total DTCA expenditures for gastrointestinal

328
drugs, percentage of individuals 45 years and older, percentage women, and percentage
of individuals with health insurance coverage. The above percentages were calculated
from the total number of individuals who saw a physician for gastrointestinal-related
symptoms and/or diagnosis each month. The dichotomous variable time period (January
1994 to August 1997 and September 1997 to April 2001), which categorized the time of
visit, was also included in the analysis. The results of the analysis with all untransformed
variables was reconfirmed by analyzing the model with transformed (logarithmic) values
for DTCA expenditures and physician visits.
Time Series Analysis: January 1994 Through April 2001
The results from the analysis with both the transformed and untransformed values
yielded the same variables as significant. The results of the analysis with untransformed
variables are reported in Table 5.30. The Durbin-Watson statistic for this dataset was
calculated to be 1.792. Based on this Durbin-Watson statistic, the null hypothesis of no
serial correlation present in the error term was tested at p=0.05 level of significance for
n=88 observations (88 months) of the dependent variable monthly gastrointestinal-related
physician visits. The critical values for positive autocorrelation were identified as 1.542
to 1.776 and for negative autocorrelation greater than 2.458 (4.0-1.542=2.458). The null
hypothesis of no serial correlation present in the error term was not rejected.
Ordinary least squares regression was used to determine the relationship between
the independent variables and the dependent variable monthly gastrointestinal-related
physician visits. The analysis yielded an adjusted R-square 0.094 and the only significant
predictor in the model was time period {t=3.277, p=0.0015}. The unstandardized

329
coefficient for this variable was 635,522.5 indicating that there were approximately
635,523 more gastrointestinal-related visits in time period two (September 1997 and
April 2001) compared to time period one (January 1994 and August 1997) while
controlling for other the variables in the equation.
Table 5.30: Test Statistics for Ordinary Least Squares Analysis of Gastrointestinal -Related Physician Visits Regressed on Age, Gender, Access, Total DTCA
Expenditures for Gastrointestinal Drugs* and Time Period
B SEB BETA T SIG TAge (> 45 yrs) 2470.04 8107.8 0.0333 0.3046 0.7614Gender: Women 2400.39 9126.5 0.0280 0.2630 0.7932Access 1727.45 15123.7 0.0125 0.1142 0.9093DTCA -25.89 19.6 -0.1671 -1.3214 0.1901Time 635522.53 193950.7 0.44111 3.2767 0.0015**Constant 942547.05 1519966.8 . 0.6201 0.5369**p<0.05 * Zantac®, Propulsid®, Prevacid®, Prilosec®, Helidac®, Lotronex®Age, Gender, Access – Percentage of individuals with gastrointestinal-related visit (45 years and older, women, with health insurance coverage)DTCA –DTCA Expenditures for gastrointestinalsTime – January 1994 to August 1997, September 1997 to April 2001
To further evaluate the effect of age, the variable percentage of individuals 45
years and older with gastrointestinal-related visits was replaced with three variables
which measured the percentage of individuals with gastrointestinal-related visits and
were 25-44 years, 45-64 years and 65 years and older. Again, only time period was
significant.
Time Series Analyses: Split by Time (Objective IV)
To determine if significant relationships in time period one were significant again
in time period two, the dataset was split by time period from January 1994 to August
1997 and September 1997 to April 2001. The time series analysis with transformed and
untransformed values for DTCA expenditures and number of gastrointestinal-related

330
visits yielded the same results. The results for the analysis with untransformed variables
are reported (Table 5.31).
Table 5.31: Test Statistics for Ordinary Least Squares Analyses of Gastrointestinal-Related Physician Visits Regressed on Age, Gender, Access, and Total DTCA
Expenditures for Gastrointestinal Drugs* for the Two Time Periods
Time Period 1 – January 1994 to August 1997B SEB BETA T SIG T
Age (> 45 yrs) 9100.3 9199.2 0.1546 0.9892 0.3286Gender: Women -4343.3 11475.0 -0.0583 -0.3785 0.7071Access -1033.3 15995.9 -0.0101 -0.0646 0.9488DTCA -60.9 41.9 -0.2247 -1.4544 0.1538Constant 1953780.1 1676847.7 . 1.1652 0.2510
Time Period 2 – September 1997 to April 2001B SEB BETA T SIG T
Age(> 45 yrs) -3318.6 13113.3 -0.0413 -0.2531 0.8016Gender: Women 7013.8 13102.3 0.08812 0.5353 0.5956Access 13688.2 25786.8 0.08708 0.5308 0.5986DTCA -23.9 28.6 -0.1360 -0.8360 0.4084Constant 1156629.7 2673353.9 . 0.4327 0.6677
**p<0.05 * Zantac®, Propulsid®, Prevacid®, Prilosec®, Helidac®, Lotronex®Age, Gender, Access – Percentage of Individuals with gastrointestinal-related visit (45 years and older, women, with health insurance coverage) DTCA –DTCA Expenditures for antilipemics
The critical interval for positive autocorrelation was identified as 1.336 to 1.720
and for negative correlation above 2.664 (4.0-1.336=2.664). The Durbin-Watson statistic
for time period one was calculated to be 2.314 and 1.552 for time period two. The null
hypothesis of no serial correlation present in error term for time period one was not
rejected, but was rejected for time period two and Yule-Walker method or Prais-Winsten
was employed to correct for the positive autocorrelation in time period two. None of the
variables were significant in either time period.
To further evaluate the effects of age, the variable percentage of individuals 45
years and older with gastrointestinal-related visits was replaced by three variables which
measured the percentage of individuals with gastrointestinal-related visits and were 25-44

331
years, 45-64 years, and 65 years and older. Again, none of the variables were
significantly related to gastrointestinal-related visits in either time period.
The research hypotheses for Objective I for relationships between
gastrointestinal-related visits and age, gender, health insurance coverage, and total DTCA
expenditures for gastrointestinals were not supported. Since none of the variables were
significant in either time period, the research hypothesis that the significant relationships
in time period one were also significant in time period two was supported.
Objective II
To determine the relationship between DTCA expenditures for gastrointestinal drugs,
access to care, demographics (age and gender), gastrointestinal-related physician visits
and the number of prescriptions written for the advertised gastrointestinal drugs.
Mixed model analysis was employed to determine the relationships for this
objective. In this analysis for dependent variable number of prescriptions written for
gastrointestinal drugs, the independent variables included monthly DTCA expenditures
for each of the gastrointestinals, monthly gastrointestinal-related visits, percentage of
individuals 45 years and older, percentage of women, and percentage of individuals with
health insurance coverage. These percentages were calculated from the total number of
prescriptions written for each of the advertised gastrointestinal drugs. In addition to these
variables, a dichotomous variable time period (January 1994 to August 1997, September
1997 to April 2001), which categorizes the time when prescription was written, along
with its interactions with the independent variables were included.

332
Mixed Model Analysis: January 1994 to April 2001
In this mixed model analysis, the variable number of gastrointestinal-related visits
and DTCA expenditures for gastrointestinals were transformed to their logarithmic values
and the variable number of prescriptions written for gastrointestinal drugs was
transformed to its square root values. The auto-regressive covariance structure, modeling
the within-subject (drug – gastrointestinal drugs) correlation over time (0.5841) or in
other words the correlation between the number of prescriptions written for
gastrointestinal drugs separated by one time interval (one month) was significant
(p<0.0001). The calculated R-square was 0.317 or the model explained 31.7 percent of
the variance in the number of prescriptions written for advertised gastrointestinal drugs.
The results of the analysis are presented in Table 5.32.
The significant variables were gender {df=250, t=2.13. p=0.0344}, DTCA
expenditures for gastrointestinals {df=49.7, t=4.61, p<0.0001}, gastrointestinal-related
visits {df=242, t=10.11, p<0.0001} and interaction between gender and time {df=248, t=-
2.66, p=0.0084}. The positive estimates or unstandardized coefficients for gender
(percent women), DTCA expenditures and number of gastrointestinal-related visits
indicate that an increase in these variables were associated with an increase in the number
of prescriptions written for gastrointestinal drugs.
The interaction between percentage of women and time indicates that the
relationship between number of prescriptions written and the percentage with a
prescription for gastrointestinals who were women varied significantly in time period one
from time period two. The slope for percent women was lower (1.2590-2.1731 = -0.9111)

333
in time period one compared to time period two (1.2590). In fact, it was negative in time
period one and positive in time period two. This indicated that the variable percentage of
individuals with a prescription for gastrointestinals who were women had a negative
relationship with number of prescriptions written for advertised gastrointestinals in time
period one and a positive relationship in time period two.
Table 5.32: Mixed Model Analysis for Prescriptions Written for Advertised Gastrointestinal Drugs* Controlling for Age, Gender, Access, DTCA Expenditures
for Gastrointestinals*, Gastrointestinal-Related Visits and Time Period (Transformed Variables)†
Time StandardEffect period Estimate Error DF t Value Pr > |t|Intercept -4070.25 461.03 243 -8.83 <.0001Age (> 45 yrs) 0.7787 0.6409 251 1.22 0.2255Gender: Women 1.2590 0.5918 250 2.13 0.0344**Access 0.4708 1.3761 233 0.34 0.7326DTCA 33.4846 7.2606 49.7 4.61 <.0001**Visit 304.59 30.1195 242 10.11 <.0001**Time 1 295.31 212.87 268 1.39 0.1665Time 2 0 . . . .Age*Time 1 -0.2946 0.8671 241 -0.34 0.7343Age*Time 2 0 . . . .Women*Time 1 -2.1731 0.8185 248 -2.66 0.0084**Women*Time 2 0 . . . .Access*Time 1 -1.7050 1.9959 236 -0.85 0.3938Access*Time 2 0 . . . .DTCA*Time 1 -4.8395 10.3098 103 -0.47 0.6398DTCA*Time 2 0 . . . .
p<0.05 * Zantac®, Propulsid®, Prevacid®, Prilosec®, Helidac®, Lotronex®†Transformed Variables – DTCA, visits, number of prescriptions written for gastrointestinalsDTCA – DTCA Expenditures for gastrointestinals, Visit – Number of gastrointestinal-related visitsAmong individuals who received a prescription for gastrointestinals: Age – Percentage of individuals 45 years and older, Gender – Percentage of women, Access – Percentage of individuals with health insurance coverageTime - 1 (January 1994 to August 1997), 2 – (September 1997 to April 2001)
The variable gastrointestinal-related physician visit was a month-level variable
whereas all other variables in the model were month and drug-level and as a result there
may be some distortion in the results. The above analysis with transformed variables was

334
repeated without the gastrointestinal-related visit variable. The analysis did not reveal any
new significant variables indicating that the visit variable was not suppressing effects of
other variables.
Mixed Model Analysis for Untransformed Variables
Since it is difficult to interpret the analysis with transformed variables (Table
5.32), mixed model analysis was employed using untransformed values for
gastrointestinal-related visits, DTCA expenditures and number of prescriptions written
for gastrointestinals. The results of the analysis with the untransformed values are
presented in Table 5.33. The variables reported to be significant in the analysis with
transformed variables (Table 5.32) were percentage of women, DTCA expenditures for
gastrointestinals, and gastrointestinal-related visits. The values or estimates from the
analysis with the untransformed variables were used to interpret the results with
transformed variables.
An increase in the percentage of individuals with a prescription for advertised
gastrointestinals who were women was significantly related to an increase in the number
of prescriptions written for advertised gastrointestinals while controlling for other
variables in the equation. For every one percent increase in individuals with
prescriptions for advertised gastrointestinals who were women (decrease in percentage of
men), approximately 1,367 more prescriptions were written for advertised
gastrointestinals while controlling for other variables in the equation. The percentage
range for women represented in the dataset was 0-100 percent (Mean = 60.9+ 22.3 %).

335
Table 5.33: Untransformed Mixed Model Analysis for Prescriptions Written for Advertised Gastrointestinal Drugs* Controlling for Age, Gender, Access, DTCA Expenditures for Gastrointestinals*, Gastrointestinal-Related Visits and Time
Period
Time StandardEffect period Estimate Error DF t Value Pr > |t|Intercept -187414 226775 252 -0.83 0.4093Age (>45 Yrs) 1912.17 956.71 257 2.00 0.0467**Gender: Women 1366.89 885.00 254 1.54 0.1237Access -535.30 2070.80 235 -0.26 0.7962DTCA 43.2688 9.1365 127 4.74 <.0001**Visit 0.1907 0.01946 248 9.80 <.0001**Time 1 201624 315509 257 0.64 0.5234Time 2 0 . . . .Age*Time 1 -1261.25 1299.11 244 -0.97 0.3326Age*Time 2 0 . . . .Women*Time 1 -1778.64 1228.05 252 -1.45 0.1488Women*Time 2 0 . . . .Access*Time 1 -430.79 2994.37 238 -0.14 0.8857Access*Time 2 0 . . . .DTCA*Time 1 21.5991 25.2568 173 0.86 0.3936DTCA*Time 2 0 . . . .p<0.05 * Zantac®, Propulsid®, Prevacid®, Prilosec®, Helidac®, Lotronex®DTCA – DTCA Expenditures for gastrointestinals, Visit – Number of gastrointestinal-related visitsAmong individuals who received a prescription for gastrointestinals: Age – Percentage of individuals 45 years and older, Gender – percentage of women, Access – Percentage of individuals with health insurance coverageTime - 1 (January 1994 to August 1997), 2 – (September 1997 to April 2001)
An increase in DTCA expenditures for gastrointestinals was significantly related
to an increase in the number of prescriptions written for the gastrointestinals while
controlling for other variables in the equation. For every $1,000 increase in DTCA
expenditures for gastrointestinal drugs, approximately 43 (unstandardized coefficient =
43.3) more prescriptions were written for gastrointestinal drugs while controlling for
other variables in the equation. An increase in gastrointestinal-related visits was
significantly related to an increase in number of prescriptions written for advertised
gastrointestinals. For every one gastrointestinal-related visit increase, approximately 0.2
(unstandardized coefficient = 0.19) more prescriptions were written for advertised

336
gastrointestinal drugs or in other words, for every ten gastrointestinal-related visits
increase, approximately two more prescriptions were written for advertised
gastrointestinals while controlling for the other variables in the equation.
Supplemental Mixed Model Analysis for Age
The relationships between age and number of prescriptions written for
gastrointestinals were further evaluated. The variable percentage of individuals who
received a prescription for gastrointestinal drugs and were 45 years and older (age) was
replaced by variables that represented percentage of individuals who received a
prescription for gastrointestinal drugs and were less than 25 years, 25-44 years, 45-64
years, and 65 years and older. Mixed model analysis was employed to determine the
relationships and the results are presented in Table 5.34. The auto-regressive covariance
structure, modeling the within-subject (drug – gastrointestinal drugs) correlation over
time (0.5818) or in other words correlation between number of prescriptions written for
gastrointestinals separated by one time interval (one month) was significant (p<0.0001).
The significant age variables were percent individuals 25-44 years {df=238, t=
-2.97, p=0.0032}, 45-64 years {df=239, t=-2.16, p=0.0317} and 65 years and older
{df=235, t=-1.98, p=0.0494}. All other significant variables including DTCA
expenditures for gastrointestinals, gastrointestinal-related visit and interaction between
percent women and time were significant in the original analysis (Table 5.32) and have
been presented earlier. For all the age variables, the percentage range of values for the
different age groups in the dataset were from 0 to 100 percent (Mean: 25-44 years –
19.9+ 19.4%, 45-64 years – 36.4+ 23.2%, 65 years and older – 39.7 + 22.6%).

337
Table 5.34: Mixed Model Analysis for Prescriptions Written for Advertised Gastrointestinal Drugs* Controlling for Multiple Age Categories, Gender, Access,
DTCA Expenditures for Gastrointestinals*, Gastrointestinal-Related Visits and Time Period (Transformed Variables)†
Time StandardEffect period Estimate Error DF t Value Pr > |t|Intercept -3565.82 483.62 243 -7.37 <.0001Age 25-44 yrs -4.5986 1.5467 238 -2.97 0.0032**Age 45-64 yrs -3.0990 1.4338 239 -2.16 0.0317**65 yrs & older -2.9664 1.5015 235 -1.98 0.0494**< 25 yrs 0 . . . .Gender: Women 0.9871 0.5964 246 1.66 0.0992Access -0.04456 1.3877 231 -0.03 0.9744DTCA 35.3064 7.1718 49.6 4.92 <.0001**Visit 300.39 29.8432 238 10.07 <.0001**Time 1 109.01 312.55 250 0.35 0.7276Time 2 0 . . . .Age 25-44 yrs*Time 1 1.7480 2.5093 239 0.70 0.4867Age 25-44 yrs*Time 2 0 . . . .Age 45-64 yrs*Time 1 1.0640 2.3501 235 0.45 0.6511Age 45-64 yrs*Time 2 0 . . . .65 yrs & older*Time 1 0.9020 2.3949 232 0.38 0.706865 yrs & older*Time 2 0 . . . .< 25 yrs*Time 1 0 . . . .< 25 yrs*Time 2 0 . . . .Women*Time 1 -2.0463 0.8265 245 -2.48 0.0140**Women*Time 2 0 . . . .Access*Time 1 -1.1477 1.9969 233 -0.57 0.5660Access*Time 2 0 . . . .DTCA*Time 1 -7.8542 10.2152 104 -0.77 0.4437DTCA*Time 2 0 . . . .
p<0.05 * Zantac®, Propulsid®, Prevacid®, Prilosec®, Helidac®, Lotronex®†Transformed variables – DTCA, Visits, Number of prescriptions written for gastrointestinalsDTCA – DTCA Expenditures for gastrointestinals, Visit – Number of gastrointestinal-related visitsAmong individuals who received a prescription for gastrointestinals: Age – Percentage of individuals in different age groups, Gender – percentage of women, Access – Percentage of individuals with health insurance coverage Time - 1 (January 1994 to August 1997,), 2 – (September 1997 to April 2001)
Individuals 45-64 years had the least decrease in the number of prescriptions
written for advertised gastrointestinals. However, on analyzing with the untransformed
variables, the order was slightly changed. Table 5.35 presents the results of the analysis
with untransformed values for gastrointestinals-related visits, DTCA expenditures and

338
number of prescriptions written for gastrointestinals. These results were used to interpret
the results of the analysis with transformed variables (Table 5.34).
Table 5.35: Untransformed Mixed Model Analysis for Prescriptions Written for Advertised Gastrointestinal Drugs* Controlling for Multiple Age Categories, Gender, Access, DTCA Expenditures for Gastrointestinals*, Gastrointestinal-
Related Visits and Time Period
Time StandardEffect period Estimate Error DF t Value Pr > |t|Intercept 314343 317861 264 0.99 0.3236Age 25-44 yrs -5192.16 2333.17 245 -2.23 0.0270**Age 45-64 yrs -2374.54 2157.95 245 -1.10 0.272265 yrs & older -2432.80 2265.19 241 -1.07 0.2839< 25 yrs 0 . . . .Gender: Women 1061.78 896.07 250 1.18 0.2372Access -1002.96 2095.29 232 -0.48 0.6326DTCA 44.3962 9.2013 129 4.82 <.0001**Visit 0.1870 0.01940 244 9.64 <.0001**Time 1 5599.67 468029 249 0.01 0.9905Time 2 0 . . . .Age 25-44 yrs*Time 1 1972.64 3776.52 245 0.52 0.6019Age 25-44 yrs*Time 2 0 . . . .Age 45-64 yrs*Time 1 -28.5567 3537.59 240 -0.01 0.9936Age 45-64 yrs*Time 2 0 . . . .65 yrs & older*Time 1 395.44 3612.59 235 0.11 0.912965 yrs & older*Time 2 0 . . . .< 25 yrs*Time 1 0 . . . . < 25 yrs*Time 2 0 . . . .Women*Time 1 -1668.79 1245.96 250 -1.34 0.1817Women*Time 2 0 . . . .Access*Time 1 18.7694 3007.58 235 0.01 0.9950Access*Time 2 0 . . . .DTCA*Time 1 16.3703 25.4582 177 0.64 0.5210DTCA*Time 2 0 . . . .
**p<0.05 * Zantac®, Propulsid®, Prevacid®, Prilosec®, Helidac®, Lotronex®DTCA – DTCA Expenditures for gastrointestinals, Visit – Number of gastrointestinal-related visitsAmong individuals who received a prescription for gastrointestinals: Age – Percentage of individuals 45 years and older, Gender – percentage of women, Access – Percentage of individuals with health insurance coverageTime - 1 (January 1994 to August 1997), 2 – (September 1997 to April 2001)
For every one percent increase in individuals 25-44 years of age who received a
prescription for advertised gastrointestinals, 5,192 fewer prescriptions were written for
advertised gastrointestinals while controlling for other variables in the equation. For

339
every one percent increase in individuals 45-64 years of age who received a prescription
for advertised gastrointestinals, 2,375 fewer prescriptions were written for advertised
gastrointestinals while controlling for other variables in the equation. For every one
percent increase in individuals 65 years and older who received a prescription for
advertised gastrointestinals, 2,433 fewer prescriptions were written for advertised
gastrointestinals while controlling for other variables in the equation.
The variable gastrointestinal-related physician visit was a month-level variable
whereas all other variables in the model were month and drug-level and as a result there
may be some distortion in the results. Hence, the analysis with transformed variables was
repeated, but without the gastrointestinal-related visit variable. There were no new
significant variables indicating that the visit variable was not suppressing effects of other
variables.
Mixed Model Analyses with Transformed Variables: Split by Time (Objective IV)
To test if significant relationships in time period one were also significant in time
period two (Objective IV), the dataset was split by time (January 1997 to August 1997,
September 1997 to April 2001). Mixed model analysis was employed for both datasets
using transformed values for variables physician visits, DTCA expenditures and number
of prescriptions written for gastrointestinals (Table 5.36). The auto-regressive covariance
structure, modeling the within-subject (drug - gastrointestinals) correlation over time or
in other words the correlation between the number of prescriptions written for
gastrointestinals separated by one time interval (1 month) was significant in both time
periods (Time 1 = 0.6795, Time 2 = 0.4985, p<0.0001).

340
The DTCA expenditures for gastrointestinal drugs and gastrointestinal-related
visits were significant in both time periods with positive estimates. An increase in DTCA
expenditures for gastrointestinals and gastrointestinal-related visits were significantly
related to an increase in the number of prescriptions written for advertised
gastrointestinals while controlling for the other variables in the equation.
Table 5.36: Mixed Model Analyses for Prescriptions Written for Advertised Gastrointestinal Drugs* Controlling for Age, Gender, Access, DTCA Expenditures for Gastrointestinal Drugs* and Gastrointestinal-Related Physician Visits for the
Two Time Periods (Transformed Variables)†
Time Period 1 - January 1994- August 1997 StandardEffect Estimate Error DF t Value Pr > |t|Intercept -3121.11 608.10 109 -5.13 <.0001Age(>45 yrs) 0.3177 0.5318 108 0.60 0.5515Gender: Women -0.8029 0.5230 114 -1.54 0.1275Access -1.1553 1.3018 109 -0.89 0.3768DTCA 24.5959 7.9966 96.3 3.08 0.0027**Visit 258.98 40.3033 106 6.43 <.0001**
Time Period 2 – September 1997-April 2001
StandardEffect Estimate Error DF t Value Pr > |t|Intercept -4422.21 662.70 137 -6.67 <.0001Age(>45 yrs) 0.8007 0.7047 136 1.14 0.2579Gender: Women 1.1610 0.6496 135 1.79 0.0761Access 0.3218 1.5186 123 0.21 0.8325DTCA 35.6085 6.6319 24.6 5.37 <.0001**Visit 329.89 44.3230 140 7.44 <.0001****p<0.05 * * Zantac®, Propulsid®, Prevacid®, Prilosec®, Helidac®, Lotronex®†Transformed variables – DTCA, Visits, Number of prescriptions written for gastrointestinalsDTCA – DTCA Expenditures for gastrointestinals, Visit – Number of gastrointestinal-related visitsAmong individuals who received a prescription for gastrointestinals: Age – percentage of individuals 45 years and older, Gender – Percentage of women, Access – Percentage of individuals with health insurance coverage
Supplemental Analysis for Age
The age variable (45 years and older) was replaced by the variables representing
percentage of individuals who received prescription for gastrointestinal drugs and were

341
less than 25 years, 25-44 years, 45-64 years and 65 years and older in both the datasets
for the two time periods. Mixed model analysis was employed for both datasets with
transformed values for gastrointestinal-related visits, DTCA expenditures and number of
prescriptions written for advertised gastrointestinals. The auto-regressive covariance
structure, modeling the within-subject (drug – gastrointestinal drugs) correlation over
time or in other words the correlation between number of prescriptions written for
gastrointestinals separated by one time interval (1 month) was significant in both time
periods (Time 1 = 0.6749, Time 2 = 0.4915, p<0.0001).
As in the previous analysis (Table 5.36), in both time periods, the variables DTCA
expenditures and gastrointestinal-related visits were significantly (positive) related to the
number of prescriptions written for advertised gastrointestinals. However, the variables
percentage of individuals 25-44 years and 45-64 years who received prescription for
gastrointestinal drugs were significant only in time period two. The negative estimate for
the age variables indicate that the percent increase in individuals in different age groups
(25-44 years and 45-64 years) who received a prescription for gastrointestinals was
significantly related to a decrease in the number of prescriptions written for
gastrointestinals. The range of values (percentage) for both age groups in the dataset for
time period two was from 0 to 100 percent (Mean: 25-44 years – 19.3+18.1%, 45-64
years – 37.8+ 23.1%).

342
Table 5.37: Mixed Model Analyses for Prescriptions Written for Advertised Gastrointestinal Drugs* Controlling for Multiple Age Categories, Gender, Access,
DTCA Expenditures for Gastrointestinal Drugs*, and Gastrointestinal-Related Physician Visits for the Two Time Periods (Transformed Variables)†
Time Period 1 - January 1994- August 1997
StandardEffect Estimate Error DF t Value Pr > |t|Intercept -2810.75 639.81 106 -4.39 <.0001Age 25-44 yrs -2.8974 1.8010 109 -1.61 0.1106Age 45-64 yrs -2.2295 1.7020 107 -1.31 0.193065 yrs & older -2.2561 1.7024 106 -1.33 0.1879< 25 yrs 0 . . . .Gender: Women -0.9589 0.5345 113 -1.79 0.0755Access -1.0899 1.3063 107 -0.83 0.4059DTCA 23.4830 7.9990 95.3 2.94 0.0042**Visit 255.54 40.4317 104 6.32 <.0001**
Time Period 2 – September 1997-April 2001Standard
Effect Estimate Error DF t Value Pr > |t|Intercept -3908.42 676.99 137 -5.77 <.0001Age 25-44 yrs -4.5749 1.6905 128 -2.71 0.0077**Age 45-64 yrs -3.1576 1.5702 128 -2.01 0.0463**65 yrs & older -2.8183 1.6445 126 -1.71 0.0890< 25 yrs 0 . . . .Gender: Women 0.9166 0.6512 133 1.41 0.1616Access -0.2268 1.5235 122 -0.15 0.8819DTCA 37.4343 6.4614 24.5 5.79 <.0001**Visit 324.92 43.6441 138 7.44 <.0001**
**p<0.05 * * Zantac®, Propulsid®, Prevacid®, Prilosec®, Helidac®, Lotronex®†Transformed variables – DTCA, Visits, Number of prescriptions written for gastrointestinalsDTCA – DTCA expenditures for gastrointestinals, Visit – Number of gastrointestinal-related visitsAmong individuals who received a prescription for gastrointestinals: Age – percentage of individuals 45 years and older, Gender – Percentage of women, Access – Percentage of individuals with health insurance coverage
The research hypotheses for Objective II regarding relationships between number
of prescriptions written for gastrointestinals and age, gender, health insurance coverage,
DTCA expenditures for gastrointestinals and gastrointestinal-related visits were
supported for gender or percent women, DTCA expenditures for gastrointestinals, and
gastrointestinal-related visits. The research hypothesis for objective IV regarding

343
significant relationships in both time periods was supported (Age – 45 years and older).
However, on further evaluation of age, this hypothesis was no longer supported.
Objective III
To determine the relationship between DTCA expenditures for gastrointestinal drugs,
access to care, demographics (age and gender), gastrointestinal-related physician visits
and the drug expenditures for the advertised gastrointestinal drugs.
Mixed model analysis was employed to determine the relationships between the
variables. In the analysis for dependent variable prescription drug expenditures for
gastrointestinal drugs, the independent variables included monthly DTCA expenditures
for each of the gastrointestinals, monthly gastrointestinal-related visits, percentage of
individuals 45 years and older, percentage of women, and percentage of individuals with
health insurance coverage. These percentages were calculated from the total number of
individuals who received prescription for each of the advertised gastrointestinals each
month. In addition to these variables, a dichotomous variable time period (January 1994
to August 1997, September 1997 to April 2001) was included along with its interactions
with the independent variables.
Mixed Model Analysis with Transformed Variables
For the mixed model analysis, the variable number of gastrointestinal-related
visits and DTCA expenditures for gastrointestinals were transformed to their logarithmic
values and the variable drug expenditures for gastrointestinals was transformed to its
square root values. The auto-regressive covariance structure, modeling the within-subject
(drug – gastrointestinal drugs) correlation over time (0.7255) or in other words

344
correlation between prescription drug expenditures for gastrointestinals separated by one
time interval (one month) was significant (p<0.0001). The calculated R-square was
0.278, signifying that 27.8 percent of the variance in the prescription drug expenditures
for advertised gastrointestinal drugs was explained by the model. The results of the
analysis are presented in Table 5.38.
Table 5.38: Mixed Model Analysis for Prescription Drug Expenditures for Advertised Gastrointestinal Drugs* Controlling for Age, Gender, Access, DTCA
Expenditures for Gastrointestinal Drugs*, Gastrointestinal-Related Visits and Time Period (Transformed Variables)†
Time StandardEffect period Estimate Error DF t Value Pr > |t|Intercept -38074 4518.13 246 -8.43 <.0001Age (> 45 Yrs) 9.3901 6.2910 242 1.49 0.1368Gender: Women 11.9620 5.8108 243 2.06 0.0406**Access 1.4457 13.3908 230 0.11 0.9141DTCA 438.44 99.4701 47.1 4.41 <.0001**Visit 2835.40 294.26 235 9.64 <.0001**Time 1 2508.15 2131.93 285 1.18 0.2404Time 2 0 . . . .Age*Time 1 -6.4670 8.4727 236 -0.76 0.4461Age*Time 2 0 . . . .Women*Time 1 -16.3726 8.0196 240 -2.04 0.0423**Women*Time 2 0 . . . .Access*Time 1 -10.3460 19.4490 232 -0.53 0.5953Access*Time 2 0 . . . .DTCA*Time 1 -211.26 125.68 112 -1.68 0.0956DTCA*Time 2 0 . . . .p<0.05 * Zantac®, Propulsid®, Prevacid®, Prilosec®, Helidac®, Lotronex®†Transformed variables – DTCA, visits, drug expenditures for gastrointestinalsDTCA – DTCA Expenditures for gastrointestinals, Visit – Number of gastrointestinal-related visitsAmong individuals who received a prescription for gastrointestinals: Age – Percentage of individuals in different age groups, Gender – percentage of women, Access – Percentage of individuals with health insurance coverageTime - 1 (January 1994 to August 1997,), 2 – (September 1997 to April 2001)
The significant variables were gender {df=243, t=2.06, p=0.041}, DTCA
expenditures for gastrointestinals {df=47.1, t=4.41, p<0.0001}, gastrointestinal-related
345
visit {df=235, t=9.64, p<0.0001} and interaction between gender and time {df=240, t=
-2.04, p=0.0423}.
The results indicate that an increase in percentage of women, DTCA expenditures
of gastrointestinals and gastrointestinal-related visits were significantly related to an
increase in the drug expenditures for gastrointestinal drugs. The significant interaction
between gender or percentage of individuals with a prescription for gastrointestinal drugs
who were women with time indicates that the relationship between percent women and
drug expenditures for gastrointestinal drugs varied significantly in time period one from
time period two. The slope for the interaction in time period one (11.962-16.3726 = -
4.4106) was lower (negative) compared to time period two (11.962). The variable percent
women had a negative relationship with drug expenditures for gastrointestinals in time
period one and a positive relationship in time period two.
Mixed Model Analysis with Untransformed Variables
To enable interpretation of the above analysis results with transformed variables,
mixed model analysis was conducted with untransformed values for gastrointestinal-
related visits, DTCA expenditures and prescription drug expenditures for
gastrointestinals. The results of this analysis are presented in Table 5.39.
The significant variables in the analysis with transformed variables were gender
or percentage of women, DTCA expenditures for gastrointestinals and gastrointestinal-
related visits and were interpreted using the estimates from the analysis with
untransformed variables (Table 5.39). An increase in the percentage of individuals with a
prescription for gastrointestinals who were women was significantly related to an

346
increase in the prescription drug expenditures for advertised gastrointestinals while
controlling for other variables in the equation. For every one percent increase in
individuals with a prescription for gastrointestinals who were women (decrease in
percentage of men), the drug expenditures for gastrointestinal increased by $98,565 while
controlling for other variables in the equation. The range for percentage of individuals
with a prescription for advertised gastrointestinal who were women was 0-100 percent
(Mean = 60.9+ 22.3%).
Table 5.39: Untransformed Mixed Model Analysis for Prescription Drug Expenditures for Advertised Gastrointestinal Drugs* Controlling for Age, Gender, Access, DTCA Expenditures for Gastrointestinal Drugs*, Gastrointestinal-Related
Visits and Time Period
Time StandardEffect period Estimate Error DF t Value Pr > |t|Intercept -1.135E7 32903948 256 -0.34 0.7304Age (> 45 yrs) 241251 102413 243 2.36 0.0193**Gender: Women 98565 90763 241 1.09 0.2786Access -162274 361407 223 -0.45 0.6539DTCA 5643.56 1175.46 149 4.80 <.0001**Visit 19.3298 2.3095 234 8.37 <.0001**Time 1 -771972 55914253 258 -0.01 0.9890Time 2 0 . . . .Age*Time 1 -198505 142166 232 -1.40 0.1640Age*Time 2 0 . . . .Women*Time 1 -85605 129562 238 -0.66 0.5094Women*Time 2 0 . . . .Access*Time 1 144176 572627 226 0.25 0.8014Access*Time 2 0 . . . .DTCA*Time 1 1186.93 3180.89 211 0.37 0.7094DTCA*Time 2 0 . . . .** p<0.05 * Zantac®, Propulsid®, Prevacid®, Prilosec®, Helidac®, Lotronex®DTCA – DTCA Expenditures for gastrointestinals, Visit – Number of gastrointestinal-related visitsAmong individuals who received a prescription for gastrointestinals: Age – Percentage of individuals in different age groups, Gender – percentage of women, Access – Percentage of individuals with health insurance coverageTime - 1 (January 1994 to August 1997), 2 – (September 1997 to April 2001)
An increase in DTCA expenditures for gastrointestinals was significantly related
to an increase in the drug expenditures for gastrointestinals while controlling for other

347
variables in the equation. For every $1,000 increase in DTCA expenditures for
gastrointestinal drugs, drug expenditures for gastrointestinals increased by approximately
$5,644 (unstandardized coefficient = 5643.56) while controlling for the other variables in
the equation. An increase in the gastrointestinal-related visits was significantly related to
an increase in prescription drug expenditures for gastrointestinals while controlling for
other variables in the equation. For every one gastrointestinal-related visit increase, the
drug expenditures for gastrointestinals increased by approximately $19 (unstandardized
coefficient = 19.33) while controlling for other variables in the equation.
Mixed Model Analysis with Transformed Variables: Excluding Visit Variable
The variable gastrointestinal-related physician visit was a month-level variable
whereas all other variables in the analysis were month and drug-level and as a result there
may have been some distortion in the results. Mixed model analysis was employed using
transformed variables and excluding the gastrointestinal- related visit variable. Table 5.40
presents the results of the analysis.
In addition to the variable DTCA expenditures for gastrointestinals, the
interaction between DTCA expenditures and time period was significant. This indicates
that the relationship between DTCA expenditures and prescription drug expenditures for
gastrointestinals varied significantly in time period one from time period two. The slope
for DTCA expenditures in time period one was lower (533.92 – 354.75 = 179.17) than
the slope for time period two (533.92). This indicates that an increase in drug
expenditures for advertised gastrointestinals related to an increase in DTCA expenditures

348
for gastrointestinals was significantly lower in time period one compared to time period
two.
Table 5.40: Mixed Model Analysis for Prescriptions Drug Expenditures for Advertised Gastrointestinal Drugs* Controlling for Age, Gender, Access, DTCA
Expenditures for Gastrointestinal Drugs*, and Time Period (Transformed Variables)†
Time StandardEffect period Estimate Error DF t Value Pr > |t|Intercept 2880.53 1751.48 280 1.64 0.1012Age (> 45 yrs) 3.4766 7.3784 249 0.47 0.6379Gender: Women 10.7132 6.8387 249 1.57 0.1185Access 12.9263 15.7947 231 0.82 0.4140DTCA 533.92 92.4727 47.8 5.77 <.0001**Time 1 3409.26 2468.57 273 1.38 0.1684Time 2 0 . . . .Age*Time 1 -3.8030 10.0023 240 -0.38 0.7041Age*Time 2 0 . . . .Women*Time 1 -17.8518 9.4532 246 -1.89 0.0601Women*Time 2 0 . . . .Access*Time 1 -26.0903 22.9519 234 -1.14 0.2568Access*Time 2 0 . . . .DTCA*Time 1 -354.75 126.87 105 -2.80 0.0061**DTCA*Time 2 0 . . . .** p<0.05 * Zantac®, Propulsid®, Prevacid®, Prilosec®, Helidac®, Lotronex®†Transformed variables – DTCA, visits, drug expenditures for gastrointestinalsDTCA – DTCA Expenditures for gastrointestinals, Visit – Number of gastrointestinal-related visitsAmong individuals who received a prescription for gastrointestinals: Age – Percentage of individuals in different age groups, Gender – percentage of women, Access – Percentage of individuals with health insurance coverageTime - 1 (January 1994 to August 1997), 2 – (September 1997 to April 2001)
Supplemental Analysis for Age
To further evaluate the effects of age, the variable percentage of individuals who
received a prescription for gastrointestinal drugs and were 45 years and older was
replaced by variables for percentage of individuals who received a prescription for
gastrointestinal drugs and were less than 25 years, 25-44 years, 45-64 years, and 65 years
and older. Mixed model analysis was employed for this model with transformed values

349
for gastrointestinal-related visits, DTCA expenditures and drug expenditures for
gastrointestinals (Table 5.41).
Table 5.41: Mixed Model Analysis for Prescription Drug Expenditures for Advertised Gastrointestinal Drugs* Controlling for Multiple Age Categories, Gender, Access, DTCA Expenditures for Gastrointestinals*, Gastrointestinal-
Related Visits, and Time Period (Transformed Variables)†
Time StandardEffect period Estimate Error DF t Value Pr > |t|Intercept -33332 4741.97 244 -7.03 <.0001Age 25-44 yrs -43.6537 15.0825 231 -2.89 0.0042**Age 45-64 yrs -25.5432 13.9879 232 -1.83 0.069165 yrs & older -28.1446 14.6189 229 -1.93 0.0554< 25 yrs 0 . . . .Gender: Women 8.9991 5.8454 239 1.54 0.1250Access -2.5093 13.4905 228 -0.19 0.8526DTCA 441.93 100.95 47.6 4.38 <.0001**Visit 2796.93 291.02 231 9.61 <.0001**Time 1 40.7413 3087.95 257 0.01 0.9895Time 2 0 . . . .Age 25-44 yrs*Time 1 24.5129 24.4712 231 1.00 0.3175Age 25-44 yrs*Time 2 0 . . . .Age 45-64 yrs*Time 1 10.6021 22.8730 228 0.46 0.6434Age 45-64 yrs*Time 2 0 . . . .65 yrs & older*Time 1 14.9825 23.2794 227 0.64 0.520565 yrs & older*Time 2 0 . . . .< 25 yrs*Time 1 0 . . . .< 25 yrs*Time 2 0 . . . .Women*Time 1 -14.4679 8.0895 236 -1.79 0.0750Women*Time 2 0 . . . .Access*Time 1 -6.0735 19.4266 229 -0.31 0.7548Access*Time 2 0 . . . .DTCA*Time 1 -227.24 126.56 113 -1.80 0.0752DTCA*Time 2 0 . . . .
** p<0.05 * Zantac®, Propulsid®, Prevacid®, Prilosec®, Helidac®, Lotronex®†Transformed variables – DTCA, visits, drug expenditures for gastrointestinalsDTCA – DTCA Expenditures for gastrointestinals, Visit – Number of gastrointestinal-related visitsAmong individuals who received a prescription for gastrointestinals: Age – Percentage of individuals in different age groups, Gender – percentage of women, Access – Percentage of individuals with health insurance coverageTime - 1 (January 1994 to August 1997), 2 – (September 1997 to April 2001)
The auto-regressive covariance structure, modeling the within-subject (drug –
gastrointestinal drugs) correlation over time (0.7350) or in other words the correlation

350
between drug expenditures for gastrointestinals separated by one time interval (one
month) was significant (p<0.0001). In this model, the percentage of individuals 25-44
years who received a prescription for gastrointestinals was significant {t=-2.89, df=231,
p=0.0042}.
The negative estimate for age 25 to 44 years indicated that an increase in the
percentage of individuals who received a prescription for gastrointestinals and were 25-
44 years was associated with a decrease in prescription drug expenditures for advertised
gastrointestinals. All other significant variables in this model were significant in the
original model (Table 5.38) and have been presented earlier. The variable percentage of
individuals 25-44 years who received a prescription for advertised gastrointestinal drug
had the highest negative estimate among the variables for age. The range of values in the
dataset for the percentage of individuals 25 to 44 years and received a prescription for
advertised gastrointestinal drug was 0-100 percent values (Mean: 25-44 years – 19.9+
19.4%).
To enable interpretation of the results of the above analysis, the analysis was
repeated with untransformed values for gastrointestinal-related visits, DTCA
expenditures and drug expenditures for gastrointestinals. The results of this analysis are
provided in Table 5.42. For every one percent increase in individuals 25-44 years who
received a prescription for gastrointestinals, the prescription drug expenditures for
gastrointestinals decreased by approximately $524,342 while controlling for the other
variables in the equation.
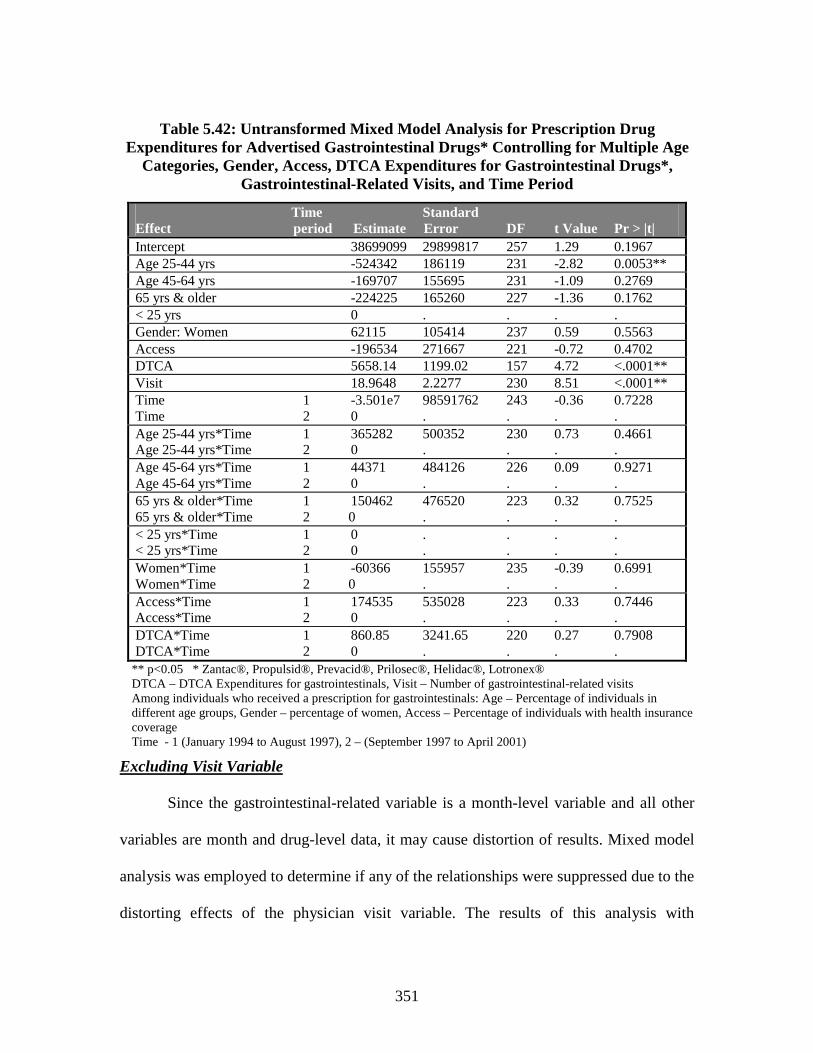
351
Table 5.42: Untransformed Mixed Model Analysis for Prescription Drug Expenditures for Advertised Gastrointestinal Drugs* Controlling for Multiple Age
Categories, Gender, Access, DTCA Expenditures for Gastrointestinal Drugs*, Gastrointestinal-Related Visits, and Time Period
Time StandardEffect period Estimate Error DF t Value Pr > |t|Intercept 38699099 29899817 257 1.29 0.1967Age 25-44 yrs -524342 186119 231 -2.82 0.0053**Age 45-64 yrs -169707 155695 231 -1.09 0.276965 yrs & older -224225 165260 227 -1.36 0.1762< 25 yrs 0 . . . .Gender: Women 62115 105414 237 0.59 0.5563Access -196534 271667 221 -0.72 0.4702DTCA 5658.14 1199.02 157 4.72 <.0001**Visit 18.9648 2.2277 230 8.51 <.0001**Time 1 -3.501e7 98591762 243 -0.36 0.7228Time 2 0 . . . .Age 25-44 yrs*Time 1 365282 500352 230 0.73 0.4661Age 25-44 yrs*Time 2 0 . . . .Age 45-64 yrs*Time 1 44371 484126 226 0.09 0.9271Age 45-64 yrs*Time 2 0 . . . .65 yrs & older*Time 1 150462 476520 223 0.32 0.752565 yrs & older*Time 2 0 . . . .< 25 yrs*Time 1 0 . . . .< 25 yrs*Time 2 0 . . . .Women*Time 1 -60366 155957 235 -0.39 0.6991Women*Time 2 0 . . . .Access*Time 1 174535 535028 223 0.33 0.7446Access*Time 2 0 . . . .DTCA*Time 1 860.85 3241.65 220 0.27 0.7908DTCA*Time 2 0 . . . .
** p<0.05 * Zantac®, Propulsid®, Prevacid®, Prilosec®, Helidac®, Lotronex®DTCA – DTCA Expenditures for gastrointestinals, Visit – Number of gastrointestinal-related visitsAmong individuals who received a prescription for gastrointestinals: Age – Percentage of individuals in different age groups, Gender – percentage of women, Access – Percentage of individuals with health insurance coverageTime - 1 (January 1994 to August 1997), 2 – (September 1997 to April 2001)
Excluding Visit Variable
Since the gastrointestinal-related variable is a month-level variable and all other
variables are month and drug-level data, it may cause distortion of results. Mixed model
analysis was employed to determine if any of the relationships were suppressed due to the
distorting effects of the physician visit variable. The results of this analysis with

352
transformed variables DTCA expenditures and drug expenditures for gastrointestinals
including age variables percentage of individuals 25 to 44 years, 45 to 64 years, and 65
years and older are presented in Table 5.43.
Table 5.43: Mixed Model Analysis for Prescription Drug Expenditures for Advertised Gastrointestinal Drugs* Controlling for Multiple Age Categories,
Gender, Access, DTCA Expenditures for Gastrointestinal Drugs*, and Time Period (Transformed Variables)†
Time StandardEffect period Estimate Error DF t Value Pr > |t|Intercept 7352.05 2435.12 270 3.02 0.0028Age 25-44 yrs -46.8187 17.8254 236 -2.63 0.0092**Age 45-64 yrs -34.5234 16.4990 236 -2.09 0.0375**65 yrs & older -35.9772 17.2683 233 -2.08 0.0383**< 25 yrs 0 . . . .Gender: Women 7.7288 6.8876 244 1.12 0.2629Access 8.4341 15.9210 229 0.53 0.5968DTCA 540.95 94.1610 47.4 5.74 <.0001**Time 1 1399.72 3614.41 253 0.39 0.6989Time 2 0 . . . .Age 25-44 yrs *Time 1 19.6903 28.9322 236 0.68 0.4968Age 25-44 yrs *Time 2 0 . . . .Age 45-64 yrs *Time 1 8.5361 27.0731 233 0.32 0.7528Age 45-64 yrs *Time 2 0 . . . .65 yrs & older*Time 1 13.1773 27.5749 230 0.48 0.633265 yrs & older*Time 2 0 . . . .< 25 yrs*Time 1 0 . . . .< 25 yrs*Time 2 0 . . . .Women*Time 1 -16.3414 9.5429 242 -1.71 0.0881Women*Time 2 0 . . . .Access*Time 1 -21.3973 22.9426 231 -0.93 0.3520Access*Time 2 0 . . . .DTCA*Time 1 -377.26 128.17 106 -2.94 0.0040**DTCA*Time 2 0 . . . .** p<0.05 * Zantac®, Propulsid®, Prevacid®, Prilosec®, Helidac®, Lotronex®†Transformed variables – DTCA, visits, drug expenditures for gastrointestinalsDTCA – DTCA Expenditures for gastrointestinals, Visit – Number of gastrointestinal-related visitsAmong individuals who received a prescription for gastrointestinals: Age – Percentage of individuals in different age groups, Gender – percentage of women, Access – Percentage of individuals with health insurance coverageTime – 1 (January 1994-August 1997), 2(September 1997-April 2001)

353
In the absence of the visit variable, all three groups 25-44 years {df=236, t=-2.63,
p=0.0092}, 45-64 years {df=236, t=-2.09, p=0.0375} and 65 years and older {df=233, t=
-2.08, p=0.0383} were significant and had negative estimates. The percentage of
individuals who received a prescription for advertised gastrointestinals and were 25 to 44
years, 45 to 64 years and 65 years older in the dataset ranged from 0 to 100 percent
(Mean: 25-44 years – 19.9+ 19.4%, 45-64 years – 36.4+ 23.2%, 65 years and older – 39.7
+ 22.6). Other significant variables including DTCA expenditures and its interactions
with time period have been presented earlier.
Analyzing with the untransformed values for DTCA expenditures for
gastrointestinals enabled the interpretation of the analysis results with transformed
variables (Table 5.43). The estimates from the analysis with untransformed values (Table
5.44) were used to interpret the results of the analysis with transformed values.
Comparing the negative estimates for the three age variables, age group 25-44 years had
the highest negative estimate (633,374) followed by age groups 65 years and older
(397,539) and 45-64 years (355,479).
The values indicate that for every one percent increase in individuals in different
age groups who received a prescription for advertised gastrointestinals, the prescription
drug expenditures decreased for advertised gastrointestinals with the greatest being for
individuals 25-44 years by $633,374 followed by age groups 65 years and older by
$397,539 and 45-64 years by $355,479 while controlling for other variables in the
equation.

354
Table 5.44: Untransformed Mixed Model Analysis for Prescription Drug Expenditures for Advertised Gastrointestinal Drugs* Controlling for Multiple Age Categories, Gender, Access, DTCA Expenditures for Gastrointestinal Drugs*, and
Time Period
Time StandardEffect period Estimate Error DF t Value Pr > |t|Intercept 85479690 54637694 258 1.56 0.1189Age 25-44 yrs -633374 46493 233 -13.62 <.0001**Age 45-64 yrs -355479 0 0 . .65 yrs & older -397539 0 0 . .< 25 yrs 0 . . . .Gender: Women 51584 113975 240 0.45 0.6513Access -12539 547358 219 -0.02 0.9817DTCA 5858.72 1257.77 128 4.66 <.0001**Time 1 -2.074e7 71605373 240 -0.29 0.7723Time 2 0 . . . .Age 25-44 yrs*Time 1 350100 0 0 . .Age 25-44 yrs*Time 2 0 . . . .Age 45-64 yrs*Time 1 67585 0 0 . .Age 45-64 yrs*Time 2 0 . . . .65 yrs & older *Time 1 184688 0 0 . .65 yrs & older *Time 2 0 . . . .< 25 yrs*Time 1 0 . . . .< 25 yrs*Time 2 0 . . . .Women*Time 1 -118589 163015 238 -0.73 0.4677Women*Time 2 0 . . . .Access*Time 1 -59119 809359 222 -0.07 0.9418Access*Time 2 0 . . . .DTCA*Time 1 -866.86 3418.43 182 -0.25 0.8001DTCA*Time 2 0 . . . .**p<0.05 * Zantac®, Propulsid®, Prevacid®, Prilosec®, Helidac®, Lotronex®DTCA – DTCA Expenditures for gastrointestinals, Visit – Number of gastrointestinal-related visitsAmong individuals who received a prescription for gastrointestinals: Age – Percentage of individuals in different age groups, Women – percentage of women, Access – Percentage of individuals with health insurance coverage, Time - 1 (January 1994 to August 1997), 2 – (September 1997 to April 2001)
Mixed Model Analyses with Transformed Variables: Split by Time (Objective IV)
In order to test for objective IV if significant relationships in time period one were
also significant in time period two, the dataset was split by time period (January 1994 to
August 1997, September 1997 to April 2001). Mixed model analysis was employed for
both datasets using transformed values for variables gastrointestinal-related visits, DTCA

355
expenditures, and drug expenditures for gastrointestinals. The auto-regressive covariance
structure, modeling the within-subject (drug - gastrointestinals) correlation over time or
in other words the correlation between prescription drug expenditures for
gastrointestinals separated by one time interval (1 month) was significant in both time
periods (Time 1 = 0.8047, Time 2 = 0.6153, p<0.0001).
Table 5.45: Mixed Model Analyses for Prescription Drug Expenditures for Advertised Gastrointestinal Drugs* Controlling for Age, Gender, Access, DTCA
Expenditures for Gastrointestinal Drugs* and Gastrointestinal-Related Physician Visits for the Two Time Periods (Transformed Variables)†
Time period 1 – January 1994 to August 1997Standard
Effect Estimate Error DF t Value Pr > |t|Intercept -27544 5673.12 120 -4.86 <.0001Age (> 45 yrs) 1.4329 4.9468 117 0.29 0.7726Gender: Women -3.7118 4.8883 119 -0.76 0.4492Access -7.9408 12.1138 116 -0.66 0.5134DTCA 178.55 83.2183 136 2.15 0.0337**Visit 2267.13 374.36 116 6.06 <.0001**
Time 2 – September 1997 to April 2001Standard
Effect Estimate Error DF t Value Pr > |t|Intercept -43460 6719.81 133 -6.47 <.0001Age (> 45 yrs) 9.2139 7.1415 132 1.29 0.1992Gender: Women 11.7327 6.5821 132 1.78 0.0770Access 0.2104 15.2471 122 0.01 0.9890DTCA 557.21 86.8281 22.5 6.42 <.0001**Visit 3203.84 449.86 133 7.12 <.0001****p<0.05 * Zantac®, Propulsid®, Prevacid®, Prilosec®, Helidac®, Lotronex®†Transformed variables – DTCA, visits, drug expenditures for gastrointestinalsDTCA – DTCA Expenditures gastrointestinals, Visit – Number of gastrointestinal-related visits,Among individuals who received a prescription for gastrointestinals: Age – Percentage of individuals in different age groups, Gender – percentage of women, Access – Percentage of individuals with health insurance coverage
The variables DTCA expenditures and number of gastrointestinal-related visits
were significant in both time periods. The estimates were positive for both variables. An
increase in DTCA expenditures for gastrointestinals and gastrointestinal-related visits

356
was significantly related to an increase in drug expenditures for advertised
gastrointestinals while controlling for the other variables in the equation.
Supplemental Analysis for Age
To determine if relationship between age and number of prescriptions written for
advertised gastrointestinals differed for the two time periods, the age variable for percent
individuals 45 years and older was replaced by the age variables representing percentage
of individuals less than 25 years, 25-44 years, 45-64 years and 65 years and older who
received prescription for gastrointestinal drugs (Table 5.46). The auto-regressive
covariance structure, modeling the within-subject (drug - gastrointestinals) correlation
over time or in other words the correlation between prescription drug expenditures for
gastrointestinals separated by one time interval (1 month) was significant in both time
periods (Time 1 = 0.8048, Time 2 = 0.6336, p<0.0001).
In addition to DTCA expenditures for gastrointestinals and gastrointestinal-related
visits, percentage of individuals 25 to 44 years (Range – 0-100%, Mean = 19.3+18.1%)
who received prescription for gastrointestinals was significant. The negative estimate
indicates than an increase in the percentage of individuals 25 to 44 years who received a
prescription for gastrointestinals was associated with a decrease in drug expenditures for
gastrointestinals.
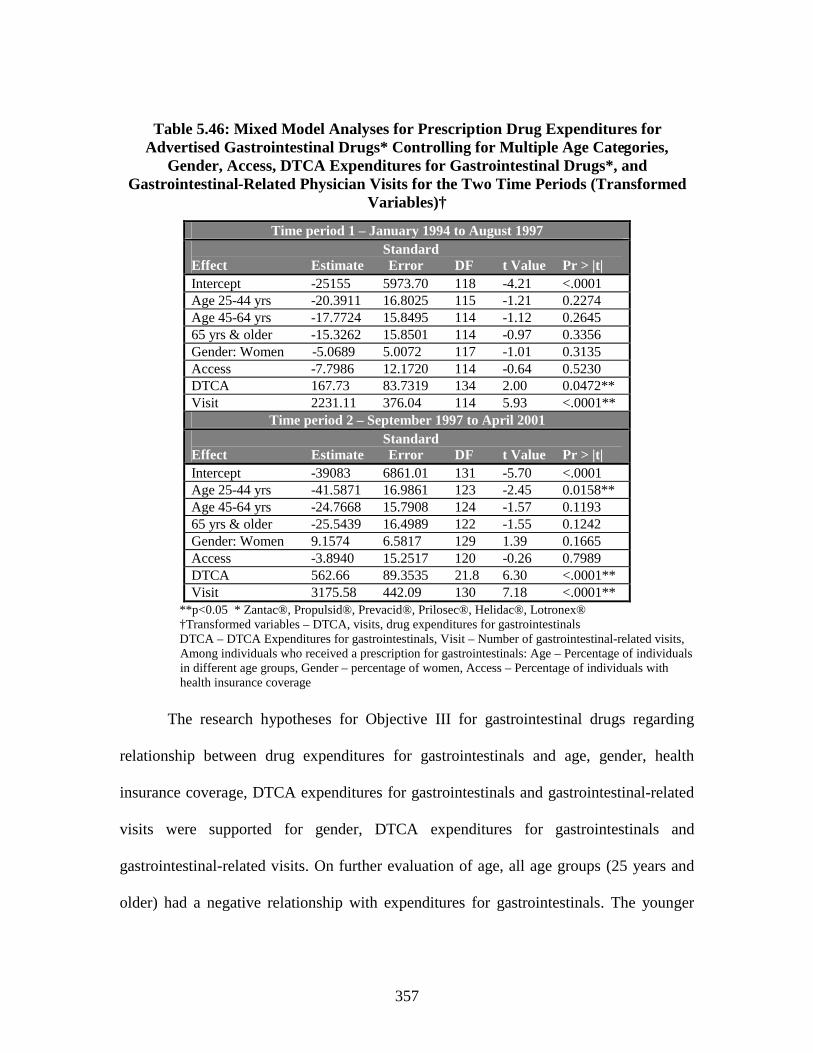
357
Table 5.46: Mixed Model Analyses for Prescription Drug Expenditures for Advertised Gastrointestinal Drugs* Controlling for Multiple Age Categories,
Gender, Access, DTCA Expenditures for Gastrointestinal Drugs*, and Gastrointestinal-Related Physician Visits for the Two Time Periods (Transformed
Variables)†
Time period 1 – January 1994 to August 1997Standard
Effect Estimate Error DF t Value Pr > |t|Intercept -25155 5973.70 118 -4.21 <.0001Age 25-44 yrs -20.3911 16.8025 115 -1.21 0.2274Age 45-64 yrs -17.7724 15.8495 114 -1.12 0.264565 yrs & older -15.3262 15.8501 114 -0.97 0.3356Gender: Women -5.0689 5.0072 117 -1.01 0.3135Access -7.7986 12.1720 114 -0.64 0.5230DTCA 167.73 83.7319 134 2.00 0.0472**Visit 2231.11 376.04 114 5.93 <.0001**
Time period 2 – September 1997 to April 2001Standard
Effect Estimate Error DF t Value Pr > |t|Intercept -39083 6861.01 131 -5.70 <.0001Age 25-44 yrs -41.5871 16.9861 123 -2.45 0.0158**Age 45-64 yrs -24.7668 15.7908 124 -1.57 0.119365 yrs & older -25.5439 16.4989 122 -1.55 0.1242Gender: Women 9.1574 6.5817 129 1.39 0.1665Access -3.8940 15.2517 120 -0.26 0.7989DTCA 562.66 89.3535 21.8 6.30 <.0001**Visit 3175.58 442.09 130 7.18 <.0001**
**p<0.05 * Zantac®, Propulsid®, Prevacid®, Prilosec®, Helidac®, Lotronex®†Transformed variables – DTCA, visits, drug expenditures for gastrointestinalsDTCA – DTCA Expenditures for gastrointestinals, Visit – Number of gastrointestinal-related visits,Among individuals who received a prescription for gastrointestinals: Age – Percentage of individuals in different age groups, Gender – percentage of women, Access – Percentage of individuals with health insurance coverage
The research hypotheses for Objective III for gastrointestinal drugs regarding
relationship between drug expenditures for gastrointestinals and age, gender, health
insurance coverage, DTCA expenditures for gastrointestinals and gastrointestinal-related
visits were supported for gender, DTCA expenditures for gastrointestinals and
gastrointestinal-related visits. On further evaluation of age, all age groups (25 years and
older) had a negative relationship with expenditures for gastrointestinals. The younger

358
individuals (25-44 years) had a more negative relationship with drug expenditures for
gastrointestinals than older individuals. The research hypothesis that significant
relationships in time period one was also significant in time period two was supported
(Age – 45 years and older). However, on further evaluation of age this hypothesis was no
longer supported.
Antidepressants
This section presents the time series and mixed model analyses results for
antidepressants. The results for Objective IV, comparing the relationships from
Objectives I, II, and III for the two time periods (1) January 1994 - August 1997, and (2)
September 1997 - April 2001, will be presented simultaneously with the three objectives.
Objective I
To determine the relationship between DTCA expenditures for antidepressants, access to
care, and demographics (age and gender) and physician visits for the symptoms and/or
conditions the antidepressants are used to treat (depression-related visits).
Time series analysis was employed to determine the relationships. The dependent
variable for this analysis was number of depression-related visits and the independent
variables included monthly total DTCA expenditures for all antidepressants, percentage
of individuals 45 years and older, percentage of women, and percentage of individuals
with health insurance coverage. These percentages were calculated from the total number
of individuals with depression-related visits. In addition, a dichotomous variable time
period (January 1994 to August 1997, September 1997 to April 2001), which categorized
the time of visit, was included in the analysis. The results of the analysis with all

359
untransformed variables were reconfirmed by analyzing with transformed (logarithmic)
values for DTCA expenditures and visits. The results from the analysis with transformed
and untransformed values of DTCA expenditures for antidepressants and depression-
related visits, yielded the same variables as significant and the results for the analysis
with untransformed variables are reported (Table 5.47).
Time Series Analysis; January 1994 to April 2001
The time series analysis yielded a Durbin-Watson statistic of 2.117. Based on this
Durbin-Watson statistic, the null hypothesis of no serial correlation present in the error
term was tested at p=0.05 level of significance for n=88 observations (88 months) of the
dependent variable monthly depression-related physician visits. The critical interval for
positive autocorrelation was identified as 1.542 to 1.776 and for negative autocorrelation
greater than 2.458 (4.0-1.542=2.458). The null hypothesis of no serial correlation present
in the error term was not rejected.
Table 5.47: Test Statistics for Ordinary Least Squares Analysis of Depression -Related Physician Visits Regressed on Age, Gender, Access, Total DTCA
Expenditures for Antidepressants* and Time Period
B SEB BETA T SIG TAge (> 45 yrs) -793.9 17632.1 -0.0049 -0.0450 0.9642Gender: Women -7826.6 19601.8 -0.0432 -0.3993 0.6907Access -17607.9 17039.5 -0.1098 -1.0334 0.3045DTCA 50.4 35.0 0.1926 1.4395 0.1538Time 248868.1 288496.7 0.1139 0.8626 0.3909Constant 5040688.2 1917894.1 . 2.6282 0.0102
**p<0.05 * - Wellbutrin®, Prozac®, Paxil®, Zoloft®, Effexor®, Serzone®Age (45 years and older), Gender (women), Access (with health insurance coverage) – Percentage of individuals with depression-related visitsDTCA –DTCA Expenditures for antidepressants Time – January 1994 -August 1997, September 1997 -April 2001

360
Ordinary least squares regression was used to determine the relationship between
the independent variables and monthly depression-related physician visits. The analysis
yielded an adjusted R-square of 0.038, but none of the variables in the model were
significant.
To further evaluate the relationship with age, the variable percentage of
individuals 45 years and older with depression-related visits was replaced with three
variables which measured the percentage of individuals with depression-related visits and
were 25-44 years, 45-64 years and 65 years and older. Again, none of the variables were
significant.
Time Series Analyses: Split by Time (Objective IV)
To determine if any of the relationships were significant in time period one were
also significant in time period two, the dataset was split by time period (January 1994 to
August 1997, September 1997 to April 2001). The time series analysis for both time
periods with untransformed and transformed (Logarithmic) values for depression-related
visits and total DTCA expenditures for antidepressants yielded the same result and the
results from the analysis with untransformed variables are reported.
The critical interval for positive autocorrelation was identified as 1.336 to 1.720
and for negative autocorrelation above 2.664 (4.0-1.336=2.664). The Durbin-Watson
statistic for time period one and two were calculated to be 2.093 and 2.017, respectively.
The null hypothesis of no serial correlation present in error term for both time periods
was not rejected. On regressing the independent variables on depression-related, none of
the variables were significant in either time period (Table 5.48).

361
Table 5.48: Test Statistics for Ordinary Least Squares Analyses of Depression-Related Physician Visits Regressed on Age, Gender, Access, and Total DTCA
Expenditures for Antidepressants* for the Two Time Periods
Time Period 1 – January 1994 to August 1997B SEB BETA T SIG T
Age (> 45 yrs) 3909.6 32719.6 0.0196 0.1195 0.9055Gender: Women -27795.6 31312.8 -0.1483 -0.8877 0.3802Access -969.4 28600.2 -0.0055 -0.0339 0.9731DTCA -6.1 125.1 -0.0079 -0.0489 0.9613Constant 5015506.0 2988278.1 . 1.6784 0.1013
Time Period 2 – September 1997 to April 2001B SEB BETA T SIG T
Age (> 45 yrs) -4155.0 19695.2 -0.0328 -0.2110 0.8340Gender: Women 14581.7 25030.8 0.0888 0.5826 0.5635Access -30474.9 20414.6 -0.2245 -1.4928 0.1435DTCA 60.3 33.2 0.2802 1.8171 0.0769Constant 5273928.0 2366524.5 . 2.2286 0.0317**p<0.05, * - Wellbutrin®, Prozac®, Paxil®, Zoloft®, Effexor®, Serzone®Age, Gender, Access – Percentage of Individuals with depression-related visit (45 years and older, women, with health insurance coverage), DTCA –DTCA Expenditures for antidepressants
Supplemental Analysis for Age
To further evaluate the effects of age, the variable percentage of individuals 45
years and older with depression-related visits was replaced by three variables which
measured the percentage of individuals with depression-related visits and were 25-44
years, 45-64 years and 65 years and older. Analyzing with transformed and
untransformed vales for DTCA expenditures for antidepressants and depression-related
visits yielded different results for time period two. The results for the analysis with
transformed values for both time periods are reported.
The critical interval for positive autocorrelation was identified as 1.238 to 1.835
and for negative correlation above 2.762 (4.0-1.238=2.762). The Durbin-Watson statistic
for time period one was calculated to be 1.601 and 1.897 for time period two. The null

362
hypothesis for no serial correlation in error term for time period one was rejected, but not
rejected for time period two. Yule-Walker method or Prais-Winsten was employed to
correct for the positive autocorrelation in time period one.
The results of the analyses for both time periods are presented in Table 5.49. The
significant variables in time period one were percentage of individuals 25-44 years and
45-64 years with depression-related visits. For time period two, only access or percentage
of individuals with health insurance coverage and a depression-related visit was
significant (Table 5.49).
An increase in percentage of individuals with depression-related visits and were
25 to 64 years of age was significantly related to an increase in depression-related visits
while controlling for other variables in the equation. The Pearson coefficient for age
group 25-44 years was 0.242 (p=0.114) and 0.098 (p=0.525) for age group 45 to 64 years
(untransformed values for visit). The Pearson coefficient for age group 25-44 years was
0.264 (p=0.083) and 0.105 (p=0.498) for age group 45 to 64 years (transformed values
for visit). Since the variables for age were expressed in percentages, the results may be
valid only for the ranges in percent values represented in the dataset (25-44 years – 20.7-
47.8%, Mean – 36.8+6.0%; 45-64 years – 21.5-42.0%, Mean – 32.3+ 5.2%).
For time period two, access had a negative unstandardized coefficient (-0.0122)
and the Pearson coefficient was –0.203 (p=0.186) for untransformed values for visit. The
Pearson coefficient for access was –0.284 (p=0.062) for transformed values for visit. An
increase in percentage of individuals with depression-related visits and health insurance
coverage was significantly related to a decrease in the number of depression-related visits

363
while controlling for other variables in the equation. The results for access or percent
individuals with health insurance coverage may be valid only for percent ranges
represented in the dataset (64.1-96.6%, Mean – 82.7+7.2%).
Table 5.49: Test Statistics for Ordinary Least Squares Analyses of Depression-Related Physician Visits Regressed on Multiple Age Categories, Gender, Access, and
Total DTCA Expenditures for Antidepressants* for Two Time Periods (Transformed Variables)†
Time Period 1 – January 1994 to August 1997B SEB BETA T SIG T
Age 25-44 yrs 0.0394 0.0113 0.6899 3.4911 0.0013**Age 45-64 yrs 0.0393 0.0133 0.5893 2.9503 0.0056**65 & older 0.0163 0.0140 0.2127 1.1691 0.2500Gender: Women -0.0075 0.0081 -0.1353 -0.9153 0.3661Access 0.0049 0.0082 0.0867 0.5940 0.5562DTCA -0.0111 0.0173 -0.0930 -0.6407 0.5258Constant 12.0420 1.2128 . 9.9294 0.0000
Time Period 2 – September 1997 to April 2001 B SEB BETA T SIG T
Age 25-44 yrs 0.0071 0.0083 0.1737 0.8573 0.3968Age 45-64 yrs -0.0007 0.0076 -0.0162 -0.0889 0.929665 yrs & older 0.0064 0.0082 0.1653 0.7823 0.4390Gender: Women 0.0007 0.0071 0.0152 0.0934 0.9257Access -0.0122 0.0057 -0.3379 -2.1381 0.0392**DTCA 0.0189 0.0131 0.2203 1.4417 0.1578Constant 15.6180 0.8789 . 17.7690 0.0000
**p<0.05, * Wellbutrin®, Prozac®, Paxil®, Zoloft®, Effexor®, Serzone®†Transformed variables – DTCA, depression-related visitsDTCA – DTCA Expenditures for antidepressantsAge, Gender, Access – Percentage of Individuals with depression-related visit (45 years and older, women, with health insurance coverage)
In time period one, the beta value for the two age groups 25 to 44 years and 45
to 64 years was approximately three times higher than the beta value for the age variable
65 years and older and was considerably higher than beta values for other variables. In
time period two, this difference in beta values reduced considerably and was no longer as
high as in time period one and for age group 45-64 years, although it was not significant,
the relationship was negative. The beta value for access or percentage of individuals with

364
depression-related visits and health care coverage increased from time period one and
was much higher than the beta values for the other variables in time period two.
The research hypotheses for Objective I regarding relationships between
depression-related visits and age, gender, health insurance coverage, and total DTCA
expenditures for antidepressants, were not supported. The research hypothesis that
significant relationships in time period one were also significant in time period two was
supported when age was calculated as percentage of individuals 45 years and older. On
further evaluation of age, the younger individuals 25 – 64 years had a significant positive
relationship with depression-visits, but only in time period one.
Objective II
To determine the relationship between DTCA expenditures for antidepressants, access to
care, demographics (age and gender), depression-related physician visits and the number
of prescriptions written for the advertised antidepressants.
Mixed model analysis was employed to determine the relationships for this
objective. In the analysis for dependent variable number of prescriptions written for
advertised antidepressants, the independent variables included monthly depression-
related visits, DTCA expenditures for each of the antidepressants, percentage of
individuals 45 years and older, percentage of women, and percentage of individuals with
health insurance coverage. These percentages were calculated from the total number of
individuals who received a prescription for each of the advertised antidepressants each
month. The dichotomous variable time period (January 1994 to August 1997, September

365
1997 to April 2001), which categorizes the time when prescription was written, along
with its interaction with the independent variables were also included in the analysis.
Mixed Model Analysis with Transformed Variables
For the analysis, the variables number of depression-related visits and number of
prescriptions written for antidepressants were transformed to their square root values. The
variable DTCA expenditures for antidepressants was transformed to its logarithmic
values. The auto-regressive covariance structure, modeling the within-subject (drug –
antidepressants) correlation over time (0.7213) or in other words the correlation between
the number of prescriptions written for antidepressants separated by one time interval
(one month) was significant (p<0.0001). The results of the analysis are presented in Table
5.50. The calculated R-square was 0.318, signifying that 31.8 percent of the variance in
the number of prescriptions written for advertised antidepressants was explained by the
model. The significant variables were access or percentage of individuals who received a
prescription for antidepressants and had health insurance coverage {df=385, t=2.59,
p=0.0099}, and depression-related visits {df=396, t=14.98, p<0.0001}.
An increase in percentage of individuals who received a prescription for
advertised antidepressants and had health insurance coverage was significantly related to
an increase in prescriptions written for advertised antidepressants while controlling for
the other variables in the equation. An increase in the depression-related visits was
significantly related to an increase in the number of prescriptions written for advertised
antidepressants while controlling for the other variables in the equation.

366
Table 5.50: Mixed Model Analysis for Prescriptions Written for Advertised Antidepressants* Controlling for Age, Gender, Access, DTCA Expenditures for
Antidepressants*, Depression-Related Physician Visits, and Time Period (Transformed Variables)†
Time StandardEffect Period Estimate Error DF t Value Pr > |t|Intercept -168.01 77.4247 467 -2.17 0.0305Age (> 45 yrs) 0.5209 0.4013 390 1.30 0.1951Gender: Women 0.2585 0.4193 397 0.62 0.5379Access 1.2768 0.4926 385 2.59 0.0099**DTCA -3.5859 5.4309 410 -0.66 0.5095Visit 0.3222 0.02151 396 14.98 <.0001**Time 1 85.9200 84.3637 445 1.02 0.3090Time 2 0 . . . .Age*Time 1 -0.6080 0.5256 391 -1.16 0.2480Age*Time 2 0 . . . .Women*Time 1 -0.01381 0.5581 394 -0.02 0.9803Women*Time 2 0 . . . .Access*Time 1 -1.1305 0.7005 392 -1.61 0.1074Access*Time 2 0 . . . .DTCA*Time 1 -3.2937 8.6565 491 -0.38 0.7037DTCA*Time 2 0 . . . .** p<0.05 * Wellbutrin®, Prozac®, Paxil®, ®, Zoloft®, Effexor®, Serzone®†Transformed variables – DTCA, visits, number of prescriptions written for antidepressantsVisit – Depression-related visits, DTCA – DTCA Expenditures for antidepressantsAmong individuals who received a prescription for antidepressants: Age – percentage of 45 years and older, Gender – Percentage of women, Access – Percentage of individuals with health insurance coverage. Time - 1 (January 1994 to August 1997), 2 – (September 1997 to April 2001)
The variable depression-related physician visit was a month-level variable
whereas all other variables in the model were month and drug-level and as a result there
may be some distortion of the results. On analyzing without the depression-related visit
variable, there were no new significant variables indicating that the variable visit was not
suppressing effects of other variables.
Mixed Model Analysis with Untransformed Variables
In order to interpret the results of the analysis with transformed values for
depression-related visits, DTCA expenditures and number of prescriptions written for

367
antidepressants, the analysis was repeated with their untransformed values. The results of
the analysis with the untransformed values are presented in Table 5.51. In the analysis
with transformed values, access (percentage of individuals with health insurance
coverage) and depression-related visits were significant. These variables were interpreted
using values or estimates from the analysis with untransformed variables.
Table 5.51: Untransformed Mixed Model Analysis for Prescriptions Written for Advertised Antidepressants* Controlling for Age, Gender, Access, DTCA
Expenditures for Antidepressants*, Depression-Related Physician Visits, and Time Period
Time StandardEffect period Estimate Error DF t Value Pr > |t|Intercept -182304 83563 491 -2.18 0.0296Age (> 45 yrs) 787.21 551.98 384 1.43 0.1546Gender: Women 61.1538 574.94 397 0.11 0.9153Access 1818.43 677.48 377 2.68 0.0076**DTCA 2.0432 7.6305 452 0.27 0.7890Visit 0.1079 0.007664 390 14.08 <.0001**Time 1 65933 108164 491 0.61 0.5424Time 2 0 . . . .Age*Time 1 -666.61 722.95 386 -0.92 0.3571Age*Time 2 0 . . . .Women*Time 1 -74.1078 766.69 390 -0.10 0.9230Women*Time 2 0 . . . .Access*Time 1 -955.15 962.44 388 -0.99 0.3216Access*Time 2 0 . . . .DTCA*Time 1 -0.9937 27.0767 477 -0.04 0.9707DTCA*Time 2 0 . . . .
** p<0.05 * Wellbutrin®, Prozac®, Paxil®, ®, Zoloft®, Effexor®, Serzone®Visit – Depression-related visits, DTCA – DTCA Expenditures for antidepressantsAmong individuals who received a prescription for antidepressants: Age – percentage of 45 years and older, Gender – Percentage of women, Access – Percentage of individuals with health insurance coverage. Time - 1 (January 1994 to August 1997), 2 – (September 1997 to April 2001)
For every one percent increase in individuals who received prescriptions for
antidepressants and had health insurance coverage, approximately 1,818 (unstandardized
coefficient = 1,818.43) more prescriptions were written for advertised antidepressants
while controlling for the other variables in the equation. The percentage range for access

368
or percentage of individuals with health insurance coverage in the dataset was 0 to 100
percent (Mean – 85.5+16.9%). For every one depression-related visit increase, 0.1
(unstandardized coefficient = 0.1079) more prescriptions were written for advertised
antidepressants or in other words, for every ten depression-related visit increase, one
more prescription was written for advertised antidepressants while controlling for other
variables in the equation.
Supplemental Mixed Model Analysis for Age
To further evaluate the effects of age, the variable percentage of individuals who
received a prescription for antidepressants and were 45 years and older was replaced by
variables which represented the percentage of individuals who received a prescription for
antidepressants and were less than 25 years, 25-44 years, 45-64 years, and 65 years and
older. The results of the mixed model analysis with untransformed values for DTCA
expenditures, depression-related visits and number of prescriptions written for
antidepressants are presented in Table 5.52. The auto-regressive covariance structure,
modeling the within-subject (drug – antidepressants) correlation over time (0.7170) or in
other words the correlation between the number of prescriptions written for
antidepressants separated by one time interval (one month) was significant (p<0.0001).
The only age variable percentage of individuals who received prescriptions for
antidepressants and were 65 years and older was significant {df =395, t =2.06, p=0.0404).
An increase in percentage of individuals who received prescriptions for advertised
antidepressants and were 65 years and older was significantly related to an increase in the
number of prescriptions written for antidepressants while controlling for the other

369
variables in the equation. The percentage range of individuals 65 years and older who
received a prescription for advertised antidepressants was 0-100 percent (Mean – 16.5+
17.6%). Other variables access and depression-related visits significant in this analysis
were significant in previous analysis (Table 5.50) and have been presented earlier.
Table 5.52: Mixed Model Analysis for Prescriptions Written for Advertised Antidepressants* Controlling for Multiple Age Categories, Gender, Access, DTCA
Expenditures for Antidepressants*, Depression-Related Visits and Time Period (Transformed Variables)†
Time StandardEffect period Estimate Error DF t Value Pr > |t|Intercept -152.89 92.7770 487 -1.65 0.1000Age 25-44 Yrs 0.1975 0.7580 398 0.26 0.7946Age 45-64 Yrs 0.2003 0.7342 392 0.27 0.785165 Yrs & Older 1.7366 0.8444 395 2.06 0.0404**< 25 yrs 0 . . . .Gender: Women 0.3462 0.4258 397 0.81 0.4167Access 1.0576 0.5093 379 2.08 0.0385**DTCA -4.1978 5.4191 403 -0.77 0.4390Visit 0.3156 0.02194 395 14.38 <.0001**Time 1 29.5266 109.17 486 0.27 0.7869Time 2 0 . . . .Age 25-44 Yrs*Time 1 0.4518 1.0066 401 0.45 0.6538Age 25-44 Yrs*Time 2 0 . . . .Age 45-64 Yrs*Time 1 0.3750 1.0133 399 0.37 0.7115Age 45-64 Yrs*Time 2 0 . . . .65 Yrs & Older*Time 1 -1.4797 1.0839 396 -1.36 0.175965 Yrs & Older*Time 2 0 . . . .< 25 yrs*Time 1 0 . . . .< 25 yrs*Time 2 0 . . . .Women*Time 1 -0.1659 0.5660 392 -0.29 0.7696Women*Time 2 0 . . . .Access*Time 1 -0.8937 0.7214 386 -1.24 0.2161Access*Time 2 0 . . . .DTCA*Time 1 -3.2808 8.6522 487 -0.38 0.7047DTCA*Time 2 0 . . . .
** p<0.05 * Wellbutrin®, Prozac®, Paxil®, ®, Zoloft®, Effexor®, Serzone®†Transformed variables – DTCA, visits, number of prescriptions written for antidepressantsDTCA – DTCA Expenditures for antidepressants, Visit – Number of depression-related visitsAmong individuals who received a prescription for antidepressants: Age – Percentage of individuals in different age groups, Gender – percentage of women, Access – Percentage of individuals with health insurance coverage,Time - 1 (January 1994 to August 1997), 2 – (September 1997 to April 2001)

370
Since it is difficult to interpret the results of the analysis with transformed
variables, the analysis was repeated with the untransformed values for depression-related
visits, DTCA expenditures, and number of prescriptions written for advertised
antidepressants (Table 5.53).
Table 5.53: Untransformed Mixed Model Analysis for Prescriptions Written for Advertised Antidepressants* Controlling for Multiple Age Categories, Gender,
Access, DTCA Expenditures for Antidepressants*, Depression-Related Visits and Time Period
Time StandardEffect period Estimate Error DF t Value Pr > |t|Intercept -151701 106950 465 -1.42 0.1567Age 25-44 yrs -158.63 1042.10 398 -0.15 0.8791Age 45-64 yrs -1.4231 1011.65 390 -0.00 0.998965 yrs & older 2173.32 1161.97 396 1.87 0.0622< 25 yrs 0 . . . .Gender: Women 217.91 585.13 399 0.37 0.7098Access 1583.66 703.85 370 2.25 0.0250**DTCA 3.9783 7.6000 437 0.52 0.6009Visit 0.1062 0.007848 390 13.53 <.0001**Time 1 10655 143755 466 0.07 0.9409Time 2 0 . . . .Age 25-44 yrs*Time 1 541.57 1383.06 399 0.39 0.6956Age 25-44 yrs*Time 2 0 . . . .Age 45-64 yrs*Time 1 460.40 1392.83 396 0.33 0.7412Age 45-64 yrs*Time 2 0 . . . .65 yrs & older*Time 1 -1746.58 1491.70 393 -1.17 0.242465 yrs & older*Time 2 0 . . . .< 25 yrs* Time 1 0 . . . .< 25 yrs*Time 2 0 . . . .Women*Time 1 -259.63 779.44 391 -0.33 0.7392Women*Time 2 0 . . . .Access*Time 1 -747.40 995.21 382 -0.75 0.4531Access*Time 2 0 . . . .DTCA*Time 1 -3.0367 27.1520 475 -0.11 0.9110DTCA*Time 2 0 . . . .** p<0.05 * Wellbutrin®, Prozac®, Paxil®, ®, Zoloft®, Effexor®, Serzone®DTCA – DTCA Expenditures for antidepressants, Visit – Number of depression-related visitsAmong individuals who received a prescription for antidepressants: Age – Percentage of individuals in different age groups, Gender – percentage of women, Access – Percentage of individuals with health insurance coverageTime - 1 (January 1994 to August 1997), 2 – (September 1997 to April 2001)

371
The only age variable that was significant was the percentage of individuals 65
years and older who received prescriptions for advertised antidepressants. For every one
percent increase in individuals who received a prescription for antidepressants and were
65 years and older, 2,173 (unstandardized coefficient = 2173.32) more prescriptions were
written for advertised antidepressants while controlling for other variables in the
equation.
The variable depression-related physician visit was a month-level variable
whereas all other variables in the analysis were month and drug-level and as a result there
may be some distortion in the results. On repeating the analysis with transformed
variables, but without the depression-related visit variable, there were no new significant
variables indicating that the variable visit was not suppressing effects of other variables.
Mixed Model Analyses with Transformed Variables: Split by Time (Objective IV)
To test if significant relationships in time period one were also significant in time
period two (Objective IV), the dataset was split by time period (January 1994 to August
1997, September 1997 to April 2001). Mixed model analysis was employed for both
datasets and transformed values were used for variables depression-related visits, DTCA
expenditures, and number of prescriptions written for advertised antidepressants. The
auto-regressive covariance structure, modeling the within-subject (drug - antidepressants)
correlation over time or in other words the correlation between the number of
prescriptions written for antidepressants separated by one time interval (1 month) was
significant in both time periods (Time 1 = 0.7509, Time 2 = 0.6738, p<0.0001) (Table
5.54).

372
Table 5.54: Mixed Model Analyses for Prescriptions Written for Advertised Antidepressants* Controlling for Age, Gender, Access, DTCA Expenditures for
Antidepressants* and Depression-Related Physician Visits For Both Time Periods (Transformed Variables)†
Time Period 1 - January 1994-August 1997
StandardEffect Estimate Error DF t Value Pr > |t|Intercept -159.61 81.0536 204 -1.97 0.0502Age (> 45yrs) -0.04931 0.3306 191 -0.15 0.8816Gender: Women 0.1907 0.3572 190 0.53 0.5941Access 0.1265 0.4874 193 0.26 0.7954DTCA -8.4430 7.4710 230 -1.13 0.2596Visit 0.3549 0.02677 190 13.26 <.0001**
Time Period 2 – September 1997-April 2001Standard
Effect Estimate Error DF t Value Pr > |t|Intercept -65.2603 101.56 254 -0.64 0.5211Age(> 45yrs) 0.5008 0.4187 197 1.20 0.2330Gender: Women 0.2466 0.4354 202 0.57 0.5717Access 1.1768 0.5176 194 2.27 0.0241**DTCA 0.2687 5.5028 173 0.05 0.9611Visit 0.2831 0.03597 204 7.87 <.0001****p<0.05 * Wellbutrin®, Prozac®, Paxil®, Zoloft®, Effexor®, Serzone®†Transformed Variables – DTCA, visits, number of prescriptions written for antidepressantsDTCA – DTCA expenditures for antidepressants, Visit – Number of depression-related visitsAmong individuals who received a prescription for antidepressants: Age – Percentage of individuals in different age groups, Gender – percentage of women, Access – Percentage of individuals with health insurance
The variable depression-related visit was significant in both time periods. An
increase in depression-related visits was significantly related to an increase in
prescriptions written for advertised antidepressants while controlling for the other
variables in the equation. The variable access or percentage of individuals who received a
prescription for antidepressants and had health insurance coverage was significant only in
time period two (Range – 0-100%, Mean – 85.9+16.1%) and had a positive estimate. An
increase in percentage of individuals with health insurance coverage among those who
received a prescription for antidepressants was significantly related to an increase in

373
prescriptions written for advertised antidepressants controlling for other variables in the
equation.
Supplemental Analysis for Age
To further evaluate the relationship of number of prescriptions written for
antidepressants with age, the age variable (45 years and older) was replaced by the age
variables which represented percentage of individuals less than 25 years, 25-44 years, 45-
64 years and 65 years and older who received prescription for antidepressants. The auto-
regressive covariance structure, modeling the within-subject (drug - antidepressants)
correlation over time or in other words the correlation between the number of
prescriptions written for antidepressants separated by one time interval (1 month) was
significant in both time periods (Time 1 = 0.7495, Time 2 = 0.6634, p<0.0001).
Similar to the previous analyses for the two datasets (Table 5.54) for age 45 years
and older, the variable, depression-related visit was significant in both time periods.
However, the variable percentage of individuals 65 years and older (Range – 0-93.5%,
Mean – 15.5+ 15.5%) who received prescription for antidepressants was significant only
in time period two. An increase in depression-related visits was significantly related to an
increase in prescriptions written for advertised antidepressants while controlling for the
other variables in the equation. An increase in the percentage of individuals who received
prescription for advertised antidepressants and were 65 years and older was significantly
related to an increase in prescriptions written for advertised antidepressants in time period
two while controlling for the other variables in the equation.

374
Table 5.55: Mixed Model Analyses for Prescriptions Written for Advertised Antidepressants* Controlling for Multiple Age Categories, Gender, Access, DTCA
Expenditures for Antidepressants*, and Depression-Related Physician Visits For the Two Time Periods (Transformed Variables)†
Time Period 1 - January 1994-August 1997
StandardEffect Estimate Error DF t Value Pr > |t|Intercept -192.79 91.0182 224 -2.12 0.0352Age 25-44 Yrs 0.5256 0.6465 196 0.81 0.4172Age 45-64 Yrs 0.4691 0.6790 196 0.69 0.490565 Yrs & Older 0.2535 0.6680 193 0.38 0.7047< 25 yrs 0 . . . .Gender: Women 0.1408 0.3632 189 0.39 0.6986Access 0.1374 0.5011 191 0.27 0.7842DTCA -8.8688 7.5351 228 -1.16 0.2404Visit 0.3507 0.02755 190 12.73 <.0001**
Time Period 2 – September 1997-April 2001
Standard Effect Estimate Error DF t Value Pr > |t|Intercept -41.2534 117.30 242 -0.35 0.7254Age 25-44 Yrs 0.1266 0.7886 202 0.16 0.8726Age45-64 Yrs 0.08489 0.7683 198 0.11 0.912165 Yrs & Older 1.7526 0.8756 200 2.00 0.0467**< 25 yrs 0 . . . .Gender: Women 0.3498 0.4404 201 0.79 0.4280Access 0.9461 0.5331 189 1.77 0.0775DTCA -0.01002 5.4376 165 -0.01 0.9985Visit 0.2736 0.03635 202 7.53 <.0001****p<0.05 * Wellbutrin®, Prozac®, Paxil®, Zoloft®, Effexor®, Serzone®†Transformed variables – DTCA, visits, number of prescriptions written for antidepressantsVisit – Number of depression-related visits, DTCA – DTCA expenditures for antidepressantsAmong individuals who received a prescription for antidepressants: Age – percentage of individuals 45 years and older, Gender – Percentage of women, Access – Percentage of individuals with health insurance coverage
The research hypotheses for Objective II regarding relationships between number
of prescriptions written for antidepressants and age, gender, health insurance coverage,
DTCA expenditures for antidepressants and depression-related visits were supported for
age (65 years and older), health insurance coverage and depression-related visits. The
research hypothesis that significant relationships in time period one was also significant

375
in time period two was not supported. On further evaluation of age, older individuals (65
years and older) had a positive relationship with the number of prescriptions written,
especially in time period two.
Objective III
To determine the relationship between DTCA expenditures for antidepressants, access to
care, demographics (age and gender), depression-related physician visits and the drug
expenditures for the advertised antidepressants.
Mixed model analysis was employed to determine the relationships for this
objective. In this analysis for dependent variable prescription drug expenditures for
advertised antidepressants, the independent variables were monthly depression-related
visits, DTCA expenditures for each of the antidepressants, percentage of individuals 45
years and older, percentage of women, and percentage of individuals with health
insurance coverage. The percentages were calculated from the total number of individuals
who received a prescription for each of the advertised antidepressants each month. The
dichotomous variable time period (January 1994 to August 1997, September 1997 to
April 2001) along with its interaction with the independent variables were also included
in the analysis.
Mixed Model Analysis with Transformed Variables
For the purpose of this analysis, the variable number of depression-related visits
was transformed to its square root values and the variables DTCA expenditures and
prescription drug expenditures for advertised antidepressants were transformed to their
logarithmic values. The auto-regressive covariance structure, modeling the within-subject

376
(drug – antidepressants) correlation over time (0.8003) or in other words the correlation
between prescription drug expenditures for antidepressants separated by one time interval
(one month) was significant (p<0.0001). The calculated R-square was 0.232, signifying
that 23.2 percent of the variance in the prescription drug expenditures for antidepressants
was explained by the model. The results of the analysis are presented in Table 5.56. The
significant variables in the model were depression-related visits {df=417, t=11.75,
p<0.0001}, time {df=394, t=2.06, p=0.0401} and the interaction between access and time
period {df=411, t=-2.41, p=0.0163}.
The results indicate that an increase in depression-related visits was significantly
related to an increase in the drug expenditures for antidepressants while controlling for
the other variables in the equation. The variable time was significant indicating that the
drug expenditures in time one varied significantly from drug expenditures in time period
two. The estimate for drug expenditures for antidepressants were higher in time period
one (0.9309+13.4155=14.3464) than in time period two (13.4155) indicating that the
drug expenditures for antidepressants were significantly higher in time period one
compared to time period two while controlling for the other variables in the equation.
The significant interaction between access and time period indicates that the
relationship between drug expenditures for antidepressants and access or percent
individuals who received a prescription for advertised antidepressants and had health
insurance coverage varied significantly in time period one from time period two. The
slope for access or the interaction in time period one (0.004253 – 0.0084=-0.004147) was
lower than slope in time period two (0.004253). In fact, the variable percent individuals

377
with health insurance coverage had a negative relationship with prescription drug
expenditures for antidepressants in time period one and a positive relationship in time
period two.
Table 5.56: Mixed Model Analysis for Prescription Drug Expenditures for Advertised Antidepressants* Controlling for Age, Gender, Access, DTCA
Expenditures for Antidepressants*, Depression-Related Physician Visits, and Time Period (Transformed Variables)†
Time StandardEffect period Estimate Error DF t Value Pr > |t|Intercept 13.4155 0.4142 322 32.39 <.0001Age (> 45 yrs) 0.001822 0.001995 410 0.91 0.3616Gender: Women 0.003894 0.002087 414 1.87 0.0628Access 0.004253 0.002446 408 1.74 0.0829Visit 0.001259 0.000107 417 11.75 <.0001**DTCA -0.01431 0.02869 479 -0.50 0.6182Time 1 0.9309 0.4520 394 2.06 0.0401**Time 2 0 . . . .Age*Time 1 -0.00333 0.002613 411 -1.27 0.2034Age*Time 2 0 . . . .Women*Time 1 -0.00184 0.002776 413 -0.66 0.5077Women*Time 2 0 . . . .Access*Time 1 -0.00840 0.003483 411 -2.41 0.0163**Access*Time 2 0 . . . .DTCA*Time 1 -0.01718 0.04445 485 -0.39 0.6993DTCA*Time 2 0 . . . .** p<0.05 * Wellbutrin®, Prozac®, Paxil®, ®, Zoloft®, Effexor®, Serzone®†Transformed variables – DTCA, visits, drug expenditures for antidepressantsVisit – Depression-Related Visits, DTCA – DTCA Expenditures for antidepressantsTime - 1 (January 1994 to August 1997), 2 – (September 1997 to April 2001)Among individuals who received a prescription for antidepressants: Age – percentage of individuals 45 years and older, Gender – Percentage of women, Access – Percentage of individuals with health insurance coverage
The variable depression-related physician visit was a month-level variable
whereas all other variables in the analysis were month and drug-level and as a result there
may be some distortion in the results. Hence, the analysis with transformed values for
DTCA expenditures and drug expenditures for antidepressants was repeated, but without

378
the depression-related visit variable. There were no new significant variables indicating
that the variable visit was not suppressing effects of other variables.
Mixed Model Analysis with Untransformed Variables
Owing to the fact that the variables depression-related visits, DTCA expenditures,
and drug expenditures for antidepressants were transformed, the interpretation of the
results of this analysis was difficult. Hence, the analysis was repeated using the
untransformed values for DTCA expenditures, visits and drug expenditures (Table 5.57).
Table 5.57: Untransformed Mixed Model Analysis for Prescription Drug Expenditures for Advertised Antidepressants* Controlling for Age, Gender, Access, DTCA Expenditures for Antidepressants*, Depression-Related Physician Visits, and
Time Period
Time StandardEffect period Estimate Error DF t Value Pr > |t|Intercept -1.649E7 7085767 409 -2.33 0.0204Age (> 45 yrs) 56784 41535 396 1.37 0.1724Gender: Women 11317 44275 403 0.26 0.7984Access 140444 53701 392 2.62 0.0093**DTCA -465.13 635.32 491 -0.73 0.4644Visit 7.9497 0.6006 403 13.24 <.0001**Time 1 9131398 9100248 448 1.00 0.3162Time 2 0 . . . .Age*Time 1 -48465 55302 397 -0.88 0.3814Age*Time 2 0 . . . .Women*Time 1 -35856 59412 400 -0.60 0.5465Women*Time 2 0 . . . .Access*Time 1 -57907 74785 398 -0.77 0.4392Access*Time 2 0 . . . .DTCA*Time 1 69.0013 2171.05 461 0.03 0.9747DTCA*Time 2 0 . . . .** p<0.05 * Wellbutrin®, Prozac®, Paxil®, ®, Zoloft®, Effexor®, Serzone®Visit – Depression-Related Visits, DTCA – DTCA Expenditures for antidepressantsTime - 1 (January 1994 to August 1997), 2 – (September 1997 to April 2001)Among individuals who received a prescription for antidepressants: Age – percentage of individuals 45 years and older, Gender – Percentage of women, Access – Percentage of individuals with health insurance coverage
The estimates from the results of this analysis with untransformed variables
presented in Tables 5.57 were used to interpret the significant variables in the analysis

379
with the transformed variables (Table 5.56). The significant variable in the analysis with
transformed values was depression-related visits. An increase in the number of
depression-related visits was significantly related to an increase in prescription drug
expenditures for advertised antidepressants while controlling for other variables in the
equation. For every one depression-related visit increase, the expenditures for
antidepressants increased by approximately $8.0 (unstandardized coefficient = 7.9497).
Supplemental Analysis for Age
To further evaluate the effects of age, the variable percentage of individuals who
received a prescription for antidepressants and were 45 years and older was replaced by
variables which represented percentage of individuals who received a prescription for
antidepressants and were less than 25 years, 25-44 years, 45-64 years, and 65 years and
older. Mixed model analysis was employed to determine the relationships with age and
the results are presented in Table 5.58. The auto-regressive covariance structure,
modeling the within-subject (drug – antidepressants) correlation over time (0.7997) or in
other words the correlation between prescription drug expenditures for antidepressants
separated by one time interval (one month) was significant (p<0.0001).
In this analysis the significant variables were percentage of individuals who
received prescription for antidepressants and were 65 years and older {df=412, t=2.47,
p=0.0141}, depression-related visits (significant in original model – Table 5.57) and
interaction between percentage of individuals 65 years and older and time period
{df=414, t=-2.07, p=0.0388}. An increase in the percentage of individuals who received
prescriptions for antidepressants and were 65 years and older (Range – 0-100%, Mean –

380
16.5+17.6%) was significantly related to an increase in prescription drug expenditures for
antidepressants while controlling for the other variables in the equation.
Table 5.58: Mixed Model Analysis for Prescription Drug Expenditures for Advertised Antidepressants* Controlling for Multiple Age Categories, Gender,
Access, DTCA Expenditures for Antidepressants*, Depression-Related Visits and Time Period (Transformed Variables)†
Time StandardEffect period Estimate Error DF t Value Pr > |t|Intercept 13.3188 0.4855 411 27.43 <.0001Age 25-44 yrs 0.004329 0.003757 414 1.15 0.2500Age 45-64 yrs 0.002876 0.003635 411 0.79 0.429365 Yrs & older 0.01031 0.004182 412 2.47 0.0141**< 25 yrs 0 . . . .Gender: Women 0.004012 0.002110 413 1.90 0.0579Access 0.002673 0.002515 403 1.06 0.2884DTCA -0.01782 0.02857 475 -0.62 0.5332Visit 0.001213 0.000109 415 11.15 <.0001**Time 1 0.7491 0.5693 465 1.32 0.1888Time 2 0 . . . .Age 25-44 yrs*Time 1 -0.00032 0.004994 418 -0.06 0.9490Age 25-44 yrs*Time 2 0 . . . .Age 45-64 yrs*Time 1 0.000758 0.005025 416 0.15 0.8802Age 45-64 yrs*Time 2 0 . . . .65 yrs & older*Time 1 -0.01113 0.005371 414 -2.07 0.0388**65 yrs & older*Time 2 0 . . . .< 25 yrs*Time 1 0 . . . .< 25 yrs*Time 2 0 . . . .Women*Time 1 -0.00241 0.002802 410 -0.86 0.3903Women*Time 2 0 . . . .Access*Time 1 -0.00619 0.003567 407 -1.73 0.0835Access*Time 2 0 . . . .DTCA*Time 1 -0.02065 0.04426 481 -0.47 0.6411DTCA*Time 2 0 . . . .** p<0.05 * Wellbutrin®, Prozac®, Paxil®, ®, Zoloft®, Effexor®, Serzone®†Transformed variables – DTCA, visits, drug expenditures for antidepressantsDTCA – DTCA Expenditures for antidepressants, Visit – Number of depression-related visitsTime - 1 (January 1994 to August 1997), 2 – (September 1997 to April 2001)Among individuals who received a prescription for antidepressants: Age – Percentage of individuals in different age groups, Gender – percentage of women, Access – Percentage of individuals with health insurance coverage
The significant interaction between percentage of individuals 65 years and older
and time period indicates that the relationship between percent individuals who received

381
prescription for advertised antidepressants and were 65 years and older and prescription
drug expenditures for advertised antidepressants varied significantly in time period one
from time period two. The slope for percentage of individuals 65 years and older for time
period one was lower (0.01031 – 0.01113 = -0.00082) than the slope for time period two
(0.01031). The variable percentage of individuals 65 years and older had a negative
relationship with drug expenditures for advertised antidepressants in time period one and
a positive relationship in time period two.
The results for age (percentage of individuals 65 years and older) were interpreted
using the values from the results of the analysis with untransformed variables (Table
5.59). For every one percent increase in individuals who received prescriptions for
antidepressants and were 65 years and older, prescription drug expenditures for
advertised antidepressants increased by $130,426.

382
Table 5.59: Untransformed Mixed Model Analysis for Prescription Drug Expenditures for Advertised Antidepressants* Controlling for Multiple Age
Categories, Gender, Access, DTCA Expenditures for Antidepressants*, Depression-Related Visits and Time Period
Time StandardEffect period Estimate Error DF t Value Pr > |t|Intercept -1.31E7 8261996 482 -1.58 0.1136Age 25-44 yrs -30417 79073 402 -0.38 0.7007Age 45-64 yrs -9871.77 73613 397 -0.13 0.893465 yrs & older 130426 87872 400 1.48 0.1385< 25 yrs 0 . . . .Gender: Women 23802 45956 402 0.52 0.6048Access 127938 56362 385 2.27 0.0238**DTCA -318.98 635.89 486 -0.50 0.6162Visit 7.8132 0.6093 400 12.82 <.0001**Time 1 3591722 11878524 487 0.30 0.7625Time 2 0 . . . .Age 25-44*Time 1 62589 113802 404 0.55 0.5826Age 25-44*Time 2 0 . . . .Age 45-64*Time 1 46883 111431 402 0.42 0.6742Age 45-64*Time 2 0 . . . .65*Time 1 -98067 120033 400 -0.82 0.414465*Time 2 0 . . . .< 25 yrs 1 0 . . . .< 25 yrs 2 0 . . . .Women*Time 1 -51103 61794 397 -0.83 0.4087Women*Time 2 0 . . . .Access*Time 1 -47257 78750 392 -0.60 0.5488Access*Time 2 0 . . . .DTCA*Time 1 -73.3616 2183.83 458 -0.03 0.9732DTCA*Time 2 0 . . . .
** p<0.05 * Wellbutrin®, Prozac®, Paxil®, ®, Zoloft®, Effexor®, Serzone®DTCA – DTCA Expenditures for antidepressants, Visit – Number of depression-related visitsAmong individuals who received a prescription for antidepressants: Age – percentage of individuals 45 years and older, Gender – Percentage of women, Access – Percentage of individuals with health insurance coverageTime - 1 (January 1994 to August 1997), 2 – (September 1997 to April 2001)
The variable depression-related physician visit was a month-level variable
whereas all other variables in the model were month and drug-level and as a result there
may be some distortion in the results. Hence, the analysis with transformed values for
DTCA expenditures and drug expenditures for antidepressants and multiple categories for
age was repeated, but without the depression-related visit variable. There were no new

383
significant variables indicating that the visit variable was not suppressing effects of other
variables.
Mixed Model Analyses with Transformed Variables: Split by Time (Objective IV)
To test if significant relationships in time period one were also significant in time
period two (Objective IV), the dataset was split by time period (January 1994 to August
1997, September 1997 to April 2001). Using mixed model analysis, both datasets were
analyzed to determine the relationships. The transformed values for depression-related
visits, DTCA expenditures and drug expenditures for antidepressants were used for the
analysis. The results of the analysis are presented in Table 5.60.
Table 5.60: Mixed Model Analyses for Prescription Drug Expenditures for Advertised Antidepressants* Controlling for Age, Gender, Access, DTCA
Expenditures for Antidepressants*, and Depression-Related Physician Visits for the Two Time Periods (Transformed Variables)†
Time Period 1 – January 1994 to August 1997Standard
Effect Estimate Error DF t Value Pr > |t|Intercept 13.5946 0.4912 123 27.68 <.0001Age (> 45 yrs) -0.00116 0.001873 197 -0.62 0.5359Gender: Women 0.001859 0.002023 196 0.92 0.3592Access -0.00401 0.002763 198 -1.45 0.1480DTCA -0.03727 0.04315 226 -0.86 0.3888Visit 0.001574 0.000152 196 10.38 <.0001**
Time Period 2 – September 1997 to April 2001Standard
Effect Estimate Error DF t Value Pr > |t|Intercept 14.6369 0.4555 231 32.13 <.0001Age (> 45 yrs) 0.001350 0.001777 211 0.76 0.4481Gender: Women 0.003596 0.001851 213 1.94 0.0534Access 0.003008 0.002194 209 1.37 0.1717DTCA -0.00352 0.02572 239 -0.14 0.8912Visit 0.000808 0.000153 216 5.28 <.0001**
**p<0.05 * Wellbutrin®, Prozac®, Paxil®, Zoloft®, Effexor®, Serzone®†Transformed variables – DTCA, visits, drug expenditures for antidepressantsVisit – Number of depression-related visits, DTCA – DTCA Expenditures for antidepressantsAmong individuals who received a prescription for antidepressants: Age – percentage of individuals 45 years and older, Women – Percentage of women, Access – Percentage of individuals with health insurance coverage

384
The auto-regressive covariance structure, modeling the within-subject (drug -
antidepressants) correlation over time or in other words the correlation between
prescription drug expenditures for antidepressants separated by one time interval (1
month) was significant in both time periods (Time 1 = 0.8104, Time 2 = 0.7781,
p<0.0001). The variable number of depression-related visits was significant in both time
periods. An increase in depression-related visits was significantly related to an increase in
the expenditures for advertised antidepressants in both time periods while controlling for
other variables in the equation.
Supplemental Analysis for Age
To further evaluate the relationship with age in both time periods the variable
percent individuals who received a prescription for antidepressants and were 45 years and
older was replaced by the age variables which represented the percentage of individuals
who received a prescription for antidepressants and were less than 25 years, 25-44 years,
45-64 years and 65 years and older. The above mixed model analyses were repeated with
these new age variables for both datasets (both time periods) and the results are presented
in Table 5.61. The auto-regressive covariance structure, modeling the within-subject
(drug - antidepressants) correlation over time or in other words the correlation between
prescription drug expenditures for antidepressants separated by one time interval (1
month) was significant in both time periods (Time 1 = 0.8098, Time 2 = 0.7763,
p<0.0001).
The variable depression-related visit was again significant in both time periods.
However, the variables percentage of individuals who received prescription for

385
antidepressants and were 65 years and older (Range – 0-93.5%, Mean – 15.5 + 15.5%)
and percentage of individuals with prescriptions for antidepressants who were women
(Range – 0-100%, Mean – 66.2+ 20.2%) were significant only in time period two.
Table 5.61: Mixed Model Analyses for Prescription Drug Expenditures for Advertised Antidepressants* Controlling for Multiple Age Categories, Gender,
Access, DTCA Expenditures for Antidepressants*, and Depression-Related Physician Visits for the Two Time Periods (Transformed Variables)†
Time Period 1 – January 1994 to August 1997Standard
Effect Estimate Error DF t Value Pr > |t|Intercept 13.4080 0.5423 159 24.73 <.0001Age 25-44 yrs 0.003096 0.003663 200 0.85 0.3990Age 45-64 yrs 0.002775 0.003847 200 0.72 0.471665 yrs & older -0.00069 0.003781 199 -0.18 0.8562< 25 yrs 0 . . . .Gender: Women 0.001520 0.002052 195 0.74 0.4596Access -0.00351 0.002833 196 -1.24 0.2172DTCA -0.04347 0.04343 224 -1.00 0.3179Visit 0.001526 0.000156 196 9.80 <.0001**
Time Period 2 – September 1997 to April 2001Standard
Effect Estimate Error DF t Value Pr > |t|Intercept 14.5743 0.5151 250 28.30 <.0001Age 25-44 yrs 0.003342 0.003322 213 1.01 0.3155Age 45-64 yrs 0.001334 0.003230 211 0.41 0.680165 yrs & older 0.009721 0.003684 211 2.64 0.0089**< 25 yrs 0 . . . .Gender: Women 0.003898 0.001854 212 2.10 0.0367**Access 0.001475 0.002234 207 0.66 0.5097DTCA -0.00657 0.02537 236 -0.26 0.7960Visit 0.000773 0.000153 214 5.05 <.0001**
**p<0.05 * Wellbutrin®, Prozac®, Paxil®, Zoloft®, Effexor®, Serzone®†Transformed variables – DTCA, visits, drug expenditures for antidepressantsVisit – Number of depression-related visits, DTCA – DTCA Expenditures for antidepressantsAmong individuals who received a prescription for antidepressants: Age – percentage of individuals 45 years and older, Women – Percentage of women, Access – Percentage of individuals with health insurance coverage
In time period two, an increase in percent individuals who received prescription
for advertised antidepressants and were 65 years and older was significantly related to an
increase in drug expenditures for advertised antidepressants while controlling for other

386
variables in the equation. An increase in the percentage of individuals with a prescription
for antidepressants who were women was significantly related to an increase in drug
expenditures for advertised antidepressants in time period two while controlling for other
variables in the equation.
The research hypotheses for Objective III regarding relationships between drug
expenditures for antidepressants and age, gender, health insurance coverage, DTCA
expenditures for antidepressants and depression-related visit were supported for
depression-related visits and age (65 years and older). On further evaluation of age, older
individuals (65 years and older) and women had a significant relationship with drug
expenditures, especially in time period two. The research hypothesis that significant
relationships in time period one were also significant in time period two was supported
when age variable included only individuals 45 years and older.
Antihypertensives
This section presents the results for the time series and mixed model analyses for
the antihypertensive drugs. The results for Objective IV, comparing the relationships
from Objectives I, II, and III for the two time periods (1) January 1994 to August 1997,
and (2) September 1997 to April 2001, will be presented simultaneously with the three
objectives.
Objective I
To determine the relationship between DTCA expenditures for antihypertensives, access
to care, and demographics (age and gender) and physician visits for the symptoms and/or
diagnosis of hypertension (hypertension-related visits).

387
Time series analysis was employed to determine the relationships for this
objective. In this analysis for dependent variable monthly hypertension-related visits, the
independent variables were monthly total DTCA expenditures for all antihypertensive
drugs, percentage of individuals 45 years and older, percentage of women, and
percentage of individuals with health insurance coverage. These percentages were
calculated from the total number of individuals with hypertension-related visits each
month. The dichotomous variable time period (January 1994 to August 1997, September
1997 to April 2001), which categorized the time of visit was also included. The results of
the analysis with all untransformed variables were reconfirmed by analyzing with
transformed (logarithmic) values for DTCA expenditures and hypertension-related visits.
Time Series Analysis: January 1994 to April 2001
Analyzing the dataset with transformed variables (logarithmic) or untransformed
values for hypertension-related visits and total DTCA expenditures for antihypertensives
did not change the results and the results with the untransformed variables are reported
(Table 5.62). The time series analysis yielded a Durbin-Watson statistic of 2.067. Based
on this Durbin-Watson Statistic, the null hypothesis of no serial correlation present in the
error term was tested at p=0.05 level of significance for n=88 observations (88 months)
of the dependent variable monthly hypertension-related physician visits. The critical
values for positive autocorrelation were identified as 1.542 to 1.776 and for negative
autocorrelation greater than 2.458 (4.0-1.542=2.458). The null hypothesis of no serial
correlation present in the error term was not rejected. Ordinary least squares regression
was used to determine the relationship between the independent variables and the

388
dependent variable monthly hypertension-related physician visits. The analysis yielded an
adjusted R-square 0.0813.
The only significant variable in the model was the variable time period {t=2.95,
p=0.0042} with unstandardized coefficient 1,209,418.6. During the second time period
(September 1997 to April 2001), there were approximately 1,209,419 more hypertension-
related visits compared to time period one (January 1994 to August 1997) while
controlling for the other variables in the equation.
Table 5.62: Test Statistics for Ordinary Least Squares Analysis of Hypertension-Related Physician Visits Regressed on Age, Gender, Access, Total DTCA
Expenditures for Antihypertensives* and Time Period
B SEB BETA T SIG TAge (> 45 yrs) -64530.9 42450.1 -0.1594 -1.5202 0.1323Gender: Women 11495.9 35098.1 0.0342 0.3275 0.7441Access 33083.5 38439.5 0.0943 0.8607 0.3919DTCA 126.6 122.0 0.1284 1.0377 0.3024Time 1209418.6 410510.6 0.3682 2.9461 0.0042**Constant 4782510.8 5317184.6 . 0.8994 0.3710
**p<0.05, * - Adalat®, Altace®, Capoten®, Cardizem®, Cardura®, Coreg®, Lotensin®, Toprol XL®Age, Gender, Access – Percentage of Individuals with hypertension-related visit (45 years and older, women, with health insurance coverage), DTCA –DTCA Expenditures for antihypertensives Time – January 1994 to August 1997, September 1997 to April 2001
Time Series Analyses: Split by Time (Objective IV)
To test if significant relationships in time period one were significant again in
time period two, the dataset was split by time period (January 1994 to August 1997,
September 1997 to April 2001). Both datasets were analyzed using time series analysis.
The results of the analyses with transformed values for DTCA expenditures and
hypertension-related visits did not change when analyzed with untransformed values and
the results with the untransformed values are presented in Table 5.63.

389
Table 5.63: Test Statistics for Ordinary Least Squares Analyses of Hypertension-Related Physician Visits Regressed on Age, Gender, Access, and Total DTCA
Expenditures for Antihypertensives* for the Two Time Periods
Time Period 1 – January 1994 to August 1997B SEB BETA T SIG T
Age (> 45 yrs) -57669.7 38854.0 -0.2348 -1.4843 0.1458Gender: Women 6252.5 31995.8 0.0309 0.1954 0.8461Access 6858.7 39675.5 0.0269 0.1729 0.8636DTCA 95.0 87.1 0.1755 1.0910 0.2820Constant 8163624.3 5067007.9 . 1.6111 0.1152
Time Period 2 – September 1997 to April 2001B SEB BETA T SIG T
Age (> 45 yrs) -66776.2 83377.6 -0.1284 -0.8009 0.4280Gender: Women 23542.7 71103.0 0.0546 0.3311 0.7423Access 68903.1 69038.0 0.1696 0.9980 0.3244DTCA 941.2 906.7 0.1659 1.0381 0.3056Constant 3190351.4 10724381.9 . 0.2975 0.7677
**p<0.05 * - Adalat®, Altace®, Capoten®, Cardizem®, Cardura®, Coreg®, Lotensin®, Toprol XL® Age, Gender, Access – Percentage of Individuals with hypertension-related visit (45 years and older, women, with health insurance coverage) DTCA –DTCA expenditures for antihypertensives
The critical interval for positive autocorrelation was identified as 1.336 to 1.720
and for negative autocorrelation above 2.664 (4.0-1.336=2.664). The Durbin-Watson
statistic for time period one was calculated to be 1.846 and 2.114 for time period two.
The null hypothesis of no serial correlation present in the error term for both time periods
was not rejected. On regressing the independent variables on hypertension-related visits,
none of the variables were significant in either time period.
The research hypotheses for Objective I regarding relationships between
hypertension-related visits and age, gender, health insurance coverage, and total DTCA
expenditures for antihypertensives were not supported. Since none of the variables were
significant in either time period, the research hypothesis that significant relationships in
time period one were significant in time period two was supported.

390
Objective II
To determine the relationship between DTCA expenditures for antihypertensives, access
to care, demographics (age and gender), hypertension-related physician visits and the
number of prescriptions written for the advertised antihypertensives.
In this mixed model analysis for dependent variable prescriptions written for
advertised antihypertensives, the independent variables included monthly hypertension-
related visits, DTCA expenditures for each of the antihypertensive drugs, percentage of
individuals 45 years and older, percentage of women, and percentage of individuals with
health insurance coverage. These percentages were calculated from the total number of
individuals who received a prescription for each of the advertised antihypertensives each
month. The dichotomous variable time period (January 1994 to August 1997, September
1997 to April 2001), which categorizes the time when prescription was written, along
with its interaction with the independent variables were also included in the analysis.
Mixed Model Analysis with Transformed Variables
For the analysis, the variables hypertension-related visits, DTCA expenditures
and number of prescriptions written for antihypertensive drugs were all transformed to
their logarithmic values. The auto-regressive covariance structure, modeling the within-
subject (drug – antihypertensives) correlation over time (0.4581) or in other words the
correlation between the number of prescriptions written for antihypertensives separated
by one time interval (one month) was significant (p<0.0001). The calculated R-square
was 0.129, signifying that 12.9 percent of the variance in the number of prescriptions
written for advertised antihypertensives was accounted for by the model.

391
The results of the mixed model analysis are presented in Table 5.64. The
significant variables were access or percentage of individuals who received a prescription
for advertised antihypertensives and had health insurance coverage {df=547, t=-2.79,
p=0.0054}, DTCA expenditures for antihypertensives {df=590, t=-2.98, p=0.0030},
hypertension-related physician visits {df=493, t = 8.58, p<0.001} and interaction between
DTCA expenditures and time period {df=609, t=3.64, p=0.0003}.
Table 5.64: Mixed Model Analysis for Prescriptions Written for Advertised Antihypertensives* Controlling for Age, Gender, Access, DTCA Expenditures for
Antihypertensives*, Hypertension-Related Physician Visits, and Time Period (Transformed Variables)†
StandardEffect Period Estimate Error DF t Value Pr > |t|Intercept -0.9004 1.7663 498 -0.51 0.6104Age (< 45 Yrs) -0.00185 0.003252 530 -0.57 0.5694Gender: Women 0.001427 0.001464 517 0.98 0.3300Access -0.01281 0.004587 547 -2.79 0.0054**DTCA -0.1214 0.04078 590 -2.98 0.0030**Visit 0.9181 0.1070 493 8.58 <.0001**Time 1 -0.7798 0.6869 566 -1.14 0.2568Time 2 0 . . . .Age*Time 1 -0.00141 0.004486 537 -0.31 0.7541Age*Time 2 0 . . . .Women*Time 1 -0.00073 0.002311 542 -0.32 0.7506Women*Time 2 0 . . . .Access*Time 1 0.008509 0.005553 543 1.53 0.1260Access*Time 2 0 . . . .DTCA*Time 1 0.1795 0.04931 609 3.64 0.0003**DTCA*Time 2 0 . . . .
**p<0.05 * - Adalat®, Altace®, Capoten®, Cardizem®, Cardura®, Coreg®, Lotensin®, Toprol XL®†Transformed variables – DTCA, visits, number of prescriptions written for antihypertensivesDTCA – DTCA Expenditures for antihypertensives, Visit – Number of hypertension-related visitsAmong individuals who received a prescription for antihypertensives: Age – Percent individuals 45 years and older, Gender, Percent women, Access – Percent individuals with health insurance coverageTime – 1 (January 1994 to August 1997), 2 – (September 1997 to April 2001)
An increase in depression-related visits was significantly related to an increase in
number of prescriptions written for advertised antihypertensives whereas an increase in
DTCA expenditures for antihypertensives was related to a decrease in number of

392
prescriptions written for advertised antihypertensives. The significant interaction between
DTCA expenditures and time indicates that the relationship between DTCA expenditures
for antihypertensives and number of prescriptions written for antihypertensives varied
significantly in time period one from time period two. The slope for DTCA expenditures
in time period one (-0.1214+0.1795 = 0.0581) was greater (positive) than its slope in time
period two (-0.1214) indicating a positive relationship between DTCA expenditures for
antihypertensives and number of prescriptions written for advertised antihypertensives in
time period one and a negative relationship in time period two.
The variable hypertension-related physician visit was a month-level variable
whereas all other variables in the analysis were month and drug-level and as a result there
may be some distortion in the results. Hence, the analysis with transformed variables was
repeated, but without the hypertension-related visit variable. There were no new
significant variables in the model indicating that the variable visit was not suppressing
effects of other variables.
Mixed Model Analysis with Untransformed Variables
The use of transformed variables in the analysis make it difficult to interpret the
results. Hence, the analysis with transformed values for DTCA expenditures for
antihypertensives, number of prescriptions written for advertised antihypertensives and
number of hypertension-related physician visits was repeated with the untransformed
values. The results of the analysis with the untransformed values are presented in Table
5.65. The estimates from the results of the analysis with untransformed values were used
to interpret the significant variables in the analysis with transformed values (Table 5.64).

393
The significant variables in the analysis with the transformed variables (Table 5.64) were
access or percentage of individuals with health insurance coverage, DTCA expenditures
for antihypertensives and hypertension-related visits.
An increase in percentage of individuals who received a prescription and had
health insurance coverage (Range – 0-100%, Mean – 94.4+13.6%) was significantly
related to a decrease in the number of prescriptions written for advertised
antihypertensives while controlling for the other variables in the equation. For every one
percent increase in individuals with health insurance coverage (decrease in percent
individuals without coverage) who received a prescription for antihypertensives,
approximately 1,703 (unstandardized coefficient = 1,702.86) fewer prescriptions were
written for advertised antihypertensives while controlling for the other variables in the
equation.
An increase in DTCA expenditures for antihypertensives was significantly related
to a decrease in the number of prescriptions written for antihypertensives while
controlling for the other variables in the equation. For every $1,000 increase in DTCA
expenditures for antihypertensives, approximately 75 (unstandardized coefficient =
74.69) fewer prescriptions were written for antihypertensives while controlling for the
other variables in the equation.
An increase in hypertension-related physician visits was significantly
related to an increase in the number of prescriptions written for advertised
antihypertensives while controlling for the other variables in the equation. For every one
hypertension-related visit increase, approximately 0.03 (unstandardized coefficient =

394
0.0344) more prescriptions were written for advertised antihypertensives or in other
words, for every 100 hypertension-related visit increase, three more prescriptions were
written for advertised antihypertensives while controlling for the other variables in the
equation.
Table 5.65: Untransformed Mixed Model Analysis for Prescriptions Written for Advertised Antihypertensives* Controlling for Age, Gender, Access, DTCA
Expenditures for Antihypertensives*, Hypertension-Related Physician Visits, and Time Period
Time StandardEffect period Estimate Error DF t Value Pr > |t|Intercept 179381 95556 560 1.88 0.0610Age (> 45 yrs) 185.29 533.35 514 0.35 0.7284Gender: Women 219.36 240.13 502 0.91 0.3614Access -1702.86 757.73 537 -2.25 0.0250**DTCA -74.6911 64.6583 548 -1.16 0.2485Visit 0.03439 0.003308 474 10.39 <.0001**Time 1 -48999 113892 572 -0.43 0.6672Time 2 0 . . . .Age*Time 1 -415.44 737.12 517 -0.56 0.5733Age*Time 2 0 . . . .Women*Time 1 -257.53 380.27 519 -0.68 0.4986Women*Time 2 0 . . . .Access*Time 1 1107.10 914.63 528 1.21 0.2267Access*Time 2 0 . . . .DTCA*Time 1 81.4677 66.2582 557 1.23 0.2194DTCA*Time 2 0 . . . .**p<0.05 * - Adalat®, Altace®, Capoten®, Cardizem®, Cardura®, Coreg®, Lotensin®, Toprol XL®DTCA – DTCA Expenditures for antihypertensives, Visit – Number of hypertension-related visitsAmong individuals who received a prescription for antihypertensives: Age – Percent individuals 45 years and older, Gender, Percent women, Access – Percent individuals with health insurance coverageTime – 1 (January 1994 to August 1997), 2 – (September 1997 to April 2001)
Mixed Model Analyses with Transformed Variables: Split by Time (Objective IV)
To test if significant relationships in time period one were also significant in time
period two (Objective IV), the dataset was split by time period (January 1994 to August
1997, September 1997 to April 2001). Both datasets were analyzed using mixed model
analysis with transformed values for hypertension-related visits, DTCA expenditures and

395
number of prescriptions written for antihypertensives. The auto-regressive covariance
structure, modeling the within-subject (drug - antihypertensives) correlation over time or
in other words the correlation between the number of prescriptions written for
antihypertensives separated by one time interval (1 month) was significant in both time
periods (Time 1 = 0.4714, Time 2 = 0.4455, p<0.0001). The results of the analysis are
presented in Table 5.66.
Table 5.66: Mixed Model Analyses for Prescriptions Written for Advertised Antihypertensives* Controlling for Age, Gender, Access, DTCA Expenditures for Antihypertensives*, and Hypertension-Related Physician Visits for the Two Time
Periods (Transformed Variables)†
Time Period 1 – January 1994-August 1997Standard
Effect Estimate Error DF t Value Pr > |t|Intercept -5.1976 3.0882 235 -1.68 0.0937Age (> 45 yrs) -0.00283 0.003110 253 -0.91 0.3636Gender: Women 0.000951 0.001751 257 0.54 0.5877Access -0.00440 0.003062 245 -1.44 0.1521DTCA 0.05928 0.02712 200 2.19 0.0300**Visit 1.1453 0.1979 234 5.79 <.0001**
Time Period 2 – September 1997-April 2001Standard
Effect Estimate Error DF t Value Pr > |t|Intercept 0.3895 2.1013 263 0.19 0.8531Age (> 45 yrs) -0.00195 0.003378 294 -0.58 0.5651Gender: Women 0.001507 0.001501 278 1.00 0.3162Access -0.01263 0.004694 292 -2.69 0.0076**DTCA -0.1177 0.04220 322 -2.69 0.0056**Visit 0.8343 0.1290 260 6.47 <.0001**
**p<0.05 * Adalat®, Altace®, Capoten®, Cardizem®, Cardura®, Coreg®, Lotensin®, Toprol XL®†Transformed variables – DTCA, visits, number of prescriptions written for antihypertensivesVisit –Number of hypertension-related visits, DTCA – DTCA expenditures for antihypertensivesAmong individuals who received prescription for antihypertensives: Age – percentage of individuals 45 years and older, Gender – Percentage of women, Access – Percentage of individuals with health insurance coverage
The variables hypertension-related visits and DTCA expenditures for
antihypertensives were significant in both time periods. However, access or percentage of

396
individuals with health insurance coverage (Range –0-100%, Mean: 96.5+10.1%) who
received a prescription for antihypertensive was significant only in time period two. An
increase in hypertension-related visits was significantly related to an increase in
prescriptions written for antihypertensives in both time periods while controlling for
other variables in the equation. An increase in DTCA expenditures for antihypertensives
was significantly related to an increase in prescriptions written for antihypertensives in
time period one and a decrease in prescriptions written for antihypertensives in time
period two while controlling for other variables in the equation. An increase in percent
individuals who received prescription for antihypertensives was significantly related to a
decrease in prescriptions written for antihypertensives in time period two while
controlling for other variables in the equation.
The research hypotheses for Objective II regarding relationships between number
of prescriptions written for antihypertensives and age, gender, health insurance coverage,
DTCA expenditures and hypertension-related visits were supported for hypertension-
related visits. The research hypothesis that significant relationships in time period one
were also significant in time period two was not supported.
Objective III
To determine the relationship between DTCA expenditures for antihypertensives, access
to care, age, gender, hypertension-related physician visits and the drug expenditures for
the advertised antihypertensives.
In this mixed model analysis for dependent variable drug expenditures for
advertised antihypertensives, the independent variables included monthly hypertension-

397
related visits, DTCA expenditures for antihypertensives, percentage of individuals 45
years and older, percentage of women, and percentage of individuals with health
insurance coverage. These percentages were calculated from total number of individuals
who received a prescription for each of the antihypertensives each month. The
dichotomous variable time period (January 1994 to August 1997, September 1997 to
April 2001), which categorized the time when prescription was written, along with its
interaction with the independent variables were also included in the analysis.
Mixed Model Analysis with Transformed Variables
For the analysis, the variables hypertension-related visits, DTCA expenditures for
antihypertensives, and drug expenditure variables for antihypertensive drugs were all
transformed to their logarithmic values. The auto-regressive covariance structure,
modeling the within-subject (drug – antihypertensives) correlation over time (0.5832) or
in other words the correlation between prescription drug expenditures for
antihypertensives separated by one time interval (one month) was significant (p<0.0001).
The calculated R-square was 0.132, signifying that 13.2 percent of the variance in
prescription drug expenditures for antihypertensives was accounted for by the model.
The results of the analysis are presented in Table 5.67. The significant variables
were access or percentage of individuals who received a prescription for advertised
antihypertensives and had health insurance coverage {df=534, t=-2.87, p=0.0042},
DTCA expenditures for antihypertensives {df=555, t=-3.13, p=0.0018}, hypertension-
related physician visits {df=482, t=8.70, p<0.001}, and interaction between DTCA
expenditures and time period {df=609, t=3.70, p=0.0002}.

398
An increase in the percentage of individuals who received a prescription for
advertised antihypertensive drugs and had health insurance coverage (Range – 0-100%,
Mean – 94.4+13.6%) was significantly related to a decrease in the drug expenditures for
advertised antihypertensives. An increase in DTCA expenditures for antihypertensives
was related to a decrease in drug expenditures for advertised antihypertensives. An
increase in the number of hypertension-related visits was related to an increase in the
drug expenditures for advertised antihypertensive drugs.
Table 5.67: Mixed Model Analysis for Prescription Drug Expenditures for Advertised Antihypertensives* Controlling for Age, Gender, Access, DTCA
Expenditures for Antihypertensives*, Hypertension-Related Physician Visits, and Time Period (Transformed Variables)†
Time StandardEffect period Estimate Error DF t Value Pr > |t|Intercept 2.7221 1.7502 490 1.56 0.1205Age (> 45 yrs) -0.00165 0.003245 512 -0.51 0.6121Gender: Women 0.001360 0.001456 499 0.93 0.3507Access -0.01324 0.004604 534 -2.87 0.0042**DTCA -0.1294 0.04133 555 -3.13 0.0018**Visit 0.9210 0.1058 482 8.70 <.0001**Time 1 -0.8417 0.6951 572 -1.21 0.2264Time 2 0 . . . .Age*Time 1 -0.00205 0.004482 515 -0.46 0.6470Age*Time 2 0 . . . .Women*Time 1 -0.00030 0.002311 517 -0.13 0.8977Women*Time 2 0 . . . .Access*Time 1 0.009149 0.005564 527 1.64 0.1007Access*Time 2 0 . . . .DTCA*Time 1 0.1901 0.05136 609 3.70 0.0002**DTCA*Time 2 0 . . . .
**p<0.05 * - Adalat®, Altace®, Capoten®, Cardizem®, Cardura®, Coreg®, Lotensin®, Toprol XL®†Transformed variables – DTCA, visits, drug expenditures for antihypertensivesDTCA – DTCA Expenditures for antihypertensives, Visit – Number of hypertension-related visitsAmong individuals who received prescription for antihypertensives: Age – percentage of individuals 45 years and older, Gender – Percentage of women, Access – Percentage of individuals with health insurance coverageTime – 1 (January 1994 to August 1997), 2 – (September 1997 to April 2001)

399
The interaction between DTCA expenditures for antihypertensives and time
period was significant indicating that the relationship between DTCA expenditures for
antihypertensives and prescription drug expenditures for antihypertensives varied
significantly in time period one from time period two. The slope for DTCA expenditures
for time period one was (-0.1294+0.1901 = 0.0607) was positive and greater than slope
for time period two (-0.1294) indicating a positive relationship between DTCA
expenditures and prescription drug expenditures for antihypertensives in time period one
and negative relationship in time period two.
The variable hypertension-related physician visit was a month-level variable
whereas all other variables in the analysis were month and drug-level and as a result there
may have been some distortion in the results. So, the above analysis with transformed
variables was repeated, but without the hypertension-related visit variable. There were no
new significant variables in the model indicating that the variable visit was not
suppressing effects of other variables.
Mixed Model Analysis with Untransformed Variables
The analysis with transformed values for hypertension-related visits, DTCA
expenditures and drug expenditures for antihypertensives makes the interpretation
difficult. Hence, the dataset was analyzed again with untransformed values for
hypertension-related visits, DTCA expenditures and drug expenditures for
antihypertensives. The results of the analysis are presented in Table 5.68. The estimates
from the results of the analysis with untransformed values were used to interpret the
significant variables in the analysis with transformed values. The significant variables in

400
the analysis with transformed values were access, DTCA expenditures for
antihypertensives and hypertension-related visits.
Table 5.68: Untransformed Mixed Model Analysis for Prescription Drug Expenditures for Advertised Antihypertensives* Controlling for Age, Gender,
Access, DTCA Expenditures for Antihypertensives*, Hypertension-Related Physician Visits, and Time Period
Time StandardEffect period Estimate Error DF t Value Pr > |t|Intercept 7463137 4770193 610 1.56 0.1182Age (> 45 yrs) 8953.56 26240 522 0.34 0.7331Gender: Women 3352.06 11892 513 0.28 0.7782Access -67642 36592 543 -1.85 0.0651DTCA -4844.59 3125.23 531 -1.55 0.1217Visit 1.4013 0.1626 500 8.62 <.0001**Time 1 389722 5735217 609 0.07 0.9458Time 2 0 . . . .Age*Time 1 -18905 36199 521 -0.52 0.6017Age*Time 2 0 . . . .Women*Time 1 -13388 18901 520 -0.71 0.4791Women*Time 2 0 . . . .Access*Time 1 41243 44397 535 0.93 0.3533Access*Time 2 0 . . . .DTCA*Time 1 5608.02 3219.18 536 1.74 0.0821DTCA*Time 2 0 . . . .
**p<0.05 * - Adalat®, Altace®, Capoten®, Cardizem®, Cardura®, Coreg®, Lotensin®, Toprol XL®DTCA – DTCA Expenditures for antihypertensives, Visit – Number of hypertension-related visitsAmong individuals who received prescription for antihypertensives: Age – percentage of individuals 45 years and older, Women – Percentage of women, Access – Percentage of individuals with healthinsurance coverage, Time – 1 (January 1994 to August 1997), 2 – (September 1997 to April 2001)
An increase in percentage of individuals who received a prescription for
advertised antihypertensives and had health insurance coverage was significantly related
to a decrease in expenditures for antihypertensive drugs while controlling for the other
variables in the equation. For every one percent increase in individuals who received a
prescription for antihypertensives and had health insurance coverage (decrease in percent
individuals without coverage), the drug expenditures for antihypertensives decreased by
$67,642 while controlling for the other variables in the equation.

401
An increase in number of hypertension-related visits was significantly related to
an increase in prescription drug expenditures for antihypertensives while controlling for
the other variables in the equation. For every one hypertension-related visit increase, the
prescriptions drug expenditures for antihypertensives increased by approximately $1.4
(unstandardized coefficient = 1.40). An increase in DTCA expenditures for
antihypertensives was significantly related to a decrease in drug expenditures for
antihypertensives while controlling for the other variables in the equation. For every
$1,000 increase in DTCA expenditures for antihypertensives, drug expenditures for
antihypertensives decreased by $4,845 while controlling for the other variables in the
equation.
Mixed Model Analyses with Transformed Variables: Split by Time (Objective IV)
To test if significant relationships in time period one were also significant in time
period two (Objective IV), the dataset was split by time period (January 1994 to August
1997, September 1997 to April 2001). Using transformed values for hypertension-related
visits, DTCA expenditures and drug expenditures for antihypertensives, both datasets
were analyzed using mixed model analysis. The auto-regressive covariance structure,
modeling the within-subject (drug - antihypertensives) correlation over time or in other
words the correlation between prescription drug expenditures for advertised
antihypertensives separated by one time interval (1 month) was significant in both time
periods (Time 1 = 0.6461, Time 2 = 0.5166, p<0.0001).
The variable number of hypertension-related visits was significant in both time
periods. The variables DTCA expenditures for antihypertensive drugs and access or

402
percentage of individuals with health insurance coverage (Range – 0-100%, Mean – 96.5
+ 10.1%) who received a prescription for antihypertensive drug were significant only in
time period two.
Table 5.69: Mixed Model Analyses for Prescription Drug Expenditures for Advertised Antihypertensives* Controlling for Age, Gender, Access, DTCA
Expenditures for Antihypertensives*, Hypertension-Related Physician Visits For Both Time Periods (Transformed Variables)†
Time Period 1 – January 1994 to August 1997Standard
Effect Estimate Error DF t Value Pr > |t|Intercept -1.5958 3.0493 228 -0.52 0.6013Age (> 45 yrs) -0.00356 0.003106 238 -1.14 0.2535Gender: Women 0.001418 0.001753 240 0.81 0.4195Access -0.00425 0.003042 233 -1.40 0.1633DTCA 0.05520 0.03062 273 1.80 0.0725Visit 1.1469 0.1951 226 5.88 <.0001**
Time Period 2 – September 1997 to April 2001Standard
Effect Estimate Error DF t Value Pr > |t|Intercept 3.9933 2.0888 260 1.91 0.0570Age (> 45 yrs) -0.00145 0.003386 288 -0.43 0.6698Gender: Women 0.001517 0.001498 271 1.01 0.3119Access -0.01301 0.004704 288 -2.77 0.0060**DTCA -0.1207 0.04273 313 -2.82 0.0050**Visit 0.8369 0.1282 257 6.53 <.0001****p<0.05 * Adalat®, Altace®, Capoten®, Cardizem®, Cardura®, Coreg®, Lotensin®, Toprol XL®†Transformed variables – DTCA, visits, drug expenditures for antihypertensivesDTCA – DTCA Expenditures for antihypertensives, Visit –Number of hypertension-related visitsAmong individuals who received a prescription for antihypertensives: Age – percentage of individuals 45 years and older, Gender – Percentage of women Access – Percentage of individuals with health insurance coverage
An increase in hypertension-related visits was significantly related to an increase
in drug expenditures for advertised antihypertensives in both time periods while
controlling for the other variables in the equation. An increase in DTCA expenditures for
antihypertensives was significantly related to a decrease in drug expenditures for
advertised antihypertensives in time period two while controlling for the other variables

403
in the equation. In time period two, an increase in percent individuals who received
prescription for advertised antihypertensives and had health insurance coverage was
significantly related to a decrease in drug expenditures for advertised antihypertensives
while controlling for the other variables in the equation.
The research hypotheses for Objective III regarding relationships between
prescription drug expenditures for antihypertensives and age, gender, health insurance
coverage, DTCA expenditures for antihypertensives and hypertension-related visits were
supported only for hypertension-related visits. The research hypothesis that significant
relationships in time period one was also significant in time period two was not
supported. The next chapter will discuss the results of the analyses presented in this
chapter along with the limitations and conclusions of the study.

404
CHAPTER 6: DISCUSSION AND CONCLUSION
The first section of this chapter describes the limitations followed by a discussion
of the results for all the objectives of the study for the five drug classes. The final section
of this chapter provides suggestions for future research.
SECTION I: LIMITATIONS
This section will discuss the limitations of the study including the limitations of
the data sources, therapeutic classes selected, operationalization of the study variables,
and the study design.
Data Sources: CMR, NAMCS and AWP
The advertising expenditure data were obtained from the Competitive Media
Reporting or the CMR database, which includes advertising expenditures for prescription
drugs by manufacturer for each month for 11 different media.455 The database does not
include several other advertising media outlets, for instance internet advertising and as a
result, the data may underestimate the advertising expenditures. In addition, CMR does
not collect the advertising expenditures in their entirety. The data for spot and cable
television networks, network radio, magazines, and newspapers are collected from 75, 12,
455 Description of Methodology. New York: Competitive Media Reporting; 1999.

405
200 and 360 outlets (spot markets), respectively.456 However, all the advertising
expenditure estimates provided by CMR are checked for their validity and consistency.
The second database used for the study was the National Ambulatory Medical
Care Survey or NAMCS. The data collection methodology for this survey is provided in
the methodology chapter (Chapter 4). The data are weighted to provide national
estimates. However, using these weights, there is a possibility of over-estimation or
under-estimation of the values. On the other hand, the data collection methodology for
the NAMCS has been well accepted and the data have been widely used in research. In
addition, the staff has conducted completeness checks for the data and the coding error
rates generally range between 0.0-0.2 percent for various survey items. The non-response
rates for the survey items have been limited to 5.0 percent or less with some exceptions
with imputations for some missing data (age, sex, race, time spent with physician, and
date of visit).457
The sum of the Average Wholesale Price (AWP) for a 30-day supply and the
average dispensing fee yielded an estimate of the total price of the prescription. The
product of the estimated price and the number of prescriptions written yielded the
prescription drug expenditures. The AWP is referred to as the inflated sticker price or list
price of drugs and may not be representative of the market price of drugs. However,
AWP has become an important benchmark for payers in the health care industry. They
456 Description of Methodology. New York: Competitive Media Reporting; 1999.457 Ambulatory Health Care Data: NAMCS Data Collection and Processing. National Center for Health
Statistics. June 12, 2002. Available at: http://www.cdc.gov/nchs/about/major/ahcd/impnam97.htm. Accessed August, 2003.

406
utilize the AWP minus a certain percentage to calculate reimbursement rates.458 As a
result of the inflated values of AWP, an over-estimation is likely in the prescription drug
expenditures. The average dispensing fee for each year that was used to estimate the price
for a 30-day supply may not be representative of the dispensing fee charged throughout
the country and may over-estimate or under-estimate the price of the prescription.
Therapeutic Drug Classes
The five drug classes namely allergy medications, antilipemics, gastrointestinals,
antidepressants, and antihypertensives were selected for the study. These drug classes
represent only a small proportion of the prescription drug market. In addition, the patterns
of prescriptions written, drug expenditures, physician visits and advertising expenditures
differed for each drug class. Hence, study results should be generalized only for the drug
classes selected.
Study Variables
In the analysis for the dependent variable physician visits, all the variables were
aggregated by month. For the dependent variables number of prescriptions written and
prescription drug expenditures, all the study variables were aggregated by month and by
drug. An exception was the visit variable, which was aggregated by month.
The variable number of physician visits was calculated based on symptoms or
reason for visit and/or diagnosis for conditions treated by the drugs selected for the study.
In NAMCS, three fields are available to record the reasons for visit or in other words up
458 Gencarelli DM. NHPF Issue Brief: Average wholesale price for prescription drugs: Is there a more appropriate pricing mechanism? The George Washington University: National Health Policy Forum. June 7, 2002. Available at: http://www.nhpf.org/pdfs_ib/IB775_AWP_6-7-02.pdf. Accessed November, 2004.

407
to three reasons for visits were recorded. The symptoms were identified using the
prescribing information for the drugs selected. However, the NAMCS codes may not
accurately capture all the symptoms associated with the conditions that the selected drugs
treat. In fact, some of the NAMCS symptom codes were broad enough for several disease
states. The “reason for visit” variable represents only individuals seeking care for the
limited symptom codes recorded by NAMCS. Since only three fields were used to record
the symptoms, all the symptoms that the patients met the physician for may not have been
captured. In addition to the initial complaint (symptom), these three fields also recorded
other reasons for visit such as existing diseases the patients wanted to evaluate, diagnostic
tests and treatment the patients requested, treatment for injuries, visit for test results, and
other administrative issues. Since, all these reasons are competing for the same three
fields for initial complaint, this may cause an underestimation of the number of visits. In
addition, the disease codes (for existing conditions) for some included a broad number of
conditions or were too general. As a result, the user may not be able to identify the
existing condition the patient specifically came in for leading to an underestimation of the
number of visits.
Using the prescribing information, the diseases that each of the drugs treat were
identified. However, the drugs may have other therapeutic uses (off label uses, especially
for antidepressants) other than those listed in the prescribing information and hence all
diseases may not have been included. The diagnoses codes (ICD-9) for the diseases were
recorded in three fields and this may not have been sufficient to record all the conditions
(diagnosis) the patients came in for.

408
The medications prescribed were recorded using codes developed by the National
Center for Health Statistics (NCHS). The coding scheme does not distinguish between
the different drug strengths available. In addition, NAMCS does not provide very specific
information on prescription drugs. For example, patients prescribed Claritin® 12 hour or
Claritin® 24 hour are coded to be prescribed Claritin®. Hence, even though CMR
provided data on expenditures for advertising for specific forms of the brand name drug,
they were all coded as the same drug. For example, DTCA expenditures for Claritin® 12
hour and Claritin® D 24 hour were aggregated as expenditures for Claritin®. As a result,
all strengths and forms of the brand name drug were assumed to be aggregated to
represent the number of prescriptions written for that drug irrespective of the strength.
The AWP was used to estimate the price for a prescription. Since the drug
strengths are unknown, the AWP for the most commonly prescribed strength of the
product were used to estimate price for a 30-day supply. The estimated price (sum of
AWP and dispensing fee) was used to calculate the expenditures for the drug not taking
into account the different prices of the different strengths available. In addition, the AWP
was not available for some the drugs for some of the years. Hence, the inflation rates for
prescription drugs and medical supplies were utilized to estimate the missing AWPs. This
may have over-estimated or under-estimated the AWP of the prescription.
Also, the prescription data represented the prescriptions written by the physician
and not necessarily the prescriptions dispensed in a pharmacy. Thus, the number of
prescriptions written will most likely be larger than those dispensed and hence we may be
overestimating the prescription drug expenditures.

409
The access or health insurance coverage variable identified individuals with and
without health insurance coverage. However, the individuals with health insurance
coverage may not necessarily have prescription drug coverage. Hence, the result for the
analyses regarding relationships with insurance coverage should be interpreted with
caution. In addition, the health insurance coverage variable did not account for the fact
that individuals with coverage may have different types of insurance coverage such as
government and private and did not include any copays or deductibles.
Age, gender, and access were the percentage of individuals calculated from the
total number of individuals with a visit or received a prescription for a drug in that
specific class. As expected, the variables number of physician visits, number of
prescriptions written and prescription drug expenditures included extremely large values.
Even a small change in the percentage value may be related to very large changes in the
dependent variable. Hence, the significant results for these three variables namely age,
gender (women) and health insurance coverage should be interpreted with caution. As a
measure to control for this, the dependent variables and DTCA expenditures were
transformed to a square root of their value or logarithmic values as appropriate.
Study Design
Time series and mixed model analyses were employed to determine the
relationships between the independent and dependent variables. For the time series
analyses, violation of the linearity assumption would not provide reliable or robust results
and thus, the linearity assumption was checked for each model using scatter plots. In
addition, all time series analyses were repeated with transformed values (logarithmic) for

410
the variables with extremely large values (DTCA expenditures, number of physician
visits) and compared with the analyses with untransformed variables. The following
analyses yielded different significant variables with transformed and untransformed
values for DTCA expenditures and visits: all analyses for lipid-related visits; and
analyses for the split datasets of allergy-related visits and depression-related visits
(further evaluation of age). All other time series analyses yielded the same variables as
significant with both transformed and untransformed values for DTCA expenditures and
visits.
One objective of the study was to evaluate the change in the relationships among
the variables following the relaxation of guidelines for broadcast advertising in August
1997. For some of the mixed model analyses, the relationships found to be significant in
the full model for the entire time period (January 1994 to April 2001) were not significant
when dataset was split (January 1994 to August 1997, September 1997 to April 2001).
One of the possible reasons could be the shorter interval of time that was analyzed.
The data used in the mixed model analyses were aggregated by month and drug
and the physician visit variable was aggregated by month. These different levels in data
for the physician visit variable and other variables may have caused some distortion in
the results. In order to check for any discrepancies, the model was reanalyzed without the
visit variable. Only the analyses for the dependent variable prescription drug expenditures
for gastrointestinals revealed new significant variables in the absence of the physician
visit variable.
Some of the other study design-related limitations were:

411
• A wider use of the drugs may reveal certain risk factors associated with the use of
drugs, which may influence the prescribing patterns of the drugs especially within
that drug class;
• Some drugs selected for the study were later withdrawn from the market (Hismanal®,
Seldane®, Propulsid®) due to the severe side effects associated with their use. The
withdrawal of a product will influence the prescriptions written for other drugs in that
therapeutic class;
• The promotion of the drug via physician detailing and the level and quality of
detailing can influence physician attitudes toward the drug and thereby influence
prescribing;
• Quality and amount of DTCA may influence the physician visits and the request for
prescription by patients;
• Exclusion of the products in the formulary of different insurance plans results in
restrictions and barriers to the prescribing and filling of the prescription; and
• Other factors or external influences which may impact the physician prescribing and
physician visits but not included in the study were:
- Historical events;
- Differences in the quality of the scientific evidence or support for the products;
- Risks associated with the use of the product;
- Health status of patients;
- Physician prescribing behaviors; and

412
- Level of other promotion (samples, detailing) for the product, and quality of the
advertisements.
SECTION II: DISCUSSION AND CONCLUSION
This section will discuss the results for each of the study objectives. Objective IV
which tested if relationships in Objectives I, II and III were significant for both time
periods (January 1994 to August 1997, September 1997 to April 2001) will be discussed
simultaneously with the appropriate objective.
Objective I
To determine the relationships between DTCA expenditures (allergy medications,
antilipemics, gastrointestinals, antidepressants and antihypertensives), access to care,
and demographics (age and gender) and physician visits (allergy-related visits, lipid-
related visits, gastrointestinal-related visits, depression-related visits, hypertension-
related visits).
Objective IV for Physician Visits: To compare relationships between DTCA expenditures,
access to care, demographics (age and gender) and physician visits in time periods: (a)
January 1994 to August 1997; and (b) September 1997 to April 2001.
Tables 6.1 and 6.2 provide the results for hypotheses tests for Objective I and
Objective IV (rejected/not rejected), respectively for all five drug classes for the
dependent variable frequency of physician visits.

413
Table 6.1: Results of the Hypotheses Tests for Objective I
Objective I: Hypotheses for the Dependent Variable Frequency of Physician Visits Rejected/Not Rejected
DTCA Expenditures
An increase in DTCA expenditures for allergy medications will be significantly related to an increase in the number of allergy-related visits.
Rejected
An increase in DTCA expenditures for antilipemic drugs will be significantly related to an increase in lipid-related visits (number of individuals diagnosed with hyperlipidemia).
Not Rejected
An increase in DTCA expenditures for gastrointestinal drugs will be significantly related to an increase in the number of gastrointestinal-related visits.
Rejected
An increase in DTCA expenditures for antidepressants will be significantly related to an increase in the number of depression-related visits.
Rejected
An increase in DTCA expenditures for antihypertensive drugs will be significantly related to an increase in hypertension-related visits.
Rejected
Health Insurance Coverage
Among individuals with allergy-related visits, an increase in the proportion of individuals with health insurance coverage or access to care will be significantly related to an increase in the allergy-related visits.
Rejected*
Among individuals diagnosed with hyperlipidemia (lipid-related visits), an increase in the proportion of individuals with health insurance coverage or access to care will be significantly related to an increase in the lipid-related visits (number of individuals diagnosed with hyperlipidemia).
Rejected
Among individuals with gastrointestinal-related visits, an increase in the proportion of individuals with health insurance coverage or access to care will be significantly related to an increase in the gastrointestinal-related visits.
Rejected
Among individuals with depression-related visits, an increase in the proportion of individuals with health insurance coverage or access to care will be significantly related to an increase in the depression-related visits.
Rejected
Among individuals with hypertension-related visits, an increase in the proportion of individuals with health insurance coverage or access to care will be significantly related to an increase in the hypertension-related visits.
Rejected
Age
An increase in the proportion of older individuals among those with allergy-related visits will be significantly related to an increase in the allergy-related visits.
Rejected
An increase in the proportion of older among those with lipid-related visits (diagnosed with hyperlipidemia) will be significantly related to an increase in the lipid-related visits.
Rejected
An increase in the proportion of older individuals among those with gastrointestinal-related visits will be significantly related to an increase in the gastrointestinal-related visits.
Rejected

414
Objective I: Hypotheses for Dependent Variable Frequency of Physician Visit Rejected/Not Rejected
An increase in the proportion of older individuals among those with depression-related visits will be significantly related to an increase in the depression-related visits.
Rejected
An increase in the proportion of older individuals with hypertension-related visits will be significantly related to an increase in the hypertension-related visits.
Rejected
Gender
An increase in the proportion of women among those with allergy-related visits will be significantly related to an increase in allergy-related physician visits.
Rejected
An increase in the proportion of women among those with lipid-related visits (diagnosed with hyperlipidemia) will be significantly related to an increase in lipid-related physician visits.
Rejected
An increase in the proportion of women among those with gastrointestinal-related visits will be significantly related to an increase in gastrointestinal-related physician visits.
Rejected
An increase in the proportion of women among those with depression-related visits will be significantly related to an increase in depression-related physician visits.
Rejected
An increase in the proportion of women among those with hypertension-related visits will be significantly related to an increase in hypertension-related physician visits.
Rejected
* - The relationship was significant, but in the opposite direction of the hypothesis (negative relationship)
Table 6.2: Results of Hypotheses Tests for Objective IV for Physician Visits
Objective IV: Hypotheses for Dependent Variable Frequency of Physician Visits Rejected/Not Rejected
The significant relationships between DTCA expenditures, access, age, gender and number of allergy-related visits in time period one (January 1994 to August 1997) are also significant in time period two (September 1997 to April 2001).
Not Rejected
The significant relationships between DTCA expenditures, access, age, gender and number of lipid-related visits in time period one (January 1994 to August 1997) are also significant in time period two (September 1997 to April 2001).
Rejected
The significant relationships between DTCA expenditures, access, age, gender and number of gastrointestinal-related visits in time period one (January 1994 to August 1997) are also significant in time period two (September 1997 to April 2001).
Not Rejected
The significant relationships between DTCA expenditures, access, age, gender and number of depression-related visits in time period one (January 1994 to August 1997) are also significant in time period two (September 1997 to April 2001).
Rejected
The significant relationships between DTCA expenditures, access, age, gender and number of hypertension-related visits in time period one (January 1994 to August 1997) are also significant in time period two (September 1997 to April 2001).
Not Rejected

415
Tables 6.3 and 6.4 provide a snapshot of the significant variables for Objective I
and Objective IV, respectively, following which, the results are discussed in more detail.
Among the variables analyzed for the five drug classes for the dependent variable
frequency of physician visits, the variables DTCA expenditures, health insurance
coverage, and age were found to be significant.
Table 6.3: Significant Variables for Objective I for Dependent Variable Frequency of Allergy-Related, Lipid-Related, Gastrointestinal -Related, Depression-Related and
Hypertension-Related Visits
Physician Visit (Dependent Variable) Objective I
Significant Variables Unstandardizedco-efficient
Allergy-Related Visit Health Insurance coverage -71,701 (negative relationship)Lipid-Related Visit DTCA expenditures
Time13.2761,817.5 (significantly more number of visits in time 2)
Gastrointestinal-Related Visit Time 635,522.5 (significantly more number of visits in time 2)
Depression-related Visit No significant variables ---Hypertension-related Visit Time 1,209,418.6 (significantly more
number of visits in time 2)
Table 6.4: Significant Variables for the Two Time Periods for Dependent Variable Frequency of Allergy-Related, Lipid-Related, Gastrointestinal-Related, Depression-
Related and Hypertension-Related Visits (Objective IV)
Significant Variables(Positive/Negative Relationship)
Physician Visit(Dependent Variable)Objective IV Time Period 1
January 1994 to August 1997Time period 2
September 1997 to April 2001Allergy-Related Visit Health Insurance coverage
(Negative relationship)Health Insurance coverage(Negative relationship)
Lipid-Related Visit DTCA expenditures(Positive relationship)
No significant variables
Gastrointestinal-Related Visit No significant variables No significant variablesDepression-related visit Age 25-44 years
(Positive relationship)Age 45-64 years(Positive relationship)
Health Insurance coverage(Negative relationship)
Hypertension-related visit No significant variables No significant variables

416
DTCA Expenditures
The relationship between DTCA expenditures and frequency of physician visits
was significant only for antilipemics. An increase in DTCA expenditures for antilipemics
was significantly related to an increase in the number of patients with diagnoses for
hyperlipidemia or hypercholesterolemia. For every $1,000 increase in DTCA
expenditures for antilipemics, 13 more patients were diagnosed with hyperlipidemia.
Two studies reported that advertising for cholesterol drugs was related to
physician visits for the conditions the drugs treat. Eichner and Maronick reported that
advertising expenditures for cholesterol-lowering drugs were related to physician visits
between 1996 and 1998.459 Zachry et al. reported that between January 1992 and July
1997, DTCA expenditures for antilipemics were significantly related to an increase in
individuals diagnosed with hyperlipidemia.460
However, Calfee et al. reported that although DTCA increased number of
prescriptions written for statin drugs, it did not have a direct impact on physician visits.461
Contrary to this, the current study found that the increase in number of individuals with
diagnoses for hyperlipidemia was significantly related to an increase in advertising
expenditures for antilipemics. Some of the reasons for this could be the increasing
awareness of the risks associated with high cholesterol levels, newer drugs released in the
459 Eichner R, Maronick TJ. A review of direct-to-consumer advertising and sales of prescription drugs: Does DTC advertising increase sales and market share? Journal of Pharmaceutical Marketing and Management. 2001;13(4):19-42.
460 Zachry III WM, Shepherd MD, Hinich MJ, et al. Relationship between direct-to-consumer advertising and physician diagnosing and prescribing. American Journal of Health-System Pharmacy. 2002;59(1):42-49.
461 Calfee JE, Winston C, Stempski R. Direct-to-consumer advertising and demand for cholesterol-reducing drugs. Journal of Law and Economics. October 2002;45(2{Part 2}):673-690.

417
market and advertising of these drugs. As a result of this increased awareness among
physician and patients, more patients may have been diagnosed with hyperlipidemia.
On further evaluation by splitting the datasets, the relationship between DTCA
expenditures and number of patients diagnosed with hyperlipidemia was significant only
in time period one (January 1994 - August 1997). Although antilipemics were being
advertised, the relationship with the diagnosis of hyperlipidemia was not strong enough
between September 1997 and April 2001 to warrant significance. The studies reported
earlier in this section with different results for the relationship between advertising and
diagnosis or physician visit for hyperlipidemia, evaluated the relationship for different
time periods. The studies reporting positive relationships were conducted using data from
1992 to 1998 whereas the study reporting that no relationship between advertising for
statin drugs and physician visits was based on data from 1995 to 2000.
Hence, similar to the studies reported, the relationship of advertising for
antilipemics with physician visits was stronger in time period one from January 1994
through August 1997 than compared to time period two from September 1997 through
April 2001. This lack of significance in the relationship between frequency of diagnoses
for hyperlipidemia and DTCA expenditures during the latter half of the time period may
also represent the saturation of awareness of hyperlipidemia and its long-term
consequences. However, DTCA expenditures were significantly related to frequency of
diagnoses of hyperlipidemia for the entire time period indicating that following the
relaxation of guidelines, DTCA expenditures were related to an increase in the number of

418
patients with diagnoses for hyperlipidemia, but this relationship was not strong enough in
the smaller dataset (time period two) to warrant significance.
Access to Care (Health Insurance Coverage)
For both allergy-related visits and depression-related visits (only in time period
two), health insurance coverage had a significant negative relationship with the frequency
of visits. Among individuals who saw a physician for allergy or depression-related
reasons (symptoms and/or diagnosis), percentage of individuals with health insurance
coverage was significantly (negative) related to the frequency of visits (allergy-related,
depression-related).
These results were contrary to the hypotheses. Among individuals who saw
physicians for allergy-related reasons (symptoms and/or diagnosis), an increase in the
percentage of individuals with health insurance coverage was significantly related to a
decrease in frequency of allergy-related visits. In other words, among individuals who
saw physicians for allergy-related reasons (symptoms and/or diagnosis), an increase in
the percentage of individuals without health insurance coverage was significantly related
to an increase in frequency of allergy-related visits. Among individuals who saw a
physician for allergy-related reasons, for every one percent increase in individuals
without health insurance coverage, number of allergy-related visits increased by 71,701.
The range of percent values for the variable health insurance coverage or individuals with
health insurance coverage included in the dataset for allergy-related visits was narrow
from 71.8-100.0% (Mean: 90.4 + 5.5%). The Pearson correlation coefficient for the
relationship between health insurance coverage and allergy-related visits was –0.194

419
(p=0.071). On splitting the datasets, health insurance coverage was again negatively
related to frequency of allergy-related visits in both time periods (p<0.05). The Pearson
correlation coefficients for the relationship between allergy-related visits (untransformed)
and health insurance coverage from January 1994 to August 1997 and September 1997 to
April 2001 were –0.316 and –0.346, respectively and both values were significant
(p<0.05). The Pearson correlation coefficients for the relationship between allergy-related
visits (transformed) and health insurance coverage from January 1994 to August 1997
and September 1997 to April 2001 were –0.329 and –0.319, respectively and both values
were significant (p<0.05).
Among individuals with depression-related visits between September 1997 and
April 2001, an increase in the percentage of individuals with health insurance coverage
was significantly related to a decrease in the frequency of depression-related visits. The
result may be valid only for the range of values for percentage of individuals with
depression-related visits and health insurance coverage included in the dataset (64.1-
96.6%, Mean: 82.7+7.2%). The Pearson correlation coefficient was –0.203 and was not
significant (p=0.186). Additionally, this relationship was significant only when age was
represented as a percentage of individuals 25-44 years, 45-64 years, and 65 years and
older. This variable for health insurance coverage was not significant when age was
represented as percentage of individuals 45 years and older.
According to studies conducted previously, health insurance coverage was a
predictor of physician visits. All studies reported that individuals with coverage were

420
more likely to visit a physician.462, 463, 464 However, Hafner-Eaton also reported that the
“acutely ill” uninsured individuals were more likely to visit the physician than their
insured counterparts.465
For both allergy-related visits and depression-related visits, majority of
individuals had health insurance coverage. One of the possible reasons that the
relationship identified in this study was negative for allergy-related visits could be the
increasing prevalence of allergy symptoms over the years and the nature of the
symptoms. As a result, the patients, though they do not have coverage, may feel
compelled to see the physician. Unlike other conditions such as hypertension and
hyperlipidemia, which do not have aggravating symptoms like those for allergies,
patients may have seen a physician irrespective of health insurance coverage. Some of the
other possible reasons such as use of OTC products for treatment and increase in
deductibles and co-payments may have contributed to the decrease in allergy-related
visits for individuals with health insurance coverage.
The DTCA expenditures for antidepressants increased considerably in 1997, 2000
and 2001. The depression-related visits did not reveal a consistent pattern until 2000 and
2001, when it increased each year. In fact, there was a very weak trend in depression-
related visits until 2000. This inconsistent pattern in DTCA expenditures for
462 Hafner-Eaton C. Physician utilization disparities between the uninsured and insured: Comparisons of the chronically ill, acutely ill, and well non-elderly populations. Journal of the American Medical Association. February 10, 1993;269(6):787-792.
463 Wan TH, Soifer SJ. Determinants of physician utilization: A causal analysis. Journal of Health and Social Behavior. June 1974;15(2):100-108.
464 Burstin HR, Swartz K, O'Neil AC, et al. The effect of change of insurance on access to care. Inquiry. Winter 1998/99;35:389-397.
465 Hafner-Eaton C. Physician utilization disparities between the uninsured and insured: Comparisons of the chronically ill, acutely ill, and well non-elderly populations. Journal of the American Medical Association. February 10, 1993;269(6):787-792.

421
antidepressants and depression-related visits may have contributed to the negative
relationship between depression-related visits and health insurance coverage.
Although the relationship between allergy-related visits and individuals with
health insurance coverage was significant in the time series analyses (January 1994 to
April 2001), the Pearson correlation coefficient was weak but significant. Similarly, in
time period two (September 1997 to April 2001), the relationship between depression-
related visits and percentage of individuals with health insurance coverage was
significant, but the negative Pearson correlation coefficient was weak and not significant.
However, on splitting the dataset for allergy-related visits, the correlation coefficients for
relationship between health insurance coverage and visits were significant in both time
periods. The reason for the significant relationships in the time series analyses could be
the high frequency of visits. Even a small change in percentage of individuals with health
insurance coverage may be related to significant changes in monthly physician visits.
Even though the relationship between health insurance coverage and allergy /depression-
related visits is statistically significant, the relationship may not necessarily be
meaningful.
Demographics: Age
Age had a significant positive relationship with depression-related physician
visits, but only during the first half of the time period selected. An increase in the
percentage of individuals 25-44 years and 45-64 years among those with depression-
related visits was significantly related to an increase in the frequency of depression-
related visits (symptoms and/or diagnosis for depression) from January 1994 to August

422
1997. The Pearson correlation coefficients for both age groups 25-44 years and 45-64
years were 0.242 (p=0.114) and 0.098 (p=0.525), respectively and both correlation
coefficients were not significant. Since age was operationalized as a percentage, the
relationships between age groups 25-44 years, 45-64 years and depression-related visits
may be valid only for percent ranges for the age groups included in the dataset (Age: 25-
44 years – 20.7-47.8%, Mean: 36.8+5.99%, Age: 45-64 years – 21.5-42.0%, Mean:
32.3+5.2%). The results should be interpreted with caution because of the narrow ranges
and weak correlations.
A study by Stordal et al. evaluating the relationship between depression-related
symptoms and age between 1995 and 1997 revealed a linear pattern up to the age of 50
years. The pattern was less distinct for older individuals.466 Similar to the results for the
study by Stordal et al., in the current study, age (25-44 years and 45-64 years) was
positively related to the number of depression-related visits (symptoms and/or diagnosis
of diseases treated with antidepressants). However, this relationship was significant only
from January 1994 to August 1997 and not during the second half from September 1997
to April 2001.
In addition, there was no consistent pattern in the frequency of depression-related
visits until 2000 and 2001, when it began increasing each year. This weak trend in
depression-related visits may have contributed to the change in relationships between age
and depression-related visits in September 1997 to April 2001.
466 Stordal E, Mykletun A, Dahl AA. The association between age and depression in the general population: A multivariate examination. Acta Psychiatrica Scandinavica. February 2003;107(2):132-141.

423
The results for age should be interpreted with caution because of the large
numbers for visits, which are used in the calculation of the percentages for the age
variable. Small changes in the percentages may be related to large changes in the
frequency of visits.
Time
There was a significant increase in lipid-related visits (diagnosis for
hyperlipidemia), gastrointestinal-related visits (symptoms and/or diagnosis) and
hypertension-related visits (symptoms and/or diagnosis) in time period two (September
1997 to April 2001) compared to time period one (January 1994 to August 1997). One of
the reasons for this could be DTCA. With the increasing DTCA for prescription drugs as
well as disease-specific advertising following relaxation of guidelines in August 1997, it
is a possibility that advertising is increasing the awareness of high cholesterol,
hypertension and ulcers and their long-term consequences. In addition, with most
individuals having some sort of health insurance coverage, the financial issues may no
longer be as much of a barrier to the use of health care services as it was in the past.
Some additional factors, which may have influenced the increase in visits between
September 1997 and April 2001 are new drugs being released in the market and the
increasing awareness regarding risks for cardiovascular diseases associated with high
cholesterol and hypertension.
Objective II
To determine the relationships between DTCA expenditures (allergy medications,
antilipemics, gastrointestinals, antidepressants and antihypertensives) access to care,

424
demographics (age and gender), physician visits (allergy-related visits, lipid-related
visits, gastrointestinal-related visits, depression-related visits, hypertension-related
visits) and the number of prescriptions written for advertised drugs (allergy medications,
antilipemics, gastrointestinals, antidepressants, and antihypertensives).
Objective IV for Number of Prescriptions Written: To compare relationships between
DTCA expenditures, access to care, demographics (age and gender), physician visits and
number of prescriptions written in time periods: (a) January 1994 to August 1997; and
(b) September 1997 to April 2001.
Tables 6.5 and 6.6 provide the results for the hypotheses tested for Objective II
and Objective IV (rejected/not rejected), respectively for all five drug classes for the
dependent variable number of prescriptions written.
Table 6.5: Results of the Hypotheses Tests for Objective II
Objective II: Hypotheses for the Dependent Variable Number of Prescriptions Written
Rejected/Not Rejected
DTCA Expenditures
An increase in DTCA expenditures for allergy medications will be significantly related to an increase in the number of prescriptions written for advertised allergy medications.
Not Rejected
An increase in DTCA expenditures for antilipemic drugs will be significantly related to an increase in the number of prescriptions written for advertised antilipemic drugs.
Not Rejected
An increase in DTCA expenditures for gastrointestinal drugs will be significantly related to an increase in the number of prescriptions written for advertised gastrointestinal drugs.
Not Rejected
An increase in DTCA expenditures for antidepressants will be significantly related to an increase in prescriptions written for advertised antidepressants.
Rejected
An increase in DTCA expenditures for antihypertensive drugs will be significantly related to an increase in prescriptions written for advertised antihypertensive drugs.
Rejected*
Health Insurance Coverage
Among individuals who received a prescription for advertised allergy medication, an increase in the proportion of individuals with health insurance coverage or access to care will be significantly related to an increase in prescriptions written for the advertised allergy medications.
Rejected

425
Objective II: Hypotheses for the Dependent Variable Number of Prescriptions Written
Rejected/Not Rejected
Among individuals who received a prescription for advertised antilipemics, an increase in the proportion of individuals with health insurance coverage or access to care will be significantly related to an increase in prescriptions written for the advertised antilipemics.
Rejected
Among individuals who received a prescription for advertised gastrointestinals, an increase in the proportion of individuals with health insurance coverage or access to care will be significantly related to an increase in prescriptions written for the advertised gastrointestinals.
Rejected
Among individuals who received a prescription for advertised antidepressants, an increase in the proportion of individuals with health insurance coverage or access to care will be significantly related to an increase in prescriptions written for the advertised antidepressants.
Not Rejected
Among individuals who received a prescription for advertised antihypertensives, an increase in the proportion of individuals with health insurance coverage or access to care will be significantly related to an increase in prescriptions written for the advertised antihypertensives.
Rejected*
Age
An increase in the proportion of older individuals among those who received prescription for advertised allergy medications will be significantly related to an increase in prescriptions written for advertised allergy medications.
Rejected
An increase in the proportion of older individuals among those who received prescription for advertised antilipemics will be significantly related to an increase in prescriptions written for advertised antilipemics.
Rejected
An increase in the proportion of older individuals among those who received prescription for advertised gastrointestinals will be significantly related to an increase in prescriptions written for advertised gastrointestinals.
Rejected*
An increase in the proportion of older individuals among those who received prescription for advertised antidepressants will be significantly related to an increase in prescriptions written for advertised antidepressants.
Not Rejected
An increase in the proportion of older individuals among those who received prescription for advertised antihypertensives will be significantly related to an increase in prescriptions written for advertised antihypertensives.
Rejected
Gender
An increase in the proportion of women among those who received a prescription for advertised allergy medications will be significantly related to an increase in prescriptions written for the advertised allergy medications.
Not Rejected
An increase in the proportion of women among those who received a prescription for advertised antilipemics will be significantly related to an increase in prescriptions written for the advertised antilipemics.
Rejected
An increase in the proportion of women among those who received a prescription for advertised gastrointestinals will be significantly related to an increase in prescriptions written for the advertised gastrointestinals.
Not Rejected
An increase in the proportion of women among those who received a prescription for advertised antidepressants will be significantly related to an increase in prescriptions
Rejected

426
Objective II: Hypotheses for the Dependent Variable Number of Prescriptions Written
Rejected/Not Rejected
written for the advertised antidepressants.
An increase in the proportion of women among those who received a prescription for advertised antihypertensives will be significantly related to an increase in prescriptions written for the advertised antihypertensives.
Rejected
Physician Visits
An increase in the number of allergy-related physician visits will be significantly related to an increase in the prescriptions written for advertised allergy medications.
Not Rejected
An increase in the number of lipid-related physician visits (patients diagnosed with hyperlipidemia) will be significantly related to an increase in the prescriptions written for advertised antilipemic drugs.
Not Rejected
An increase in the number of gastrointestinal-related physician visits will be significantly related to an increase in the prescriptions written for advertised gastrointestinal drugs.
Not Rejected
An increase in the number of depression-related physician visits will be significantly related to an increase in the prescriptions written for advertised antidepressants.
Not Rejected
An increase in the number of hypertension-related physician visits will be significantly related to an increase in the prescriptions written for advertised antihypertensives.
Not Rejected
* - The relationships were significant, but in the opposite direction of the hypotheses (negative relationship)
Table 6.6: Results of the Hypotheses Tests for Objective IV for Number of Prescriptions Written
Objective IV: Hypotheses for Dependent Variable Number of Prescriptions Written
Rejected/Not Rejected
The significant relationships between DTCA expenditures, access, age, gender, number of allergy-related visits and number of prescriptions written for advertised allergy medications in time period one (January 1994 to August 1997) are also significant in time period two (September 1997 to April 2001).
Rejected
The significant relationships between DTCA expenditures, access, age, gender, number of lipid-related visits and number of prescriptions written for advertised antilipemic drugs in time period one (January 1994 to August 1997) are also significant in time period two (September 1997 to April 2001).
Not Rejected
The significant relationships between DTCA expenditures, access, gender, number of gastrointestinal-related visits and number of prescriptions written for advertised gastrointestinal drugs in time period one (January 1994 to August 1997) are also significant in time period two (September 1997 to April 2001).
Rejected
The significant relationships between DTCA expenditures, access, age, gender, number of depression-related visits and number of prescriptions written for advertised antidepressants in time period one (January 1994 to August 1997) are also significant in time period two (September 1997 to April 2001).
Rejected
The significant relationships between DTCA expenditures, access, age, gender, number of hypertension-related visits and number of prescriptions written for advertised
Rejected
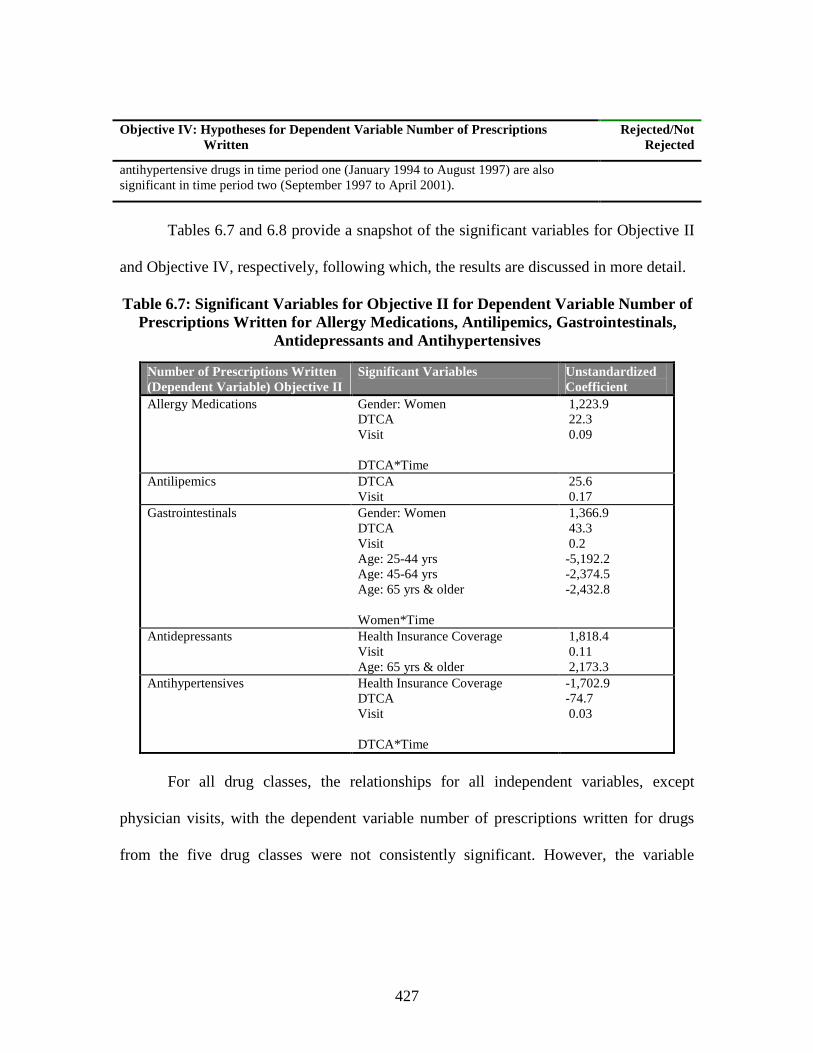
427
Objective IV: Hypotheses for Dependent Variable Number of Prescriptions Written
Rejected/Not Rejected
antihypertensive drugs in time period one (January 1994 to August 1997) are also significant in time period two (September 1997 to April 2001).
Tables 6.7 and 6.8 provide a snapshot of the significant variables for Objective II
and Objective IV, respectively, following which, the results are discussed in more detail.
Table 6.7: Significant Variables for Objective II for Dependent Variable Number of Prescriptions Written for Allergy Medications, Antilipemics, Gastrointestinals,
Antidepressants and Antihypertensives
Number of Prescriptions Written(Dependent Variable) Objective II
Significant Variables Unstandardized Coefficient
Allergy Medications Gender: WomenDTCAVisit
DTCA*Time
1,223.9 22.3 0.09
Antilipemics DTCAVisit
25.6 0.17
Gastrointestinals Gender: WomenDTCAVisitAge: 25-44 yrsAge: 45-64 yrsAge: 65 yrs & older
Women*Time
1,366.9 43.3 0.2-5,192.2-2,374.5-2,432.8
Antidepressants Health Insurance CoverageVisitAge: 65 yrs & older
1,818.4 0.11 2,173.3
Antihypertensives Health Insurance CoverageDTCAVisit
DTCA*Time
-1,702.9-74.7 0.03
For all drug classes, the relationships for all independent variables, except
physician visits, with the dependent variable number of prescriptions written for drugs
from the five drug classes were not consistently significant. However, the variable

428
number of physician visits was significantly related to the number of prescriptions written
for all drug classes.
Table 6.8: Significant Variables for the Two Time Periods for Dependent Variable Number of Prescriptions Written for Allergy Medications, Antilipemics, Gastrointestinals, Antidepressants and Antihypertensives (Objective IV)
Significant Variables (Positive/Negative Relationship)Prescriptions Written(Dependent Variable)Objective IV
Time Period 1January 1994 to August 1997
Time period 2September 1997 to April 2001
Allergy Medication Visit(Positive relationship)
Visit(Positive relationship)DTCA(Positive relationship)
Antilipemics DTCA(Positive relationship)Visit(Positive relationship)
DTCA(Positive relationship)Visit(Positive relationship)
Gastrointestinals DTCA(Positive relationship)Visit(Positive relationship)
DTCA(Positive relationship)Visit(Positive relationship)Age: 25-44 yrs(Negative relationship)Age: 45-64 yrs(Negative relationship)
Antidepressants Visit(Positive relationship)
Visit(Positive relationship)Health Insurance Coverage(Positive relationship)Age: 65 yrs & older(Positive relationship)
Antihypertensives DTCA(Positive relationship)Visit(Positive relationship)
DTCA(Negative relationship)Visit(Positive relationship)Health Insurance Coverage(Negative relationship)
DTCA Expenditures
DTCA expenditures were significantly related to the number of prescriptions
written for all drug classes except antidepressants. For allergy medications, antilipemics
and gastrointestinals, an increase in DTCA expenditures was significantly related to an
increase in prescriptions written for advertised drugs from the respective drug classes.

429
For every $1,000 increase in DTCA expenditures for allergy medications, 22 more
prescriptions were written for advertised allergy medications. For every $1,000 increase
in DTCA expenditures for antilipemics, 26 more prescriptions were written for advertised
antilipemics. For every $1,000 increase in DTCA expenditures for gastrointestinals, 43
more prescriptions were written for advertised gastrointestinals. However, an increase in
DTCA expenditures for antihypertensives was significantly related to a decrease in
prescriptions written for advertised antihypertensives or in other words decrease in
DTCA expenditures for antihypertensives were related to an increase in prescriptions
written for advertised antihypertensives. For every $1,000 decrease in DTCA
expenditures for antihypertensives, 75 more prescriptions were written for advertised
antihypertensives.
For allergy medications and antihypertensives, the relationships between DTCA
expenditures and number of prescriptions written for drugs in that class were significantly
different in time period one (January 1994 to August 1997) from time period two
(September 1997 to April 2001). The increase in number of prescriptions written for
allergy medications related to an increase in DTCA expenditures for allergy medications
was significantly higher in time period two (September 1997 through April 2001)
compared to the increase in time period one (January 1994 through August 1997). The
DTCA expenditures for antihypertensives were positively related to the number of
prescriptions written for antihypertensives in time period one, but negatively related in
time period two.

430
Based on data from 1995 to 2000 from CMR and NAMCS, Iizuka and Gin
reported that DTCA expenditures had a significant positive effect on visits when
prescriptions were written for drugs in that class, but only after 1997.467 However, some
studies have reported that DTCA expenditures do influence prescriptions written, but
only for some drugs. Zachry et al. reported that DTCA expenditures were related to the
growth in prescriptions written for antilipemics and not for other categories including
antihistamines, benign prostatic hypertrophy aids, and acid/peptic disorder aids. On
evaluating the relationship specifically for the drugs, DTCA expenditures were related to
the prescriptions written for Claritin® and Zocor®.468
In a study by Fairman, advertising was found to influence utilization for
antidepressants, anti-rheumatic and antiulcerants. Antihyperlipidemics or antilipemics
had below average new use rates even though they were advertised extensively and two
drug classes namely antihistamines and antiulcerants had high drop out rates.469 Eichner
and Maronick reported that DTCA expenditures did influence prescriptions written for
cholesterol-lowering drugs and antihistamines, but did not play a role in increasing sales
for antidepressants. They also reported an erratic effect of DTCA expenditures on market
share for antidepressants.470 Rosenthal et al. reported that, DTCA was found to influence
467 Iizuka T, Jin GZ. The effects of direct-to-consumer advertising in the prescription drug markets. 2003. Available at: http://www.e.u-tokyo.ac.jp/cirje/research/workshops/micro/micropaper03/iizuka.pdf. Accessed June, 2004.
468 Zachry III WM, Shepherd MD, Hinich MJ, et al. Relationship between direct-to-consumer advertising and physician diagnosing and prescribing. American Journal of Health-System Pharmacy. 2002;59(1):42-49.
469 Fairman KA. The effect of new and continuing prescription drug use on cost: A longitudinal analysis of chronic and seasonal utilization. Clinical Therapeutics. 2000;22(5):641-652.
470 Eichner R, Maronick TJ. A review of direct-to-consumer advertising and sales of prescription drugs: Does DTC advertising increase sales and market share? Journal of Pharmaceutical Marketing and Management. 2001;13(4):19-42.

431
prescriptions written for antidepressants, antihyperlipidemics, proton pump inhibitors,
nasal sprays and antihistamines.471,472 Wosinska reported that for cholesterol-lowering
drugs, DTCA increased market share, but had to be used in conjunction with detailing.473
However, Calfee et al. in a study for cholesterol-lowering drugs, reported that DTCA did
not impact the demand or market share for cholesterol-lowering drugs.474
Based on the literature, there are contradictory results regarding the relationships
between DTCA expenditures and prescriptions written for antihyperlipidemics and
antidepressants. The heavily advertised antiulcerants and antihistamines displayed a
significant relationship between the DTCA expenditures with prescriptions written for
them, but were reported to have high drop out rates by one study.
In the current study, the extensive advertising for allergy medications,
antilipemics, and gastrointestinals may have contributed to the increasing awareness of
the conditions and the prescription drugs available for treatment and thereby influencing
the number of prescriptions written for them. The DTCA expenditures for antilipemics
were related to the number of patients with diagnosis for hyperlipidemia (Objective I).
An increase in the number of patients diagnosed with hyperlipidemia would lead to an
increase in number of patients requiring treatment and thereby increasing the number of
prescriptions written, especially for statins.
471 Rosenthal MB, Berndt ER, Donohue JM, et al. Promotion of prescription drugs to consumers. New England Journal of Medicine. 2002;346(7):498-505.
472 Rosenthal MB, Donohue J, Epstein A, et al. Demand effects of recent changes in prescription drug promotion. Available at: www.kff.org. Accessed October, 2002.
473 Wosinska ME. The economics of prescription drug advertising [Ph.D Diss]. Berkley, University of California; 2002.
474 Calfee JE, Winston C, Stempski R. Direct-to-consumer advertising and demand for cholesterol-reducing drugs. Journal of Law and Economics. October 2002;45(2{Part 2}):673-690.

432
DTCA expenditures did not have a significant relationship with prescriptions
written for advertised antidepressants. One of the reasons could be that DTCA
expenditures may have influenced prescriptions written only for some drugs and not all
advertised drugs. As a result, the relationship was not significant. In addition, DTCA
expenditures for antidepressants did not rise to the level as other drugs classes including
allergy medications, antilipemics, and gastrointestinals. DTCA expenditures for
antidepressants rose to comparable levels of advertising expenditures for other drug
classes only in 2000 and 2001.
DTCA expenditures for antihypertensives had a negative relationship with
prescriptions written for advertised antihypertensives. Among all five drug classes
selected, antihypertensives had the lowest DTCA expenditures followed by
antidepressants. The advertising expenditures for antihypertensives were reduced
dramatically in 1997. From 1998 to 2001, DTCA expenditures for antihypertensives
increased slightly only in 1999. However, prescriptions written for antihypertensives did
not follow the trend for DTCA expenditures. This decrease in DTCA expenditures may
have accounted for the negative relationship between DTCA expenditures and
prescriptions written for advertised antihypertensives.
It is possible that while DTCA expenditures do influence the number of
prescriptions written, the relationship is dependent on the time of advertising. On splitting
the dataset, DTCA expenditures for allergy medications were significantly (positive)
related to prescriptions written for allergy medications only in time period two
(September 1997-April 2001). DTCA expenditures for antilipemics and gastrointestinals

433
were positively and significantly related to prescriptions written in both time periods
(January 1994-August 1997, September 1997-April 2001). The relationships between
DTCA expenditures and prescriptions written for allergy medications and
antihypertensives were significantly different in time period one from time period two
(interaction variable). The increase in DTCA expenditures related to an increase in
prescriptions written for allergy medications was higher in time period two compared to
time period one. DTCA expenditures for allergy medications were much higher following
the relaxation of guidelines compared to prior the relaxation. This surge in DTCA
expenditures and the resulting increase in awareness may have contributed to the
difference in the relationship between the two time periods.
From January 1994 to August 1997, DTCA expenditures had a significant
positive relationship with prescriptions written for antihypertensives, whereas from
September 1997 to April 2001, DTCA expenditures had a significant negative
relationship with prescriptions written for antihypertensives. The decrease in DTCA
expenditures was not accompanied by a decrease in number of prescriptions written for
antihypertensives. The drastic decrease in DTCA expenditures from time period one to
time period two would account for this change in its relationship with the number of
prescriptions written from time period one to time period two.
Access to Care (Health Insurance Coverage)
Among individuals who received a prescription for antidepressants or
antihypertensives, access or percentage of individuals with health insurance coverage was
significantly related to the number of prescriptions written for advertised drugs from the

434
respective drug class (antidepressants, antihypertensives). Access had a positive
relationship with the number of prescriptions written for advertised antidepressants;
however, a negative relationship was found with the number of prescriptions written for
advertised antihypertensives. The range of values for percentage of individuals with
health insurance among those who received prescriptions for antidepressants (Mean:
85.5+16.9%) and antihypertensives (Mean: 94.4+13.6%) was 0 to 100 percent each.
Among individuals who received prescriptions for advertised antidepressants, for every
one percentage increase in individuals with health insurance coverage, 1,818 more
prescriptions were written for advertised antidepressants. Among individuals who
received prescriptions for advertised antihypertensives, for every one percentage increase
in individuals with health insurance coverage, 1,703 fewer prescriptions were written for
advertised antihypertensives.
Studies have reported that insurance coverage increased the likelihood of
receiving a prescription.475,476 Individuals with insurance coverage received more
prescriptions than individuals without health insurance coverage.477,478,479,480,481 Sclar et
al., evaluating the 1995 NAMCS data, reported that individuals with health insurance
475 Mott DA, Kreling DH. The association of insurance type with costs of dispensed drugs. Inquiry. Spring 1998;35:23-35.
476 Stuart B, Grana J. Ability to pay and the decision to medicate. Medical Care. 1998;36(2):202-211.477 Gianfrancesco FD, Baines AP, Richards D. Utilization effects of prescription drug benefits in an aging
population. Health Care Financing Review. Spring 1994;15(3):113-126.478 Lassila HC, Stoehr GP, Ganguli M, et al. Use of prescription medications in an elderly rural
population: The MoVIES project. The Annals of Pharmacotherapy. 1996;30:589-595.479 Report to the President: Prescription drug coverage, spending, utilization, and prices. Department of
Health and Human Services. April 2000. Available at: http://aspe.hhs.gov/health/reports/drugstudy/index.htm. Accessed August, 2001.
480 Poisal J, Chulis GS. Medicare beneficiaries and drug coverage. Health Affairs. March/April 2000;19(2):248-256.
481 Poisal JA, Murray L. Growing differences between Medicare beneficiaries with and without drug coverage. Health Affairs. March/April 2001;20(2):74-85.

435
coverage were more likely to be prescribed or continued on a regimen for
antidepressants.482 In a study by Goldman et al., antidepressants showed significant
responsiveness to changes in co-payment, indicating that antidepressants are one of the
several drug classes influenced by insurance coverage and co-payment and hence
sensitive to price. Antihypertensive, antihistamines, antiulcerants and antihyperlipidemics
were among the other drug classes sensitive to price changes.483 In the current study, only
results for antidepressants were similar to the findings in the literature.
The number of prescriptions written for antihypertensives had a negative
relationship with health insurance coverage. An increase in individuals without health
insurance coverage among those who received prescriptions for the advertised
antihypertensives was associated with an increase in prescriptions written for the
advertised antihypertensives. The nature of the illness (hypertension) may have
influenced this relationship. It can be reasoned that physicians and patients are aware of
the seriousness of hypertension, its long-term consequences, and its relationship with
other chronic conditions and hence are more cautious about it. As a result, irrespective of
health insurance coverage they are being prescribed antihypertensives. However, even
though these patients did receive prescriptions they may not necessarily get these
prescriptions filled. Another explanation is that physicians may be prescribing other
antihypertensive medications not included in the study (prescriptions written for products
482 Sclar DA, Robinson LM, Skaer TL, et al. What factors influence the prescribing of antidepressant pharmacotherapy? An assessment of national office-based encounters. International Journal of Psychiatry in Medicine. 1998;28(4):407-419.
483 Goldman DP, Joyce GF, Escarce JJ, et al. Pharmacy benefits and use of drugs by the chronically ill. Journal of the American Medical Association. 2004;291(19):2344-2350.

436
that were not advertised directly to consumers) for patients with health insurance
coverage resulting in a decrease in prescriptions written for drugs selected.
Upon splitting dataset by time period, the relationships between health insurance
coverage and prescriptions written for antidepressants and antihypertensives were
significant only in time period two. Health insurance coverage had a significant positive
relationship with prescriptions written for advertised antidepressants and a negative
relationship with prescriptions written for advertised antihypertensives only in time
period two (September 1997 through April 2001).
The frequency of hypertension-related visits increased significantly during time
period September 1997 through April 2001 thereby increasing the probability of
receiving treatment. However, it is a possibility that while patients with health insurance
coverage were receiving prescriptions for advertised antidepressants, they were receiving
fewer prescriptions for advertised antihypertensives compared to individuals without
health insurance coverage.
A significant increase in DTCA expenditures between September 1997 and April
2001 (especially in 2000 and 2001), followed by increased awareness of depression-
related symptoms and antidepressants, may have resulted in more individuals receiving
prescriptions for antidepressants. In addition, due to the increasing price for
antidepressants over the years and since according to literature, number of prescriptions
written for antidepressants is sensitive to price, the percentage of the individuals who
received prescription for antidepressants and had health insurance coverage was
positively related to prescriptions written specifically in time period two. Advertising for

437
antihypertensives reduced drastically from 1997 to 2001 and this may have influenced the
decrease in the number of prescriptions written for advertised antihypertensives
especially for individuals with health insurance coverage specifically in time period two.
This may have resulted in the negative relationship between prescriptions written and
health insurance coverage.
The results for health insurance coverage should be interpreted with caution
because of the large numbers for prescriptions written, which are used in the calculation
of the percentages for the health insurance coverage variable. Small changes in the
percentages (individuals with health insurance coverage) may be related to large changes
in the number of prescriptions written.
Demographics: Age
As seen in tables 6.5 and 6.7, age (45 years and older) did not have any significant
relationship with prescriptions written for any of the five drug classes. The relationship
for age with number of prescriptions written was further explored for gastrointestinals
and antidepressants by categorizing age into: less than 25 years, 25-44 years, 45-64 years
and 65 years and older. Age was found to be related to the number of prescriptions
written for both drug classes.
Among individuals who received a prescription for advertised gastrointestinals,
age had a negative relationship with the number of prescriptions written for
gastrointestinals. An increase in percentage of individuals who received a prescription for
gastrointestinals and were 25-44 years, 45-64 years and 65 years and older were
significantly related to a decrease in the number of prescriptions written for advertised

438
gastrointestinals. The range of values for percentage of individuals in these different age
groups including 25-44 years (Mean: 19.9+19.4%), 45-64 years (Mean: 36.4+ 23.2%),
and 65 years and older (Mean: 39.7 + 22.6%) was 0 to 100 percent each. The decrease in
the number of prescriptions written for gastrointestinals associated for individuals 45-64
years and 65 years and older was almost half the decrease in the number of prescriptions
written associated with individuals 25-44 years who received prescriptions for
gastrointestinals. Among individuals who received prescriptions for advertised
gastrointestinals, for every one percentage increase in individuals 25-44 years, 45-64
years and 65 years and older, 5,192, 2,375, and 2,433 fewer prescriptions were written for
individuals 25-44 years, 45-64 years and 65 years and older, respectively.
One of the reasons for this negative relationship could be the changes or events
that occurred during the time period selected for the study and the nature of the dataset.
This drug class saw a lot of changes from January 1994 to April 2001. Zantac® 75 mg
was switched from prescription to OTC (Rx-OTC) status in December 1995, which led to
a decrease in the number of prescriptions written for it (Appendix D). Propulsid® was
withdrawn from the market in 1999. Helidac®, released in 1996, was not a widely
prescribed drug and Lotronex®, released in the market in February 2000, was withdrawn
in November 2000. Prilosec® and Prevacid® showed a steady increase in prescriptions
written until 1999 for Prilosec® and 2000 for Prevacid®. In 2000, prescriptions written
for Prilosec® decreased and in 2001, prescriptions written for Prilosec and Prevacid®
decreased.

439
The upheavals in the market may be one of the reasons for the negative
relationship between age and prescriptions written for gastrointestinals. Splitting the
dataset by time period, the two age groups, individuals 25-44 years and 45-64 years were
significant only in time period two thereby further strengthening the theory of upheavals.
All of the above events (Propulsid®, Lotronex®), except for Rx-OTC switch for
Zantac®, occurred between September 1997 and April 2001.
Among studies evaluating utilization of prescription drugs, most concluded that
older individuals receive more prescriptions than younger adults.484,485 In the current
study among individuals who received prescriptions for antidepressants, older individuals
(65 years and older) had a positive relationship with the number of prescriptions written
for antidepressants. Among individuals who received prescriptions for advertised
antidepressants, for every one percentage increase in individuals 65 years and older,
2,173 more prescriptions were written for advertised antidepressants. The range of values
for percentage of individuals who received a prescription for antidepressants and were 65
years and older was from 0 to 100 percent (Mean: 16.5+17.6%).
According to a study by Stordal et al., reporting of depression-related symptoms
increased linearly with age. This increase in prevalence was limited to 20-50 years for
men and 20-70 years for women when adjusted for several factors. However, overall,
484 Kotzan L, Carroll NV, Kotzan JA. Influence of age, sex, and race on prescription drug use among Georgia Medicaid recipients. American Journal of Hospital Pharmacy. February 1989;46:287-290.
485 Thomas CP, Ritter G, Wallack SS. Growth in prescription drug spending among insured adults. Health Affairs. September/October 2001;20(5):265-277.

440
prevalence of depression increased with age.486 In a recent report on trends in health care
utilization by NAMCS, the rate of drug mentions for antidepressants increased from 99
per 1,000 visits in 1993-94 to 173 per 1,000 in 1999-2000, a 75 percent increase.
Compared to all other age groups, individuals 65 years and older had the highest number
of drug mentions for antidepressants during an office visit from 1993 to 2000 increasing
each year, but increased sharply from 1995-1996 to 1997-1998.487 However, Sclar et al.,
on evaluating the NAMCS data for 1995 for patients diagnosed with depression, reported
that younger individuals (<50 years) were more likely to be prescribed antidepressants.488
The current study displayed a positive relationship between older individuals (65
years and older) and prescriptions written for antidepressants thereby reporting different
results compared to the results of the study by Sclar et al. This was probably due to the
difference in the operationalization of depression-related visits. Sclar et al. did not
include all the diagnoses and symptoms included in the current study. However, the
current study supported the results discussed previously for NAMCS.
On splitting the dataset for antidepressants, the relationship between proportion of
older individuals (65 years and older) and number of prescriptions written for
antidepressants was significant only between September 1997 and April 2001.
Advertising expenditures for antidepressants increased dramatically in 2000 and 2001. As
486 Stordal E, Mykletun A, Dahl AA. The association between age and depression in the general population: A multivariate examination. Acta Psychiatrica Scandinavica. February 2003;107(2):132-141.
487 Health care in America: Trends in utilization. US Department for Health and Human Services, Centers for Disease Control and Prevention, National Center for Health Care Statistics. January 2004. Available at: http://www.cdc.gov/nchs/data/misc/healthcare.pdf. Accessed February, 2004.
488 Sclar DA, Robinson LM, Skaer TL, et al. What factors influence the prescribing of antidepressant pharmacotherapy? An assessment of national office-based encounters. International Journal of Psychiatry in Medicine. 1998;28(4):407-419.

441
a result of advertising, patients may have been more aware of the antidepressants
available and the symptoms the antidepressants are used to treat, especially during the
latter half of the time period selected for the study (September 1997 to April 2001).
Advertising, coupled with the fact that the prevalence of depression increased with age,
may be reason for the relationship between variables percentage of individuals who
received prescription for antidepressants and were 65 years older and prescriptions
written for antidepressants, especially in time period two.
The results for age should be interpreted with caution because of the large
numbers for prescriptions written, which are used in the calculation of the percentages for
the age variable. Small changes in the percentages (age) may be related to large changes
in the number of prescriptions written.
Demographics: Gender
Among individuals who received a prescription for allergy medications and
gastrointestinals, an increase in percentage of women was significantly related to an
increase in prescriptions written for advertised drugs from the respective drug class
(allergy medications/gastrointestinals). Among individuals who received a prescription
for allergy medications, for every one percentage increase in women among those who
received prescriptions for advertised allergy medications, 1,224 more prescriptions were
written for advertised allergy medications. Among individuals who received a
prescription for gastrointestinals, for every one percentage increase in women among
those who received prescriptions for advertised gastrointestinals, 1,367 more
prescriptions were written for advertised gastrointestinals. The range of values for

442
percentage of women among those who received a prescription for allergy medications
(Mean: 61.6+21.4%) and gastrointestinals (Mean: 60.9+22.3%) was 0 to 100 percent
each.
Several studies have reported that women usually receive more prescriptions than
men.489,490,491 Some studies have reported that after adjusting for women-specific
conditions and drugs prescribed for it, there is no difference in prescription drug
utilization between men and women.492,493,494 However, Momin et al. reported that except
for lipotropics and antidepressants, men received more prescriptions than women
(calcium channel blockers, angiotensin converting enzyme inhibitors, H2-blockers, and
beta blockers).495
In this study, although gender was not related to the physician visits, it is possible
that women have a positive relationship with prescriptions written for advertised
gastrointestinals and allergy medications due to the symptomology for allergic rhinitis
and gastrointestinal-related problems. The symptoms associated with allergic rhinitis and
gastrointestinal-related problems are much more aggravating than other conditions
489 Kreling DH, Mott DA, Wiederholt JB, et al. Prescription drug trends: A chart book. Sonderegger Institute and The Henry Kaiser Family Foundation. July 2000. Available at: http://www.kff.org/content/2000/3019/PharmFinal.pdf. Accessed June 2001.
490 Stewart RB, Moore MT, May FE, et al. A longitudinal evaluation of drug use in an ambulatory elderly population. Journal of Clinical Epidemiology. 1991;44(12):1353-1359.
491 Kauffman DW, Kelly JP, Rosenberg L, et al. Recent patterns of medication use in the ambulatory adult population of the United States: The Slone survey. Journal of the American Medical Association. January 16, 2002;287(3):337-344.
492 Svarstad BL, Cleary PD, Mechanic D, et al. Gender differences in the acquisition of prescribed drugs an epidemiological study. Medical Care. 1987;25:1089-1098.
493 Zodoroznyj M, Svarstad BL. Gender, employment and medication use. Social Science and Medicine. 1990;31(9):971-978.
494 Metge C, Black C, Peterson S, et al. The population use of pharmaceuticals. Medical Care. 1999;37(Supplement 6):JS42-JS59.
495 Momin SR, Larrat EP, Lipson DP, et al. Demographics and cost of pharmaceuticals in a private third-party prescription program. Journal of Managed Care Pharmacy. 2000;6(5):395-409.

443
included in the study, inducing physician visits at the onset of symptoms, which resulted
in prescriptions written for the advertised medications for treatment.
The interaction between the variable percentage of women and time period for
gastrointestinals indicated that the relationship between percentage of individuals with a
prescription for gastrointestinals who were women and number of prescriptions written
for gastrointestinals was significantly different in January 1994 to August 1997 compared
to the relationship in September 1997 to April 2001. Women had a positive relationship
with prescriptions written for gastrointestinals only from September 1997 through April
2001 and had a negative relationship during the time period one from January 1994
through August 1997. This may be due to the increased advertising during the latter half,
which resulted in the increased awareness regarding the symptoms and drugs for
treatment of gastrointestinal-related problems. The significantly greater number of
gastrointestinal visits in time period two coupled with women usually receiving more
prescriptions than men might be the reasons for the positive relationship between women
who received prescriptions for gastrointestinals and the number of prescriptions written
for advertised gastrointestinals.
However, on splitting the datasets by time, the variable percentage of women was
no longer significant for both allergy medications and gastrointestinals. The relationship
may not have been strong enough to warrant significance in the smaller datasets.
The literature has consistently reported that more women report symptoms of
depression than men.496,497,498,499 However, in this study, gender was not related to the
496 Kessler RC. Epidemiology of women and depression. Journal of Affective Disorders. 2003;74:5-13.

444
visit (symptoms and/or diagnosis) or the prescriptions written for the antidepressants. The
reason for this could be the nature of the dataset. The symptoms and diagnosis utilized to
capture conditions and symptoms treated with antidepressants may not have accurately
captured all the depression-related visits.
The results for gender should be interpreted with caution because of the large
numbers for prescriptions written, which are used in the calculation of the percentages for
the gender variable. Small changes in the percentages (women) may be related to large
changes in the prescriptions written.
Physician Visits
The physician visits included the visits when patients reported symptoms and/or
were diagnosed with conditions the advertised drugs selected for the study treat. The
frequency of these physician visits was significantly related to the number of
prescriptions written for all drug classes and in both time periods. Studies have reported
that physician visits have a direct effect on utilization of prescription drugs or increases
the likelihood of receiving prescriptions.500,501,502,503 The physician visits are essential for
497 Blazer DG, Kessler RC, McGonagle KA, et al. The prevalence and distribution of major depression in a national community sample: The National Comorbidity Survey. American Journal of Psychiatry. 1994;151:979-986.
498 Angst J, Merikangas K. The depressive spectrum: Diagnostic classification and course. Journal of Affective Disorders. 1997;45:31-39.
499 Kessler RC, Zhao S, Blazer DG, et al. Prevalence, correlates and course of minor depression and major depression in the NCS. Journal of Affective Disorders. 1997;45:19-30.
500 Fillenbaum GG, Horner RD, Hanlon JT, et al. Factors predicting change in prescription and nonprescription drug use in a community-residing black and white elderly population. Journal of Clinical Epidemiology. 1996;49(5):587-593.
501 Aiken MM, Smith MC, Juergens JP, et al. Individualized determinants of prescription drug use among noninstitutionalized elderly. Journal of Pharmacoepidemiology. 1994;3(1):3-25.
502 Jörgenson T, Johnasson S, Kennerfalk A, et al. Prescription drug use, diagnoses, and healthcare utilization among the elderly. The Annals of Pharmacotherapy. September 2001;35:1004-1009.
503 Bush PJ, Osterweis M. Pathways to medicine use. Journal of Health and Social Behavior. June 1978;19(2):179-189.

445
new prescriptions or rather are a requirement for new prescriptions to be written. This
could explain the significant positive relationship between physician visits and
prescriptions written for all drug classes. Physician visits were positively related to
prescriptions written in the overall model for the entire time period (January 1994 to
April 2001) as well as in the split datasets (January 1997-August 1997, September 1997-
April 2001).
In examination of results for Objective IV, for all drug classes expect for
antilipemics, the significant variables in time period one were not significant in time
period two. For antilipemics, DTCA expenditures and physician visits or patients
diagnosed with hyperlipidemia were significantly related to prescriptions written for
advertised antilipemics both prior to and following the relaxation of advertising
guidelines. For gastrointestinals when the age variable represented percentage of
individuals 45 years and older among those who received prescriptions for
gastrointestinals, significant relationships in time period one were significant in time
period two. However, when age was represented by several age groups (less than 25
years, 25-44 years, 45-64 years, and 65 years and older), different relationships were
significant in the two time periods.
Other factors in addition to the factors discussed earlier which have contributed to
the change in the relationships from time period one to time period two are market
dynamics, evolving clinical practice, changing treatment guidelines for conditions or
diseases included or related diseases, and new drugs released in the market (included/not
included in study).

446
Objective III
To determine the relationship between DTCA expenditures (allergy medications,
antilipemics, gastrointestinals, antidepressants and antihypertensives) access to care,
demographics (age and gender), physician visits (allergy-related visits, lipid-related
visits, gastrointestinal-related visits, depression-related visits, hypertension-related
visits) and the expenditures for the advertised drugs (allergy medications, antilipemics,
gastrointestinals, antidepressants, and antihypertensives).
Objective IV for Prescription Drug Expenditures: To compare relationships between
DTCA expenditures, access to care, demographics (age and gender), physician visits and
prescription drug expenditures in time periods: (a) January 1994 to August 1997; and (b)
September 1997 to April 2001.
Tables 6.9 and 6.10 report the results of the hypotheses tests for Objective III and
IV, respectively for each of the five drug classes for the dependent variable prescription
drug expenditures.
Table 6.9: Results of the Hypotheses Tests for Objective III
Objective III: Hypotheses for the Dependent Variable Prescription Drug Expenditures
Rejected/Not Rejected
DTCA Expenditures
An increase in DTCA expenditures for allergy medications will be significantly related to an increase in allergy drug expenditures.
Not Rejected
An increase in DTCA expenditures for antilipemic drugs will be significantly related to an increase in antilipemic drug expenditures.
Not Rejected
An increase in DTCA expenditures for gastrointestinal drugs will be significantly related to an increase in gastrointestinal drug expenditures.
Not Rejected
An increase in DTCA expenditures for antidepressants will be significantly related to an increase in antidepressant drug expenditures.
Rejected
An increase in DTCA expenditures for antihypertensive drugs will be significantly related to an increase in antihypertensive drug expenditures.
Rejected*

447
Objective III: Hypotheses for the Dependent Variable Prescription Drug Expenditures
Rejected/Not Rejected
Health Insurance Coverage
Among individuals who received a prescription for advertised allergy medications, an increase in the proportion of individuals with health insurance coverage or access to care will be significantly related to an increase in expenditures for advertised allergy medications.
Rejected
Among individuals who received a prescription for advertised antilipemics, an increase in the proportion of individuals with health insurance coverage or access to care will be significantly related to an increase in expenditures for advertised antilipemics.
Rejected
Among individuals who received a prescription for advertised gastrointestinals, an increase in the proportion of individuals with health insurance coverage or access to care will be significantly related to an in increase expenditures for advertised gastrointestinals.
Rejected
Among individuals who received a prescription for advertised antidepressants, an increase in the proportion of individuals with health insurance coverage or access to care will be significantly related to an in increase expenditures for advertised antidepressants.
Rejected
Among individuals who received a prescription for advertised antihypertensives, an increase in the proportion of individuals with had health insurance coverage or access to care will be significantly related to an in increase expenditures for advertised antihypertensives.
Rejected*
Age
An increase in the proportion of older individuals among those who received a prescription for advertised allergy medications will be significantly related to an increase in expenditures for advertised allergy medications.
Rejected
An increase in the proportion of older individuals among those who received a prescription for advertised antilipemics will be significantly related to an increase in expenditures for advertised antilipemics.
Rejected
An increase in the proportion of older individuals among those who received a prescription for advertised gastrointestinals will be significantly related to an increase in expenditures for advertised gastrointestinals.
Rejected*
An increase in the proportion of older individuals among those who received a prescription for advertised antidepressants will be significantly related to an increase in expenditures for advertised antidepressants.
Not Rejected
An increase in the proportion of older individuals among those who received a prescription for advertised antihypertensives will be significantly related to an increase in expenditures for advertised antihypertensives.
Rejected
Gender
An increase in the proportion of women among those who received prescription for advertised allergy medications will be significantly related to an increase in expenditures for advertised allergy medications.
Not Rejected
An increase in the proportion of women among those who received prescription for advertised antilipemics will be significantly related to an increase in expenditures for advertised antilipemics.
Rejected

448
Objective III: Hypotheses for the Dependent Variable Prescription Drug Expenditures
Rejected/Not Rejected
An increase in the proportion of women among those who received prescription for advertised gastrointestinals will be significantly related to an increase in expenditures for advertised gastrointestinals.
Not Rejected
An increase in the proportion of women among those who received prescription for advertised antidepressants will be significantly related to an increase in expenditures for advertised antidepressants.
Rejected
An increase in the proportion of women among those who received prescription for advertised antihypertensives will be significantly related to an increase in expenditures for advertised antihypertensives.
Rejected
Physician Visits
There is no significant relationship between the number of allergy-related physician visits and prescription drug expenditures for advertised allergy medications.
Rejected
There is no significant relationship between the number of lipid-related physician visits (number of patients with diagnoses for hyperlipidemia) and prescription drug expenditures for advertised antilipemics.
Rejected
There is no significant relationship between the number of gastrointestinal-relatedphysician visits and prescription drug expenditures for advertised gastrointestinals.
Rejected
There is no significant relationship between the number of depression-related physician visits and prescription drug expenditures for advertised antidepressants.
Rejected
There is no significant relationship between the number of hypertension-related physician visits and prescription drug expenditures for advertised antihypertensives.
Rejected
* - The relationships were significant, but in the opposite direction of the hypotheses (negative relationship)
Table 6.10: Results of the Hypotheses Tests for Objective IV for Prescription Drug Expenditures
Objective IV: Hypotheses for the Dependent Variable Prescription Drug Expenditures
Rejected/Not Rejected
Prescription Drug Expenditures
The significant relationships between DTCA expenditures, access, age, gender, number of allergy-related visits and expenditures for advertised allergy medications in time period one (January 1994 to August 1997) are also significant in time period two (September 1997 to April 2001).
Rejected
The significant relationships between DTCA expenditures, access, age, gender, number of lipid-related visits and expenditures for advertised antilipemic drugs in time period one (January 1994 to August 1997) are also significant in time period two (September 1997 to April 2001).
Not Rejected
The significant relationships between DTCA expenditures, access, age, gender, number of gastrointestinal-related visits and expenditures for advertised gastrointestinal drugs in time period one (January 1994 to August 1997) are also significant in time period two (September 1997 to April 2001).
Rejected

449
Objective IV: Hypotheses for the Dependent Variable Prescription Drug Expenditures
Rejected/Not Rejected
The significant relationships between DTCA expenditures, access, age, gender, number of depression-related visits and expenditures for advertised antidepressants in time period one (January 1994 to August 1997) are also significant in time period two (September 1997 to April 2001).
Rejected
The significant relationships between DTCA expenditures, access, age, gender, number of hypertension-related visits and expenditures for advertised antihypertensive drugs in time period one (January 1994 to August 1997) are also significant in time period two (September 1997 to April 2001).
Rejected
Table 6.11 reports the significant independent variables (positive and negative
relationships) for dependent variable prescription drug expenditures for each of the five
drug classes.
Table 6.11: Significant Variables for Objective III for Dependent Variable Prescription Drug Expenditures for Allergy Medications, Antilipemics,
Gastrointestinals, Antidepressants, and Antihypertensives
Prescription Drug Expenditures(Dependent Variable)Objective III
Significant Variables Unstandardized coefficient
Allergy Medication Gender: WomenDTCAVisit
78,787 1,450.2 5.5
Antilipemics DTCAVisit
2,634.5 14.3
Gastrointestinals Gender: WomenDTCAVisitAge: 25-44 yrsAge: 45-64 yrsAge: 65 yrs & older
Women*TimeDTCA*Time
98,565 5,643.6 19.3-524,342-355,479-397,539
Antidepressants VisitAge: 65 yrs & olderTime
Health Insurance Coverage*TimeAge: 65 yrs & older*Time
7.95 130,426 9,131,398 (significantly higher in time 1)
Antihypertensives Health Insurance CoverageDTCAVisitDTCA*Time
-67,642-4844.61.4

450
Table 6.12 reports the significant variables for the two time periods when the
dataset was split, followed by a discussion of the reported results. All variables, except
physician visits, were not consistently significant for all drug classes. Physician visits
were significantly related to drug expenditures for all drug classes.
Table 6.12: Significant Variables for the Two Time Periods for Dependent Variable Prescription Drug Expenditures for Allergy Medication, Antilipemics,
Gastrointestinals, Antidepressants and Antihypertensives (Objective IV)
Significant Variables (Positive/Negative Relationship)Prescription Drug Expenditures(Dependent Variable)Objective IV
Time Period 1January 1994 to August 1997
Time Period 2September 1997 to April 2001
Allergy Medication DTCA(Positive relationship)Visit (Positive relationship)
Gender: Women(Positive relationship)DTCA(Positive relationship)Visit(Positive relationship)
Antilipemics DTCA(Positive relationship)Visit(Positive relationship)
DTCA(Positive relationship)Visit(Positive relationship)
Gastrointestinals Visit(Positive relationship)DTCA(Positive relationship)
Visit(Positive relationship)(DTCA(Positive relationship)Age: 25-44 years(Negative Relationship)
Antidepressants Visit(Positive relationship)
Visit(Positive relationship)Gender: Women(Positive relationship)Age: 65 yrs & older(Positive relationship)
Antihypertensives Visit(Positive relationship)
Visit(Positive relationship)DTCA(Negative relationship)Health insurance coverage(Negative relationship)

451
DTCA Expenditures
Similar to the relationship between DTCA expenditures and prescriptions written,
DTCA expenditures were significantly related to drug expenditures for all drug
categories except antidepressants. An increase in DTCA expenditures for allergy
medications, antilipemics, and gastrointestinals were significantly related to an increase
in prescription drug expenditures for the respective drug class. For every $1,000 increase
in DTCA expenditures for allergy medications, drug expenditures for advertised allergy
medications increased by $1,450. For every $1,000 increase in DTCA expenditures for
antilipemics, drug expenditures for antilipemics increased by $2,635. For every $1,000
increase in DTCA expenditures for gastrointestinals, drug expenditures for
gastrointestinals increased by $5,644. An increase in DTCA expenditures for
antihypertensives was significantly related to a decrease in drug expenditures for
advertised antihypertensives. In other words, for every $1,000 decrease in DTCA
expenditures for antihypertensives, drug expenditures for antihypertensives increased by
$4,845.
According to a study by Rosenthal et al., DTCA expenditures did influence the
sales for the five drug classes, namely antidepressants, antihyperlipidemics, proton pump
inhibitors, nasal sprays and antihistamines, but were not the primary drivers of growth in
drug expenditures from 1999 to 2000.504 One of the reasons for this could be the short
period of time evaluated. The study evaluated the growth from 1999 to 2000 whereas the
504 Rosenthal MB, Donohue J, Epstein A, et al. Demand effects of recent changes in prescription drug promotion. Available at: www.kff.org. Accessed October, 2002.

452
current study evaluated the relationship between drug expenditures and DTCA
expenditures from January 1994 to April 2001.
As mentioned previously (Objective II), studies have reported that DTCA
expenditures influence prescriptions written, but only for some drug classes and some
drugs.505,506,507 Contradictory results were reported for the relationship between
advertising expenditures and market share or demand for cholesterol-lowering
drugs.508,509 There are contradictory reports in the literature regarding relationships
between DTCA expenditures and prescriptions written for antidepressants.510,511
Antiulcerants and antihistamines have been reported to have high drop out rates by one
study, but number of prescriptions written for them was significantly related to DTCA
expenditures.512,513 Other studies have reported a positive relationship between DTCA
505 Zachry III WM, Shepherd MD, Hinich MJ, et al. Relationship between direct-to-consumer advertising and physician diagnosing and prescribing. American Journal of Health-System Pharmacy. 2002;59(1):42-49.
506 Fairman KA. The effect of new and continuing prescription drug use on cost: A longitudinal analysis of chronic and seasonal utilization. Clinical Therapeutics. 2000;22(5):641-652.
507 Eichner R, Maronick TJ. A review of direct-to-consumer advertising and sales of prescription drugs: Does DTC advertising increase sales and market share? Journal of Pharmaceutical Marketing and Management. 2001;13(4):19-42.
508 Wosinska ME. The economics of prescription drug advertising [Ph.D Diss]. Berkley, University of California; 2002.
509 Calfee JE, Winston C, Stempski R. Direct-to-consumer advertising and demand for cholesterol-reducing drugs. Journal of Law and Economics. October 2002;45(2{Part 2}):673-690.
510 Fairman KA. The effect of new and continuing prescription drug use on cost: A longitudinal analysis of chronic and seasonal utilization. Clinical Therapeutics. 2000;22(5):641-652.
511 Eichner R, Maronick TJ. A review of direct-to-consumer advertising and sales of prescription drugs: Does DTC advertising increase sales and market share? Journal of Pharmaceutical Marketing and Management. 2001;13(4):19-42.
512 Fairman KA. The effect of new and continuing prescription drug use on cost: A longitudinal analysis of chronic and seasonal utilization. Clinical Therapeutics. 2000;22(5):641-652.
513 Eichner R, Maronick TJ. A review of direct-to-consumer advertising and sales of prescription drugs: Does DTC advertising increase sales and market share? Journal of Pharmaceutical Marketing and Management. 2001;13(4):19-42.

453
expenditures and prescriptions written for antihistamines.514,515 Since the variable number
of prescriptions written was a part of the calculation for prescription drug expenditures,
the relationships for prescriptions written will hold for drug expenditures as well.
An increase in DTCA expenditures was significantly related to an increase in drug
expenditures for allergy medications, antilipemics, and gastrointestinals. On splitting the
datasets, DTCA expenditures were related to drug expenditures for allergy medications,
antilipemics, and gastrointestinals both prior to and following the relaxation of guidelines
for broadcast advertising. The extensive advertising for allergy medications, antilipemics,
and gastrointestinals may have contributed to the increasing awareness of the conditions
as well as the treatments available. For antilipemics, DTCA expenditures were positively
related to the number of patients diagnosed with hyperlipidemia (Objective I). DTCA
expenditures for allergy medications, antilipemics, and gastrointestinals were
significantly related to the number of prescriptions written for advertised drugs from the
respective class. These reasons may have contributed to the relationships between DTCA
expenditures and drug expenditures for allergy medications, antilipemics, and
gastrointestinals.
In the absence of the physician visit variable, the relationship between DTCA
expenditures and drug expenditures for gastrointestinals was significantly different prior
to and following the relaxation of guidelines for broadcast advertising. The increase in
DTCA expenditures related to an increase in drug expenditures for gastrointestinals was
514 Eichner R, Maronick TJ. A review of direct-to-consumer advertising and sales of prescription drugs: Does DTC advertising increase sales and market share? Journal of Pharmaceutical Marketing and Management. 2001;13(4):19-42.
515 Rosenthal MB, Donohue J, Epstein A, et al. Demand effects of recent changes in prescription drug promotion. Available at: www.kff.org. Accessed October, 2002.

454
significantly lower in time period one (prior to relaxation of guidelines) compared to time
period two (following relaxation of guidelines).
The non-significant relationship between DTCA expenditures and the
prescriptions written for antidepressants could be one of the reasons for the non-
significant relationship between drug expenditures for antidepressants and their DTCA
expenditures. It is a possibility that DTCA expenditures may have influenced
prescriptions written for only some antidepressants or the relationship was weak, thereby
resulting in a non-significant relationship with drug expenditures for antidepressants.
DTCA expenditures for antihypertensives had a negative relationship with drug
expenditures for advertised antihypertensives. The advertising expenditures for
antihypertensives were reduced dramatically in 1997. From 1998 to 2001, DTCA
expenditures for antihypertensives increased slightly only in 1999. However,
prescriptions written for antihypertensives and consequently the drug expenditures did
not follow the trend for DTCA expenditures. The decrease in advertising expenditures
along with the negative relationship between DTCA expenditures and prescriptions
written for antihypertensives (Objective II) may account for the negative relationship
between DTCA expenditures and drug expenditures for advertised antihypertensives.
The relationship between DTCA expenditures and drug expenditures for
antihypertensives were significantly different in time period one from time period two.
From January 1994 to August 1997, DTCA expenditures had a positive relationship (not
significant) with drug expenditures for antihypertensives, whereas from September 1997
to April 2001, DTCA expenditures had a significant negative relationship with drug

455
expenditures for antihypertensives. The drastic decrease in DTCA expenditures for
antihypertensives plays a key role in this change in relationship. On splitting the dataset,
an increase in DTCA expenditures for antihypertensives was significantly related to a
decrease in antihypertensive drug expenditures, but only in time period two. In time
period one, although DTCA expenditures were related to number of prescriptions written
for antihypertensives, the relationship between DTCA expenditures for antihypertensives
and drug expenditures for antihypertensives may not have been strong enough to warrant
significance.
Access to Care (Health Insurance Coverage)
Among individuals who received a prescription for antihypertensives, an increase
in percentage of individuals with health insurance coverage was significantly related to a
decrease in drug expenditures for antihypertensives. Among individuals who received
prescription for advertised antihypertensives, for every one percentage increase in
individuals without health insurance, drug expenditures for antihypertensives increased
by $67,642. Prescription drug expenditures were calculated as a product of the estimated
price and the number of prescriptions written. Hence, factors related to number of
prescriptions written are more likely to be related to the drug expenditures. The range of
values for percentage of individuals with health insurance coverage among those who
received a prescription for antihypertensives in the dataset was 0 to 100 percent (Mean:
94.3+13.6%).
456
Studies have reported that individuals with insurance coverage incurred higher
costs than individuals without coverage.516,517,518,519,520 Contrary to the literature, an
increase in individuals who received prescriptions for antihypertensives and had health
insurance coverage was significantly related to a decrease in drug expenditures for
antihypertensives. As discussed in Objective II, percentage of individuals with health
insurance coverage were negatively related to prescriptions written for antihypertensives
and thereby leading to a negative relationship between expenditures for antihypertensives
and health insurance coverage.
Owing to the seriousness of the condition and its long-term consequences patients
may have been prescribed advertised antihypertensives irrespective of health insurance
coverage. Another explanation is that physicians may be prescribing other
antihypertensive medications not included in the study (drugs that were not advertised
directly to consumers) or prescribing the more expensive medications for individuals
without health insurance coverage. However, it should be noted that although patients are
prescribed these medications patients may not necessarily fill these prescriptions. It is
516 Curtis LH, Law AW, Anstrom KJ, et al. The insurance effect on prescription drug expenditures among the elderly: Findings from the 1997 Medical Expenditure Panel Survey. Medical Care. 2004;42(5):439-446.
517 Davis M, Poisal J, Chulis G, et al. Prescription drug coverage, utilization, and spending among Medicare beneficiaries. Health Affairs. January-February 1999;18(1):231-243.
518 Report to the President: Prescription drug coverage, spending, utilization, and prices. Department of Health and Human Services. April 2000. Available at: http://aspe.hhs.gov/health/reports/drugstudy/index.htm. Accessed August, 2001.
519 Andrade SE, Gurwitz JH. Drug benefit plans under managed care: To what extent do older subscribers selecting less drug coverage put themselves at increased risk? Journal of the American Geriatric Society. 2002;50:178-181.
520 Mott DA, Kreling DH. The association of insurance type with costs of dispensed drugs. Inquiry. Spring 1998;35:23-35.

457
also possible that individuals receiving prescriptions for advertised antihypertensives are
the sicker patients and hence their expenditures have exceeded the benefits.
On splitting the datasets, among individuals who received a prescription for
advertised antihypertensives, the percentage of individuals with health insurance
coverage had a significant negative relationship with drug expenditures for advertised
antihypertensives only from September 1997 to April 2001. As mentioned previously,
advertising for antihypertensives reduced drastically from 1997 to 2001 and this may
have influenced the prescriptions written for antihypertensives, specifically in time period
two. Also, other prescription drugs not included in the study may have been prescribed
more often in time period two for individuals with health insurance coverage accounting
for negative relationship between access and drug expenditures in time period two. Since
health insurance coverage had a negative relationship with prescriptions written for
antihypertensives, this may have contributed to the negative relationship between drug
expenditures for antihypertensives and health insurance coverage in time period two. The
range of values for the variable percentage of individuals with health insurance coverage
among those who received a prescription for antihypertensives in the dataset for time
period two was 0 to 100 percent (Mean: 96.5 + 10.1%).
Among those who received prescriptions for antidepressants, the relationship
between percentage of individuals with health insurance coverage and drug expenditures
for antidepressants was significantly different in time period one from time period two.
The percentage of individuals who received a prescription for antidepressants and had
health insurance coverage was negative in time period one and positive in time period

458
two. This change in relationship may be due to the changing environment of advertising
and increasing number of individuals with coverage, especially in time period two from
September 1997 to April 2001. However, on splitting the dataset for antidepressants, the
relationship with health insurance coverage was no longer significant. It is possible that
due to the smaller size of the datasets or shorter length of time, the relationship was not
strong enough to warrant significance.
Since the number of prescriptions written were used in the calculation of drug
expenditures and the percentages for the health insurance coverage variable, the results
for health insurance coverage should be interpreted with caution because of the large
values for number of prescriptions written. Small changes in the percentages (health
insurance coverage) may be related to large changes in the drug expenditures.
Demographics: Age
The variable age or percentage of individuals 45 years and older among those
who received a prescription was not significantly related to drug expenditures for any of
the drug classes. However, on further categorizing age for gastrointestinals and
antidepressants, as less than 25 years, 25-44 years, 45-64 years and 65 years and older,
age did have a significant relationship with drug expenditures.
According to literature, the chances of being diagnosed with a chronic condition
are increased with age resulting in increased number of prescriptions written, and drug
expenditures.521,522 In addition to the overall relationship with age, studies have also
521 Mueller C, Schur C, O'Connell J. Prescription drug spending: The impact of age and chronic disease status. American Journal of Public Health. October 1997;87(10):1626-1629.

459
reported increased expenditures by age for specific drug categories from 1997 to 2000
including cholesterol-lowering medications, anti-arthritic medications and
antidepressants.523,524 However, Momin et al. reported that except for beta-blockers and
antidepressants, the elderly had the highest average drug costs for certain drug classes
(cholesterol-lowering drugs, calcium channel blockers, H2-blockers).525 Contrary to this
result, Stordal et al. reported a linear relationship between age and depression
symptoms.526 With an increase in diagnoses of depression with age, the need for
antidepressants increases and along with it the drug expenditures for antidepressants also
increase.
Among individuals who received a prescription for antidepressants, an increase in
percentage of individuals 65 years and older was associated with an increase in drug
expenditures for antidepressants. The increase in the percentage of individuals 65 years
and older among those who received a prescription for antidepressants was significantly
related to an increase in prescriptions written for advertised antidepressants. Hence, we
can conclude that this was the main reason for the significant positive relationship
between percentage of individuals 65 years and older among those who received a
522 Report to the President: Prescription drug coverage, spending, utilization, and prices. Department of Health and Human Services. April 2000. Available at: http://aspe.hhs.gov/health/reports/drugstudy/index.htm. Accessed August, 2001.
523 Thomas CP, Ritter G, Wallack SS. Growth in prescription drug spending among insured adults. Health Affairs. September/October 2001;20(5):265-277.
524 Wallack SS, Thomas C, Hodgkin D, et al. Recent trends in prescription drug spending for individuals under 65 and age 65 and older. Schneider Institute for Health Policy. Available at: http://www.rxhealthvalue.com/docs/research_07302001.pdf. Accessed October, 2002.
525 Momin SR, Larrat EP, Lipson DP, et al. Demographics and cost of pharmaceuticals in a private third-party prescription program. Journal of Managed Care Pharmacy. 2000;6(5):395-409.
526 Stordal E, Mykletun A, Dahl AA. The association between age and depression in the general population: A multivariate examination. Acta Psychiatrica Scandinavica. February 2003;107(2):132-141.

460
prescription for advertised antidepressants and drug expenditures for advertised
antidepressants. The range of values for percentage of individuals 65 years and older
among those who received prescription for antidepressants was 0 to 100 percent (Mean:
16.5+17.6%). Among individuals who received prescriptions for advertised
antidepressants, for every one percentage increase in individuals 65 years and older, drug
expenditures for antidepressants increased by $130,426.
The interaction between percentage of individuals who received prescription for
antidepressants and were 65 years and older and time period indicates that the
relationship with expenditures was significantly different in time period one from time
period two. In time period one, the percentage of individuals who received a prescription
for advertised antidepressants and were 65 years and older was negatively related to drug
expenditures and positively related in time period two. However, the relationship was
significant only in time period two from September 1997 to April 2001. In time period
two, prescriptions written for antidepressants were significantly related to percentage of
individuals 65 years and older contributing to the significant relationship between drug
expenditures for antidepressants and individuals 65 years and older.
NAMCS reported a significant increase in physician visits when antidepressants
were mentioned during an office visit, from 1993 to 2000, especially from 1995-96 to
1997-98.527 In addition, the increase in advertising following relaxation of guidelines in
August 1997 (especially in 2000 and 2001) may have contributed to an increased
527 Health care in America: Trends in utilization. US Department for Health and Human Services, Centers for Disease Control and Prevention, National Center for Health Care Statistics. January 2004. Available at: http://www.cdc.gov/nchs/data/misc/healthcare.pdf. Accessed February, 2004.

461
awareness for consumers and physicians regarding antidepressants and thereby
contributing to the significant relationship during the second half. In addition, the
prevalence of depression has been reported to increase with age, which may have
contributed to the relationship of age and drug expenditures.
Among individuals who received a prescription for gastrointestinals, the
percentage of individuals 25-44 years was significantly related to drug expenditures for
gastrointestinals in the presence of the visit variable. In the absence of the visit variable,
age groups, 45-64 years and 65 years and older also emerged as significant. One of the
probable reasons for this could be that because visit was only a month-level variable
whereas all other variables in the model were month and drug-level variables, it could
have resulted in a distortion of the results. Another probable reason is that visit had a very
strong relationship with drug expenditures and as a result, the two age groups were not
significant in the presence of the visit variable. In the analysis for prescriptions written
for gastrointestinals, all three age groups had a negative relationship with prescriptions
written. Since drug expenditures were calculated as a product of estimated price of drug
and number of prescriptions written, age groups were also related to prescription drug
expenditures for gastrointestinals. The relationship between age and drug expenditures
for gastrointestinals was much stronger for younger individuals (25 to 44 years) than
older individuals. The range of values for the percentage of individuals 25-44 years
(Mean: 19.9+ 19.4%), 45-64 years (Mean: 36.4+ 23.2%) and 65 years older (Mean: 39.7
+ 22.6%) among those who received prescriptions for gastrointestinals was 0 to 100
percent each. Among individuals who received prescriptions for advertised

462
gastrointestinals, for every one percentage increase in individuals 25-44 years, 45-64
years and 65 years and older, drug expenditures for individuals 25-44 years, 45-64 years
and 65 years and older decreased by $5,24342, $355,479 and $397,539, respectively.
As discussed previously in Objective II, one of the reasons for this negative
relationship could be the changes or events that occurred during the time period selected
for the study (January 1994 to April 2001) and the nature of the dataset. Zantac® 75 mg
was switched from prescription to OTC status in December 1995, which probably led to a
decrease in the number of prescriptions written for it. Propulsid® was withdrawn from
the market in 1999 and Helidac®, released in 1996, was not a widely prescribed drug.
Lotronex® was released in the market in February 2000 and was withdrawn in November
2000. In addition, Prilosec® and Prevacid® showed increases in prescriptions written
until 2000. In 2000 and 2001, prescriptions written for Prilosec® decreased and in 2001,
prescriptions written for Prevacid® decreased (Appendix D). These upheavals in the
market could be reasons for the negative relationship between drug expenditures for
gastrointestinals and age.
On splitting the dataset for gastrointestinals, in time period two, the age variable
percentage of individuals 25 to 44 years (Mean: 19.3+ 18.1%) among those who received
a prescription for gastrointestinal drugs had a significant negative relationship with drug
expenditures for gastrointestinals. In the original analysis for the entire time period from
January 1994 to April 2001, only percentage of individuals 25 to 44 years of age was
significant in the presence of visit variable. In the analysis for gastrointestinals for the
entire time period, younger individuals had a stronger relationship with drug expenditures

463
as well as number of prescriptions written and this relationship. The upheavals discussed
earlier may be one of the reasons for this negative relationship between age and drug
expenditures for gastrointestinals. Most the upheavals or changes occurred between
September 1997 and April 2001, which may account for the relationship for younger
individuals with the drug expenditures for gastrointestinals.
Since the number of prescriptions written were used in the calculation of drug
expenditures and the percentages for the age variable, the results of the relationships
between age and drug expenditures should be interpreted with caution because of the
large values for number of prescriptions written. Small changes in the percentages (age)
may be related to large changes in the drug expenditures.
Demographics: Gender
Gender or percentage of women was significantly related to prescription drug
expenditures for allergy medications and gastrointestinals. Among those who received
prescriptions for allergy medications or gastrointestinals, an increase in the proportion of
women was significantly related to an increase in drug expenditures for advertised drugs
in the respective classes (allergy medications/gastrointestinals). Among those who
received prescriptions for advertised allergy medications, for every one percentage
increase in women, drug expenditures for allergy medications increased by $78,787.
Among those who received prescriptions for advertised gastrointestinals, for every one
percentage increase in women, drug expenditures for gastrointestinals increased by
$98,565. It can be reasoned that since prescription drug expenditures are a product of the
price and prescription volume, the relationship between gender and number of

464
prescriptions written contributed to the relationship between gender and drug
expenditures. The range of values for percentage of women among those who received
prescriptions for allergy medications (Mean: 61.6+23.4%) and gastrointestinals (Mean:
60.9+20.3%) was 0 to 100 percent each.
For gastrointestinals, the interaction between percentage of percentage of women
and drug expenditures for gastrointestinals was negative in time period one (not
significant) and positive (significant) in time period two. On splitting the datasets
(gastrointestinals), although gender did play a role for the entire time period, it no longer
had an impact in the shorter time periods. This may have been due to the smaller datasets
or the relationships were not strong enough in the shorter time periods to warrant
significance.
On splitting the datasets, the relationship between drug expenditures and
percentage of women was significant only in time period two from September 1997 to
April 2001 for allergy medications and antidepressants. Among those who received
prescriptions for allergy medications/antidepressants, an increase in the percentage of
women was significantly related to an increase in drug expenditures for the advertised
drugs in the respective drug classes (allergy medication/antidepressants). The range of
values for percentage of women among those who received prescriptions for allergy
medications (Mean: 62.0+20.6%) and antidepressants (Mean: 66.2+20.2%) was 0 to 100
percent each.
465
Some studies have reported that women spend more on prescription drugs than
men.528,529,530 However, Momin et al. reported that except for lipotropics and
antidepressants, men received more prescriptions than women for the following drug
classes calcium channel blockers, angiotensin converting enzyme (ACE) inhibitors, H2-
blockers, and beta blockers.531 The results for allergy medications and antidepressants
(September 1997-April 2001) are similar to the results in literature and results for study
by Momin et al.
The reason that gender played a role in expenditures for allergy medications and
gastrointestinals during the entire time period selected for the study could be the
symptomology for allergic rhinitis and gastrointestinal-related problems. The symptoms
associated with allergic rhinitis and gastrointestinal-related problems are possibly much
more aggravating than other conditions included in the study, inducing physician visits at
onset of symptoms, which resulted in prescriptions for the advertised medications for
treatment. In addition, women are more likely to be care-seekers than self-treaters and
are usually more proactive in seeking care, resulting in more physician visits.532,533
On splitting the datasets, gender or percentage of individuals with prescriptions
for allergy medications and antidepressants who were women was significantly related to
528 Eng HJ, Lee ES. The role of prescription drugs in health care for the elderly. Journal of Health and Human Resources Administration. Winter 1987;9(3):306-318.
529 Eng HJ, Lee ES. The role of prescription drugs in health care for the elderly. Journal of Health and Human Resources Administration. Winter 1987;9(3):306-318.
530 Steinberg EP, Gutierrez B, Momani A, et al. Beyond survey data: A claims-based analysis of drug use and spending by the elderly. Health Affairs. March/April 2000;19(2):198-211.
531 Momin SR, Larrat EP, Lipson DP, et al. Demographics and cost of pharmaceuticals in a private third-party prescription program. Journal of Managed Care Pharmacy. 2000;6(5):395-409.
532 Hibbard JH, Pope CR. Another look at sex differences in the use of medical care: Illness orientation and types of morbidities for which services are used. Women Health. 1986;11:21-36.
533 Ganther JM, Wiederholt JB, Kreling DH. Measuring patients' medical care preferences: Care seeking versus self-treating. Medical Decision Making. 2000;21:47-54.

466
drug expenditures in time period two. With increased advertising from September 1997
to April 2001 and increased awareness due to the advertising, are some of the reasons for
the increased number of prescriptions written (Objective II) and ultimately increased drug
expenditures for advertised allergy medications.
Although the variable, percentage of women was not significant in the analysis
for the entire time period for antidepressants, percentage of women among those who
received a prescription for antidepressants was significantly related to drug expenditures
for antidepressants for time period two. This may be because women have been noted to
be diagnosed with depression more often than men534 and hence may receive more
antidepressants than men.535 Although these relationships were not significant, it is a
possibility that in this case the relationship was strong enough to be significant only for
drug expenditures during the latter half. Increased advertising following the relaxation of
guidelines in time period two may have contributed to this relationship. With increased
expenditures for DTCA and increased awareness of depression and antidepressants,
women may have received prescriptions for more expensive medications.
Since the number of prescriptions written were used in the calculation of drug
expenditures and the percentages for the gender variable, The results of the relationships
between gender and drug expenditures should be interpreted with caution because of the
large values for number of prescriptions written. Small changes in the percentages
(women) may be related to large changes in the drug expenditures.
534 Kessler RC. Epidemiology of women and depression. Journal of Affective Disorders. 2003;74:5-13.535 Sclar DA, Robinson LM, Skaer TL, et al. What factors influence the prescribing of antidepressant
pharmacotherapy? An assessment of national office-based encounters. International Journal of Psychiatry in Medicine. 1998;28(4):407-419.

467
Physician Visits
Physician visits (symptoms and/or diagnosis) were significantly related to the
drug expenditures for all five classes, both prior to and following the relaxation of
guidelines. Physician visits were significantly related to prescriptions written for the five
drug classes (Objective II). The physician visits are essential for prescriptions to be
written or rather are a requirement for new prescriptions to be written. Since drug
expenditures are derived from prescriptions written, it is logical to assume the factors
related to prescriptions written will also be related to drug expenditures.
Time
The drug expenditures for antidepressants differed significantly between the two
time periods and was significantly higher in time period one (January 1994 through
August 1997) compared to drug expenditures in time period two (September 1997 to
April 2001). The reason for the higher drug expenditures in time period one could be that
more prescriptions were written for the more expensive medications in time period one
compared to time period two.
When age was operationalized as percentage of individuals 45 years and older, for
antilipemics, gastrointestinals, and antidepressants, significant variables in time period
one were significant in time period two. For both gastrointestinals and antidepressants,
these results changed on further categorization of age. For antilipemics, DTCA
expenditures and physician visits or patients diagnosed with hyperlipidemia were
significantly related to drug expenditures for advertised antilipemics both prior to and
following the relaxation of guidelines. Other factors in addition to the factors discussed

468
earlier which have contributed to the change in the relationships from time period one to
time period two are market dynamics, price, evolving clinical practice, and new drugs
released in the market (included/not included in study).
Conclusion
This study brought to the forefront some factors that are related to use of health
care services (physician visit) and products (prescriptions drugs) and drug expenditures.
The relationships between demographics, health insurance coverage, DTCA expenditures
for the respective drugs and the frequency of visits varied for the allergy-related visits,
diagnosis of hyperlipidemia and depression-related visits. None of the variables were
found to be related to the frequency of gastrointestinal-related visits and hypertension-
related visits. The relationships of demographics, health insurance coverage, advertising
expenditures with number of prescriptions written and its expenditures varied for all
classes prior to and following relaxation of guidelines for broadcast advertising. There
was no uniformity in the relationships with number of prescriptions written and their
expenditures for different drug classes. However, physician visits were related to
prescriptions written and expenditures for all drug classes.
Age played a role in the frequency of physician visits for depression-related
symptoms and/or diagnosis, but not for the entire time period from January 1994 to April
2001. Age (25-64 years) was related to depression-related visits only from January 1994
to August 1997. Age had a significant relationship with the prescriptions written and drug
expenditures only for gastrointestinals and antidepressants. While age had a negative
relationship with prescriptions written and drug expenditures for gastrointestinals, older

469
individuals had a positive relationship with the prescriptions written and drug
expenditures for antidepressants.
Gender was related specifically to prescriptions written and drug expenditures for
two drug classes namely allergy medications and gastrointestinals. Gender was also
related to the drug expenditures for antidepressants, but only from September 1997
through April 2001.
Contrary to the literature, health insurance coverage had a negative relationship
with allergy-related visits and prescriptions written and drug expenditures for
antihypertensives. However, health insurance coverage was positively related to
prescriptions written for antidepressants.
DTCA expenditures influenced the increase in prescriptions written and
expenditures for all drug classes except for antidepressants and antihypertensives.
Increases in DTCA expenditures for allergy medications, antilipemics and
gastrointestinals were significantly related to the increase in prescriptions written and
drug expenditures for advertised drugs in the respective classes. While DTCA
expenditures were not related to prescriptions written and expenditures for
antidepressants, it was negatively related to the prescriptions written and expenditures for
antihypertensives.
The increase in prescriptions written for allergy medications related to an increase
in DTCA expenditures for allergy medications was much higher in September 1997 to
April 2001 compared to the increase in January 1994 to August 1997. On splitting the
datasets, DTCA expenditures were related to prescriptions written for allergy medications

470
only in September 1997 to April 2001, whereas DTCA expenditures for gastrointestinals
were related to prescriptions written for them during both time periods. DTCA
expenditures were related to drug expenditures for allergy medications and
gastrointestinals, prior to and following relaxation of guidelines. However, the increase in
expenditures for gastrointestinals related to an increase in DTCA expenditures for
gastrointestinals was much higher from September 1997 through April 2001 compared to
the increase during time period January 1994 through August 1997.
Overall, the number of patients with diagnoses for hyperlipidemia increased with
the DTCA expenditures for antilipemics. While the number of patients diagnosed with
hyperlipidemia was more strongly related to DTCA expenditures between January 1994
and August 1997, DTCA expenditures were related to prescriptions written and drug
expenditures for antilipemics both prior to and following the relaxation of guidelines.
Physician visits played a very important role in prescriptions written and expenditures for
all drug classes during the entire time period selected for the study. Only physician visits
were significant in both time periods (prior to and following relaxation of guidelines for
broadcast advertising).
The study results indicate that different factors are related to physician visits,
prescriptions written and their expenditures and are different for different drug classes.
Only physician visits had a consistent relationship with prescriptions written and
expenditures for all drug classes. The number of patients diagnosed with hyperlipidemia,
gastrointestinal-related visits and hypertension-related visits increased significantly
following the relaxation of guidelines. With increased advertising, increased awareness

471
not only due to DTCA, but also other sources of information may have played a role,
thereby resulting in more health-conscious consumers for the conditions such as
hyperlipidemia, gastrointestinal conditions and hypertension. These conditions may be
more serious with long-term consequences compared to conditions treated with allergy
medications evaluated in the study.
These study results give us a better understanding of factors influencing use of
health care services (physician visits) and products (prescription drugs) and the
prescription drug expenditures. Although there are studies comparing each of the
relationships, they mainly evaluated relationships for different classes of drugs, for
different time periods, but not exactly for the same mix of factors included in this study.
In spite of the limitations of this study, the results can enable policy makers to understand
the overall impact of these factors on the use and expenditures for health care services
and products.
SECTION III: SUGGESTIONS FOR FUTURE RESEARCH
The results of the study, while answering some of the questions in the literature,
have raised several interesting issues regarding the various aspects of use of health care
services and products. The data for the study were aggregated by month and this
aggregation can cause loss of information. Hence, the data for the current study
reanalyzed without aggregation and without the DTCA expenditures (month-level data),
can reconfirm the relationships of demographics and health insurance coverage with
physician visits, prescriptions written and their expenditures.

472
For the purpose of this study, physician visits included reason for visit and/or
diagnosis related to the visit. The study should be repeated, but separating the reason for
visit and diagnosis to identify which is more influenced by DTCA and which has a
greater impact on prescriptions written and their expenditures.
NAMCS data provided an array of options for source of payment or health
insurance coverage. Comparing the results for private and public health insurance will
help us understand the variations in office visits for the different conditions and drugs
prescribed. In addition, the prescribing patterns by health insurance status can be further
evaluated.
With the new drugs introduced in the market, prescribing patterns and
inappropriate prescribing have become key issues in patient care. Advertising of
prescription drugs has sparked debates regarding inappropriate prescribing patterns.
Using NAMCS for a national estimate, we can evaluate the patterns in inappropriate
prescribing using different algorithms, and compare the physician and patient
characteristics. The patient and physician characteristics can be compared for the
different drugs prescribed and the relationship of physician characteristics with DTCA
expenditures and prescribing patterns can also be evaluated.
The current study included only five drug classes and only advertised drugs
within these classes. A study including all drugs prescribed, even the drugs not advertised
in these drug classes, may give us a better understanding of the impact of DTCA on the
entire drug class. During the recent years, other drug classes such as antidiabetic
medications and oral contraceptives. are being heavily advertised The current study

473
should be repeated for these newer heavily advertised drug classes. Determining the
influence of DTCA for other drug classes and even specifically the advertised drug can
help identify if the effects of DTCA are limited to the advertised drugs or if it extends to
the entire drug class.
There are several “me-too” drugs being introduced in the market and are also
among the more heavily advertised drugs. Analysis comparing the relationships for these
“me-too drugs” (e.g., Prilosec®-Nexium®) can give us an understanding of the market
and the changes in market dynamics as a result of introduction of these drugs. In the past
few years, several heavily advertised drugs have been switched to the OTC status
(Zantac®, Prilosec®, Claritin®). Evaluating the trends (DTCA, utilization) and
relationships prior to and following the switch will enable us to understand the impact of
these switches, not only in terms of volume, but also identify patient factors associated
with the use of these medications. They can then be compared to the use of other
prescription drugs in that class when these medications were switched to OTC status and
newer drugs were introduced in the market. In addition, the role of DTCA in switching
patients to the competing/newer drugs in the market at that time can be evaluated along
with its impact on market share.
The prescription drug expenditures data in the current study were calculated using
the AWP and may not reflect the true values. Analyzing the actual expenditures (e.g.
Managed care population, Medical Expenditure Panel Survey), can give us a more
realistic view of factors related to prescription drug expenditures.

474
Appendix A
Acronyms

475
GLOSSARY OF ACRONYMS
AARP - American Associated for Retired PersonsACE – Angiotensin Converting EnzymeAMA -American Medical AssociationAOA – American Osteopathic AssociationAPhA – American Pharmaceutical AssociationAWP – Average Wholesale PriceBMJ – The British Medical JournalCI – Confidence IntervalCMR – Competitive Media ReportingCMS – Centers for Medicare and Medicaid ServicesDTCA – Direct-to-consumer advertisingFDA – Food and Drug AdministrationFD&C Act – Food, drug and cosmetic actFTC – Federal Trade CommissionGAO – General Accounting OfficeGI – GastrointestinalHMO – Health Maintenance OrganizationHRQOL -Health-Related Quality of LifeMCBS – Medicare Current Beneficiary SurveyMCO – Managed Care OrganizationMEPS – Medical Expenditure Panel SurveyMoVIES - Monogahela Valley Independent Elders SurveyNACDS – National Association of Chain Drugs StoresNAMCS – National Ambulatory Medical Care SurveyNCHS – National Center for Health StatisticsNIHCM – National Institute for Health Care ManagementNMES – National Medical Expenditure SurveyNMCUES – National Medical Care Utilization and Expenditure SurveyOR – Odds RatioOTC – Over-the-CounterPACE - Pennsylvania Pharmaceutical Assistance ContractPBM – Pharmacy Benefit ManagerPIB – Publishers Information BureauPhRMA - Pharmaceutical Research and Manufacturers of AmericaPSID - Panel Study of Income DynamicsPSU – Primary Sampling UnitR&D – Research and DevelopmentROI – Return on InvestmentSMSA – Standard Metropolitan Statistical Areas

476
Appendix B
Average Wholesale Price for
Selected Allergy Medications, Antilipemics, Gastrointestinals, Antidepressants, and
Antihypertensives

477
Average Wholesale Price of Drugs, 1994 to 20011994 1995 1996 1997 1998 1999 2000 2001
Allergy MedicationsHismanal® 10 mg $50.628 $55.500 $57.660 $59.910 $62.247 $68.496 -- --Seldane® 60 mg $35.400 $36.780 $37.500 -- -- --Claritin® 10 mg $53.170 $55.300 $58.060 $62.490 $64.060 $65.650 $67.300 $74.650Flonase® 16 gm -- $38.880 $40.630 $42.270 $46.180 $49.870 $53.360 $56.030
Allegra® 60 mg -- -- $25.127 $25.780 $26.550 $29.826 $29.826 $31.014
Zyrtec ® 5mg/10mg -- -- $51.408 $52.953 $52.384 $55.797 $57.528 $59.370
Nasonex ®17 gm -- -- -- -- $48.230 $49.920 $51.170 $46.540Antilipemics
Mevacor® 20 mg $59.895 $62.525 $64.965 $67.495 $69.850 $69.850 $72.500 $75.400
Pravachol® 20 mg $107.805 $112.545 $116.930 $121.490 $125.740 $125.740 $130.515 $135.730Zocor® 20 mg $51.909 $54.525 $57.723 $60.033 $62.973 $69.432 $74.223 $77.937Lescol® 20 mg $87.750 $82.953 $95.860 $99.693 $101.687 $112.110 $118.277 $124.187Lipitor® 10 mg -- -- -- $52.768 $54.720 $56.360 $56.360 $63.560Baycol® 0.2 mg -- -- -- -- $39.600 $39.600 $42.570 $48.675
GastrointestinalsZantac® 150 mg $47.830 $49.600 $49.600 $49.600 $51.605 $52.640 $53.165 $54.760Propulsid® 10 mg $18.000 $18.882 $19.620 $20.388 $21.384 $22.431 $26.922 --Prilosec® 20 mg -- $108.900 $108.900 $108.900 $113.040 $116.090 $119.570 $124.170
Prevacid® 30 mg -- $99.299 $102.675 $102.675 $104.184 $107.832 $112.035 $119.898Helidac® Kit -- -- -- $77.700 $77.700 $81.640 $81.640 $81.640
Lotronex® 1mg -- -- -- -- -- -- $155.566 --
AntidepressantsWellbutrin® 100 mg $21.666 $22.533 $22.533 $24.888 $29.001 $31.737 $32.055 $33.657
Prozac® 20 mg $62.556 $64.746 $67.370 $72.510 $75.050 $77.670 $79.220 $85.510Paxil® 20 mg $52.480 $54.600 $59.300 $61.950 $64.350 $66.850 $69.850 $75.900Zoloft® 50 mg $58.323 $58.233 $62.784 $64.665 $66.414 $68.142 $70.254 $72.498
Effexor® 75 mg $29.982 $29.982 $32.202 $34.428 $35.598 $36.810 $39.357 $43.308
Serzone® 100 mg -- $24.840 $24.840 $29.070 $30.275 $34.660 $37.055 $39.280
AntihypertensivesAdalat® 60 mg $43.650 $45.177 $45.177 $46.983 $49.098 $53.952 $61.770 $67.746Altace® 5 mg $22.254 $22.254 $22.431 $24.264 $24.984 $28.833 $29.898 $33.405
Capoten® 25 mg $19.636 $20.707 $21.535 $23.292 $24.224 $28.255 $29.159 $29.159
Cardizem CD® 240 mg
$50.400 $52.620 $52.620 $55.200 $57.420 $62.100 $62.100 $68.450
Cardura® 4 mg $26.853 $27.930 $28.905 $29.772 $30.579 $31.374 $32.343 $33.378
Lotensin® 10 mg $19.089 $19.089 $20.043 $20.844 $22.755 $23.712 $25.014 $27.006
Toprol XL® 50 mg $12.777 $13.389 $14.034 $14.454 $15.936 $16.734 $17.490 $18.186
Coreg® 25 mg -- -- -- $43.394 $45.000 $46.350 $47.745 $48.705

478
Appendix C
DTCA Expenditures for Allergy Medications
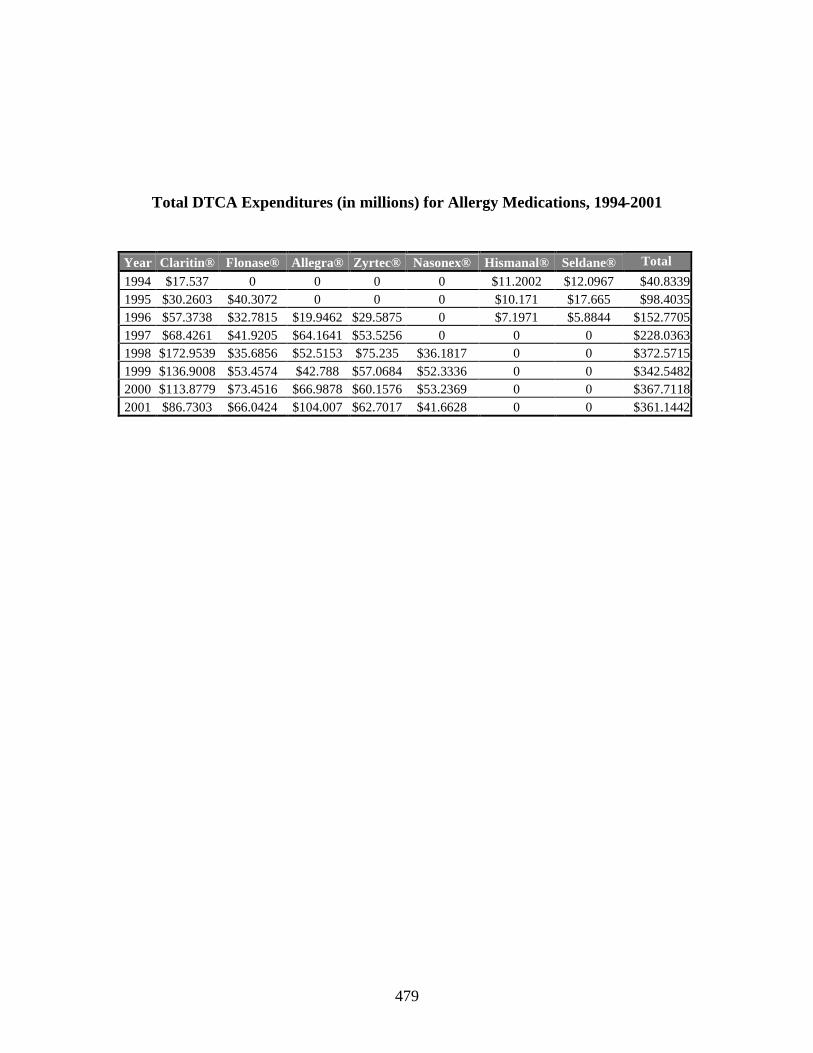
479
Total DTCA Expenditures (in millions) for Allergy Medications, 1994-2001
Year Claritin® Flonase® Allegra® Zyrtec® Nasonex® Hismanal® Seldane® Total
1994 $17.537 0 0 0 0 $11.2002 $12.0967 $40.83391995 $30.2603 $40.3072 0 0 0 $10.171 $17.665 $98.40351996 $57.3738 $32.7815 $19.9462 $29.5875 0 $7.1971 $5.8844 $152.77051997 $68.4261 $41.9205 $64.1641 $53.5256 0 0 0 $228.03631998 $172.9539 $35.6856 $52.5153 $75.235 $36.1817 0 0 $372.57151999 $136.9008 $53.4574 $42.788 $57.0684 $52.3336 0 0 $342.54822000 $113.8779 $73.4516 $66.9878 $60.1576 $53.2369 0 0 $367.71182001 $86.7303 $66.0424 $104.007 $62.7017 $41.6628 0 0 $361.1442

480
Appendix D
Tables for Number and Percentage of Prescriptions Written for Advertised Drugs
from the Five Drug Classes: Allergy Medications, Antilipemics, Gastrointestinal
Drugs, Antidepressants, and Antihypertensives

481
Number and Percentage of Prescriptions Written for Advertised Allergy Medications, 1994-2001
Number and Percentage of Prescriptions Written for Advertised Antilipemics, 1994-2001
Number of Prescriptions Written(Column%)
Drug 1994 1995 1996 1997 1998 1999 2000 2001Claritin® 3,937,473
(40.87%)5,513,566(49.77%)
8,028,119(59.84%)
10,984,358(56.07%)
14,195,380(45.46%)
16,059,763(45.60%)
17,085,954(43.69%)
14,617,433(31.31%)
Allegra® -- -- 87,523(0.65%)
1,863,675(9.51%)
4,147,136(13.57%)
5,746,829(16.32%)
7,082,380(18.11%)
9,375,907(20.08%)
Zyrtec® -- -- 1,736,479(12.94%)
2,925,556(14.93%)
5,145,933(16.84%)
4,597,302(13.05%)
5,886,364(15.05%)
8,142,186(17.44%)
Flonase® -- 1,228,483(11.09%)
2,258,206(16.83%)
2,937,345(14.99%)
4,616,124(15.11%)
5,339,367(15.16%)
4,486,246(11.47%)
8,516,192(18.24%)
Nasonex® -- -- -- -- 2,302,849(7.54%)
3,430,335(9.74%)
4,566,256(11.68%)
6,035,808(12.93%)
Hismanal® 1,123,071(11.66%)
712,762(6.43%)
547,499(4.08%)
878,305(4.48%)
148,940(0.49%)
42,347(0.12%)
-- --
Seldane® 4,573,702(47.47%)
3,622,352(32.70%)
758,745(5.66%)
0(0%)
-- -- -- --
Total 9,634,246 11,077,163 13,416,571 19,589,239 30,556,362 35,215,943 39,107,200 46,687,526
Number of Prescriptions Written(Column%)
Drug 1994 1995 1996 1997 1998 1999 2000 2001
Mevacor®3,298,207(54.78%)
3,543,882(40.08%)
3,814,504(32.72%)
2,456,326(14.04%)
2,217,477(9.55%)
1,067,377(4.06%)
635,745(1.89%)
1,162,461(2.92%)
Pravachol®1,163,305(19.32%)
1,705,003(19.28%)
2,747,191(23.57%)
3,275,579(18.73%)
4,674,185(20.13%)
5,351,506(20.34%)
4,063,069(12.06%)
4,447,725(11.17%)
Lescol®285,218(4.74%)
792,096(8.96%)
1,176,155(10.09%)
2,560,517(14.64%)
2,079,429(8.96%)
1,174,376(4.46%)
1,320,313(3.92%)
1,542,048(3.87%)
Zocor®1,274,632(21.17%)
2,801,542(31.68%)
3,920,029(33.63%)
6,756,211(38.63%)
6,262,575(26.97%)
6,102,751(23.19%)
9,306,120(27.62%)
10,352,392(25.99%)
Lipitor® -- -- --2,440,855(13.96%)
7,751,139(33.39%)
12,211,941(46.41%)
16,429,022(48.77%)
21,022,247(52.78%)
Baycol® -- -- -- --230,562(0.99%)
403,859(1.53%)
1,934,770(5.74%)
1,301,913(3.27%)
Total 6,021,362 8,842,523 11,657,879 17,489,488 23,215,367 26,311,810 33,689,039 39,828,786

482
Number and Percentage of Prescriptions Written for Advertised Gastrointestinal Drugs, 1994-2001
Number of Prescriptions Written(Column %)
Drug 1994 1995 1996 1997 1998 1999 2000 2001Zantac® 8,107,267
(87.50%)9,060,423(60.24%)
6,401,830(37.63%)
6,327,782(33.24%)
6,387,518(27.38%)
5,348,551(20.25%)
4,423,565(17.42%)
4,453,407(18.19%)
Propulsid® 1,157,865(12.50%)
1,532,143(10.19%)
2,565,777(15.08%)
2,285,796(12.01%)
2,989,208(12.81%)
2,289,369(8.67%)
625,503(2.46%)
--
Prilosec® -- 4,180,470(27.79%)
6,921,305(40.69%)
7,780,055(40.86%)
9,215,724(39.50%)
11,869,345(44.93%)
10,709,621(42.18%)
10,888,211(44.48%)
Prevacid® -- 268,659(1.79%)
1,122,340(6.60%)
2,621,991(13.77%)
4,632,480(19.86%)
6,908,251(26.15%)
9,301,204(36.63%)
9,028,131(36.88%)
Helidac® -- -- -- 23,715(0.12%)
105,446(0.45%)
0(0%)
30,760(0.12%)
109,810(0.45%)
Lotronex® -- -- -- -- -- -- 299,536(1.18%)
--
Total 9,265,132 15,041,695 17,011,252 19,039,339 23,330,376 26,415,516 25,390,189 24,479,559
Number and Percentage of Prescriptions Written for Advertised Antidepressants, 1994-2001
Number of Prescriptions Written(Column %)
Drug 1994 1995 1996 1997 1998 1999 2000 2001
Wellbutrin®868,773(5.65%)
793,452(4.52%)
870,200(4.40%)
2,277,038(7.97%)
3,107,547(10.37%)
3,167,775(9.95%)
4,746,865(13.44%)
3,889,641(10.19%)
Prozac®5,989,012(38.95%)
5,994,548(34.17%)
6,666,301(33.70%)
8,199,939(28.71%)
8,142,249(27.17%)
7,905,183(24.84%)
6,853,208(19.41%)
8,767,286(22.96%)
Paxil®3,045,043(19.81%)
3,674,103(20.94%)
4,280,552(21.64%)
6,849,445(23.98%)
6,585,495(21.98%)
7,812,608(24.55%)
8,267,562(23.41%)
10,082,076(26.41%)
Zoloft®4,811,118(31.29%)
5,602,307(31.94%)
5,936,704(30.01%)
7,607,287(26.64%)
8,406,992(28.05%)
8,322,120(26.15%)
9,168,548(25.96%)
9,749,707(25.54%)
Effexor®660,619(4.30%)
1,130,638(6.45%)
1,204,793(6.09%)
2,063,013(7.22%)
1,636,064(5.46%)
2,927,008(9.20%)
4,402,019(12.47%)
3,956,323(10.36%)
Serzone® --347,488(1.98%)
822,224(4.16%)
1,563,221(5.47%)
2,088,762(6.97%)
1,694,863(5.32%)
1,875,721(5.31%)
1,736,579(4.55%)
Total 15,374,565 17,542,536 19,780,774 28,559,943 29,967,109 31,829,557 35,313,923 38,181,612

483
Number and Percentage of Prescriptions Written for Advertised Antihypertensive Drugs, 1994-2001
Number of Prescriptions Written(Column%)
Drug 1994 1995 1996 1997 1998 1999 2000 2001
Capoten®3,001,665(20.16%)
2,558,792(17.58%)
2,716,088(16.20%)
1,944,209(11.26%)
1,537,324(6.70%)
1,429,524(7.01%)
1,429,231(7.19%)
659,435(3.02%)
Toprol XL®471,193(3.16%)
726,602(4.99%)
1,284,097(7.66%)
2,304,847(13.35%)
2,479,213(10.81%)
3,304,741(16.21%)
4,731,919(23.80%)
7,496,346(34.38%)
Altace®951,409(6.39%)
1,317,335(9.05%)
1,005,902(6.00%)
576,410(3.34%)
1,039,027(4.53%)
1,355,627(6.65%)
621,157(3.12%)
2,225,303(10.21%)
Adalat®410,186(2.75%)
1,153,615(7.92%)
1,532,429(9.14%)
2,061054(11.94%)
3,215,264(14.02%)
1,827,268(8.96%)
1,731,094(8.71%)
785,898(3.60%)
Cardura®1,257,663(8.45%)
1,048,760(7.20%)
2,464,505(14.70%)
2,976,414(17.24%)
3,681,012(16.05%)
3,748,662(18.39%)
3,531,480(17.76%)
2,633,013(12.08%)
Cardizem®7,947,085(53.37%)
6,319,442(43.41%)
5,967,654(35.59%)
4,347,089(25.18%)
6,079,681(26.51%)
5,434,108(26.65%)
3,830,249(19.27%)
4,791,213(21.98%)
Lotensin®851,411(5.72%)
1,432,658(9.84%)
1,799,432(10.73%)
3,028,723(17.54%)
4,223,257(18.41%)
2,525,465(12.39%)
3,278,144(16.49%)
1,901,650(8.72%)
Coreg® -- -- --25,725
(0.15%)682,013(2.97%)
761,532(3.74%)
727,232(3.66%)
1,309,275(6.01%)
Total 14,890,612 14,557,204 16,770,107 17,264,471 22,936,791 20,386,927 19,880,506 21,802,133

484
Appendix E
Tables for Percentage of Women Among those who Received Prescriptions for
Advertised Allergy Medications, Antilipemics, Gastrointestinals, Antidepressants
and Antihypertensives, 1994-2001

485
Percentage of Women Among those who Received Prescriptions for Advertised Allergy Medications, 1994-2001
Year Claritin®%
Allegra®%
Zyrtec®%
Flonase®%
Nasonex®%
Hismanal®%
Seldane®%
1994 65.0 -- -- -- -- 57.2 64.8
1995 64.9 -- -- 53.2 -- 60.2 63.9
1996 66.7 88.8 70.2 40.2 -- 41.1 36.2
1997 58.2 67.9 67.0 63.7 -- 73.6 0.0
1998 58.8 62.8 68.0 58.3 59.5 85.7 --
1999 56.6 70.4 66.3 63.6 55.9 100.0 --
2000 65.4 68.7 64.2 60.6 60.3 -- --
2001 49.0 62.6 57.2 54.5 53.8 -- --
Note: In 1998, all prescriptions written for Hismanal® were for women
Percentage of Women Among those who Received Prescriptions for Advertised Antilipemic Drugs, 1994-2001
Year Lescol®%
Mevacor®%
Pravachol®%
Zocor®%
Lipitor®%
Baycol®%
1994 44.4 57.4 56.2 67.6 -- --
1995 63.0 51.7 50.0 46.3 -- --
1996 44.9 55.4 45.7 52.4 -- --
1997 47.0 68.5 53.3 51.7 48.4 --
1998 53.8 46.4 44.7 45.5 52.3 35.5
1999 68.0 72.3 50.7 46.2 46.2 42.8
2000 39.0 36.3 40.5 49.2 49.6 44.7
2001 61.9 29.1 42.4 43.9 50.0 43.4
Percentage of Women Among those who Received Prescriptions for Advertised Gastrointestinal Drugs, 1994-2001
YearZantac®
%Propulsid®
%Prilosec®
%Prevacid®
%Helidac®
%Lotronex®
%
1994 54.6 72.2 -- -- -- --
1995 60.3 62.2 55.3 75.6 -- --
1996 65.1 70.4 51.5 71.4 -- --
1997 60.0 66.5 52.6 47.5 100.0 --
1998 63.4 62.6 59.7 61.4 100.0 --
1999 61.9 51.2 57.3 59.0 -- --
2000 59.4 63.1 56.2 62.3 0.0 100.0
2001 67.0 -- 65.7 54.5 100.0 --
Note: In 1997, 1998, and 2001, all prescriptions written for Helidac® were for women. In 2000, all prescriptions written for Helidac® were for men and all prescriptions written for Lotronex® were for women

486
Percentage of Women Among those who Received Prescriptions for Advertised Antidepressants, 1994-2001
Year Effexor®%
Paxil®%
Prozac®%
Serzone®%
Wellbutrin®%
Zoloft®%
1994 63.5 68.7 67.2 -- 81.3 70.61995 65.8 68.6 76.9 70.3 60.3 65.41996 68.6 68.5 68.2 60.6 62.6 68.2
1997 71.1 71.0 70.8 61.0 64.9 70.31998 67.9 73.5 69.2 63.9 49.2 69.81999 77.0 68.5 67.0 67.4 63.2 65.3
2000 64.2 67.2 62.2 65.7 56.0 71.12001 72.4 76.8 79.1 73.7 51.1 73.4
Percentage of Women Among those who Received Prescriptions for Advertised Antihypertensive Drugs, 1994-2001
YearAdalat®
%Altace®
%Capoten®
%Cardizem®
%Cardura®
%Coreg®
%Lotensin®
%
Toprol XL®
%
1994 63.6 61.7 50.9 55.8 45.9 -- 68.1 83.31995 87.7 63.3 54.8 55.9 32.0 -- 56.3 54.31996 46.8 47.0 52.9 59.6 29.5 -- 65.9 45.31997 56.3 65.0 41.8 56.1 20.9 17.5 42.8 52.4
1998 48.8 42.8 54.5 52.8 28.7 22.9 54.5 46.21999 61.2 47.1 54.2 44.8 16.3 28.7 55.7 40.02000 56.9 49.9 66.8 42.8 22.2 23.3 54.2 46.9
2001 45.0 30.3 58.1 53.9 20.1 50.0 71.8 52.4

487
Appendix F
Tables for Percentage of Individuals with Health Insurance Coverage Among
those who Received Prescriptions for Advertised Allergy Medications, Antilipemics,
Gastrointestinals, Antidepressants and Antihypertensives Coverage, 1994-2001

488
Percentage of Individuals with Health Insurance Coverage Among those who Received Prescriptions for Advertised Allergy Medications, 1994-2001
Year Claritin®%
Allegra®%
Zyrtec®%
Flonase®%
Nasonex®%
Hismanal®%
Seldane®%
1994 92.8 -- -- -- -- 77.4 93.1
1995 82.7 -- -- 94.7 -- 74.3 89.5
1996 82.1 88.8 83.8 85.0 -- 86.0 97.5
1997 93.1 79.5 91.7 90.5 -- 100.0 0.0
1998 92.5 87.4 83.7 88.5 95.3 100.0 --
1999 94.0 94.6 94.1 97.2 93.5 100.0 --
2000 93.7 93.8 93.1 94.9 95.0 -- --
2001 89.8 93.2 88.6 89.8 85.5 -- --
Percentage of Individuals with Health Insurance Coverage Among those who Received Prescriptions for Advertised Antilipemic Drugs, 1994-2001
Year Lescol®%
Mevacor®%
Pravachol®%
Zocor®%
Lipitor®%
Baycol®%
1994 96.7 96.4 95 94.7 -- --1995 98.2 98.4 98.5 87.0 -- --1996 95.3 90.6 94.9 95.5 -- --1997 98.0 94.3 95.9 95.1 98.7 --
1998 97.8 96.3 97.3 93.1 92.4 87.21999 100.0 87.5 97.0 97.0 94.0 100.02000 100.0 100.0 99.1 98.7 94.2 99.7
2001 100.0 78.7 98.1 95.0 92.4 81.5
Percentage of Individuals with Health Insurance Coverage Among those who Received Prescriptions for Advertised Gastrointestinal Drugs, 1994-2001
Year Zantac®%
Propulsid®%
Prilosec®%
Prevacid®%
Helidac®%
Lotronex®%
1994 93.3 100.0 -- -- -- --1995 91.8 94.5 91.2 81.4 -- --1996 90.3 98.2 94.4 97.9 -- --1997 95.8 95.1 92.3 95.7 100.0 --
1998 98.8 96.8 95.2 95.2 100.0 --1999 96.0 96.7 96.1 97.9 0.0 --2000 95.4 100 97.5 96.2 100.0 100.0
2001 92.0 -- 95.8 96.6 100.0 --

489
Percentage of Individuals with Health Insurance Coverage Among those who Received Prescriptions for Advertised Antidepressants, 1994-2001
Year Effexor®%
Paxil®%
Prozac®%
Serzone®%
Wellbutrin®%
Zoloft®%
1994 66.9 92.8 83.6 -- 78.2 88.51995 89.0 90.4 84.7 96.9 81.3 82.11996 75.1 88.0 86.3 88.3 87.5 86.6
1997 78.9 85.4 88.4 83.9 80.3 87.61998 86.4 93.4 85.1 88.8 88.7 90.41999 86.4 94.1 80.4 92.5 78.0 89.4
2000 82.9 92.2 77.7 84.0 80.1 83.42001 87.0 92.9 88.1 71.7 83.1 93.9
Percentage of Individuals with Health Insurance Coverage Among those who Received Prescriptions for Advertised Antihypertensive Drugs, 1994-2001
Year Adalat®%
Altace®%
Capoten®%
Cardizem®%
Cardura®%
Coreg®%
Lotensin®%
Toprol XL®
%1994 100.0 91.4 91.5 94.8 91.4 -- 99.4 100.01995 60.4 74.8 96.7 92.8 82.7 -- 82.3 86.81996 96.5 90.4 94.0 95.9 83.8 -- 92.2 82.41997 96.5 89.7 95.1 98.1 95.1 100.0 92.6 93.01998 92.0 97.0 97.8 97.7 96.1 100.0 97.6 86.31999 97.6 97.8 89.9 94.9 96.1 97.6 88.2 98.52000 99.7 97.0 99.2 97.5 95.3 88.9 100.0 99.12001 86.2 93.9 100.0 94.6 97.0 99.6 86.5 95.6

490
Appendix G
Tables for Number And Percentage Of Prescriptions Written For Advertised
Allergy Medications, Antilipemics, Gastrointestinals, Antidepressants and
Antihypertensives by Patient Age Group (Less than 45 years, 45 years and older),
1994-2001

491
Number And Percentage Of Prescriptions Written For Selected Advertised Allergy Medications By Patient Age Groups, 1994-1997
1994 1995 1996 1997Drug
0-44 years
45 years and older
0-44 years
45 years and older
0-44 years
45 years and older
0-44 years 45 years and older
Claritin® 2,098,365(53.29%)
1,839,108(46.71%)
3,166,825(57.44%)
2,346,741(42.56%)
4,810,079(59.92%)
3,218,040(40.08%)
5,831,278(53.09%)
5,153,080(46.91%)
Allegra® -- -- -- -- 19,461(22.24%)
68,062(77.76%)
944,300(50.67%)
919,375(49.33%)
Zyrtec® -- -- -- -- 1,008,727(58.09%)
727,752(41.92%)
1,646,932(56.29%)
1,278,624(43.71%)
Flonase® -- -- 667,081(54.30%)
561,402(45.70%)
1,242,790(55.03%)
1,015,416(44.97%)
1,251,891(42.62%)
1,685,454(57.38%)
Nasonex® -- -- -- -- -- -- -- --
Hismanal® 437,821(38.98%)
685,250(61.02%)
365,977(51.35%)
346,785(48.65%)
149,339(27.28%)
398,160(72.72%)
385,504(43.89%)
492,801(56.11%)
Seldane® 2,808,211(61.40%)
1,765,491(38.60%)
1,964,538(54.23%)
1,657,814(45.77%)
412,688(54.39%)
346,057(45.61%)
0(0.0%)
0(0.0%)
5,344,397(55.47%)
4,289,849(44.53%)
6,164,421(55.65%)
4,912,742(44.35%)
7,643,084(56.97%)
5,773,487(43.03%)
10,059,905(51.35%)
9,529,334(48.65%)
Total
9,634,246 11,077,163 13,416,571 19,589,239
Number And Percentage Of Prescriptions Written For Selected Advertised Allergy Medications By Patient Age Groups, 1998-2001
1998 1999 2000 2001Drug0-44 years 45 years
and older0-44 years 45 years
and older0-44 years 45 years
and older0-44 years 45 years
and olderClaritin® 7,632,622
(53.77%)6,562,758(46.23%)
8,956,295(55.77%)
7,103,468(44.23%)
10,230,878(59.88%)
6,855,076(40.12%)
8,489,163(58.08%)
6,128,270(41.92%)
Allegra® 1,867,426(45.03%)
2,279,710(54.97%)
2,430,148(42.29%)
3,316,681(57.71%)
2,921,970(41.26%)
4,160,410(58.74%)
3,489,711(37.22%)
5,886,196(62.78%)
Zyrtec® 3,059,450(59.45%)
2,086,483(40.55%)
2,796,755(60.83%)
1,800,547(39.17%)
3,607,571(61.29%)
2,278,793(38.71%)
4,878,302(59.91%)
3,263,884(40.09%)
Flonase® 2,728,716(59.11%)
1,887,408(40.89%)
2,422,427(45.37%)
2,916,940(54.63%)
2,235,745(49.84%)
2,250,501(50.16%)
3,923,959(46.08%)
4,592,233(53.92%)
Nasonex® 1,322,413(57.43%)
980,436(42.57%)
1,819,556(53.04%)
1,610,779(46.96%)
2,728,968(59.76%)
1,837,288(40.24%)
4,024,398(66.68%)
2,011,410(33.32%)
Hismanal® 0(0%)
148,940(100%)
42,347(100%)
0(0%)
-- -- -- --
Seldane® 0(0.0%)
0(0.0%)
-- -- -- -- -- --
16,610,627(52.36%)
13,945,735(45.64%)
18,467,528(52.44%)
16,748,415(47.56%)
21,725,132(55.55%)
17,382,068(44.45%)
24,805,533(53.13%)
21,881,993(46.87%)
Total
30,556,362 35,215,943 39,107,200 46,687,526

492
Number and Percentage of Prescriptions Written for Selected Advertised Antilipemic Drugs by Patient Age Groups, 1994-1997
1994 1995 1996 1997Drug0-44 years
45 years and older
0-44 years
45 yearsand older
0-44 years
45 years and older
0-44 years
45 years and older
Lescol®11,050
(3.87%)274,168(96.13%)
97,795(12.35%)
694,301(87.65%)
0(0.0%)
1,176,155(100.00%)
191,916(7.50%)
2,368,601(92.50%)
Mevacor®107,124(3.25%)
3,191,083(96.75%)
142,079(4.01%)
3,401,803(95.99%)
143,911(3.77%)
3,670,593(96.23%)
124,172(5.06%)
2,332,154(94.94%)
Pravachol®31,589
(2.72%)1,131,716(97.28%)
80,387(4.71%)
1,624,616(95.29%)
63,965(2.33%)
2,683,226(97.67%)
194,015(5.92%)
3,081,564(94.08%)
Zocor®72,453
(5.68%)1,202,179(94.32%)
168,173(6.00%)
2,633,369(94.00%)
389,008(9.92%)
3,531,021(90.08%)
384,426(5.69%)
6,371,785(94.31%)
Lipitor®-- -- -- -- -- -- 299,145
(12.26%)2,141,710(87.74%)
Baycol® -- -- -- -- -- -- -- --222,216(3.69%)
5,799,146(96.31%)
488,434(5.52%)
8,354,089(94.48%)
596,884(5.12%)
11,060,995(94.88%)
1,193,674(6.83%)
16,295,814(93.17%)
Total 6,021,362 8,842,523 11,657,879 17,489,488
Number and Percentage of Prescriptions Written for Selected Advertised Antilipemic Drugs by Patient Age Groups, 1998-2001
1998 1999 2000 2001Drug0-44 years
45 years and older
0-44 years
45 years and older
0-44 years
45 years and older
0-44 years
45 years and older
Lescol®60,684
(2.92%)2,018,745(97.08%)
0(0.0%)
1,174,376(100.00%)
0(0.0%)
1,320,313(100.00%)
127,649(8.28%)
1,414,399(91.72%)
Mevacor®34,804
(1.57%)2,182,673(98.43%)
0(0.0%)
1,067,377(100.00%)
5,873(0.92%)
629,872(99.08%)
0(0.0%)
1,162,461(100.00%)
Pravachol®357,951(7.66%)
4,316,234(92.34%)
309,010(5.77%)
5,042,496(94.23%)
241,527(5.94%)
3,821,542(94.06%)
167,660(3.77%)
4,280,065(96.23%)
Zocor®285,381(4.56%)
5,977,194(95.44%)
323,400(5.30%)
5,779,351(94.70%)
741,265(7.97%)
8,564,855(92.03%)
594,703(5.74%)
9,757,689(94.26%)
Lipitor®841,535(10.86%)
6,909,604(89.14%)
1,002,833(8.21%)
11,209,108(91.79%)
1,863,500(11.34%)
14,565,522(88.66%)
2,047,049(9.74%)
18,975,198(90.26%)
Baycol®65,003
(28.19%)165,559(71.81%)
69,909(17.31%)
333,950(82.69%)
257,120(13.29%)
1,677,650(86.71%)
127,632(9.80%)
1,174,281(90.20%)
1,645,358(7.09%)
21,570,009(92.91%)
1,705,152(6.48%)
24,606,658(93.52%)
3,109,285(9.23%)
30,579,754(90.77%)
3,064,693(7.69%)
36,764,093(92.31%)Total
23,215,367 26,311,810 33,689,039 39,828,786

493
Number and Percentage of Prescriptions Written for Selected Advertised Gastrointestinal Drugs By Patient Age Groups, 1994-1997
1994 1995 1996 1997
Drug 0-4445 years
and older 0-4445 years
and older 0-4445 years
and older 0-4445 years
and older
Zantac®2533927 (31.26%)
5573340 (68.74%)
1826540 (20.16%)
7233883 (79.84%)
1315934 (20.56%)
5085896 (79.44%)
1430332 (22.60%)
4897450 (77.40%)
Propulsid®247960
(21.42%)909905
(78.58%)454604
(29.67%)1077539 (70.33%)
672612 (26.21%)
1893165 (73.79%)
446356 (19.53%)
1839440 (80.47%)
Prilosec® -- --847374
(20.27%)3333096 (79.73%)
1794983 (25.93%)
5126322 (74.07%)
1921272 (24.69%)
5858783 (75.31%)
Prevacid® -- --69128
(25.73%)199531
(74.27%)326485
(29.09%)795855
(70.91%)613984
(23.42%)2008007 (76.58%)
Helidac® -- -- -- -- -- --0
(0.0%)23715
(100.0%)
2,781,887(30.03%)
6,483,245(69.97%)
3,197,646(21.26%)
11,844,049(78.74%)
4,110,014(24.16%)
12,901,238(75.84%)
4,411,944(23.17%)
14,627,395(76.83%)Total
9,265,132 15,041,695 17,011,252 19,039,339
Number and Percentage of Prescriptions Written for Selected Advertised Gastrointestinal Drugs By Patient Age Groups, 1998-2001
1998 1999 2000 2001
Drug 0-4445 years
and older 0-4445 years
and older 0-4445 years
and older 0-4445 years
and older
Zantac®
1,492,195(23.36%)
4,895,323(76.64%)
1,517,290(28.37%)
383,1261(71.63%)
994,076(22.47%)
3,429,489(77.53%)
1,026,565(23.05%)
3,426,842(76.95%)
Propulsid®
461,929(15.45%)
2,527,279(84.55%)
578,966(25.29%)
1,710,403(74.71%)
275,344(44.02%)
350,159(55.98%)
-- --
Prilosec®
1,468,317(15.93%)
7,747,407(84.07%)
1,906,983(16.07%)
9,962,362(83.93%)
2,284,412(21.33%)
8,425,209(78.67%)
1,498,127(13.76%)
9,390,084(86.24%)
Prevacid®
1,163,941(25.13%)
3,468,539(74.87%)
1,865,503(27.00%)
5,042,748(73.00%)
2,816,766(30.28%)
6,484,438(69.72%)
1,758,817(19.48%)
7,269,314(80.52%)
Helidac®
0(0%)
105,446(100.0%)
0(0%)
0(0%)
30,760(100%)
0(0%)
0(0%)
109,810(100.0%)
Lotronex®
-- -- -- -- 104,730(34.96%)
194,806(65.04%)
-- --
4,586,382(19.66%)
18,743,994(80.34%)
5,868,742(22.22%)
20,546,774(77.78%)
5,512,012(22.59%)
18,884,101(77.41%)
4,283,509(17.50%)
20,196,050(82.50%)Total
23,330,376 26,415,516 25,390,189 24,479,559

494
Number and Percentage of Prescriptions Written for Selected Advertised Antidepressants by Patient Age Groups, 1994-1997
1994 1995 1996 1997Drug 0-44
years45 years
and older0-44years
45 years and older
0-44years
45 years and older
0-44years
45 years and older
Wellbutrin®548,077(63.09%)
320,696(36.91%)
344,867(43.46%)
448,585(56.54%)
497,137(57.13%)
373,063(42.87%)
1,324,208(58.15%)
952,830(41.85%)
Prozac®3,272,559(54.64%)
2,716,453(45.36%)
3,025,207(50.47%)
2,969,341(49.53%)
3,652,714(54.79%)
3,013,587(45.21%)
3,717,166(45.33%)
4,482,773(54.67%)
Paxil®1,544,082(50.71%)
1,500,961(49.29%)
1,875,855(51.06%)
1,798,248(48.94%)
1,974,885(46.14%)
2,305,667(53.86%)
2,637,367(38.50%)
4,212,078(61.50%)
Zoloft®2,315,068(48.12%)
2,496,050(51.88%)
2,288,384(40.85%)
3,313,923(59.15%)
2,569,330(43.28%)
3,367,374(56.72%)
2,930,068(38.52%)
4,677,219(61.48%)
Effexor®421,832(63.85%)
238,787(36.15%)
708,465(62.66%)
422,173(37.34%)
621,764(51.61%)
583,029(48.39%)
768,090(37.23%)
1,294,923(62.77%)
Serzone®178,698
(51.43%)168,790(48.57%)
490,857(59.70%)
331,367(40.30%)
1,053,482(67.39%)
509,739(32.61%)
8,101,618(52.69%
7,272,947(47.31%)
8,421,476(48.01%)
9,121,060(51.99%)
9,806,687(49.58%)
9,974,087(50.42%)
12,430,381(43.52%)
16,129,562(56.48%)Total
15,374,565 17,542,536 19,780,774 28,559,943
Number and Percentage of Prescriptions Written for Selected Advertised Antidepressants by Patient Age Groups, 1998-2001
1998 1999 2000 2001Drug 0-44
years45 years
and older0-44years
45 years and older
0-44years
45 years and older
0-44years
45 years and older
Wellbutrin®1,866,869(60.08%)
1,240,678(39.92%)
1,471,035(46.44%)
1,696,740(53.56%)
3,007,162(63.35%)
1,739,703(36.65%)
1,803,233(46.36%
2,086,408(53.64%)
Prozac®4,000,405(49.13%)
4,141,84450.87%
3,683,399(46.59%)
4,221,784(53.41%)
3,271,998(47.74%)
3,581,210(52.26%)
4,498,368(51.31%
4,268,918(48.69%)
Paxil®2,357,034(35.79%)
4,228,46164.21%
3,213,556(41.13%)
4,599,052(58.87%)
3,531,272(42.71%)
4,736,290(57.29%)
4,134,830(41.01%
5,947,246(58.99%)
Zoloft®3,637,191(43.26%)
4,769,80156.74%
3,089,900(37.13%)
5,232,220(62.87%)
3,833,474(41.81%)
5,335,074(58.19%)
4,226,942(43.35%
5,522,765(56.65%)
Effexor®843,230(51.54%)
792,83448.46%
1,393,767(47.62%)
1,533,241(52.38%)
2,165,621(49.20%)
2,236,398(50.80%)
1,631,779(41.24%
2,324,544(58.76%)
Serzone®1,025,646(49.10%)
1,063,11650.90%
973,139(57.42%)
721,724(42.58%)
790,195(42.13%)
1,085,526(57.87%)
995,022(57.30%
741,557(42.70%)
13,730,375(45.82%)
16,236,734(54.18%)
13,824,796(43.43%)
18,004,761(56.57%)
16,599,722(47.01%)
18,714,201(52.99%)
17,290,174(45.28%)
20,891,438(54.72%)
Total 29,967,109 31,829,557 35,313,923 38,181,612

495
Number and Percentage of Prescriptions Written for Selected Advertised Antihypertensive Drugs by Patient Age Groups, 1994-1997
1994 1995 1996 1997Drug
0-44years
45 years and older
0-44years
45 years and older
0-44years
45 years and older
0-44years
45 years and older
Capoten®411,180(13.70%)
2,590,485(86.30%)
87,634(3.42%)
2,471,158(96.58%)
196,573(7.24%)
2,519,515(92.76%)
160,619(8.26%)
1,783,590(91.74%)
Toprol XL®
143,568(30.47%)
327,625(69.53%)
26,851(3.70%)
699,751(96.30%)
231,523(18.03%)
1,052,574(81.97%)
208,700(9.05%)
2,096,147(90.95%)
Altace®235,791(24.78%)
715,618(75.22%)
219,442(16.66%)
1,097,893(83.34%)
119,700(11.90%)
886,202(88.10%)
66,616(11.56%)
509,794(88.44%)
Adalat®0
(0.0%)410,186
(100.00%)315,916(27.38%)
837,699(72.62%)
112,115(7.32%)
1,420,314(92.68%)
303,552(14.73%)
1,757,502(85.27%)
Cardura®64,643
(5.14%)1,193,020(94.86%)
162,982(15.54%)
885,778(84.46%)
235,409(9.55%)
2,229,096(90.45%)
311,439(10.46%)
2,664,975(89.54%)
Cardizem®416,592(5.24%)
7,530,493(94.76%)
398,924(6.31%)
5,920,518(93.69%)
246,223(4.13%)
5,721,431(95.87%)
272,735(6.27%)
4,074,354(93.73%)
Lotensin®96,599
(11.35%)754,812(88.65%)
292,693(20.43%)
1,139,965(79.57%)
179,937(10.00%)
1,619,495(90.00%)
456,462(15.07%)
2,572,261(84.93%)
Coreg® -- -- -- -- -- -- --25,725
(100.0%)1,368,373(10.12%)
13,522,239(90.81%)
1,504,442(11.53%)
13,052,762(89.67%)
1,321,480(8.55%)
15,448,627(92.12%)
1,780,123(11.5%)
15,484,348(89.69%)
Total 14,890,612 14,557,204 16,770,107 17,264,471

496
Number and Percentage of Prescriptions Written for Selected Advertised Antihypertensive Drugs by Patient Age Groups, 1998-2001
1998 1999 2000 2001Drug
0-44years
45 years and older
0-44years
45 years and older
0-44years
45 years and older
0-44years
45 years and older
Capoten®24,857
(1.62%)1,512,467(98.38%)
29,489(2.06%)
1,400,035(97.94%)
0(0.0%)
1,429,231(100.0%)
0(0.0%)
659,435(100.0%)
Toprol XL®
130,898(5.28%)
2,348,315(94.72%)
478,412(14.48%)
2,826,329(85.52%)
249,454(5.27%)
4,482,465(94.73%)
1,059,001(14.13%)
6,437,345(85.87%)
Altace®112,006(10.78%)
927,021(89.22%)
264,372(19.50%)
1,091,255(80.50%)
14,799(2.38%)
606,358(97.62%)
487,760(21.92%)
1,737,543(78.08%)
Adalat®293,609(9.13%)
2,921,655(90.87%)
44,008(2.41%)
1,783,260(97.59%)
18,877(1.09%)
1,712,217(98.91%)
79,209(10.08%)
706,689(89.92%)
Cardura®97,432
(2.65%)3,583,580(97.35%)
171,877(4.59%)
3,576,785(95.41%)
45,957(1.30%)
3,485,523(98.70%)
290,828(11.05%)
2,342,185(88.95%)
Cardizem®259,113(4.26%)
5,820,568(95.74%)
180,486(3.32%)
5,253,622(96.68%)
185,163(4.83%)
3,645,086(95.17%)
330,108(6.89%)
4,461,105(93.11%)
Lotensin®370,536(8.77%)
3,852,721(91.23%)
275,291(10.90%)
2,250,174(89.10%)
284,566(8.68%)
2,993,578(91.32%)
328,235(17.26%)
1,573,415(82.74%)
Coreg®0
(0%)682,013
(100.00%)58,999
(7.75%)702,533(92.25%)
76,505(10.52%)
650,727(89.48%)
179,208(13.69%)
1,130,067(86.31%)
1,288,451(5.95%)
21,648,340(94.38%)
1,502,934(7.96%)
18,883,993(92.63%)
875,321(4.61%)
19,005,185(95.60%)
2,754,349(14.46%)
19,047,784(87.37%)
Total 22,936,791 20,386,927 19,880,506 21,802,133

497
Appendix H
Figures for Percentage of Prescriptions Written for Advertised Allergy Medications,
Antilipemics, Gastrointestinals, Antidepressants, and Antihypertensives By Patient
Age Groups (Less than 25 Years, 25-44 Years, 45-64 Years, 65-74 Years, 75 Years
and Older), 1994-2001

498
Percentage of Prescriptions Written for Advertised Allergy Medications* by Patient Age Groups, 1994-2001
6.6%
9.0%9.3%
6.8%
9.9% 10.0% 7.9%11.4% 14.7% 15.8% 18.9% 19.4%
11.1% 8.1%10.1%10.9%9.3% 8.8%
9.1%
34.6% 35.5% 37.9% 31.8% 30.3% 27.9% 27.6% 27.2%
27.9% 28.4% 30.0%31.0% 29.9%
29.2% 25.3% 32.2%
10.6%13.8%10.5% 11.5%9.4%
6.5% 3.9% 7.7% 7.8%9.1%5.1%4.0%6.1%
0%
20%
40%
60%
80%
100%
1994 1995 1996 1997 1998 1999 2000 2001
Year
Per
cent
Under 15 years 15-24 years 25-44 years
45-64 years 65-74 years 75 years and older
* Claritin®, Allegra®, Zyrtec®, Flonase®, Nasonex®, Hismanal®, Seldane®
Percentage of Prescriptions Written for Advertised Antilipemic Drugs* by Patient Age Groups, 1994-2001
14.8% 19.1% 23.6% 20.0% 18.7% 24.1%17.6% 23.1%
5.0% 4.5% 5.3% 6.5% 6.3% 8.7% 6.9%
40.0% 40.1%34.3%
38.7% 39.9% 41.6%42.5% 42.1%
41.5% 35.3%37.0%
34.6% 34.3% 27.8%30.6%
27.1%
0%
20%
40%
60%
80%
100%
1994 1995 1996 1997 1998 1999 2000 2001
Year
Per
cent
Under 15 years 15-24 years 25-44 years45-64 years 65-74 years over 75 years
* - Baycol®, Lescol®, Lipitor®, Mevacor®, Pravachol®, Zocor®

499
Percentage of Prescriptions Written for Advertised Gastrointestinal Drugs* by Age, 1994-2001
21.9%
17.6%23.6% 21.2% 20.4% 20.2%
23.6%17.9% 20.6% 19.8% 14.6% 18.1% 21.3% 12.2%
29.7%33.0% 31.9% 38.7% 41.4% 36.8% 33.4%
39.2%
22.1%
22.6% 22.7% 20.8% 23.8% 24.5%18.6%
17.2% 18.8%16.2%
0%
20%
40%
60%
80%
100%
1994 1995 1996 1997 1998 1999 2000 2001
Year
Per
cent
Under 15 years 15-24 years 25-44 years 45-64 years 65-74 years 75 years and older
* - Zantac®, Propulsid®, Prilosec®, Prevacid®, Helidac®, Lotronex®
Percentage of Prescriptions Written for Advertised Antidepressants by Patient Age, 1994-2001
7.9% 8.0%
44.5% 40.6% 43.5% 34.3% 39.4% 33.4% 35.5% 35.0%
39.1%
9.1% 11.3% 9.6% 8.7%10.0%
8.5% 8.6% 8.3% 9.4% 11.8%
7.5%5.0%6.7%4.0%6.7%7.4%
31.4% 33.3% 32.2% 34.5% 37.8% 34.9% 32.9%
9.4% 10.1% 9.7%
8.4% 9.1%6.5%
0%
20%
40%
60%
80%
100%
1994 1995 1996 1997 1998 1999 2000 2001
Year
Per
cent
Under 15 years 15-24 years 25-44 years 45-64 years 65-74 years 75 years and older
* - Wellbutrin®, Prozac®, Paxil®, Zoloft®, Effexor®, Serzone®

500
Percentage of Prescriptions Written for Advertised Antihypertensive Drugs* by Patient Age, 1994-2001
7.4% 9.5% 7.6% 8.9%5.1% 6.8% 3.8%
25.8%32.3% 33.5%
26.2% 27.7%32.5% 30.3% 28.6%
11.0%
33.5% 28.7% 30.7%33.6%
37.6% 34.4%36.4%
30.1%
31.5%28.6% 27.8%
29.9% 29.1%25.7% 29.0%
28.6%
0%
20%
40%
60%
80%
100%
1994 1995 1996 1997 1998 1999 2000 2001
Year
Per
cent
Under 15 years 15-24 years 25-44 years 45-64 years 65-74 years 75 years and older
*- Adalat®, Altace®, Capoten®, Cardizem®, Cardura®, Coreg®, Lotensin®, Toprol XL®

501
Appendix I
Tables for Total Prescription Drug Expenditures for Advertised Allergy
Medications, Antilipemics, Gastrointestinals, Antidepressants, and
Antihypertensives, 1994 to 2001

Total Prescription Drug Expenditures for Advertised Allergy medications, 1994 to 2001
Year Hismanal® Seldane® Claritin® Allegra® Zyrtec® Flonase® Nasonex® Total1994 $59,829,361.383 $174,006,492.590 $219,770,055.495 -- -- -- -- $453,605,909.4681995 $41,340,196.000 $142,285,986.560 $318,684,114.800 -- -- $50,834,626.540 -- $553,144,923.9001996 $32,789,715.110 $30,144,938.850 $484,015,294.510 $2,394,366.711 $93,141,260.602 $96,786,709.160 -- $739,272,284.9431997 $54,608,613.375 -- $711,292,102.290 $52,266,765.375 $161,543,351.208 $131,402,128.575 -- $1,111,112,960.8231998 $9,571,926.980 -- $938,030,710.400 $118,483,675.520 $279,959,338.932 $222,497,176.800 $115,718,162.250 $1,684,260,990.8821999 $2,986,564.522 -- $1,086,924,759.840 $183,070,984.624 $265,848,182.754 $277,113,147.300 $178,205,903.250 $1,994,149,542.2902000 -- -- $1,185,338,058.750 $225,935,004.380 $350,844,953.492 $248,695,047.010 $243,130,300.720 $2,253,943,364.3522001 -- -- $1,121,010,936.770 $309,911,229.978 $500,011,642.260 $494,535,269.440 $293,219,552.640 $2,718,688,631.088
Total Prescription Drug Expenditures for Advertised Antilipemics, 1994 to 2001
Year Baycol® Lescol® Lipitor® Mevacor® Pravachol® Zocor® Total1994 -- $9,688,855.460 -- $206,269,865.780 $63,462,940.970 $128,132,381.800 $407,554,044.0101995 -- $27,263,944.320 -- $238,522,335.310 $97,227,796.075 $293,293,431.980 $656,307,507.6851996 -- $43,200,173.150 -- $248,234,188.020 $164,702,342.023 $424,931,143.600 $881,067,846.7931997 -- $99,514,493.205 $134,326,596.873 $171,353,301.760 $204,062,020.542 $732,609,739.785 $1,341,866,152.1651998 $95,959,904.400 $82,594,919.880 $439,799,626.860 $159,370,071.990 $303,789,305.705 $700,782,142.500 $1,782,295,971.3351999 $168,126,501.700 $46,657,958.480 $713,055,234.990 $76,723,058.760 $382,429,321.772 $709,109,152.445 $2,096,101,228.1472000 $863,778,066.500 $55,446,544.435 $960,029,900.570 $47,410,683.375 $310,004,038.562 $1,081,743,388.800 $3,318,412,622.2422001 $660,265,177.950 $68,343,567.360 $1,379,059,403.200 $90,020,979.840 $355,715,702.325 $1,314,132,640.480 $3,867,537,471.155
502

Total Prescription Drug Expenditures for Advertised Gastrointestinals, 1994 to 2001
Year Helidac® Lotronex® Prevacid® Prilosec® Propulsid® Zantac® Total1994 -- -- -- -- $23,904,122.925 $409,214,301.825 $433,118,424.7501995 -- -- $27,349,217.541 $465,704,358.000 $32,760,281.626 $472,048,038.300 $997,861,895.4671996 -- -- $117,739,077.700 $769,164,624.650 $56,062,227.450 $331,806,848.900 $1,274,772,778.7001997 $1,896,369.975 -- $275,151,735.540 $864,869,814.075 $51,780,136.788 $328,190,413.430 $1,521,888,469.8081998 $8,406,155.120 -- $491,987,905.920 $1,060,361,203.440 $69,959,424.032 $342,530,652.750 $1,973,245,341.2621999 -- -- $758,954,271.362 $1,402,007,031.400 $56,000,255.109 $292,405,283.170 $2,509,366,841.0412000 $2,575,073.400 $47,219,154.576 $1,061,360,388.440 $1,302,771,846.545 $18,137,710.491 $244,357,730.600 $2,676,421,904.0522001 $9,188,900.800 -- $1,100,872,237.878 $1,374,201,110.310 -- $252,953,517.600 $2,737,215,766.588
Total Prescription Drug Expenditures for Advertised Antidepressants, 1994 to 2001
Year Effexor® Paxil® Prozac® Serzone® Wellbutrin® Zoloft® Total1994 $21,554,016.113 $167,857,995.375 $390,489,571.412 -- $21,120,740.403 $293,324,242.224 $894,346,565.5271995 $36,725,383.516 $209,791,281.300 $403,109,374.808 $9,500,321.920 $19,862,483.916 $340,244,911.031 $1,019,233,756.4911996 $41,483,432.576 $263,382,364.560 $463,974,549.600 $22,257,603.680 $21,548,762.600 $385,968,873.856 $1,198,615,586.8721997 $75,698,136.009 $439,837,110.675 $613,150,438.725 $48,983,530.035 $61,828,412.814 $509,155,718.910 $1,748,653,347.1681998 $61,545,455.552 $437,079,303.150 $627,523,130.430 $67,456,568.790 $96,399,215.487 $575,324,090.528 $1,865,327,763.9371999 $113,684,990.720 $538,132,439.040 $630,043,085.100 $62,184,523.470 $106,966,258.425 $583,979,804.640 $2,034,991,101.3952000 $182,384,451.208 $594,644,396.850 $557,131,544.360 $73,396,962.730 $162,010,502.450 $663,151,908.292 $2,232,719,765.8902001 $179,411,335.404 $785,797,003.440 $767,575,889.300 $71,755,444.280 $138,848,514.777 $726,723,660.366 $2,670,111,847.567
503

Total Prescription Drug Expenditures for Advertised Antihypertensives, 1994 to 2001
Year Adalat® Altace® Capoten® Cardizem® Cardura® Coreg® Lotensin® Toprol XL® Total
1994 $18,989,560.87 $23,689,132.69 $66,880,097.87 $421,553,123.83 $37,098,543.17 -- $18,504,566.67 $7,266,738.45 $593,981,763.551995 $55,000,902.36 $32,609,310.59 $59,381,885.94 $348,327,643.04 $31,913,766.80 -- $30,929,653.56 $11,544,979.18 $569,708,141.471996 $72,647,861.60 $24,806,549.22 $64,547,831.32 $327,325,821.90 $76,732,363.18 -- $40,078,748.94 $20,884,553.61 $627,023,729.761997 $101,502,787.39 $15,291,580.89 $49,688,149.41 $249,805,469.39 $95,355,375.32 $1,174,577.78 $69,990,759.81 $38,534,736.99 $621,343,436.971998 $164,357,865.15 $28,057,885.11 $40,345,531.06 $361,376,238.64 $119,997,310.19 $32,068,251.26 $104,631,192.18 $44,516,748.63 $895,351,022.211999 $102,294,117.18 $41,838,716.10 $43,293,134.34 $348,489,346.04 $125,220,305.45 $36,842,918.16 $65,010,520.03 $62,010,160.12 $824,999,217.422000 $110,521,696.43 $19,860,252.76 $44,640,601.05 $245,806,229.58 $121,546,478.64 $36,230,698.24 $88,801,642.82 $92,579,995.24 $759,987,594.75
2001 $54,844,677.83 $78,875,864.84 $20,573,712.57 $337,732,604.37 $93,256,054.43 $66,439,159.88 $55,235,325.90 $151,621,094.20 $858,578,494.00
504

505
BIBLIOGRAPHY
. 21 C.F.R. § 202.1(1)(1) (1979).
21 C.F.R. § 314.81(3).
21 U.S.C. § 352(n) {FDCA § 502(n)}.
1994 National Ambulatory Medical Care Survey: Data File Documentation: National
Center for Health Statistics, Centers for Disease Control and Prevention; 1994:1- 2.
1996 National Ambulatory Medical Care Survey: Data File Documentation: National
Center for Health Statistics, Centers for Disease Control and Prevention; 1996:1- 2.
2001 NAMCS Micro- data File Documentation: National Center for Health Statistics,
Centers for Disease Control and Prevention; 2001:28.
2001 NAMCS Micro- data File Documentation: National Center for Health Statistics,
Centers for Disease Control and Prevention; 2001:5-22.
Ambulatory Health Care Data: NAMCS Data Collection and Processing. National Center
for Health Statistics. June 12, 2002. Available at:
http://www.cdc.gov/nchs/about/major/ahcd/impnam97.htm. Accessed August, 2003.
Ambulatory Health Care Data: NAMCS Description. National Center for Health
Statistics. Available at: www.cdc.gov/nchs/about/major/ahcd/namcsdes.htm. Accessed
June, 2002.
Ambulatory Health Care Data: NAMCS Estimation Procedures. National Center for
Health Statistics. May 17, 2001. Available at:
http://www.cdc.gov/nchs/about/major/ahcd/namcs_est_proc.htm. Accessed June, 2002.

506
Ambulatory Health Care Data: NAMCS Scope and Sample Design. National Center for
Health Statistics. Available at: www.cdc.gov/nchs/about/major/ahcd/sampnam.htm.
Accessed August, 2003.
Attitudes and behaviors associated with direct-to-consumer promotion of prescription
drugs. Center for Drug Evaluation and Research, FDA. 1999. Available at:
www.fda.gov/cder/ddmac/research.htm. Accessed November, 2002.
Bitter pill: The rising prices of prescription drugs for older Americans. Families USA.
June 2002. Available at:
http://www.familiesusa.org/site/DocServer/BitterPillreport.pdf?docID=261. Accessed
September, 2004.
The Cable Television Network Service. Description of Methodology. New York:
Competitive Media Reporting; 1999:11-12.
CBS consumer model: A study of attitudes, concerns and information needs for
prescription drugs and related illnesses. New York: CBS Network Television; 1984.
The chain pharmacy industry profile: National Association of Chain Drug Stores; 1999.
Congressional report advises against prescription drug advertising to consumers.
American Pharmacy. January 1985;25(1):18.
Consumers taking control with DTC Rx ads. National Consumers League. January 9,
2003. Available at: www.ncl.org/dtcpr.html. Accessed April, 2003.
Description of Methodology. New York: Competitive Media Reporting; 1999.
Description of Methodology. New York: Competitive Media Reporting; 1999:6-25.
Description of Methodology. New York: Competitive Media Reporting; 1999:15-21.

507
Direct-to-consumer advertisement of prescription drugs: Withdrawal of moratorium.
Federal Register. September 9 1985;50:36677-36678.
Direct-to-consumer promotion: Public hearing. Federal Register. August 16
1995;60(158):42581.
Documentation for SAS Version 8: Alternate autocorrelation correction methods. SAS
Institute, NC. Available at: http://support.sas.com/documentation/onlinedoc/index.html.
Accessed August 2004.
Documentation for SAS Version 8: Overview for mixed models. SAS Institute, NC.
Available at: http://support.sas.com/documentation/onlinedoc/index.html. Accessed
August 2004.
Documentation for SAS Version 8: Regression with autocorrelated errors. SAS Institute,
NC. Available at: http://support.sas.com/documentation/onlinedoc/index.html. Accessed
August 2004.
Drug Topics: Red Book: Thomson Healthcare; 1994-2003.
DTC ads prompted prescriptions for 7.5 million Americans, APhA/Prevention survey
concludes. FDC Reports, The Pink Sheet. October 20 1997;59(42):9-10.
Enough to make you sick: Prescription drug prices for the elderly. Families USA. June
2001. Accessed September, 2004.
Establishing the accountability: A strategic research approach to measuring advertising
effectiveness. Washington DC: Advertising Research Foundation for the Advertising
Council; 1991.
The factors fueling rising healthcare costs. PriceWaterhouseCoopers, prepared for the
American Association of Health Plans. April 2002. Available at:
http://www.aahp.org/InternalLinks/PwCFinalReport.pdf. Accessed November, 2002.

508
FDA Paper: Seldane and Generic Terfenadine Withdrawn from the Market. Food and
Drug Administration. February 27, 1998. Available at:
www.fda.gov/bbs/topics/answers/ans00853.html. Accessed August, 2004.
FDA Talk Paper: Janssen Pharmaceutica Stops Marketing Cisapride in the US. Food and
Drug Administration. March 23, 2000. Available at:
http://www.fda.gov/bbs/topics/ANSWERS/ANS01007.html. Accessed September, 2004.
FDA, Draft guidance for industry: Consumer-directed broadcast advertisements: Food
and Drug Administration, Center for Drug Evaluation and Research; August 1997.
FDCA §. 21 USC § 321(k).
Food and Drug Administration: Determination that Astemizole 10mg Tablets were
Withdrawn from Sale for Safety Reasons. Federal Register. August 23
1999;64(162):45973.
Glaxo Wellcome Decides to Withdraw Lotronex from the Market. Food and Drug
Administration. November 28, 2000. Available at:
http://www.fda.gov/bbs/topics/ANSWERS/ANS01058.html. Accessed September, 2004.
Guidance for industry: Consumer-directed broadcast advertisements: US Department of
Health and Human Services, FDA, Center for Drug Evaluation and Research, Center for
Biologics Evaluation and Research, Center for Veterinary Medicine, DDMAC; August
1999.
Hard to swallow: Rising drug prices for America's senior's. Families USA. November
1999. Available at: http://www.familiesusa.org/site/DocServer/drug.pdf?docID=772.
Accessed September, 2004.
Health Accounts. Centers for Medicare and Medicaid services. Available at:
http://www.cms.gov/statistics/nhe/default.asp. Accessed June, 2003.

509
Health care in America: Trends in utilization. US Department for Health and Human
Services, Centers for Disease Control and Prevention, National Center for Health Care
Statistics. January 2004. Available at: http://www.cdc.gov/nchs/data/misc/healthcare.pdf.
Accessed February, 2004.
Impact of DTC advertising relative to patient compliance. Pfizer, Inc. and RxRemedy,
Inc. June 2001. Available at:
http://www.pfizer.com/are/news_releases/mn_2001_1129_additional.html. Accessed
November, 2002.
IMS Health. Integrated Promotion Service and Competitive Media Reporting. 1996-
2001. Available at: www.imshealth.com. Accessed December, 2002.
International Classification of Diseases, 9th Revision, Clinical Modification. 6th ed: U.S.
Department of Health and Human Services, Centers for Disease Control and Prevention,
Health Care Financing Administration; October 1999.
Kefauver-Harris Act 21. Code of Regulations. Vol 2.2.1; 1962.
MediaWatch® Data Collection. Description of Methodology. New York: Competitive
Media Reporting; 1999:4-5.
Multi-tier co-pays and the chronically ill. Harris Interactive. Available at:
http://www.nacdsfoundation.org/NACDSfoundation/2003/Multi_tier_Co-
Pays_the_Chronically_Ill.pdf. Accessed September, 2003.
National survey of consumer reactions to direct-to-consumer advertising. Emmaus, PA:
Prevention Magazine, Rodale Inc.; 1998.
National survey of consumer reactions to direct-to-consumer advertising. Emmaus, PA:
Prevention Magazine, Rodale Inc.; 1999.

510
National survey on prescription drugs. The News Hour with Jim Lehrer, The Henry
Kaiser Family Foundation, Harvard School of Public Health. September 2000. Available
at: www.kff.org. Accessed January, 2002.
The National Syndicated Television Service. Description of Methodology. New York:
Competitive Media Reporting; 1999:13-14.
Navigating the medical marketplace: How consumers choose. Washington DC:
Prevention Magazine and the American Pharmaceutical Association; 1997.
The Network Television Service. Description of Methodology. New York: Competitive
Media Reporting; 1999:9-10.
Oraflex case seen changing the drug industry. The Wall Street Journal. Vol 76; 1982:33.
Orange Book. Food and Drug Administration. July 2004. Available at:
http://www.fda.gov/cder/ob/default.htm. Accessed September 2004, 2004.
Out of bounds: Rising prescription drug prices for seniors. Families USA. July 2003.
Available at:
http://www.familiesusa.org/site/DocServer/Out_of_Bounds.pdf?docID=1522. Accessed
September, 2004.
Prescription drugs: FDA oversight of direct-to-consumer has limitations: United States
General Accounting Office, Report to Congressional Requesters; October 2002. GAO-
03-177.
Prescription drugs: Little is known about the effects of direct-to-consumer
advertisements: United States General Accounting Office, Report to the Chairman,
Subcommittee on Oversight and Investigations, Committee on Energy and Commerce,
House of Representatives; July 1991. GAO PEMD-91-19.

511
Report to the President: Prescription drug coverage, spending, utilization, and prices.
Department of Health and Human Services. April 2000. Available at:
http://aspe.hhs.gov/health/reports/drugstudy/index.htm. Accessed August, 2001.
Rx-to-consumer advertising debate starts up again. Drug Topics. October 1985;129:20-
21.
SAS. Version 8.0. Cary, NC.
The Spot Television Service. Description of Methodology. New York: Competitive
Media Reporting; 1999:6-8.
SPSS. Version 12.0. Chicago, IL.
Staff report on prescription drug advertising to consumers. United States Congress,
House of Representatives, Subcommittee on Oversight and Investigations of the
Committee on Energy and Commerce. Washington DC: Government Printing Office;
1984.
Still rising: Drug price increases for seniors 1999-2000. Families USA. April 2000.
Available at: http://www.familiesusa.org/site/DocServer/pdrug.pdf?docID=771.
Accessed September, 2004.
Total U.S. promotional spending by type, 2001. IMS Health. 2002. Available at:
www.imshealth.com. Accessed August, 2002.
Trend of the month: Higher utilization and introduction of new drugs cause increased
drug spending. Drug Benefit Trends. 2000;12(7):7-8.
Understanding the effects of direct-to-consumer prescription drug advertising. The Henry
Kaiser Family Foundation. November 2001. Available at: www.kff.org. Accessed
December, 2002.

512
Aiken MM, Smith MC, Juergens JP, et al. Individualized determinants of prescription
drug use among noninstitutionalized elderly. Journal of Pharmacoepidemiology.
1994;3(1):3-25.
Aikin KJ. Direct-consumer advertising of prescription drugs: Physician survey
preliminary results. Division of Drug Marketing, Advertising and Communication, FDA.
January 13, 2003. Available at: www.fda.gov/cder/ddmac/globalsummit2003/sld001.htm.
Accessed January, 2003.
Aikin KJ. Direct-to-consumer advertising of prescription drugs: Preliminary patient
survey results. Division of Drug Marketing, Advertising and Communications, FDA.
April 18, 2002. Available at: www.fda.gov/cder/ddmac/DTCnational2002a/sld001.htm.
Accessed May 2002.
Allison-Ottey A, Ruffin K, Allison K, et al. Assessing the impact of direct -to-consumer
advertisements on the AA patient: A multisite survey of patients during the office visit.
Journal of the National Medical Association. February 2003;95(2):120-131.
Allison-Ottey SD, Ruffin K, Allison KB. "To do no harm": Survey of NMA physicians
regarding perceptions on DTC advertisements. Journal of the National Medical
Association. 2002;94(4):194-202.
Alperstein NM, Peyrot M. Consumer awareness of prescription drug advertising. Journal
of Advertising Research. July/August 1993;33:50-56.
Amonkar MM, Lively BT. Pharmacists' attitudes toward product-specific television
advertising of prescription drugs. Journal of Pharmaceutical Marketing and
Management. 1996;11(2):3-20.
Andrade SE, Gurwitz JH. Drug benefit plans under managed care: To what extent do
older subscribers selecting less drug coverage put themselves at increased risk? Journal
of the American Geriatric Society. 2002;50:178-181.

513
Angel JE. Drug advertisements and prescribing. Lancet. November 23 1996;348:1452-
1453.
Angst J, Merikangas K. The depressive spectrum: Diagnostic classification and course.
Journal of Affective Disorders. 1997;45:31-39.
Arias E. United States, Life tables, 2000. National Vital Statistics Reports. December 19,
2002;51(3):1-39.
Avorn J, Chen M, Hartley R. Scientific versus commercial sources of influence on the
prescribing behavior of physicians. American Journal of Medicine. July 1982;73:4-8.
Bardel A, Wallander M, Svärdsudd K. Reported use of prescription drugs and some of its
determinants among 35 to 65-year-old women in mid-Sweden: A population-based study.
Journal of Clinical Epidemiology. 2000;53:637-643.
Barents Group L. Issue brief: Factors affecting the growth of prescription drugs
expenditures. National Institute for Health Care Management. July, 1999. Available at:
www.nihcm.org. Accessed January, 2001.
Basara LR. The impact of a direct-to-consumer prescription medication advertising
campaign on new prescription volume. Drug Information Journal. 1996;30:715-729.
Baugh DK, Pine PL, Blackwell S. Trends in Medicaid prescription drug utilization and
payments, 1990-1997. Health Care Financing Review. Spring 1999;20(3):79-105.
Baylor-Henry M, Drezin NA. Regulation of prescription drug promotion: Direct-to-
consumer advertising. Clinical Therapeutics. 1998;20(Suppl C):C86-C95.
Bell R, Kravitz RL, Wilkes MS. Direct-to-consumer prescription drug advertising, 1989-
1998: A content analysis of conditions, targets, inducements, and appeals. Journal of
Family Practice. April 2000;49(4):329-335.

514
Bell RA, Kravitz RL, Wilkes MS. Direct-to-consumer prescription drug advertising and
the public. Journal of General Internal Medicine. 1999;14(11):651-657.
Bell RA, Wilkes MS, Kravitz RL. Advertisement-induced prescription drug requests:
Patients' anticipated reactions to a physician who refuses. Journal of Family Practice.
1999;48(6):446-452.
Bell RA, Wilkes MS, Kravitz RL. The educational value of consumer-targeted
prescription drug print advertising. Journal of Family Practice. 2000;49(12):1092-1098.
Berndt ER. The U. S. Pharmaceutical industry: Why major growth in times of cost
containment. Health Affairs. March/April 2001;20(2):100-114.
Bernstein AB, Hing E, Burt CW, et al. Trend data on medical encounters: Tracking a
moving target. Health Affairs. March/April 2001;20(3):58-72.
Bertakis KD, Azari R, Helms LJ, et al. Gender differences in the utilization of health ca re
services. Journal of Family Practice. February 2000;49(2):147-152.
Blazer DG, Kessler RC, McGonagle KA, et al. The prevalence and distribution of major
depression in a national community sample: The National Comorbidity Survey. American
Journal of Psychiatry. 1994;151:979-986.
Bradley LR, Zito JM. Direct-to-consumer prescription drug advertising. Medical Care.
1997;35(1):86-92.
Burak LJ, Damico A. College students' use of widely advertised medications. Journal of
American College Health. November 2000;49(3):118-121.
Burstin HR, Swartz K, O'Neil AC, et al. The effect of change of insurance on access to
care. Inquiry. Winter 1998/99;35:389-397.
Bush PJ, Osterweis M. Pathways to medicine use. Journal of Health and Social
Behavior. June 1978;19(2):179-189.

515
Cain G. A remedy for rising drug costs. Best's Review. March 2002:80.
Calfee JE. Direct-to-consumer advertising of prescription drugs. Subcommittee on
Consumer Affairs, Foreign Commerce, and Tourism, Committee on Commerce, Science,
and Transportation; July 24, 2001:1-8.
Calfee JE, Winston C, Stempski R. Direct-to-consumer advertising and demand for
cholesterol-reducing drugs. Journal of Law and Economics. October 2002;45(2{Part
2}):673-690.
Carey J, Barrett A. Drug prices what's fair? Business Week; December 10, 2001:61-70.
Chen AY, Chang RK. Factors associated with prescription drug expenditures among
children: An analysis of the Medical Expenditure Panel survey. Pediatrics.
2002;109(5):728-732.
Cherry DK, Burt CW, Woodwell DA. National Ambulatory Medical Care Survey: 1999
Summary. National Center for Health Care Statistics/Centers for Disease Control and
Prevention: Advance data report No. 322. July 17, 2001. Available at:
http://www.cdc.gov/nchs/data/ad/ad322.pdf. Accessed December, 2002.
Cherry DK, Burt CW, Woodwell DA. National Ambulatory Medical Care Survey: 2001
Summary. National Center for Health Care Statistics/Centers for Disease Control and
Prevention: Advance data report No. 337. August 11, 2003. Available at:
http://www.cdc.gov/nchs/data/ad/ad337.pdf. Accessed January, 2004.
Christensen TP, Ascione FJ, Bagozzi RP. Understanding how elderly patients process
drug information: A test of theory of information processing. Pharmaceutical Research.
November 1997;14(11):1589-1596.
Cleary PD, Mechanic D, Greenley JR. Sex differences in medical care utilization: An
empirical investigation. Journal of Health and Social Behavior. June 1982;23(2):106-
119.

516
CMS. An overview of the U.S. healthcare system: Two decades of change, 1980-2000.
Centers for Medicare and Medicaid Services (CMS). Available at:
www.cms.gov/charts/healthcaresystem/all.asp. Accessed May, 2003.
Cohen E. Direct-to-the public advertisement of prescription drugs. New England Journal
of Medicine. 1988;318(6):373-376.
Copeland C. Prescription drugs: Issues of cost, coverage, and quality. EBRI Issue Brief.
1999(208):1-21.
Curtis LH, Law AW, Anstrom KJ, et al. The insurance effect on prescription drug
expenditures among the elderly: Findings from the 1997 Medical Expenditure Panel
Survey. Medical Care. 2004;42(5):439-446.
Cutrer CM, Pleil AM. Potential outcomes associated with direct-to-consumer advertising
of prescription drugs: Physicians' perspectives. Journal of Pharmaceutical Marketing and
Management. 1991;5(3):3-19.
Davis JJ. Riskier than we think? The relationship between risk statement completeness
and perceptions of direct to consumer advertised prescription drugs. Journal of Health
Communication. 2000;5(4):349-369.
Davis M, Poisal J, Chulis G, et al. Prescription drug coverage, utilization, and spending
among Medicare beneficiaries. Health Affairs. January- February 1999;18(1):231-243.
Desselle SP, Aparasu R. Attitudinal dimensions that determine pharmacists' decisions to
support DTCA of prescription medication. Drug Information Journal. January-March
2000;34(1):103-114.
Eichner R, Maronick TJ. A review of direct-to-consumer advertising and sales of
prescription drugs: Does DTC advertising increase sales and market share? Journal of
Pharmaceutical Marketing and Management. 2001;13(4):19-42.

517
Eng HJ, Lairson DR. Prescribed medicines: Expenditures and usage patterns for selected
demographic characteristics. Journal of Pharmaceutical Marketing and Management.
1988;3(2):19-36.
Eng HJ, Lee ES. The role of prescription drugs in health care for the elderly. Journal of
Health and Human Resources Administration. Winter 1987;9(3):306-318.
Everett SE. Lay audience response to prescription drug advertising. Journal of
Advertising Research. April/May 1991;31(2):43-49.
Fairman KA. The effect of new and continuing prescription drug use on cost: A
longitudinal analysis of chronic and seasonal utilization. Clinical Therapeutics.
2000;22(5):641-652.
Ferguson JA. Prescribing practices and patient sex differences. Journal of the Royal
Society of Health. April 1990;110(2):45-49, 53.
Fillenbaum GG, Horner RD, Hanlon JT, et al. Factors predict ing change in prescription
and nonprescription drug use in a community-residing black and white elderly
population. Journal of Clinical Epidemiology. 1996;49(5):587-593.
Findlay S. Research Brief: Prescription drugs and mass media advertising. National
Institute for Health Care Management. September, 2000. Available at: www.nihcm.org.
Accessed April, 2001.
Findlay S, Sherman D, Chockley N, et al. Prescription drug expenditures in 2000: The
upward trend continues. The National Institute for Health Care Management. May 2001.
Available at: www.nihcm.org. Accessed December, 2001.
Findlay S, Sherman D, Chockley N, et al. Prescription drugs and mass media advertising,
2000. National Institute for Health Care Management. November 2001. Available at:
www.nihcm.org. Accessed January, 2002.

518
Findlay S, Sherman D, Chockley N, et al. Prescription drug expenditures in 2001:
Another year of escalating costs. National Institute for Health Care Management. April
2002. Available at: www.nihcm.org. Accessed June, 2002.
Findlay SD. Direct-to-consumer promotion of prescription drugs: Economic implications
for patients, payers and providers. Pharmacoeconomics. 2001;19(2):109-119.
Foley LA, Gross DJ. Are consumers well informed about prescription drugs?
Washington DC: AARP Public Policy Institute; April 2000.
Frank R, Berndt ER, Donohue J, et al. Trends in direct-to-consumer advertising of
prescription drugs. The Henry Kaiser Family Foundation. February, 2002. Available at:
www.kff.org. Accessed December, 2002.
Freidman K. IMS health reports: US pharmaceutical promotional spending reached a
record $13.9 billion in 1999. IMS Health. Accessed March, 2000.
Ganther JM, Wiederholt JB, Kreling DH. Measuring patients' medical care preferences:
Care seeking versus self-treating. Medical Decision Making. 2000;21:47-54.
Gencarelli DM. NHPF Issue Brief: Average wholesale price for prescription drugs: Is
there a more appropriate pricing mechanism? The George Washington University:
National Health Policy Forum. June 7, 2002. Available at:
http://www.nhpf.org/pdfs_ib/IB775_AWP_6-7-02.pdf. Accessed November, 2004.
Gianfrancesco FD, Baines AP, Richards D. Utilization effects of prescription drug
benefits in an aging population. Health Care Financing Review. Spring 1994;15(3):113-
126.
Glasgow C, Schommer JC, Gupta K, et al. Promotion of prescription drugs to consumers:
Case study results. Journal of Managed Care Pharmacy. November/December
2002;8(6):512-518.

519
Goldman DP, Joyce GF, Escarce JJ, et al. Pharmacy benefits and use of drugs by the
chronically ill. Journal of the American Medical Association. 2004;291(19):2344-2350.
Gönül FF, Carter B, Wind J. What kind of patients and physicians value direct-to-
consumer advertising of prescription drugs. Health Care Management Science.
2000;3(3):215-226.
Green CA, Pope CR. Gender, psychological factors and the use of medical services: A
longitudinal analysis. Social Science and Medicine. 1999;48:1363-1372.
Hafner-Eaton C. Physician utilization disparities between the uninsured and insured:
Comparisons of the chronically ill, acutely ill, and well non-elderly populations. Journal
of the American Medical Association. February 10, 1993;269(6):787-792.
Health Care Financing Administration (HCFA) Office of the Actuary NHSG. HCFA
website: www.hcfa.gov; January 10, 2000.
Heffler S, Levit K, Smith S, et al. Health spending growth up: Faster growth expected in
the future. Health Affairs. March/April 2001;20(2):193-203.
Helling DK, Lemke JH, Semla TP, et al. Medication use characteristics i n the elderly:
The Iowa 65+ rural health study. Journal of the American Geriatrics Society. 1987;35:4-
12.
Hibbard JH, Pope CR. Another look at sex differences in the use of medical care: Illness
orientation and types of morbidities for which services are used. Women Health.
1986;11:21-36.
Hoen E. Direct-to-consumer advertising: For better profits or for better health. American
Journal of Health-System Pharmacy. 1998;55:594-597.

520
Hoffman JR, Wilkes M. Direct to consumer advertising of prescription drugs: An idea
whose time should not come. British Medical Journal. May 15, 1999;318(7194):1301-
1302.
Hollon M. Direct-to-consumer marketing of prescription drugs. Journal of the American
Medical Association. 1999;281:382-384.
Holmer AF. Direct-to-consumer prescription drug advertising builds bridges between
patients and physicians. Journal of the American Medical Association. 1999;281:380-
382.
Holocombe RF, Griffin J. Effect of insurance status on pain medications in a
hematology/oncology practice. Southern Medical Journal. February 1993;86(2):151-156.
Holtz WE. Consumer-directed prescription drugs advertising: Effects on public health.
Journal of Law and Health. 1998-99;13(2):199-218.
Hong S, Shepherd MD. Outpatient prescription drug use by children enrolled in five drug
benefit plans. Clinical Therapeutics. 1996;18(3):528-545.
Hunt M. Direct-to-consumer advertising of prescription drugs. The George Washington
University, Washington DC: National Health Policy Forum; April 1998.
Hunt MI. Prescription drug costs: Federal regulation of the industry. Blue Cross Blue
Shield Association. September 2000. Available at:
http://bcbshealthissues.com/proactive/newsroom/release.vtml?id=17521. Accessed
November, 2002.
Iizuka T, Jin GZ. The effects of direct-to-consumer advertising in the prescription drug
markets. 2003. Available at: http://www.e.u-
tokyo.ac.jp/cirje/research/workshops/micro/micropaper03/iizuka.pdf. Accessed June,
2004.

521
IMS-Health. Paper presented at: Pharmaceutical Marketing Research Group, March 29,
1999.
Ingram RA. Some comments on direct-to-consumer advertising. Journal of
Pharmaceutical Marketing and Management. 1992;7(1):67-74.
Jones JP. The ultimate secrets of advertising. Thousand Oaks, California: Sage
Publications; 2002:9,10,95,171-174.
Jörgenson T, Johnasson S, Kennerfalk A, et al. Prescription drug use, diagnoses, and
healthcare utilization among the elderly. The Annals of Pharmacotherapy. September
2001;35:1004-1009.
Kasper JA, Wilson R. Use of prescribed medicines: A proxy indicator of access and
health status. International Journal of Health Services. 1983;13(3):433-442.
Kauffman DW, Kelly JP, Rosenberg L, et al. Recent patterns of medication use in the
ambulatory adult population of the United States: The Slone survey. Journal of the
American Medical Association. January 16, 2002;287(3):337-344.
Kessler DA, Pines WL. The federal regulation of drug advertising and promotion.
Journal of the American Medical Association. November 14, 1990;264(18):2409-2415.
Kessler RC. Epidemiology of women and depression. Journal of Affective Disorders.
2003;74:5-13.
Kessler RC, Zhao S, Blazer DG, et al. Prevalence, correlates and course of minor
depression and major depression in the NCS. Journal of Affective Disorders. 1997;45:19-
30.
Koberstein W. Old order meets new markets. Pharmaceutical Executive. September
2000;20(9):76-92.

522
Kopp SW, Sheffet MJ. The effect of direct-to-consumer advertising of prescription drugs
on retail gross margins: Empirical evidence and public policy implications. Journal of
Public Policy and Marketing. Fall 1997;16(2):270-276.
Kotzan L, Carroll NV, Kotzan JA. Influence of age, sex, and race on prescription drug
use among Georgia Medicaid recipients. American Journal of Hospital Pharmacy.
February 1989;46:287-290.
Krause N. Stress, gender, cognitive impairment, and outpatient physician use in later life.
Journals of Gerontology. Series B, Psychological Sciences and Social Sciences. January
1996;51(1):P15-P23.
Kreling DH, Mott DA, Wiederholt JB, et al. Prescription drug trends: A chart book.
Sonderegger Institute and The Henry Kaiser Family Foundation. July 2000. Available at:
http://www.kff.org/content/2000/3019/PharmFinal.pdf. Accessed June 2001.
Kreling DH, Mott DA, Wiederholt JB, et al. Prescription drug trends: A chartbook
update. Sonderegger Research Center and The Henry Kaiser Family Foundation.
November 2001. Available at: www.kff.org. Accessed February, 2002.
Lassila HC, Stoehr GP, Ganguli M, et al. Use of prescription medications in an elderly
rural population: The MoVIES project. The Annals of Pharmacotherapy. 1996;30:589-
595.
Leibowitz A, Manning WG, Newhouse JP. The demand for prescription drugs as a
function of cost-sharing. Social Science and Medicine. 1985;21(10):1063-1069.
Levit K, Smith C, Cowan C, et al. Inflation spurs health spending in 2000. Health Affairs.
January/February 2002;21(1):172-181.
Lillard LA, Rogowski J, Kington R. Insurance coverage for prescription drugs: Effects on
use and expenditures in the Medicare population. Medical Care. 1999;37(9):926-936.

523
Lipsky MS, Taylor CA. The opinions and experiences of family physicians regarding
direct-to-consumer advertising. Journal of Family Practice. 1997;45(6):495-499.
Lipton C. Consumer advertising and pharmaceuticals: A happy marriage? Journal of
Pharmaceutical Marketing and Management. Winter 1986;1(2):23-28.
Littell RC, Henry PR, Ammerman CB. Statistical analysis of repeated measures data
using SAS procedures. Journal of Animal Science. 1998;76:1216-1231.
Littell RC, Milliken GA, Stroup WW, et al. Analysis for Repeated Measures Data. SAS
System for Mixed Models. Cary, North Carolina: BBU Press; 1996:87-134.
Lyles A. Direct marketing of pharmaceutical to consumers. Annual Review of Public
Health. 2002;23:73-91.
Ma J, Stafford RS, Cockburn IM, et al. A statistical analysis of the magnitude and
composition of drug promotion in the United States in 1998. Clinical Therapeutics. May
2003;22(5):1503-1517.
Maddox LM, Katsanis LP. Direct-to-consumer advertising of prescription drugs in
Canada: Its potential effect on patient-physician interaction. Journal of Pharmaceutical
Marketing and Management. 1997;12(1):1-21.
Manning RL, Keith A. The economics of direct-to-consumer advertising of prescription
drugs. Economic Realities in Health Care. 2001;2(1):3-9.
Masson A, Rubin PH. Matching prescription drugs and consumers: The benefits of
direct-to-consumer advertising. New England Journal of Medicine. August 22,
1985;313(8):512-515.
McLemore T, DeLozier J. 1985 Summary: National Ambulatory Medical Care Survey.
National Center for Health Care Statistics/Centers for Disease Control and Prevention:
524
Advance Data Report No. 128. January 28, 1987. Available at:
http://www.cdc.gov/nchs/data/ad/ad128acc.pdf. Accessed January, 2004.
Merlis MA. Explaining the growth in prescription drug spending: A review of recent
studies. Paper presented at: ASPE, Conference on Pharmaceutical Pricing Practices,
Utilization, and Costs, US Department of Health and Human Services, 2000; Washington
DC.
Metge C, Black C, Peterson S, et al. The population use of pharmaceuticals. Medical
Care. 1999;37(Supplement 6):JS42-JS59.
Mindell J, Kemp T. Only two-fifths of advertisements cited published, peer reviewed
references. British Medical Journal. December 13 1997;315:1622.
Mintzes B, Barer ML, Bassett K, et al. An assessment of the health-system impacts of
direct-to-consumer advertising of prescription medications (DTCA): Volume III - Patient
information on medicines Comparative patient/doctor survey in Vancouver and
Sacramento. Center for Health Services and Policy Research. August 2001. Available at:
http://www.chspr.ubc.ca/hpru/pdf/dtca-v3-compsurvey.pdf. Accessed August, 2002.
Momin SR, Larrat EP, Lipson DP, et al. Demographics and cost of pharmaceuticals in a
private third-party prescription program. Journal of Managed Care Pharmacy.
2000;6(5):395-409.
Morris LA, Brinberg D, Klimberg R, et al. The attitudes of consume rs toward direct
advertising of prescription drugs. Public Health Reports. January/February 1986;101:82-
89.
Morris LA, Brinberg D, Plimpton L. Prescription drug information for consumers: An
experiment of source and format. Current Issues in Research in Advertising.
1984;7(1):65-78.

525
Morris LA, Mazis MB, Brinberg D. Risk disclosures in televised prescription drug
advertising to consumers. Journal of Public Policy and Marketing. 1989;8(1):64-80.
Mott DA, Kreling DH. The association of insurance type with costs of dispensed drugs.
Inquiry. Spring 1998;35:23-35.
Mueller C, Schur C, O'Connell J. Prescription drug spending: The impact of age and
chronic disease status. American Journal of Public Health. October 1997;87(10):1626-
1629.
Murphy JF, Hepworth JT. Age and gender differences in health services utilization.
Research in Nursing and Health. August 1996;19(4):323-329.
Mutran E, Ferraro KF. Medical need and use of services among older men and women.
Journal of Gerontology. 1988;43(5):S162-S171.
Nelson C, Knapp D. Medication therapy in ambulatory medical care: National
Ambulatory Medical Care Survey and National Hospital Ambulatory Care Survey, 1992.
Advance Data from Vital Health Statistics, No. 290, Hyattsville, MD. National Center for
Health care Statistics. Available at: www.cdc.gov/nchs/data/ad/ad290.pdf. Accessed
November, 2002.
Neslin S. ROI Analysis of pharmaceutical promotion (RAPP): An independent study.
May 22, 2001. Available at: www.rappstudy.org. Accessed December, 2002.
Novartis. Facts and Figures. East Hanover, NJ: Novartis Pharmaceuticals Corporation
and Emron; 1995-2002 editions.
Ostrom CW. Time Series Analysis: Regression Techniques. Thousand Oaks, California:
Sage Publications.

526
Perri M, Nelson AA, Jr. An exploratory analysis of consumer recognition of direct-to-
consumer advertising of prescription medications. Journal of Health Care Marketing.
1987;7(1):9-17.
Petroshius SM, Titus PA, Hatch KJ. Physician attitudes toward pharmaceutical
advertising. Journal of Advertising Research. November/December 1995;35(6):41-51.
Peyrot M, Alperstein NM, Van Doren D, et al. Direct -to-consumer ads can influence
behavior. Advertising increases consumer knowledge and prescription drug requests.
Marketing Health Services. 1998;18(2):26-32.
Pines WL. Direct-to-consumer promotion: An industry perspective. Clinical
Therapeutics. 1998;20(Suppl C):C96-103.
Pines WL. A history and perspective on direct-to-consumer promotion. Food Drug and
Law Journal. 1999;54:489-518.
Poisal J, Chulis GS. Medicare beneficiaries and drug coverage. Health Affairs.
March/April 2000;19(2):248-256.
Poisal JA, Murray L. Growing differences between Medicare beneficiaries with and
without drug coverage. Health Affairs. March/April 2001;20(2):74-85.
Punjabi SS, Shepherd MD. Pharmacists' perceptions about the impact of direct-to-
consumer advertising of prescription drugs on pharmacy practice [Thesis]: Pharmacy
Administration, University of Texas at Austin; 2000.
Rockwell T. The Lifetime experience with prescription drug advertising exposed to
consumers. Journal of Pharmaceutical Marketing and Management. Winter
1986;1(2):13-18.
Rosen A. A new kind of opportunity. Advertising Age. September 1982;53.

527
Rosenbach ML, Irvin C, Coulam RF. Access for low-income children: Is health insurance
enough? Pediatrics. June 1999;103(6):1167-1174.
Rosenthal MB, Berndt ER, Donohue JM, et al. Promotion of prescription drugs to
consumers. New England Journal of Medicine. 2002;346(7):498-505.
Rosenthal MB, Donohue J, Epstein A, et al. Demand effects of recent changes in
prescription drug promotion. Available at: www.kff.org. Accessed October, 2002.
Roth MS. Patterns in direct-to-consumer prescription drug print advertising and their
public policy implications. Journal of Public Policy and Marketing. Spring
1996;15(1):63-75.
Rothermich EA, Smeenk DA. Health-related quality-of-life claims in prescription drug
advertisements. American Journal of Health-System Pharmacy. July 1 1996;53(13):1565-
1569.
Sachs EA. Health claims in the market place: The future of FDA and the FTC's
regulatory split. Food and Drug Law Journal. 1993;48:268-?
Sayer GP, Britt H. Sex differences in prescribed medications: Another case of
discrimination in general practice. Social Science and Medicine. 1997;45(10):1581-1587.
Schommer JC, Doucette WR, Mehta BH. Rote learning after exposure to a direct-to-
consumer television advertisement for a prescription drug. Clinical Therapeutics.
1998;20(3):617-632.
Schwartz RK, Soumerai SB, Avorn J. Physician motivations for nonscientific drug
prescribing. Social Science and Medicine. 1989;28(6):577-582.
Schwartz TM. Consumer-directed prescription drug advertising and the learned
intermediary rule. Food Drug Cosmetic Law Journal. 1991;46(6):829-848.

528
Sclar DA, Robinson LM, Skaer TL, et al. What factors influence the prescribing of
antidepressant pharmacotherapy? An assessment of national office-based encounters.
International Journal of Psychiatry in Medicine. 1998;28(4):407-419.
Scott-Levin. Patient visits up for DTC conditions. Press Release. November 6, 1998.
Available at: www.scottlevin.com. Accessed January, 2002.
Scott-Levin. Patients visits up for DTC conditions, November 6, 1998.
Scussa F. Consumer ads reach peak. Med Ad News. June 2002;21(6):1-8.
Sharpe T, Smith M, Barbe A. Medicine use among the rural elderly. Journal of Health
and Social Behavior. 1984;26(2):113-127.
Sheffet MJ, Kopp SW. Advertising prescription drugs to the public: Headache or relief.
Journal of Public Policy and Marketing. 1990;9(2):42-62.
Sherr MK, Hoffman DC. Physicians - Gatekeepers to DTC success. Pharmaceutical
Executive. October 1997;17(10):56-66.
Sibley CE. Research report: DTC Advertising studies. Coalition for Healthcare
Communication. August 2001. Available at:
http://www.cohealthcom.org/pages2/dtcadstudies.html. Accessed December, 2002.
Silverman M, Lee PR. Drug Promotion: The Truth, the Whole Truth, and Nothing but the
Truth. Pills Profits and Politics. Los Angeles: University of California Press; 1976:48-80.
Slaughter E. Consumer reaction to DTC advertising of prescription medicines. Emmaus,
PA: Prevention Magazine, Rodale Inc.; 2001/2002.
Slaughter E, Schumacher M. International survey on wellness and consumer reaction to
DTC advertising of Rx drugs. Emmaus, PA: Prevention Magazine, Rodale Inc.;
2000/2001.

529
Smart S, Williams C. Half of drug advertisements in BMJ over six months cited no
supporting evidence. British Medical Journal. December 13, 1997;315:1622-1623.
Smeeding JE. Direct-to-consumer advertising of prescription pharmaceuticals: Strategic
issues for the pharmaceutical industry. Topics in Hospital Pharmacy Management.
1990;10(1):40-64.
Steinberg EP, Gutierrez B, Momani A, et al. Beyond survey data: A claims -based
analysis of drug use and spending by the elderly. Health Affairs. March/April
2000;19(2):198-211.
Stewart RB, Moore MT, May FE, et al. A longitudinal evaluation of drug use in an
ambulatory elderly population. Journal of Clinical Epidemiology. 1991;44(12):1353-
1359.
Stordal E, Mykletun A, Dahl AA. The association between age and depression in the
general population: A multivariate examination. Acta Psychiatrica Scandinavica.
February 2003;107(2):132-141.
Stuart B, Grana J. Ability to pay and the decision to medicate. Medical Care.
1998;36(2):202-211.
Svarstad BL, Cleary PD, Mechanic D, et al. Gender differences in the acquisition of
prescribed drugs an epidemiological study. Medical Care. 1987;25:1089-1098.
Tanouye E. Drug ads spur patients to demand more prescriptions. The Wall Street
Journal. December 22, 1997: B1.
Tenney JB, White KL, Williamson JW. National Ambulatory Medical Care Survey.
National Center for Health Statistics. April 1974;Series 2(61):1-76.
Thomas CP, Ritter G, Wallack SS. Growth in prescription drug spending among insured
adults. Health Affairs. September/October 2001;20(5):265-277.

530
Verbrugge LM. Gender and health: An update on hypothesis and evidence. Journal of
Health and Social Behavior. September 1985;26:156-182.
Wallack SS, Thomas C, Hodgkin D, et al. Recent trends in prescription drug spending for
individuals under 65 and age 65 and older. Schneider Institute for Health Policy.
Available at: http://www.rxhealthvalue.com/docs/research_07302001.pdf. Accessed
October, 2002.
Wan TH, Soifer SJ. Determinants of physician utilization: A causal analysis. Journal of
Health and Social Behavior. June 1974;15(2):100-108.
Wechsler J. Managed care and pharmaceutical costs. Pharmaceutical Executive.
November 1998;18(11):18-22.
Weeks HA. Changes in prescription drug utilization after the introduction of a prepaid
drug insurance program. Journal of the American Pharmaceutical Association. April
1973;NS13(4):205-209.
Weissman JS, Blumenthal D, Silk AJ, et al. Consumer reports on the health effects of
direct-to-consumer drug advertising. Health Affairs - Web Exclusive. February 26
2003:W3-82-W83-95.
Wilkes MS, Bell RA, Kravitz RL. Direct-to-consumer prescription drug advertising:
Trends, impact, and implications. Health Affairs. 2000;19(2):110-128.
Wilkes MS, Doblin BH, Shapiro MF. Pharmaceutical advertisements in leading medical
journals: Experts' assessments. Annals of Internal Medicine. June 1, 1992;116(11):912-
919.
Williams JR, Hensel PJ. Direct-to-consumer advertising of prescription drugs. Journal of
Health Care Marketing. 1995;15(1):35-41.

531
Wind Y. Pharmaceutical advertising: A business school perspective. Archives of Family
Medicine. April 1994;3(4):321-323.
Wolfinger R, Chang M. Comparing the SAS GLM and mixed procedures for repeated
measures. SAS Institute Inc., NC. March 30, 2000. Available at:
http://support.sas.com/rnd/app/papers/mixedglm.pdf. Accessed May 2000.
Woloshin S, Schwartz LM, Tremmel J, et al. Direct -to-consumer advertisements for
prescription drugs: What are Americans being sold? The Lancet. October 6
2001;358:1141-1146.
Wood DL, Hayward RA, Corey CR, et al. Access to medical care for children and
adolescents in the United States. Pediatrics. November 1990;86(5):666-673.
Woodwell DA. National Ambulatory Medical Care Survey: 1998 Summary. Advance
from vital and health statistics, No. 315, Hyattsville, MD: National Center for Health
Care Statistics, 2000. Available at: www.cdc.gov/nchs/products/pubs/pubd/ad/311-
320/311-320.htm#ad315. Accessed November, 2001.
Wosinska ME. The economics of prescription drug advertising [Ph.D Diss]. Berkley,
University of California; 2002.
Zachry III WM, Shepherd MD, Hinich MJ, et al. Relationship between dir ect-to-
consumer advertising and physician diagnosing and prescribing. American Journal of
Health-System Pharmacy. 2002;59(1):42-49.
Zodoroznyj M, Svarstad BL. Gender, employment and medication use. Social Science
and Medicine. 1990;31(9):971-978.

532
Vita
Radhika Anantharaman Nair, the daughter of Tirunallai Anantharaman and
Saraswathi Anantharaman, was born in Mumbai, India on February 8th, 1975. In 1996,
she received her Bachelor of Science degree in Pharmacy from the University of
Mumbai, India. She worked as a Management Trainee in Criticare, India, a manufacturer
of nutritional products. She then joined the graduate program at the University of Toledo
in 1997 and received her Masters degree in Pharmacy Administration in 1999. Later that
year, she was accepted into the graduate program at the University of Texas at Austin.
Permanent Address: 6, Raghuram, Nahur, Mulund (West), Mumbai 400080, India
This dissertation was typed by Radhika Anantharaman Nair


![Anti Dumping Regulations - Radhika[2]](https://img.dokumen.tips/doc/110x75/577d2ea11a28ab4e1eaf92fa/anti-dumping-regulations-radhika2.jpg)


![Tcs radhika sareen [e_doc_find.com]](https://img.dokumen.tips/doc/110x75/545cf27eb0af9f12318b4c2c/tcs-radhika-sareen-edocfindcom.jpg)