Embed Size (px)
Citation preview

Copyright
by
Jeremy Michals Schraw
2016

The Dissertation Committee for Jeremy Michals Schraw Certifies that this is the
approved version of the following dissertation:
The Relationships of Infant and Childhood Diet to Growth and Acute
Lymphoblastic Leukemia
Committee:
Michele Forman, Supervisor
Carmen Sapienza
Jaimie Davis
Michael Daniels
Stefano Tiziani

The Relationships of Infant and Childhood Diet to Growth and Acute
Lymphoblastic Leukemia
by
Jeremy Michals Schraw, B.S.
Dissertation
Presented to the Faculty of the Graduate School of
The University of Texas at Austin
in Partial Fulfillment
of the Requirements
for the Degree of
Doctor of Philosophy
The University of Texas at Austin
December 2016

Dedication
Dedicated to my father, for always encouraging and supporting my education.

v
Acknowledgements
My thanks to Department of Nutritional Sciences and all the past and present
members of the Forman Lab for their help and support.

vi
The Relationships of Infant and Childhood Diet to Growth and Acute
Lymphoblastic Leukemia
Jeremy Michals Schraw, Ph.D.
The University of Texas at Austin, 2016
Supervisor: Michele R. Forman
Diet during infancy and childhood can affect growth, onset of puberty and disease
susceptibility throughout the life course. The goal of this research was to describe the
associations of early life diet (birth – five years of age) with hormone levels and pubertal
development in healthy adolescent females and with the risk of pediatric acute
lymphoblastic leukemia (ALL), the most common form of pediatric cancer, in a
population of boys and girls. Chapter 1 summarizes what is known about the early life
diet and childhood growth, hormone levels and risk of acute lymphoblastic leukemia. It
identifies gaps in the literature which led to the research described in this dissertation.
Chapter 2 discusses findings on the effects of early life diet on serum insulin like growth
factor-1 levels and breast development in healthy adolescent females. Child’s weekly
dairy consumption from 3-5 years was inversely associated with the odds ratio of
thelarche whereas child’s weight and maternal overweight during pregnancy were
positively associated with the odds ratio of thelarche at 10.8 years. Chapter 3 discusses
identification of two novel risk factors for pediatric ALL: longer duration of milk formula
feeding and later introduction of solids foods. Chapter 4 describes research into windows
of susceptibility for solid food introduction in ALL. Compared to children introduced to
solids before 6 months of age, children introduced to solid foods at or after 7 months of

vii
age are at increased odds of ALL with a dose-response relationship between age at
introduction to solids and the odds ratio of ALL. Potential mechanisms for the
associations reported in chapters 3 & 4 are discussed. Chapter 5 details the association of
age- and sex-adjusted height and weight at time of diagnosis with the odds ratio of ALL.
The relationship of height at diagnosis to ALL is unclear, owing in part to inconsistencies
in study methodology. Using a population of matched controls, we report no association
of height at diagnosis with ALL. Children with low weight-for-age or weight-for-height
were at increased odds of ALL. Finally, chapter 6 summarizes these findings and
discusses their public health implications.

viii
Table of Contents
List of Tables ......................................................................................................... xi
List of Figures ...................................................................................................... xiii
Chapter 1: Introduction ...........................................................................................1
Infant diet and childhood growth: Links from early life to disease risk .........1
Putative mechanisms for infant feeding-childhood growth associations ........2
Dietary protein intake and IGF-1 in infants and children ......................2
Rapid growth in infancy predicts higher adiposity in childhood and
adulthood.......................................................................................4
What is known about infant diet and pediatric acute lymphoblastic leukemia5
Insulin like growth factor-1 exposure and risk of pediatric ALL ..........5
Dissertations aims address gaps in the literature ............................................6
Specific aims ...................................................................................................6
Chapter 2: Effects of Infant and Childhood Diet on Pubertal Development in Healthy
Girls.................................................................................................................8
Abstract ...........................................................................................................8
Introduction .....................................................................................................9
Materials and methods ..................................................................................11
Data collection .....................................................................................11
Biospecimen analysis ...........................................................................13
Statistics ...............................................................................................14
IRB approval ........................................................................................15
Results ...........................................................................................................16
Discussion .....................................................................................................25
Conclusions ...................................................................................................29
Acknowledgements .......................................................................................30
Chapter 3: Infant Feeding Patterns are Associated with Pediatric Acute
Lymphoblastic Leukemia..............................................................................31
Abstract .........................................................................................................31

ix
Introduction ...................................................................................................32
Materials and methods ..................................................................................33
Subjects ................................................................................................33
Data collection and ALL diagnosis......................................................34
Statistics ...............................................................................................36
IRB approval ........................................................................................37
Results ...........................................................................................................37
Discussion .....................................................................................................43
Conclusions ...................................................................................................48
Chapter 4: Identification of Vulnerable Ages for the Introduction of Solid Foods in
Pediatric Acute Lymphoblastic Leukemia ....................................................49
Abstract .........................................................................................................49
Introduction ...................................................................................................50
Materials and methods ..................................................................................51
Subjects ................................................................................................51
Statistics ...............................................................................................52
IRB approval ........................................................................................53
Results ...........................................................................................................53
Discussion .....................................................................................................61
Conclusions ...................................................................................................64
Acknowledgements .......................................................................................65
Chapter 5: The Relationships of Childhood Height and Weight to Pediatric Acute
Lymphoblastic Leukemia..............................................................................66
Abstract .........................................................................................................66
Introduction ...................................................................................................67
Materials and methods ..................................................................................69
Subjects ................................................................................................69
Statistics ...............................................................................................70
IRB approval ........................................................................................71
Results ...........................................................................................................72

x
Discussion .....................................................................................................81
Conclusions ...................................................................................................84
Chapter 6: Conclusions ..........................................................................................85
Infant feeding patterns, childhood diet and pubertal development in girls...85
infant feeding patterns, childhood anthropometrics and pediatric ALL .......87
Public health implications .............................................................................88
Future directions ...........................................................................................91
The gut microbiome, immune system and risk of ALL .......................91
Pooled analysis of infant feeding data .................................................95
Appendix A: Case-Control Consent Form .............................................................98
Appendix B: Texas-Oklahoma Pediatric Neuro-oncology Consortium Case-Control
Questionnaire ..............................................................................................114
References ............................................................................................................146

xi
List of Tables
Table 2.1 Birth characteristics of the study sample ...............................................17
Table 2.2 Follow-up characteristics of children at 10.8 and 12.9 years ................19
Table 2.3 Unadjusted and adjusted odds ratios for thelarche at 10.8 years by infant
feeding practices, age at introduction to solids and childhood diet ..22
Table 2.4 Unadjusted and adjusted odds ratios for thelarche at 10.8 years among
exclusively breastfed girls.................................................................24
Table 3.1 Demographics and birth characteristics of ALL patients and controls ..38
Table 3.2 Mean duration of infant feeding practices and age at introduction to solids
among cases and controls..................................................................40
Table 3.3 Multivariable logistic regression models for the odds ratio and 95%
confidence interval of ALL by infant feeding practices and selected
covariates. .........................................................................................42
Table 4.1 Characteristics of cases and controls .....................................................55
Table 4.2 Infant feeding practices by case-control status ......................................56
Table 4.3 Multivariable logistic regression models for the OR and 95% CI of ALL by
age at introduction to solids ..............................................................58
Table 4.4 Multivariable logistic regression models for the OR and 95% CI of ALL by
age at introduction to solids among incident cases ...........................60
Table 5.1 Characteristics of cases and controls .....................................................73
Table 5.2 Height-for-Age, Weight-for-Age and Weight-for-Height Z scores (Mean ±
SD) of cases and controls ..................................................................75
Table 5.3 Multivariable logistic regression models of Height-for-Age and Weight-for-
Height Z scores on the odds ratio of ALL ........................................77

xii
Table 5.4 Multivariable logistic regression models of Height-for-Age and Weight-for-
Age Z scores on the odds ratio of ALL.............................................78
Table 5.5 Multivariable logistic regression models of Height-for-Age and Weight-for-
Height category on the odds ratio of ALL ........................................79
Table 5.6 Multivariable logistic regression models of Height-for-Age and Weight-for-
Age category on the odds ratio of ALL ............................................80

xiii
List of Figures
Figure 5.1 Distributions of Height-for-Age, Weight-for-Age and Weight-for-Height Z
scores among cases (blue) and controls (red) ...................................76

1
Chapter 1: Introduction
INFANT DIET AND CHILDHOOD GROWTH: LINKS FROM EARLY LIFE TO DISEASE RISK
It is now understood that growth in utero as well as in infancy and early
childhood are determinants of lifetime weight status, hormone levels and health
outcomes. Infants who are born premature, low birthweight (< 2,500 grams) of small-
for-gestational-age (weight below the 10th percentile adjusted for gestational age) are at
risk of acute complications, developmental delays and cardiovascular disease in
adulthood1. Indeed, the association of low birthweight with cardiovascular disease is
even evident in the offspring of women who were themselves low birthweight1.
Macrosomia or high birthweight (> 4,000 grams) also carries an increased risk of
cardiovascular disease in later life1 as well as of pediatric acute lymphoblastic leukemia
(ALL) and other forms of pediatric cancers2-5
. These risks may be compounded by
‘catch-up growth’, a period of rapid growth in early life following abnormal fetal
growth1,6
. It is clear therefore that growth both in utero and in early life is influential in
establishing one’s lifelong disease risk.
Infant nutrition exerts a powerful influence on early life growth and development.
A large body of research has demonstrated that exclusively breastfed infants gain weight
less rapidly during the first year of life than do exclusively formula-fed infants6-21
. This
difference may be explained by the lower mean calorie and protein content of breastmilk
relative to commercial milk formula12,19,22-24
, the presence of bioactive compounds like
leptin, adiponectin and human milk oligosaccharides (HMOs) in breastmilk25-28
and the
greater role of the infant in determining satiety during breastfeeding as compared to
bottle feeding17,29,30
. Breastfeeding also attenuates the association of high birthweight
with rapid growth in infancy and confers protection against later life obesity14,15,24,31-34
.

2
As a child transitions from breastmilk or infant formula to a diet of solid foods,
dietary protein content remains important in growth and development. Higher intakes of
milk and animal protein during childhood have been associated with more rapid growth
during childhood12,35-37
. The biological mechanisms by which milk formula and animal
protein intakes increase growth in early life are discussed in the following section.
These mechanisms are also implicated in the etiologies of pediatric ALL and earlier onset
of puberty, the two principal outcomes of this research.
PUTATIVE MECHANISMS FOR INFANT FEEDING-CHILDHOOD GROWTH ASSOCIATIONS
Dietary protein intake and IGF-1 in infants and children
Commercial, cow’s milk-based infant formulas and cow’s milk have higher
protein and calorie content on average than breastmilk23,38
. In infants, dietary protein
intake is a determinant of serum insulin-like growth factor 1 (IGF-1)20,23,36,39
. Several
studies of infant feeding practices have compared IGF-1 levels among breast- and
formula-fed infants. In general, serum IGF-1 levels are higher among infants fed milk
formula or cow’s milk than among infants fed breastmilk19,20,23,36
.
A randomized clinical trial which assigned infants to a low-protein formula, high-
protein formula or breastfeeding reported a median free IGF-1 level among infants in the
high protein arm which was twice as high as infants in the breastmilk arm (0.60 ng/mL
vs. 0.31 ng/mL)23
. IGF-1 levels were positively associated with weight gain up to 6
months of age in this study. A prospective cohort study of infant feeding, IGF-1 levels
and growth demonstrated lower weight and body mass index (BMI) Z scores among
breastfed as compared to not breastfed infants at 9 and 18 months of age. The authors
identified negative dose-response relationships between number of breastfeeding
episodes per day and total daily protein intake, serum total IGF-1 and the molar ratio of
3
serum IGF-1 to insulin-like growth factor binding protein 3 (IGFBP-3), which is
considered a marker of bioavailable IGF-1 levels. The median serum total IGF-1 level
was 50% lower among infants breastfed six or more times per day than among infants
who were not breastfed (25.6 ng/mL vs. 51.6 ng/mL, p <0.001). The median IGF-
1/IGFBP-3 molar ratio was 30% lower among infants breastfed six or more times per day
than those who were not breastfed (p < 0.005)19
. Animal protein intake in children has
also been associated with higher IGF-1 levels in children between 1-6 years of age, as
well as with subsequent weight and length gain and body fatness12,36
.
One study examined IGF-1 levels in expressed breastmilk in connection with
growth of infants27
. The authors reported that breastmilk from mothers of infants with
high weight gain (> 1,000 g/mo) contained higher IGF-1 levels at 1, 2 and 3 months of
age than breastmilk from mothers of infants of the same age with low (< 500 g/mo) or
normal weight gain (500 - 1,000 g/mo). At 3 months, breastmilk of mothers whose
infants experienced high weight gain had a mean IGF-1 level of 12.20 ng/mL compared
to 3.15 ng/mL in breastmilk of mothers whose infants experienced low weight gain (p <
0.05).
IGF-1 is a member of a class of hormones known as somatomedins, which are
anabolic and promote cell growth and division40
. In infants and children this is
manifested as weight gain and linear growth41,42
. Higher serum IGF-1 levels in infancy
predict more rapid growth, especially gains in length and height20,36
. These findings led
to the development of the hypothesis that milk formula, cow’s milk and early life animal
protein intake accelerate growth trajectory by increasing serum total and bioavailable
IGF-1 levels.

4
Rapid growth in infancy predicts higher adiposity in childhood and adulthood
Longitudinal studies of growth during infancy and childhood suggest that greater
gains in length and fat-free mass during the first year of life predict higher adiposity later
in childhood and in adulthood6,43
. Exclusive breastfeeding duration ≥ 6 months is
associated with shorter length during the first year of life and demonstrates protective
effects against obesity which are evident as early as 2 years of age and continuing into
adulthood7,9,31,44
. In addition, one study followed children who were randomized to
receive supplemental cow’s milk or not until a mean age of 25 years. At follow-up,
adults who had received supplemental milk as children had lower mean serum IGF-1
concentrations (-8.5 ng/mL compared to the control group, p = 0.01). The authors
concluded that early life IGF-1 levels program adult IGF-1 levels in an inverse fashion45
.
These data suggest that weight and length gain in the first year of life program
adiposity and hormone levels throughout the life course. This relationship has important
public health implications. For example, it is known that overweight or obese girls
experience menarche earlier than their leaner peers46
. This association is likely explained
in part by programming of hormone levels and body weight by infant and childhood diet.
It has been demonstrated that longer breastfeeding during infancy may delay the onset of
menarche47,48
and that serum IGF-1 levels are higher among girls who experience earlier
or precocious puberty49,50
. A meta-analysis of 117 studies on breast cancer risk
concluded that every year younger at age of menarche increased the relative risk of breast
cancer by 5%51
. As of September 1, 2016 the Surveillance Epidemiology and End
Results group at the National Cancer Institute estimates 246,000 incident cases of breast
cancer will be diagnosed in the United States for the year 201652
. Thus, declines in mean
age at menarche will have non-trivial consequences for chronic disease burden in the
United States. In Chapter 2 I describe research on the relationships of infant and

5
childhood diet to the onset of thelarche (breast development) in a longitudinal study of
healthy Norwegian girls.
WHAT IS KNOWN ABOUT INFANT DIET AND PEDIATRIC ACUTE LYMPHOBLASTIC
LEUKEMIA
Insulin like growth factor-1 exposure and risk of pediatric ALL
Chapters 3, 4 and 5 discuss the associations of infant diet and childhood
anthropometrics with pediatric ALL. ALL arises from rapid and aberrant replication of B
or T cell populations53
. There are few known risk factors for ALL; specifically, trisomy
21 and ionizing radiation have been causally linked to ALL53,54
. High birthweight and
large-for-gestational-age have been reported to increase the risk of ALL2,5,55
. Birthweight
is positively associated with IGF-1 levels in umbilical cord blood56-59
. This hypothesis
has been put forward to explain the higher risk of ALL among those born high
birthweight or large-for-gestational-age60
.
IGF-1 regulates lymphopoiesis, the differentiation of multipotent hematopoietic
stem cells into mature lymphoid cells61-63
. In vitro research has demonstrated that IGF-1
increases the numbers of CD34+CD38+CD10+ lymphoid progenitor cells61
. These cells
are precursors for the pre-B, B and T cells which are affected by ALL53
. Higher
cumulative exposure to IGF-1 may lead to an increase in the number of cells at risk of
malignant transformation in ALL60
.
Several lines of evidence suggest the involvement of IGF-1 and other
somatomedins in leukemogenesis. Baier et. al. reported high numbers of high affinity
IGF-1 receptors expressed in T cell and pre-B cell ALL cell lines64
. Another group
identified autocrine expression of IGF-1 in leukemias driven by the t(9;22)(q34.1;q11.2)
fusion gene (“Philadelphia chromosome”) and found that inhibition of IGF-1 decreased

6
proliferation and increased apoptosis65
. Badr et. al. reported higher serum IGF-1 levels
among incident ALL cases than among age- and gender-matched controls (mean of 454.9
ng/mL in cases compared to 99.3 ng/mL in controls; p < 0.001)66
. Other authors have
reported alterations in IGF-1 and IGFBP-3 levels in serum or bone marrow of leukemia
patients, which have been summarized in a review article67
. The observations that
formula feeding is associated with higher serum IGF-1 levels and that higher serum IGF-
1 levels may increase the risk of pediatric ALL led to the development of specific aims 2-
4 of this dissertation.
DISSERTATIONS AIMS ADDRESS GAPS IN THE LITERATURE
The literature provides considerable evidence for possible relationships of
formula feeding with ALL and pubertal development as well as of formula feeding and
age at introduction to solids with ALL. Despite this, nutritional epidemiology has not
investigated these topics extensively. In particular, only one previous study has
investigated the association of milk supplementation with risk of ALL68
; no studies have
investigated the effect of timing of introduction to solid foods on ALL, and little has been
done to characterize the relationship of infant and childhood diet with anthropometrics
and hormone levels in adolescents and adults45
. The above referenced research and gaps
in our current understanding of infant feeding and disease outcomes led to the
development of 4 specific aims for this dissertation.
SPECIFIC AIMS
Specific aim 1 is to determine whether infant feeding practices and milk and
animal protein intake from 3-5 years are associated with serum IGF-1 at 10.8 years and
with the odds ratio of thelarche at 10.8 years and Tanner breast stage 3 or above at 12.9
years in girls.

7
Specific aim 2 is to determine whether longer cow’s milk formula feeding is
associated with the odds ratio of pediatric acute lymphoblastic leukemia.
Specific aim 3 is to determine whether later age at introduction to solid foods is
positively associated with pediatric ALL.
Specific aim 4 is to determine whether height-for-age, weight-for-age and
weight-for-height at time of diagnosis/interview are associated with pediatric ALL.

8
Chapter 2: Effects of Infant and Childhood Diet on Pubertal
Development in Healthy Girls
This section was published as “Schraw JM, Ogland B, Dong YQ, Nilsen ST,
Forman MR. In utero preeclampsia exposure, milk intake and pubertal development.
Reproductive toxicology (Elmsford, N.Y.). Dec 12 2014.”69
Jeremy Schraw drafted the
manuscript and conducted statistical analyses. Bjorn Ogland collected data, translated
study documents into English and revised the manuscript. Yongquan Dong maintained
and provided data and reviewed the statistical analyses. Stein Tore Nilsen and Michele
Robin Forman designed the study, collected data and revised the manuscript.
ABSTRACT
Cord blood insulin-like growth factor-1 (IGF-1) concentrations are lower in
preeclamptic (PE) than normotensive (NT) pregnancies. PE offspring have increased risk
of cardiovascular disease and decreased risk of some cancers including breast. We
examined the effects of PE exposure in utero, infant feeding and childhood diet at 3-5
years on IGF-1 and breast development in 194 female offspring who were followed from
birth until follow-ups at 10.8 and 12.9 years. Diet was not associated with serum IGF-1
levels at 10.8 years. PE exposure was associated with reduced odds of thelarche at 10.8
years only among exclusively breastfed girls. Milk, butter and ice cream consumption at
3-5 years was inversely related to the OR of breast development at 10.8 years. Child’s
weight and maternal overweight were positively associated with breast development at

9
10.8 years; child’s height and weight were positively associated with breast development
at 12.9 years.
Keywords: preeclampsia, infant feeding, childhood diet, dairy consumption, breast
development, puberty, developmental programming
INTRODUCTION
Preeclampsia (PE) is a pregnancy disorder characterized by inadequate
development of the spiral arteries that supply blood to the placenta and maternal
hypertension and proteinuria70
. Maternal serum androgen levels, notably testosterone and
androstenedione, are elevated in PE pregnancies while cord blood insulin-like growth
factor 1 (IGF-1) concentrations are reduced57,71-79
. Beyond the immediate risks PE
pregnancies pose to the mother and neonate, their androgenic nature has been
hypothesized to affect chronic disease risk in both80,81
. Indeed, offspring of PE
pregnancies are at increased risk of cardiovascular disease but decreased risk of breast
and prostate cancers82-86
. PE mothers are at decreased risk of breast cancer and the
reduction in risk is larger if the offspring of the index pregnancy is male (relative risk
0.79, 95% CI 0.60 – 0.90)80,83,84
. If the unique hormonal milieu of PE pregnancies causes
developmental programming in offspring and reprogramming in mothers resulting in

10
long-term changes to the hormonal profile, it is possible that these changes may
contribute to the observed incidence rates of chronic diseases among PE mothers and
offspring.
Diet in infancy and childhood impacts serum hormone levels and adult chronic
disease risk. In particular cow’s milk and cow’s milk formula consumption are directly
associated with higher serum IGF-1 concentrations and risk of obesity and may cause
reprogramming of adult IGF-1 concentrations14,87
. Research on the relationships between
infant feeding, childhood diet and age at onset of puberty, an intermediate marker for
adult chronic disease, has been inconsistent. Neither the effects of diet on pubertal timing
or the ages at which children are susceptible to dietary programming effects on pubertal
timing are well understood88
. Further, these studies have focused on age at menarche and
peak height velocity, used incomparable methodologies and have not explored
associations of infant feeding practices with more proximal events like onset of thelarche
(breast development). The objectives of this study were to compare serum IGF-1 levels
and breast development at 10.8 years in girls according to PE exposure in utero, infant
feeding practices (breast and milk formula feeding, age at introduction to solid foods) and
childhood milk, butter and ice cream and animal protein intake. We hypothesized that PE
children would have lower IGF-1 levels than NT children at 10.8 years and that infancy
and childhood milk and animal protein intake would be negatively associated with serum
IGF-1 at 10.8 years. We use a life-course approach to address in utero, infant and
childhood exposures on IGF-1 concentrations and breast development in early puberty in
an effort to identify early exposures related to chronic disease.

11
MATERIALS AND METHODS
Data collection
Umbilical cord blood samples and demographic data were collected from
participants in a prospective study of births at Rogaland Central Hospital in Stavanger,
Norway between January 1993 and December 1995. Preeclamptic (PE) women were
identified from among mothers who delivered at the hospital during this time as
described previously57
. Briefly, inclusion criteria for PE mothers were a diagnosis of PE
during the index pregnancy, a live birth event at Rogaland Central Hospital during 1993 –
1995, Norwegian residency, mentally competent and not treated with chemotherapy or
radiotherapy during the prior year. PE was diagnosed based on blood pressure and
proteinuria levels from mid-pregnancy on and further classified as mild, moderate or
severe according to the CLASP criteria as specified previously70,89
. Two normotensive
(NT) women who delivered at the hospital during the study period were matched to each
case of PE; one who delivered a child of the same sex on the same day and a second on
the basis of maternal age.
Participants were invited to follow-up studies at 10.8 and 12.9 years. 288 mother-
daughter dyads participated in the first follow-up, of which 180 of the index pregnancies
were NT and 108 were PE. Of these, 194 pairs (119 NT, 75 PE) returned and provided
data at 12.9 years. Anthropometrics were measured and Tanner breast stage was assessed
using palpation by trained pediatric research nurses according to protocols described
12
previously90
. Tanner stage was recorded as 1-5 and nurses were blind to the PE status of
the participating children.
Mothers completed a questionnaire to assess child and maternal health through
the life course and daughter’s diet during infancy and childhood. Regarding maternal
exposures, data were collected on maternal employment and physical activity, smoking,
alcohol, coffee and tea drinking, anthropometrics, family history of disease and mother’s
health conditions. Maternal weight was categorized as normal weight (BMI 18.5 –
24.99), overweight (BMI 25 – 29.99) or obese (BMI 30 or above). Mothers were asked
whether they breastfed the index child and for how long, whether they fed infant formula,
its type and the ages at which the child received formula and when the child began
receiving solids and cow’s milk. Mothers completed a semi-quantitative food frequency
questionnaire of child’s diet from 3-5 years of age originally derived from the Mother’s
Cohort of the Nurse’s Health Study II91
. Pre-pregnancy weight, pregnancy weight gain,
mode of delivery, infant birthweight and birth length, child’s medication use, history of
infection and history of hospitalization were abstracted from medical records using the
unique identifying number provided at birth by the Norwegian government.
Diet was examined in chronological order using data from infancy and then
childhood. Breastfeeding and formula feeding duration and age at introduction of solids
were reported in 3 month increments except for the first week of life i.e. < 1 week, 1
week - 3 months, 3 - 6 months, 6 - 9 months or > 9 months. Children who were breastfed
for < 1 week were considered exclusively formula fed. Few parents reported introducing
solids before 3 months or after 9 months (n = 2 for each) so only the effects of

13
introducing solids at 3 -6 months and 6 – 9 months were considered. How frequently the
child consumed animal and dairy proteins was assessed using a food frequency
questionnaire. Parents reported child’s dietary intake from the ages of 3-5 years
according to the following categories: never, 1-3 times per month, 1 time per week, 2-4
times per week or 5 or more times per week. The questionnaire asked mothers to report
how often the child consumed the following animal foods from 3-5 years: eggs, hot dogs
and sausage, lunch and deli meats, minced meats, pork, beef, lamb, chicken, turkey, fish
and seafood and liver. Child’s frequency of animal protein consumption per week was
computed by assigning a numerical score equal to the median of the frequency category
to each response and taking the sum of these scores across all categories of animal foods.
“Never” was assigned a value of 0 and “5 or more times per week” was assigned a value
of 5. The same procedure was followed to compute the number of times per week that
the index child consumed milk, ice cream and butter. Data were not collected on cheese
or yogurt consumption so these data could not be included in the estimate of total dairy
consumption. In sensitivity analyses, the weekly frequency of milk intake reported
according to the same categories as the abovementioned foods replaced the weekly
frequency of dairy consumption.
Biospecimen analysis
Overnight fasting blood samples were collected in heparinized tubes from
children at follow-up. Blood samples were immediately frozen at -80o
C and stored at
Stavanger University Hospital. Blood samples were shipped to Esoterix Laboratory,

14
LLC (Calabasas Hills, California) for analysis of insulin like growth factor-1 (IGF-1) by
radioimmunoassay and high performance liquid chromatography-mass spectrometry.
Limits of detection were 15 ng/mL for IGF-1. The Intra-assay coefficient of variation
was 10.6%.
Statistics
Tests for differences in the means of continuous variables between PE and NT
girls were computed using the Student’s t tests. χ2 or likelihood ratio tests were used to
test for differences in proportions of girls classified by Tanner breast stages, by infant
feeding patterns and by PE status. Descriptive data were presented as proportions and
means ± standard errors except for cord blood levels of IGF binding proteins which were
non-normally distributed and for which medians ± interquartile ranges were reported.
Serum IGF-1 levels were natural-log transformed in subsequent analysis to reduce
skewness and normalize their distributions.
Linear regression models were computed to model the natural log of serum IGF-1
levels (the dependent variable) with the following independent variables: PE status,
duration of breastfeeding, age at introduction of formula, age at introduction of solids,
frequency of childhood milk and animal protein consumption, Tanner breast stage, and
maternal body mass index. PE status, Tanner stage, duration of breastfeeding, age at
introduction to formula and age at introduction to solids were treated as fixed effects.
Height, weight, maternal body mass index, average total weekly frequency of milk, butter

15
and ice cream consumption and average total weekly frequency of animal protein
consumption were treated as continuous variables.
Multiple logistic regression analysis was used to model the odds ratio (OR) and
95% confidence interval of thelarche (dependent variable, breast development defined as
Tanner breast stage 2+ versus Tanner breast stage 1) in girls at 10.8 years and the OR of
being classified as Tanner 3 or above at 12.9 years using the same predictors. Child’s
age was not included in the models because by design there was minimal variation in the
ages of children at follow-up (table 2). PE status was not associated with the natural log
of serum IGF-1 at follow-up or with height and weight and there was no evidence of
interaction between PE status and any dietary variables (data not shown). Therefore
main effects models were run including all PE and NT children simultaneously.
All statistical procedures were computed in IBM SPSS version 21 (© 2012, IBM,
Armonk, New York). P-values < 0.05 were considered significant. Adjustments for
multiple comparisons were made during post-hoc testing to maintain an α level of 0.05
for the entire set of tests. The method of correction was determined by the statistical
procedure and the distribution of the data. When data were natural log-transformed for
analysis, results were back-transformed for presentation.
IRB approval
This study was approved by the Regional Committee for Ethics in Medical
Research, the Norwegian Data Inspectorate and The University of Texas at Austin (IRB
number 2014-04-0036).

16
RESULTS
Table 2.1 lists birth characteristics, levels of cord blood analytes and infant
feeding practices among study participants. PE mothers were younger on average than
normotensive mothers (p < 0.001). PE girls had lower birthweight, birth length and cord
blood IGF-1 concentrations as well as shorter gestational length than their sex-matched
NT controls. Neither the proportion of mothers who reported ever breastfeeding,
exclusive breastfeeding, ever formula feeding nor the duration of infant feeding practices
varied by PE status. Similarly there were no differences in the ages at which children
started and stopped receiving infant formula, began receiving solid foods and began
receiving cow’s milk by sex and PE status (data not shown). There were no differences
observed in baseline maternal or birth characteristics between those who consented to
participate at first follow-up and those who did not92
.

17
Table 2.1 Birth characteristics of the study sample
Means ± standard errors
Birth Characteristics Normotensive girls
(n=180)
Preeclamptic girls
(n=108)
p-value, girls
(NT vs. PE)
Maternal age (yr) 28.7 ± 5.3 27.5 ± 4.8 0.01
Gestation length (d) 280.6 ± 10.9 264.5 ± 22.6 <0.001
Birthweight (g) 3517.3 ± 36.9 3026.8 ± 81.6 <0.001
Birth length (cm) 49.5 ± 0.1 47.1 ± 0.6 <0.001
Cord blood
Cord IGF-1 (ng/mL) 66.4 ± 2.0 57.2 ± 3.2 0.01
Cord IGFBP-1 (ng/mL) 95.2 ±39. 61 96.0 ± 141.7
1 0.37
2
Cord IGFBP-3 (ng/mL) 1357.4 ± 506.0 1296.9 ± 560.6 0.292
Infant feeding Proportions
% Ever breastfed 93.9 90.7 0.16
% Exclusively breastfed 53.9 52.8 0.48
% Ever fed formula 43.9 44.4 0.93
1. Data are non-normally distributed. Medians and interquartile ranges are reported.
2. P-value derived from Kruskall-Wallis Test rather than t test; post-hoc p-values computed by
Mann-Whitney U Test with Bonferroni adjustment.

18
Table 2.2 lists follow-up characteristics of the study sample. There were no
differences in anthropometric measurements at follow-up, infant feeding practices or
childhood dietary variables between those lost to follow-up at 12.9 years and those who
completed both visits except that there was a marginally significant difference in the
likelihood of exclusive breastfeeding (46.8% exclusively breastfed and 48.9% fed both
breast milk and formula among those lost to follow up vs. 56.7% and 35.1% among those
who participated, p = 0.06).

19
Table 2.2 Follow-up characteristics of children at 10.8 and 12.9 years
10.8 years (Mean ± S.E.) 12.9 years (Mean ± S.E.)
Normotensive
girls (n=180)
Preeclamptic
girls (n=108)
p-
value
Normotensive
girls (n=119)
Preeclamptic
girls (n=75)
p-value
Age (yrs) 10.8 ± 0.15 10.8 ± 0.07 0.646 12.9 ± 0.01 12.9 ± 0.01 0.799
Height (cm) 147.5 ± 0.8 146.8 ± 0.7 0.86 159.6 ± 0.6 158.8 ± 0.8 .399
Weight (kg) 38.2 ± 0.6 39.8 ± 0.9 0.41 47.5 ± 0.8 49.4 ± 1.2 .153
Serum IGF-1
(ng/ml)1
246 ± 143 264 ± 153 0.799 N/A N/A
Tanner breast stages
% Stage 1 40.8 43.8
0.801
3.4 6.7
0.621
% Stage 2 35.1 37.1 22.7 17.3
% Stage 3 23.0 18.1 47.1 49.3
% Stage 4 1.1 1.0 26.9 26.7
1. Serum IGF-1 measurements were not measured at 12.9 years. Data at 10.8 years are non-normally
distributed. Medians ± interquartile ranges are reported.
A higher proportion of mothers who exclusively breastfed than those who both
breast and formula fed were breastfeeding for > 9 months (77.7% vs. 15.9% respectively,
p <0.001). From the ages of 3-5 years egg consumption was more frequent among NT
than PE girls with 18.7% of PE mothers reporting their child never consumed eggs vs.
4.6% of NT mothers (p = 0.003). No differences in child’s consumption of pork, beef
and lamb, chicken and turkey, fish and seafood or liver were observed by PE status. The

20
mean reported frequency of animal protein consumption was 9.3 ± 3.8, with a range from
0 to 28.5 times per week. The frequency of consumption did not vary by PE status. Milk
was the dairy food consumed most often (14.8 times per week on average) followed by
butter (9.3 times per week on average).
Results of logistic regression models are presented in Table 4. There was no
significant difference in Tanner breast stage or serum IGF-1 levels by PE status. No
significant associations were observed between dietary variables and the natural log of
serum IGF-1 in univariate analysis. PE status and dietary variables were not associated
with serum IGF-1 levels in the adjusted model; however height and Tanner stage were
significantly positively associated with serum IGF-1 (data not shown). Each 1 cm
increase in height was associated with a 1.7% increase in serum IGF-1. Each increase in
Tanner stage from 1 to 4 was associated with an increase in serum IGF-1 concentrations;
mean serum IGF-1 was significantly different for every pairwise comparison except for
Tanner stage 3 compared to stage 4. Specifically, compared to Tanner 1 girls, mean
serum IGF-1 was 20.9% higher for Tanner 2 girls, 48.1% higher among Tanner 3 girls
and 132.8% higher among Tanner 4 girls. Neither the duration of breastfeeding nor
other dietary variables among the exclusively breastfed and mixed fed children were
associated with serum IGF-1 concentrations. To investigate whether cow’s milk alone
rather than combined milk, butter and ice cream may have an effect on serum IGF-1 we
replaced the estimated frequency of these three dairy food groups with the maternal-
reported frequency of milk consumption in the models, but results were unchanged (data
not shown).

21
There were significant positive associations between child’s weight and maternal
BMI of 25 – 29.99 and the OR of thelarche at 10.8 years (table 2.3) whereas the
frequency of milk, butter and ice cream consumption was negatively associated with the
OR of thelarche at that age. At 12.9 years, neither PE exposure, maternal BMI nor any
dietary variables were significantly associated with the OR of Tanner breast stage 3 or
above (compared to Tanner breast stage 1 or 2) (data not shown). Child’s current weight
and height were both significantly positively associated with the OR of more advanced
breast development. Each 1 kg increase in weight was associated with an OR of 1.16
(1.06 – 1.27) and each 1 cm increase in height was associated with an OR of 1.14 (1.04 –
1.25). Maternal BMI was not related to breast development.

22
Table 2.3 Unadjusted and adjusted odds ratios for thelarche at 10.8 years by infant
feeding practices, age at introduction to solids and childhood diet
Unadjusted3 Early life model
4
Childhood
model5
Adjusted model6
OR (95% CI) OR (95% CI) OR (95% CI) OR (95% CI)
Duration of
breastfeeding
1 week – 3 months 1.00 1.00 - 1.00
3 – 6 months 1.29 (0.49 – 3.37) 1.46 (0.45 – 4.74) - 2.34 (0.55 – 9.96)
6 – 9 months 0.99 (0.44 – 2.25) 1.27 (0.37 – 4.42) - 2.81 (0.64 –
12.36)
> 9 months 1.41 (0.68 – 2.91) 1.80 (0.51 – 6.38) - 4.48 (0.99 –
20.16)
Age started
formula
No milk formula 1.00 1.00 - 1.00
< 3 months 0.81 (0.41 – 1.61) 0.64 (0.19 – 2.17) - 1.29 (0.30 – 5.49)
3 - 6 months 1.06 (0.54 – 2.11) 1.16 (0.39 – 3.45) - 2.63 (0.73 – 9.50)
6 - 9 months 0.67 (0.30 – 1.50) 0.58 (0.22 – 1.52) - 0.69 (0.21 – 2.31)
> 9 months 0.67 (0.16 – 2.78) 0.42 (0.09 – 1.98) - 0.74 (0.12 – 4.36)
Age started solids
3 - 6 months 1.00 1.00 - 1.00
6 - 9 months 0.75 (0.45 – 1.25) 0.62 (0.35 – 1.10) - 0.60 (0.30 – 1.22)
PE exposure 0.86 (0.53 – 1.41) 0.73 ( 0.42 – 1.27) - 0.57 (0.28 – 1.14)
Per extra weekly
dairy consumption
event1
0.98 (0.96 – 1.00) - 0.98 (0.95 – 1.00) 0.97 (0.95 – 1.00)

23
Table 2.3 Unadjusted and adjusted odds ratios for thelarche at 10.8 years by infant
feeding practices, age at introduction to solids and childhood diet (continued from page
22)
Per extra weekly
protein
consumption event2
0.97 (0.91 – 1.04) - 0.95 (0.88 – 1.03) 0.95 (0.87 – 1.05)
Maternal BMI
(kg/m2)
18.5 – 24.99 - - 1.00 1.00
25 – 29.99 - - 2.08 (1.04 – 4.16) 2.63 (1.19 – 5.81)
≥ 30 - - 0.96 (0.39 – 2.40) 1.19 (0.42 – 3.40)
Height (cm) - - 0.98 (0.90 – 1.07) 1.03 (0.96 – 1.11)
Weight (kg) - - 1.24 (1.12 – 1.36) 1.16 (1.08 – 1.25)
1. Includes milk, butter and ice cream.
2. Includes eggs, hot dogs and sausage, lunch/deli meats, minced meats, pork, cattle, beef, lamb,
chicken, turkey, fish and other seafood and liver.
3. Univariate results.
4. Early life model includes infant feeding variables, age at introduction to solids and PE exposure.
5. Childhood model includes childhood diet variables, maternal BMI, child’s height and weight.
6. Adjusted model contains all variables in the early life and childhood models.
When these analyses were restricted to exclusively breastfed children (N=154,
table 3.4), child’s weight and maternal BMI 25 – 29.99 remained significantly associated
with the OR of thelarche at 10.8 years however the effect of childhood milk, butter and
ice cream consumption was attenuated and became non-significant. Among exclusively
breastfed children PE status was negatively associated with OR of thelarche at 10.8 years.
Current height and weight remained the only variables significantly associated with the
OR of Tanner breast stage 3+ at 12.9 years (data not shown).

24
Table 2.4 Unadjusted and adjusted odds ratios for thelarche at 10.8 years among
exclusively breastfed girls
Unadjusted3
Early life
model4
Childhood
model5
Adjusted
model6
OR (95% CI) OR (95% CI) OR (95% CI) OR (95% CI)
Duration of exclusive
breastfeeding
6 – 9 months 0.82 (0.36 –
1.89)
0.68 (0.28 –
1.66) -
0.59 (0.19 –
1.82)
> 9 months 1.00 1.00 - 1.00
Age started solids
3 - 6 months 1.00 1.00 - 1.00
6 - 9 months 0.75 (0.45 –
1.25)
0.58 (0.27 –
1.22) -
0.57 (0.22 –
1.44)
PE exposure 0.54 (0.27 –
1.07)
0.47 (0.23 –
0.97) -
0.29 (0.11 –
0.76)
Per extra weekly dairy
consumption event1
0.98 (0.96 –
1.00) -
0.98 (0.95 –
1.01)
0.97 (0.94 –
1.01)
Per extra weekly
protein consumption
event2
0.97 (0.91 –
1.04) -
1.05 (0.93 –
1.18)
1.04 (0.91 –
1.18)
Maternal BMI (kg/m2)
18.5 – 24.99 - - 1.00 1.00
25 – 29.99 - - 6.29 (2.05 –
19.29)
5.71 (1.65 –
19.84)
≥ 30 - - 1.17 (0.29 –
4.68)
1.12 (0.25 –
4.93)
25
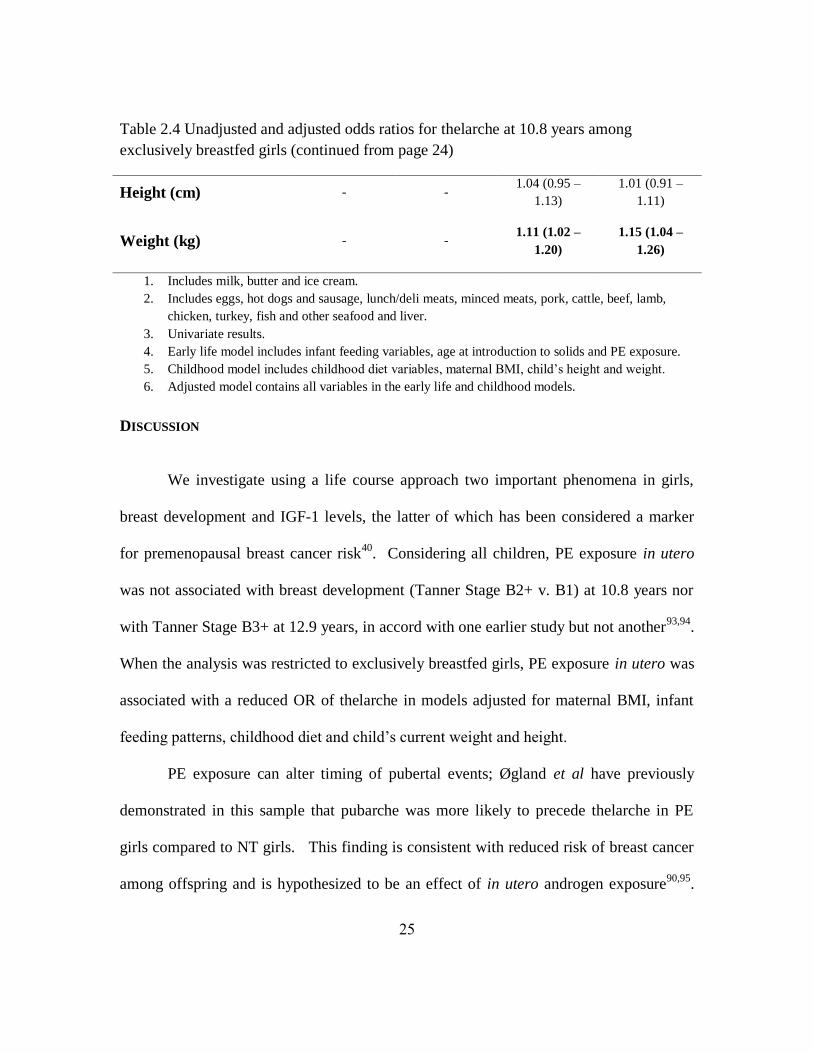
Table 2.4 Unadjusted and adjusted odds ratios for thelarche at 10.8 years among
exclusively breastfed girls (continued from page 24)
Height (cm) - - 1.04 (0.95 –
1.13)
1.01 (0.91 –
1.11)
Weight (kg) - - 1.11 (1.02 –
1.20)
1.15 (1.04 –
1.26)
1. Includes milk, butter and ice cream.
2. Includes eggs, hot dogs and sausage, lunch/deli meats, minced meats, pork, cattle, beef, lamb,
chicken, turkey, fish and other seafood and liver.
3. Univariate results.
4. Early life model includes infant feeding variables, age at introduction to solids and PE exposure.
5. Childhood model includes childhood diet variables, maternal BMI, child’s height and weight.
6. Adjusted model contains all variables in the early life and childhood models.
DISCUSSION
We investigate using a life course approach two important phenomena in girls,
breast development and IGF-1 levels, the latter of which has been considered a marker
for premenopausal breast cancer risk40
. Considering all children, PE exposure in utero
was not associated with breast development (Tanner Stage B2+ v. B1) at 10.8 years nor
with Tanner Stage B3+ at 12.9 years, in accord with one earlier study but not another93,94
.
When the analysis was restricted to exclusively breastfed girls, PE exposure in utero was
associated with a reduced OR of thelarche in models adjusted for maternal BMI, infant
feeding patterns, childhood diet and child’s current weight and height.
PE exposure can alter timing of pubertal events; Øgland et al have previously
demonstrated in this sample that pubarche was more likely to precede thelarche in PE
girls compared to NT girls. This finding is consistent with reduced risk of breast cancer
among offspring and is hypothesized to be an effect of in utero androgen exposure90,95
.

26
Our results suggest exclusive breastfeeding may also modify the relationship of PE
exposure in utero with breast development at 10.8 years. Rapid weight gain in early life
may mediate the association between premature birth and earlier puberty96,97
and as
compared to formula-fed infants breastfed infants gain weight less rapidly87
. In another
population, breastfeeding reduced DNA methylation differences between children born ≤
85th
percentile of weight-for-gestational-age and children born > 85th
percentile at the
H19 differentially methylated region. Further, whereas the OR of overweight or obesity
among never breastfed children with ≥ 75th
percentile methylation at H19 was 22.27
(95% CI 2.07-239.84) there was no effect among breastfed children98
. Such findings
raise the possibility that exclusive breastfeeding may modify developmental
programming resulting from in utero PE exposure. Only 3 mothers who breastfed
exclusively reported breastfeeding for fewer than 6 months, limiting analysis of
breastfeeding duration in this group. The association of PE exposure and pubertal
development may also be affected by maternal BMI; in a separate analysis of our sample,
daughters of PE pregnancies from obese women had higher BMI and larger waist and hip
circumferences whereas no such differences were evident when comparing PE and NT
daughters of normal weight or overweight mothers92
.
Childhood frequency of milk, butter and ice cream consumption was weakly
inversely associated with the OR of Tanner stage 2+ at 10.8 years but not with Tanner 3+
at 12.9 years. A recent systematic review concluded there was a likely association
between childhood animal protein intake and earlier puberty assessed by age at menarche
and age at peak height velocity99
. There is less research on dairy consumption and breast

27
development. In our analysis, child’s weight and maternal BMI were more strongly
associated with the OR of thelarche and child’s height and weight were the only variables
significantly associated with breast development at 12.9 years. These findings are
consistent with studies showing earlier breast development among girls with greater BMI
and accelerated achievement of pubertal milestones among both male and female
offspring of overweight or obese mothers46,100,101
. One potential mechanism for the effect
of dairy consumption on thelarche in this population is that it is often associated with
lower weight and adiposity in observational studies102
. In our study, the correlation
coefficients between dairy consumption and weight at first and second follow-up were
negative but non-significant.
Our research was conducted in Norway where there are restrictions on and
therefore limited exposure to environmental contaminants such as bisphenol A and
recombinant bovine somatotropin compared to the United States. Thus our findings are
most applicable to maternal breast milk and cow’s milk absent contaminants in non-
European populations. While infant and child diet were not associated with IGF-1 levels,
height and Tanner breast stage were associated with serum IGF-1. Both have been
previously identified as correlates of serum IGF-1 levels in healthy European children103
.
This study has limitations. First, the childhood diet-outcome associations may
have been attenuated by use of a semi-quantitative food frequency questionnaire. The
categories of dairy and animal foods on which data were collected were not exhaustive.
Some foods - for example cheese and yoghurt - were not reported. The DAFNE study
reported the average per capita daily availability (not intake) of cheese products in

28
Norway to be 38 grams, sixth among ten European countries104
. Hjartåker et al. reported
that the average daily consumption of cheese was 40-43 grams among adult Norwegian
women who participated in the European Prospective Investigation into Cancer and
Nutrition (EPIC) study105
. In this sample, cheese accounted for 14% of total dairy
consumption. Twelve to thirteen percent of dairy consumption was as ‘yoghurt and other
fermented milk products’ (mean 35-38 g/d). Sixty one percent was from milk with lesser
contributions from creams, puddings, ice creams and butter. Norway’s per capita cheese
consumption was greater than most other European countries whereas its per capita
yoghurt consumption was lower. A study of iodine content in the Norwegian diet
reported a mean cheese intake of 23 g/d among adult men and 22 g/d among adult
women. It is likely that our data underreport frequency of total dairy intake, specifically
regarding cheese and to a lesser extent yoghurt, but the extent to which this is true in
children is unknown given available data relate to adults. Further research on total dairy
consumption among Norwegian children is required to determine both the rates of
consumption and whether dairy foods have heterogeneous effects on breast development.
Considering duration of breastfeeding, age at introduction of solids and age at
introduction of formula in three-month increments may be inadequate for future studies
of the developmental effects of infant feeding practices. Within the three month windows
the effects of terminating breastfeeding, introducing formula or solids may in fact be
biologically diverse and identify a specific window of susceptibility. This loss of
precision may have attenuated our ability to detect associations between infant feeding
practices and IGF-1 at 10.8 years due to misclassification of the exposure and potentially

29
reduced inter-individual variation in the exposure status. However, mothers completed
the childhood FFQ at the first follow-up so there is potential recall bias. Likewise,
assigning the median value to all responses within the intake category for childhood
dietary variables (for example defaulting all responses in the 2-4 times per week category
to 3 times per week) fails to accurately reflect heterogeneity in dietary patterns between
subjects and may weaken any dietary associations. This is particularly true for subjects
who reported frequencies of consumption in the highest, open-ended categories. These
individuals are likely to have consumed these foods more often than indicated. Because
average serving size was not reported, it is possible children with different frequencies of
consumption may in fact have more similar absolute intakes. Conversely, children with
the same reported frequency of intake may have different absolute intakes owing to
different serving sizes.
A prior study of maternal recall of breastfeeding among Norwegian women after a
20-year interval reported strong correlations between recorded and recalled duration106
,
though in other studies maternal recall of childhood diet became less accurate as the
elapsed time interval lengthened107,108
. Hence, it is also possible that assigning the
median value to all responses within each intake category may reduce false inter-
individual variation introduced by errors in maternal reporting.
CONCLUSIONS
PE exposure was associated with reduced odds of thelarche at 10.8 years among
exclusively breastfed girls only. Increasing frequency of childhood milk, ice cream and

30
butter consumption was negatively related to the OR of thelarche at 10.8 but not to the
OR of having more advanced breast development at 12.9 years. In contrast, infant
feeding patterns were not associated with breast development at either age. Increasing
weight was consistently associated with more advanced breast development, as were
maternal BMI at 10.8 years and offspring’s height at 12.9 years. Infant feeding and
childhood diet were not associated with serum IGF-1 levels at 10.8 years. Concordant
with other published data, being taller and more advanced breast stage were both found to
correlate with higher serum IGF-1 levels. Future research needs to determine whether PE
offspring experience changes in the rate of subsequent pubertal development, whether
diet more proximal to puberty could influence development and whether the reported
association may be due to particular dairy foods or to another exposure associated with
dairy consumption patterns.
ACKNOWLEDGEMENTS
The authors extend their thanks to all participants in the Stavanger cohort study,
to Dr. Donald Walt Chandler at Esoterix Laboratories for his contributions to the analysis
of hormone levels and to the Bruton Centennial Fellowship for its support of nutritional
sciences research at the University of Texas. This study was supported by internal
funding from the National Cancer Institute, NIH and the Folker Foundation, Stavanger
Norway.

31
Chapter 3: Infant Feeding Patterns are Associated with Pediatric Acute
Lymphoblastic Leukemia
This section was originally published as “Schraw JM, Dong YQ, Okcu MF,
Scheurer ME, Forman MR. Do longer formula feeding and later introduction of solids
increase risk for pediatric acute lymphoblastic leukemia? Cancer causes & control :
CCC. Oct 24 2013.”109
Jeremy Schraw designed the research, drafted the manuscript and
conducted statistical analyses. Yongquan Dong supervised statistical analyses. Mehmet
Fatih Okcu collected data and revised the manuscript. Michael Scheurer collected and
maintained data and revised the manuscript. Michele Forman designed the research and
revised the manuscript.
ABSTRACT
Milk formula feeding can elevate insulin-like growth factor-1 levels, possibly
impacting leukemogenesis. The intent of the current study is to examine the associations
between infant feeding practices and age at introduction of solids on risk of childhood
acute lymphoblastic leukemia (ALL). Incident cases of infant and childhood (aged ≤ 14
years) ALL (N=142) were enrolled in a case-control study. Cases were frequency
matched on age, sex, race and ethnicity to two sets of controls (N =284 total).
Multivariable logistic regression was used to determine the association between infant

32
feeding practices and age at the introduction of solids and the odds ratio of ALL. In
adjusted multivariable analyses, each additional month of formula feeding was associated
with a 1.17 (1.09-1.25) odds ratio; each additional month of age at introduction of solids
was associated with a 1.18 (1.07-1.30) odds ratio. In this study, longer duration of
formula feeding and later age at the introduction of solid foods were independently
associated with increased risk of ALL. Additional studies are needed to address the
factors influencing duration of formula feeding and delayed introduction of solids. The
results support the potential role of energy balance in early life as a contributor to risk for
pediatric acute lymphoblastic leukemia.
INTRODUCTION
The etiology of acute lymphoblastic leukemia (ALL) is not well understood. A
few strong risk factors have been identified, such as a diagnosis of Down syndrome or
exposure to ionizing radiation in utero53
. Insulin like growth factor-1 (IGF-1) and growth
hormone (GH) are regulators of lymphopoietic stem cell proliferation and lymphoid stem
cells express IGF-1 and insulin receptors, with receptors on leukemic cells possessing
greater affinity61,110,111
. Therefore, elevations in bioavailable IGF-1 could subject
hematopoietic cells to a proliferative stress and encourage the growth of leukemic cells.
High IGF-1 exposure has been associated with risk of ALL directly66
as well as through
high birthweight (≥ 4000 g), large for gestational age and taller standing height than age-
matched controls112,113
. Evidence for the association between accelerated intrauterine
growth and ALL is strong. Both our group and others report an increased risk among

33
high birthweight (HBW) and large for gestational age (LGA) infants112-114
. One study
reported a 41% increased risk (OR 1.41, 95% CI 1.08-1.84) among HBW infants as
compared to the normal birthweight group (2500-4000 gr)114
. Among LGA infants the
odds ratio of ALL was 45% higher compared to the appropriate for gestational age (OR
1.45, 95% CI 1.07-1.97). The association between childhood cancer and the IGF system,
summarized in an excellent review67
, stimulated the current line of investigation.
Within the last decade, the influence of infant feeding practices on serum IGF-1
has become clearer. Cow’s milk and cow’s milk formula have been shown to elevate
bioavailable serum IGF-119,20
, and a dose-response has been established between higher
protein content in formula and higher free IGF-123
. While the literature suggests that
prolonged breastfeeding (≥ 6 or 12 months) may have a weak protective effect against
ALL115,116
, the relationships between cow’s milk formula feeding and the age at the
introduction of solid foods and risk of diagnosis have not been well characterized.
Timing of the introduction of solids foods was considered as an exposure because it is
known to be associated with breastfeeding duration117,118
. The objective of this paper is
to characterize the relationship between infant feeding practices and age at the
introduction of solids and pediatric ALL in a case-control study of Texas children.
MATERIALS AND METHODS
Subjects
Cases were children aged ≤ 14 years newly diagnosed with ALL at the Texas
Children’s Cancer Center (TCCC) between 1997 and 2011. Controls were recruited from

34
two groups: healthy children attending well-child visits at Texas Children’s Hospital
(TCH) and satellite clinics, whose mothers completed the TCCC questionnaire; the
second group of controls were mother-offspring dyads in Houston, San Antonio and
Austin, Texas randomly selected from those who participated in formative research for
the National Children’s Study (NCS). Exclusion criteria for the control group were a
diagnosis of cancer or of any condition known to be associated with pediatric cancer risk.
Controls were frequency matched 2:1 to cases on age (± 1 year), sex, race and ethnicity.
179 cases consented and were enrolled in the study. Of these, 37 were excluded because
infant feeding data were missing. Therefore 142 cases and 284 controls were included in
the final analysis. There were no significant differences between included and excluded
cases by race, gender, ethnicity or age at diagnosis. The overall participation rate for
cases diagnosed at TCCC was 85% and for controls recruited through TCH-affiliated
clinics the participation rate was 90%. This study was approved by the Institutional
Review Boards of Baylor College of Medicine and The University of Texas at Austin.
Written informed consent was obtained from the parents of cases and controls and verbal
assent was obtained from children.
Data collection and ALL diagnosis
Two different questionnaires were used. Both questionnaires asked mothers
whether the child was ever fed breast milk or milk formula and the duration of each, as
well as the age when the child began receiving solid foods. Both collected data on
maternal age, education, smoking, parity, newborn’s weight and length, gestational age at

35
birth and maternal and paternal race and ethnicity. Mothers of ALL cases (n = 142) and
TCCC-based controls (n = 109) completed the Texas Children’s Cancer Center
questionnaire at enrollment. Trained interviewers administered a validated questionnaire
to mothers of NCS-based controls (n = 175). With respect to infant feeding variables, the
TCCC and NCS questionnaires contained similarly structured questions regarding breast
and formula feeding (closed “ever/never” questions followed by open-ended duration
questions). Diagnosis of ALL (ICD-O-3 codes 9831-9837) was abstracted from the
diagnostic pathology report by the research coordinator and reviewed by a medical
oncologist.
Data from the TCCC and NCS questionnaires were merged for this analysis.
When necessary, continuous variables were recoded categorically. Although the NCS
questionnaire collected data on the ages at which children were fed breast milk and
formula, the TCCC questionnaire did not. Therefore, durations of formula feeding is
reported in months without respect to child’s age at initiation. It is reasonable to assume
that if only breastfed or only bottle fed, then the age started was at birth. In the mixed
feeding group, the exact age started formula feeding is not known, but again
breastfeeding was presumed to have been initiated at birth. Children were classified as
exclusively breastfed if the mother indicated the child was never fed milk formula on a
daily basis, and as exclusively formula fed if the mother indicated the child had never
been fed breast milk on a daily basis. Children who had been fed both on a daily basis at
any time were classified as mixed feeding. Age at the introduction of solids was given in
months for cases and both sets of controls. Due to small numbers in racial groups such as

36
Asian and Native American, race was classified as either white, African American or
other and ethnicity was either Hispanic or non-Hispanic.
Statistics
The statistical analysis was conducted in two phases. In the first phase of the
analysis, differences in the proportions of cases and controls by infant feeding practice as
well as by gestational age at birth, gender, ethnicity, maternal smoking and maternal
education were assessed by Chi-square test. Differences by case-control status in the
means of age at interview, birth weight, age at the introduction of solids and durations of
breast and formula feeding, respectively were assessed by the Student’s T-test.
In the second phase of the analysis, odds ratios (OR) and 95% confidence
intervals (CI) for ALL were calculated using unconditional multiple logistic regression
analysis. The main exposure variable was infant feeding group with the reference
category of exclusive breast feeding, while the dependent variable was a diagnosis of
ALL. In the first model, the children who were ever formula fed were compared to those
exclusively breast fed; in the second model, children who were exclusively fed formula
or fed both breast milk and formula were compared to the exclusively breast fed. A final
set of models addressed the effects of each additional month of breastfeeding and of
formula feeding and age at the introduction of solid foods on the odds ratio of ALL both
individually and unadjusted, and simultaneously after adjustment for selected covariates:
gender, race, ethnicity, birth weight categorized into low (< 2500 g), normal (2500-4000
g) and high (> 4000 g), child’s age in years and whether the mother smoked during the

37
pregnancy. Statistical significance was set at P < 0.05 for bivariate statistics. All
procedures were computed using SPSS© version 20.
IRB approval
This study was approved by the Institutional Review Boards of the University of
Texas at Austin (IRB# 2012-05-0029) and Baylor College of Medicine (IRB# H-29892).
RESULTS
Table 3.1 lists the characteristics of the study population. Cases and controls
ranged in age from 0 – 14 years, with means of 4.10 and 4.05 years respectively (median
3 years for both cases and controls). There were no significant differences with respect to
birth weight, gestation length, gender, ethnicity or maternal education. When race was
categorized into white, African American and other, there were significantly more cases
than controls in the other category (P < 0.01). A higher proportion of cases than controls
were born to mothers who smoked during pregnancy (P < 0.001); and among the mothers
who reported smoking during pregnancy, mothers of ALL cases smoked more heavily (P
< 0.02).

38
Table 3.1 Demographics and birth characteristics of ALL patients and controls
Cases (n =
142)
Controls (n =
284)
mean ± standard deviation
Age at interview (y) 4.1 ± 2.97 4.04 ± 3.08
Birth weight (g) 3335 ± 583 3237 ± 608
(%)
Term length
< 38 weeks 20.4 19.1
≥ 38 weeks1 73.2 77.5
Gender
Male 52.8 51.8
Female 47.2 48.2
Race
White 82.4 83.8
African-American 8.5 13.4
Other 9.1 2.8*
Ethnicity
Hispanic 43.7 52.1
Non-Hispanic 55.6 47.9
Maternal smoking
during pregnancy 8.5 3.2**
pre-pregnancy 19.7 29.6
Maternal education
Less than high school 12.7 17.3
High school or GED 23.9 18.0
Vocational or some college 23.9 28.5
College 25.4 17.6
Graduate/Professional 14.1 18.0
*p < 0.01 by X2 test, ** p < 0.001 by X
2 test
1< 1% of children in the sample were ≥ 42 weeks gestational age at
birth

39
There were no significant differences in the percentage of cases vs. controls who
were ever breast or bottle fed, nor by exclusive breastfeeding or mixed feeding (Table
3.2). There were no significant differences in the length of breastfeeding between cases
and controls. Compared to cases, controls had a shorter mean duration of formula
feeding; this difference was significant among the children fed both breast milk and
formula (P < 0.001) but not among the children fed formula exclusively. The mean age
at the introduction of solid foods was later among ever breastfed cases than controls (P <
0.001) and ever formula fed cases than controls (P < 0.001). There was no difference
among the mean age at the introduction of solids among the exclusively breastfed or the
exclusively formula fed by case-control status. Age at the introduction of solids among a
group that merged both the exclusively breastfed and exclusively formula fed, that is
“any exclusive feeding pattern” was significantly later among cases than controls (8.75 ±
4.12 months and 7.56 ± 3.09 respectively) (p=0.050). This would suggest that
differences in the age at introduction of solids are persistent among cases and controls
regardless of infant feeding pattern.

40
Table 3.2 Mean duration of infant feeding practices and age at introduction to solids among cases and controls
Sample Size
Breastfeeding duration
(mean ± standard
deviation)
Formula feeding duration
(mean ± standard
deviation)
Age at introduction to
solids
(mean ± standard
deviation)
Case/Control Cases Controls Cases Controls Cases Controls
Ever breastfed 108 / 201 6.54 ± 6.61 7.04 ± 5.91 - - 8.68 ± 4.05 7.07 ± 3.32
Exclusively breastfed 16 / 36 14.47 ± 7.21 16.21 ± 5.60 - - 9.19 ± 3.64 8.22 ± 2.72
Ever formula fed 126 / 246 - - 10.54 ± 4.09 8.09 ± 5.67* 8.56 ± 4.18 6.99 ± 3.33*
Exclusively formula
fed 33 / 84 - - 12.46 ± 3.85 11.85 ± 2.82 8.52 ± 4.40 7.30 ± 3.21
Mixed feeding 92 / 161 5.32 ± 5.45 5.50 ± 4.38 9.99 ± 4.03 6.16 ± 5.79 8.58 ± 4.13 6.83 ± 3.39*
* p < 0.001 by Student’s t test

41
Results from the multivariable logistic regression analysis are shown in Table 3.3.
The crude OR of ALL did not differ by ever formula feeding, mixed breast and bottle
feeding or exclusive breastfeeding or bottle feeding. When infant feeding variables were
analyzed continuously, each additional month of milk formula feeding and each
additional month of age at the time of introduction of solid foods were associated with an
increased odds of ALL (OR 1.17, 95% CI 1.09-1.25 and OR 1.18, 95% CI 1.07-1.30
respectively). This was the case both before and after adjustment for simultaneous effects
of other infant feeding patterns, race, gender, ethnicity, age at diagnosis/interview,
birthweight category and maternal smoking during pregnancy. Results were unchanged
when cases and controls aged < 1 year were excluded (data not shown). Duration of
breastfeeding was not significantly associated with the OR of ALL. Each 100 g increase
in birthweight was associated with an 8% increase in the odds of ALL (OR 1.08, 95% CI
1.02 – 1.05). In all adjusted models there were trends towards increased odds among
mothers who smoked during pregnancy and high birthweight children as well as
decreased odds among African Americans, although these effects were not statistically
significant.

42
Table 3.3 Multivariable logistic regression models for the odds ratio and 95% confidence interval of ALL by infant feeding
practices and selected covariates.
Odds ratio ((95% confidence interval)
Unadjusted Adjusted2 Adjusted
3
Crude1
Ever fed formula 1.18 (0.63 – 2.20) - 1.54 (0.79 – 3.01)
By practices1
Exclusively formula fed 0.95 (0.47 – 1.93) - 1.30 (0.60 – 2.80)
Mixed feeding 1.31 (0.69 – 2.48) - 1.64 (0.83 – 3.24)
By duration
Per additional month of breastfeeding 0.99 (0.95 – 1.03) 1.03 (0.97 – 1.09) 1.01 (0.94 – 1.08)
Per additional month of formula feeding 1.10 (1.05 – 1.15)** 1.16 (1.09 – 1.23)** 1.17 (1.09 – 1.25)**
Per additional month of age at introduction of solids 1.12 (1.06 – 1.19)** 1.13 (1.03 – 1.26)* 1.18 (1.07 – 1.30)* 1 Exclusively breastfed infants serve as the referent group
2 Adjusted for other infant feeding variables
3 Adjusted for race, age at interview, sex, ethnicity, maternal smoking during pregnancy and birthweight category (<
2500 g ‘low’, 2500-3999 g ‘normal’, ≥ 4000 g ‘high)
* p < 0.05, ** p < 0.001

43
DISCUSSION
In this study of 142 ALL cases aged ≤ 14 years at diagnosis, the duration of milk
formula feeding and age at introduction of solid foods were found to increase the odds of
ALL. In contrast, the results do not support the hypothesis that breastfeeding is protective
of ALL.
Duration of infant feeding patterns appear to be more influential in predicting
ALL than whether a particular pattern (e.g. mixed feeding, exclusive breast or bottle) was
practiced. The findings remained after adjustment for previously identified risk factors
such as race, sex, ethnicity, birthweight and gestational age at birth, maternal education
and maternal smoking during pregnancy. The median age at diagnosis of 3 years was
comparable to the SEER-reported peak incidence at ages 2-3119
.
The possible association of milk formula feeding and leukemia has not been well
studied. In the context of recent publications reporting higher serum IGF-1 and greater
growth velocity among cow’s milk and cow’s milk formula fed infants and children than
breastfed infants and children19,20,23,28,36
, our findings may represent the identification of a
novel risk factor for pediatric ALL. It has been known for some time that IGF-1
signaling is involved in the proliferation of lymphoid progenitor cells and that elevated
IGF-1 may result in accelerated proliferation in these cell populations61,110
. A case-
control study which reported higher serum IGF-1 among ALL cases aged 1-11 than their
controls provides partial support for this hypothesis66
. It is possible formula feeding may
promote the disease process in those with an oncogene or pre-existing epigenetic

44
vulnerability such as the loss of tumor-suppressor gene activity frequently observed in
childhood leukemia120-123
. Which particular genetic or epigenetic events may be sensitive
to formula feeding is not currently known.
The technology of infant formulas has advanced since their inception and formula
compositions have changed. Although data were not collected by type of milk formula, it
is important to note there would be heterogeneity among formulas with regard to their
composition across the study period. Recently, some formula manufacturers have begun
to supplement their products with probiotics, although findings regarding their effects are
mixed124
. The inclusion of probiotics in infant formula was rare prior to c. 2007-
2008125,126
. The case children included in these analyses were all born prior to the advent
of commonly available probiotic-containing formulas so it is unlikely the secular trend in
probiotic formulas influences the results. Nonetheless, data on the specific preparation of
infant formula will be important for future research. This is the first study to report an
increased OR associated with each additional month of age at the introduction of solids.
The mean age at introduction of solids was later among ever breastfed cases, ever
formula fed cases and mixed fed cases than their respective controls. Duration of formula
feeding was longer among cases than controls in the ever formula fed and mixed fed
groups, whereas there was no difference in the duration of breastfeeding among mixed
fed cases and their controls. Therefore, it is reasonable to assume that these cases had a
higher cumulative exposure to formula. The increased OR reported for each month of
age at the introduction of solids may be a result of higher cumulative exposure to
formula, although these terms were independent of one another in multivariable models

45
and were significantly but weakly correlated (Pearson’s r = 0.129, p = 0.02). It has also
been shown that infant feeding practices influence the composition of the gut
microbiome127
, and could thus potentially interact with the systemic immune system.
With respect to ALL, considerably more literature exists on the association of
breastfeeding and breastfeeding duration and ALL risk. The American Academy of
Pediatrics recommends exclusive breastfeeding through the first 6 months of life, and
continuation of breastfeeding for the first year or beyond while complementary foods are
introduced44
. Results from prior studies are mixed; in many studies128-133
but not all134-
138, breastfeeding length greater than 6 or 12 months has been observed as protective.
The null finding reported here should be interpreted with caution as an effect of
breastfeeding is more often detected in larger studies and meta-analyses than in studies of
this approximate size. Further, the high percentage of children who ever breastfed
coupled with the low percentage who were exclusively breastfed may have limited the
power to detect an effect in this population. Much of the previous research on
breastfeeding and ALL has been in the realm of immunology, wherein breastfeeding is
considered a mediator of a healthy immune response per the Greaves Hypothesis139
. This
hypothesis may be most applicable to pre-B cell and B cell ALL and tends to weaken
when all ALL subtypes or acute myeloid leukemia are considered. However, ALL was
not histologically subtyped in our protocol. Lastly, among populations in which
breastfeeding is promoted, the possibility of maternal over-reporting as a socially
desirable response exists.

46
The remainder of our findings was not statistically significant. It is noteworthy
however that we reported a statistically non-significant increased odds of ALL among
those with high birthweight and those born to mothers who smoked during the pregnancy
as well as decreased odds among the low birth weight and African-American groups
which are all consistent with other studies112,140,141
. The finding that either high birth
weight in absolute terms or large for gestational age both increase risk has been reported
by members of our group and others114,134,137,141
and is hypothesized to stem from
increased IGF-1 exposure in utero60,142
[43, 44]. Therefore, prolonged formula feeding
may recapitulate this established fetal risk factor.
This paper has several strengths; first is its novel hypothesis. Second, this
analysis uses healthy, population-based controls matched on several important
demographic characteristics. Both cases and controls were recruited from urban areas in
a relatively narrow geographical area (central Texas) instead of the country-wide
recruitment sometimes required to accrue cases, minimizing potential for confounding by
geography and population density. It also heavily represents Hispanics, a rapidly
growing section of the population routinely underrepresented in childhood cancer
research despite being at high risk for ALL143,144
. Finally, ours is the first study to report
an association between age at the introduction of solid foods and ALL.
There are limitations to this study; because no measurement of IGF-1
accompanies the infant feeding data, any relationship of IGF-1 to the reported association
between duration of formula feeding and risk of ALL remains speculative, based on
extrapolation from known risk factors and prior research. We were also unable to

47
determine the precise ages of children when they were mixed breast and formula-fed.
The importance of the ages at which a child first and last receives milk formula are
therefore unknown. If a child continues to receive cow’s milk after milk formula is
stopped, and both increase bioavailable IGF-1, it may be that the relevant exposure is the
age at which the child is first exposed to milk or milk formula, rather than simple
duration. Serum IGF-1 levels vary by age in early life and there is the potential that a
“critical window” exists during which infant feeding may have the strongest impact on
risk. Additionally, the low percentage of exclusively breastfed children precluded
analysis of the role of breastfeeding in ALL. Importantly, this study incorporates data
from two populations of controls who were each interviewed using a different
questionnaire. In a sensitivity analysis conducted on a subset of cases (n = 109) and only
those controls who provided data using the same questionnaire as cases (n = 109), the
significant multivariable regression results were essentially unchanged. Each increasing
month of age at the introduction of solid food remained a statistically significant risk
factor for ALL (OR 1.18, 95% CI 1.03 – 1.36) and the odds of disease for each additional
month of formula feeding (OR 1.11, 95% CI 0.98 – 1.26) fell within the confidence
interval of the larger model when adjusted for the same covariates. Finally, although
cases were not histologically grouped for analysis, the effect of elevated IGF-1 on cell
proliferation is common to B and T cell precursors61
and should not unduly impact the
results.
Future research should focus on obtaining more detailed information related to the
timeline of infant feeding exposures. Since formula feeding is proposed to be

48
leukemogenic only in children with a predisposition, it would also be informative to
stratify risk by histologic subtype, cytogenetics, or epigenetic profile to determine which
factors, if any, elevate risk when coupled with prolonged formula feeding. Previous
research suggests that ALLs involving high hyperdiploidy or t(1;19) translocations are
more strongly associated with increasing birthweight141
although these results are not
reported universally145
. Documenting an association between prolonged formula feeding
and these subtypes of ALL may indicate a shared mechanism. Recent work has also
identified added fats as risk factors for pediatric ALL146
. It is not known whether milk
formula as a whole or one of its constituents may be responsible for the findings we
report.
CONCLUSIONS
This paper identifies milk formula feeding and later age at the introduction
of solid foods as novel potential risk factors for pediatric ALL. Existing research on the
relationship between formula feeding and serum IGF-1 in early life and the role of IGF-1
in leukemogenesis may explain the association of formula feeding with risk of ALL.
Increasing age at the introduction of solid foods may be an independent risk factor or
may stem from the observation that the same children who received longer formula
feeding began solid foods later. Because these infant feeding practices are modifiable
exposures, their putative roles in the disease process warrant further study.

49
Chapter 4: Identification of Vulnerable Ages for the Introduction of
Solid Foods in Pediatric Acute Lymphoblastic Leukemia
ABSTRACT
There is little research concerning infant formula or age at introduction to solid
foods and pediatric acute lymphoblastic leukemia (ALL). The purpose of this case-
control study was to estimate the association of age at introduction of solids and pediatric
ALL. 171 ALL cases aged 0-14 years were recruited at Texas Children’s Cancer Center
and matched on sex, age and ethnicity to 342 population-based controls. Data were
collected on infant feeding and known risk factors for ALL. Multivariable logistic
regression was used to model the odds ratio of ALL by quartile of age at introduction of
solids with the first/earliest quartile (0-4 months) as the reference group. In adjusted
models, the odds ratio of ALL among children in quartile 3 (7-9 months) was 4.08, 95%
CI 1.42 – 11.71; for children in quartile 4 (≥ 10 months) the OR was 6.03, 95% CI 2.06 –
17.72. For each additional month of milk formula feeding the OR of ALL was 1.16, 95%
CI 1.08 – 1.25. These results suggest a window when later introduction to solids is
positively associated with ALL and recommend compliance with American Academy of
Pediatrics guidelines.
50
INTRODUCTION
The epidemiology of pediatric acute lymphoblastic leukemia (ALL) is
poorly understood. There are few recognized risk factors, such as Down syndrome and
exposure to ionizing radiation, which account for a small percentage of cases147
. ALL
patients often harbor one of a suite of genetic or epigenetic lesions linked to the disease;
however, not all diagnoses are driven by these and not all children with an oncogenic
mutation will develop leukemia147
. Early life immune exposures likely play a role in the
etiology of ALL148
. Evidence suggests that either an overall lack of immune challenges or
an inappropriate response to them by the immune system may be a risk factor for
childhood ALL149
. One marker of immune exposure, breast feeding, has been
associated with lower ALL risk, specifically breast feeding for a duration of > 6
months116
. Duration of breast feeding is only one component of infant feeding, however.
Breastmilk, milk formula and the introduction of solid foods stimulate the infant
digestive and immune systems. Breast feeding transfers antibodies, antigens and human
milk oligosaccharides from mother to offspring150
. Breastfed infants experience slower
weight gain and have, on average, lower serum insulin-like growth factor-1 (IGF-1)
levels than cow’s milk formula-fed infants15,23
. IGF-1 has been reported to have
antiapoptotic effects on lymphoid progenitor cells in vitro61
. Our prior work identified a
higher odds of ALL for each additional month of age at the introduction of solid foods
and for longer duration of milk formula feeding109
when these were modeled
continuously.
The objectives of the current analysis were to examine the associations of age at
introduction to solid foods and durations of breast feeding and milk formula feeding with
the odds of ALL. We sought to investigate the specific age or age range past which
introduction of solids is associated with the increased risk of ALL. We hypothesized that

51
later introduction of solid foods is associated with an increased odds of ALL. We also
sought to explore whether the effect of later introduction of solids is different among
children without an older sibling, which serves as an indicator for limited infectious
exposures in early life.
MATERIALS AND METHODS
Subjects
This case-control study included 171 cases of childhood ALL (ICD-O-3 codes
9831-9837) aged 0-14 years who were diagnosed at Texas Children’s Cancer Center
(TCCC) in Houston, Texas from 1997-2012 and had complete exposure data. Parents of
116 cases responded to the questionnaire at the time of diagnosis. For 55 cases, parents
responded to the questionnaire after the end of induction therapy. Median time between
diagnosis and completion of the questionnaire in this group was 6.01 years. Maximum
time between diagnosis and interview in this group was 13.3 years. 342 population-based
controls recruited from Austin, Houston and San Antonio, Texas were frequency matched
to cases on sex, ethnicity (Hispanic or not) and age within 1 year at diagnosis/interview.
Parents of cases and controls reported sociodemographic and maternal reproductive data
as well as the duration of breast feeding, milk formula feeding and the age at introduction
of solids during an interviewer-administered questionnaire. Assessment was comparable
between cases and controls. Cases and controls with the following characteristics were
excluded from the analysis: diagnosis of a genetic condition associated with childhood
cancer; diagnosis of an inherited metabolic disease that might affect infant feeding; the
parent/guardian was unable to provide information on infant feeding practices; the index
child was currently breastfed, fed milk formula or had not been introduced to solids.

52
The parent/guardian provided written informed consent for participation while the
child provided verbal assent, if at the age of assent. This study was approved by the
Institutional Review Boards of the University of Texas at Austin and Baylor College of
Medicine and was conducted in accord with the principles of the Declaration of Helsinki.
Statistics
Differences in the means of continuous variables among cases and controls were
assessed using Student’s t-test or Mann-Whitney U test. Differences in the proportions of
categorical variables were assessed using χ2 tests or likelihood ratio tests, as appropriate.
Continuous data are presented as means with standard deviations or as medians with
interquartile ranges, when non-normally distributed.
Unconditional multivariable logistic regression was used to model the odds ratio
(OR) and 95% confidence interval (CI) of ALL by duration of breast feeding, duration of
milk formula feeding and age at introduction to solid foods. Race/ethnicity, age at
diagnosis/interview, birthweight, number of older siblings and maternal smoking status
during pregnancy were included as covariates. Because of sample size, the effects of race
and ethnicity are reported only for Hispanic white, non-Hispanic white and non-Hispanic
black children. Duration of breast feeding and milk formula feeding were treated as
continuous variables reported in months. Age at introduction to solid foods was
categorized as 0-4 months, 5-6 months, 7-9 months and 10 or more months. The
American Academy of Pediatrics recommends exclusive breast feeding for 6 months44
.
We wished to compare the effects of introducing solids earlier than, at, or later than 6
months. The univariate OR and 95% CI were first calculated for each independent
variable. Any variable significantly associated with the outcome was included in an
initial final model. A backward elimination procedure was used to select the most

53
parsimonious multivariable model. We initially included maternal education and
maternal pre-pregnancy smoking but found no direct effect and no evidence of
confounding by these variables, so they were excluded from the final model. There were
no significant interactions between independent variables. Missing covariate data was
handled via pairwise deletion. To test whether these findings were affected by the
presence of the 55 cases enrolled as survivors, we then computed the same model using
only the cases whose parent or guardian responded to the questionnaire at the time of
diagnosis.
Because of the hypothesis that the introduction of solid foods to an infant or child
may act as an immune exposure, we then computed the multiple logistic regression
models separately among children with and without one or more older siblings. Having
older siblings has been used as a surrogate marker of immune exposures such as common
infections149
.
For all tests, a P-value of ≤ 0.05 was considered statistically significant. All analyses
were conducted in IBM SPSS© version 21.
IRB approval
This study was approved by the Institutional Review Boards of the University of Texas at
Austin (IRB# 2012-05-0029) and Baylor College of Medicine (IRB# H-29892).
RESULTS
Tables 4.1 and 4.2 list characteristics of cases and controls as well as infant
feeding practices and age at introduction to solid foods. There were no significant
differences between cases and controls by age at diagnosis/interview, sex, ethnicity,
proportion of children with at least one older sibling or number of older siblings. Cases
were more likely than controls to be of unknown race or of Asian, American Indian or

54
Middle Eastern descent. Mothers of cases were more likely to have report smoking
during the index pregnancy than were mothers of controls. Mean birthweight was higher
among cases than controls. The median duration of milk formula feeding was longer
among cases than controls. The median age at introduction to solid food was later among
cases than controls. A lower proportion of cases than controls were introduced to solid
foods at 5-6 months whereas higher proportions of cases than controls were introduced to
solid foods between 7-9 months and ≥ 10 months.

55
Table 4.1 Characteristics of cases and controls
Cases (n=171) Controls (n=342) P-value1
Age at diagnosis/interview (x̄ ± s.d.) 4.4 ± 3.1 4.1 ± 3.3 0.34
Percent male (n) 53.2 (91) 52.6 (180) 0.90
Percent female (n) 46.8 (80) 47.4 (162)
Race, % (n)
Percent White (n) 85.4 (146) 86.3 (295)
0.05 Percent Black (n) 7.0 (12) 10.5 (36)
Percent Other2 (n) 7.6 (13) 3.2 (11)
Ethnicity
Percent Hispanic (n) 49.1 (84) 55.0 (188) 0.21
Percent Non-Hispanic (n) 50.9 (87) 45.0 (154)
Birthweight (x̄ ± s.d.) 3381 ± 588 3265 ± 603 0.04
Percent firstborn (n) 52.7 (77) 58.1 (182) 0.28
Number of older siblings (x̄ ± s.d.) 0.8 ± 1.0 1.0 ±1.2 0.10
Maternal smoking in pregnancy
Percent reporting ‘yes’ (n) 8.9 (15) 3.3 (11) <0.01 1 Test for significant difference between cases and controls
2 Includes person of American Indian (n=3 cases, 0 controls), Asian (n=5 cases, 7
controls), mixed (n=1 case, 4 controls) and unknown (n=4 cases, 0 controls) descent.

56
Table 4.2 Infant feeding practices by case-control status
Cases (n=171) Controls (n=342) P-value1
Percent ever breastfed (n) 76.0 (130) 72.2 (247) 0.36
Breastfeeding duration, months
(median ± IQR) 3.5 ± 4.0 5.0 ± 7.0 0.07
Percent ever formula fed (n) 89.5 (153) 85.3 (291) 0.19
Formula feeding, months (median
± IQR) 12.0 ± 4.0 7.0 ± 12.0 <0.001
Age at introduction to solids,
months (median ± IQR) 8.0 ±4.0 6.0 ± 4.0 <0.001
Solids at ≤ 4 months % (n) 13.3 (21) 19.2 (61)
<0.001 Solids at 5-6 months % (n) 24.7 (39) 43.4 (138)
Solids at 7-9 months % (n) 28.5 (45) 18.2 (58)
Solids at ≥ 10 months % (n) 33.5 (53) 19.2 (61) 1 Test for significant difference between cases and controls

57
Results of unconditional logistic regression models for the OR and 95% CI of
ALL by age at introduction to solids, infant feeding practices and covariates are presented
in Table 4.3. In univariate models, the OR of ALL was significantly elevated among
children who began solid foods at 7-9 months or ≥ 10 months as well as with each
additional month of milk formula feeding (P for linear trend < 0.001). The ORs of ALL
were lower among Hispanic white compared to non-Hispanic white children but higher
among children of mothers who smoked during pregnancy and with increasing
birthweight of the index child.

58
Table 4.3 Multivariable logistic regression models for the OR and 95% CI of ALL by age
at introduction to solids
Unadjusted OR (95% CI) Adjusted OR (95% CI)
Race/ethnicity
Non-Hispanic white 1.00 1.00
Hispanic white 0.63 (0.42-0.94) 0.61 (0.30-1.25)
Non-Hispanic black 0.49 (0.23-1.02) 0.28 (0.08-1.05)
Sex
Female 1.00 1.00
Male 1.03 (0.71-1.48) 1.08 (0.56-2.08)
Maternal smoking during pregnancy
No 1.00 1.00
Yes 2.87 (1.29-6.39) 2.91 (0.55-15.32)
Birthweight (per 100g increase) 1.03 (1.00-1.07) 1.06 (1.00-1.13)
Older siblings
None 1.00 1.00
1 or more 0.80 (0.54-1.19) 0.87 (0.46-1.64)
Breastfeeding (per additional month) 0.99 (0.96-1.02) 0.99 (0.93-1.06)
Milk formula feeding (per additional month) 1.07 (1.03-1.11) 1.16 (1.08-1.25)
Age at introduction to solids
0-4 months 1.00 1.00
5-6 months 0.82 (0.45-1.51) 1.11 (0.40-3.16)
7-9 months 2.25 (1.20—4.23) 4.08 (1.42-11.71)
10 or more months 2.52 (1.36-4.68) 6.03 (2.06-17.72)

59
Age at introduction to solids remained the strongest risk factor for ALL in the
adjusted multivariable model. The OR of ALL was significantly higher among children
introduced to solid foods at 7-9 or ≥ 10 months of age (P for linear trend < 0.001). Each
additional month of milk formula feeding was positively associated with OR of ALL. No
differences in the OR of ALL persisted by race/ethnicity or maternal smoking in
pregnancy; however, increasing birthweight (per 100g) remained positively associated
with the OR of ALL.
Results of the sensitivity analysis omitting survivors are given in table 4.4. In the
adjusted model, the OR of ALL among Hispanic white compared to non-Hispanic white
children was significantly decreased, in contrast to the model using the full dataset.
Duration of milk formula feeding and introduction to solid foods at ≥ 7 months of age
remained positively associated with the OR of ALL.

60
Table 4.4 Multivariable logistic regression models for the OR and 95% CI of ALL by age
at introduction to solids among incident cases
Adjusted OR1 (95% CI)
Race/ethnicity
Non-Hispanic white 1.00
Hispanic white 0.51 (0.28 – 0.92)
Non-Hispanic black 0.54 (0.19 – 1.41)
Sex
Female 1.00
Male 0.90 (0.52 – 1.54)
Maternal smoking during pregnancy
No 1.00
Yes 1.15 (0.22 – 4.85)
Birthweight (per 100g increase) 1.03 (0.98 – 1.08)
Older siblings
None 1.00
1 or more 0.80 (0.47 – 1.35)
Breastfeeding (per additional month) 1.03 (0.98 – 1.08)
Milk formula feeding (per additional month) 1.11 (1.04 – 1.18)
Age at introduction to solids
0-4 months 1.00
5-6 months 1.02 (0.43 – 2.61)
7-9 months 3.59 (1.54 - 9.04)
10 or more months 3.91 (1.64 – 10.10)
1 adjusted for all listed variables

61
When logistic regression models were stratified according to whether the child had at
least 1 older sibling, the effect of later introduction to solid foods was only significant
among children without an older sibling. Considering children without an older sibling
(n=94 cases, 160 controls) the OR of ALL per additional month of age at the introduction
of solids was 1.20 (95% CI 1.03 – 1.39, data not shown). Among children with at least
one older sibling, there was no significant increase in the OR according to age at
introduction to solids (quartile 3, OR = 3.08, 95% CI = 0.72 – 13.18; quartile 4 OR =
3.13, 95% CI = 0.73 – 13.38). Stratification by presence of an older sibling had no effect
on the OR per additional month of milk formula feeding.
DISCUSSION
Our results suggest that children introduced to solid foods at 7 months or later are
at increased odds of pediatric ALL after adjustment for covariates. In stratified analyses,
this effect was significant only among children without an older sibling. Increasing
duration of milk formula feeding and higher birthweight were also significantly
associated with ALL, although their effects were smaller. The effect of duration of milk
formula feeding was unchanged when stratified by sibship status.
Research regarding the effect of age at introduction to solid foods and childhood
diet are mixed. A recent study reported no effect of introducing solids > 4 months on
childhood ALL, but noted a significant increase in the OR for childhood brain tumors151
.
This discrepancy may be due to differences in study populations or in the cut-off for ages,

62
as there was similarly no increase in the odds of ALL among children introduced to
solids at or before 6 months in our analysis. An emerging body of evidence suggests that
infant diet effects the maturation of the gut and oral microbiomes and the early immune
system152-155
; thus breastmilk and solid foods may represent immune challenges and may
have age-specific effects. Our finding that age at introduction to solids was a stronger
risk factor among children without an older sibling suggests the possibility of effect
modification by other immune exposures. While both ours and the Australian study151
adjusted for child’s birth order the available data did not permit us to assess the effect of
other markers of immune stimulation such as daycare attendance or early infections,
leaving open the possibility of residual confounding.
Prior research has reported both high birthweight2,3,5
and milk formula
feeding68,109,151
to be associated with pediatric ALL. Two studies examined the
association between ALL and the ages at which children were fed formula. MacArthur et
al. reported an increased odds of ALL among children who received more than 50% of
their diet from a milk supplement at 7-12 months of age68
, while Greenop et al. reported
increased odds of ALL among children who began receiving cow’s milk formula within
the first 14 days or who were exclusively formula fed for the first 6 months151
. Mean
serum IGF-1 levels are lower among breastfed than milk formula-fed infants19
, and high
birthweight is considered a marker of greater IGF-1 exposure in utero60
. IGF-1 induces
the proliferation of lymphoid progenitor cells in vitro61
and is the proposed mechanism
for the consistent associations of high birthweight and large-for-gestational age with
ALL60
. When our analysis was stratified by presence of an older sibling the effect of

63
duration of milk formula feeding remained significant in both groups, suggesting that
duration of milk formula feeding may work through a different mechanism than timing of
introduction of solids. Our findings of a positive association between birthweight and the
odds of ALL are consistent with the literature2,3,5
.
One strength of this study is its representation of Hispanic children. Recent
analysis of Surveillance, Epidemiology and End Results Program data suggest that the
proportion of ALL cases who are of Hispanic ethnicity is increasing. At the same time,
the 5-year ALL mortality hazard ratio among Hispanic children compared to non-
Hispanic white children increased over the previous decade156
. Future studies of
pediatric ALL must include Hispanic populations in order to address this inequality.
Secondly, whereas much previous research has been limited to the effect of any breast
feeding this study additionally accounts for the effects of formula and solid foods. We
are the first to report that the effect of infant diet may depend on whether the child
encounters other immune exposures in early life. On the basis of evidence that an
infant’s diet affects the development of the microbiome and the maturation of the
immune system152-155
we attempted to adjust for the child’s likelihood of acquiring other
immune exposures. Birth order, number of siblings and daycare attendance are
commonly used as markers of immune exposures in studies of pediatric ALL149
. Because
infants and children with older siblings may receive exposure to infective agents through
siblings which firstborn or only children would not, they may benefit from additional
protection against ALL148
. Therefore, we hypothesized that the potential immunogenic
effect of introduction of solid foods would be reduced in such children as their immune

64
systems are more likely to face concurrent challenges. The observed data are consistent
with this hypothesis.
A limitation of the current analysis is that the data did not permit calculation of the
duration of exclusive breast feeding according to the World Health Organization (WHO)
definition. Further, data on the specific solid foods first introduced were not available.
The WHO recommends maintaining breast feeding after six months of age as
complementary foods are introduced. Our findings are consistent with this
recommendation. Another limitation is that using whether a child has an older sibling as
a surrogate marker of immune exposures is imperfect149
. Presence of an older sibling
was chosen because it was not feasible to directly assess history of infections due to the
sparseness of this data in our sample. Finally, wide confidence intervals for the upper
categories of age at introduction to solids in the analysis stratified by older siblings reflect
the small numbers of children in these groups. Further research based on a greater
sample size is needed to confirm these results and provide more precise estimates of these
effects.
CONCLUSIONS
These findings suggest that infants who were introduced to solids later than 6
months of age were at increased odds of childhood ALL. Importantly, this effect may be
stronger among children who are absent other markers of immune exposure. Further
exploration of the vulnerable period in infancy related to the types of solid foods, other

65
markers of immune exposure and the mechanisms underlying their effects during the
second half of infancy is warranted.
ACKNOWLEDGEMENTS
The authors would like to thank all study participants for their contribution to the
published research. There are no funding sources or conflicts of interest to disclose. This
work was conducted at Baylor College of Medicine and the University of Texas at
Austin.

66
Chapter 5: The Relationships of Childhood Height and Weight to
Pediatric Acute Lymphoblastic Leukemia
ABSTRACT
Greater exposure to insulin-like growth factor 1 (IGF-1) is a putative risk factor
for pediatric acute lymphoblastic leukemia (ALL). Height at diagnosis, a marker of IGF-
1 exposure, has been tested in connection with ALL. Most prior studies have compared
cases to national reference data derived from earlier birth cohorts. Our objective was to
determine the association of height-for-age Z score (HAZ) at time of diagnosis with the
OR of ALL using a case-control design (N=498) with a contemporaneous population of
age- sex- and ethnicity-matched controls. We hypothesized that cases would have greater
mean HAZ at time of diagnosis/interview, after adjustment for weight-for-age (WAZ)
and weight-for-height (WHZ). HAZ was not associated with ALL. For each one
standard deviation increase in WAZ the OR of ALL was 0.83 (95% CI 0.68 – 0.99). The
OR of ALL was increased among children with either a WAZ ≤ -2 (OR 5.10, 95% CI
1.85 – 16.75) or WHZ of ≤ -2 (OR 5.27, 95% CI 1.65 – 23.61). Previous findings of
taller height among ALL cases may arise from the choice of control populations.
Children with low WAZ or WHZ were at increased odds of ALL; these findings may
reflect acute malnutrition due to disease.

67
INTRODUCTION
Growth hormone (GH) and somatomedins have been proposed to play a role in
the etiology of pediatric acute lymphoblastic leukemia (ALL). Repeated findings of
higher mean birthweight among ALL cases as compared to controls co-occur with higher
mean cord blood insulin-like growth factor 1 (IGF-1) levels in infants and therefore
support the hypothesis that children with higher levels of GH or somatomedins are at
greater risk of ALL3-5,60
. IGF-1 and GH directly related to stature20,157
. This has led
some to test the hypothesis that children diagnosed with ALL are taller than their peers158-
166. Higher birthweight or taller height at diagnosis may reflect greater early life
exposure to GH and IGF-160
.
Studies of height and ALL most commonly compare the heights or age-adjusted
heights of ALL cases to either national reference data for childhood growth158-161,165,166
or
to an internal control group selected from the same source population as cases163,164
.
Results from these studies are mixed; some have reported that ALL cases are taller than
expected158-160,165,166
whereas others report null associations161-164
. These discrepancies
may be explained at least in part by the differences in the referent group for cases. Both
studies using an internal control group reported no relationship between height and
ALL163,164
. Among six studies which compared cases to reference data158-161,165,166
five
reported a positive association between height and ALL158-160,165,166
. National reference
data are updated periodically but may still include older birth cohort data and not reflect
norms for birth cohorts from which the cases are recruited. In the United States, for

68
example, growth references were last updated in 2000 although some of the data on
which these norms are based were collected prior to 1980167
. Due to a secular trend
towards increased height in the population168
, a potential methodological weakness of
studies which compare incident ALL cases to national reference data is that any finding
of taller height among cases may reflect a general trend towards increased height in the
population over time, rather than a biological association of height with disease. Because
of this, further studies of height and ALL using cases and matched controls are required.
Early life GH and IGF-1 levels may also affect weight in children. Greater intake
of energy and protein in infancy and childhood is associated with higher total and
bioavailable IGF-1 levels19,20,35,36
and with greater body mass7,9,19
. Therefore, age- or
height-adjusted weight may also be useful as a marker of GH and IGF-1 exposure and
could be expected to share the putative etiological role of height in leukemogenesis.
Indeed, Suminoe et. al. reported a significantly higher proportion of ALL cases with body
weight 2 or more standard deviations above the mean at time of diagnosis166
. Despite
this, associations of weight-for-age and weight-for-height with ALL risk are less studied
than height-for-age. We wished to adjust for the effects of weight when testing for an
association of height with ALL. We also wanted to determine whether weight-for-age or
weight-for-height are associated with ALL risk independent of height-for-age. Whether
these factors are associated with ALL is of interest in populations with high rates of
pediatric overweight and obesity169
.

69
The objective of this study was to determine whether there is an association
between height-for-age Z score (HAZ) at time of diagnosis and the OR of ALL using a
contemporaneous population of controls drawn from the same population during the
same years. We hypothesized that ALL cases would be taller than controls (have a
higher mean HAZ) at time of diagnosis/interview and that increasing HAZ would be
positively associated with the OR of ALL in logistic regression models. We also tested
whether weight-for-age Z score (WAZ) and weight-for-height Z score (WHZ) were
associated with the OR of ALL independently of HAZ.
MATERIALS AND METHODS
Subjects
Among 255 ALL cases diagnosed between 1997 and 2015 at Texas Children’s
Hospital, 249 children and adolescents ≤ 14 years of age were included in this study;
thereby excluding six cases age 15 and older. The 249 cases were frequency matched to
249 population-based controls (total N=498) on sex, ethnicity and age at
diagnosis/interview. Controls were recruited between June 2008 and January 2014.
Parents of cases and controls provided data on race, ethnicity, parental educational
attainment and child’s birthweight, sex and age at diagnosis/interview. Race was
classified as white, black or other. Ethnicity was classified as Hispanic or non-Hispanic.
Maternal education was classified as less than high school, high school or GED or post-
high school, which included trade or technical school, college, and post-graduate
education. Height (in cm) and weight (in kg) at diagnosis were abstracted from medical

70
records for cases. When height and/or weight had been measured multiple times, the
measurement taken on the date closest to the date of diagnosis was used. Trained
interviewers recorded height and weight among controls at the time of entry into the
study.
Statistics
HAZ and WAZ scores were computed from the Centers for Disease Control and
Prevention (CDC) 2000 growth charts using the LMS (lambda-mu-sigma) method
detailed on their website170
. This method produces a Z-score using the given physical
measurement (X), the median for that age and sex (M), the generalized coefficient of
variation (S) and the power in the Box-Cox transformation (L) according to the following
formulas:
𝑍 =((
𝑋
𝑀)
𝐿)−1
𝐿𝑆, 𝐿 ≠ 0 or 𝑍 =
ln(𝑋
𝑀)
𝑆, 𝐿 = 0
Weight-for-length Z scores were computed for children less than 3 years of age
and for recumbent length measurements 45 – 103.5 cm. Weight-for-stature Z scores
were computed for children ages 3 years and older who had a measured height between
77 and 121.5 cm. 356 children (188 cases and 168 controls) met these criteria.
Hereafter, we refer to weight-for-length and weight-for-stature collectively as weight-for-
height (WHZ).

71
Chi-squared tests were used to test for differences in the proportions of sex, race,
ethnicity and maternal education by case-control status. The distributions of HAZ, WAZ
and WHZ among cases and controls were visually examined using density plots. The
two-sample Kolmogorov-Smirnov test with Bonferroni-Holm correction was used to test
for differences in the distributions of HAZ, WAZ and WHZ by case-control status.
Analysis of variance with Bonferroni-Holm post-hoc correction was used to test for
differences in mean HAZ, WAZ and WHZ between cases and controls overall and within
the age categories 0-4 years and 5 or more years.
Univariate and then multiple logistic regression analysis were computed to
estimate the odds ratio (OR) of ALL according to HAZ, WAZ and WHZ and then after
adjustment for sociodemographic covariates. First, single variable models for the OR of
ALL based on HAZ, WAZ and WHZ were computed. Two adjusted models were then
created, one which contained HAZ and WHZ and another which contained WAZ and
HAZ. Both included maternal education and race/ethnicity as covariates. These same
models were then computed with anthropometric Z scores reported as three-level
categorical variables (≤ -2, -1.99 – 1.99, ≥ 2). Statistical analysis was conducted in R
version 3.2.5 and RStudio version 0.98.939. Density plots were generated using the
ggplot2 package171
.
IRB approval
This study was approved by the Institutional Review Boards of the University of
Texas at Austin (IRB# 2012-05-0029) and Baylor College of Medicine (IRB# H-29892).

72
RESULTS
Table 5.1 lists sociodemographic characteristics of cases and controls. A higher
proportion of cases than controls were white whereas a lower proportion was black.
There were no differences by sex, ethnicity, age at diagnosis/interview or maternal
education between cases and controls.

73
Table 5.1 Characteristics of cases and controls
Participant Characteristics Cases N (%) Controls N (%) P-value
Total 249 249
Sex
1.00
Male 137 (55.0%) 137 (55.0%)
Female 112 (45.0%) 112 (45.0%)
Age at diagnosis/interview
0.53 <5 years 106 (42.6%) 114 (45.8%)
5 years or older 143 (57.4%) 135 (54.2%)
Race
< 0.01
White 223 (89.9%) 184 (73.9%)
Black 14 (5.6%) 54 (21.7%)
Other 11 (4.4%) 11 (4.4%)
Ethnicity
0.42 Non-Hispanic 110 (44.2%) 120 (48.2%)
Hispanic 139 (55.8%) 129 (51.8%)
Mother's Education
0.94
Less than High School 36 (14.8%) 36 (14.7%)
High School or GED 57 (23.4%) 54 (22.0%)
Post High School 151 (61.9%) 155 (63.3%)
Not Specified 5 (2.0%) 4 (1.61%)

74
Table 5.2 shows the means and standard deviations for HAZ, WAZ and WHZ
among cases and controls overall and by age category. There were no differences in
mean HAZ between cases and controls. Considering the entire study sample, cases had
lower mean WAZ and WHZ scores than did controls. Lower mean WAZ among cases
was also evident among children aged 5 or older.

75
Table 5.2 Height-for-Age, Weight-for-Age and Weight-for-Height Z scores (Mean ± SD)
of cases and controls
Participant Characteristics Mean Z-Score (SD)
Cases Controls P-value*
Height-for-Age Z-Score
Overall -0.16 (1.13) -0.10 (1.26) 0.62
<5 years -0.22 (1.16) -0.42 (1.24) 0.31
5 years or older -0.05 (1.09) 0.28 (1.08) 0.09
Weight-For-Age Z-Score
Overall -0.05 (1.30) 0.20 (1.21) 0.03
<5 years -0.14 (1.28) -0.09 (1.27) 0.74
5 years or older 0.08 (1.33) 0.53 (1.04) 0.03
Weight-For-Height Z-Score
Overall 0.02 (1.29) 0.36 (1.99) 0.05
<5 years 0.05 (1.29) 0.32 (2.20) 0.71
5 years or older -0.08 (1.33) 0.50 (0.91) 0.70
*Post-hoc ANOVA comparisons use the Bonferroni-Holm correction for multiple testing

76
Figure 5.1 provides density plots for the distributions of HAZ, WAZ and WHZ
among cases and controls. After adjustment for multiple comparisons, there was a
significant difference in the distribution of WHZ by case-control status (p < 0.005).
Figure 5.1 Distributions of Height-for-Age, Weight-for-Age and Weight-for-Height Z
scores among cases (blue) and controls (red)
Tables 5.3 and 5.4 present results of multivariable logistic regression models for
the adjusted OR of ALL. In adjusted models the continuous parameterizations of HAZ
and WHZ were not associated with the OR of ALL (5.3A & 5.3B). WAZ was negatively
associated with the OR of ALL. When anthropometrics were analyzed categorically, the
OR of ALL was elevated among children with WAZ or WHZ ≤ -2 (5.4A & 5.4B). A
consistently reduced OR of ALL was observed across all models when comparing black
to white children.

77
Table 5.3 Multivariable logistic regression models of Height-for-Age and Weight-for-
Height Z scores on the odds ratio of ALL
Adjusted OR (95% CI)
Height-for-age Z score 1.03 (0.85 – 1.26)
Weight-for-height Z score 0.89 (0.77 – 1.03)
Race
White 1.00
Black 0.26 (0.11 – 0.56)
Other 0.86 (0.26 – 3.06)
Ethnicity
Non-Hispanic 1.00
Hispanic 0.64 (0.39 – 1.06)
Maternal Education
Post high school 1.00
High School or GED 1.26 (0.72 – 2.21)
Less than high school 1.16 (0.62 – 2.18)

78
Table 5.4 Multivariable logistic regression models of Height-for-Age and Weight-for-
Age Z scores on the odds ratio of ALL
Adjusted OR (95% CI)
Height-for-age Z score 1.10 (0.90 – 1.35)
Weight-for-age Z score 0.83 (0.68 – 0.99)
Race
White 1.00
Black 0.18 (0.09 – 0.35)
Other 0.72 (0.45 – 1.07)
Ethnicity
Non-Hispanic 1.00
Hispanic 0.69 (0.45 – 1.07)
Maternal Education
Post high school 1.00
High school or GED 1.10 (0.69 – 1.77)
Less than high school 0.99 (0.57 – 1.72)

79
Table 5.5 Multivariable logistic regression models of Height-for-Age and Weight-for-
Height category on the odds ratio of ALL
Adjusted OR (95% CI)
Height-for-age Z score
≤ -2 1.34 (0.53 – 3.50)
-1.99 – 1.99 1.00
≥ 2 1.85 (0.36 – 13.58)
Weight-for-height Z score
≤ -2 5.27 (1.65 – 23.61)
-1.99 – 1.99 1.00
≥ 2 0.91 (0.39 – 2.12)
Race
White 1.00
Black 0.23 (0.10 – 0.52)
Other 0.69 (0.19 – 2.58)
Ethnicity
Non-Hispanic 1.00
Hispanic 0.61 (0.36 – 1.01)
Maternal Education
Post high school 1.00
High School or GED 1.24 (0.70 – 2.19)
Less than high school 1.16 (0.62 – 2.19)

80
Table 5.6 Multivariable logistic regression models of Height-for-Age and Weight-for-
Age category on the odds ratio of ALL
Adjusted OR (95% CI)
Height-for-age Z score
≤ -2 1.09 (0.42 – 2.92)
-1.99 – 1.99 1.00
≥ 2 0.68 (0.21 – 2.12)
Weight-for-age Z score
≤ -2 5.10 (1.85 – 16.75)
-1.99 – 1.99 1.00
≥ 2 1.20 (0.57 – 2.56)
Race
White 1.00
Black 0.16 (0.08 – 0.32)
Other 0.73 (0.29 – 1.85)
Ethnicity
Non-Hispanic 1.00
Hispanic 0.67 (0.43 – 1.05)
Maternal Education
Post high school 1.00
High school or GED 1.09 (0.68 – 1.75)
Less than high school 0.96 (0.55 – 1.69)

81
DISCUSSION
In this study of pediatric ALL cases and age-matched population-based controls,
no association was observed between HAZ and the OR of ALL. Some studies have
reported taller height among ALL cases than controls158-160,165,166
whereas others have
not161-164
. This inconsistency may be due to the use of different comparison groups in
these studies. Two of the studies used internal controls recruited specifically for the
study from the same underlying population rather than reference data; both reported no
association of height with ALL163,164
. Six of the studies158-161,165,166
did not have an
internal control group, instead comparing ALL cases to national reference data. Five of
these six reported a positive association of height with ALL158-160,165,166
. Davis et. al.
reported that male cases were 0.67 cm taller on average and female cases were 0.30 cm
taller on average than the population norm. Huang et. al. reported that cases had a mean
height z score of 0.29 (compared to a population mean of 0.00), equivalent on average to
a 1.32 cm difference in height between cases and population norms. A potential issue
with this approach is whether the reference data were contemporaneous with the ages of
the cases and therefore the time period for case ascertainment. For example, Broomhall
et. al. compared cases diagnosed in 1972-73 to reference data from the 1950’s, while
Huang et. al. compared cases diagnosed between 1988-2007 to values from the CDC
2000 growth charts, which are based partially on data collected before 1980167
. From
1960-2002 the United States experienced an increase in mean height of 2.03 cm among
boys ages 6-11 and an increase in mean height of 1.5 cm among girls ages 6-11168
. The
magnitude of this change exceeds the mean difference in height between ALL cases and
the total population of U.S. children reported by Huang et. al, for example160
. It is
possible therefore that studies which compare cases to older population values/birth

82
cohorts may report taller height among cases due to the secular trend in increased height
in the population over time rather than any true relationship between height and disease.
Two studies used reference data collected during the same years as case recruitment and
reported positive associations between height and ALL159,166
suggesting that validity of
reference data may not wholly explain the associations reported by other studies using
this methodology. Our data, consistent with those of other studies using age-matched
contemporaneous controls, do not support the hypothesis that children with ALL are
taller than the populations/birth cohorts from which they were drawn.
We examined the effects of WAZ and WHZ on the OR of ALL. Visual analysis
of the distributions of WAZ and WHZ indicated higher proportions of cases than controls
with Z scores < -2, a recognized cut-off for wasting172
. This was confirmed by the lower
mean WAZ among cases than controls overall and in the subgroup aged 5 years or older
as well as the lower mean WHZ among cases than controls overall. In the multiple
logistic regression models, the OR of ALL decreased by 17% for each 1 standard
deviation increase in WAZ and the OR was higher among children with WAZ or WHZ ≤
-2. Malnourishment among a subset of cases has been noted at approximately the same
frequency in other studies of ALL as in ours (5-10% of cases) and likely reflects the
disease process, as the absence of any deficit in HAZ suggests the absence of chronic
malnutrition172,173
. Although elevated, the ORs reported for WAZ and WHZ ≤ -2 should
be interpreted with caution as few children fell into these categories. In this analysis, 26
children (21 cases and 5 controls) were found to have WAZ ≤ -2 whereas 19 children (16
cases and 3 controls) were found to have WHZ ≤ -2. The importance of low WAZ and
WHZ as prognostic markers is unclear, with some studies reporting similar overall and
event-free survival in these children compared with those having WAZ or WHZ > -2174
and others reporting poorer outcomes in malnourished children172
.

83
All four logistic regression models show a significantly decreased OR of ALL
among African-Americans compared to whites, which is consistent with national data. In
contrast to the majority of published data, we also report non-significantly decreased ORs
of ALL among Hispanics compared to non-Hispanics175
. We find no association of ALL
with maternal education, which we included as a marker of socioeconomic status.
The greatest strength of this study is the use of an age-matched control group largely
recruited during the same time period, reducing potential confounding arising from
comparing cases to reference data which may have been collected 20 years or more prior
to the ALL cases. The use of measured height improves the accuracy of exposure
assessment and limits recall bias which arises in case-control studies from differential
self-report of exposures by parents or guardians of cases and controls. 53% of the study
sample was Hispanic; Hispanics are the largest growing segment of the U.S. population
and are at a higher risk of ALL175
. Therefore this study has the potential to help
understand the etiology of ALL in this group, who can be expected to represent an
increased proportion of ALL cases in the U.S. moving forward. Finally, this study
adjusted for child’s WAZ and WHZ when reporting the effect of height-for-age on the
OR of ALL. The majority of studies to date have not considered weight when reporting
the effects of height.
The lack of longitudinal data on WAZ and WHZ makes it difficult to determine
whether the lower mean WAZ and WHZ among cases at the time of diagnosis reflects
differential weight gain in childhood or acute malnourishment arising from the disease.
These findings are presumed to reflect acute changes in nutritional status secondary to
disease onset. However, if in fact they are not acute in nature then a small portion of
ALL cases may display a pattern of low weight gain for a period of time prior to the onset
of disease. The small numbers of children with Z-scores below -2 leads to imprecise

84
estimates of effect size. Finally, we computed anthropometric Z scores for both cases
and controls from the CDC 2000 growth data for children in the United States. As
mentioned previously, these data are based in part on data collected in previous
generations of children. This could potentially inflate mean z scores in our study sample
if the average height and weight of children are increasing over time. However, this
applies both to cases and controls, so case-control comparisons should be unbiased by
any change in mean of HAZ, WAZ and WHZ.
CONCLUSIONS
This study does not support the hypothesis that ALL cases at diagnosis are taller
than age-matched controls. Findings of a positive association between height and ALL
primarily arise from studies which compare cases to reference data rather than to age-
matched controls. We report a negative association of weight-for-age Z-score with the
OR of ALL and higher ORs of ALL among children with either WAZ or WHZ-scores ≤ -
2 which are likely the result of a portion of ALL cases experiencing acute malnutrition at
the time of diagnosis.

85
Chapter 6: Conclusions
This research examined the effects of infant and childhood diet on thelarche at
10.8 and 12.9 years and serum IGF-1 levels at 10.8 years in healthy girls, as well as the
associations of infant feeding practices with the OR of pediatric ALL. We report
associations of thelarche with childhood dairy consumption, child’s weight and maternal
overweight and of ALL with longer duration of milk formula feeding and later age at
introduction to solid foods.
INFANT FEEDING PATTERNS, CHILDHOOD DIET AND PUBERTAL DEVELOPMENT IN GIRLS
Chapter 2 discusses the effects of in utero PE exposure, infant feeding practices
and diet from 3-5 years on IGF-1 levels and anthropometrics at 10.8 and 12.9 years in
Norwegian girls. We observed several differences in birth characteristics between infants
exposed to PE in utero compared to those not exposed which are consistent with the
literature57,71,85
. Infants exposed to PE in utero had shorter mean gestational length,
lower mean cord blood IGF-1 levels and lower mean birthweight and length. PE mothers
were younger than NT mothers.
Tanner breast stage was strongly positively related to serum IGF-1 levels at
follow-up, with girls having more advanced breast development also having higher serum
IGF-1 levels. Specifically, compared to Tanner 1 girls, mean serum IGF-1 was 20.9%
higher for Tanner 2 girls, 48.1% higher among Tanner 3 girls and 132.8% higher among
Tanner 4 girls. Taller children also had higher serum IGF-1 levels. Neither PE exposure
in utero nor dietary intake were associated with serum IGF-1 at follow-up. Although
higher intakes of milk, milk formula and animal protein are associated with higher serum
IGF-1 levels in infants and young children, there is a suspected negative association
between serum IGF-1 levels in childhood and adulthood. One study demonstrated lower

86
serum IGF-1 levels among adults who had received supplemental milk as children. serum
IGF-1 levels among adults who had received supplemental milk during childhood45
.
Greater weight gain during infancy predict higher adiposity in childhood and
adulthood7,43
. These data suggest that early life diet is involved in developmental
programming of body composition and serum IGF-1 levels. The relationships of infant
feeding practices to serum IGF-1 in older children and adolescents are not well studied.
This study does not provide evidence for these associations.
Child’s weight and maternal overweight were positively associated and frequency
of dairy consumption was negatively associated with the OR of thelarche at 10.8 years.
This is consistent with prior studies, which have identified earlier onset of puberty among
heavier girls46,176-178
. In our sample, frequency of dairy consumption was significantly
associated with a reduced OR of thelarche at 10.8 years and non-significantly negatively
associated with weight. These data suggest dairy consumption in childhood may reduce
BMI in adolescent girls, leading to a lower proportion of girls having undergone
thelarche at 10.8 years. At 12.9 years, only current weight and height were associated
with more advanced breast development, defined as Tanner breast stage 3 or above after
adjustment for covariates.
This research provides limited evidence that breastfeeding may modify the
associations of PE exposure in utero and childhood diet with thelarche at 10.8 years. PE
exposure in utero was associated with a reduced OR of thelarche among exclusively
breastfed girls. Conversely, childhood frequency of dairy consumption was not
associated with the OR of thelarche. There is evidence in the literature for effect
modification of in utero exposures by breastfeeding status. One study found methylation
levels at the gene H19 were higher among children born ≥ 85th
percentile of birthweight-
for-gestational age, and that H19 higher methylation was associated with the risk of

87
overweight or obesity at 1 year. Breastfeeding attenuated birthweight-associated changes
in H19 methylation fraction and breastfed children were not at increased risk of
overweight or obesity according to H19 methylation98
. Replication studies will be
required to determine whether our findings are reflective of effect modification by
breastfeeding status.
INFANT FEEDING PATTERNS, CHILDHOOD ANTHROPOMETRICS AND PEDIATRIC ALL
Chapters 3 & 4 examined the effects of infant feeding practices on pediatric ALL.
The OR of ALL is increased among children who received milk formula feeding longer
(OR per each additional month of milk formula feeding 1.17, 95% CI 1.09 – 1.25).
These data support the hypothesis that longer duration of milk formula feeding increases
the risk of ALL, which was developed on the basis of evidence that milk formula feeding
increases serum IGF-1 levels in children and does not provide an equivalent stimulus for
the development of the immune system as breastmilk. The OR of ALL is also increased
among children introduced to solid foods later (OR per each additional month of age at
the introduction of solids 1.18, 95% CI 1.07 – 1.30)109
. Both higher IGF-1 exposure and
delayed immune exposures are believed to increase risk of pediatric ALL60,139
.
We next sought to identify whether there were critical ages for the introduction of
solid foods in pediatric ALL. Children introduced to solid foods at either 7 months of
age or later were at increased odds of ALL compared to children introduced at ≤ 6
months of age. There was a significant linear trend towards increasing OR of ALL with
increasing age at introduction to solids. Children introduced at ≥ 10 months of age were
at the highest odds of ALL (OR of ALL 6.03, 95% CI 2.06 – 17.72 as compared to
children introduced to solids at 0-4 months). Although the sample size (n = 171 cases,
342 controls) does not allow for precise estimates of the OR of ALL for children

88
introduced in each quartile, these data provide evidence that delayed introduction of
solids increases the risk of ALL.
Finally, we used height and weight at time of diagnosis as proximal markers of
IGF-1 exposure in children. We tested the hypothesis that children diagnosed with ALL
would be taller than their healthy peers. Findings regarding the association of height at
diagnosis with ALL risk are mixed, possibly owing to inconsistent study designs. We
compared the age- and sex- adjusted heights of cases to age- and sex- matched
contemporaneous controls and reported no association of height at diagnosis with ALL
after adjustment for weight-for-age or weight-for-height plus covariates. Mean WAZ
was lower among ALL cases and the OR of ALL was inversely associated with weight-
for-age Z score (OR per 1-unit increase in WAZ 0.83, 95% CI 0.68 – 0.99).
There are inherent difficulties involved in using height at diagnosis as a surrogate
for infant feeding exposures. Any effect of infant feeding practices on height at time of
diagnosis may be obscured by more proximal nutritional exposures and health status,
particularly in older children. Height is also a heritable trait and it is possible that genetic
factors which determine height are the same as or co-vary with genetic traits that
determine ALL risk. Because taller height is an indicator of greater IGF-1 exposure, the
lack of a positive association between height and ALL may also indicate the lack of
involvement of IGF-1 in determining ALL risk. This explanation is less likely given the
extensive body of research indicating both mechanistic and epidemiologic linkages
between IGF-1 and leukemogenesis.
PUBLIC HEALTH IMPLICATIONS
This research was conducted to explore the effects of infant and childhood diet on
health and disease outcomes. These data provide evidence that infant and childhood diet

89
affect pubertal development and risk of multiple non-communicable diseases throughout
the life course.
Childhood dairy consumption from 3-5 years was associated with reduced OR of
thelarche in girls at 10.8 years. Earlier age at onset of puberty in girls increases lifetime
risk of breast cancer, which is the most common non-cutaneous cancer among women in
the United States52
. Small changes in mean age at onset of puberty in girls would result
in practically important changes in the burden of breast cancer in the total population179
.
We report a non-significant negative relationship of frequency of dairy intake from 3-5
years and weight at follow-up, which has previously been noted in both pediatric180
and
adult populations181
. This association may be explained by the negative correlation of
dairy consumption with sugar-sweetened beverage consumption182,183
. Given that
increased child and maternal weight were associated with breast development at 10.8
years and more advanced breast development at 12.9 years it is possible that increased
childhood dairy consumption acts to decrease the likelihood of breast development at
10.8 years by reducing bodyweight and adiposity in children. Hence, interventions
designed to increase dairy intake in children and adolescents have the potential to
decrease bodyweight. Such changes would likely be reflected in reduced incidence of
chronic disease during adulthood, specifically cancer, diabetes and cardiovascular
disease.
Infant feeding practices were associated with the OR of pediatric ALL. ALL is
the most common pediatric cancer in the United States52
. The Centers for Disease
Control estimates approximately 4,000 new cases of ALL will be diagnosed in children
and adolescents in 2016. In contrast with most other pediatric cancers, the incidence rate
of ALL is increasing175
. This parallels the rising incidence of other pediatric conditions
related to diet and immunity, for example type 1 diabetes184
and food allergies and likely

90
reflects changes in early life exposures over the last several decades184-186
. Additionally,
it is known that Hispanic children are at a higher risk of ALL as compared to non-
Hispanic white children187
. Therefore the increase in ALL incidence may also reflect the
higher proportion of Hispanics in the U.S. population over this time. Although 5-year
survival rates among children aged 1-14 are high relative to other cancers ALL survivors
are at increased risk of a number of late effects over the life course as a result of
treatment. These include increased risk of a second malignant neoplasm or
cardiovascular disease, overweight and obesity and reduced intelligence quotient188-193
.
These statistics suggest the burdens of ALL incidence and survivorship will increase in
the years to come and recommend research focused on improving our understanding of
ALL etiology and prevention.
Duration of formula feeding and timing of introduction to solids are strong
candidates for ALL prevention efforts. Many risk factors for ALL are genetic or non-
modifiable. Infant feeding practices are among the most comprehensively researched
non-genetic risk factors for ALL and there is already considerable interest in improving
breastfeeding rates among mothers for prevention of childhood overweight and obesity,
necrotizing enterocolitis in premature infants and common childhood infections44
. While
a majority of Hispanic mothers initiate breastfeeding, they demonstrate shorter mean
breastfeeding duration compared to non-Hispanic whites and are more likely to provide
formula in addition to breastmilk11,194,195
. Increasing breastfeeding duration and
decreasing formula feeding duration among Hispanic mother-infant dyads may reduce
ALL incidence in this already at-risk population.
In summary, this research provides evidence that infant and childhood diet are
associated with ALL in childhood and breast cancer and cardiovascular disease in
adulthood. Seminal studies of children born during the Dutch Hunger Winter as well as

91
more recent longitudinal studies of diet and growth during infancy and childhood suggest
that lifetime risk of many non-communicable diseases is established during early life.
Infant and childhood diet are modifiable risk factors in the prevention of pediatric ALL
and chronic diseases.
FUTURE DIRECTIONS
Future work in infant feeding and ALL aims to 1) robustly estimate the effects of
duration of formula feeding (modeling exclusive formula feeding separately from mixed
breast- and formula-feeding) and age at introduction to solid foods in a pooled analysis of
infant feeding data from multiple study sites to enhance statistical power and 2) to use
metagenomics and metabolomics to identify putative molecular mechanisms for infant
feeding-ALL associations. There is mounting evidence to demonstrate that infant diet
affects development of the gut microbiome and systemic immune system. However, the
gut microbiome has not been studied in connection with ALL. I will conduct this work
as the Cancer Prevention Research Institute of Texas molecular epidemiology
postdoctoral fellow at Baylor College of Medicine (BCM).
The gut microbiome, immune system and risk of ALL
Breastmilk contains bioactive compounds such as immunoglobulin A (IgA) and a
variety of human milk oligosaccharides (HMOs), the most abundant of which is 2’-
fucosyllactose (2’-FL). These compounds affect antibacterial and antimicrobial activity
in the gut and oral cavity of infants and are the primary determinant of the infant’s gut

92
microbiome. Evidence from animal models suggests that HMOs and commensal
intestinal bacteria are involved in the development of the infant’s immune system.
Breastmilk is a vector for the transfer of immunogenic compounds from mother to
infant. In neonates, IgA secreted in breastmilk plays a critical role in facilitating normal
immune responses among infants196
. Breastmilk supports the activity of xanthine oxidase
and lactoperoxidase, two key antimicrobial enzymes in the oral cavity of infants. In the
presence of breastmilk these enzymes produce hydrogen peroxide at concentrations
which are adequate to inhibit the growth of pathogenic bacteria such as Staphylococcus
aureus and Salmonella spp155
. It is also known that the relative abundances of bacteria in
the infant intestine differ between breastfed and formula-fed infants. The greater
carbohydrate content and presence of HMOs in breastmilk are associated with a gut
microbiome which is more diverse and is enriched for Bifidobacteria197-199
. Acetate
produced by Bifidobacteria as an end-product of carbohydrate metabolism has been
shown to inhibit growth of Escherichia coli and to prevent death in E. coli 0157 infected
mice200
.
While breastmilk and commensal bacteria bolster immune response in neonates,
there is mounting evidence that they also participate in developmental programming of
the immune system. This is manifested both directly, through the interactions of HMOs
in peripheral blood with immune cells as well as indirectly through interactions of the
mucosal immune system with commensal bacteria. Goehring et. al. identified multiple
HMOs including 2’-FL in urine and plasma of breastfed but not formula-fed infants using
gas chromatography/mass spectrometry201
indicating that these molecules are absorbed

93
into the infant’s bloodstream. Lymphocytes isolated from piglets and cultured ex vivo
with HMOs show a number of differences from cells unexposed to HMOs. These
include oligosaccharide-specific effects on T-cell proliferation; lower T-helper cell
counts and greater cytotoxic T-cell counts among HMO-exposed cells in response to
challenge with lipopolysaccharide; and increased interleukin-10 production among
HMO-exposed cells153
.
Short-chain fatty acids and other metabolites derived from the microbiome have
been proposed to regulate development of the infant immune system through an
epigenetic mechanism, with breastfed infants showing greater expression of genes
involved in the development of immunity202,203
. Infants with higher stool abundance of
Bifidobacteria also show more robust immune responses204
and infant feeding patterns
have been associated with natural killer cell and T-cell counts152
. Finally, breastfed
rhesus macaques showed more robust correlation networks between T-cell subsets during
the juvenile period (3-5 years) than never-breastfed animals205
, suggesting that
relationships between infant feeding patterns and immune cell activation may persist at
least into adolescence. As an infant is weaned the diversity of the microbiome increases
and shifts towards that of an adult; this process is believed to be complete by
approximately 3 years of age. Greater microbial diversity results in immune
development as the infant is exposed to a wider array of antigens206
.
Abnormal early development of the immune system is believed to be a key event
in the natural history of pediatric ALL53
. Although certain oncogenic gene fusions are
recurrently identified in pediatric ALL cases, some cases do not harbor any identifiable

94
genetic risk factors and many children with these mutations will not develop ALL53,207
. It
is believed that ALL arises in at-risk children whose immune systems do not develop
appropriately, commonly as a result of delayed immune exposures (a “two-hit” model)139
.
These findings support a potential IGF-1 independent relationship of infant diet with
ALL risk – reduced stimulation of the immune system and lower diversity of the gut
microbiome among infants who are formula-fed or introduced to solid foods later,
resulting in a less robust immune system during early life.
I propose to collect infant feeding data and stool samples on incident ALL cases
and healthy controls through 3 years of age (at which point the gut microbiome is more
like that of an adult)208
. I will then characterize how the gut microbiome and metabolome
differ among cases and controls; and whether infant feeding patterns affect microbial
diversity and microbial metabolites uniquely among cases v. controls. Bacterial diversity
will be characterized using 16s rRNA sequencing. We will interrogate the metagenomes
and blood metabolomes of cases and controls for differences in bacterial activity and
metabolites. Detection of changes to the gut microbiomes of ALL cases and controls by
type and duration of formula feeding and also by age at/delayed introduction of solids
will be used to identify putative ALL-associated changes in the microbiome. This will
accelerate understanding of ALL etiology and aid in cancer prevention since infant
feeding practices and early diet are highly modifiable behaviors.
In another phase of my postdoctoral studies, I propose to undertake a longitudinal
study of the blood metabolome of ALL cases pre- and post-induction therapy to identify

95
compounds that predict treatment response. This information will then be used to
improve current risk stratification and treatment algorithms in pediatric ALL.
Dr. James Versalovic of the Texas Children’s Microbiome Center and Dr.
Michael Scheurer will serve as mentors for this research. Dr. Scheurer, Dr. Michele
Forman and I have collaboratively designed an infant feeding questionnaire which is
already in use at BCM and provides the exposure data required for this research. The
infant feeding questionnaire was validated as part of the National Children’s Study
Formative Research led by Dr. Forman and the CDC Infant Feeding Practices II Study
(Appendix B).
Pooled analysis of infant feeding data
Working with Dr. Scheurer and Dr. Forman I have also proposed a pooled
analysis of infant feeding data through the Childhood Leukemia International Consortium
(CLIC). Under the supervision of Dr. Scheurer, who is a CLIC member, and Dr. Forman
I will conduct a pooled analysis of infant feeding data from CLIC study sites. The goal
of this research is to determine the effects of duration of any breastfeeding and exclusive
breastfeeding, duration of any formula feeding and exclusive formula feeding and age at
introduction to solid foods on the risk of pediatric ALL. This research will produce
robust estimates of the effects of duration of simultaneous breast and formula feeding as
compared to exclusive formula feeding and exclusive breast feeding on the risk of ALL
by pooling infant feeding data from multiple study centers to increase sample size and
precision in the magnitude of effect. It will also be the first such study to separately

96
estimate the risk of ALL according to exclusive as compared to mixed breast and formula
feeding. I hypothesize that longer duration of formula feeding will be associated with an
increased OR of ALL and that this effect will be greater in the exclusively formula fed
than the breastfed or breast- and formula-fed children. Regarding solid foods, I
hypothesize that older age at time of introduction to solid foods will be associated with an
increased OR of ALL. This research has the potential to identify whether there is a dose-
response relationship between formula feeding and risk of ALL and in conjunction with
analysis of the responses of the case and control microbiomes to infant feeding practices
identify putative molecular mechanisms for these associations. The results may
strengthen the evidence for longer duration of formula feeding and later introduction to
solid foods as risk factors for pediatric ALL and aid in cancer prevention efforts by
identifying modifiable risk factors.

97

98
Appendix A: Case-Control Consent Form

99

100

101

102

103

104

105

106

107

108

109

110

111
112

113

114
Appendix B: Texas-Oklahoma Pediatric Neuro-oncology Consortium
Case-Control Questionnaire

115

116

117

118

119

120

121

122

123

124

125

126

127

128

129

130

131

132

133

134

135

136

137

138

139

140

141

142

143

144

145

146
References
1. Alexander BT, Dasinger JH, Intapad S. Fetal programming and cardiovascular
pathology. Comprehensive Physiology. Apr 2015;5(2):997-1025.
2. Schuz J, Forman MR. Birthweight by gestational age and childhood cancer.
Cancer Causes Control. Aug 2007;18(6):655-663.
3. Caughey RW, Michels KB. Birth weight and childhood leukemia: a meta-analysis
and review of the current evidence. Int. J. Cancer. Jun 1 2009;124(11):2658-
2670.
4. Paltiel O, Tikellis G, Linet M, et al. Birthweight and Childhood Cancer:
Preliminary Findings from the International Childhood Cancer Cohort
Consortium (I4C). Paediatr. Perinat. Epidemiol. May 19 2015.
5. Milne E, Greenop KR, Metayer C, et al. Fetal growth and childhood acute
lymphoblastic leukemia: Findings from the Childhood Leukemia International
Consortium (CLIC). Int. J. Cancer. Jun 10 2013.
6. Ejlerskov KT, Christensen LB, Ritz C, Jensen SM, Molgaard C, Michaelsen KF.
The impact of early growth patterns and infant feeding on body composition at 3
years of age. Br. J. Nutr. Jul 1 2015:1-12.
7. de Beer M, Vrijkotte TG, Fall CH, van Eijsden M, Osmond C, Gemke RJ.
Associations of infant feeding and timing of linear growth and relative weight
gain during early life with childhood body composition. Int. J. Obes. (Lond.). Dec
1 2014.
8. Fujiwara T, Oguni T, Unishi G, Tanabe T, Ohbayashi K, Kaneko K. Factors
related to patterns of body mass index in early infancy: 18 month longitudinal
study. Pediatr. Int. Jun 2014;56(3):406-410.
9. Gianni ML, Roggero P, Morlacchi L, Garavaglia E, Piemontese P, Mosca F.
Formula-fed infants have significantly higher fat-free mass content in their bodies
than breastfed babies. Acta Paediatr. Jul 2014;103(7):e277-281.
10. Grjibovski AM, Ehrenblad B, Yngve A. Infant feeding in Sweden: socio-
demographic determinants and associations with adiposity in childhood and
adolescence. International breastfeeding journal. 2008;3:23.

147
11. Gross RS, Mendelsohn AL, Fierman AH, Hauser NR, Messito MJ. Maternal
Infant Feeding Behaviors and Disparities in Early Child Obesity. Childhood
obesity (Print). Mar 25 2014.
12. Gunther AL, Remer T, Kroke A, Buyken AE. Early protein intake and later
obesity risk: which protein sources at which time points throughout infancy and
childhood are important for body mass index and body fat percentage at 7 y of
age? Am. J. Clin. Nutr. Dec 2007;86(6):1765-1772.
13. Hathcock A, Krause K, Viera AJ, Fuemmeler BF, Lovelady C, Ostbye T. Satiety
responsiveness and the relationship between breastfeeding and weight status of
toddlers of overweight and obese women. Maternal and child health journal. May
2014;18(4):1023-1030.
14. Imai CM, Gunnarsdottir I, Thorisdottir B, Halldorsson TI, Thorsdottir I.
Associations between infant feeding practice prior to six months and body mass
index at six years of age. Nutrients. Apr 2014;6(4):1608-1617.
15. Jensen SM, Ritz C, Ejlerskov KT, Molgaard C, Michaelsen KF. Infant BMI peak,
breastfeeding, and body composition at age 3 y. Am. J. Clin. Nutr. Feb
2015;101(2):319-325.
16. Klag EA, McNamara K, Geraghty SR, Keim SA. Associations Between Breast
Milk Feeding, Introduction of Solid Foods, and Weight Gain in the First 12
Months of Life. Clin. Pediatr. (Phila.). Feb 2 2015.
17. Li R, Fein SB, Grummer-Strawn LM. Association of breastfeeding intensity and
bottle-emptying behaviors at early infancy with infants' risk for excess weight at
late infancy. Pediatrics. Oct 2008;122 Suppl 2:S77-84.
18. Li R, Magadia J, Fein SB, Grummer-Strawn LM. Risk of bottle-feeding for rapid
weight gain during the first year of life. Arch. Pediatr. Adolesc. Med. May
2012;166(5):431-436.
19. Madsen AL, Larnkjær A, Mølgaard C, Michaelsen KF. IGF-I and IGFBP-3 in
healthy 9 month old infants from the SKOT cohort: breastfeeding, diet, and later
obesity. Growth Horm. IGF Res. Aug 2011;21(4):199-204.
20. Ong KK, Langkamp M, Ranke MB, et al. Insulin-like growth factor I
concentrations in infancy predict differential gains in body length and adiposity:
the Cambridge Baby Growth Study. Am. J. Clin. Nutr. Jul 2009;90(1):156-161.

148
21. Rose CM, Savage JS, Birch LL. Patterns of early dietary exposures have
implications for maternal and child weight outcomes. Obesity (Silver Spring,
Md.). Dec 31 2015.
22. Marriage BJ, Buck RH, Goehring KC, Oliver JS, Williams JA. Infants Fed a
Lower Calorie Formula with 2'-fucosyllactose (2'FL) Show Growth and 2'FL
Uptake Like Breast-Fed Infants. J. Pediatr. Gastroenterol. Nutr. Jul 6 2015.
23. Socha P, Grote V, Gruszfeld D, et al. Milk protein intake, the metabolic-
endocrine response, and growth in infancy: data from a randomized clinical trial.
Am. J. Clin. Nutr. Dec 2011;94(6 Suppl):1776S-1784S.
24. Weber M, Grote V, Closa-Monasterolo R, et al. Lower protein content in infant
formula reduces BMI and obesity risk at school age: follow-up of a randomized
trial. Am. J. Clin. Nutr. May 2014;99(5):1041-1051.
25. Brunner S, Schmid D, Zang K, et al. Breast milk leptin and adiponectin in relation
to infant body composition up to 2 years. Pediatr. Obes. Feb 2015;10(1):67-73.
26. Alderete TL, Autran C, Brekke BE, et al. Associations between human milk
oligosaccharides and infant body composition in the first 6 mo of life. Am. J. Clin.
Nutr. Dec 2015;102(6):1381-1388.
27. Kon IY, Shilina NM, Gmoshinskaya MV, Ivanushkina TA. The study of breast
milk IGF-1, leptin, ghrelin and adiponectin levels as possible reasons of high
weight gain in breast-fed infants. Ann. Nutr. Metab. 2014;65(4):317-323.
28. Savino F, Fissore MF, Grassino EC, Nanni GE, Oggero R, Silvestro L. Ghrelin,
leptin and IGF-I levels in breast-fed and formula-fed infants in the first years of
life. Acta Paediatr. May 2005;94(5):531-537.
29. Disantis KI, Collins BN, Fisher JO, Davey A. Do infants fed directly from the
breast have improved appetite regulation and slower growth during early
childhood compared with infants fed from a bottle? The international journal of
behavioral nutrition and physical activity. 2011;8:89.
30. Li R, Fein SB, Grummer-Strawn LM. Do infants fed from bottles lack self-
regulation of milk intake compared with directly breastfed infants? Pediatrics.
Jun 2010;125(6):e1386-1393.
31. Assuncao ML, Ferreira HS, Coutinho SB, Santos LM, Horta BL. Protective effect
of breastfeeding against overweight can be detected as early as the second year of

149
life: a study of children from one of the most socially-deprived areas of Brazil.
Journal of health, population, and nutrition. Mar 2015;33(1):85-91.
32. Ramirez-Silva I, Rivera JA, Trejo-Valdivia B, et al. Breastfeeding status at age 3
months is associated with adiposity and cardiometabolic markers at age 4 years in
Mexican children. J. Nutr. Jun 2015;145(6):1295-1302.
33. Rossiter MD, Colapinto CK, Khan MK, et al. Breast, Formula and Combination
Feeding in Relation to Childhood Obesity in Nova Scotia, Canada. Maternal and
child health journal. Feb 6 2015.
34. Zhu Y, Hernandez LM, Dong Y, Himes JH, Hirschfeld S, Forman MR. Longer
breastfeeding duration reduces the positive relationships among gestational
weight gain, birth weight and childhood anthropometrics. J. Epidemiol.
Community Health. Feb 13 2015.
35. Larnkjaer A, Hoppe C, Molgaard C, Michaelsen KF. The effects of whole milk
and infant formula on growth and IGF-I in late infancy. Eur. J. Clin. Nutr. Aug
2009;63(8):956-963.
36. Hoppe C, Udam TR, Lauritzen L, Mølgaard C, Juul A, Michaelsen KF. Animal
protein intake, serum insulin-like growth factor I, and growth in healthy 2.5-y-old
Danish children. Am. J. Clin. Nutr. Aug 2004;80(2):447-452.
37. Hoppe C, Molgaard C, Juul A, Michaelsen KF. High intakes of skimmed milk,
but not meat, increase serum IGF-I and IGFBP-3 in eight-year-old boys. Eur. J.
Clin. Nutr. Sep 2004;58(9):1211-1216.
38. Alexy U, Kersting M, Sichert-Hellert W, Manz F, Schoch G. Macronutrient
intake of 3- to 36-month-old German infants and children: results of the
DONALD Study. Dortmund Nutritional and Anthropometric Longitudinally
Designed Study. Ann. Nutr. Metab. 1999;43(1):14-22.
39. Holmes MD, Pollak MN, Willett WC, Hankinson SE. Dietary correlates of
plasma insulin-like growth factor I and insulin-like growth factor binding protein
3 concentrations. Cancer Epidemiol. Biomarkers Prev. Sep 2002;11(9):852-861.
40. Renehan AG, Zwahlen M, Minder C, O'Dwyer ST, Shalet SM, Egger M. Insulin-
like growth factor (IGF)-I, IGF binding protein-3, and cancer risk: systematic
review and meta-regression analysis. Lancet. Apr 24 2004;363(9418):1346-1353.
41. Murray PG, Clayton PE. Endocrine control of growth. Am. J. Med. Genet. C
Semin. Med. Genet. May 2013;163(2):76-85.

150
42. Ejlerskov KT, Larnkjaer A, Pedersen D, Ritz C, Molgaard C, Michaelsen KF.
IGF-I at 9 and 36 months of age - relations with body composition and diet at 3
years - the SKOT cohort. Growth Horm. IGF Res. Dec 2014;24(6):239-244.
43. Bjerregaard LG, Rasmussen KM, Michaelsen KF, et al. Effects of body size and
change in body size from infancy through childhood on body mass index in
adulthood. Int. J. Obes. (Lond.). Oct 2014;38(10):1305-1311.
44. Pediatrics AAo. Breastfeeding and the use of human milk. Pediatrics. Mar
2012;129(3):e827-841.
45. Ben-Shlomo Y, Holly J, McCarthy A, Savage P, Davies D, Davey Smith G.
Prenatal and postnatal milk supplementation and adult insulin-like growth factor
I: long-term follow-up of a randomized controlled trial. Cancer Epidemiol.
Biomarkers Prev. May 2005;14(5):1336-1339.
46. Rosenfield RL, Lipton RB, Drum ML. Thelarche, pubarche, and menarche
attainment in children with normal and elevated body mass index. Pediatrics. Jan
2009;123(1):84-88.
47. Al-Sahab B, Adair L, Hamadeh MJ, Ardern CI, Tamim H. Impact of
breastfeeding duration on age at menarche. Am. J. Epidemiol. May 1
2011;173(9):971-977.
48. Kale A, Deardorff J, Lahiff M, et al. Breastfeeding Versus Formula-Feeding and
Girls' Pubertal Development. Maternal and child health journal. Jun 11 2014.
49. Thankamony A, Ong KK, Ahmed ML, Ness AR, Holly JM, Dunger DB. Higher
levels of IGF-I and adrenal androgens at age 8 years are associated with earlier
age at menarche in girls. J. Clin. Endocrinol. Metab. May 2012;97(5):E786-790.
50. Sorensen K, Aksglaede L, Petersen JH, Andersson AM, Juul A. Serum IGF1 and
insulin levels in girls with normal and precocious puberty. Eur. J. Endocrinol.
May 2012;166(5):903-910.
51. Menarche, menopause, and breast cancer risk: individual participant meta-
analysis, including 118 964 women with breast cancer from 117 epidemiological
studies. The lancet oncology. Nov 2012;13(11):1141-1151.
52. Surveillance Research Program NCI. Fast Stats: an interactive tool for access to
SEER cancer statistics. 2014; http://seer.cancer.gov/faststats/.

151
53. Inaba H, Greaves M, Mullighan CG. Acute lymphoblastic leukaemia. The Lancet.
2013.
54. Tomonaga M. Leukaemia in Nagasaki atomic bomb survivors from 1945 through
1959. Bull. World Health Organ. 1962;26(5):619-631.
55. Roman E, Lightfoot T, Smith AG, et al. Childhood acute lymphoblastic
leukaemia and birthweight: insights from a pooled analysis of case-control data
from Germany, the United Kingdom and the United States. Eur. J. Cancer. Apr
2013;49(6):1437-1447.
56. Vatten LJ, Nilsen ST, Odegard RA, Romundstad PR, Austgulen R. Insulin-like
Growth Factor I and Leptin in Umbilical Cord Plasma and Infant Birth Size at
Term. Pediatrics. 2002;109(6):1131-1135.
57. Vatten LJ, Odegard RA, Nilsen ST, Salvesen KA, Austgulen R. Relationship of
insulin-like growth factor-I and insulin-like growth factor binding proteins in
umbilical cord plasma to preeclampsia and infant birth weight. Obstet. Gynecol.
Jan 2002;99(1):85-90.
58. Carlsen EM, Renault KM, Jensen RB, et al. The Association between Newborn
Regional Body Composition and Cord Blood Concentrations of C-Peptide and
Insulin-Like Growth Factor I. PLoS One. 2015;10(7):e0121350.
59. Nagano N, Okada T, Fukamachi R, et al. Insulin-like growth factor-1 and
lipoprotein profile in cord blood of preterm small for gestational age infants. J.
Dev. Orig. Health Dis. Dec 2013;4(6):507-512.
60. Ross JA, Perentesis JP, Robison LL, Davies SM. Big babies and infant leukemia:
a role for insulin-like growth factor-1? Cancer Causes Control. Sep
1996;7(5):553-559.
61. Hanley MB, Napolitano LA, McCune JM. Growth hormone-induced stimulation
of multilineage human hematopoiesis. Stem Cells. Sep 2005;23(8):1170-1179.
62. Clark R. The somatogenic hormones and insulin-like growth factor-1: stimulators
of lymphopoiesis and immune function. Endocr. Rev. Apr 1997;18(2):157-179.
63. Shimon I, Shpilberg O. The insulin-like growth factor system in regulation of
normal and malignant hematopoiesis. Leuk. Res. Apr 1995;19(4):233-240.

152
64. Baier TG, Ludwig WD, Schonberg D, Hartmann KK. Characterisation of insulin-
like growth factor I receptors of human acute lymphoblastic leukaemia (ALL) cell
lines and primary ALL cells. Eur. J. Cancer. 1992;28a(6-7):1105-1110.
65. Lakshmikuttyamma A, Pastural E, Takahashi N, et al. Bcr-Abl induces autocrine
IGF-1 signaling. Oncogene. Jun 19 2008;27(27):3831-3844.
66. Badr M, Hassan T, Tarhony SE, Metwally W. Insulin-like growth factor-1 and
childhood cancer risk. Oncol. Lett. Nov 2010;1(6):1055-1059.
67. Callan AC, Milne E. Involvement of the IGF system in fetal growth and
childhood cancer: an overview of potential mechanisms. Cancer Causes Control.
Dec 2009;20(10):1783-1798.
68. MacArthur AC, McBride ML, Spinelli JJ, Tamaro S, Gallagher RP, Theriault GP.
Risk of childhood leukemia associated with vaccination, infection, and
medication use in childhood: the Cross-Canada Childhood Leukemia Study. Am.
J. Epidemiol. Mar 1 2008;167(5):598-606.
69. Schraw JM, Ogland B, Dong YQ, Nilsen ST, Forman MR. In utero preeclampsia
exposure, milk intake and pubertal development. Reprod. Toxicol. Dec 12 2014.
70. CLASP: a randomised trial of low-dose aspirin for the prevention and treatment
of pre-eclampsia among 9364 pregnant women. CLASP (Collaborative Low-dose
Aspirin Study in Pregnancy) Collaborative Group. Lancet. Mar 12
1994;343(8898):619-629.
71. Halhali A, Tovar AR, Torres N, Bourges H, Garabedian M, Larrea F.
Preeclampsia is associated with low circulating levels of insulin-like growth
factor I and 1,25-dihydroxyvitamin D in maternal and umbilical cord
compartments. J. Clin. Endocrinol. Metab. May 2000;85(5):1828-1833.
72. Sharifzadeh F, Kashanian M, Fatemi F. A comparison of serum androgens in pre-
eclamptic and normotensive pregnant women during the third trimester of
pregnancy. Gynecol. Endocrinol. Oct 2012;28(10):834-836.
73. Salamalekis E, Bakas P, Vitoratos N, Eleptheriadis M, Creatsas G. Androgen
levels in the third trimester of pregnancy in patients with preeclampsia. Eur. J.
Obstet. Gynecol. Reprod. Biol. May 1 2006;126(1):16-19.
74. Troisi R, Potischman N, Roberts JM, et al. Maternal serum oestrogen and
androgen concentrations in preeclamptic and uncomplicated pregnancies. Int. J.
Epidemiol. Jun 2003;32(3):455-460.

153
75. Jirecek S, Joura EA, Tempfer C, Knofler M, Husslein P, Zeisler H. Elevated
serum concentrations of androgens in women with pregnancy-induced
hypertension. Wiener klinische Wochenschrift. Mar 31 2003;115(5-6):162-166.
76. Serin IS, Kula M, Basbug M, Unluhizarci K, Gucer S, Tayyar M. Androgen levels
of preeclamptic patients in the third trimester of pregnancy and six weeks after
delivery. Acta Obstet. Gynecol. Scand. Nov 2001;80(11):1009-1013.
77. Acromite MT, Mantzoros CS, Leach RE, Hurwitz J, Dorey LG. Androgens in
preeclampsia. Am. J. Obstet. Gynecol. Jan 1999;180(1 Pt 1):60-63.
78. Steier JA, Ulstein M, Myking OL. Human chorionic gonadotropin and
testosterone in normal and preeclamptic pregnancies in relation to fetal sex.
Obstet. Gynecol. Sep 2002;100(3):552-556.
79. Faupel-Badger JM, Wang Y, Staff AC, et al. Maternal and cord steroid sex
hormones, angiogenic factors, and insulin-like growth factor axis in African-
American preeclamptic and uncomplicated pregnancies. Cancer Causes Control.
May 2012;23(5):779-784.
80. Troisi R, Innes KE, Roberts JM, Hoover RN. Preeclampsia and maternal breast
cancer risk by offspring gender: do elevated androgen concentrations play a role?
Br. J. Cancer. Sep 3 2007;97(5):688-690.
81. Ekbom A. Growing evidence that several human cancers may originate in utero.
Semin. Cancer Biol. Aug 1998;8(4):237-244.
82. Ekbom A, Hsieh CC, Lipworth L, et al. Perinatal characteristics in relation to
incidence of and mortality from prostate cancer. BMJ. Aug 10
1996;313(7053):337-341.
83. Vatten LJ, Forman MR, Nilsen TI, Barrett JC, Romundstad PR. The negative
association between pre-eclampsia and breast cancer risk may depend on the
offspring's gender. Br. J. Cancer. May 7 2007;96(9):1436-1438.
84. Innes KE, Byers TE. Preeclampsia and breast cancer risk. Epidemiology. Nov
1999;10(6):722-732.
85. Lawlor DA, Macdonald-Wallis C, Fraser A, et al. Cardiovascular biomarkers and
vascular function during childhood in the offspring of mothers with hypertensive
disorders of pregnancy: findings from the Avon Longitudinal Study of Parents
and Children. Eur. Heart J. Feb 2012;33(3):335-345.

154
86. Terry MB, Perrin M, Salafia CM, et al. Preeclampsia, pregnancy-related
hypertension, and breast cancer risk. Am. J. Epidemiol. May 1 2007;165(9):1007-
1014.
87. Michaelsen KF, Larnkjaer A, Molgaard C. Early diet, insulin-like growth factor-
1, growth and later obesity. World Rev. Nutr. Diet. 2013;106:113-118.
88. Kwok MK, Leung GM, Lam TH, Schooling CM. Breastfeeding, childhood milk
consumption, and onset of puberty. Pediatrics. Sep 2012;130(3):e631-639.
89. Odegard RA, Vatten LJ, Nilsen ST, Salvesen KA, Austgulen R. Umbilical cord
plasma leptin is increased in preeclampsia. Am. J. Obstet. Gynecol. Mar
2002;186(3):427-432.
90. Ogland B, Nilsen ST, Forman MR, Vatten LJ. Pubertal development in daughters
of women with pre-eclampsia. Arch. Dis. Child. Aug 2011;96(8):740-743.
91. Michels KB, Willett WC, Graubard BI, et al. A longitudinal study of infant
feeding and obesity throughout life course. Int. J. Obes. (Lond.). Jul
2007;31(7):1078-1085.
92. Ogland B, Vatten LJ, Romundstad PR, Nilsen ST, Forman MR. Pubertal
anthropometry in sons and daughters of women with preeclamptic or
normotensive pregnancies. Arch. Dis. Child. Nov 2009;94(11):855-859.
93. Persson I, Ahlsson F, Ewald U, et al. Influence of perinatal factors on the onset of
puberty in boys and girls: implications for interpretation of link with risk of long
term diseases. Am. J. Epidemiol. Oct 1 1999;150(7):747-755.
94. Vatten LJ, Romundstad PR, Holmen TL, Hsieh CC, Trichopoulos D, Stuver SO.
Intrauterine exposure to preeclampsia and adolescent blood pressure, body size,
and age at menarche in female offspring. Obstet. Gynecol. Mar 2003;101(3):529-
533.
95. Juul A. In utero programming of pubertal development? Arch. Dis. Child. Aug
2011;96(8):703.
96. Ibanez L, de Zegher F. Puberty after prenatal growth restraint. Horm. Res.
2006;65 Suppl 3:112-115.
97. Neville KA, Walker JL. Precocious pubarche is associated with SGA,
prematurity, weight gain, and obesity. Arch. Dis. Child. Mar 2005;90(3):258-261.

155
98. Perkins E, Murphy SK, Murtha AP, et al. Insulin-like growth factor 2/H19
methylation at birth and risk of overweight and obesity in children. J. Pediatr. Jul
2012;161(1):31-39.
99. Hornell A, Lagstrom H, Lande B, Thorsdottir I. Protein intake from 0 to 18 years
of age and its relation to health: a systematic literature review for the 5th Nordic
Nutrition Recommendations. Food & nutrition research. 2013;57.
100. Deardorff J, Berry-Millett R, Rehkopf D, Luecke E, Lahiff M, Abrams B.
Maternal pre-pregnancy BMI, gestational weight gain, and age at menarche in
daughters. Maternal and child health journal. Oct 2013;17(8):1391-1398.
101. Hounsgaard ML, Hakonsen LB, Vested A, et al. Maternal pre-pregnancy body
mass index and pubertal development among sons. Andrology. Mar
2014;2(2):198-204.
102. Dror DK, Allen LH. Dairy product intake in children and adolescents in
developed countries: trends, nutritional contribution, and a review of association
with health outcomes. Nutr. Rev. Feb 2014;72(2):68-81.
103. Alberti C, Chevenne D, Mercat I, et al. Serum concentrations of insulin-like
growth factor (IGF)-1 and IGF binding protein-3 (IGFBP-3), IGF-1/IGFBP-3
ratio, and markers of bone turnover: reference values for French children and
adolescents and z-score comparability with other references. Clin. Chem. Oct
2011;57(10):1424-1435.
104. Byrd-Bredbenner C, Lagiou P, Trichopoulou A. A comparison of household food
availability in 11 countries. Journal of human nutrition and dietetics : the official
journal of the British Dietetic Association. Jun 2000;13(3):197-204.
105. Hjartaker A, Lagiou A, Slimani N, et al. Consumption of dairy products in the
European Prospective Investigation into Cancer and Nutrition (EPIC) cohort: data
from 35 955 24-hour dietary recalls in 10 European countries. Public Health Nutr.
Dec 2002;5(6b):1259-1271.
106. Natland ST, Andersen LF, Nilsen TI, Forsmo S, Jacobsen GW. Maternal recall of
breastfeeding duration twenty years after delivery. BMC Med. Res. Methodol.
2012;12:179.
107. Chavarro JE, Michels KB, Isaq S, et al. Validity of maternal recall of preschool
diet after 43 years. Am. J. Epidemiol. May 1 2009;169(9):1148-1157.

156
108. Maruti SS, Feskanich D, Colditz GA, et al. Adult recall of adolescent diet:
reproducibility and comparison with maternal reporting. Am. J. Epidemiol. Jan 1
2005;161(1):89-97.
109. Schraw JM, Dong YQ, Okcu MF, Scheurer ME, Forman MR. Do longer formula
feeding and later introduction of solids increase risk for pediatric acute
lymphoblastic leukemia? Cancer Causes Control. Oct 24 2013.
110. Eshet R, Silbergeld A, Zaizov R, et al. Decreased insulin-like growth factor-I
receptor sites on circulating mononuclear cells from children with acute leukemia.
Pediatr. Hematol. Oncol. 2000 Apr-May 2000;17(3):253-260.
111. Foster M, Montecino-Rodriguez E, Clark R, Dorshkind K. Regulation of B and T
cell development by anterior pituitary hormones. Cell. Mol. Life Sci. Oct
1998;54(10):1076-1082.
112. Sprehe MR, Barahmani N, Cao Y, et al. Comparison of birth weight corrected for
gestational age and birth weight alone in prediction of development of childhood
leukemia and central nervous system tumors. Pediatr. Blood Cancer. Feb
2010;54(2):242-249.
113. Milne E, Laurvick CL, Blair E, Bower C, de Klerk N. Fetal growth and acute
childhood leukemia: looking beyond birth weight. Am. J. Epidemiol. Jul 15
2007;166(2):151-159.
114. Schüz J, Kaatsch P, Kaletsch U, Meinert R, Michaelis J. Association of childhood
cancer with factors related to pregnancy and birth. Int. J. Epidemiol. Aug
1999;28(4):631-639.
115. Kwan ML, Buffler PA, Abrams B, Kiley VA. Breastfeeding and the risk of
childhood leukemia: a meta-analysis. Public Health Rep. 2004 Nov-Dec
2004;119(6):521-535.
116. Martin RM, Gunnell D, Owen CG, Smith GD. Breast-feeding and childhood
cancer: A systematic review with metaanalysis. Int. J. Cancer. Dec 20
2005;117(6):1020-1031.
117. Wijndaele K, Lakshman R, Landsbaugh JR, Ong KK, Ogilvie D. Determinants of
early weaning and use of unmodified cow's milk in infants: a systematic review.
J. Am. Diet. Assoc. Dec 2009;109(12):2017-2028.
118. Scott JA, Binns CW, Graham KI, Oddy WH. Predictors of the early introduction
of solid foods in infants: results of a cohort study. BMC Pediatr. 2009;9:60.

157
119. Ries L, Smith M, Gurney J, et al. Cancer Incidence and Survival among Children
and Adolescents: United States SEER Program 1975-1995. National Cancer
Institute, SEER Program. NIH Pub. No. 99-4649. Bethesda, MD. 1999.
120. Davidsson J, Lilljebjorn H, Andersson A, et al. The DNA methylome of pediatric
acute lymphoblastic leukemia. Hum. Mol. Genet. Nov 1 2009;18(21):4054-4065.
121. Kuang SQ, Tong WG, Yang H, et al. Genome-wide identification of aberrantly
methylated promoter associated CpG islands in acute lymphocytic leukemia.
Leukemia. Aug 2008;22(8):1529-1538.
122. Vilas-Zornoza A, Agirre X, Martin-Palanco V, et al. Frequent and simultaneous
epigenetic inactivation of TP53 pathway genes in acute lymphoblastic leukemia.
PLoS One. 2011;6(2):e17012.
123. Wong IH, Ng MH, Huang DP, Lee JC. Aberrant p15 promoter methylation in
adult and childhood acute leukemias of nearly all morphologic subtypes: potential
prognostic implications. Blood. Mar 2000;95(6):1942-1949.
124. Mugambi MN, Musekiwa A, Lombard M, Young T, Blaauw R. Synbiotics,
probiotics or prebiotics in infant formula for full term infants: a systematic
review. Nutrition journal. 2012;11:81.
125. Carvalho RS, Michail S, Ashai-Khan F, Mezoff AG. An update on pediatric
gastroenterology and nutrition: a review of some recent advances. Curr. Probl.
Pediatr. Adolesc. Health Care. Aug 2008;38(7):204-228.
126. Heird WC. Progress in promoting breast-feeding, combating malnutrition, and
composition and use of infant formula, 1981-2006. J. Nutr. Feb
2007;137(2):499S-502S.
127. Grzeskowiak L, Gronlund MM, Beckmann C, Salminen S, von Berg A, Isolauri
E. The impact of perinatal probiotic intervention on gut microbiota: double-blind
placebo-controlled trials in Finland and Germany. Anaerobe. Feb 2012;18(1):7-
13.
128. Altinkaynak S, Selimoglu MA, Turgut A, Kilicaslan B, Ertekin V. Breast-feeding
duration and childhood acute leukemia and lymphomas in a sample of Turkish
children. J. Pediatr. Gastroenterol. Nutr. May 2006;42(5):568-572.
129. Bener A, Denic S, Galadari S. Longer breast-feeding and protection against
childhood leukaemia and lymphomas. Eur. J. Cancer. Jan 2001;37(2):234-238.

158
130. Infante-Rivard C, Fortier I, Olson E. Markers of infection, breast-feeding and
childhood acute lymphoblastic leukaemia. Br. J. Cancer. Dec 2000;83(11):1559-
1564.
131. Perrillat F, Clavel J, Auclerc MF, et al. Day-care, early common infections and
childhood acute leukaemia: a multicentre French case-control study. Br. J.
Cancer. Apr 2002;86(7):1064-1069.
132. Rudant J, Orsi L, Menegaux F, et al. Childhood acute leukemia, early common
infections, and allergy: The ESCALE Study. Am. J. Epidemiol. Nov
2010;172(9):1015-1027.
133. Shu XO, Linet MS, Steinbuch M, et al. Breast-feeding and risk of childhood acute
leukemia. J. Natl. Cancer Inst. Oct 1999;91(20):1765-1772.
134. Flores-Lujano J, Perez-Saldivar ML, Fuentes-Panana EM, et al. Breastfeeding and
early infection in the aetiology of childhood leukaemia in Down syndrome. Br. J.
Cancer. Sep 1 2009;101(5):860-864.
135. Jourdan-Da Silva N, Perel Y, Mechinaud F, et al. Infectious diseases in the first
year of life, perinatal characteristics and childhood acute leukaemia. Br. J.
Cancer. Jan 12 2004;90(1):139-145.
136. Kwan ML, Buffler PA, Wiemels JL, et al. Breastfeeding patterns and risk of
childhood acute lymphoblastic leukaemia. Br. J. Cancer. Aug 2005;93(3):379-
384.
137. McKinney PA, Cartwright RA, Saiu JM, et al. The inter-regional epidemiological
study of childhood cancer (IRESCC): a case control study of aetiological factors
in leukaemia and lymphoma. Arch. Dis. Child. Mar 1987;62(3):279-287.
138. Petridou E, Trichopoulos D, Kalapothaki V, et al. The risk profile of childhood
leukaemia in Greece: a nationwide case-control study. Br. J. Cancer.
1997;76(9):1241-1247.
139. Greaves MF. Speculations on the cause of childhood acute lymphoblastic
leukemia. Leukemia. Feb 1988;2(2):120-125.
140. Milne E, Royle JA, de Klerk NH, et al. Fetal growth and risk of childhood acute
lymphoblastic leukemia: results from an Australian case-control study. Am. J.
Epidemiol. Jul 15 2009;170(2):221-228.

159
141. Hjalgrim LL, Rostgaard K, Hjalgrim H, et al. Birth weight and risk for childhood
leukemia in Denmark, Sweden, Norway, and Iceland. J. Natl. Cancer Inst. Oct 20
2004;96(20):1549-1556.
142. Blatt J. IGF1 and leukemia. Pediatr. Hematol. Oncol. 2000 Apr-May
2000;17(3):199-201.
143. Campleman S. Childhood Cancer in California 1988 to 1999 Volume I: birth to
age 14. 2004.
144. Linabery AM, Ross JA. Trends in childhood cancer incidence in the U.S. (1992-
2004). Cancer. Jan 2008;112(2):416-432.
145. Smith A, Lightfoot T, Simpson J, Roman E, investigators U. Birth weight, sex
and childhood cancer: A report from the United Kingdom Childhood Cancer
Study. Cancer Epidemiol. Nov 2009;33(5):363-367.
146. Diamantaras AA, Dessypris N, Sergentanis TN, et al. Nutrition in early life and
risk of childhood leukemia: a case-control study in Greece. Cancer Causes
Control. Jan 2013;24(1):117-124.
147. Brisson GD, Alves LR, Pombo-de-Oliveira MS. Genetic susceptibility in
childhood acute leukaemias: a systematic review. Ecancermedicalscience.
2015;9:539.
148. Wiemels J. Perspectives on the causes of childhood leukemia. Chem. Biol.
Interact. Apr 5 2012;196(3):59-67.
149. Maia Rda R, Wunsch Filho V. Infection and childhood leukemia: review of
evidence. Rev. Saude Publica. Dec 2013;47(6):1172-1185.
150. Liu B, Newburg DS. Human milk glycoproteins protect infants against human
pathogens. Breastfeed. Med. Aug 2013;8(4):354-362.
151. Greenop KR, Bailey HD, Miller M, et al. Breastfeeding and Nutrition to 2 Years
of Age and Risk of Childhood Acute Lymphoblastic Leukemia and Brain Tumors.
Nutr. Cancer. Feb 3 2015:1-11.
152. Pozo-Rubio T, de Palma G, Mujico JR, et al. Influence of early environmental
factors on lymphocyte subsets and gut microbiota in infants at risk of celiac
disease; the PROFICEL study. Nutr. Hosp. Mar-Apr 2013;28(2):464-473.

160
153. Comstock SS, Wang M, Hester SN, Li M, Donovan SM. Select human milk
oligosaccharides directly modulate peripheral blood mononuclear cells isolated
from 10-d-old pigs. Br. J. Nutr. Mar 14 2014;111(5):819-828.
154. Morelli L. Postnatal development of intestinal microflora as influenced by infant
nutrition. J. Nutr. Sep 2008;138(9):1791s-1795s.
155. Al-Shehri SS, Knox CL, Liley HG, et al. Breastmilk-Saliva Interactions Boost
Innate Immunity by Regulating the Oral Microbiome in Early Infancy. PLoS One.
2015;10(9):e0135047.
156. Wang L, Bhatia S, Gomez SL, Yasui Y. Differential inequality trends over time in
survival among US children with acute lymphoblastic leukemia by race/ethnicity,
age at diagnosis and sex. Cancer Epidemiol. Biomarkers Prev. Sep 16 2015.
157. Crowe FL, Key TJ, Allen NE, et al. A cross-sectional analysis of the associations
between adult height, BMI and serum concentrations of IGF-I and IGFBP-1 -2
and -3 in the European Prospective Investigation into Cancer and Nutrition
(EPIC). Ann. Hum. Biol. Mar 2011;38(2):194-202.
158. Broomhall J, May R, Lilleyman JS, Milner RD. Height and lymphoblastic
leukaemia. Arch. Dis. Child. Apr 1983;58(4):300-301.
159. Davis E, Jacoby P, de Klerk NH, Cole C, Milne E. Western Australian children
with acute lymphoblastic leukemia are taller at diagnosis than unaffected children
of the same age and sex. Pediatr. Blood Cancer. May 2011;56(5):767-770.
160. Huang T, Ducore JM. Children and adolescents with ALL are taller than expected
at diagnosis. J. Pediatr. Hematol. Oncol. Jan 2014;36(1):16-21.
161. Pui CH, Dodge RK, George SL, Green AA. Height at diagnosis of malignancies.
Arch. Dis. Child. May 1987;62(5):495-499.
162. Berry DH, Elders MJ, Crist W, et al. Growth in children with acute lymphocytic
leukemia: a Pediatric Oncology Group study. Med. Pediatr. Oncol.
1983;11(1):39-45.
163. Bessho F. Height at diagnosis in acute lymphocytic leukaemia. Arch. Dis. Child.
Mar 1986;61(3):296-298.
164. Delbecque-Boussard L, Gottrand F, Ategbo S, et al. Nutritional status of children
with acute lymphoblastic leukemia: a longitudinal study. Am. J. Clin. Nutr. Jan
1997;65(1):95-100.

161
165. Dalton VK, Rue M, Silverman LB, et al. Height and weight in children treated for
acute lymphoblastic leukemia: relationship to CNS treatment. J. Clin. Oncol. Aug
1 2003;21(15):2953-2960.
166. Suminoe A, Matsuzaki A, Kinukawa N, et al. Rapid somatic growth after birth in
children with neuroblastoma: A survey of 1718 patients with childhood cancer in
Kyushu-Okinawa district. J. Pediatr. Feb 1999;134(2):178-184.
167. Kuczmarski RJ, Ogden CL, Guo SS, et al. 2000 CDC Growth Charts for the
United States: methods and development. Vital Health Stat. 11. May 2002(246):1-
190.
168. Ogden CL, Fryar CD, Carroll MD, Flegal KM. Mean body weight, height, and
body mass index, United States 1960-2002. Adv. Data. Oct 27 2004(347):1-17.
169. Hedley AA, Ogden CL, Johnson CL, Carroll MD, Curtin LR, Flegal KM.
Prevalence of overweight and obesity among US children, adolescents, and
adults, 1999-2002. JAMA. Jun 16 2004;291(23):2847-2850.
170. Percentile Data Files with LMS Values. 2009;
http://www.cdc.gov/growthcharts/percentile_data_files.htm. Accessed
06/21/2016.
171. Wickham H. ggplot2. 2013; http://ggplot2.org/. Accessed 06/23/2016.