Embed Size (px)
Citation preview
Copyright © 2015, 2008, 2011 Pearson Education, Inc. Section 2.1, Slide 1
Chapter 2Modeling with Linear Functions

Copyright © 2015, 2008, 2011 Pearson Education, Inc. Section 2.1, Slide 2
2.1 Using Lines to Model Data

Copyright © 2015, 2008, 2011 Pearson Education, Inc. Section 2.1, Slide 3
Example: Using a Graph to Describe an Authentic Situation
The Grand Canyon is a beautiful landmark, yet the difficulty of finding a parking spot can detract from visitors’ enjoyment. The numbers of Grand Canyonvisitors are listed in the table for various years. Describe the data with a graph.
Copyright © 2015, 2008, 2011 Pearson Education, Inc. Section 2.1, Slide 4
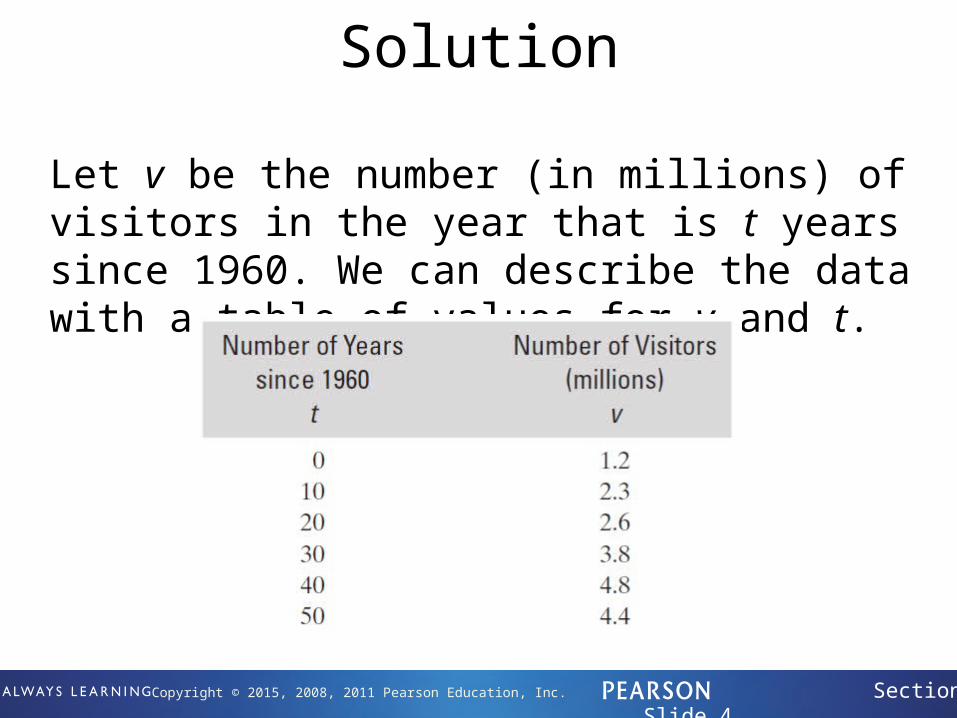
Solution
Let v be the number (in millions) of visitors in the year that is t years since 1960. We can describe the data with a table of values for v and t.

Copyright © 2015, 2008, 2011 Pearson Education, Inc. Section 2.1, Slide 5
Solution
Plot the (t, v) data points shown in the table. Let the horizontal axis be the t-axis and the vertical axis be the v-axis.
Copyright © 2015, 2008, 2011 Pearson Education, Inc. Section 2.1, Slide 6
Scattergram
A graph of plotted ordered pairs is called a scattergram. A scattergram should have scaling on both axes and labels indicating the variable names and scale units.
Copyright © 2015, 2008, 2011 Pearson Education, Inc. Section 2.1, Slide 7
Approximately Linearly Related
We can sketch a line that comes close to (or on) the data points of the graph from the previous example. Since the points in the scattergram lie close to (or on) a line, then we say that the relevant variables are approximately linearly related.

Copyright © 2015, 2008, 2011 Pearson Education, Inc. Section 2.1, Slide 8
Approximately Linearly Related
One possible line that comes close to (or on) the data points.

Copyright © 2015, 2008, 2011 Pearson Education, Inc. Section 2.1, Slide 9
Approximately Linearly Related
A few of the many lines that come close to (or on) the data points.
Copyright © 2015, 2008, 2011 Pearson Education, Inc. Section 2.1, Slide 10
Model
Definition
A model is a mathematical description of an authentic situation. We say the description models the situation.

Copyright © 2015, 2008, 2011 Pearson Education, Inc. Section 2.1, Slide 11
Linear model
Definition
A linear model is a linear function, or its graph, that describes the relationship between two quantities for an authentic situation.

Copyright © 2015, 2008, 2011 Pearson Education, Inc. Section 2.1, Slide 12
Example: Using a Linear Model to Make a Prediction and an Estimate
1. Use the linear model shown on the next slide to predict the number of visitors in 2018.
2. Use the linear model to estimate in what year there were 4 million visitors.
Copyright © 2015, 2008, 2011 Pearson Education, Inc. Section 2.1, Slide 13
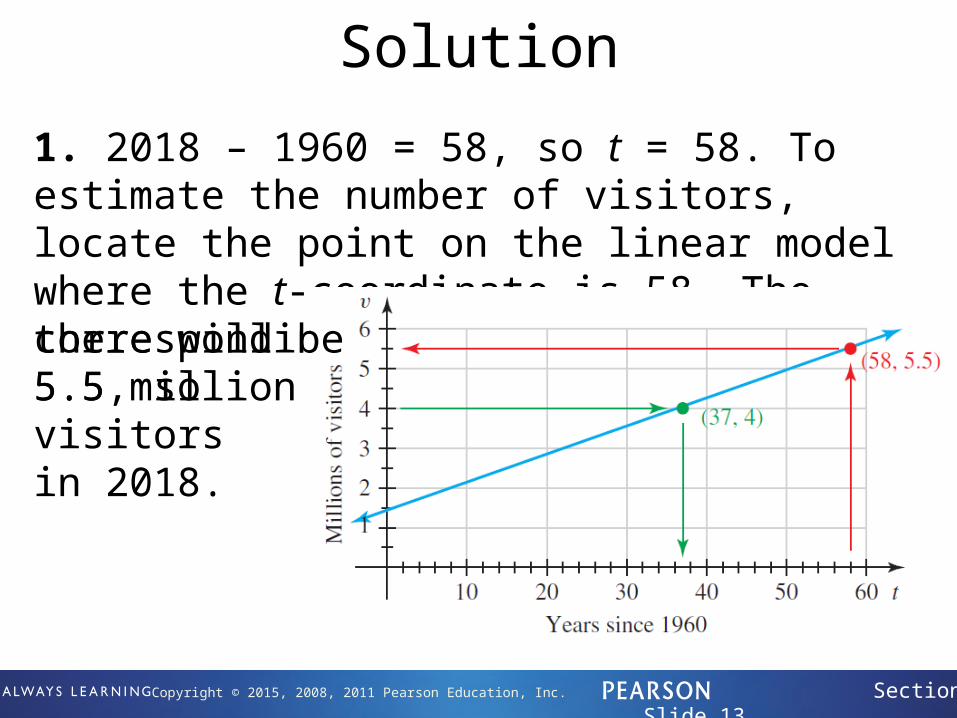
Solution
1. 2018 – 1960 = 58, so t = 58. To estimate the number of visitors, locate the point on the linear model where the t-coordinate is 58. The corresponding v-coordinate is about 5.5, sothere will be 5.5 million visitors in 2018.

Copyright © 2015, 2008, 2011 Pearson Education, Inc. Section 2.1, Slide 14
Solution
2. To find the year when there were 4 million visitors, locate the point on the linear model where the v-coordinate is 4. The coordinating t-coordinate is about 37. So, according to the linear model, there were 4 million visitors in 1960 + 37 = 1997.

Copyright © 2015, 2008, 2011 Pearson Education, Inc. Section 2.1, Slide 15
Using a Linear Function to Model Data
Warning
We create a scattergram of data to determine whether the relevant variables are approximately linearly related. If they are, we draw a line that comes close to (or on) the data points and use the line to make estimates and predictions. It is a common error to try to find a line that contains the greatest number of data points. Our goal is to find a line that comes close to all of the data points.

Copyright © 2015, 2008, 2011 Pearson Education, Inc. Section 2.1, Slide 16
Example: Intercepts of a Model;
Model Breakdown
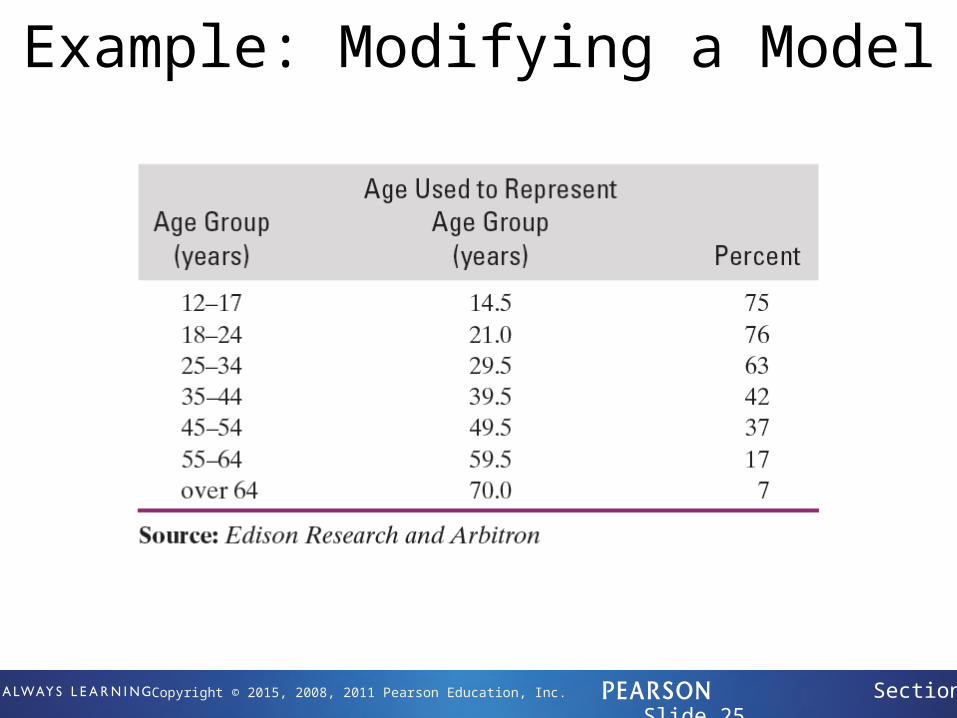
The percentages of cell phone users who send or receive text messages multiple times per day are shown in the table for various age groups.

Copyright © 2015, 2008, 2011 Pearson Education, Inc. Section 2.1, Slide 17
Example: Intercepts of a Model;
Model Breakdown
1. Let p be the percentage of cell phone users at age a who send or receive text messages multiple times per day. Find a linear model that describes the relationship between a and p.
2. Find the p-intercept. What does it mean in this situation?
3. Find the a-intercept. What does it mean in this situation?

Copyright © 2015, 2008, 2011 Pearson Education, Inc. Section 2.1, Slide 18
Solution
1. View the positions of the points in the scattergram. a and p appear approximately linearly related, so we sketch a line that comes close to the data points.
Copyright © 2015, 2008, 2011 Pearson Education, Inc. Section 2.1, Slide 19
Solution
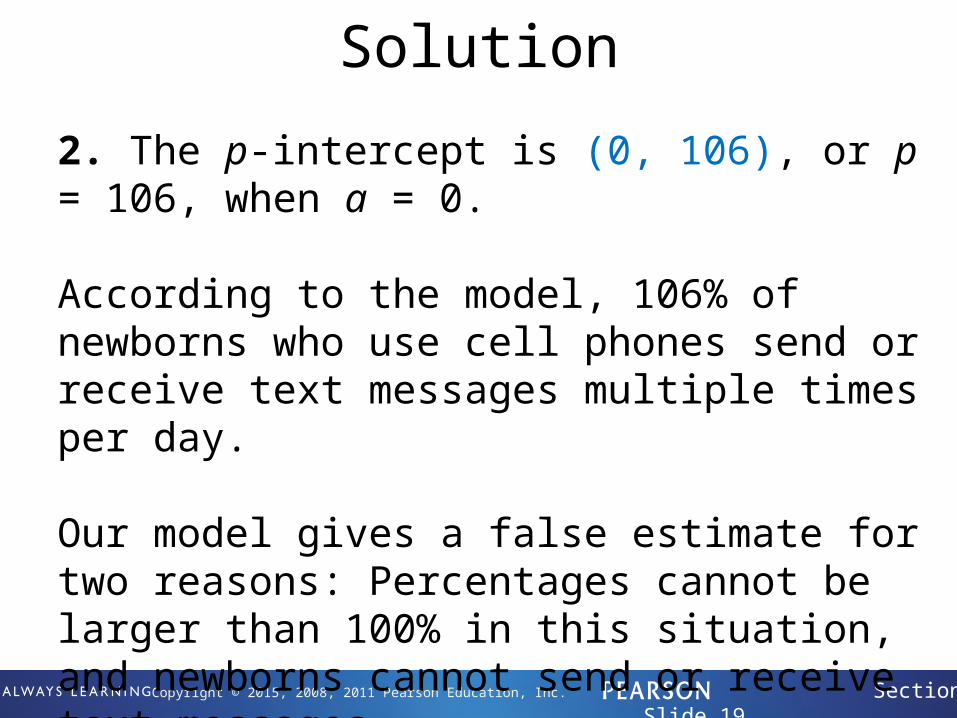
2. The p-intercept is (0, 106), or p = 106, when a = 0.
According to the model, 106% of newborns who use cell phones send or receive text messages multiple times per day.
Our model gives a false estimate for two reasons: Percentages cannot be larger than 100% in this situation, and newborns cannot send or receive text messages.

Copyright © 2015, 2008, 2011 Pearson Education, Inc. Section 2.1, Slide 20
Solution
3. The a-intercept is (71, 0), or p = 0, when a = 71.
According to the model, no 71-year-old cell phone users send or receive text messages multiple times per day. This is a false statement.
A little research would show some 71-year-old cell phone users send or receive text messages multiple times per day.

Copyright © 2015, 2008, 2011 Pearson Education, Inc. Section 2.1, Slide 21
Interpolation, extrapolation
Definition
For a situation that can be modeled by a function whose independent variable is t,
•We perform interpolation when we use a part of the model whose t-coordinates are between the t-coordinates of two data points.
•We perform extrapolation when we use a part of the model whose t-coordinates are not between the t-coordinates of any two data points.

Copyright © 2015, 2008, 2011 Pearson Education, Inc. Section 2.1, Slide 22
Interpolation, extrapolation

Copyright © 2015, 2008, 2011 Pearson Education, Inc. Section 2.1, Slide 23
Model Breakdown
Definition
When a model gives a prediction that does not make sense or an estimate that is not a good approximation, we say model breakdown has occurred.
Copyright © 2015, 2008, 2011 Pearson Education, Inc. Section 2.1, Slide 24
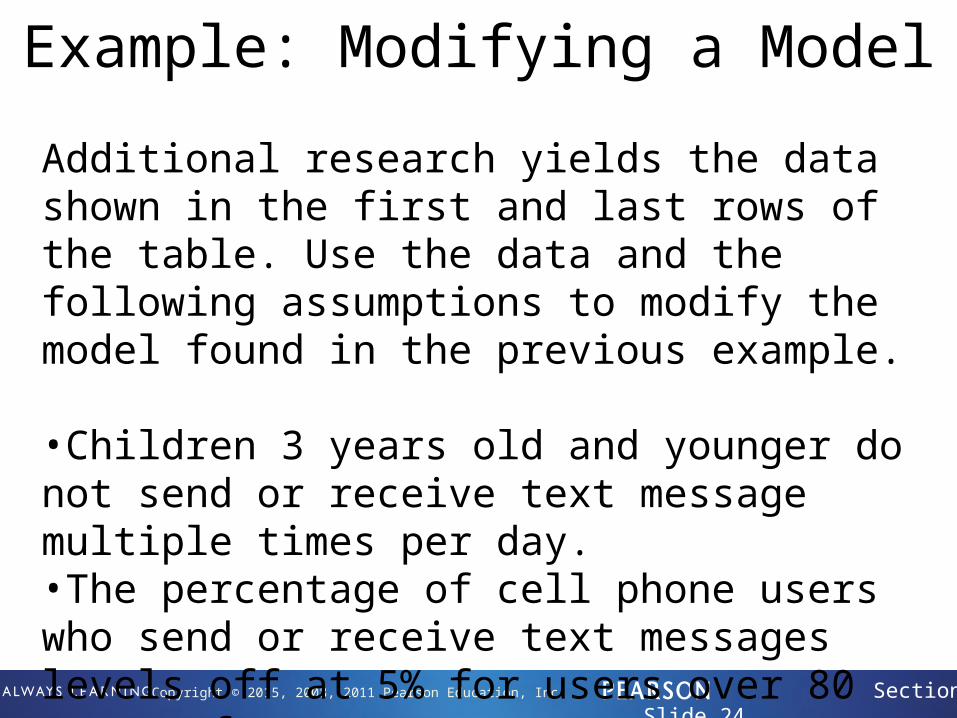
Example: Modifying a Model
Additional research yields the data shown in the first and last rows of the table. Use the data and the following assumptions to modify the model found in the previous example.
•Children 3 years old and younger do not send or receive text message multiple times per day.•The percentage of cell phone users who send or receive text messages levels off at 5% for users over 80 years of age.•The age of the oldest cell phone user is 116 years.
Copyright © 2015, 2008, 2011 Pearson Education, Inc. Section 2.1, Slide 25
Example: Modifying a Model

Copyright © 2015, 2008, 2011 Pearson Education, Inc. Section 2.1, Slide 26
Solution
Recall that p is the percentage of cell phone users at age a years who send or receive multiple text messages per day. Taking into account the three assumptions, we sketch a scattergram and draw a model that comes close to the data points.