Embed Size (px)
Citation preview

Copyright © 2013 SolarReserve. All Rights Reserved.
Finance Keynote Address
Michael Whalen, CFO SolarReserve
28th Global Power Markets Conference Las Vegas, NV
April 2013

Copyright © 2013 SolarReserve. All Rights Reserved.
Please note the following cautionary language regarding all forward-looking statements in this presentation. Caution must be exercised in relying on forward-looking statements. Due to known and unknown risks, actual results may differ materially from expectations or projections.
Information set forth in this presentation contains financial estimates, projections and other forward-looking statements that are subject to risks and uncertainties, and actual results might differ materially. Please consult relevant filings with the Securities and Exchange Commission, if and when submitted, or any other relevant regulatory authority to review factors affecting SolarReserve’s future results.
SolarReserve disclaims any obligation to update or revise statements contained in this presentation based on new information or otherwise.
Forward-Looking Statements

Copyright © 2013 SolarReserve. All Rights Reserved.

Copyright © 2013 SolarReserve. All Rights Reserved.
A Nickel’s Worth
Renewable Energy: “You’ve Come a Long Way, Baby”
Renewable Energy is Evolving to Meet Market Demands
Policy Challenges Abound in Established Markets
The Pivot to Growth Market Opportunities
A Call to Action

Copyright © 2013 SolarReserve. All Rights Reserved.
“You’ve come a long way, baby”

Copyright © 2013 SolarReserve. All Rights Reserved.
Globally Wind – 44.7 GW in new capacity in 2012, estimated $74 billion of new capex Solar – 30.0 GW in new capacity in 2012, estimated $80 billion of new capex Biofuels – 31.4 billion gallons of ethanol and biodiesel produced in 2012, up
from 27.9 billion gallons in 2011
United States
Approx. 55% of MW additions to the US power fleet in 2012 were renewable energy generation sources
Europe
Renewable sources were >31 GW of 44.6 GW of generation capacity added in EU in 2012; approx. 70% of all new capacity for second consecutive year
New solar PV was 37% of this new capacity in 2012
The “Indispensable Market”

Copyright © 2013 SolarReserve. All Rights Reserved.
0102030405060708090
100
2006 2007 2008 2009 2010 2011 2012
US$
bill
ions
Solar PV Wind Biofuels
Global Investment in Key Renewable Sectors
Source: Clean Edge

Copyright © 2013 SolarReserve. All Rights Reserved.
0
500
1000
1500
2000
2500
3000
3500
2003 2004 2005 2006 2007 2008 2009 2010 2011 2012
MW
(DC)
Residential Commercial Utility
US Solar PV Installations 2003 to 2012
Source: GTM Research

Copyright © 2013 SolarReserve. All Rights Reserved.
GTM Research forecasts that the industry will maintain its sustained growth, as an additional 4,300 MW of solar PV to be installed in 2013
29% increase over 2012
Utility segment in 2013 only 31% y-o-y versus 134% y-o-y in 2012
Longer term, 38% CAGR from 2013 to 2016
“Sustainable” growth
82% CAGR from 2009 to 2012
Increased distributed generation volumes
ITC rush for 2016 “in-service” deadline
Solar Outlook for the United States
Copyright © 2013 SolarReserve. All Rights Reserved.
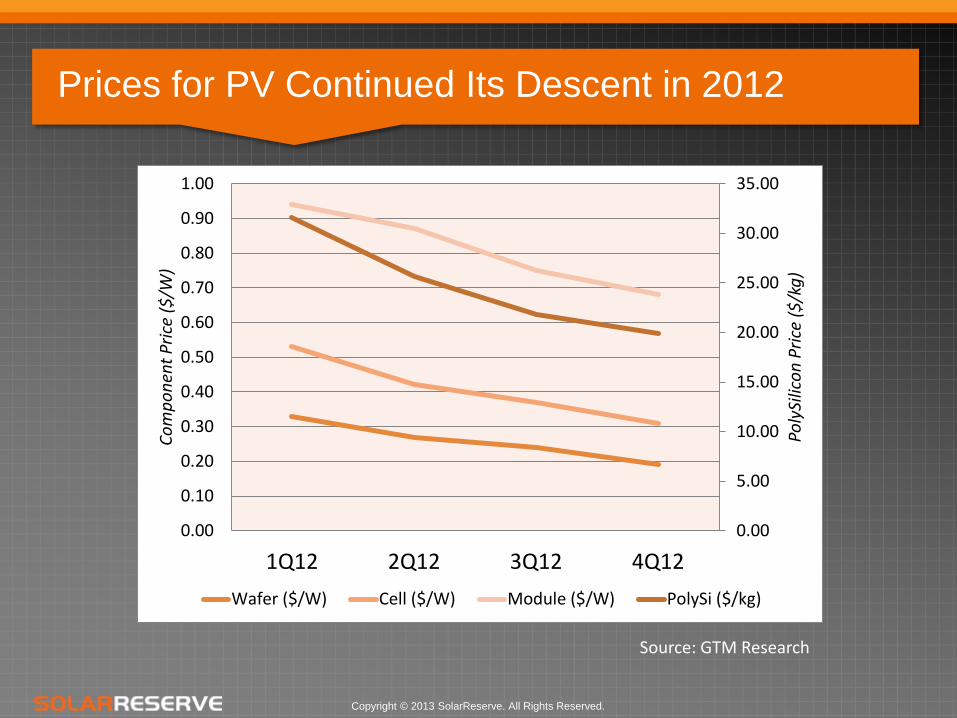
Prices for PV Continued Its Descent in 2012
0.00
5.00
10.00
15.00
20.00
25.00
30.00
35.00
0.00
0.10
0.20
0.30
0.40
0.50
0.60
0.70
0.80
0.90
1.00
1Q12 2Q12 3Q12 4Q12
Poly
Silic
on P
rice
($/k
g)
Com
pone
nt P
rice
($/W
)
Wafer ($/W) Cell ($/W) Module ($/W) PolySi ($/kg)
Source: GTM Research

Copyright © 2013 SolarReserve. All Rights Reserved.
>1,100 MWac CSP projects are scheduled to be online in 2013 and 2014
Crescent Dunes/Tonopah (SolarReserve)
Solana (Abengoa)
Mojave (Abengoa)
Genesis (NextEra)
Ivanpah (BrightSource)
Announced projects include SolarReserve’s Rice, Saguache, Crossroads and Quartzite projects and BrightSource’s Palen project
Large CSP Additions Online in 2013 and 2014

Copyright © 2013 SolarReserve. All Rights Reserved.
Renewable Energy is Evolving to Meet Market Demands

Copyright © 2013 SolarReserve. All Rights Reserved.
As penetration of renewable energy increases, market “asks” for clean power become more demanding
Reliability
Mitigation of intermittency and load misalignment
Reduction of resource variability
Cost Effectiveness
Minimization – or greater effectiveness – of policy supports
Minimization of additional system investments
Market is Seeking More from Renewables

Copyright © 2013 SolarReserve. All Rights Reserved.
California AB 2514 (2010) Requires CPUC to study and set energy storage procurement targets by October
2013 to be achieved by 2015 and 2020
California Public Utilities Commission Approved a long term procurement decision ordering Southern California Edison to
procure between 1,400 and 1,800 MW of energy resource capacity in the Los Angeles basin by 2021
Of this amount, at least 50 MW to be from energy storage resources, as well as up to an additional total of 600MW of capacity to be procured from preferred resources – including energy storage
February 2013 unanimous decision – move “beyond paralysis by analysis”
Lawrence Berkeley National Laboratory (Mills & Wiser, 2012) Marginal economic value of PV and CSP without thermal storage is found to drop
considerably (by more than $70/MWh) as the penetration of solar increases toward 30% on an energy basis
At solar penetration levels above 10%, CSP with thermal storage is found to be considerably more valuable relative to PV and CSP without thermal storage.
Increased Recognition of Need for Storage

Copyright © 2013 SolarReserve. All Rights Reserved.
Example of Solar PV Intermittency
0%
20%
40%
60%
80%
100%
6:00 8:00 10:00 12:00 14:00 16:00 18:00 20:00 22:00
Perc
ent L
oad
Time of Day
Afternoon Haze or Transient Clouds

Copyright © 2013 SolarReserve. All Rights Reserved.
CSP Without Storage
0%
20%
40%
60%
80%
100%
6:00 8:00 10:00 12:00 14:00 16:00 18:00 20:00 22:00
Perc
ent L
oad
Time of Day
Smoother Ride … But Same Destination

Copyright © 2013 SolarReserve. All Rights Reserved.
But CSP With Storage Is Another Story …
0%
20%
40%
60%
80%
100%
6:00 8:00 10:00 12:00 14:00 16:00 18:00 20:00 22:00
Perc
ent L
oad
Time of Day
8-Hour Generation Profile

Copyright © 2013 SolarReserve. All Rights Reserved.
… and Design Can Be Optimized to System Needs
0%
20%
40%
60%
80%
100%
6:00 8:00 10:00 12:00 14:00 16:00 18:00 20:00 22:00
Perc
ent L
oad
Time of Day
16-Hour Generation Profile

Copyright © 2013 SolarReserve. All Rights Reserved.
Wind Generation vs. CAISO Load Profiles
24,000
26,000
28,000
30,000
32,000
34,000
36,000
38,000
40,000
200
400
600
800
1,000
1,200
0 2 4 6 8 10 12 14 16 18 20 22 24
MW
MW
Hours

Copyright © 2013 SolarReserve. All Rights Reserved.
Average realized price: CSP + storage achieves 1.34x in CA Time of Day
market, while availability-initiated dispatch achieves only 1.19x
$0
$2,500,000
$5,000,000
$7,500,000
$10,000,000
$12,500,000
1 2 3 4 5 6 7 8 9 10 11 12 13 14 15 16 17 18 19 20 21 22 23 24
Annu
al R
even
ue (a
ssum
es e
quiv
alen
t 250
MW
gen
erat
ion
@
$.1
0/kW
hr b
ase
rate
)
Hour
Dispatch as Available Dispatch out of Storage
Storage Maximizes Time-of-Day Revenue

Copyright © 2013 SolarReserve. All Rights Reserved.
Avoidance of additional investment in fossil-fueled peaking reserve
Optimization of investment in transmission upgrades by shifting generation profile to offset cyclicality of wind or solar PV
Thermal storage offers high efficiency / long cycle life alternative to costly / low cycle life battery options
Cost effective curtailment option
Available for ancillary services (ramping, firming, balancing, and reserves)
Incremental investment for additional storage in thermal storage system can be a fraction of the cost of incremental battery systems
Cost Effectiveness

Copyright © 2013 SolarReserve. All Rights Reserved.
California-based developer of large-scale solar power projects – includes development of CSP and PV projects
Exclusive 20-year license to the Molten Salt Power Tower CSP technology with Rocketdyne. Inherent thermal energy storage allows for dispatchable power on demand Lowest projected Levelized Cost of Energy (LCOE) of any CSP technology Significant projected future cost reductions and efficiency improvements
expected
SolarReserve Overview

Copyright © 2013 SolarReserve. All Rights Reserved.
SolarReserve’s CSP Technology
Multi-Extractions Reheat Steam
Cycle
Molten Salt Steam
Generation System
Air Cooled Condenser
Molten Salt Thermal Storage Tanks
Molten Salt Tower Receiver 565 MWt
Heliostats 1.08 million m2
Conventional Steam Turbine
Generator
Hot Tank
Cold Tank

Copyright © 2013 SolarReserve. All Rights Reserved.
SolarReserve CSP Solar Energy Plants
640 foot tall tower More than 10,000 heliostats Project Rendering

Copyright © 2013 SolarReserve. All Rights Reserved.
Location: Tonopah, Nevada
Technology: CSP with thermal energy storage via molten salt system
Size: 110 MW net output
Storage: 10 hours full load storage
Energy production: more than 500,000 MW-hours annually
Capacity factor: 52%
Power contract: NV Energy
EPC Contractor: Cobra Thermosolar Plants, Inc. with full EPC “wrap”
Technology Supplier: SolarReserve
Investors: SolarReserve (managing investor), Cobra, Santander
Crescent Dunes Solar Energy Project Overview

Copyright © 2013 SolarReserve. All Rights Reserved.
Crescent Dunes Project Arrangement
1.75 mile (2800m) diameter
640 foot tower 10,000 heliostats
Steam Turbine, Generator and Controls Hot and Cold Salt Storage Tanks
Heliostat Manufacturing
Evaporation Ponds
Offices and Construction Laydown

Copyright © 2013 SolarReserve. All Rights Reserved.
Pouring receiver deck foundation Constructing receiver deck
Steel reinforcement Nearing tower completion
Construction Activities – 2012

Copyright © 2013 SolarReserve. All Rights Reserved.
Heliostat steel components Assembled heliostats
Molten salt tank in construction
Construction Activities – March 2013
Closer aerial view

Copyright © 2013 SolarReserve. All Rights Reserved.
Aerial view of tower (Pre-panel installation)
Construction Activities – Receiver Installation
First receiver panel installation
Receiver panels fully installed

Copyright © 2013 SolarReserve. All Rights Reserved.
SolarReserve US CSP Developments

Copyright © 2013 SolarReserve. All Rights Reserved.
Rice Solar Energy Project
Location Riverside County in southeast California
Turbine Capacity 170 MW gross 150 MW net
Est. Annual Output 500 GWh
PPA 25-year PPA COD mid-2016
PPA Counterparty Pacific Gas & Electric
Technology Arrangement
Molten salt system collection and storage arrangement consistent with Crescent Dunes; identical receiver and tower; full air cooling
Site Control; Permitting
Unanimous CPUC Amended PPA Approval on Jan. 2013; BLM ROD for transmission corridor on Feb. 2012; CEC AFC Final Decision on Dec. 2010; previously disturbed 3,300 acre private land site under option
Transmission 10-mile gen-tie to Western Area Power Administration network with Mead substation as point of delivery; CAISO as balancing authority
Rice Project Site

Copyright © 2013 SolarReserve. All Rights Reserved.
"In my personal view, projects like the Rice Solar Project will be important to demonstrate that we can firm and shape intermittent renewables with clean technology, not just with fossil technology.”
"Eight to 10 hours of fully dispatchable storage is quite impressive and offers significant benefits to the system that we don't yet know how to quantify fully, but there's definitely value there. … Hopefully this is the first of many.”
"This particular project will also offer storage, which is a key component, and make it therefore hopefully more flexible in terms of being able to help us support integration. I look forward to this technology coming into California and helping us with renewable integration.”
"I think technology diversity is critical for risk diversification, and this project brings that to the energy mix.”
Commissioner Ferron Commissioner Sandova
Commissioner Florio Commissioner Peterman
Selected Comments from CPUC Commissioners

Copyright © 2013 SolarReserve. All Rights Reserved.
Policy Challenges Abound in Established Markets

Copyright © 2013 SolarReserve. All Rights Reserved.
Europe
Collapse of feed-in-tariff policy regimes
United States
Department of Commerce Antidumping and Countervailing Duties
Phase-out of Section 1705 US Department of Energy Loan Guarantee Program
Section 1603 Expiry and Sequestration Impact
Depth of Tax Capacity Market for ITC
Question of Whether States Have Met Success in Achieving Renewable Portfolio Standard Targets
Considerable increase in distressed activity via bankruptcies and restructurings
Headwinds

Copyright © 2013 SolarReserve. All Rights Reserved.
02468
1012141618
GW
Germany Italy
Spain France
Rest of Europe
A Tale of Two Markets
0
5
10
15
20
25
30
GW
USA China
India Japan
Korea Australia
Rest of World
Projected CAGR (7.9%) Projected CAGR 52.8%
Source: Analyst Reports

Copyright © 2013 SolarReserve. All Rights Reserved.
The Pivot to Growth Market Opportunities

Copyright © 2013 SolarReserve. All Rights Reserved.
SolarReserve Growth Market Focus

Copyright © 2013 SolarReserve. All Rights Reserved.
Flat daily demand profile and energy prices
CSP value is shifting generation to nighttime for combined baseload solar alongside PV, for maximal fuel conservation without compromising grid stability
Government announced solicitation for CSP and has targeted 40GW of solar capacity
Saudi Arabia: Baseload Solar Offsets Oil Use
• Opportunity cost: Oil at $100/barrel
• Fleet requires 1.3 to 2 barrels of oil per MWh, depending on type of generating facility
• At $100/barrel, this is $134-$205/MWh in variable fuel cost alone

Copyright © 2013 SolarReserve. All Rights Reserved.
A Call to Action

Copyright © 2013 SolarReserve. All Rights Reserved.
Modify ITC recapture rules to mirror more flexible Section 1603 Cash Grant transfer rules
Convert end-2016 “in-service” deadline for 30% ITC into Section 1603 style “commencement of construction” or investment safe harbor
Redesign Federal financing support away from full loan guarantee approach and toward new technology performance risk coverage
Permit use of Master Limited Partnerships toward renewable energy properties (although changing passive income loss rules may be counter to prevailing mood against “tax shelters” for the 1%)
Allow qualifying solar projects option to convert ITC into equivalent PTC
Replace distortive tax credit incentives with technology-neutral carbon tax levy to price carbon externalities to encourage market-based investments in low- or zero-carbon alternatives
Policy Opportunities to Maintain US Solar Growth

Copyright © 2013 SolarReserve. All Rights Reserved.
Thank You

Copyright © 2013 SolarReserve. All Rights Reserved.
Contact Information
www.solarreserve.com
Corporate Headquarters: 2425 Olympic Blvd. Suite 500 East Santa Monica, CA 90404 Phone: (310) 315-2200 Toll-Free: (866) 622-2778 Fax: (310) 315-2201