Embed Size (px)
Citation preview

Copyright © 2013 N.S.
Copyright © 2013 N.S.

Copyright © 2013 N.S.
What Do You Know About…?
3) Unemployment
4)Inflatio
nDeflati
on
1) Cycle
Write down words that come to mind when you think of each of the following. There are no right or wrong answers!
2) Gross Domestic Product (GDP)
5) Economic Growth
Ask yourself these questions:
1) What do I remember about these concepts from my previous classes?2) How have I heard these words used in the news?3) How do these affect me?

Copyright © 2013 N.S.
“The Business Cycle” Targets
Knowledge 1 Understand the different components of the business cycle.
Knowledge 2 Understand the causes and effects of a recession.
Reasoning 5 Explain how the three major indicators ofan economy’s performance are related(GDP, unemployment, and inflation)
Skill 1 Create an illustration of the business cycle.

Copyright © 2013 N.S.
What Is the Business Cycle?The business cycle describes the short-run fluctuation between economic
recession and expansion.

Copyright © 2013 N.S.
What Is the Business Cycle?The business cycle describes the short-run fluctuation between economic
recession and expansion.
1) The business cycle diagram compares the level of output (GDP) over time.

Copyright © 2013 N.S.
What Is the Business Cycle?The business cycle describes the short-run fluctuation between economic
recession and expansion.
1) The business cycle diagram compares the level of output (GDP) over time.
2) Downturns in the cycle are known as recessions. Severe downturns are depressions.
Recession
Recession
3) Upturns in the cycle are known as expansions, or recoveries.
Expansion
Expansion
4) Maximum economic output is called a peak.
Peak
5) Minimum economic output is called a trough.
Trough
Trough
6) There is steady growth in the long run.

Copyright © 2013 N.S.
United States Business Cycles
The graph below illustrates the business cycles that have occurred in the United States over the last 62 years.
Note that this graph shows the change in the real GDP growth RATE.

Copyright © 2013 N.S.
United States Business Cycles
The graph below illustrates the business cycles that have occurred in the United States over the last 62 years.
Note that this graph shows the change in the real GDP growth RATE.
1) U.S. recessions began in each of the following years:
1953 1958 1960 1969
1973 1980 1990
2001 2007
1981
Troughs
2) Recessions have lasted on average about one year.
3) Periods of expansion between recessions last about 5 years.
Peaks

Copyright © 2013 N.S.
United States Business Cycles
The graph below illustrates the business cycles that have occurred in the United States over the last 62 years.
1) U.S. recessions began in each of the following years:
1953 1958 1960 1969
1973 1980 1990
2001 2007
1981
2) Recessions have lasted on average about one year.
3) Periods of expansion between recessions last about 5 years.
4) In the long run, the U.S. economy has steadily grown.

Copyright © 2013 N.S.
During RecessionsAs a general rule, the following events occur during recessions.

Copyright © 2013 N.S.
During RecessionsAs a general rule, the following events occur during recessions.
1) GDP DecreasesAggregate output (total final goods and services produced) decreases during economic downturns.

Copyright © 2013 N.S.
During RecessionsAs a general rule, the following events occur during recessions.
1) GDP DecreasesAggregate output (total final goods and services produced) decreases during economic downturns.
2) Unemployment IncreasesBecause the amount of goods and services produced decreases, fewer workers are needed.
3) Inflation DecreasesBecause fewer goods and services are purchased, the price level in the economy decreases.

Copyright © 2013 N.S.
During ExpansionsAs a general rule, the following events occur during expansions.

Copyright © 2013 N.S.
During ExpansionsAs a general rule, the following events occur during expansions.
1) GDP IncreasesAggregate output increases as people begin to demand more goods and services.

Copyright © 2013 N.S.
During ExpansionsAs a general rule, the following events occur during expansions.
1) GDP IncreasesAggregate output increases as people begin to demand more goods and services.
2) Unemployment DecreasesIn order to supply consumers with increased demand, producers must hire more workers.
3) Inflation IncreasesBecause more money is being spent, the overall price level for the economy increases.

Copyright © 2013 N.S.
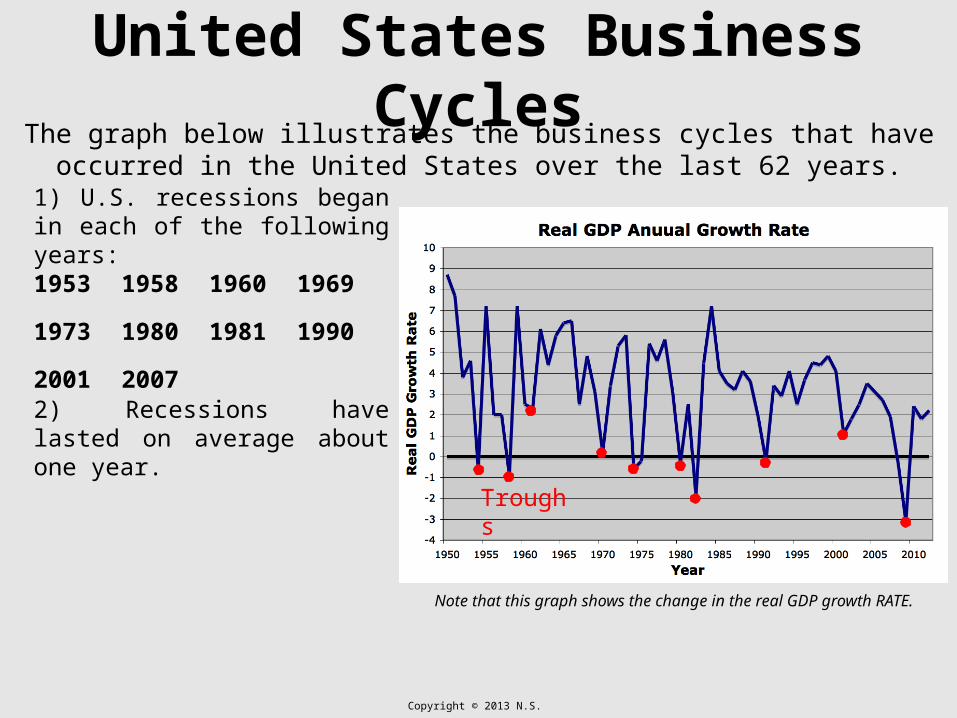
Other IndicatorsGDP, Unemployment, and Inflation are the three main tools for measuring an
economy’s performance. There are, however, dozens of other indicators.

Copyright © 2013 N.S.
Other IndicatorsGDP, Unemployment, and Inflation are the three main tools for measuring an
economy’s performance. There are, however, dozens of other indicators.
1) Leading IndicatorsLeading indicators become weak right before a recession and strong right before an expansion.
Some examples include building permits for new housing units, the Standard & Poor’s
500 stock index, and the M2 money supply.

Copyright © 2013 N.S.
Other IndicatorsGDP, Unemployment, and Inflation are the three main tools for measuring an
economy’s performance. There are, however, dozens of other indicators.
1) Leading IndicatorsLeading indicators become weak right before a recession and strong right before an expansion.
Some examples include number of employees on payrolls, industrial production,
and manufacturing.
2) Coincident IndicatorsThese change at roughly the same time as the economy.
Copyright © 2013 N.S.
Other IndicatorsGDP, Unemployment, and Inflation are the three main tools for measuring an
economy’s performance. There are, however, dozens of other indicators.
1) Leading IndicatorsLeading indicators become weak right before a recession and strong right before an expansion.
2) Coincident IndicatorsThese change at roughly the same time as the economy.
3) Lagging IndicatorsThese do not change until after the economy has already begun to enter a recession or an expansion.
Some examples include outstanding consumer credit, the CPI (inflation), and the
prime rate charged by banks.

Copyright © 2013 N.S.
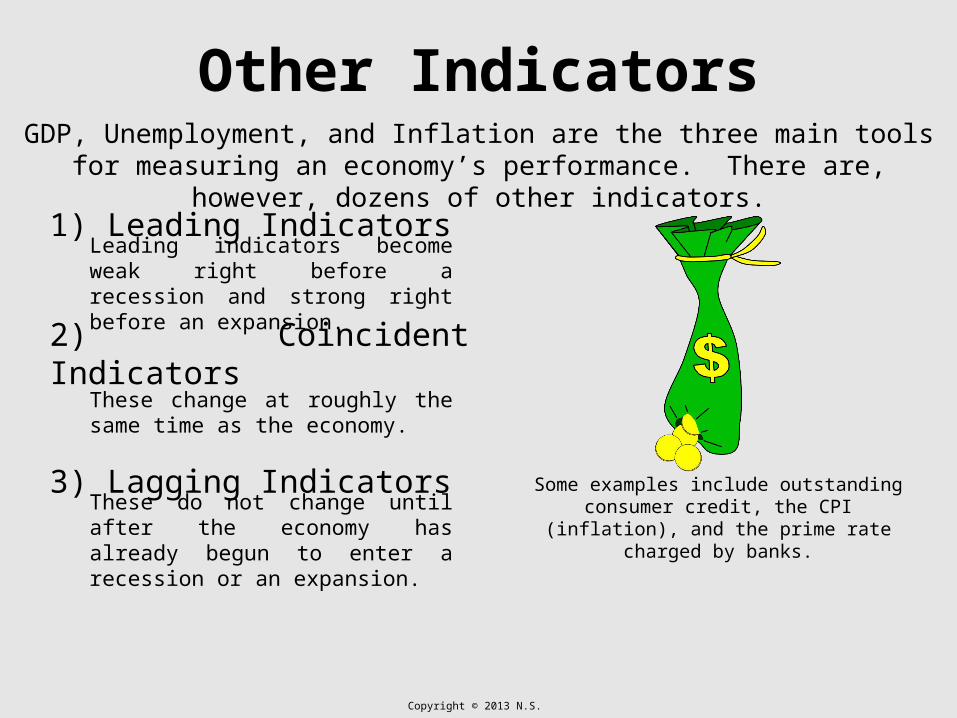
Stabilizing the Business Cycle
One of the key goals of macroeconomics is to smooth out the ups and downs of the business cycle.

Copyright © 2013 N.S.
Stabilizing the Business Cycle
One of the key goals of macroeconomics is to smooth out the ups and downs of the business cycle.
1) Controlling the severity of recessions means people have jobs and money for spending.
Copyright © 2013 N.S.
Stabilizing the Business Cycle
One of the key goals of macroeconomics is to smooth out the ups and downs of the business cycle.
1) Controlling the severity of recessions means people have jobs and money for spending.
2) Controlling excessively strong expansions means prices will not rise out of control.
3) Government uses fiscal policy, which uses taxes and spending to control the economy.
Copyright © 2013 N.S.
Stabilizing the Business Cycle
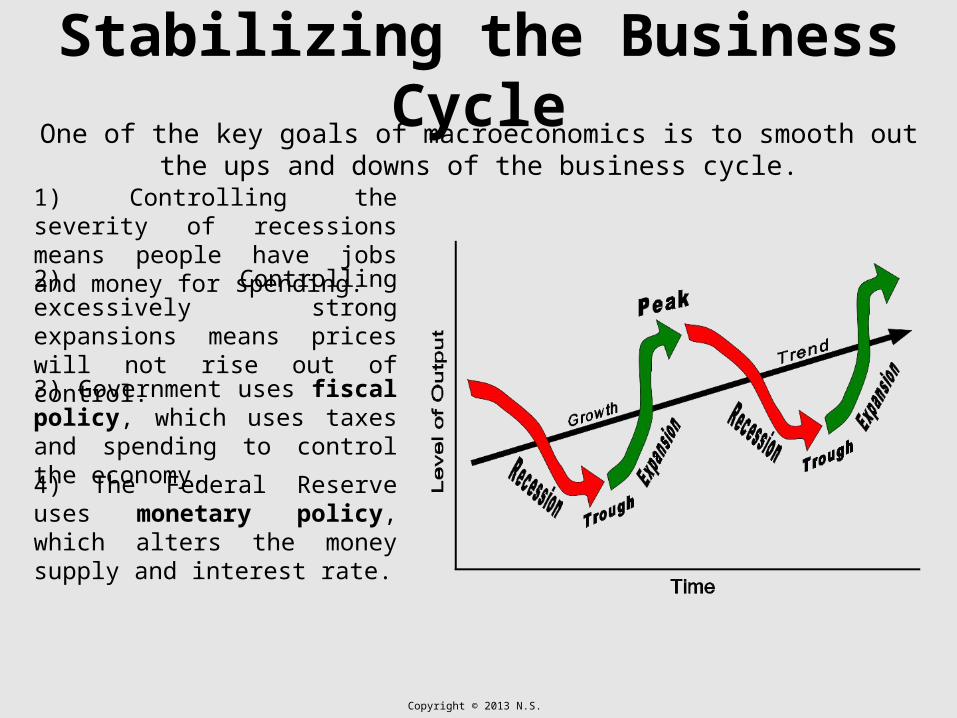
One of the key goals of macroeconomics is to smooth out the ups and downs of the business cycle.
1) Controlling the severity of recessions means people have jobs and money for spending.
2) Controlling excessively strong expansions means prices will not rise out of control.
3) Government uses fiscal policy, which uses taxes and spending to control the economy.
4) The Federal Reserve uses monetary policy, which alters the money supply and interest rate.

Copyright © 2013 N.S.
Business Cycle FluctuationsA) CREATE AN ILLUSTRATION OF THE
BUSINESS CYCLEDraw an illustration of the business cycle. Be sure to label your diagram using all of the words from the box.
B) IDENTIFY ECONOMIC INDICATORSUsing the Business Cycle Fluctuations Cards, identify whether each event indicates an expansion or a recession. Turn one card over at a time and discuss as a group. Then, write the name of the event under the proper heading.

Copyright © 2013 N.S.
“The Business Cycle” Targets
Knowledge 1 Understand the different components of the business cycle.
Knowledge 2 Understand the causes and effects of a recession.
Reasoning 5 Explain how the three major indicators ofan economy’s performance are related(GDP, unemployment, and inflation)
Skill 1 Create an illustration of the business cycle.

Copyright © 2013 N.S.
Resources
http://www.bea.gov/national/index.htm#gdp: Data regarding Real GDP growth rates and Real GDP