Embed Size (px)
Citation preview
Copyright © 2011 Pearson Education, Inc. Slide 5-1
Unit 5E
Correlation Coefficient

Copyright © 2011 Pearson Education, Inc. Slide 5-2
Unit 5E
What does it tell us?

5-E
Copyright © 2011 Pearson Education, Inc. Slide 5-3
The trendline is simply a straight line fitted to the data by the method of least squares.
If the straight line goes “uphill,” it indicates a positive correlation.
If the straight line goes “downhill,” it indicates a negative correlation.
If the straight line is horizontal or nearly horizontal, it indicates no correlation
Review: Trendline

5-E
Copyright © 2011 Pearson Education, Inc. Slide 5-4
The correlation coefficient is a measure of the strength of the correlation (i.e., how near the data are to the trendline)
If the straight line goes “uphill,” R will have a positive value; the closer R is to 1, the stronger the correlation
If the straight line goes “downhill,” R will have a negative value; the closer R is to -1, the stronger the correlation
If the straight line is horizontal or nearly horizontal, R will be zero or have a very small value
Review: Correlation Coefficient R r

5-EFour Sets of Data over the same Range
Copyright © 2011 Pearson Education, Inc. Slide 5-5
x y y1 y2 y3
0.00 2.00 2.10 1.00 0.00
1.00 3.00 2.90 4.00 5.00
2.00 4.00 3.10 3.00 2.00
3.00 5.00 4.90 6.00 7.00
4.00 6.00 5.90 5.00 4.00
5.00 7.00 7.10 8.00 9.00
6.00 8.00 7.90 7.00 6.00
7.00 9.00 9.10 10.00 11.00
8.00 10.00 9.90 9.00 8.00
9.00 11.00 11.10 12.00 13.00

5-EScatterplot of Y Data Set (Correlation?)
Copyright © 2011 Pearson Education, Inc. Slide 5-6

5-EScatterplot for Y1 Data Set (Correlation?)
Copyright © 2011 Pearson Education, Inc. Slide 5-7
R=0.995935

5-EScatterplot for Y2 Data Set (Correlation?)
Copyright © 2011 Pearson Education, Inc. Slide 5-8

5-EScatterplot of Y3 Data Set (Correlation?)
Copyright © 2011 Pearson Education, Inc. Slide 5-9

5-E
Copyright © 2011 Pearson Education, Inc. Slide 5-10
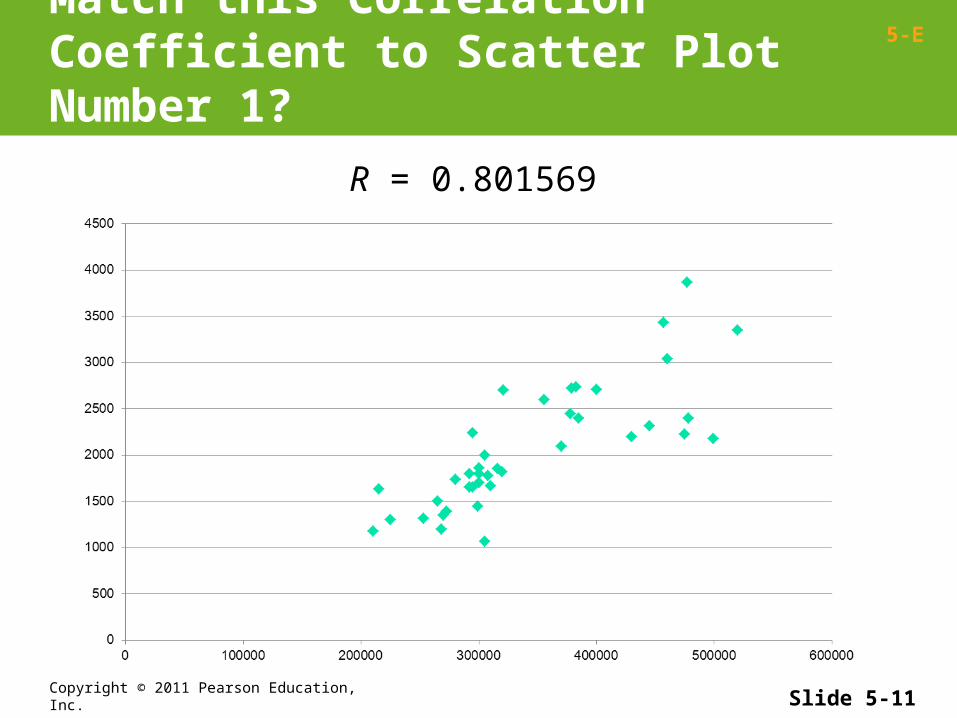
Match a Correlation Coefficient to a Scatter Plot
Given R = 0.801569
Which of the following scatter plots could have this correlation coefficient?
5-E
Copyright © 2011 Pearson Education, Inc. Slide 5-11
Match this Correlation Coefficient to Scatter Plot Number 1?
R = 0.801569

5-E
Copyright © 2011 Pearson Education, Inc. Slide 5-12
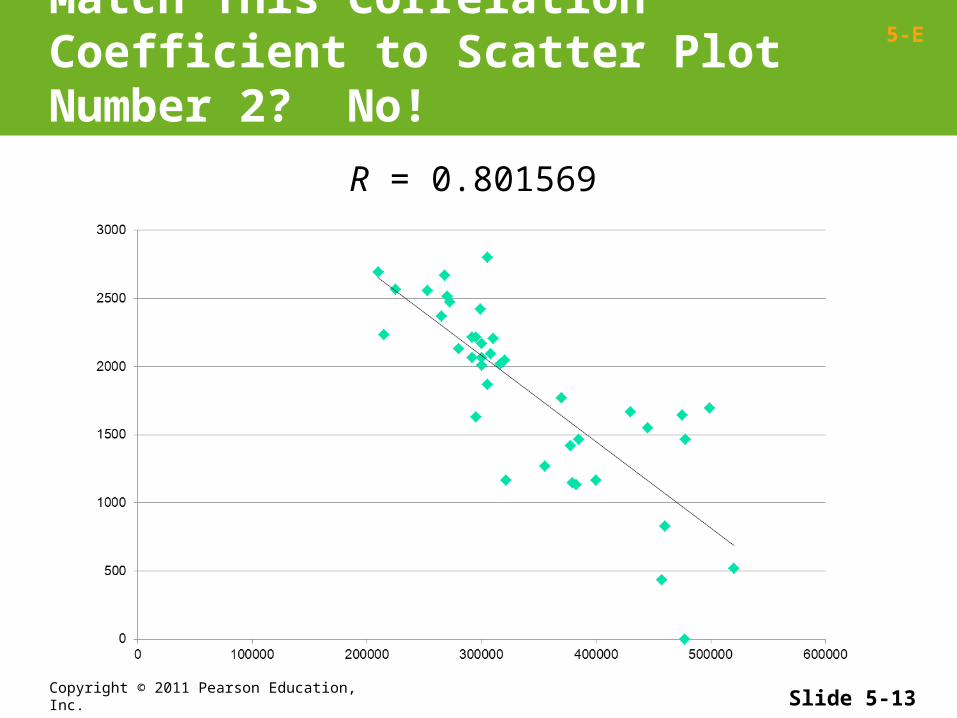
Match This Correlation Coefficient to Scatter Plot Number 2?
R = 0.801569
5-E
Copyright © 2011 Pearson Education, Inc. Slide 5-13
Match This Correlation Coefficient to Scatter Plot Number 2? No!
R = 0.801569

5-E
Copyright © 2011 Pearson Education, Inc. Slide 5-14
Match this Correlation Coefficient to Scatter Plot Number 3?
R = 0.801569

5-E
Copyright © 2011 Pearson Education, Inc. Slide 5-15
Match this Correlation Coefficient to Scatter Plot Number 3? No!
R = 0.801569

5-E
Copyright © 2011 Pearson Education, Inc. Slide 5-16
Match this Correlation Coefficient to Scatter Plot Number 1?
R = 0.801569

5-E
Copyright © 2011 Pearson Education, Inc. Slide 5-17
Match this Correlation Coefficient to Scatter Plot Number 1? Yes!
R = 0.801569R2 64% Data within Trendline Relationship
Matches