Embed Size (px)
Citation preview

Copyright © 2010 Pearson Education, Inc. Publishing as Prentice Hall 5-1
Chapter 5 Factors Affecting
Bond Yields and the Term Structure of
Interest Rates

Copyright © 2010 Pearson Education, Inc. Publishing as Prentice Hall 5-2
Learning ObjectivesAfter reading this chapter, you will understandwhy the yield on a Treasury security is the base interest ratethe factors that affect the yield spread between two bondswhat a yield curve is a spot rate and a spot rate curvehow theoretical spot rates are derived using arbitrage arguments from the Treasury yield curvewhat the term structure of interest rates iswhy the price of a Treasury bond should be based on theoretical spot ratesa forward rate and how a forward rate is derived

Copyright © 2010 Pearson Education, Inc. Publishing as Prentice Hall 5-3
Learning Objectives(continued)
After reading this chapter, you will understandhow long-term rates are related to the current short-term rate and short-term forward rateswhy forward rates should be viewed as hedgeable ratesthe various theories about the determinants of the shape of the term structure: pure expectations theory, the liquidity theory, the preferred habitat theory, and the market segmentation theorythe main economic influences on the shape of the Treasury yield curvewhat the swap curve/LIBOR curve is and why it is used as an interest rate benchmark

Copyright © 2010 Pearson Education, Inc. Publishing as Prentice Hall 5-4
Base Interest Rates The securities issued by the U.S. Department of the Treasury
are backed by the full faith and credit of the U.S. government. Interest rates on Treasury securities are the key interest rates in
the U.S. economy as well as in international capital. The minimum interest rate that investors want is referred to as
the base interest rate or benchmark interest rate that investors will demand for investing in a non-Treasury security.
This rate is the yield to maturity (hereafter referred to as simply yield) offered on a comparable maturity Treasury security that was most recently issued (“on the run”).
Exhibit 5-1 (see Overhead 5-5) shows the yield. These yields represent the benchmark interest rate.

Copyright © 2010 Pearson Education, Inc. Publishing as Prentice Hall 5-5
Exhibit 5-1U.S. Treasury Security Yields on December 28, 2007
Maturity Yield
3-month 3.01 6-month 3.29
2-year 3.09
3-year 3.04
5-year 3.49
10-year 4.07 30-year 4.49
Copyright © 2010 Pearson Education, Inc. Publishing as Prentice Hall 5-6
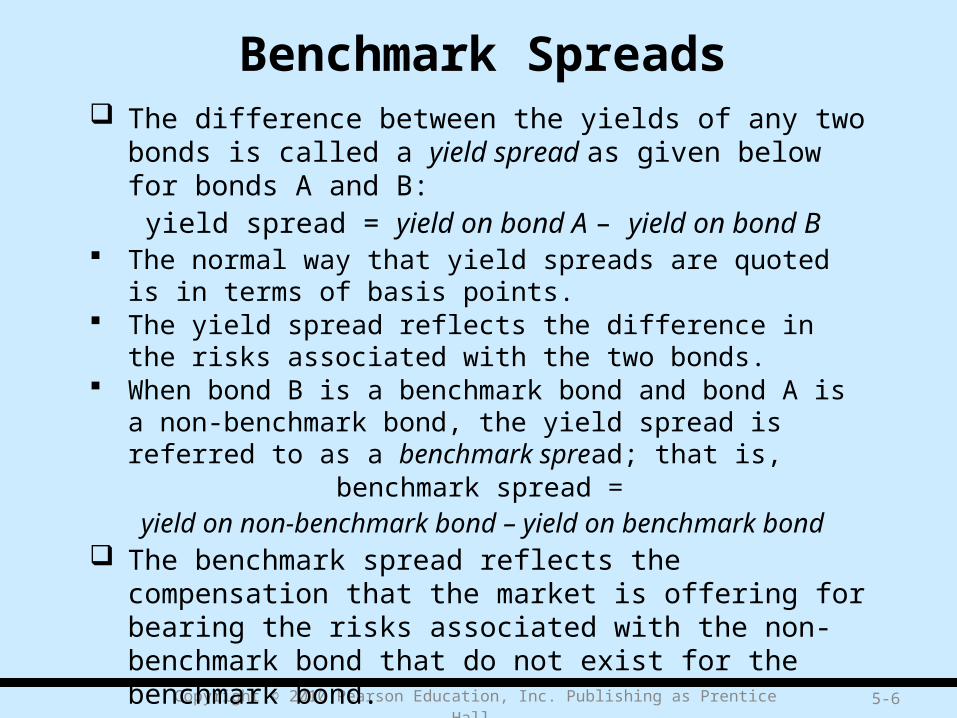
Benchmark Spreads The difference between the yields of any two bonds is called a
yield spread as given below for bonds A and B:yield spread = yield on bond A – yield on bond B
The normal way that yield spreads are quoted is in terms of basis points.
The yield spread reflects the difference in the risks associated with the two bonds.
When bond B is a benchmark bond and bond A is a non-benchmark bond, the yield spread is referred to as a benchmark spread; that is,
benchmark spread = yield on non-benchmark bond – yield on benchmark bond
The benchmark spread reflects the compensation that the market is offering for bearing the risks associated with the non-benchmark bond that do not exist for the benchmark bond.
Thus, the benchmark spread can be thought of as a risk premium.

Copyright © 2010 Pearson Education, Inc. Publishing as Prentice Hall 5-7
Benchmark Spreads (continued)
Exhibit 5-2 (see Overhead 5-8) provides information on benchmark spreads for actual trades for four issues.
The four issues traded are shown in the second column of the exhibit.
The trade price and the resulting yield for each issue are shown in the fourth and fifth columns.
The appropriate Treasury benchmark for each traded bond is shown in the sixth column.
The yield for the Treasury benchmark issue on the trade date is shown in the seventh column.
The benchmark spread is then the difference between the yield on the traded issue and the yield on the Treasury benchmark issue and is shown in the last column.

Copyright © 2010 Pearson Education, Inc. Publishing as Prentice Hall 5-8
Exhibit 5-2U.S. Treasury Security Yields on December 28, 2007
Issuer Issue RatingTrade Price Yield (%)
TreasuryBench-mark
Bench-mark Yield (%)
Bench-mark
Spread (bps)
General Elect.Capital Corp.
GE 4.12509/01/2009
Aaa/AAA
100.182 4.008US/T 3.125
11/30/2009
3.218 79.0
EI Du Pont DeNemours & Co.
DD 501/15/2013
A2/A
100.681 4.843US/T 3.375
11/30/2012
3.616 122.7
The Coca-ColaCompany
KO 5.3511/15/2017
Aa3/A
102.533 5.020US/T 4.25
11/15/2017
4.201 81.9
Wal-Mart Stores Inc.
WMT 6.508/15/2037
Aa2/AA
109.010 5.855US/T 4.75
02/15/2037
4.619 123.6
Copyright © 2010 Pearson Education, Inc. Publishing as Prentice Hall 5-9
Benchmark Spreads (continued)
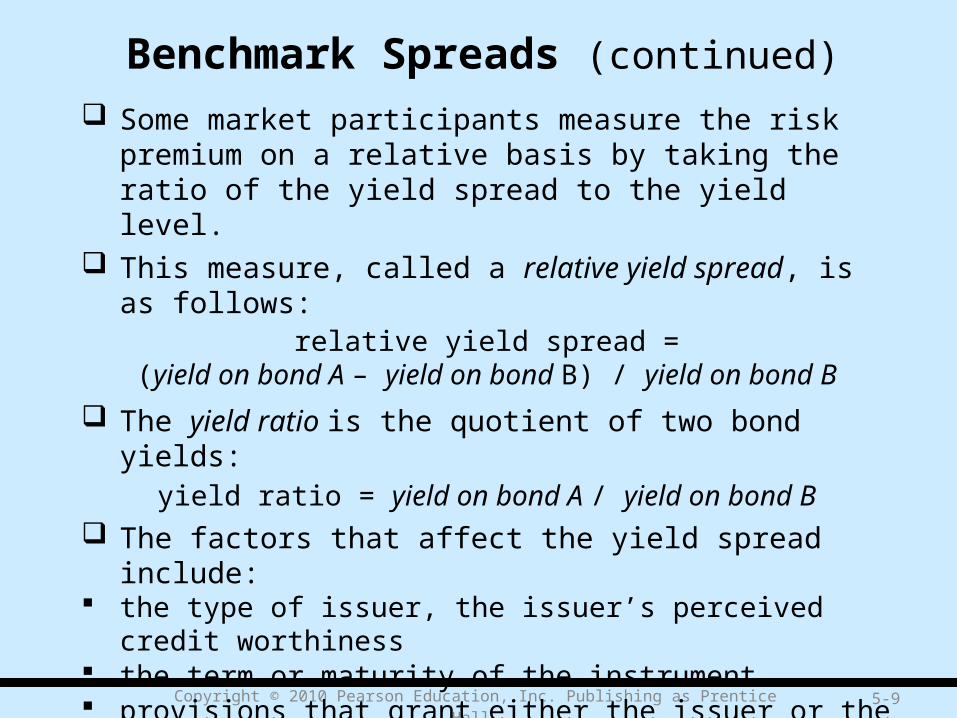
Some market participants measure the risk premium on a relative basis by taking the ratio of the yield spread to the yield level.
This measure, called a relative yield spread, is as follows:relative yield spread =
(yield on bond A – yield on bond B) / yield on bond B
The yield ratio is the quotient of two bond yields:yield ratio = yield on bond A / yield on bond B
The factors that affect the yield spread include: the type of issuer, the issuer’s perceived credit worthiness the term or maturity of the instrument provisions that grant either the issuer or the investor the option to do
something the taxability of the interest received by investors the expected liquidity of the security

Copyright © 2010 Pearson Education, Inc. Publishing as Prentice Hall 5-10
Benchmark Spreads (continued)
Types of Issuers The bond market is classified by the type of issuer, including the U.S.
government, U.S government agencies, municipal governments, credit (domestic and foreign corporations), and foreign governments.
These classifications are referred to as market sectors. Different sectors can be perceived to signify different risks and rewards. Some market sectors are further subdivided into categories intended to
reflect common economic characteristics. For example, within the credit market sector, issuers are classified as
follows: industrial, utility, finance, and non-corporate. The spread between the interest rate offered in two sectors of the bond
market with the same maturity is called an intermarket sector spread. The spread between two issues within a market sector is called an
intramarket sector spread.

Copyright © 2010 Pearson Education, Inc. Publishing as Prentice Hall 5-11
Benchmark Spreads (continued)
Perceived Credit Worthiness of Issuer Default risk or credit risk refers to the risk that the issuer of a bond
may be unable to make timely principal and/or interest payments. Most market participants rely primarily on commercial rating
companies to assess the default risk of an issuer. The spread between Treasury securities and non-Treasury securities
that are identical in all respects except for quality is referred to as a credit spread.
Examples of credit spreads on December 28, 2007, are provided in Exhibit 5-3 (see Overhead 5-12).
The Treasury yields for computing the credit spreads were those shown in Exhibit 5-2 (as was seen in Overhead 5-8).
As can be seen, for a given maturity, the higher the credit rating is, the smaller the credit spread.

Copyright © 2010 Pearson Education, Inc. Publishing as Prentice Hall 5-12
Exhibit 5-3Corporate Bond Yields and Risk Premium Measures Relative to Treasury Yields on
December 28, 2007
Maturity RatingCorporate Yield (%)
Treasury Yield (%)
Yield Spread (bps)
5-year AAA 4.60 3.49 111
5-year AA 4.91 3.49 142
10-year AAA 5.03 4.07 96
10-year AA 5.32 4.07 125
Note: Yields were reported on finance. yahoo. com. The original source is ValuBond.
Copyright © 2010 Pearson Education, Inc. Publishing as Prentice Hall 5-13
Benchmark Spreads (continued)
Inclusion of Options It is not uncommon for a bond issue to include a provision
that gives either the bondholder and/or the issuer an option to take some action against the other party.
The presence of an embedded option has an effect on the spread of an issue relative to a Treasury security and the spread relative to otherwise comparable issues that do not have an embedded option.
An analytical measure called the option-adjusted spread (OAS) is the yield spread after adjusting for the value of the embedded options.
Absent any embedded options, the lower rated bond would have a higher benchmark spread.

Copyright © 2010 Pearson Education, Inc. Publishing as Prentice Hall 5-14
Benchmark Spreads (continued)
Taxability of Interest Because of the tax-exempt feature of municipal bonds, the
yield on municipal bonds is less than Treasuries with the same maturity. This is seen in Exhibit 5-4 (see Overhead 5-15)
The yield on a taxable bond issue after federal income taxes are paid is called the after-tax yield:
after-tax yield = pretax yield × (1 – marginal tax rate) Alternatively, we can determine the yield that must be offered
on a taxable bond issue to give the same after-tax yield as a tax-exempt issue.
• This yield is called the equivalent taxable yield and is:equivalent taxable yield =
tax-exempt yield / (1 – marginal tax rate)

Copyright © 2010 Pearson Education, Inc. Publishing as Prentice Hall 5-15
Exhibit 5-4AAA Municipal Yields versus AAA Corporate Yields
MaturityMunicipal Yield (%)
Corporate Yield (%)
Yield Ratio
5-year 3.35 4.91 0.68
10-year 3.87 5.03 0.77
20-year 4.59 5.32 0.86
Note: Yields were reported on finance. yahoo. com. The original source is ValuBond.

Copyright © 2010 Pearson Education, Inc. Publishing as Prentice Hall 5-16
Benchmark Spreads (continued) The municipal bond market is divided into two major sectors:
general obligations and revenue bonds. State and local governments may tax interest income on bond
issues that are exempt from federal income taxes. Some municipalities’ exempt interest income from all municipal
issues from taxation; others do not. Some states exempt interest income from bonds issued by
municipalities within the state but tax the interest income from bonds issued by municipalities outside the state.
Municipalities are not permitted to tax the interest income from securities issued by the U.S. Treasury.
Thus part of the spread between Treasury securities and taxable non-Treasury securities of the same maturity reflects the value of the exemption from state and local taxes.

Copyright © 2010 Pearson Education, Inc. Publishing as Prentice Hall 5-17
Benchmark Spreads (continued)
Expected Liquidity of an Issue Bonds trade with different degrees of liquidity. Bonds with greater expected liquidity will have
lower yields that investors would require. Treasury securities are the most liquid securities in
the world. The lower yield offered on Treasury securities
relative to non-Treasury securities reflects the difference in liquidity.
Even within the Treasury market, on-the-run issues have greater liquidity than off-the-run issues.

Copyright © 2010 Pearson Education, Inc. Publishing as Prentice Hall 5-18
Benchmark Spreads (continued)
Financeability of an Issue A portfolio manager can use an issue as collateral for borrowing funds
so as to create leverage. The typical market used by portfolio managers to borrow funds using a
security as collateral for a loan is the repurchase agreement (repo) market.
When a portfolio manager wants to borrow funds via a repo agreement, a dealer provides the funds.
The interest rate charged by the dealer is called the repo rate. There is not one repo rate but a structure of rates depending on the
maturity of the loan and the specific issue being financed. With respect to the latter, there are times when dealers are in need of
particular issues to cover a short position. When a dealer needs a particular issue, that dealer will be willing to
offer to lend funds at a lower repo rate than the general repo rate in the market.

Copyright © 2010 Pearson Education, Inc. Publishing as Prentice Hall 5-19
Benchmark Spreads (continued)
Term To Maturity The term to maturity is the time remaining on a bond’s life. The volatility of a bond’s price is dependent on its term to maturity. All other factors constant, the longer the term to maturity of a bond,
the greater the price volatility resulting from a change in market yields.
Bonds are classified into three maturity sectors:• Short-term bonds have a term to maturity of between 1 to 5 years• Intermediate bonds have a term to maturity of between 5 and 12 years • Long-term bonds have a term to maturity greater than 12 years The spread between any two maturity sectors of the market is
called a maturity spread. The relationship between the yields on otherwise comparable
securities with different maturities is called the term structure of interest rates.

Copyright © 2010 Pearson Education, Inc. Publishing as Prentice Hall 5-20
Term Structure of Interest Rates (continued)
Yield Curve The yield curve is the graphical depiction of the relation between
the yield on bonds of the same credit quality but different maturities.
Investors have typically constructed yield curves from observations of prices and yields in the Treasury market for two reasons:
i. First, Treasury securities are free of default risk, and differences in credit worthiness do not affect yields. Therefore, these instruments are directly comparable.
ii. Second, as the largest and most active bond market, the Treasury market offers the fewest problems of illiquidity or infrequent trading. The disadvantage is that the yields may be biased downward because they reflect favorable financing opportunities.
Exhibit 5-5 (see Overhead 5-21) shows three typical shapes for the yield curve.

Copyright © 2010 Pearson Education, Inc. Publishing as Prentice Hall 5-21
Exhibit 5-5Shape of Price-Yield Relationship for an Option-Free Bond
Yie
ld
Maturity(a)
Positive
Inverted
Flat
Maturity
Maturity
Yie
ld
Yie
ld
(b)
(c)
Copyright © 2010 Pearson Education, Inc. Publishing as Prentice Hall 5-22
Term Structure of Interest Rates (continued)
Why the Yield Curve Should Not Be Used To Price a Bond The bond pricing formula assumes that one interest rate should be
used to discount all the bond’s cash flows. Because of the different cash flow patterns, it is not appropriate to
use the same interest rate to discount all cash flows. Each cash flow should be discounted at a unique rate appropriate for
the time period in which the cash flow will be received. The correct way to think about bonds is that they are packages of
zero-coupon instruments. Each zero-coupon instrument in the package has a maturity equal to
its coupon payment date or, in the case of the principal, the maturity date.
The value of the bond should equal the value of all the component zero-coupon instruments.

Copyright © 2010 Pearson Education, Inc. Publishing as Prentice Hall 5-23
Term Structure of Interest Rates (continued)
Why the Yield Curve Should Not Be Used To Price a Bond To determine the value of each zero-coupon instrument, it is necessary
to know the yield on a zero-coupon Treasury with that same maturity. This yield is called the spot rate, and the graphical depiction of the
relationship between the spot rate and maturity is called the spot rate curve.
Because there are no zero-coupon Treasury debt issues with a maturity greater than one year, it is not possible to construct such a curve solely from observations of market activity on Treasury securities.
Rather, it is necessary to derive this curve from theoretical considerations as applied to the yields of the actually traded Treasury debt securities.
Such a curve is called a theoretical spot rate curve and is the graphical depiction of the term structure of interest rate.

Copyright © 2010 Pearson Education, Inc. Publishing as Prentice Hall 5-24
Term Structure of Interest Rates (continued)
Constructing the Theoretical Spot Rate Curve for Treasuries Bond
A default-free theoretical spot rate curve can be constructed from the yield on Treasury securities.
The Treasury issues that are candidates for inclusion arei. on-the-run Treasury issuesii. on-the-run Treasury issues and selected off-the-run Treasury issuesiii. all Treasury coupon securities, and billsiv. Treasury coupon strips After the securities that are to be included in the construction of the
theoretical spot rate curve are selected, the methodology for constructing the curve must be determined.
If the on-the-run Treasury issues with or without selected off-the-run Treasury issues are used, a methodology called bootstrapping is used.

Copyright © 2010 Pearson Education, Inc. Publishing as Prentice Hall 5-25
Term Structure of Interest Rates (continued)
On-the-Run Treasury Issues The on-the-run Treasury issues are the most recently auctioned issue of
a given maturity. These issues include 3-month, 6-month, and 1-year Treasury bills; 2-
year, 5-year, and 10-year Treasury notes; and 30-year Treasury bond. Treasury bills are zero-coupon instruments; the notes and the bond are
coupon securities. There is an observed yield for each of the on-the-run issues. For the coupon issues, these yields are not the yields used in the
analysis when the issue is not trading at par.• Instead, for each on-the-run coupon issue, the estimated yield necessary
to make the issue trade at par is used.• The resulting on-the-run yield curve is called the par coupon curve.

Copyright © 2010 Pearson Education, Inc. Publishing as Prentice Hall 5-26
Term Structure of Interest Rates (continued) On-the-Run Treasury Issues The goal is to construct a theoretical spot rate curve with 60
semiannual spot rates: 6 month rate to 30-year rate. Excluding the three-month bill, there are only six maturity points
available when only on-the-run issues are used. The 54 missing maturity points are extrapolated from the surrounding
maturity points on the par yield curve. The simplest interpolation method, and the one most commonly used,
is linear extrapolation. Specifically, given the yield on the par coupon curve at two maturity
points, the following is calculated:
The yield for all intermediate semiannual maturity points is found by adding to the yield at the lower maturity the amount computed here.
1
yield at higher maturity yield at lower maturity
number of semiannual periods between the two maturity points

Copyright © 2010 Pearson Education, Inc. Publishing as Prentice Hall 5-27
Term Structure of Interest Rates (continued)
On-the-Run Treasury Issues There are two problems with using just the on-the-run issues.i. First, there is a large gap between some of the maturities points,
which may result in misleading yields for those maturity points when estimated using the linear interpolation method.
• Specifically, the concern is with the large gap between the five-year and 10-year maturity points and the 10-year and 30-year maturity points.
i. The second problem is that the yields for the on-the-run issues themselves may be misleading because most offer the favorable financing opportunity in the repo market mentioned earlier.
• This means that the true yield is greater than the quoted (observed) yield.

Copyright © 2010 Pearson Education, Inc. Publishing as Prentice Hall 5-28
Term Structure of Interest Rates (continued)
On-the-Run Treasury Issues As shown in Exhibit 5-6 (see Overhead 5-29), we can convert the par
yield curve into the theoretical spot rate curve using bootstrapping. To explain the process of estimating the theoretical spot rate curve from
observed yields on Treasury securities, we consideri. a six-month Treasury bill where its annualized yield is the six-month spot
rate andii. a one-year Treasury where its annualized yield is the one year spot rate. Given these two spot rates, we can compute the spot rate for a theoretical
1.5-year zero-coupon Treasury. Given the theoretical 1.5-year spot rate, we can obtain the theoretical 2-
year spot rate and so forth until we derive theoretical spot rates for the remaining 15 half-yearly rates.
The spot rates using this process represent the term structure of interest rates and can be viewed in Exhibit 5-7 (see Overhead 5-30).

Copyright © 2010 Pearson Education, Inc. Publishing as Prentice Hall 5-29
Exhibit 5-6 Maturity and Yield to Maturity for 20 Hypothetical Treasury Securities
Period Years Yield to Maturity/Coupon Rate (%)1 0.5 5.252 1.0 5.503 1.5 5.754 2.0 6.005 2.5 6.256 3.0 6.507 3.5 6.758 4.0 6.809 4.5 7.00
10 5.0 7.1011 5.5 7.15
12 6.0 7.20
13 6.5 7.3014 7.0 7.3515 7.5 7.4016 8.0 7.5017 8.5 7.6018 9.0 7.6019 9.5 7.7020 10.0 7.80

Copyright © 2010 Pearson Education, Inc. Publishing as Prentice Hall 5-30
Exhibit 5-7 Theoretical Spot RatesPeriod Years Yield to Maturity/Coupon Rate (%)
1 0.5 5.252 1.0 5.503 1.5 5.764 2.0 6.025 2.5 6.286 3.0 6.557 3.5 6.828 4.0 6.879 4.5 7.09
10 5.0 7.2011 5.5 7.2612 6.0 7.3113 6.5 7.4314 7.0 7.4815 7.5 7.5416 8.0 7.6717 8.5 7.8018 9.0 7.7919 9.5 7.9320 10.0 8.07
Copyright © 2010 Pearson Education, Inc. Publishing as Prentice Hall 5-31
Term Structure of Interest Rates (continued)
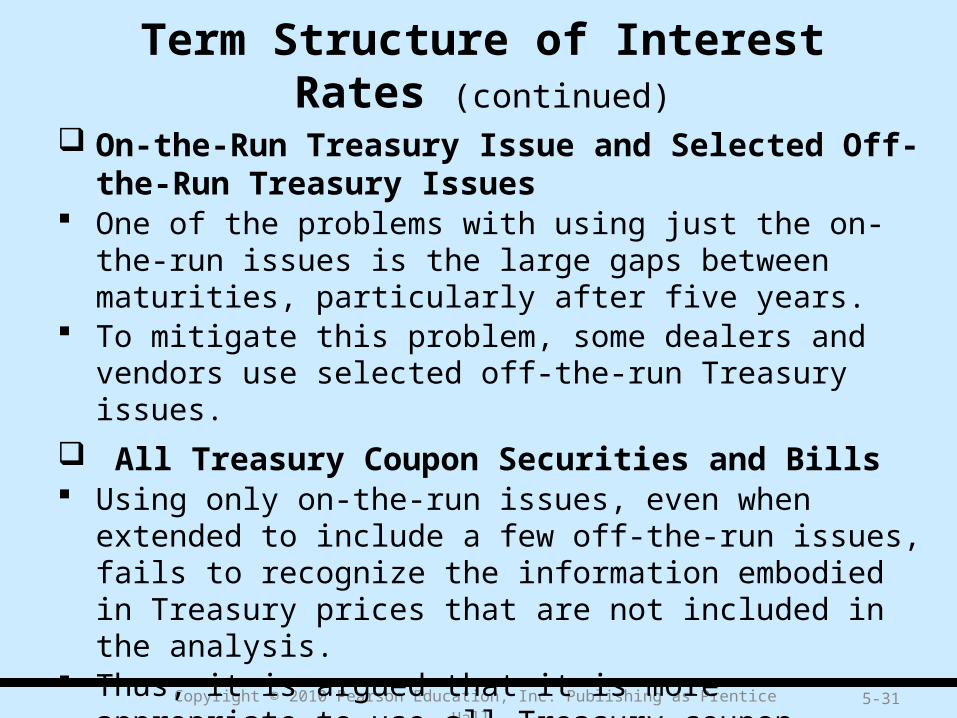
On-the-Run Treasury Issue and Selected Off-the-Run Treasury Issues
One of the problems with using just the on-the-run issues is the large gaps between maturities, particularly after five years.
To mitigate this problem, some dealers and vendors use selected off-the-run Treasury issues.
All Treasury Coupon Securities and Bills Using only on-the-run issues, even when extended to include a few
off-the-run issues, fails to recognize the information embodied in Treasury prices that are not included in the analysis.
Thus, it is argued that it is more appropriate to use all Treasury coupon securities and bills to construct the theoretical spot rate curve.

Copyright © 2010 Pearson Education, Inc. Publishing as Prentice Hall 5-32
Term Structure of Interest Rates (continued)
Treasury Coupon Strips Treasury coupon strips are zero-coupon Treasury securities. It would seem logical that the observed yield on strips could be
used to construct an actual spot rate curve. There are three problems with using the observed rates on
strips. First, the liquidity of the strips market is not as great as that of
the Treasury coupon market. Second, the tax treatment of strips is different from that of
Treasury coupon securities. Finally, there are maturity sectors in which non–U.S. investors
find it advantageous to trade off yield for tax advantages associated with a strip.

Copyright © 2010 Pearson Education, Inc. Publishing as Prentice Hall 5-33
Term Structure of Interest Rates (continued)
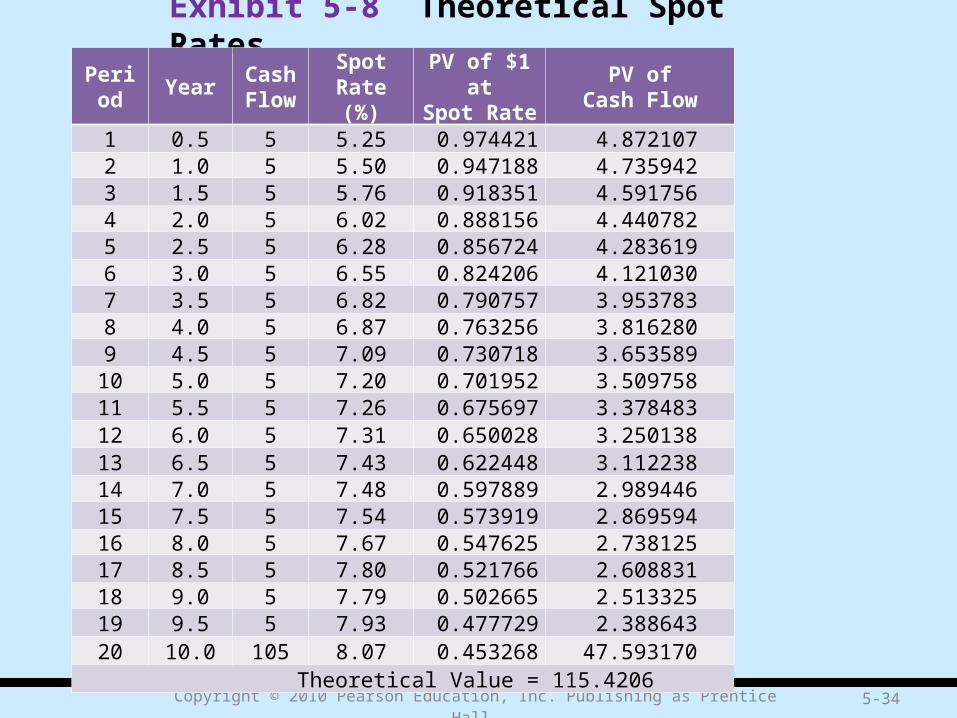
Using the Theoretical Spot Rate Curve Exhibit 5-8 (see Overhead 5-34) shows how to value a
Treasury bond properly using the theoretical spot rates.
• The bond in the illustration is a hypothetical 10-year Treasury security with a coupon rate of 10%.
Arbitrage forces a Treasury to be priced based on spot rates and not the yield curve.
The ability of dealers to purchase securities and create value by stripping forces Treasury securities to be priced based on the theoretical spot rates.
Copyright © 2010 Pearson Education, Inc. Publishing as Prentice Hall 5-34
Exhibit 5-8 Theoretical Spot Rates
Period YearCash Flow
Spot Rate(%)
PV of $1 atSpot Rate
PV ofCash Flow
1 0.5 5 5.25 0.974421 4.8721072 1.0 5 5.50 0.947188 4.7359423 1.5 5 5.76 0.918351 4.5917564 2.0 5 6.02 0.888156 4.4407825 2.5 5 6.28 0.856724 4.2836196 3.0 5 6.55 0.824206 4.1210307 3.5 5 6.82 0.790757 3.9537838 4.0 5 6.87 0.763256 3.8162809 4.5 5 7.09 0.730718 3.653589
10 5.0 5 7.20 0.701952 3.50975811 5.5 5 7.26 0.675697 3.37848312 6.0 5 7.31 0.650028 3.25013813 6.5 5 7.43 0.622448 3.11223814 7.0 5 7.48 0.597889 2.98944615 7.5 5 7.54 0.573919 2.86959416 8.0 5 7.67 0.547625 2.73812517 8.5 5 7.80 0.521766 2.60883118 9.0 5 7.79 0.502665 2.51332519 9.5 5 7.93 0.477729 2.38864320 10.0 105 8.07 0.453268 47.593170
Theoretical Value = 115.4206

Copyright © 2010 Pearson Education, Inc. Publishing as Prentice Hall 5-35
Term Structure of Interest Rates (continued)
Forward Rates From the yield curve we can extrapolate the theoretical spot rates. In
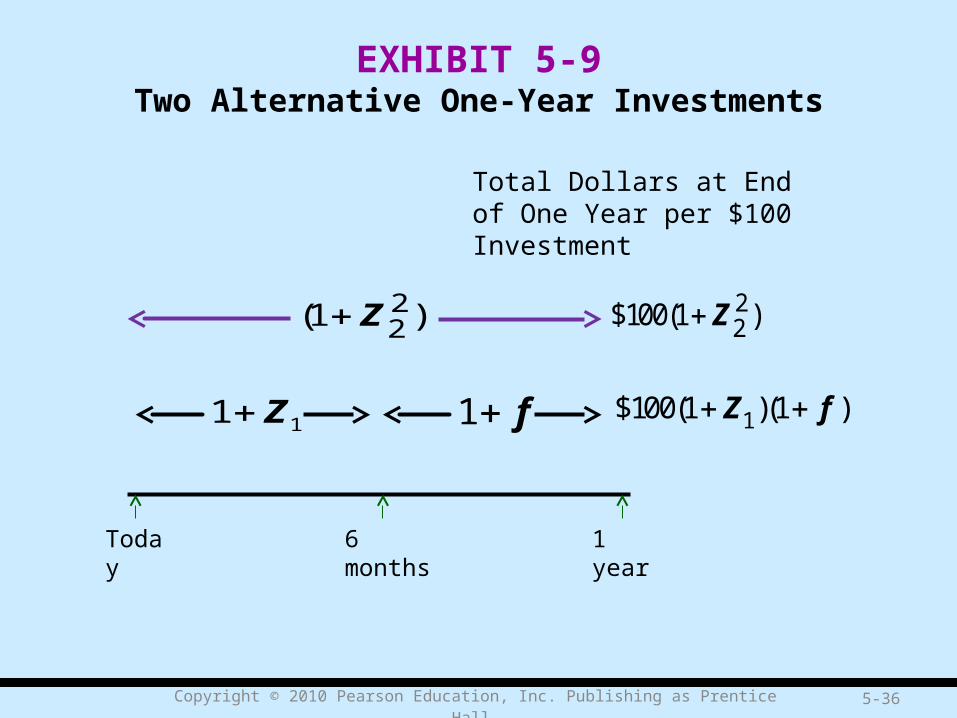
addition, we can extrapolate the market’s consensus of future interest rates. To see the importance of knowing the market’s consensus for future interest
rates, consider the following two investment alternatives for an investor who has a one-year investment horizon.
Alternative 1: Buy a one-year instrument.Alternative 2: Buy a six-month instrument and when it matures in six months,
buy another six-month instrument. With alternative 1, the investor will realize the one-year spot rate and that
rate is known with certainty but with alternative 2, the investor will realize the 6-month spot rate, but the 6-month rate 6 months from now is unknown.
Therefore, for alternative 2, the rate that will be earned over one year is not known with certainty. This is illustrated in Exhibit 5-9 (see Overhead 5-36)
Copyright © 2010 Pearson Education, Inc. Publishing as Prentice Hall 5-36
EXHIBIT 5-9Two Alternative One-Year Investments
Total Dollars at End of One Year per $100 Investment
6 months 1 yearToday
22(1 )Z 2
2$100(1 ) Z
1$100(1 )(1 )Z f 11 Z 1 f
Copyright © 2010 Pearson Education, Inc. Publishing as Prentice Hall 5-37
Term Structure of Interest Rates (continued)
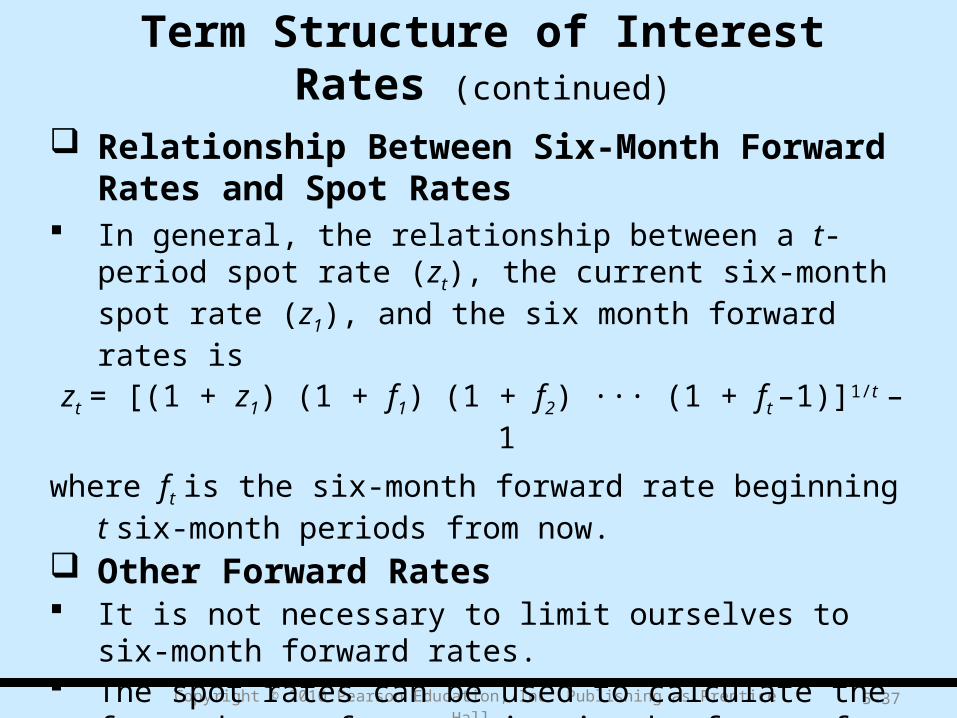
Relationship Between Six-Month Forward Rates and Spot Rates
In general, the relationship between a t-period spot rate (zt), the current six-month spot rate (z1), and the six month forward rates is
zt = [(1 + z1) (1 + f1) (1 + f2) ··· (1 + ft –1)]1/t – 1
where ft is the six-month forward rate beginning t six-month periods from now.
Other Forward Rates It is not necessary to limit ourselves to six-month forward rates. The spot rates can be used to calculate the forward rate for any
time in the future for any investment horizon.

Copyright © 2010 Pearson Education, Inc. Publishing as Prentice Hall 5-385-38
Term Structure of Interest Rates (continued)
Forward Rate as a Hedgeable Rate A natural question about forward rates is how well they do at
predicting future interest rates. The forward rate may never be realized but is important in what
it tells investors about his expectation relative to what the market consensus expects.
Some market participants prefer not to talk about forward rates as being market consensus rates but refer to forward rates as being hedgeable rates.
• For example, by buying the one-year security, the investor can hedge the six-month rate six months from now.
Copyright © 2010 Pearson Education, Inc. Publishing as Prentice Hall 5-39
Term Structure of Interest Rates (continued)
Determinants of the Shape of the Term Structure If we plot the term structure – the yield to maturity, or the spot
rate, at successive maturities against maturity – what is it likely to look like?
• Exhibit 5-5 (as was seen in Overhead 5-21) showed three generic shapes that have appeared for the U.S. Treasury yield curve with some frequency over time.
• Exhibit 5-10 (see Overhead 5-40) shows five selective daily Treasury yield curves in tabular form.
Two major theories have evolved to account for these observed shapes of the yield curve: expectations theories and market segmentation theory.

Copyright © 2010 Pearson Education, Inc. Publishing as Prentice Hall 5-40
Exhibit 5-10 U.S. Treasury Yield Curve for Five Selective Dates
Day 3 mos 6 mos 1 yr 2 yrs 3 yrs Shape
4/23/2001 3.75 3.78 3.75 3.77 4.15 Normal
4/10/1992 3.74 3.88 4.12 5.16 5.72 Steep
8/14/1981 N/A N/A 16.71 16.91 15.88 Inverted
1/3/1990 7.89 7.94 7.85 7.94 7.96 Flat
1/4/2001 5.37 5.20 4.82 4.77 4.78 Humped
Day 3 mos 6 mos 1 yr 2 yrs 3 yrs Shape
4/23/2001 4.38 4.78 5.06 5.84 5.73 Normal
4/10/1992 6.62 7.03 7.37 N/A 7.89 Steep
8/14/1981 15.34 15.04 NA 14.74 13.95 Inverted
1/3/1990 7.92 8.04 7.99 N/A 8.04 Flat
1/4/2001 4.82 5.07 5/03 5.56 5.44 Humped

Copyright © 2010 Pearson Education, Inc. Publishing as Prentice Hall 5-41
Term Structure of Interest Rates (continued)
Determinants of the Shape of the Term Structure There are several forms of the expectations theory: pure expectations
theory, liquidity theory, and preferred habitat theory. Expectations theories share a hypothesis about the behavior of short-term
forward rates and also assume that the forward rates in current long-term bonds are closely related to the market’s expectations about future short-term rates.
These three theories differ, however, as to whether other factors also affect forward rates, and how.
The pure expectations theory postulates that no systematic factors other than expected future short-term rates affect forward rates; the liquidity theory and the preferred habitat theory assert that there are other factors.
Accordingly, the last two forms of the expectations theory are sometimes referred to as biased expectations theories.
Exhibit 5-11 (see Overhead 5-42) depicts the relationships among these three theories.

Copyright © 2010 Pearson Education, Inc. Publishing as Prentice Hall 5-42
Exhibit 5-11 Term Structure Theories
Return-to-maturity expectations
Market Segmentation Theory
Narrowest Interpretations(local expectations)
Pure Expectations TheoryThree Interpretations
Broadest interpretation
Expectations Theory
Pure Expectations TheoryThree Interpretations
Broadest interpretation
Narrowest Interpretations(local expectations)

Copyright © 2010 Pearson Education, Inc. Publishing as Prentice Hall 5-43
Term Structure of Interest Rates (continued)
Pure Expectations Theory According to the pure expectations theory, the forward rates
exclusively represent the expected future rates. Thus, the entire term structure at a given time reflects the market’s
current expectations of the family of future short-term rates.
Liquidity Theory The liquidity theory of the term structure says that the implied
forward rates will not be an unbiased estimate of the market’s expectations of future interest rates because they embody a liquidity premium.
While an upward-sloping yield curve may reflect expectations about future interest rates, it is a liquidity premium increasing with maturity that can explain why the yield curve slopes upward.

Copyright © 2010 Pearson Education, Inc. Publishing as Prentice Hall 5-44
Term Structure of Interest Rates (continued)
Preferred Habitat Theory The preferred habitat theory also adopts the view that the term structure
reflects the expectation of the future path of interest rates as well as a risk premium.
the preferred habitat theory rejects the assertion that the risk premium must rise uniformly with maturity.
Market Segmentation Theory The market segmentation theory also recognizes that investors have
preferred habitats dictated by the nature of their liabilities. However, he market segmentation theory differs from the preferred
habitat theory in that it assumes that neither investors nor borrowers are willing to shift from one maturity sector to another to take advantage of opportunities arising from differences between expectations and forward rates.
Copyright © 2010 Pearson Education, Inc. Publishing as Prentice Hall 5-45
Term Structure of Interest Rates (continued)
The Main Influences of the Shape of the Yield Curve Empirical evidence suggests that the three main influences on the shape
of the Treasury yield curve are:i. the market’s expectations of future rate changesii. bond risk premiumsiii. convexity bias. The convexity bias influence is the least well known of the three
influences. The longer the maturity, the more convexity the security has.• That is, longer-term Treasury securities have a more attractive feature due to
convexity than shorter-term Treasury securities.• As a result, investors are willing to pay more for longer-term Treasury
securities and therefore accept lower returns.• This influence on the shape of the Treasury yield curve is what is referred to
as the convexity bias.
Copyright © 2010 Pearson Education, Inc. Publishing as Prentice Hall 5-46
Rate Swap Yield Curve The basic elements of an interest rate swap are important for us to
understand because it is a commonly used interest rate benchmark. In fact, the interest rate swap market in most countries is
increasingly used as an interest rate benchmark despite the existence of a liquid government bond market.
In a generic interest rate swap, the parties exchange interest rate payments on specified dates: one party pays a fixed rate and the other party pays a floating rate over the life of the swap.
In a typical swap, the floating rate is based on a reference rate, and the reference rate is typically the London Interbank Offered Rate (LIBOR).
LIBOR is the interest rate at which prime banks in London pay other prime banks on U.S. dollar certificates of deposits.

Copyright © 2010 Pearson Education, Inc. Publishing as Prentice Hall 5-47
Rate Swap Yield Curve (continued)
The fixed interest rate that is paid by the fixed rate counterparty is called the swap rate.
Dealers in the swap market quote swap rates for different maturities. The relationship between the swap rate and maturity of a swap is called the swap rate yield curve or, more commonly, the swap curve.
Because the reference rate is typically LIBOR, the swap curve is also called the LIBOR curve.
There is a swap curve for most countries. Exhibit 5-13 (see Overhead 5-48) shows the U.S. swap curve, Euro swap curve, and U.K. swap curve on 10/16/2007.
For Euro interest rate swaps, the reference rate is the Euro Interbank Offered Rate (Euribor), which is the rate at which bank deposits in countries that have adopted the euro currency and are member states of the European Union are offered by one prime bank to another prime bank.

Copyright © 2010 Pearson Education, Inc. Publishing as Prentice Hall 5-48
Exhibit 5-13U.S., Euro, and U.K. Swap Rate Curve on October 16, 2007
Years to Maturity
Swap Rate (%) for:
U.S. Euro U.K.
1 4.96 4.72 6.192 4.85 4.65 5.973 4.90 4.64 5.915 5.12 4.65 5.807 5.18 4.69 5.70
10 5.33 4.77 5.5612 5.39 4.82 5.5015 5.46 4.88 5.4020 5.52 4.92 5.2715 5.54 4.92 5.1430 5.54 4.90 5.04
Note: The rates in this table were obtained from CLP Structured Finance’s website, www.swap-rates.com.

Copyright © 2010 Pearson Education, Inc. Publishing as Prentice Hall 5-49
Rate Swap Yield Curve (continued)
The swap curve is used as a benchmark in many countries outside the U.S.
Unlike a country’s government bond yield curve, the swap curve is not a default-free yield curve but reflects the credit risk of the counterparty to an interest rate swap.
One would expect that if a country has a government bond market, the yields in that market would be the best benchmark; however, that is not necessarily the case.

Copyright © 2010 Pearson Education, Inc. Publishing as Prentice Hall 5-50
Rate Swap Yield Curve (continued)
There are three advantages of using a swap curve over a country’s government securities yield curve.
i. There may be technical reasons why within a government bond market some of the interest rates may not be representative of the true interest rate but instead be biased by some technical or regulatory factor unique to that market.
ii. To create a representative government bond yield curve, a large number of maturities must be available.
iii. The ability to compare government yields across countries is difficult because there are differences in the credit risk for every country.

Copyright © 2010 Pearson Education, Inc. Publishing as Prentice Hall 5-51
All rights reserved. No part of this publication may be reproduced, stored in a retrieval system, or transmitted, in any form or by any means, electronic, mechanical, photocopying, recording, or otherwise, without the prior written permission of the publisher. Printed in the United States of America.